Page 1
*Corresponding Author Vol. 17 (No. 3) / 161
International Journal of Thermodynamics (IJoT) Vol. 17 (No. 3), pp. 161-171, 2014 ISSN 1301-9724 / e-ISSN 2146-1511 doi: 10.5541/ijot.561 www.ijoticat.com Published online: September 01, 2014
Thermoeconomic Analysis of Combined Production of Electricity and Second
Generation Ethanol Based on the Dilute Acid Hydrolysis of Sugarcane
Bagasse
D.N. Flório1, S. Oliveira Junior
*2
Mechanical Engineering Department. Polytechnic School of the University of São Paulo, Av. Prof. Mello
Moraes, 2231, 05508-900, São Paulo, Brazil E-mail:
[email protected]
Abstract In this study, a thermoeconomic assessment of an integrated ethanol production from sugarcane bagasse and
traditional sugarcane juice is developed and discussed. An integrated distillery, which works with first and second
generation ethanol production routes, is modeled and simulated. The thermoeconomic model assumes that the only
agricultural input to the processes is the sugarcane itself (straw or other wastes recovered from the field were not
considered in the analysis). The analyses are carried out for three operating scenarios: scenario I describes a
traditional distillery or a first generation distillery; scenario II takes into account an integrated distillery operating
with current acid hydrolysis technology; scenario III describes an improved distillery which operates with future
technology for hydrolysis and pentose fermentation. Exergy analysis, production cost analysis and economic
viability assessment are carried out for each scenario. As a result, it can be concluded that the global exergy
efficiency decreases with the bagasse hydrolysis for scenario II. This situation is reversed when pentose
fermentation is considered in scenario III. The economic viability assessment shows that hydrolysis is not viable in
the present Brazilian economic scenario because it causes a drop of 4.0% in the internal rate of return (IRR) for
scenario II and 2.3% for scenario III, when compared to scenario I.
Keywords: Exergy; acid hydrolys; biofuel; cogeneration; second generation ethanol.
1. Introduction
Brazil is the second largest ethanol producer in the
world, the largest exporter, the international leader in terms
of biofuels and the first economy that has reached a
sustainable use of it. Brazil and the United States lead the
ethanol production worldwide. In 2006, they accounted for
89% of the global output and nearly 90% of ethanol as fuel
[1].
In 2011, Brazil produced nearly 21 billion liters of
ethanol [2]. Brazilian ethanol industry has 90 years of
history and sugarcane is the main agricultural raw material.
Going further, regulation enacted by the Federal
Government states that all gasoline sold in the country must
be blended with 25% ethanol, and since July 2009, more
than 8 million vehicles can run on 100% ethanol or any
combination of ethanol and gasoline. These cars are
popularly called "flex".
Currently, ethanol production in Brazil is based on first
generation technologies, i.e., it uses only sucrose, which
represents one third of energy stored in sugarcane [3]. The
bagasse is used primarily as an energy source for steam
generation in boilers. However, it is possible to transform
cellulose present inside the bagasse to sucrose through a
hydrolysis reaction, which is known as second generation
technology.
Second generation biofuels are produced from
lignocellulosic materials such as cereal straw, forest
residues, bagasse, and purpose-grown energy crops such as
vegetative grasses and short rotation forests. This
technology could avoid many of the concerns that first
generation biofuels face and potentially offers greater cost
reduction in the long term.
In the sugarcane industry, another advantage for the use
of lignocellulosic material as feedstock for bioethanol
production is clear: since it is already available in plant site
(for bagasse), or close to it (trash), second generation
bioethanol production may share part of the infrastructure
where first generation ethanol production takes place, for
instance, concentration, fermentation, distillation, storage
and cogeneration facilities [4].
An important factor in the current Brazilian ethanol
program is the production of large amounts of electricity by
burning the excess bagasse. In the early days of the
program, bagasse was burnt inefficiently to produce heat
and work required for the industrial process (crushing,
fermentation and distillation), and a good portion of it was
then wasted. Nowadays high-pressure boilers can operate
around 100 bar (in contrast with 20 bar in the past). As a
result, a portion of the energy can be supplied to the local
electricity grid.
2. Objectives
In this study, a thermoeconomic model that evaluates
the integrated ethanol production from sugarcane bagasse
and traditional sugarcane juice is developed. The model is
applied to a hybrid distillery, which works with both first
and second generation juices. The model assumes that the
only agricultural feedstock to processes is the sugarcane
itself, i.e. straw or other waste recovered from the field
were not considered in the analysis and the surplus
Page 2
162 / Vol. 17 (No. 3) Int. Centre for Applied Thermodynamics (ICAT)
electricity will be sold to the public grid. The analysis will
be carried out considering three complementary
approaches; (i) The exergy analysis evaluates exergy use of
the inputs until the final products and then identifies the
main sources of irreversibilities in a given production route;
(ii) The cost analysis that aims to obtain the production cost
of ethanol and electricity; (iii) The economic viability
assessment intends to assess the viability in terms of return
on investment.
Three different scenarios were defined. Scenario I
depicts a traditional distillery or a first generation distillery,
scenario II represents a hybrid distillery that operates with
current technology for hydrolysis (base case), and scenario
III takes into account an improved distillery which operates
with future technology for hydrolysis and pentose
fermentation. Exergy analysis, production cost analysis and
economic viability assessment will be carried out for each
scenario.
3. Methods
3.1 Exergy and Thermoeconomic Analysis
Assuming all processes in steady state and neglecting
variations in kinetic and potential energies, the mass,
energy, exergy and cost balances for each control volume
and every production route, take respectively, the form of
Eqs. (1) – (4):
∑ - ∑
(1)
∑ -
∑ - ∑
(2)
∑ ( -
) - ∑ -∑
(2)
∑ ( ) ∑ ( )
(4)
Where ( ) represents mass flow rate entering (exiting)
the control volume (kg/s), heat transfer rate (kW),
shaft power (kW), specific enthalpy (kJ/kg), specific
exergy (kJ/kg), ambient temperature (K), irreversibility
rate (kW), c specific monetary exergy cost (R$/kJ) and
the depreciation rate of equipment (R$/s) which is
calculated by Eqs. (5) and (6):
(5)
( ) - (6)
where is the acquisition cost of the equipment (R$),
capital recovery factor, fixed cost associated with
the equipment operation (9%), variable cost of the
equipment (1%), FC the load factor (0.75), j interest rate
(12 %), expected yearly operation time (5,000 hours)
and N equipment lifetime (20 years). The set of equations
was solved simultaneously using EES® software [5].
3.2 Development of the Model
The thermodynamic model used in this study is based
on performance prediction models of three plants available
in the literature. The first one is a utilities plant with
subcritical Rankine cycle [6], the second one is a distillery
plant [7], and the third one is a hydrolysis plant [8]. Each
one of them will be explored separately and the complete
model to be solved in this study arises from the assembly of
these three sub-models. The implementation of the model
corresponds to mass, energy, exergy, and monetary exergy
cost balances for each control volume, as stated before.
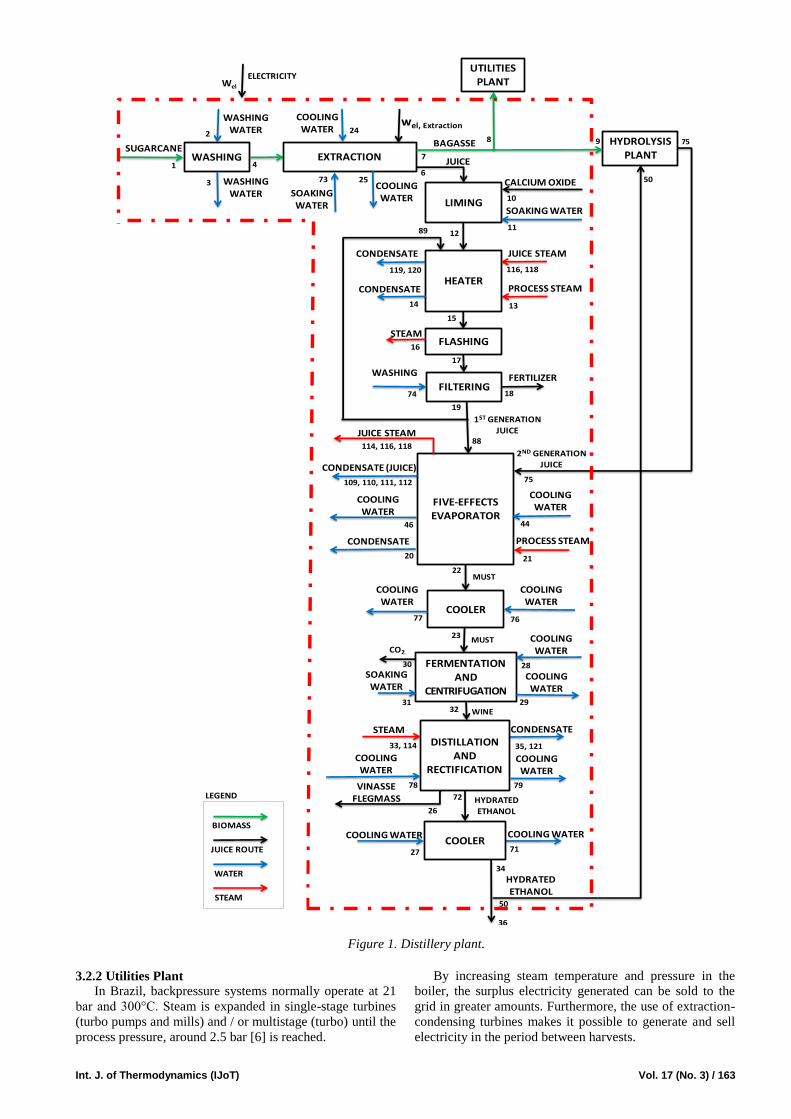
3.2.1 Distillery
Ethanol is produced by fermentation of the sugarcane
juice as well as the juice obtained from the bagasse
hydrolysis. Thus, the modelled distillery can be considered
a hybrid one, i.e., a combination of first and second
generation production routes, as shown in Fig. 1 and
described in detail by [9]. The following processes were
modelled thermodynamically: (i) washing, (ii) extraction,
(iii) juice treatment, (iv) evaporation (v) fermentation, (vi)
distillation and rectification, and (vii) cooling. Table 1
shows data related to these processes.
Table 1. Distillery Parameters.
Parameter Value
Capacity 2 2 500 000 TC/yeara
Sugarcane Processed (wet basis)2 500 TC/ha
Yearly Operation 5000 hours/year
Sugarcane Fiber Content (wet basis)2 14.0%
Sugarcane Sucrose Content (wet basis)2 14.0%
Sugarcane Moisture Content 70.5% Juice Extraction Efficiency (Fermentable sugar
recovery)2 97.0%
Sucrose Fermentation Efficiency (Sucrose mass converted to alcohol)2
89.0%
Bagasse Moisture Content1 50.0%
Hydrated Ethanol Purity2 93.7% Process Steam Pressure2 2.5bar
Sugarcane Bagasse Cellulose Content (dry
basis)1 43.4%
Sugarcane Bagasse Hemicellulose Content (dry
basis)1 25.6%
Sugarcane Bagasse Lignin Content (dry basis)1 23.2% Sugarcane Bagasse Ash Content (dry basis) 1.0%
Distillation Steam Consumption (Distillery
Plant)3 2.5 kg/kg of ethanol
Distillation Mass Recovery Efficiency
(Distillery Plant)3 99%
a - TC - metric tons of sugarcane. 1 – [4]
2 – [7]
3 – [6]
Page 3
Int. J. of Thermodynamics (IJoT) Vol. 17 (No. 3) / 163
Figure 1. Distillery plant.
3.2.2 Utilities Plant
In Brazil, backpressure systems normally operate at 21
bar and 300°C. Steam is expanded in single-stage turbines
(turbo pumps and mills) and / or multistage (turbo) until the
process pressure, around 2.5 bar [6] is reached.
By increasing steam temperature and pressure in the
boiler, the surplus electricity generated can be sold to the
grid in greater amounts. Furthermore, the use of extraction-
condensing turbines makes it possible to generate and sell
electricity in the period between harvests.
COOLING WATER
COOLING WATER
SOAKING WATER
COOLING WATER
JUICE STEAM
HYDROLYSIS PLANT
75
50
WASHING
WASHING WATER
SUGARCANEEXTRACTION
BAGASSE
JUICE
WASHINGWATER
LIMING
HEATER
FLASHING
FILTERING
CALCIUM OXIDE
SOAKING WATER
PROCESS STEAMCONDENSATE
STEAM
1ST GENERATION JUICE
FERTILIZER
FIVE-EFFECTS EVAPORATOR
COOLER
MUST
MUST
FERMENTATION AND
CENTRIFUGATION
CO2
WINE
STEAM CONDENSATE
HYDRATED ETHANOL
UTILITIES PLANT
1
2
3
47
8
10
11
6
12
14 13
17
15
16
18
19
PROCESS STEAMCONDENSATE
20 21
22
25
23
24
2830
293132
33, 114 35, 121
34
36
2ND GENERATION JUICE
50
COOLING WATER
COOLING WATER
ELECTRICITYWel
COOLING WATER
COOLING WATER
7677
COOLING WATER COOLING WATER
27 71
9
75
CONDENSATE (JUICE)
109, 110, 111, 112
DISTILLATION AND
RECTIFICATION
COOLER
72VINASSE
FLEGMASS26
SOAKING WATER
73
WASHING
74
COOLING WATER
78 79
CONDENSATE
119, 120 116, 118
JUICE STEAM114, 116, 118
COOLING WATER
COOLING WATER
4446
wel, Extraction
88
89
HYDRATED ETHANOL
STEAM
WATER
JUICE ROUTE
LEGEND
BIOMASS
Page 4
164 / Vol. 17 (No. 3) Int. Centre for Applied Thermodynamics (ICAT)
New plants and units, seeking to improve their energy
balances, opt to use boilers with pressures up to 100 bar in
order to facilitate the sale of surplus electricity. The use of
higher pressures is limited to 180 bar due to equipment cost
and to economic and financial issues related to the sale of
surplus electricity. The efficiency of these new boilers is
85-87% (based on Lower Heating Value, LHV), and it can
be raised to 89-90% in case of burning dry bagasse [6].
The utilities plant modelled in this study, differently
from the standard Brazilian backpressure system, operates
on a Rankine cycle with a condensing-extraction turbine.
The extraction is done twice: steam at 13 bar is required to
provide heat to the hydrolysis plant, and steam at 2.5 bar is
used for the remainder heat demands, e.g. distillation,
evaporation and heating, as shown in Fig. 2. No pressure
drop in the piping and heat exchangers was considered for
the simulation. The main parameters used to model the
utilities plant are presented in Table 2.
Table 2. Utilities Plant Operating Parameters.
Parameter Value
Steam Generation Pressure 60 bar
Steam Generation Temperature 450ºC Boiler Efficiency (LHV basis)1 82%
Turbine Isoentropic Efficiency1 85%
Pump Isoentropic Efficiency 80% Make up Water1 5%
Electric Generator Efficiency2 95%
1 – [6]
2 – [4]
Figure 2. Utilities plant.
3.2.3 Hydrolysis Plant
The hydrolysis plant operates on the process DHR
(Dedini Rapid Hydrolysis), which combines the organosolv
pre-treatment of bagasse with the dilute acid rapid
hydrolysis [10].
The pre-treatment process and the hydrolysis of
cellulose and hemicellulose occurs simultaneously in a
counter current reactor fed with bagasse from the top and
with a mixture of ethanol (75% weight/weight) and diluted
sulphuric acid (0.25 - 0.5% weight/weight), under pressure
of 25-28 bar and temperature of 180 - 200°C [11]. The
fluxes meet in the middle part of the reactor, where cooking
takes place between the lignocellulosic biomass and the
ethanol-water mixture responsible for promoting
delignification and the hydrolysis reaction. The weight ratio
bagasse, ethanol-water mixture, sulphuric acid at 98%, is
100:600:0.1 [11]. The time that the mixture remains in the
reactor varies from a few seconds to a few minutes. The
residual biomass, composed primarily of lignin, is
recovered and burnt in the boiler.
Upon leaving the reactor, the slightly acid solution with
high sugar content is immediately cooled as a result of the
expansion in the valve, which is modelled as isenthalpic,
CONDENSER
EXTRACTION CONDENSING TURBINE
DEAERATOR
PUMP II
BOILER
HYDROLYSISPLANT
PUMP I
COOLING WATER
58 59
CONDENSATE (2,5 bar)
PROCESS STEAM (2,5 bar)
60
61
BAGASSE
8
63
64
HIGH PRESSURE STEAM
LOW PRESSURE STEAM
14, 20, 35, 56
CONDENSATE
65
66
13,21 33, 57
5c
ELECTRIC GENERATOR
Pel SURPLUS ELECTRICITY
STEAM (13 bar)
68
STEAM (2.5 bar)
69
70
b1
b2
DESUPERHEATER I
CONDENSATE (2.5 bar)
67
82
MAKE-UP WATER
62
PUMP IV
CONDENSATE (13 bar)
37
b4
DESUPERHEATER II39
CONDENSATE (13 bar)
86
87
80
RESIDUAL BIOMASS
CONDENSATE
CONDENSATE
STEAM
WATER
WORK
LEGEND
BIOMASS
Page 5
Int. J. of Thermodynamics (IJoT) Vol. 17 (No. 3) / 165
thereby preventing degradation of formed sugars. The cold
liquor is routed to a distillation column where ethanol is
recovered at the top of the column and returned to the
process. The aqueous solution containing sugar is removed
from the bottom of the reactor. Fig. 3 shows the hydrolysis
synthesis plant.
Steam consumption in the distillation column is
determined by applying the first principle of
thermodynamics Eq. (2) in the distillation control volume.
Due to the small amount of sulfuric acid, only ethanol,
water and sucrose were taken into account to assess steam
consumption. The parameters used in this control volume
are detailed in Table 3.
Figure 3. Hydrolysis synthesis plant.
Table 3.Hydrolysis Juice Distillation Parameters. Parameter Value
Ethanol Concentration in the Reactor (%
weight/weight) 72.20
Sulfuric Acid Concentration in the Reactor (%
weight/weight) 0.35
Pressure in the Reactor (bar) 27 Temperature in the Reactor (ºC) 190.0
Hydrolysed Juice Exit Temperature (ºC) 99.8
Ethanol Exit Temperature (ºC) 77.8 Ethanol Exit Concentration (% weight/weight) 93.7
Ethanol Condensation Thermal Load (kJ/kg of
ethanol)1 2133
1 – [7]
The plants are designed to minimize external water
consumption. A cooling tower system collects the
condensate of juice steam as well as the water used in
cooling processes in order to reuse it by providing cool
water for the processes. As a result, the external water
consumption represents less than 10% of the water needed
for the processes.
4. Results and Analysis
Three scenarios were defined in order to analyse the
results. Table 4 shows the parameters of each scenario.
Because of most fermentable sugar is from the first
generation plant, steam consumption in the distillery plant
is slightly affected by hydrolysis yield or pentose
fermentation. The simulation shows that for scenarios II
and III, steam consumption in the hydrolysis plant limits to
18% the amount of bagasse that can be hydrolysed. This is
a direct consequence of the steam requirement in the
distillation and heating process inside the hydrolysis plant,
which is approximately the same for both scenarios II and
III. Table 5 presents key points process values obtained
from the base case simulation.
a15
b21
c18
d23
e24
f7
g16
h19
i3
H2SO4
co2
ethanol
COOLING WATER
DISTILLERY
REACTOR
HEAT STEAM CONDENSATE
PUMP III
MIXING TANK
SULFURICACID
MIXING TANK WATER
MIXING STEAMCONDENSATE
DISTILLATION
ETHANOL
ETHANOL
Na2SO4, H2O, SUCROSE, WASTE
ETHANOL
HOT WATER
PURE HYDROLYSED
NEUTRALIZATION NaOH
9
40
86
41
42
43
45
47
38
69
75
48
50
49
51
53
55
52
54
5657
b3
RESIDUALBIOMASS80
VALVE
81
HYDROLYSED
wEL, NEUTRALIZATION
49
STEAM
WATER
JUICE ROUTE
LEGEND
BIOMASS
Page 6
166 / Vol. 17 (No. 3) Int. Centre for Applied Thermodynamics (ICAT)
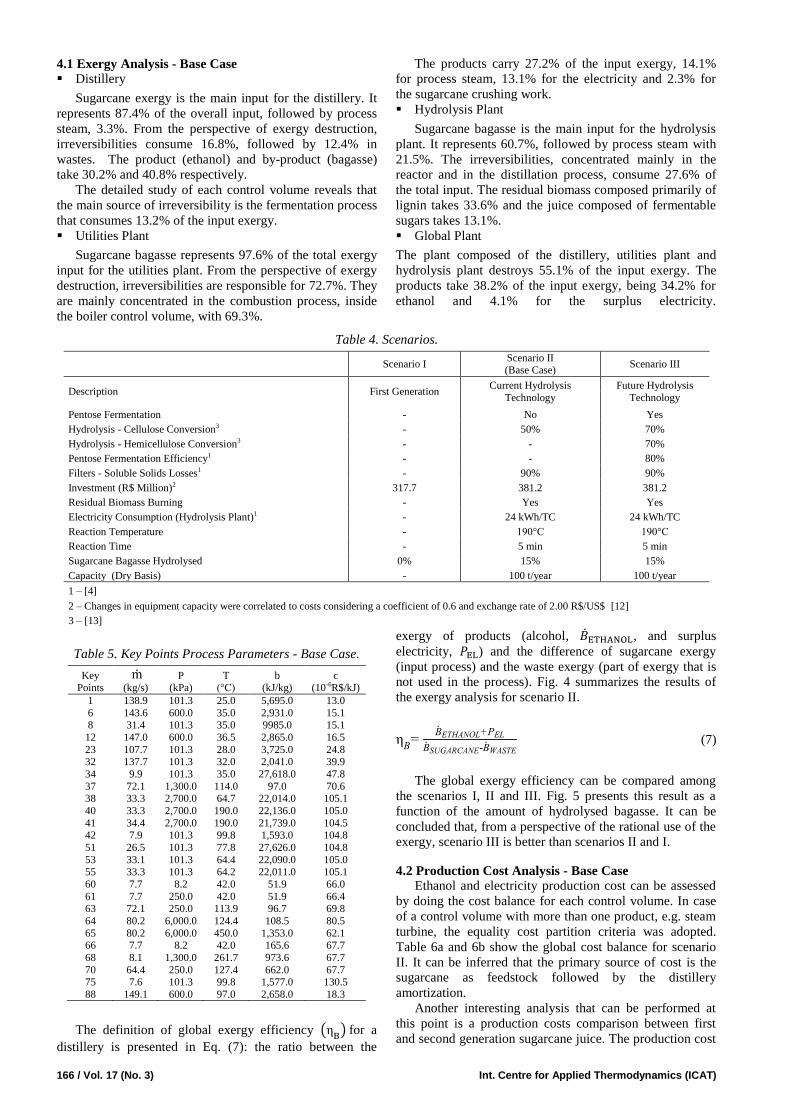
4.1 Exergy Analysis - Base Case
Distillery
Sugarcane exergy is the main input for the distillery. It
represents 87.4% of the overall input, followed by process
steam, 3.3%. From the perspective of exergy destruction,
irreversibilities consume 16.8%, followed by 12.4% in
wastes. The product (ethanol) and by-product (bagasse)
take 30.2% and 40.8% respectively.
The detailed study of each control volume reveals that
the main source of irreversibility is the fermentation process
that consumes 13.2% of the input exergy.
Utilities Plant
Sugarcane bagasse represents 97.6% of the total exergy
input for the utilities plant. From the perspective of exergy
destruction, irreversibilities are responsible for 72.7%. They
are mainly concentrated in the combustion process, inside
the boiler control volume, with 69.3%.
The products carry 27.2% of the input exergy, 14.1%
for process steam, 13.1% for the electricity and 2.3% for
the sugarcane crushing work.
Hydrolysis Plant
Sugarcane bagasse is the main input for the hydrolysis
plant. It represents 60.7%, followed by process steam with
21.5%. The irreversibilities, concentrated mainly in the
reactor and in the distillation process, consume 27.6% of
the total input. The residual biomass composed primarily of
lignin takes 33.6% and the juice composed of fermentable
sugars takes 13.1%.
Global Plant
The plant composed of the distillery, utilities plant and
hydrolysis plant destroys 55.1% of the input exergy. The
products take 38.2% of the input exergy, being 34.2% for
ethanol and 4.1% for the surplus electricity.
Table 4. Scenarios.
Scenario I
Scenario II (Base Case)
Scenario III
Description First Generation Current Hydrolysis
Technology
Future Hydrolysis
Technology
Pentose Fermentation - No Yes
Hydrolysis - Cellulose Conversion3 - 50% 70%
Hydrolysis - Hemicellulose Conversion3 - - 70%
Pentose Fermentation Efficiency1 - - 80%
Filters - Soluble Solids Losses1 - 90% 90%
Investment (R$ Million)2 317.7 381.2 381.2
Residual Biomass Burning - Yes Yes
Electricity Consumption (Hydrolysis Plant)1 - 24 kWh/TC 24 kWh/TC
Reaction Temperature - 190°C 190°C
Reaction Time - 5 min 5 min
Sugarcane Bagasse Hydrolysed 0% 15% 15%
Capacity (Dry Basis) - 100 t/year 100 t/year
1 – [4]
2 – Changes in equipment capacity were correlated to costs considering a coefficient of 0.6 and exchange rate of 2.00 R$/US$ [12]
3 – [13]
Table 5. Key Points Process Parameters - Base Case.
Key Points
(kg/s) P
(kPa) T
(°C) b
(kJ/kg) c
(10-6R$/kJ)
1 138.9 101.3 25.0 5,695.0 13.0
6 143.6 600.0 35.0 2,931.0 15.1 8 31.4 101.3 35.0 9985.0 15.1
12 147.0 600.0 36.5 2,865.0 16.5
23 107.7 101.3 28.0 3,725.0 24.8 32 137.7 101.3 32.0 2,041.0 39.9
34 9.9 101.3 35.0 27,618.0 47.8
37 72.1 1,300.0 114.0 97.0 70.6 38 33.3 2,700.0 64.7 22,014.0 105.1
40 33.3 2,700.0 190.0 22,136.0 105.0
41 34.4 2,700.0 190.0 21,739.0 104.5
42 7.9 101.3 99.8 1,593.0 104.8
51 26.5 101.3 77.8 27,626.0 104.8
53 33.1 101.3 64.4 22,090.0 105.0 55 33.3 101.3 64.2 22,011.0 105.1
60 7.7 8.2 42.0 51.9 66.0
61 7.7 250.0 42.0 51.9 66.4 63 72.1 250.0 113.9 96.7 69.8
64 80.2 6,000.0 124.4 108.5 80.5
65 80.2 6,000.0 450.0 1,353.0 62.1 66 7.7 8.2 42.0 165.6 67.7
68 8.1 1,300.0 261.7 973.6 67.7
70 64.4 250.0 127.4 662.0 67.7 75 7.6 101.3 99.8 1,577.0 130.5
88 149.1 600.0 97.0 2,658.0 18.3
The definition of global exergy efficiency ( ) for a
distillery is presented in Eq. (7): the ratio between the
exergy of products (alcohol, , and surplus
electricity, ) and the difference of sugarcane exergy
(input process) and the waste exergy (part of exergy that is
not used in the process). Fig. 4 summarizes the results of
the exergy analysis for scenario II.
- (7)
The global exergy efficiency can be compared among
the scenarios I, II and III. Fig. 5 presents this result as a
function of the amount of hydrolysed bagasse. It can be
concluded that, from a perspective of the rational use of the
exergy, scenario III is better than scenarios II and I.
4.2 Production Cost Analysis - Base Case Ethanol and electricity production cost can be assessed
by doing the cost balance for each control volume. In case
of a control volume with more than one product, e.g. steam
turbine, the equality cost partition criteria was adopted.
Table 6a and 6b show the global cost balance for scenario
II. It can be inferred that the primary source of cost is the
sugarcane as feedstock followed by the distillery
amortization.
Another interesting analysis that can be performed at
this point is a production costs comparison between first
and second generation sugarcane juice. The production cost
Fig 4(b) - Utility Plant
Page 7
Int. J. of Thermodynamics (IJoT) Vol. 17 (No. 3) / 167
0
500
1.000
1.500
2.000
2.500
3.000
Input Irrev. Waste Products
Ex
ergy (
MJ/
tc)
Crushing
Work
Electricity
Steam
Exergy
Breakdown
100%
72.7%
0.1%
14.1%
13.1%
2.3%
0
1.000
2.000
3.000
4.000
5.000
6.000
7.000
Input Irrev. Waste Bagasse Ethanol
Ex
ergy (
MJ/
tc)
Electricity
Steam
Others
Sugarcane
Exergy
Breakdown
16.8%
12.4%
40.8%
30.2%
100%
0
100
200
300
400
500
600
700
Input Irrev. Waste Products
Byproducts
Exer
gy (
MJ/
tc)
Residual
BiomassOthers
Steam
Juice
Exergy
Breakdown
27.6%
25.7%
13.1%
100%
33.6%
100%
3%
19% 32%
1% 6%
34%
4% 0%
20%
40%
60%
80%
100%
120%
0
1.000
2.000
3.000
4.000
5.000
6.000
7.000
Ex
ergy (
MJ/
tc)
Irreversibilities Products
(a) - Distillery
(c) – Hydrolysis Plant
(b) – Utilities Plant
(d) – Global Plant
of the latter reaches extremely high values for small values
of the percentage of hydrolysed sugarcane bagasse. This
comes from the fact that all the fixed cost of the hydrolysis
plant is discharged in a small amount of produced juice
Figure 4. Exergy analysis for scenario II (15% of hydrolysis).
Figure 5. Global exergy efficiency for scenarios I, II and III.
Table 6a. Input Costs for Scenario II - Base Case.
Input Monetary Exergy Cost
(10-6 R$/kJ)
Specific Exergy
(kJ/kg)
Specific Cost
(R$/kg) Cost Rate (R$/s)
Specific Cost
(R$/tc) Flow
Sugarcane1 13.0 5695 0.074 10.29 74.09 m1 H2SO4
1 360.1 1666 0.60 0.07 0.51 m54
NaOH1 738.5 2113 1.56 0.13 0.91 m43
CaO1 142.5 1965 0.28 0.04 0.31 m10 Replacement Water1 5.20 50 0.00 0.04 0.29 m84 and m62
Distillery - - - 3.00 21.59 Amortization
Hydrolysis Plant - - - 0.82 5.87 Amortization Utilities Plant - - - 1.08 7.81 Amortization
Total Input - - - 15.5 111.3
1- [14]
40%
41%
42%
43%
0% 5% 10% 15% 20%
Exer
gy G
lob
al E
ffic
iency
(%)
Hydrolysed Sugarcane Bagasse (%)
Scenario II Scenario III Scenario I
Page 8
168 / Vol. 17 (No. 3) Int. Centre for Applied Thermodynamics (ICAT)
0,0
1,0
2,0
3,0
4,0
5,0
0% 5% 10% 15% 20%
Co
st (
R$
/kg o
f su
gar
)
Hydrolysed Sugarcane Bagasse(%)
Sugarcane Juice (Scenarios I, II and III)
Juice from Hydrolysis Plant (Scenario II)
Juice from Hydrolysis Plant (Scenario III)
0
60
120
180
240
300
1,0
1,1
1,2
1,3
1,4
1,5
0% 5% 10% 15% 20%
Ele
ctri
city
Co
st (
R$
/MW
h)
Eth
ano
l C
ost
(R
$/k
g)
Hydrolysed Sugarcane Bagasse (%)
Electricity (Scenario I) Ethanol (Scenario III)
Ethanol (Scenario I) Ethanol (Scenario II)
Electricity (Scenario III) Electricity (Scenario II)
Table 6b. Output Costs for Scenario II - Base Case.
Output Monetary Exergy Cost
(10-6 R$/kJ)
Specific Exergy
(kJ/kg)
Specific Cost
(R$/kg)
Cost Rate
(R$/s)
Specific Cost
(R$/tc) Flow
Ethanol 47.8 27618 1.32 13.06 93.99 m36
Electricity 73.4a - - 2.39 17.21 Wel
Total Output - - - 15.5 111.2
a - 264.30 R$/MWh
Figure 6. Juice (a), electricity and ethanol (b) production costs.
(Note: Electricity costs for scenarios II and III are overlapped in the chart)
For scenarios II and III, as shown in Fig. 6, production
cost of the juice tends to stabilize when a large amount of
bagasse is hydrolysed. Although the cost tends to decrease
with the amount hydrolysed, it is still much more costly
than the first generation juice. Scenario III shows a 40%
cost reduction in relation to scenario II. This is a
consequence of the higher hydrolysis yield and the use of
the pentose for obtaining ethanol.
4.2.1 Sensitivity Analysis - Base Case
In order to compare the impact of changes in the main
parameters, a dimensionless sensitivity coefficient is
defined as in Eq. (8):
(8)
where:
is a result obtained by the model. Four
products were analyzed: (i) sugarcane juice cost,
(ii) hydrolysed juice cost, (iii) ethanol cost, and
(iv) electricity cost.
is a specific process variable. Seven inputs
were considered: (i) sugarcane price, (ii)
investment, (iii) boiler LHV efficiency, (iv)
cellulose conversion efficiency, (v) steam turbine
isentropic efficiency, (vi) distillation steam
consumption, and (vii) sucrose fermentation
efficiency.
An array can be obtained by calculating for all
possible combinations of Product-Input. Table 7 shows the
dimensionless sensitivity array. As can be seen, sugarcane
plays a key role in determining the cost of all products. In
addition, the control volumes that present the highest
irreversibility rate, i.e. boiler, steam turbine, fermentation
and hydrolysis reactor, also present the highest
dimensionless sensitivity coefficient.
Table 7. Dimensionless Sensitivity Array for Scenario II -
Base Case.
Product Sugarcane
Juice Cost Hydrolysed
Juice Cost
Ethanol
Cost
Electricity
Cost Input
Sugarcane Price 0.84 0.47 0.64 0.74
Investment 0.15 0.56 0.36 0.25 Boiler LHV Efficiency -0.07 -0.32 -0.21 -0.92
Cellulose Conversion
Efficiency -0.01 -0.56 -0.02 0.00
Steam Turbine Isentropic
Efficiency -0.04 -0.23 -0.16 -0.47
Distillation Steam Consumption
0.00 -0.03 0.04 -0.04
Sucrose Fermentation
Efficiency -0.04 -0.24 -0.96 -0.07
Note: The most significant coefficients are highlighted
4.3 Economic Viability Assessment
The economic viability assessment is based on the cash
flow generated by the construction and operation of the
plants for scenarios I, II and III as described in Table 4.
During the first two years, cash flow is negative because of
the investment expenses. From the third year until the end
of operation, cash flow is generated by the sale of
electricity and ethanol. The Internal Rate of Return (IRR) is
then calculated to decide which scenario is the best one in
terms of return on investment. Fig. 7 illustrates that
although the IRR increases with the hydrolysis for scenario
III, the best choice is still scenario I with IRR of 13.4% in
real terms. Table 8 shows the main parameters used in the
economic viability assessment.
Page 9
Int. J. of Thermodynamics (IJoT) Vol. 17 (No. 3) / 169
Table 8. Parameters Used in the Economic Analysis.
Figure 7. IRR for scenarios I, II and III.
4.3.1 Sensitivity Analysis In order to evaluate the impact of changes in prices and
investment expenses on the internal rate of return (IRR),
taking into account eventual uncertainties on the investment
of the hydrolysis plant and market fluctuations, a sensitivity
analysis was carried out. For electricity price, sugarcane
price and investment expenses, a variation of ±25% over
the original value (displayed in Tables 4, 5a and 6) was
assumed. For ethanol price, a variation of ±20% was
considered. Results are shown in Fig. 8. It can be verified
that among the variables, the one that presents the most
significant impact on the IRR, is the ethanol price: a
variation of ±20% causes the largest changes on the IRR in
all the scenarios evaluated. Changes of ±25% on sugarcane
prices also affect the IRR significantly, but with less
intensity than ethanol prices. Changes on investment of
hydrolysis plant and electricity price have small impact on
the IRR. An important conclusion at this point is that
scenario I presents the highest IRR value among the three
scenarios in the ±25% interval.
4.4 Comparison with Other Studies
Tables 9 to 11 show several comparison parameters
between results obtained in this model and previous
publications.
As expected, the exergy efficiency varies significantly
as a function of the hydrolysed biomass. Table 9 shows that
lignocellulosic materials such as banana peduncle and
sugarcane bagasse present exergy efficiency ranging from
13.1% to 28.7% depending on the analysed scenario.
In terms of global exergy efficiency (Table 10), scenario
II actually is worse than scenario I. When compared with
previous publications, global exergy efficiency is close to a
first generation plant. This is due to the fact that most input
exergy from sugarcane in the model is still processed in a
traditional first generation distillery and only the surplus
bagasse is hydrolysed.
Table 11 compares main efficiency parameters of the
model with a 50/50 ethanol/sugar first generation plant [6]
with different utilities plant configurations. As a result,
global exergy efficiency in the model is lower than value
obtained for an extraction-condensing system. This is
mainly due to the choice 100/0 ethanol/sugar in the model,
which is more irreversible. For the other parameters, it can
be concluded that the results are consistent with this study
Figure 8. Sensitivity analysis.
Table 9. Exergy Efficiency Comparison (Hydrolysis Only). Acid Hydrolysis1 Enzymatic Hydrolysis1 Acid Hydrolysis2
Origin Banana Skin Banana Pulp Peduncle Bagasse
(Scenario II)
Bagasse
(Scenario III)
Biomass Starch Starch Lignocellulose Lignocellulose Lignocellulose
( ) 51.3 57.4 20.3 13.1 28.7
1 – [8];
2 – Results from the model
Parameters Value
Ethanol Price1 1.31 (R$/l) Tax on Revenue2 8.30%
Electricity Price3 102.10(R$/MWh)
Income Tax 34% Depreciation (linear) 10 years
Start-up time 2 years
Salvage Value 0 Project lifetime 20 years
1- [14]
2- [15]
3- Public Auction 02/2011-ANEEL (Net of taxes) [16]
Scenario I
Page 10
170 / Vol. 17 (No. 3) Int. Centre for Applied Thermodynamics (ICAT)
Table 10. Global Exergy Efficiency Comparison.
Biomass Products Exergy Efficiency (%)
Palm Tree1 Biodiesel 74.7
Sugarcane3 Sugar and Ethanol 43.5
Banana Skin (Starch)1 Ethanol 35.1 Banana Pulp (Starch)1 Ethanol 24.5
Banana Peduncle (Lignocellulose)1 Ethanol 12.2
Sugarcane (Scenario I)2 Electricity and Ethanol 41.4
Sugarcane (Scenario II - 15% of hydrolysis)2 Electricity and Ethanol 40.9 Sugarcane (Scenario III - 15% of hydrolysis)2 Electricity and Ethanol 42.0
1 – [8]
2 – Results from the model 3 – [6]
Table 11. Key Results Comparison.
Parameter Backpressure
System1
Extraction-
Condensing System1
Supercritical
System1 Scenario I2 Scenario II2 Scenario III2
Ethanol Exergy Cost (kJ/kJ) 3.08 2.91 2.54 2.23 2.42 2.36
Electricity Exergy Cost (kJ/kJ) 5.01 5.16 3.66 4.58 4.23 4.22
Steam Exergy Cost (kJ/kJ)3 4.77 4.78 3.78 4.35 4.02 4.01 Steam Consumption (kg/tc) 490 392 278 322.2 526.0 526.0
Sugar Exergy Cost (kJ/kJ)3 1.62 1.56 1.39 - - -
Exergy Efficiency (%) 45.8 44.7 50.0 41.4 40.9 42.0 Surplus Electricity (kWh/tc) 48.5 64.9 142.3 90.5 65.4 62.3
Surplus Sugarcane Bagasse (%) 12.8 3.0 3.0 0.0 0.0 0.0
1 - Different configurations for a 50/50 sugar/ethanol plant [6] 2 - Results from the model
3 - Differently from the monetary exergy cost (R$/kJ), the exergy cost (kJ/kJ) measures the amount of input Exergy necessary to produce one kJ of
product Exergy, in this case electricity and ethanol.
5. Conclusions
The simulation shows that for scenarios II and III, steam
consumption in the hydrolysis plant limits to 18% the
amount of bagasse that can be hydrolysed. This is a direct
consequence of the steam requirement in the distillation and
heating process inside the hydrolysis plant, which is
approximately the same for scenarios II and III. Because of
most fermentable sugar is from the first generation plant,
steam consumption in the distillery plant is slightly affected
by hydrolysis yield or pentose fermentation. In terms of
productivity improvement, hydrolysis can increase the net
ethanol production by 3.7% and 8.1%, for scenarios II and
III respectively, which leads, respectively, to 136 and 286
liters of ethanol per dry ton of sugarcane.
Regarding the exergy analysis, hydrolysis under
scenario II causes a small drop in global exergy efficiency,
from 41.4% (scenario I) to 40.9% (scenario II). The
situation is reversed for scenario III in which the global
exergy efficiency increases from 41.4% to 42.0%. This is a
direct consequence of higher saccharification yield and
pentose fermentation. Exergy analysis still shows that, for
all three scenarios, the main source of irreversibility is the
utilities plant, notably the boiler. This is an expected result
because the combustion reaction is highly irreversible.
The economic viability assessment based on the IRR
shows that scenario I, which is a first generation plant, is
the best choice with IRR of 13.4%, followed by scenarios
III and II with IRR of 11.1% and 9.3% respectively.
Sensitivity analysis shows that the scenario I is still the best
choice even if main parameters change ±25%.
Acknowledgements:
The corresponding author acknowledges CNPq
(Brazilian National Council of Scientific and Technological
Development) for grant 306033/2012-7.
Nomenclature
Specific exergy (kJ/kg)
Ethanol exergy flow rate (kW)
Sugarcane exergy flow rate (kW)
Waste exergy flow rate (kW)
c Specific monetary exergy cost
(R$/kJ)
Acquisition cost of the equipment
(R$)
Capital recovery factor
Operational and maintenance fixed
cost factor
Operational and maintenance variable
cost factor
FC Load factor
h Specific enthalpy (kJ/kg)
Irreversibility rate (kW)
IRR Internal rate of return (%)
j Interest rate (%)
Mass flow rate (kg/s)
N Equipment lifetime (year)
P Pressure (kPa)
Electrical power (kW)
Heat transfer rate (kW)
Temperature (K, °C)
Ambient temperature (K, °C)
Expected yearly operation time (h)
Shaft power (kW)
Equipment depreciation rate (R$/s)
Greek Symbols Sensitivity Coefficient
Variation
B
Exergy efficiency
Subscripts in Inlet
out Outlet
Q heat
W work
Page 11
Int. J. of Thermodynamics (IJoT) Vol. 17 (No. 3) / 171
References
[1] M. Sanchez, Latin America -- the 'Persian Gulf' of
Biofuels? , The Washington Post. February 23, 2007.
Accessed March 30, 2014. Available at: http://www.washingtonpost.com/wp-
dyn/content/article/2007/02/22/AR2007022201361.html.
[2] RFA – Renewable Fuels Association, Ethanol industry
outlook, World Fuel Ethanol Production, 2012.
[3] J. Goldemberg, The Brazilian biofuels industry,
Biotechnology for Biofuels, p.1-6, 2008.
[4] M.O.S. Dias, T.L. Junqueira, O. Cavallet, M.P. Cunha,
C.D.F. Jesus, C.E.V. Rossel, R.M. Filho, A. Bonomi,
Integrated versus stand-alone second generation ethanol
production from sugarcane bagasse and trash,
Bioresource Technology, 103. 152-161, 2011
[5] EES Engineering Equation Solver, 2012. Available at: www.fchart.com/ees/
[6] L. F. Pellegrini, Thermo-Economic-Environmental
analysis applied to the combined production of sugar,
ethanol and electricity (in Portuguese), 346p., Doctoral
Thesis, Mechanical Engineering Department,
Polytechnic School of the University of São Paulo, São
Paulo, 2009.
[7] A. V. Ensinas, Thermal integration and termoeconomic
optimization applied to the industrial process of sugar
and ethanol from surgarcane (in Portuguese), 229 p.,
Doctoral Thesis, University of Campinas, Mechanical
Engineering Department, Campinas, 2009.
[8] H. I. Velásquez, Exergetic and exergo-enviromental
evaluation of the biofuel production (in Portuguese),
235p., Doctoral Thesis, Mechanical Engineering
Department, Polytechnic School of the University of
São Paulo, São Paulo, 2009.
[9] L. F. Pellegrini, S. Oliveira Junior, Combined
production of sugar, ethanol and electricity:
Thermoeconomic and environmental analysis and
optimization, Energy 36, 3704-3715, 2011
[10] P. A. Soares, J. L. Olivério, The Dedini vision - Acid
hydrolysis - A practical experience of the process
Dedini Rapid Hydrolysis (DRH), Workshop on
hydrolysis, Technological Centre of Bioethanol - CTBE,
1, 1 - 53, 2009
[11] P. A. Soares, C. E. Rossell, Cellulose conversion using
the Organosolv technology (Vol. 3) (in Portuguese). São
Paulo: Naippe, 2009
[12] J. A. Fortman, Techno-economic comparison of hot
water and dilute acid pretreatment for biochemical
production of ethanol from corn stover and evaluation
of alternative scenarios to purchasing cellulase
enzymes, Graduate Theses and Dissertations. Paper
10495, Iowa State University Iowa State University,
2009
[13] M.J. Taherzadeh, K. Karimi, Acid-based hydrolysis
processes for ethanol from lignocellulosic materials: A
review, BioResources, 2, 472-499, 2007
[14] PACEGE-ESALQ, Production costs of sugarcane,
ethanol and sugar in Brazil: Harvest 2011/2012, 1st Ed,
February 2012
[15] M.R. Joia, M.S.F.A Fregonesi, A.J, Rezende, Tax
analysis of the sugarcane industry in Brazil, Qualit@s
Revista Eletrônica Vol.1. N°1, 2011
[16] ANEEL (2011). Brazilian Electricity Regulatory
Agency. Accessed March 30, 2014. Available:
http://www.mme.gov.br/mme/galerias/arquivos/acoes/E
nergia/Leilxes_de_Transmissxo_-_resultados_2011-
2012_xfinalx_x3x.pdf