Think Like A Graph: Real-Time Traffic Estimation at City-Scale Zhidan Liu , Member, IEEE, Pengfei Zhou, Zhenjiang Li , Member, IEEE, and Mo Li , Member, IEEE Abstract—This paper presents a graph processing based traffic estimation system, GPTE, which is able to achieve high accuracy and high scalability to support city scale traffic estimation. GPTE benefits from its non-linear traffic correlation modeling and the graph-parallel processing framework built on clustered machines. By representing the road network as a property graph, GPTE decomposes the numerous computations involved in non-linear models to vertices and performs traffic estimation via neural network modeling and iterative information propagation. This paper presents our experiences in designing and implementing GPTE on top of the Spark, an emerging cluster computing framework. Extensive experiments are performed with real-world data input from Singapore’s transport authority. Experimental results show that GPTE achieves as high as 88 percent accuracy in traffic estimation and up to 8performance gain in computation efficiency with the optimization techniques applied. Comparison study demonstrates that GPTE outperforms the baseline solutions by 34 percent on accuracy and 46 percent on processing time. Index Terms—Traffic estimation, graph-parallel processing, non-linear correlation modeling Ç 1 INTRODUCTION A CCURATE and timely traffic information is of essential importance to urban transportation, and tremendous efforts have been put in efficiently monitoring the traffic conditions in the past decades. Conventional methods rely on deploying intrusive sensing infrastructures, e.g., traffic cameras or inductive loop detectors [43], to actively detect traffic conditions. Due to the excessive deployment and maintenance overheads, it becomes prohibitive when adopt- ing such intrusive solutions at city scale, and as a result the coverage is limited to certain busy road segments or junc- tions in most cities. Many recent studies resort to data-driven solutions, where location reports collected from driving vehicles on roads are leveraged to derive traffic conditions [23], [41], [52]. Vehicles, equipped with GPS devices, can periodically report their instant status including locations, travel speeds, travel directions, etc. This information can be used to estimate instant traffic speeds of roads covered by probe vehicles. Such passive traffic sensing methods avoid expensive infrastructure deployment and largely extend the coverage of traffic estimation. As an example of practice, the Land Transport Authority (LTA) [1] of Singapore is currently making use of the GPS reports from 12000+ taxi fleet to derive the city wide road traffic in its TrafficScan portal that publishes the live traffic information to all Singaporean citizens [2], [9]. Despite these advantages, such solutions are inherently limited by the number of probe vehicles. In TrafficScan, even with 12000+ taxis the available GPS reports (which are generated every 30 seconds in each 15 mins time slot) are still sparse when compared with the 58000+ road segments of the city. The Google Traffic, 1 with its combined usage of traffic data acquired from local trans- port authority (e.g., LTA in the case of Singapore) and crowdsourced location reports from mobile phones, shares similar limit in data availability and coverage. Many works were proposed to address the data sparsity issue in passive traffic estimation. Most of them exploit the traffic correlations among different road segments to recover the complete traffic from incomplete road measurements [23], [40], [52]. The traffic correlations used in those works are explicitly or implicitly modeled linearly mainly to reduce computations for large road networks. The practical traffic, however, is influenced by various factors, e.g., intricate road network, transport regulations, mixed traffic flows, etc., and thus are much more complex than linearly, which requires advanced modeling for more accurate estimation. There exist a few studies that consider non-linear traffic correlation models [4], [16], [40], all of which, however, suffer from poor scalability due to enormous computation overheads involved in non-linear models, which strictly limits their practical applicability to larger scale traffic estimation. This paper proposes a non-linear model to characterize the traffic correlations and derive traffic with the 12000+ taxi probes from LTA. In order to cope with the heavy com- putations introduced by the model, we develop a graph processing framework that can be efficiently executed in parallel on computer cluster. In the proposed framework, the road network is represented as a property graph, where vertices are road segments and edges are formed between Z. Liu is with the College of Computer Science and Software Engineering, Shenzhen University, Shenzhen 518060, China. E-mail: [email protected]. P. Zhou is with the School of Software, Tsinghua University, Beijing 100084, China. E-mail: [email protected]. Z. Li is with the Department of Computer Science, City University of Hong Kong, Hong Kong. E-mail: [email protected]. M. Li is with the School of Computer Science and Engineering, Nanyang Technological University, Singapore 639798. E-mail: [email protected]. Manuscript received 5 Apr. 2018; revised 25 Aug. 2018; accepted 19 Sept. 2018. Date of publication 4 Oct. 2018; date of current version 28 Aug. 2019. (Corresponding author: Zhidan Liu.) For information on obtaining reprints of this article, please send e-mail to: [email protected], and reference the Digital Object Identifier below. Digital Object Identifier no. 10.1109/TMC.2018.2873642 1. The details how Google Traffic derives live traffic are not public. 2446 IEEE TRANSACTIONS ON MOBILE COMPUTING, VOL. 18, NO. 10, OCTOBER 2019 1536-1233 ß 2018 IEEE. Personal use is permitted, but republication/redistribution requires IEEE permission. See ht_tp://www.ieee.org/publications_standards/publications/rights/index.html for more information.
Transcript
Think Like A Graph: Real-Time TrafficEstimation at City-Scale
Zhidan Liu ,Member, IEEE, Pengfei Zhou, Zhenjiang Li ,Member, IEEE, and Mo Li ,Member, IEEE
Abstract—This paper presents a graph processing based traffic estimation system, GPTE, which is able to achieve high accuracy
and high scalability to support city scale traffic estimation. GPTE benefits from its non-linear traffic correlation modeling and the
graph-parallel processing framework built on clustered machines. By representing the road network as a property graph, GPTE
decomposes the numerous computations involved in non-linear models to vertices and performs traffic estimation via neural network
modeling and iterative information propagation. This paper presents our experiences in designing and implementing GPTE on top
of the Spark, an emerging cluster computing framework. Extensive experiments are performed with real-world data input from
Singapore’s transport authority. Experimental results show that GPTE achieves as high as 88 percent accuracy in traffic estimation
and up to 8� performance gain in computation efficiency with the optimization techniques applied. Comparison study demonstrates
that GPTE outperforms the baseline solutions by 34 percent on accuracy and 46 percent on processing time.
Index Terms—Traffic estimation, graph-parallel processing, non-linear correlation modeling
Ç
1 INTRODUCTION
ACCURATE and timely traffic information is of essentialimportance to urban transportation, and tremendous
efforts have been put in efficiently monitoring the trafficconditions in the past decades. Conventional methods relyon deploying intrusive sensing infrastructures, e.g., trafficcameras or inductive loop detectors [43], to actively detecttraffic conditions. Due to the excessive deployment andmaintenance overheads, it becomes prohibitive when adopt-ing such intrusive solutions at city scale, and as a result thecoverage is limited to certain busy road segments or junc-tions inmost cities. Many recent studies resort to data-drivensolutions, where location reports collected from drivingvehicles on roads are leveraged to derive traffic conditions[23], [41], [52]. Vehicles, equipped with GPS devices, canperiodically report their instant status including locations,travel speeds, travel directions, etc. This information can beused to estimate instant traffic speeds of roads covered byprobe vehicles. Such passive traffic sensing methods avoidexpensive infrastructure deployment and largely extend thecoverage of traffic estimation. As an example of practice, theLand Transport Authority (LTA) [1] of Singapore is currentlymaking use of the GPS reports from 12000+ taxi fleet toderive the city wide road traffic in its TrafficScan portal
that publishes the live traffic information to all Singaporeancitizens [2], [9]. Despite these advantages, such solutionsare inherently limited by the number of probe vehicles.In TrafficScan, even with 12000+ taxis the available GPSreports (which are generated every 30 seconds in each15 mins time slot) are still sparse when compared with the58000+ road segments of the city. The Google Traffic,1 withits combined usage of traffic data acquired from local trans-port authority (e.g., LTA in the case of Singapore) andcrowdsourced location reports from mobile phones, sharessimilar limit in data availability and coverage.
Many works were proposed to address the data sparsityissue in passive traffic estimation. Most of them exploit thetraffic correlations among different road segments to recoverthe complete traffic from incomplete road measurements[23], [40], [52]. The traffic correlations used in those worksare explicitly or implicitlymodeled linearlymainly to reducecomputations for large road networks. The practical traffic,however, is influenced by various factors, e.g., intricate roadnetwork, transport regulations, mixed traffic flows, etc., andthus are much more complex than linearly, which requiresadvanced modeling for more accurate estimation. Thereexist a few studies that consider non-linear traffic correlationmodels [4], [16], [40], all of which, however, suffer frompoor scalability due to enormous computation overheadsinvolved in non-linear models, which strictly limits theirpractical applicability to larger scale traffic estimation.
This paper proposes a non-linear model to characterizethe traffic correlations and derive traffic with the 12000+taxi probes from LTA. In order to cope with the heavy com-putations introduced by the model, we develop a graphprocessing framework that can be efficiently executed inparallel on computer cluster. In the proposed framework, theroad network is represented as a property graph, wherevertices are road segments and edges are formed between
� Z. Liu is with the College of Computer Science and Software Engineering,Shenzhen University, Shenzhen 518060, China.E-mail: [email protected].
� P. Zhou is with the School of Software, Tsinghua University, Beijing100084, China. E-mail: [email protected].
� Z. Li is with the Department of Computer Science, City University ofHong Kong, Hong Kong. E-mail: [email protected].
� M. Li is with the School of Computer Science and Engineering, NanyangTechnological University, Singapore 639798. E-mail: [email protected].
Manuscript received 5 Apr. 2018; revised 25 Aug. 2018; accepted 19 Sept.2018. Date of publication 4 Oct. 2018; date of current version 28 Aug. 2019.(Corresponding author: Zhidan Liu.)For information on obtaining reprints of this article, please send e-mail to:[email protected], and reference the Digital Object Identifier below.Digital Object Identifier no. 10.1109/TMC.2018.2873642 1. The details how Google Traffic derives live traffic are not public.
2446 IEEE TRANSACTIONS ON MOBILE COMPUTING, VOL. 18, NO. 10, OCTOBER 2019
1536-1233� 2018 IEEE. Personal use is permitted, but republication/redistribution requires IEEE permission.See ht _tp://www.ieee.org/publications_standards/publications/rights/index.html for more information.
connected road segments. By distributing the propertygraph among machines, we decompose all computationtasks at each vertex and perform complete traffic estima-tion via information propagation among vertices. Thissolution embraces non-linear traffic correlations for higherestimation accuracy and can be highly parallelized forcity-scale traffic estimation.
The idea being attractive, developing a practical systemout of it is challenging for at least two reasons. First, it isnon-trivial to model non-linear traffic correlations within agraph. As taxis freely travel across roads, the traffic states ofgraph vertices are randomly sampled and they form a time-evolving graph. Due to such dynamics, the vertices withknown traffic states are changing over time. As a result, it isimpossible to maintain a fixed correlation model throughouttraffic estimations. Second, a number of system details needto be carefully addressed when implementing the fullsystem. In particular, when we fit our solution into a clustercomputing platform,wemust not only consider computationcost but also minimize the communication overhead associ-ated with data exchange and computing threads running ondifferent machines. This requires wise treatments to the traf-fic data given road network structure and characteristics.
We propose Graph-parallel Processing based TrafficEstimation - GPTE, which addresses above challenges. GPTErepresents road network data as a property graph andannotates vertex states with real-time traffic samplings.GPTE builds artificial neural network (ANN) models to cap-ture the correlations and iteratively propagates traffic infor-mation from annotated vertices to those vertices of unknownstates. To deal with dynamics in the time-evolving graph, foreach unannotated vertex GPTE dynamically selects corre-lated vertices from its annotated neighbors, and builds aninstant ANN model to infer its traffic state. We build GPTEbased on the latest cluster computing framework Spark [44],and make use of interfaces provided by the recent graphprocessing engine GraphX [14]. To reduce communicationcost during the cluster execution, we propose a geography-aware graph partitioner that optimizes the data layout ondifferentmachines.We improve the efficiency of informationpropagation among vertices using multi-hop messagebroadcast scheme and redundant message elimination.In addition, we incorporate a set of optimization techniquesto improve the accuracy and efficiency of data processing.
To the best of our knowledge, this is the first real-timetraffic estimation solution that incorporates advanced trafficcorrelation modeling for large scale road networks. We sys-tematically evaluate the performance of GPTE with real-world traffic data provided by LTA. The experimental resultsshow that in average GPTE can accomplish the traffic estima-tion for the entire city in every 15 mins time slot in 34 secondsand achieve as high as 88 percent estimation accuracy.
In the rest of this paper, we present the motivationand design in Sections 2 and 3, respectively. The systemimplementation is detailed in Section 4. Optimizationsare presented in Section 5. The evaluations are described inSection 6. We review related works in Section 7. FinallySection 8 concludes this paper.
2 TRAFFIC ESTIMATION WITH PROBES
The Problem. The road network of an urban city is composedof a number of roads of different types, e.g., expressways,major roads, minor roads, etc. Each road is further divided
into smaller road segments for better granularity in trafficestimation. The traffic condition of a road segment ri can bemeasured by the average traffic speed vi within a time slot,which used to be collected via expensive sensing infrastruc-tures, e.g., inductive loop detectors [43], at a few importantroad segments. An appealing alternative that has beenrecently practiced is data-driven and based on the trafficsamplings from probe vehicles. A typical traffic samplingcontains a timestamp, location, travel speed, travel direc-tion, etc. [38]. For each road segment ri, its traffic conditionvi can be approximated as the average travel speed of allprobe vehicles passing by [40], [52]. The approximation isconsidered credible if the road segment is sampled by a suf-ficient number, e.g., � �, of probe vehicles [39]. The objec-tive of traffic estimation is to derive the timely, accurate, andcomplete traffic conditions for all road segments based onthe available traffic samplings from probe vehicles.
A concrete practice is TrafficScan [2] that has been devel-oped and used by the LTA of Singapore. Since 1999, LTAhas been trying to exploit the traffic samplings collectedfrom driving taxis to conduct traffic estimation and pro-vided such information to the public for their route plan-ning. More than 12000 taxis have recently been engaged inproviding traffic samplings and the LTA is planning to scaleup to include the entire taxi fleet of over 21000 taxis in thecountry for improved accuracy. The LTA solution, however,has been severely suffering from the data sparsity issue allthe time. A particular road segment may not have any taxispassing by at certain time slots, resulting in incompleteroad coverage. According to our statistics on the Singaporetaxi dataset (short for SG dataset and see more details inSection 6.1), in average less than 30 percent road segments(out of 58356 in total) are covered by taxi data in 15 minstime slot. The current LTA solution applies space interpola-tion to infer the traffic of uncovered roads, which deliverspoor accuracy [9].
Non-Linearity in Traffic Estimation. Other than the simpleinterpolation method applied by the LTA, there have beenmany studies that exploit spatial correlation among roadsegments in order to complete the traffic estimation. Thetraffic of nearby road segments is mutually influenced, andthus their traffic conditions are highly correlated [23], [40],[52]. We term it as traffic correlation in this paper. Previousworks explicitly or implicitly model the traffic correlationslinearly mainly to reduce the tremendous computationoverheads, and recover the complete traffic conditions byexploiting techniques like regression [41], [48], matrix fac-torization [39], tensor decomposition [33], [37], and com-pressive sensing [23], [52]. The practical traffic, however, isaffected by a number of factors, e.g., intricate road network,traffic regulations, traffic lights, mixed traffic flows, weathercondition, etc., and far more complex than linearly.
To better capture inscrutable traffic correlations, somerecent works suggest building a non-linear model by ANN[4], [24], [35]. The ANNmodel is remarkable in representingcomplex patterns from imprecise data, and enables us tocapture detailed traffic correlations for each road segment.Specifically, for road segment ri and its n correlated roadsegments, we can build a three-layer feed-forward neuralnetwork to model their traffic correlations. The desired out-put of the model is traffic condition vi of ri, while the inputlayer consists of traffic conditions vj of each correlated roadsegment rj. The hidden layer of the model contains ðnþ 1Þ
LIU ETAL.: THINK LIKE AGRAPH: REAL-TIME TRAFFIC ESTIMATION ATCITY-SCALE 2447
hidden unit2 hk. Both hidden and output units can use astandard hyperbolic tangent (i.e., tanh) activation function.Therefore, the ANN model includes n� ðnþ 1Þ input-to-hidden parameters, ðnþ 1Þ � 1 hidden-to-output parame-ters. With sufficient training data of m samples, a standardback-propagation algorithm can be adopted to train theANN model by minimizing the mean square error as theoptimization objective. The computation complexity to trainan ANNmodel is Oðm � n2Þ.
For example, assuming the correlated road segments ofroad segment r3 as depicted in Fig. 1a are r1, r2, r4, and r5,we can build the three-layer neural network as shown inFig. 1b, which includes 4 input units, 5 hidden units, and 1output unit. We train the model using historical traffic data,and can use the derived model to connect r3’s traffic condi-tion v3 with the traffic conditions of r1, r2, r4, and r5.
To examine the advantage of non-linear models overthe linear ones, we compare the traffic estimation accuracyusing ANN model and using a representative linear model,i.e., multiple linear regression (MLR) [22], based on the SGdataset. The MLR model has been widely used for traffic cor-relation modeling in existing works [5], [23], [31], whichrepresents traffic condition of one road segment as a linearcombination of correlated road segments. Specifically, for atarget road segment ri and its n correlated road segmentsrj; j ¼ 1; 2; . . . ; n, we can build the MLR model to capturetheir traffic correlation to predict ri’s traffic condition criusing the following equation:
cri ¼ b0 þXn
j¼1bj � crj ;
where b0 and bj are model coefficients [22]. With sufficienttraining data, we can determine the MLR model usingleast-square method. Similar to the ANN model, the MLRmodel also takes the traffic conditions of n correlated roadsegments as input to predict ri’s traffic condition. For com-parison, we randomly select 500 road segments for each roadtype from the Singapore road network (see details in Sec-tion 6.1). For each test road segment, we select its directlyconnected road segments for building both the ANN modeland the MLR model to capture traffic correlations. The accu-racy is derived from the estimations of ANN/MLR models
and ground truth. The statistics in Fig. 2 show that ANNmodel has much higher accuracy than MLR model on bothworkdays and weekends. The gap is even wider on work-days, which experience much heavier and more complextraffic. In addition to high-level statistics, we compare theirmodeling capability on individual road segments. Specifi-cally, for one road segment ri, if ANN delivers higher accu-racy than MLR we consider ANN beats MLR on ri, and viceverse. We calculate the percentage of the road segments onwhich ANN wins and find that ANN outperforms MLR for73.5 and 78.9 percent of all test road segments on workdaysand weekends, respectively. In particular, their accuracy dif-ferences larger than 1 percent account for 69.5 and 76.9 per-cent for workdays and weekends, respectively. Moreover,we also analyze the other 26.5 and 21.2 percent cases whereMLR performs better than ANN. In these cases, the accuracydifferences greater than 1 percent are no more than 53 per-cent. These results show the gain of using ANN models toaccurately capture the complex traffic correlations.
Challenges. While ANN based traffic correlation model-ing provides clear improvement in estimation accuracy, it ischallenging to introduce the ANN modeling for large scaleestimation. First, fine ANN modeling for traffic correlationsis non-trivial. A proper model needs to determine the correctcorrelated road segments, which involves various combina-tions in the road network space and thus results in huge com-putations. In addition, the randommovements of taxis bringuncertain availability of traffic samplings [5], which requiresdynamic ANN modeling during the estimation stage. Theinherent complexity in building ANNmodels will inevitablyintroduce tremendous computation overheads, especiallywhen we scale the traffic estimation to the entire city thatinvolves tens of thousands of road segments and the relatedANN modeling. Such computation overheads may over-whelmingly degrade the timeliness of traffic estimation.
3 THINK LIKE A GRAPH
To address the challenges, we present Graph-parallel Proc-essing based Traffic Estimation - GPTE. In this section,we detail how GPTE represents road network data as aproperty graph and enables non-linear correlation modelingbased traffic estimation on the property graph.
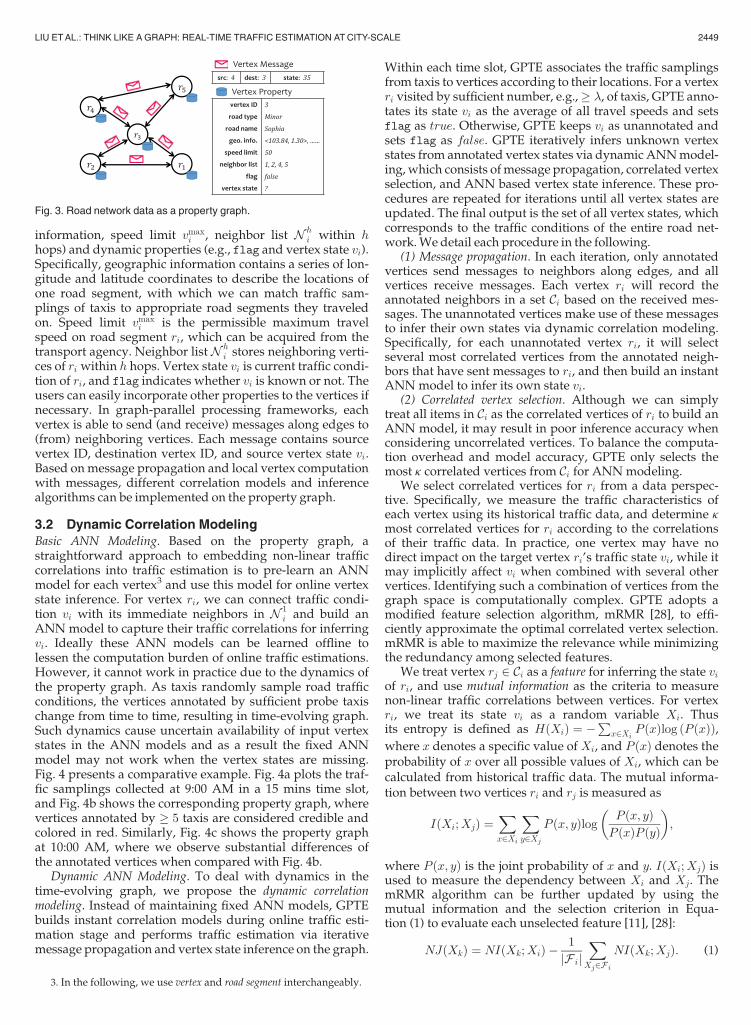
3.1 Graph RepresentationWe model the underlying road network for traffic estima-tion as a property graph GðV; EÞ, where road segments arerepresented as vertices and edges are formed between anytwo physically connected road segments. Fig. 3 depicts thecorresponding property graph for the simple road networkpresented in Fig. 1a. As the traffic conditions of connectingroad segments are mutually influenced, the edges are thusbidirectional. In such a property graph, each vertex ri ownsstatic properties (e.g., road type, road name, geographic
Fig. 1. (a) A simple road network. (b) The three-layer ANN model for cap-turing the traffic correlations between road segment r3, r1, r2, r4, and r5.
Fig. 2. CDF of MLR and ANN model accuracy on capturing the trafficcorrelations.
2. In this paper, we empirically set the number of hidden units in thehidden layer as ðnþ 1Þ to balance the computation overhead and pre-diction accuracy. We find that if we further increase the hidden unitnumber, e.g., ðnþ 2Þ, the prediction accuracy improvement is less than0.5 percent, while the ANN training time increases at least 1 second.However, even the 1-second time increase for each individual ANNmodel training could introduce about 81 minutes overall traffic estima-tion delay, which prohibits the near real-time traffic estimation.
2448 IEEE TRANSACTIONS ON MOBILE COMPUTING, VOL. 18, NO. 10, OCTOBER 2019
information, speed limit vmaxi , neighbor list N h
i within hhops) and dynamic properties (e.g., flag and vertex state vi).Specifically, geographic information contains a series of lon-gitude and latitude coordinates to describe the locations ofone road segment, with which we can match traffic sam-plings of taxis to appropriate road segments they traveledon. Speed limit vmax
i is the permissible maximum travelspeed on road segment ri, which can be acquired from thetransport agency. Neighbor list N h
i stores neighboring verti-ces of ri within h hops. Vertex state vi is current traffic condi-tion of ri, and flag indicates whether vi is known or not. Theusers can easily incorporate other properties to the vertices ifnecessary. In graph-parallel processing frameworks, eachvertex is able to send (and receive) messages along edges to(from) neighboring vertices. Each message contains sourcevertex ID, destination vertex ID, and source vertex state vi.Based onmessage propagation and local vertex computationwith messages, different correlation models and inferencealgorithms can be implemented on the property graph.
3.2 Dynamic Correlation ModelingBasic ANN Modeling. Based on the property graph, astraightforward approach to embedding non-linear trafficcorrelations into traffic estimation is to pre-learn an ANNmodel for each vertex3 and use this model for online vertexstate inference. For vertex ri, we can connect traffic condi-tion vi with its immediate neighbors in N 1
i and build anANNmodel to capture their traffic correlations for inferringvi. Ideally these ANN models can be learned offline tolessen the computation burden of online traffic estimations.However, it cannot work in practice due to the dynamics ofthe property graph. As taxis randomly sample road trafficconditions, the vertices annotated by sufficient probe taxischange from time to time, resulting in time-evolving graph.Such dynamics cause uncertain availability of input vertexstates in the ANN models and as a result the fixed ANNmodel may not work when the vertex states are missing.Fig. 4 presents a comparative example. Fig. 4a plots the traf-fic samplings collected at 9:00 AM in a 15 mins time slot,and Fig. 4b shows the corresponding property graph, wherevertices annotated by � 5 taxis are considered credible andcolored in red. Similarly, Fig. 4c shows the property graphat 10:00 AM, where we observe substantial differences ofthe annotated vertices when compared with Fig. 4b.
Dynamic ANN Modeling. To deal with dynamics in thetime-evolving graph, we propose the dynamic correlationmodeling. Instead of maintaining fixed ANN models, GPTEbuilds instant correlation models during online traffic esti-mation stage and performs traffic estimation via iterativemessage propagation and vertex state inference on the graph.
Within each time slot, GPTE associates the traffic samplingsfrom taxis to vertices according to their locations. For a vertexri visited by sufficient number, e.g.,� �, of taxis, GPTE anno-tates its state vi as the average of all travel speeds and setsflag as true. Otherwise, GPTE keeps vi as unannotated andsets flag as false. GPTE iteratively infers unknown vertexstates from annotated vertex states via dynamic ANNmodel-ing,which consists ofmessage propagation, correlated vertexselection, and ANN based vertex state inference. These pro-cedures are repeated for iterations until all vertex states areupdated. The final output is the set of all vertex states, whichcorresponds to the traffic conditions of the entire road net-work.We detail each procedure in the following.
(1) Message propagation. In each iteration, only annotatedvertices send messages to neighbors along edges, and allvertices receive messages. Each vertex ri will record theannotated neighbors in a set Ci based on the received mes-sages. The unannotated vertices make use of these messagesto infer their own states via dynamic correlation modeling.Specifically, for each unannotated vertex ri, it will selectseveral most correlated vertices from the annotated neigh-bors that have sent messages to ri, and then build an instantANNmodel to infer its own state vi.
(2) Correlated vertex selection. Although we can simplytreat all items in Ci as the correlated vertices of ri to build anANN model, it may result in poor inference accuracy whenconsidering uncorrelated vertices. To balance the computa-tion overhead and model accuracy, GPTE only selects themost k correlated vertices from Ci for ANNmodeling.
We select correlated vertices for ri from a data perspec-tive. Specifically, we measure the traffic characteristics ofeach vertex using its historical traffic data, and determine kmost correlated vertices for ri according to the correlationsof their traffic data. In practice, one vertex may have nodirect impact on the target vertex ri’s traffic state vi, while itmay implicitly affect vi when combined with several othervertices. Identifying such a combination of vertices from thegraph space is computationally complex. GPTE adopts amodified feature selection algorithm, mRMR [28], to effi-ciently approximate the optimal correlated vertex selection.mRMR is able to maximize the relevance while minimizingthe redundancy among selected features.
We treat vertex rj 2 Ci as a feature for inferring the state viof ri, and use mutual information as the criteria to measurenon-linear traffic correlations between vertices. For vertexri, we treat its state vi as a random variable Xi. Thusits entropy is defined as HðXiÞ ¼ �P
x2XiP ðxÞlog ðP ðxÞÞ,
where x denotes a specific value ofXi, and P ðxÞ denotes theprobability of x over all possible values of Xi, which can becalculated from historical traffic data. The mutual informa-tion between two vertices ri and rj is measured as
IðXi;XjÞ ¼Xx2Xi
Xy2Xj
P ðx; yÞlog P ðx; yÞP ðxÞP ðyÞ
� �;
where P ðx; yÞ is the joint probability of x and y. IðXi;XjÞ isused to measure the dependency between Xi and Xj. ThemRMR algorithm can be further updated by using themutual information and the selection criterion in Equa-tion (1) to evaluate each unselected feature [11], [28]:
NJðXkÞ ¼ NIðXk;XiÞ � 1
jF ijX
Xj2F i
NIðXk;XjÞ: (1)
Fig. 3. Road network data as a property graph.
3. In the following, we use vertex and road segment interchangeably.
LIU ETAL.: THINK LIKE AGRAPH: REAL-TIME TRAFFIC ESTIMATION ATCITY-SCALE 2449
In particular, for a target road segment ri and the feature setF i that has been selected, the first term in Equation (1)measures the mutual information of an unselected featurerk 2 Ci and target ri, which is denoted as dependence, whilethe second term measures the average redundancy of rkand the already selected features in F i, which is denoted asredundancy. These two terms together determine whether rkshould be further included in F i.
Different from the original mRMR algorithm in [28], wenormalize the mutual information IðXk;XiÞ by HðXiÞaccording to [11] and define NIðXk;XiÞ ¼ IðXk;XiÞ
HðXiÞ , so that
the normalized mutual information NIðXk;XiÞ 2 ½0; 1�,because the entropy of a feature itself could vary greatly.
However, HðXiÞ cannot be used to normalize IðXk;XiÞdirectly, since
IðXk;XjÞHðXiÞ may not fall in the range ½0; 1�. Con-
sidering 0 � IðX;Y Þ � minfHðXÞ; HðY Þg, we can further
define NIðXk;XjÞ ¼ IðXk;XjÞminfHðXkÞ;HðXjÞg 2 ½0; 1�. Therefore, for a
target road segment ri, we iteratively select the featurerk 2 Ci that maximizes Equation (1), implying that rk has alarge dependency with ri and small redundancy with cur-rent F i. We repeat this process until k features are selectedor NJðXkÞ � 0.
(3) ANN based vertex state inference. Once the correlatedverticesF i are selected, the unannotated vertex ri can locallytrain an ANN model to capture its traffic correlations withthe correlated vertices in F i using their historical trafficspeeds. Specifically, we normalize the historical trafficspeeds by comparing with speed limit vmax of each vertexrespectively during the ANN training. After successfullylearning the correlation model, vertex ri feeds the normal-ized states of vertices in F i, extracted from received mes-sages, into the ANNmodel to infer its own state vi. Similarly,we normalize the vertex state vj of rj 2 F i as
vjvmaxj
using its
speed limit, and recover the state of vertex ri as the productof model inference and speed limit vmax
i . The normalizationcan unify the speed scales of road segments in different roadtypes and transform the input data to the range ½�1; 1�, wherethe activation function tanh has the best non-linear transfor-mation capability. Note that vertex ri only uses the builtANN model once in current time slot and it may need tolearn a new model with different correlated vertices in nexttime slot due to the evolution of property graph. Finally, ver-tex ri updates its state as annotated and changes flag astrue. In the subsequent iterations, ri will sendmessages to itsneighbors for inferring other unknown vertex states.
4 PUTTING THINGS INTO SPARK
Ideally GPTE should implement the algorithms introducedin previous section into an integrated computing framework
that supports both data-parallel and graph-parallel compu-tation. The emerging cluster computing framework Spark[44], which builds on the abstraction Resilient DistributedDatasets (RDDs), supports such requirements. In addition todataflow operations, the graph processing engine GraphX[14] is built atop of Spark, which represents graph-structureddata as a property graph including a pair of vertex RDDs andedge RDDs and embeds graph computations as specific join-map-group-by dataflow operators on these RDDs.
Basic Implementation. GPTE is implemented on the Sparkand makes use of some GraphX APIs. Fig. 5 illustrates theexecution flow of GPTE in a Spark cluster, which adopts theHadoop distributed file system (HDFS) for distributed datastorage. In the cluster, one machine is selected as the Masterto coordinate parallel computing among other machines,i.e., Workers. GPTE first inputs the road network data fromthe HDFS to construct the property graph (via Graph½V; E�ðÞ).Without any optimization, the property graph is distributedto worker machines using the default graph partitioner ofGraphX (via partitionBy), which exploits a hashing func-tion to evenly distribute vertices and edges among all work-ers for load balance. GPTE then continuously conductstraffic estimation from each time slot of traffic samplings.It iteratively lets annotated vertices send messages to neigh-bors (via sendMsg) and then applies the received messagesto the property graph (via joinVertices), which allowsunannotated vertices to infer their own states (via vprog).The vertex program vprog embeds correlated vertex selec-tion and ANN modeling based vertex state inference, asmentioned in Section 3.2. Finally the set of all vertex statesis dumped to the HDFS for traffic visualization.
To improve the system efficiency, we propose (1) a geogra-phy-aware partitioner that optimizes the placement of edges/
Fig. 4. Taxis report traffic samplings periodically along their routes, which result in time-evolving property graph: (a) Traffic samplings at 9:00AM of atypical workday, where green dots represent traffic samplings. (b) The corresponding property graph snapshot generated from (a). (c) The propertygraph snapshot at 10:00AM. For (b) and (c), red dots represent annotated vertices and black dots represent vertices of unknown states.
Fig. 5. The execution flow of GPTE in a Spark cluster, which consists ofone master and some workers. The property graph is distributed to work-ers for parallel processing. The solid lines represent command flows anddashed lines represent data flow within the cluster.
2450 IEEE TRANSACTIONS ON MOBILE COMPUTING, VOL. 18, NO. 10, OCTOBER 2019
vertices and traffic data among machines to reduce unneces-sary communications across different worker machines;and (2) an efficient information propagation scheme includ-ing multi-hop message broadcast and redundant messageelimination to optimize the information exchange. Thesetechniques can significantly reduce the intra-machine andinter-machine communications and finally improve thesystem efficiency.
4.1 Geography-Aware Graph PartitioningDue to random edge/vertex assignments of hash-partitioner,the default graph partitioning schemes of GraphX may placeneighboring vertices onto different machines, which incursunnecessary communications and thus results in poor perfor-mance [19]. We thus expect a better graph partitioner tailoredto the traffic estimation. Common graph partitioningapproaches are categorized into edge-cuts and vertex-cuts [13].The former divides vertices into disjoint clusters of nearlyequal size while minimizing the number of edges spanningclusters, e.g., balanced edge-cuts in METIS [20]. Edge-cuts,however, results in many edge and vertex replicas thatimmensely consume memory. Vertex-cuts aims to divideedges into clusters with nearly equal size while reducing ver-tex replicas. Recent studies report that vertex-cuts is moreeffective than edge-cuts on processing the real-world graphs[13], [14]. Considering skewed power-law degree distributionof natural graphs, PowerGraph [13] proposes a vertex-cutstechnique that heuristically places edges across machines tominimize vertex replicas. PowerLyra [8] proposes a hybrid-cuts that combines edge-cuts and vertex-cuts according to ver-tex degrees. Road network graphs, however, do not typicallyexhibit power-law degree distribution but a relatively flat dis-tribution. These techniques thus are not directly applicable.To balance the advantages and disadvantages of aboveapproaches, we choose vertex-cuts to avoid edge replicas. Asthe vertices geographically close to each other are more likelycorrelated in traffic and may exchange messages, we proposea geography-aware partitioner for edge/vertex placements topreserve spatial locality.
The partitioner used in GPTE first maps vertices to real-world geo-coordinates using the middle points of road seg-ments. A simple and effective approach named Hilbertspace-filling curve is used to index vertices. Space-fillingcurve allows one to map multi-dimensional data, e.g,2-dimensional locations, to 1-dimensional keys that pre-serve spatial proximity [29]. Keys that are contiguous pres-ent nearby locations in space. We thus assign the space-filling curve keys to vertices based on their geographical
information. The keys are then range-partitioned into dis-joint clusters of nearly equal size. Edges are co-partitionedwith vertices by assigning them the same keys as theirsource vertices. Fig. 6a illustrates how we divide the roadnetwork space into 4� 4 cells using Hilbert space-fillingcurve and assign keys to vertices according to their locationcoordinates. Based on the keys, we divide the vertices andedges into two partitions. Fig. 6b shows the pseudocode ofkey assignment. There are some other techniques, e.g.,Quad-tree or k-means, can be used to partition the graphwhile preserving the spatial proximity of vertices as well.It is, however, difficult for them to evenly control the parti-tion sizes, and thus cannot balance the workloads amongdifferent machines (see the performance comparisons inSection 6.3), whichwill finally affect the systemperformance.
As expressways interact with other roads in traffic only atfew entries and exits, we thus separately apply the spatialindexing technique to expressway vertices and the other verti-ces, and then unify the indexes of all vertices (and edges)according to their space-filling keys.Wefirst re-index express-way vertices and then the others, both following the ascend-ing order of their original space-filling keys. Finally, weobtain the continuous vertex keys and then range-partitionvertices (and edges) given the desired number of partitions.
4.2 Efficient Information PropagationWe propose two techniques to optimize information pro-pagation among vertices. One allows multi-hop messagebroadcast to speedup the state inferences of all vertices andthe other eliminates redundant messages to further reducecommunication costs. Fig. 7 shows the pseudocode thatimplements message propagation in the Spark.
Multi-hop Message Broadcast. Since road segments distantfrom each other may still be traffic correlated, it is necessaryfor one vertex to propagate its messages to vertices withinmultiple hops rather than only direct neighbors. To achievethis, a simple approach is based on the hop-by-hop messagepropagation, where each vertex receives a message and thenforwards the message to the next hop until desired hopsare reached. Such an approach, however, is not efficient.In GraphX, message propagation is implemented withtriplets (a triplet contains an edge and its property, and thetwo vertex properties), which are derived through join oper-ations on vertex RDDs and edge RDDs. As join operation hasto be repeated for every hop, the hop-by-hopmessage propa-gation introduces excessive computations. We proposemulti-hop message broadcast instead, which allows one ver-tex to broadcast messages to vertices within h hops.
GPTE maintains a broadcast variable4 Bnb, which storesthe 1-hop neighbors for each vertex. Each vertex ri in
Fig. 6. (a) Illustration of Hilbert space-filling curve based graph partition-ing, where the property graph in Fig. 3 is divided into two partitions (inblue and red colors). (b) The pseudocode of key assignment for a givenvertex location coordinate ðx; yÞ.
Fig. 7. Pseudocode of message propagation in Spark.
4. A broadcast variable is a static lookup table and a copy is main-tained in each machine to facilitate data access in the Spark.
LIU ETAL.: THINK LIKE AGRAPH: REAL-TIME TRAFFIC ESTIMATION ATCITY-SCALE 2451
different machine can easily access the variable Bnb and
build its h-hop neighbor list N hi . For vertex ri, N 1
i includesits immediate neighbors, and the h-hop (h > 1) neighborlist N h
i is recursively built as N hi ¼ S
rj2N h�1i
N 1j . Based on
N hi , vertex ri can directly send messages to its h-hop neigh-
bors via map operator. To reduce the communication costs,GPTE first combines all messages targeting to the same ver-tex and then sends the aggregated message. Fig. 7 showsthat GPTE realizes the message broadcast through the map-reduce-by operation in the Spark. GPTE applies the h-hopmessages to the vertices with join operation only once,which completes message propagation with constant over-head instead of being proportional to the hop count.
Eliminating Redundant Messages. By default, annotatedvertices propagate messages to their neighbors and at thesame time all vertices receive the messages. As a matter offact, such messages are only useful for unannotated verticesfor inferring their states but redundant for the annotatedvertices. Therefore, it is desired that the annotated verticesonly send messages to unannotated vertices so that a largeamount of unnecessary message exchanges can be saved.
We propose redundant message elimination for GPTE toavoid unnecessary computation and communication costs.The key idea is that each annotated vertex tracks the sta-tuses of its h-hop neighbors and only sends messages tothose unannotated neighbors in the subsequent iterations.Directly sending vertex status to other vertices in a distrib-uted setting will introduce extra communication overhead,so GPTE implicitly infers vertex status by leveraging thefact that only annotated vertices propagate messages. If anannotated vertex ri receives a message from vertex rj, itmeans that rj’s state is already known and thus ri’s mes-sages to rj are redundant. Each vertex ri maintains an unan-
notated neighbor list N hi , which is initially copied from N h
i
in each time slot. For each annotated vertex ri, it removes a
neighbor rj fromN hi once it receives a message from rj. Sim-
ilarly, ri will also be removed from N hj by vertex rj as ri
sends messages to rj as well. In each iteration, ri only propa-
gates messages to the neighbors inN hi . With more and more
vertices annotated in later iterations, there are much fewermessages to be processed and thus the system efficiency isimproved. To implement this idea in the Spark, GPTE repla-
ces the neighbor list, i.e., v:nblist in Fig. 7, as N hi and
dynamically maintains the list for vertex ri during runtime.
5 OTHER OPTIMIZATIONS
As real-world traffic data are inherently sparse and noisy,GPTE adopts some data processing techniques to preprocessthe traffic data before putting them to the estimation stage.
Aggregate Travel Speeds to Alleviate Data Sparsity. Toderive an intact dataset for traffic correlation modeling, wecompress traffic dataset according to time of the day andday of the week (i.e., Monday, , Sunday). We divide theentire day into a series of time slots with size of 15 mins.For each road segment ri, we map each of its associatedtraffic samplings in the traffic dataset to a group accordingto time slot of the day and day of the week, and then aver-age the reported travel speeds of the same group as the gen-eral traffic condition of ri for the specific time slot and day.We thus obtain a compact time series Pi containing
24�6015 �
7 ¼ 672 traffic speeds. In case there still exist missing values,
we use the average of previous 4 time slots in Pi. We namePi as the speed profile of road segment ri as it describes thegeneral traffic speeds of ri in history. To avoid expensivedata movements across machines, we save all speed profilesas a broadcast variable Bsp in the Spark.
Smooth Traffic Speeds to Filter Out Noises. The traffic sam-plings could be noisy due to inaccurate GPS reports of taxis,and thus the resulting speed profiles could be noisy aswell. To filter out noises, we smooth the traffic speeds. Forroad segment ri, we apply the exponential smoothing tech-nique [32] to each day of the week for its speed profile,Dj 2 Pi; j ¼ f1; 2; ; 7g, respectively. We apply the follow-ing equation to smooth the traffic speeds in Dj:
where ai is the smoothing factor, xj;t is the raw traffic speedof the t-th time slot in Dj, sj;t is the corresponding smoothedspeed, and sj;1 ¼ xj;1. We determine the best ai value for riusing the least square method by solving
ai ¼ argmin0<ai�1
X7j¼1
X96t¼1
ðsj;t � xj;tÞ2:
Incorporate Traffic Patterns to Improve Performance. Asurban traffic is not consistent across time and days andexhibits various patterns [5], we thus incorporate such traf-fic patterns in the ANN modeling. Specifically, we minetraffic patterns for each road segment ri using its speed pro-file Pi. We first split and compress Pi into two time seriesPW
i and PNWi (both containing 96 time slots and 96 ¼
24� 60=15) according to its time slot and the type of theday, which represent general traffic speeds of ri on work-days and weekends, respectively. We then separately applythe top-down time series segmentation algorithm [21] onPW
i and PNWi to divide the 96 time slots into consecutive
time slot groups, each of which represents a traffic patternand preserves similar varying trend of traffic speeds.To guarantee that we have adequate traffic speeds in eachtraffic pattern for ANN training, we set the minimum sizeof a time slot group as v. The segmentation algorithm repet-itively divides time slot series until each group cannot beseparated any more. During online traffic estimation, GPTEbuilds the ANN model for each vertex only using trafficspeeds belonging to the same traffic pattern, which avoidsirrelevant training data that may lead to overfitting.
6 EVALUATION
We conduct extensive trace-driven experiments with real-world traffic dataset to evaluate GPTE. We first describe theexperimental setup, then evaluate the estimation accuracyof GPTE with comparisons to baseline methods, and finallyrun detailed experiments to evaluate the GPTE design.
6.1 Experimental SetupWe use the road network data and two months of taxi dataprovided by the LTA to evaluate GPTE in a cluster.
Road Network. The road network covers the whole mainisland of Singapore and contains all road segments. In theroad network, two driving directions of a road are separatelyrepresented. LTA divides all roads into 58356 road segmentsfor traffic analysis purpose. These road segments are catego-rized according to their types as expressway (=2404), major
2452 IEEE TRANSACTIONS ON MOBILE COMPUTING, VOL. 18, NO. 10, OCTOBER 2019
(=14493), minor (=4814), collector (=11140), local (=21620),slip links (=3234), andNCAT (non-category, =651).
SG Dataset. The dataset contains traffic samplings col-lected from more than 12000 taxis covering the whole Singa-pore road network in July and August of 2015. Each taxisends back a report every 30 seconds, which includes a time-stamp, GPS location, travel speed, direction, status (availableor busy), etc. About 10million reports are collected each day.
To prepare a clean and correct dataset, we adopt an accu-rate map matching algorithm [27] to match each traffic sam-pling to the road segment a taxi actually traveled, whichfilters the errant traffic samplings due to GPS noises as well.In addition, we only keep the traffic samplings with taxistatus as busy for experiments as they reflect more represen-tative conditions of normal traffic. We derive the road cov-erage by the taxi data, and average the two month data intoworkday and weekend in Fig. 8a. We use a time slot of size15 mins. For each time slot, the road coverage is measuredas # of road segments with taxi samplings
# of all road segments . From Fig. 8a, we see theroad coverage varies across the time of a day, and the aver-age coverage ratios are only 32 and 29 percent for workdayand weekend, respectively. Among the road segments with-out taxi samplings, we summarize its composition of roadtypes. Fig. 8b gives the profile—most of them are local(49 percent), major (18 percent), and collector (18 percent)roads since the three road types account for large propor-tions among all kinds of road segments.
For evaluations, we keep the traffic data from the lastweek of August for testing and all the rest as historical traf-fic. During the testing phase, we randomly select r percentsof all taxis in each time slot as probe taxis and use their trafficsamplings for traffic estimation. GPTE makes use of the ver-tex states annotated by � � 5 probe taxis to infer unknownvertex states on the property graph. We perform traffic esti-mations for 5:00 AM to 21:00 PM everyday, which is the typ-ical time period that contains more traffic in Singapore.
Evaluation Metrics. During each time slot, we calculateaverage traffic speed vi of road segment ri using all trafficsamplings and consider the speed vi annotated by � 5 taxisas the ground truth. The estimation accuracy on ri is definedas accuracy ¼ ð1� jvi�v̂ij
viÞ � 100%, where vi is the ground
truth and v̂i is the estimation. We use the execution time oftraffic estimation to measure the computation efficiency.
As Fig. 8a depicts, 60-80 percent of road segments arenot covered by taxis in one time slot, so we want to specifi-cally evaluate how our traffic estimation approach performsover such uncovered roads. Because we do not have any
traffic samplings (so no ground truth) on those uncoveredroads, direct evaluation is not possible. Instead, we constructa subset S of 100 road segments, composed of different roadtypes (the composition follows the percentage profiled inFig. 8b). We take away the taxi data on S from the originaldataset and input to traffic estimation approach, so no trafficsamplings on road segments of S are used during traffic esti-mation. On the other hand, we can build ground truth forthose 100 road segments from the taxi data we take away,and use that for accuracy evaluation. The estimation accu-racy on S suggests how the estimation approach performson the uncovered roads (which account for 60%-80% roadsegments in each time slot). We separately report the accu-racy results for subset S aswell as those for all road segmentsin Singapore wherewe have� 5 taxi speed annotations.
The Spark Configuration. We implement GPTE on theSpark 2.1.0 [3]. For GPTE, we set h ¼ 5 to enable eachvertex broadcast its messages to neighbors within 5 hops. Weset k ¼ 3 and thus each vertex selects at most 3 correlated ver-tices to build the ANN model. Accordingly, we set v ¼ 30 toguarantee sufficient traffic speeds in each traffic pattern forANN training. These settings are empirically determined inorder to balance the estimation accuracy and computationoverhead.
Our evaluation environment consists of 5 machines form-ing a cluster. Each machine has 24 Intel Xeon(R) 3.07 GHzCPU cores and 24GB ofmemory. All machines share a disk ofsize 2TB. All the road network data and taxi data are stored inthe HDFS for distributed data processing. To run GPTE in theSpark, we set onemachine as the master machine and treat allthe 5 machines as the worker machines, which will performthe ANN modeling and traffic estimations. We have mea-sured the resource utilizations of GPTE on the Spark. Specifi-cally, we sample the CPU utilization and memory usage foreach machine with an interval of 1 second. Since the resourceutilizations of allmachines are quite similar, we only visualizethe CPU utilization and memory usage of one ordinaryworker machine for 5 minutes in Fig. 9 for a clear illustration(The master machine will have slightly higher resource uti-lizations). During the whole course of execution, the averageCPU utilization is about 73 percent while the maximum valuecan even approach 100 percent. Meanwhile, the memoryusage is stable around 5 GB in Fig. 9b and the maximummemory usage could be about 8 GB ( 34 percent of all avail-able memory) at the last. These measurements demonstratethat the ANN modeling based traffic estimation is computa-tion extensive and the Spark heavily consumes CPU andmemory resources due to the storage of RDDs for quick
Fig. 8. (a) Road coverage by taxis across the time of a day. (b) Composi-tion of uncovered road segments.
Fig. 9. The CPU utilization and memory usage of one worker machine.
LIU ETAL.: THINK LIKE AGRAPH: REAL-TIME TRAFFIC ESTIMATION ATCITY-SCALE 2453
computation. These results also imply that GPTE can wellexploit the cluster resources and the power of Spark.
6.2 Performance ComparisonWe compare GPTE with three baselines on the estimationaccuracy and execution time. Although we cannot identify aproper way for direct comparison with Google Traffic due tothe limit in accessing its original estimation results, we try toperform best effort analysis based on the available GoogleTraffic data and present at the end of this subsection.
kNNTE. This method enhances LTA solution [9] toachieve complete traffic estimations via kNN based interpo-lation, whichmeasures traffic condition vi of road segment riusing average travel speed of all probe taxis passing by oraverage traffic speed of the top 10 nearest neighboring roadsegments (whose current traffic conditions are available) ofthe same road type as ri [6], [35] when no probes travel on ri.
MLRTE. Some works explicitly capture the traffic correla-tions using MLR models. The models are learned from his-torical data, and later used for the online traffic estimation[5], [23], [31]. We implement the state-of-the-art MLR basedmethod in [23] for performance comparison.
SVDTE. There exist someworks implicitly exploiting traf-fic correlations in a traffic matrix to recover the missing traf-fic conditions [33], [37], [52]. Specifically, they first constructa traffic matrix consisting of traffic conditions ofm road seg-ments in t time slots and then exploit singular value decom-position (SVD) technique to recover missing values in them� t matrix. We implement a typical SVD based method in[52] for comparison, which sets t ¼ 32 for the best results.
We implement kNNTE in the Spark and run it in the clus-ter. As there are no cluster computing version of MLRTE andSVDTE, we implement and run them using multi-threadingin a powerful HP Z440 Workstation that has 12 3.5 GHz IntelXeon CPU cores and 32 GB memory. We try our best to opti-mize these methods to derive their best performances. Forcomparison, we explore how thesemethods performwith dif-ferent amount of traffic data (i.e., varied taxi usage ratio r as40, 60, and 80 percent) and report estimation accuracies onsubset S and on those road segments with � 5 taxi speedannotations in Fig. 10. All methods have lower accuracy onsubset S. This is because there is no taxi input from thoseroads contained in S, and thus the traffic estimation of S ismerely inferred from traffic samplings on other road seg-ments. The accuracy on S reflects the traffic estimation perfor-mance on those 60%-80% uncovered roads in each time
slot. We can see our method outperforms the three baselineson subset S, and achieves high accuracy above 80 percentwhile the others only have accuracy around 60 percent whenr � 60%. Even when r ¼ 40%with much fewer taxis for traf-fic monitoring, our method still achieves reasonably highaccuracy about 78 percent while other methods only haveaccuracy� 62%. It implies that GPTE can still work well evenin a scenario like terrible weather conditions with a reducednumber of available taxis. As a matter of fact, we do observesome time slots with much fewer taxis than usual in the data-set. On those road segments with � 5 taxi speed annotations,the accuracies of all methods increase, e.g., 73, 64, 74, and 90percent for kNNTE,MLRTE, SVDTE, andGPTE, respectively,when r ¼ 80%. Relying on simple interpolation without con-sidering traffic correlations among roads, kNNTE (i.e., theenhanced LTA solution) cannot get accurate estimations.Although MLRTE and SVDTE performs well and considerthe traffic correlations, the linear modeling cannot promisegood performances neither, with both accuracies lower than75 percent. Benefited from non-linear traffic correlationmodeling, GPTE outperforms the baselines on accuracy by 12 34 percent as indicated by Fig. 10.
We compare the execution times in Table 1. kNNTE runsthe fastest due to its simplicity, while MLRTE and GPTE canaccomplish traffic estimationwithin 1minute.Withmore traf-fic data, the execution time of MLRTE and SVDTE increaseswhile the other two run faster. This is because more trafficdata lead to more initially annotated vertices, and the compu-tation tasks for inferring unknown vertex states are thusreduced for kNNTE and GPTE. Even conducting ANNmodeling with more taxi data when r ¼ 80%, GPTE still runsmuch faster than MLRTE and SVDTE, improving up to 46percent. SVDTE accumulates sufficient traffic data for t ¼ 32time slots to perform SVD based missing traffic conditionrecovery. As a result, it introduces great estimation delay (i.e.,15� 32 ¼ 480 minutes) and cannot provide timely trafficinformation. The other methods can immediately estimatetraffic conditionswith instant traffic data.
Google Traffic provides the live traffic visualization, but itonly gives 4 coarse traffic levels (from Fast to Slow) instead ofproviding detailed road traffic estimation to the end users.Besides, there is no interface5 for public access of GoogleTraffic’s historical or live traffic estimation data. As a result, itis impossible for us to directly compare it with GPTE on thetraffic estimation accuracy. We try to manually measure thecoverage of Google Traffic based on a selected region of size7km� 5km in the downtown area of Singapore (which covers713 road segments). We count the number of road segmentswith live traffic data fromGoogle Traffic for four 15mins timeslots (during 17:30 PM - 18:30 PM) a day for oneweek, and cal-culate the coverage ratio. According to our statistics, while all
Fig. 10. Accuracy on (a) subset S and (b) those road segments with � 5taxi speed annotations, with varied r.
TABLE 1Performance Comparison on Execution Time(in Seconds) with Different Taxi Usage Ratio r
5. Although Google Maps Directions APIs enable the users to querythe travel routes and travel durations, these APIs do not provide thedetailed traffic estimation of any specific road segment.
2454 IEEE TRANSACTIONS ON MOBILE COMPUTING, VOL. 18, NO. 10, OCTOBER 2019
the 145 expressway and major road segments are covered,other roads have poor coverage, with an average coverageratio about 37.8 percent. The overall estimation coverage ofthis busy downtown district is only 50.4 percent.
6.3 Detailed EvaluationWe present the traffic visualization and then evaluate GPTEand its design components. We fix the taxi usage ratio r as70 percent and report the estimation accuracy on all roadsegments with � 5 taxi speed annotations in this subsection.
Traffic Visualization. We visualize our traffic estimationresults to LTA through a web service. For better understand-ing the general traffic conditions, we translate specific trafficspeed v (in km/h) into one traffic congestion level accordingto LTA’s rules, i.e., Congestion (v < 40 for expressways, andv < 20 for others), Slow (40 � v < 60 for expressways, and20 � v < 40 for others), and Normal (v � 60 for express-ways, and v � 40 for others). Fig. 11a depicts the traffic esti-mation snapshot at peak hour 8:00 AM of a typical workday.Even with a small number of probe taxis ( 2500 in eachtime slot), our method can still derive the traffic conditionsof the whole road network. Fig. 11b shows the traffic condi-tions for all roads in the downtown area, most of which arein poor traffic conditions due to commuter traffic.
Overall Performance.According to our statistics, the numberof all taxis (probe taxis) ranges from 1388 to 4942 (972 to 3460)in each time slot throughout the testing week. On average,17716 road segments ( 30:4 percent of all) are traveled bytaxis in a time slot. Fig. 12a presents the average estimationaccuracy across the time of a day. GPTE achieves relativelyhigher andmore stable accuracy onweekends thanworkdays.This is possibly because the traffic on weekends is more
regular than on workdays and thus the traffic correlations arebetter modeled. The average accuracies for workdays andweekends are 87 and 88 percent, respectively. We observeobvious accuracy decrease in the time range [6:30 AM -9:00 AM] and [17:30 PM - 19:00 PM] on workdays, which arethe commuter rush hours in Singapore. Surprisingly, GPTEstill achieves high accuracy above 83 percent in these rushhours that always contain heavy and complex traffic.
Weplot the statistics of execution time of traffic estimationsin Fig. 12b. The 90-percentile and 50-percentile execution timeare 37 seconds and 33 seconds for workdays, and 38 secondsand 35 seconds for weekends, respectively. GPTE runs a bitlonger on weekends as there are less taxi data and thus morestate inference tasks. The overall average is 34 seconds, whichmeans that GPTE can return traffic estimation results with asmall delay. It is worthy to note that training an ANN modelin the HP Z440 Workstation takes about 1.48 seconds, and itwill need much more time to build ANN models for all roadsegments due to the large computation overhead, e.g., tens ofminutes even we adopt the multi-threading technique, whichis much larger than the time budget of 15 mins. Therefore,Fig. 12b demonstrates that GPTE can significantly improvethe computation efficiencywith high parallelism.
Accuracy Across Different Road Types. We report the accu-racy performance of GPTE on different road types in Fig. 13.GPTE gets the best estimations for expressways with accu-racy higher than 92 percent, and good estimation for majorand slip roads (which bridge expressways and major roads)with accuracy 85 percent. The results for collector, localand NCAT roads are with slightly low accuracy ( 80 per-cent) and large variances. The performance gap among dif-ferent road types is caused by following reasons. On onehand, high-level roads, e.g., expressways, are usually
Fig. 12. Overall performance on (a) estimation accuracy across the timeof a day and (b) execution time.
Fig. 11. Traffic estimation at peak hour 8:00AM of a typical workday: (a) The whole road network. (b) Downtown area where green, yellow, and redrepresent the traffic speed in Normal, Slow, and Congestion, respectively.
Fig. 13. Estimation accuracies and variances for different road types.
LIU ETAL.: THINK LIKE AGRAPH: REAL-TIME TRAFFIC ESTIMATION ATCITY-SCALE 2455
traveled by more vehicles and we can have sufficient trafficdata to accurately capture their traffic correlations while weonly have limited data on the low-level roads, e.g., local andcollector roads are largely uncovered by taxis as shown inFig. 8b. On the other hand, high-level roads tend to havefewer external influencing factors while vehicles are gov-erned by many factors on the low-level roads, e.g., trafficlights exist on low-level roads but not on expressways.
Accuracy Across Different Iterations. GPTE makes use ofmessage propagations for iterative vertex state inferencesand we thus report the completed inference ratio (calculated
as # of verticeswith already knownstates# of all vertices ) and accuracy for each itera-
tion. From Fig. 14, we see that the states of > 90% unanno-tated vertices can be inferred within 2 iterations and we canderive almost all (99.9 percent) vertex states within 10 iter-ations. In the dynamic ANN modeling, estimation errorsmay be accumulated along with the message propagations.Fig. 14 shows that the traffic estimation indeed becomes lessaccurate and reliable (with a larger variance) as the iterationincreases. However, benefited from the good generalizationof the ANN model, the performance loss is limited, e.g., theaverage accuracy decreases by around 4 percent merely. Inthe future, we will study how to introduce a discountingfactor for the inferred states that are further used for ANNpredictions to reduce the influence of estimation error accu-mulation along with the message propagations.
Next we will show how the proposed optimization techni-ques helpGPTE achieve timely and accurate traffic estimation.
Benefit of Geography-Aware Graph Partitioning. To under-stand the impact of data placement on system efficiency,we compare our geography-aware graph partitioner usingspace-filling curve technique with the Quad-tree based graphpartitioner and three default graph partitioning schemes ofGraphX, i.e., RandomVertexCut (Random), EdgePartition1D(EP1D), and EdgePartition2D (EP2D). The Quad-tree basedmethod recursively subdivides a graph into four quadrantsuntil the number of vertices in each quadrant is smaller than athreshold. Thismethod preserves spatial proximity of verticesas well but it unevenly distributes vertices among partitions.The default graph partitioner assigns edges/vertices to differ-ent partitions by hashing source (or destination) vertex ID,resulting in random placements of edges/vertices amongmachines. In contrast, our scheme exploits vertex locations toplace nearby edges/vertices to the samemachine.
In order to compare the communication efficiency ofdifferent schemes, we count the number of cross-partition
messages (communication overhead). During each trafficestimation, about 153:3 k messages in total are generated forinformation propagation among vertices, while there are onaverage 11:8 k, 31:3 k, 145:1 k, 144:9 k, 145:2 k cross-partitionmessages for the five schemes respectively, as shown inTable 2. From the statistic, we see that space-filling methodsignificantly outperforms other methods, with reduction oncross-partition messages by 4:4� than Quad-tree and 11:4�than the three default schemes of GraphX.
In addition to the comparisons on cross-partition mes-sages, we use execution time as another metric to comparethese five schemes since cross-partition messages couldbe costly and will explicitly affect the execution time.The comparison results are depicted in Fig. 15a. Comparedto default schemes of GraphX, the benefit of exploitingvertex locations is clear that the proposed scheme reducesthe execution time up to 6 seconds. When vertices that aregeographically close to each other are assigned to the samepartition, the data exchanges among different partitionsare reduced. Although Quad-tree based scheme has alsoexploited geographical information of vertices, it cannotevenly assign vertices to partitions that lead to unbalancedloads among machines. Relying on the Hilbert space-fillingcurve technique, our scheme indexes vertices with consecu-tive keys and can evenly partition vertices among machines,which is more flexible and efficient. Besides, our schememakes graph processing more stable when compared withother schemes on the variance of execution times.
Benefit of Efficient Information Propagation. Rather thanpropagating messages among vertices in a hop-by-hopmanner, we propose the multi-hop message broadcast toaccelerate information propagation. Indeed we can firstlearn h-hop neighbors for each vertex and then buildanother graph where vertices are still the road segmentsand edges are formed between each vertex and its h-hopneighbors. In this graph, each vertex can directly send mes-sages to its original h-hop neighbors through the triplets
in GraphX. We implement this idea using Pregel [25] APIof GraphX. We compare the three message propagation
Fig. 14. The completed ratio and accuracy of traffic estimation in differ-ent iterations.
TABLE 2The Cross-Partition Messages for
Different Graph Partitioning Schemes
Scheme Space-filling Quad-tree Random EP1D EP2D
Average (�103) 11.8 31.3 145.1 144.9 145.2
Fig. 15. Evaluation of (a) graph partitioning and (b) message broadcast.
2456 IEEE TRANSACTIONS ON MOBILE COMPUTING, VOL. 18, NO. 10, OCTOBER 2019
methods and plot the results in Fig. 15b. The average execu-tion times of multi-hop message broadcast, hop-by-hopmethod, and Pregel based method are 34 seconds, 110 sec-onds, and 130 seconds, respectively. Our method signifi-cantly outperforms the hop-by-hop method and Pregelbased method with gains of 3:2� and 3:8�, respectively.The multi-hop message broadcast avoids repetitive join-operations between vertex RDDs and edge RDDs whencompared to the hop-by-hop method, and meanwhile keepsthe original road network structure rather than generating aparticular graph as Pregel based method dose.
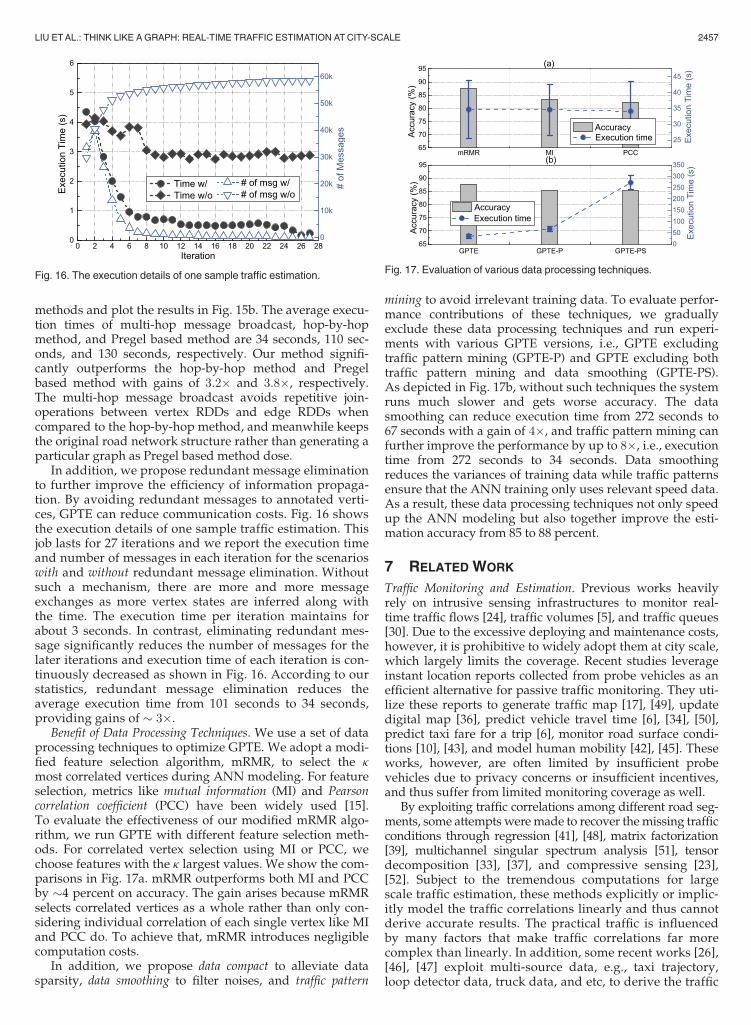
In addition, we propose redundant message eliminationto further improve the efficiency of information propaga-tion. By avoiding redundant messages to annotated verti-ces, GPTE can reduce communication costs. Fig. 16 showsthe execution details of one sample traffic estimation. Thisjob lasts for 27 iterations and we report the execution timeand number of messages in each iteration for the scenarioswith and without redundant message elimination. Withoutsuch a mechanism, there are more and more messageexchanges as more vertex states are inferred along withthe time. The execution time per iteration maintains forabout 3 seconds. In contrast, eliminating redundant mes-sage significantly reduces the number of messages for thelater iterations and execution time of each iteration is con-tinuously decreased as shown in Fig. 16. According to ourstatistics, redundant message elimination reduces theaverage execution time from 101 seconds to 34 seconds,providing gains of 3�.
Benefit of Data Processing Techniques. We use a set of dataprocessing techniques to optimize GPTE. We adopt a modi-fied feature selection algorithm, mRMR, to select the kmost correlated vertices during ANN modeling. For featureselection, metrics like mutual information (MI) and Pearsoncorrelation coefficient (PCC) have been widely used [15].To evaluate the effectiveness of our modified mRMR algo-rithm, we run GPTE with different feature selection meth-ods. For correlated vertex selection using MI or PCC, wechoose features with the k largest values. We show the com-parisons in Fig. 17a. mRMR outperforms both MI and PCCby 4 percent on accuracy. The gain arises because mRMRselects correlated vertices as a whole rather than only con-sidering individual correlation of each single vertex like MIand PCC do. To achieve that, mRMR introduces negligiblecomputation costs.
In addition, we propose data compact to alleviate datasparsity, data smoothing to filter noises, and traffic pattern
mining to avoid irrelevant training data. To evaluate perfor-mance contributions of these techniques, we graduallyexclude these data processing techniques and run experi-ments with various GPTE versions, i.e., GPTE excludingtraffic pattern mining (GPTE-P) and GPTE excluding bothtraffic pattern mining and data smoothing (GPTE-PS).As depicted in Fig. 17b, without such techniques the systemruns much slower and gets worse accuracy. The datasmoothing can reduce execution time from 272 seconds to67 seconds with a gain of 4�, and traffic pattern mining canfurther improve the performance by up to 8�, i.e., executiontime from 272 seconds to 34 seconds. Data smoothingreduces the variances of training data while traffic patternsensure that the ANN training only uses relevant speed data.As a result, these data processing techniques not only speedup the ANN modeling but also together improve the esti-mation accuracy from 85 to 88 percent.
7 RELATED WORK
Traffic Monitoring and Estimation. Previous works heavilyrely on intrusive sensing infrastructures to monitor real-time traffic flows [24], traffic volumes [5], and traffic queues[30]. Due to the excessive deploying and maintenance costs,however, it is prohibitive to widely adopt them at city scale,which largely limits the coverage. Recent studies leverageinstant location reports collected from probe vehicles as anefficient alternative for passive traffic monitoring. They uti-lize these reports to generate traffic map [17], [49], updatedigital map [36], predict vehicle travel time [6], [34], [50],predict taxi fare for a trip [6], monitor road surface condi-tions [10], [43], and model human mobility [42], [45]. Theseworks, however, are often limited by insufficient probevehicles due to privacy concerns or insufficient incentives,and thus suffer from limited monitoring coverage as well.
By exploiting traffic correlations among different road seg-ments, some attempts weremade to recover themissing trafficconditions through regression [41], [48], matrix factorization[39], multichannel singular spectrum analysis [51], tensordecomposition [33], [37], and compressive sensing [23],[52]. Subject to the tremendous computations for largescale traffic estimation, these methods explicitly or implic-itly model the traffic correlations linearly and thus cannotderive accurate results. The practical traffic is influencedby many factors that make traffic correlations far morecomplex than linearly. In addition, some recent works [26],[46], [47] exploit multi-source data, e.g., taxi trajectory,loop detector data, truck data, and etc, to derive the traffic
Fig. 16. The execution details of one sample traffic estimation.Fig. 17. Evaluation of various data processing techniques.
LIU ETAL.: THINK LIKE AGRAPH: REAL-TIME TRAFFIC ESTIMATION ATCITY-SCALE 2457
conditions. Specifically, they build one model for each indi-vidual data source and integrate these models for multi-source data to obtain the final traffic estimation results,where each traffic model essentially assumes the traffic cor-relation to be linear. In this paper, we propose a non-linearmodel to accurately capture practical traffic correlationsfrom taxi data and enable advanced traffic estimation atcity-scale based on the graph-parallel processing design.
There exist a few works that adopt advanced models fortraffic estimation and prediction [35]. They primarily relyon modeling the temporal correlation of traffic for each indi-vidual road segment using support vector machine [4], arti-ficial neural network [24], and hidden Markov model [40].These works, however, are mainly designed for specificroads, e.g., expressways, and implicitly assume sufficientamount of data can be collected. Although the emergingdeep learning technique can be used for traffic estimation[24], it introduces a large number of extra parameters to beestimated and thus requires much more training data,which will greatly increase the computation complexity.The enormous computations involved in non-linear modelsstrictly limit their applicability to large road networks. Ourwork differs from these works by considering the data spar-sity issue and improving computing parallelism for cityscale traffic estimation.
Graph Analysis and Processing. Various analysis can beconducted on the road network graphs, e.g, travel route plan-ing [12] and spatial query [7]. These works involve only smalldataset with negligible computation burdens. In contrast,non-linear correlation modeling based large scale traffic esti-mation requires muchmore computation efforts. The popularcluster computing framework Spark [44] serves as a powerfulengine to handle continuously increasing graph scale anddataset, which could be adopted for satisfying applicationrequirements on timeliness and efficiency [18]. Meanwhile,emerging graph-parallel processing frameworks, e.g., Pregel[25], GraphLab [13], and GraphX [14], show their capabilitiesin settling large scale graph analysis problems, e.g., cellularnetwork analysis [19]. To the best of our knowledge, this isthe first work that adapts traffic data analytics to the graph-parallel processing context. Our work implements and opti-mizes the advanced traffic estimation for city scale road net-works in the latest cluster computing framework.
8 CONCLUSION
This paper presents GPTE for accurate and timely traffic esti-mation at city scale. GPTE proposes non-linear traffic correla-tion modeling and adapts the advanced traffic estimation tothe graph-parallel processing paradigm through dynamicANN modeling and efficient information propagation.A number of optimization techniques are proposed toimprove the design. Experiment results from real-world traf-fic data demonstrate that GPTE significantly outperformsbaseline solutions and can derive traffic estimation for theentire city in 34 secondswith accuracy as high as 88 percent.
As the future work, we could analyze mobility patternsof taxis and augment taxi probe based traffic sensing withcrowdsourcing. Specifically, we could well design theroutes for empty taxis that will migrate some taxis frompopular road segments to those less popular ones, so as toimprove the overall data coverage of the whole road net-work. With more initial vertex states, we can improve thetraffic estimation accuracy further.
ACKNOWLEDGMENTS
This work is supported by a China NSFC grant(No. 61802261), a NSF grant from Shenzhen University(No.2018061), an ECS grant from the Research Grants Coun-cil of Hong Kong (No. CityU 21203516), and a GRF grantfrom Research Grants Council of Hong Kong (No. CityU11217817), Singapore MOE Tier 2 grant MOE2016-T2-2-023,and NTU CoE grant M4081879.
REFERENCES
[1] LTA of Singapore. [Online]. Available: https://www.lta.gov.sg/,Accessed on: Aug. 2018.
[2] TrafficScan portal. [Online] https://www.onemotoring.com.sg/content/onemotoring/en/imap.html, Accessed on: Aug. 2018.
[3] Apache Spark. [Online]. Available: http://spark.apache.org/,Accessed on: Aug. 2018.
[4] M. T. Asif, J. Dauwels, C. Y. Goh, A. Oran, E. Fathi, M. Xu,M. M. Dhanya, N. Mitrovic, and P. Jaillet, “Spatiotemporal pat-terns in large-scale traffic speed prediction,” IEEE Trans. Intell.Transp. Syst., vol. 15, no. 2, pp. 794–804, Apr. 2014.
[5] J. Aslam, S. Lim, X. Pan, and D. Rus, “City-scale traffic estimationfrom a roving sensor network,” in Proc. 10th ACM Conf. EmbeddedNetw. Sensor Syst., 2012, pp. 141–154.
[6] R. K. Balan, K. X. Nguyen, and L. Jiang, “Real-time trip informa-tion service for a large taxi fleet,” in Proc. 9th Int. Conf. Mobile Syst.Appl. Serv., 2011, pp. 99–112.
[7] Z. Bolong, Z. Kai, X. Xiaokui, S. Han, Y. Hongzhi, and X. Zhou,“Keyword-aware continuous kNN query on road networks,” inProc. IEEE 32nd Int. Conf. Data Eng., 2016, pp. 871–882.
[8] R. Chen, J. Shi, Y. Chen, and H. Chen, “Powerlyra: Differentiatedgraph computation and partitioning on skewed graphs,” in Proc.10th Eur. Conf. Comput. Syst., 2015, Art. no. 1.
[9] K. K. CHIN and C. W. LEE, “TrafficScan - bringing real-time travelinformation to motorists,” The LTA Academy (LTAA)., vol. 1, no. 5,pp. 7–14, 2009.
[10] J. Eriksson, L. Girod, B. Hull, R. Newton, S. Madden, andH. Balakrishnan, “The pothole patrol: Using a mobile sensor net-work for road surface monitoring,” in Proc. 6th Int. Conf. MobileSyst. Appl. Serv., 2008, pp. 29–39.
[11] P. A. Est�evez, M. Tesmer, C. A. Perez, and J. M. Zurada,“Normalized mutual information feature selection,” IEEE Trans.Neural Netw., vol. 20, no. 2, pp. 189–201, Feb. 2009.
[12] H. Gonzalez, J. Han, X. Li, M. Myslinska, and J. P. Sondag,“Adaptive fastest path computation on a road network: A trafficmining approach,” in Proc. 33rd Int. Conf. Very Large Data Bases,2007, pp. 794–805.
[13] J. E. Gonzalez, Y. Low, H. Gu, D. Bickson, and C. Guestrin,“PowerGraph: Distributed graph-parallel computation on naturalgraphs,” in Proc. 10th USENIX Conf. Operating Syst. Des. Implemen-tation, 2012, pp. 17–30.
[14] J. E. Gonzalez, R. S. Xin, A. Dave, D. Crankshaw, M. J. Franklin,and I. Stoica, “GraphX: Graph processing in a distributed data-flow framework,” in Proc. 11th USENIX Conf. Operating Syst. Des.Implementation, 2014, pp. 599–613.
[15] I. Guyon and A. Elisseeff, “An introduction to variable andfeature selection,” J. Mach. Learn Res., vol. 3, no. Mar, pp. 1157–1182, 2003.
[16] R. Herring, A. Hofleitner, P. Abbeel, and A. Bayen, “Estimatingarterial traffic conditions using sparse probe data,” in Proc. 13thInt. IEEE Conf. Intell. Transp. Syst., 2010, pp. 929–936.
[17] B. Hoh, M. Gruteser, R. Herring, J. Ban, D. Work, J.-C. Herrera,A. M. Bayen, M. Annavaram, and Q. Jacobson, “Virtual trip linesfor distributed privacy-preserving traffic monitoring,” in Proc. 6thInt. Conf. Mobile Syst. Appl. Serv., 2008, pp. 15–28.
[18] T. Hunter, T. Moldovan, M. Zaharia, S. Merzgui, J. Ma, M. J.Franklin, P. Abbeel, and A. M. Bayen, “Scaling the mobile millen-nium system in the cloud,” in Proc. 2nd ACM Symp. Cloud Com-put., 2011, Art. no. 28.
[19] A. Iyer, L. E. Li, and I. Stoica, “CellIQ: Real-time cellular networkanalytics at scale,” in Proc. USENIX NSDI, 2015, pp. 309–322.
[20] METIS - Serial Graph Partitioning and Fill-reducing MatrixOrdering. [Online]. Available: http://glaros.dtc.umn.edu/gkhome/metis/metis/overview, Accessed on: Aug. 2018.
2458 IEEE TRANSACTIONS ON MOBILE COMPUTING, VOL. 18, NO. 10, OCTOBER 2019
[21] E. Keogh, S. Chu, D. Hart, and M. Pazzani, “An online algorithmfor segmenting time series,” in Proc. IEEE Int. Conf. Data Mining,2001, pp. 289–296.
[22] M. H. Kutner, C. Nachtsheim, and J. Neter, Applied Linear Regres-sion Models. New York, NY, USA: McGraw-Hill/Irwin, 2004.
[23] Z. Liu, Z. Li, M. Li, W. Xing, and D. Lu, “Mining road networkcorrelation for traffic estimation via compressive sensing,”IEEE Trans. Intell. Transp. Syst., vol. 17, no. 7, pp. 1880–1893,Jul. 2016.
[24] Y. Lv, Y. Duan, W. Kang, Z. Li, and F.-Y. Wang, “Traffic flow pre-diction with big data: A deep learning approach,” IEEE Trans.Intell. Transp. Syst., vol. 16, no. 2, pp. 865–873, Apr. 2015.
[25] G. Malewicz, M. H. Austern, A. J. Bik, J. C. Dehnert, I. Horn,N. Leiser, and G. Czajkowski, “Pregel: A system for large-scalegraph processing,” in Proc. ACM SIGMOD Int. Conf. Manage. Data,2010, pp. 135–146.
[26] C. Meng, X. Yi, L. Su, J. Gao, and Y. Zheng, “City-wide trafficvolume inference with loop detector data and taxi trajectories,” inProc. ACM SIGSPATIAL, 2017, pp. 1–10.
[27] P. Newson and J. Krumm, “Hidden Markov map matchingthrough noise and sparseness,” in Proc. 17th ACM SIGSPATIALInt. Conf. Adv. Geographic Inf. Syst., 2009, pp. 336–343.
[28] H. Peng, F. Long, and C. Ding, “Feature selection based on mutualinformation criteria of max-dependency, max-relevance, and min-redundancy,” IEEE Trans. Pattern Anal. Mach. Intell., vol. 27, no. 8,pp. 1226–1238, Aug. 2005.
[29] H. Sagan, “Hilbert’s space-filling curve,” in Space-Filling Curves.New York, NY, USA: Springer, 1994, pp. 9–30.
[30] R. Sen, A. Maurya, B. Raman, R. Mehta, R. Kalyanaraman,N. Vankadhara, S. Roy, and P. Sharma, “Kyun queue: A sensornetwork system to monitor road traffic queues,” in Proc. 10thACM Conf. Embedded Netw. Sensor Syst., 2012, pp. 127–140.
[31] Z. Shan, D. Zhao, and Y. Xia, “Urban road traffic speed estimationfor missing probe vehicle data based on multiple linear regressionmodel,” in Proc. 16th Int. IEEE Conf. Intell. Transp. Syst., 2013,pp. 118–123.
[32] R. H. Shumway and D. S. Stoffer, “An approach to time seriessmoothing and forecasting using the EM algorithm,” in J. TimeSeries Anal., vol. 3, no. 4, pp. 253–264, 1982.
[33] H. Tan, G. Feng, J. Feng, W. Wang, Y.-J. Zhang, and F. Li,“A tensor-based method for missing traffic data completion,”Transp. Res. Part C: Emerging Technol., vol. 28, pp. 15–27, 2013.
[34] A. Thiagarajan, L. Ravindranath, K. LaCurts, S. Madden,H. Balakrishnan, S. Toledo, and J. Eriksson, “VTrack: Accurate,energy-aware road traffic delay estimation using mobile phones,”in Proc. 7th ACMConf. Embedded Netw. Sensor Syst., 2009, pp. 85–98.
[35] E. I. Vlahogianni, M. G. Karlaftis, and J. C. Golias, “Short-termtraffic forecasting: Where we are and where we’re going,” Transp.Res. Part C: Emerging Technol., vol. 43, pp. 3–19, 2014.
[36] Y. Wang, X. Liu, H. Wei, G. Forman, C. Chen, and Y. Zhu,“Crowdatlas: Self-updating maps for cloud and personal use,”in Proc. 11th Annu. Int. Conf. Mobile Syst. Appl. Serv., 2013, pp. 469–470.
[37] Y. Wang, Y. Zheng, and Y. Xue, “Travel time estimation of a pathusing sparse trajectories,” in Proc. 20th ACM SIGKDD Int. Conf.Knowl. Discovery Data Mining, 2014, pp. 25–34.
[38] Y. Wang, Y. Zhu, Z. He, Y. Yue, and Q. Li, “Challenges and oppor-tunities in exploiting large-scale GPS probe data,” HP Laborato-ries, Palo Alto, CA, USA, HP Tech. Rep. HPL-2011–109, 2011.
[39] X. Xin, C. Lu, Y. Wang, and H. Huang, “Forecasting collector roadspeeds under high percentage of missing data,” in Proc. 29thAAAI Conf. Artif. Intell., 2015, pp. 1917–1923.
[40] B. Yang, C. Guo, and C. S. Jensen, “Travel cost inference fromsparse, spatio-temporally correlated time series using Markovmodels,” Proc. VLDB Endowment, vol. 6, pp. 769–780, 2013.
[41] B. Yang, M. Kaul, and C. S. Jensen, “Using incomplete informationfor complete weight annotation of road networks,” IEEE Trans.Knowl. Data Eng., vol. 26, no. 5, pp. 1267–1279, May 2014.
[42] Z. Yang, J. Hu, Y. Shu, P. Cheng, J. Chen, and T. Moscibroda,“Mobility modeling and prediction in bike-sharing systems,” inACM Int. Conf. Mobile Syst. Appl. Serv., 2016.
[43] J. Yoon, B. Noble, and M. Liu, “Surface street traffic estimation,”in Proc. 5th Int. Conf. Mobile Syst. Appl. Serv., 2007, pp. 220–232.
[44] M. Zaharia, M. Chowdhury, T. Das, A. Dave, J. Ma, M. McCauley,M. J. Franklin, S. Shenker, and I. Stoica, “Resilient distributeddatasets: A fault-tolerant abstraction for in-memory clustercomputing,” in Proc. 9th USENIX Conf. Netw. Syst. Des. Implemen-tation, 2012, pp. 2–2.
[45] D. Zhang, J. Huang, Y. Li, F. Zhang, C. Xu, and T. He, “Exploringhuman mobility with multi-source data at extremely large metro-politan scales,” in Proc. 20th Annu. Int. Conf. Mobile Comput. Netw.,2014, pp. 201–212.
[46] D. Zhang, F. Zhang, and T. He, “MultiCalib: National-scale trafficmodel calibration in real time with multi-source incomplete data,”in Proc. 24th ACM SIGSPATIAL Int. Conf. Adv. Geographic Inf. Syst.,2016, Art. no. 19.
[47] D. Zhang, J. Zhao, F. Zhang, and T. He, “UrbanCPS: A cyber-physical system based on multi-source big infrastructure data forheterogeneous model integration,” in Proc. ACM/IEEE 6th Int.Conf. Cyber-Phys. Syst., 2015, pp. 238–247.
[48] J. Zheng and L. M. Ni, “Time-dependent trajectory regression onroad networks via multi-task learning,” in Proc. 27th AAAI Conf.Artif. Intell., 2013, pp. 1048–1055.
[49] P. Zhou, S. Jiang, and M. Li, “Urban traffic monitoring with thehelp of bus riders,” in Proc. IEEE 35th Int. Conf. Distrib. Comput.Syst., 2015, pp. 21–30.
[50] P. Zhou, Y. Zheng, and M. Li, “How long to wait?: Predicting busarrival time with mobile phone based participatory sensing,”Proc. ACMMobiSys, 2012, pp. 379–392.
[51] H. Zhu, Y. Zhu, M. Li, and L. M. Ni, “SEER: Metropolitan-scaletraffic perception based on lossy sensory data,” in Proc. IEEEINFOCOM, 2009, pp. 217–225.
[52] Y. Zhu, Z. Li, H. Zhu,M. Li, andQ. Zhang, “A compressive sensingapproach to urban traffic estimation with probe vehicles,” IEEETrans. Mobile Comput., vol. 12, no. 11, pp. 2289–2302, Nov. 2013.
Zhidan Liu received the BE degree in computerscience and technology from NortheasternUniversity, China, in 2009, and the PhD degree incomputer science and technology from ZhejiangUniversity, China, in 2014. He is currently anassistant professor with Shenzhen University,China. His research interests include distributedsensing and mobile computing, big data analytics,and urban computing. He is amember of the IEEE.
Pengfei Zhou received the BE degree fromthe Automation Department, Tsinghua University,Beijing, China, in 2009, and the PhD degree fromthe School of Computer Science and Engineering,Nanyang Technological University, Singapore,in 2015. His research interests include mobilecomputing and systems, localization, and cellularnetwork communications.
Zhenjiang Li received the BE degree in computerscience and technology from Xian JiaotongUniversity, Xian, China, in 2007, the MPhil degreein electronic and computer engineering, and thePhD degree in computer science and engineeringfrom The Hong Kong University of Scienceand Technology, Hong Kong, in 2009 and 2012,respectively. He is currently an assistant professorof the Computer Science Department, City Univer-sity of Hong Kong. His research interests includewearable and mobile sensing, deep learning and
datamining, distributed, and edge computing. He is amember of the IEEE.
Mo Li received the BS degree in computer sci-ence and technology from Tsinghua University,China, in 2004 and the PhD degree in computerscience and engineering from The Hong KongUniversity of Science and Technology, HongKong, in 2009. He is currently an associate pro-fessor with Nanyang Technological University,Singapore. His research interests include net-worked and distributed sensing, wireless andmobile, cyber-physical systems, smart city, andurban computing. He is a member of the IEEE.
" For more information on this or any other computing topic,please visit our Digital Library at www.computer.org/publications/dlib.
LIU ETAL.: THINK LIKE AGRAPH: REAL-TIME TRAFFIC ESTIMATION ATCITY-SCALE 2459