31
This is DEEPerent: Tracking App behaviors with (Nothing changed) phone for Evasive android malware

This is DEEPerent:Tracking App behaviors with(Nothing changed) phone forEvasive android malware

What I will talk about..
• Challenges we faced on android malware analysis:
– Fast code analysis (Reversing) <- always challenge
– Obfuscation
– Various dynamic code loading techniques (file/memory)
– Anti-analysis techniques(advanced android malware, protectors)
– Native behavior, obfuscation, packing
– Maintenance
– Environment detection (Emulator/Rooting detection)

• A tool for tracking execution flow of android malware
– Supports tracking the android application with your nothing changed phone
– The tool has following features to track behaviors of evasive android malwares:
• No platform modification
• Regardless of root privilege
• Selective behavior tracking
• Support tracking extension(plug-in)
• Native layer monitoring (libc, JNI, Binder)
What I will talk about..

• Flow-centric code analysis
– DEX exports a lot of code informations such as method arguments, debug symbols, register information, etc.
– DVM supports JDWP(Java Debug Wired Protocol)
– JDWP is excellent tracer for monitoring app’s behaviors • Method execution flow
• Symbol information
• Object tracking
• Call stack
• Etc..
– ART(Android Runtime) supports JDWP
What I will talk about..

• Tracking behaviors of evasive android malware
– User-defined method and Third-party libraries monitoring(Crypto, Network, etc)
– Obfuscated code monitoring(String, Reflection, AssetEncryption, etc)
– Dynamic loaded code detecting and tracing
– Breaking anti-analysis techniques(anti-jdwp, anti-gdb, anti-emulator, device detection, etc)
Fast code analysis

• Tracking behaviors of evasive android malware
– This code steals phone number, mac address, ip address, IMEI and IMSI
Fast code analysis

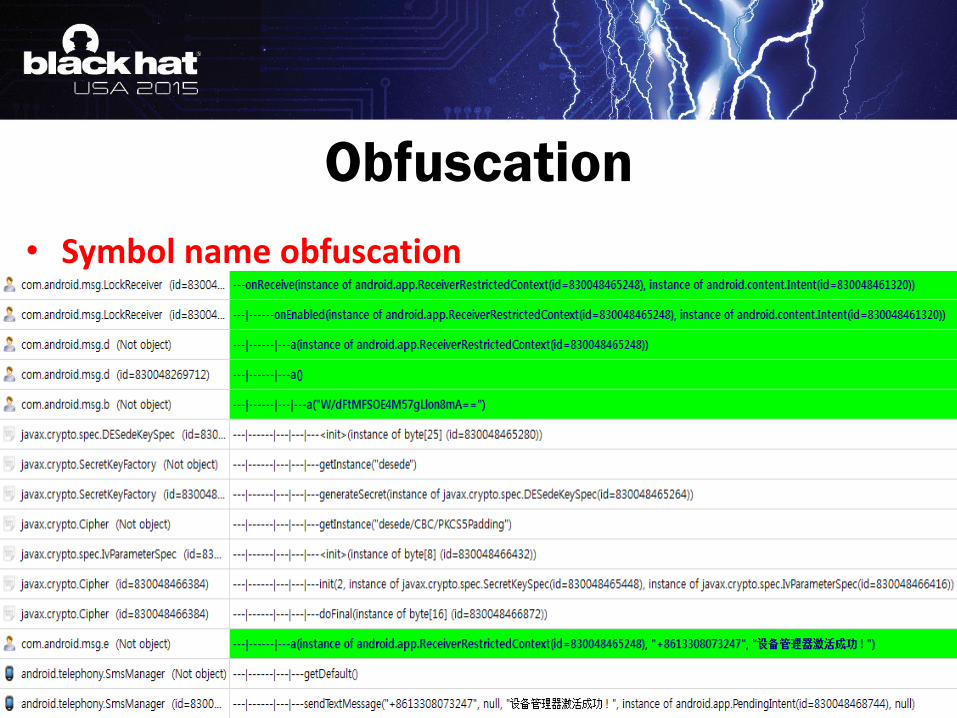
• Symbol name obfuscation
Obfuscation

• String encryption
– String obfuscation of DexGuard
Obfuscation
Disassembled code of string obfuscation
Discompiled code of string obfuscation

• String encryptionObfuscation
Code position
(for static analysis)
Method tracing of String object
Decrypted string
deobfuscated string is
“Hello world!”
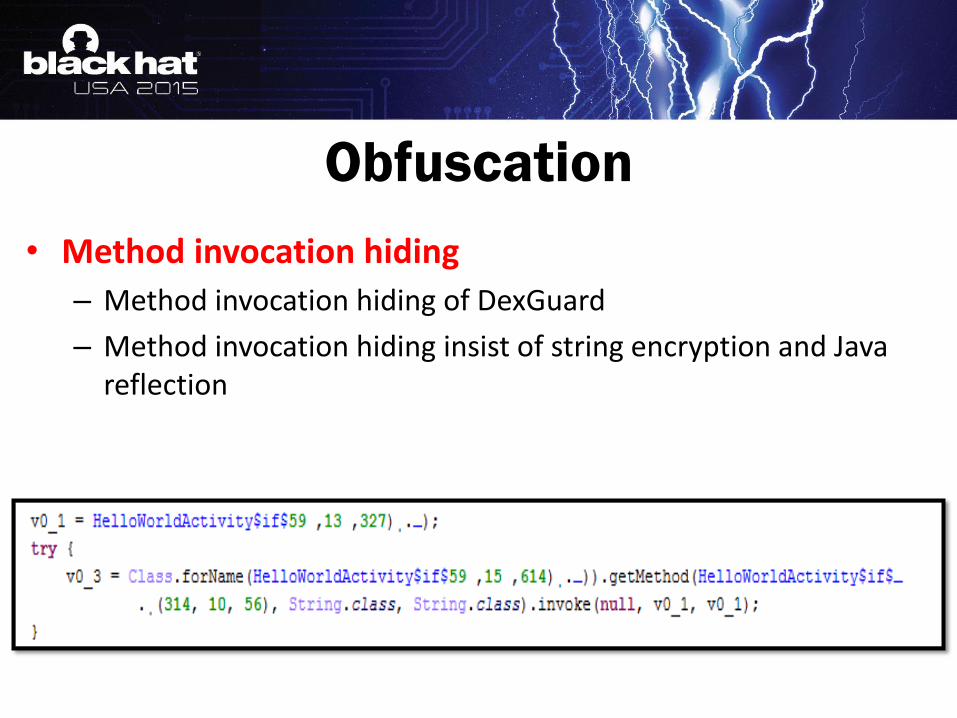
• Method invocation hiding
– Method invocation hiding of DexGuard
– Method invocation hiding insist of string encryption and Java reflection
Obfuscation

• Method invocation hiding
– Method invocation hiding of DexGuard(Most invocation hiding is performed using Java reflection)
Obfuscation
A object of dalvik.system.DexFile created using java reflection
java.lang.reflect.Method->invoke (Method hiding by java reflection)

• Complicated code: TamperDetection of DexGuard
– DexGuard employs multiple obfuscation techniques(String encryption, Class encryption, method invocation hiding)
Fast code analysis: example

• Complicated code: TamperDetection of DexGuard
Fast code analysis: example
1st loading
2nd loading
Integrity checking routine

• Complicated code: TamperDetection of DexGuard
Fast code analysis: example
Certification checking routine

• Dynamic loading: DEX file
– There are several hooking point to detect dynamic code loading
– You can get the loaded dex file with collaboration between JDWP and Injected code
Dynamic code loading
Injected Code
App DEX
Second DEX
file<App process>
Alarm! and Extraction!
Detect dynamic loading!

• Dynamic loading: memory patch
– To patch code, it needs to call mprotect() to change memory privilege writable to patch code
– We hook the mprotect() and rejects request for write privilege
– It will cause access violation (SIGSEGV)
Dynamic code loading
Signal handler
Code area
DEX image
(read-only area)
<App process>CodePatch.so
- Instruction caused the signal
(Code address in CodePatch.so)
- Accessed memory address
(Encrypted area)
- Thread contextAlarm! and Extraction! Write!

- 727df000-727e3000 rw-p 00000000 b3:1a 918654 /data/dalvik-cache/data@[email protected]@classes.dex
- 727e3000-727e4000 r--p 00004000 b3:1a 918654 /data/dalvik-cache/data@[email protected]@classes.dex
- 727e4000-727ed000 rw-p 00005000 b3:1a 918654 /data/dalvik-cache/data@[email protected]@classes.dex
- 727ed000-727f1000 r-xp 00000000 b3:1a 1179701 /data/app-lib/google.service-1/libAPKProtect.so
- 727f1000-727f2000 -w-p 00003000 b3:1a 1179701 /data/app-lib/google.service-1/libAPKProtect.so
- 727f2000-727f3000 rw-p 00004000 b3:1a 1179701 /data/app-lib/google.service-1/libAPKProtect.so
Link Register:
x727e203c
Accessed memory: 0x727e203c is in classes.dex
In sigHandler function, we got these information
1) Address of instruction caused segmentation fault: 0x40147370
- Link Register: 0x727ee4a1
2) Accessed memory address: 0x727e203c
3) Thread context (PC: 0x40147370)
- Address 0x40147370 is in memset function
- 0x727ee4a1 is for apkprotect.so
- While loop is unpacking routine
- Scalpel detected the unpacking point
We found
Unpacking routine
of APKProtect easily!
without reversing
• Monitoring extension performs using dex injection
• We can inject monitoring extension whenever it needs
• We makes our own process environment to track behaviors of the evasive android application using wait-for-debug feature(Wait-for-debug feature has presented in BlackHat ASIA 2015 )
• With monitoring extension, we can get the various things in nothing changed phone such as anti-analysis techniques, file extraction, Exploring app private directory, various detection, etc
Monitoring extension

• Malwares conceal their behaviors with using Native code
Mixed-environment code with JNI
Java Export table
Encrypted string
Native code
Example(Fake KakaoTalk Security Plug-in)www.virusbtn.com/virusbulletin/archive/2013/12/vb201312-KakaoTalk
①
② ?
③

• Need 3-layer monitoring
– JNI : calling native, calling Java
– Libc : calling libc
– Binder : communication with other app/service
Tracking Native Behavior

Tracking Native Behavior
Android App,Service Manager
Binder
Target App
Dalvik VM
Java Component
NativeComponent Libc
NativeTracker

• Java → Native
– Hook dvmCallJNIMethod()
• Native → Java
– Change functions table in JNIEnv
Tracking Native Behavior : JNI
jint JNI_xxxxxxx(JNIEnv* env, void *reserved )
void dvmCallJNIMethod(unsigned int const* args, Jvalue *pResult,Method const* method, void *self)

Tracking Native Behavior : JNI
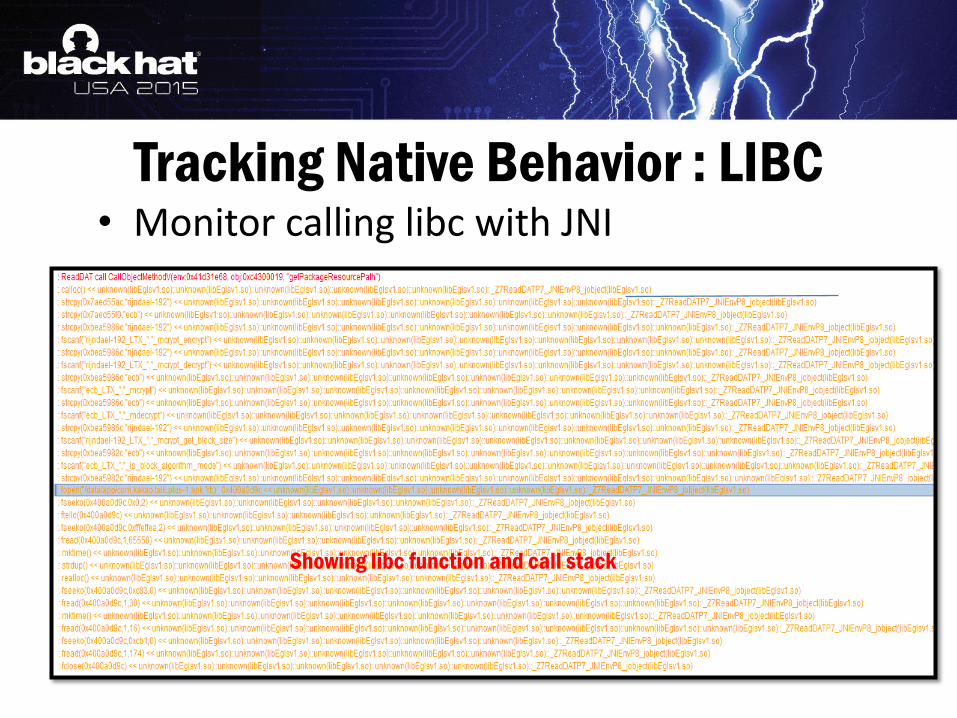
Tracking Native Behavior : LIBC• Monitor calling libc with JNI
Showing libc function and call stack
• NOT hooking ioctl() at binder driver
• Hooking Binder function(related transact) at IPC layer
– So we can monitor custom service
– No performance issue
• Can see all Message between targeted App and service/app through the binder
Tracking Native Behavior : BINDER

Tracking Native Behavior : BINDER
Service Layer
Binder Driver
foo()
transact()
transact()
talkWithDriver()
BpFooService
BpBinder
IPCThreadState
onTransact()
transact()
executeCommand()
talkWithDriver()
BnFooService
BBinder
IPCThreadState
onTransact()
BnFooService
foo()
Service User
Service Client Service Server
Service Layer
RPC Layer
IPC Layer
Ioctl() Ioctl()

Tracking Native Behavior : BINDER
Target Service Service Code
Service Data dump
Reply Data dump
• In addition to protecting information of analyst
– Camera, MIC, GPS
– Device info(phone number, IMEI, USIM, IMSI, etc)
Tracking Native Behavior : BINDER

DEMO


