DATE OF REPORT: 7 TH NOVEMBER, 2016 Mr Tim Radimissis Compliance Manager SA Adelaide Brighton Cement Ltd PO Box 77 Port Adelaide SA 5015 This Report Contains Commercially Sensitive Information TEST REPORT NO. JUN16100.2 AIR EMISSIONS MONITORING OF RELEASE POINTS 4A & 4B AT ADELAIDE BRIGHTON CEMENT LTD IN BIRKENHEAD DATE OF TESTING: 14 – 15 TH JUNE, 2016 ACCREDITATION: AUTHORISATION: Mr. I.S. Brash Adv.Dip.Mar.Eng. Dr. C.M. Clunies-Ross PhD(Chem.Eng.) TECHNICAL MANAGER LABORATORY MANAGER This laboratory is accredited by the National Association of Testing Authorities (NATA). NATA Accredited Laboratory No. 15463. Accredited for compliance with ISO/IEC 17025:2005. This document shall not be reproduced, except in full.
Transcript
DATE OF REPORT: 7TH NOVEMBER, 2016
Mr Tim Radimissis Compliance Manager SA Adelaide Brighton Cement Ltd PO Box 77 Port Adelaide SA 5015
This Report Contains Commercially Sensitive Information
TEST REPORT NO. JUN16100.2
AIR EMISSIONS MONITORING OF
RELEASE POINTS 4A & 4B AT
ADELAIDE BRIGHTON CEMENT LTD
IN BIRKENHEAD
DATE OF TESTING: 14 – 15TH JUNE, 2016
ACCREDITATION:
AUTHORISATION:
Mr. I.S. Brash Adv.Dip.Mar.Eng. Dr. C.M. Clunies-Ross PhD(Chem.Eng.) TECHNICAL MANAGER LABORATORY MANAGER
This laboratory is accredited by the National Association of Testing Authorities (NATA). NATA Accredited Laboratory No. 15463. Accredited for compliance with ISO/IEC 17025:2005.
This document shall not be reproduced, except in full.
Report to Adelaide Brighton Cement Ltd, Birkenhead Test Report No. JUN16100.2
Air Emissions Monitoring of Release Points 4A & 4B on14 - 15th June 2016 Page 3 of 16
AirLabs Environmental NATA endorsed test report. This document shall not be reproduced, except in full.
INTRODUCTION
Airlabs Environmental Pty Ltd was commissioned by Adelaide Brighton Cement Ltd to conduct air emissions testing of the Dry Process Kiln 4 Main Stack (Release Point 4A) and the Precalciner Plant Stack (Release Point 4B) at their Birkenhead Plant. The following parameters were monitored on each stack:
Temperature, Gas Velocity and Volume Flow Rate
Moisture Concentration
Concentration of Oxygen and Carbon Dioxide
Dry Molecular Weight and Dry Gas Density
Concentration and Mass Emission Rate of:
- Total Solid Particulates
- PM10 (Particulate matter with a nominal aerodynamic diameter ≤ 10 μm)
- PM2.5 (Particulate matter with a nominal aerodynamic diameter ≤ 2.5 μm)
- Sulphur Dioxide
- Carbon Monoxide
- Nitrogen Oxides (as NO2)
- Hydrogen Chloride a
- Chlorine
- Fluoride b
- Total Volatile Organic Compounds (VOCs)
- Benzene
- Multi-Metals c
- Chromium VI and compounds
- Polycyclic Aromatic Hydrocarbons (PAHs as BaP).
Combustion gases (O2, CO, CO2, SO2 and NOx) were monitored semi-continuously and the average values reported. Average normalised flow rates were used to calculate the mass emission rates. The Dry Process Kiln 4 Main Stack (4A) and the Precalciner Plant Stack (4B) were both tested on 14 – 15th June 2016.
QUALITY STATEMENT
Airlabs Environmental is committed to providing the highest quality data to all our clients, as reflected in our ISO 17025 (NATA) accreditation. This requires strict adherence to and continuous improvement of all our processes and test work. Our goal is to exceed the QA/QC requirements as set by our clients and appropriate governmental entities and to insure that all data generated is scientifically valid and defensible.
Airlabs Environmental is NATA accredited for all sampling undertaken for this project. Analysis was undertaken by the National Measurement Institute (NATA Accreditation No. 198) and Airlabs Environmental in accordance with our terms of accreditation.
a Chlorides expressed as HCl. b Fluorides expressed as HF. c Antimony and compounds, Arsenic and compounds, Barium (soluble compounds), Beryllium and compounds, Cadmium and
compounds Chromium (III) and compounds, Copper oxide fume (as CuO), Iron oxide fume (as Fe2O3), Lead and compounds, Magnesium oxide fume (as MgO), Manganese and compounds, Mercury - organic, Mercury - inorganic, Nickel and compounds, Zinc oxide fume (as ZnO).
Report to Adelaide Brighton Cement Ltd, Birkenhead Test Report No. JUN16100.2
Air Emissions Monitoring of Release Points 4A & 4B on14 - 15th June 2016 Page 4 of 16
AirLabs Environmental NATA endorsed test report. This document shall not be reproduced, except in full.
ghocking
Highlight
Report to Adelaide Brighton Cement Ltd, Birkenhead Test Report No. JUN16100.2
Air Emissions Monitoring of Release Points 4A & 4B on14 - 15th June 2016 Page 5 of 16
AirLabs Environmental NATA endorsed test report. This document shall not be reproduced, except in full.
TEST METHODS
All sampling was undertaken by Airlabs Environmental. Airlabs Environmental is NATA accredited for all sampling undertaken for this project (NATA Accredited Laboratory No. 15463). Analysis was undertaken by Airlabs Environmental and the National Measurement Institute (NMI, NATA Accreditation No. 198) in accordance with our terms of accreditation. Specific details of the test methods used are available upon request.
Table 1: Summary of Test Methods
Test Parameter Test Method Method
Detection Limit
Estimated Measurement Uncertainty
NATA Accredited
Sampling Analysis
Sample plane criteria AS 4323.1 NA NA ✓ NA
Gas velocity US EPA Method 2 3 m/s ± 10% ✓ NA
Temperature US EPA Method 2 273K (0°C) 1% ✓ NA
Moisture content US EPA Method 4 0.2% 5% ✓ ✓
Oxygen & carbon dioxide US EPA Method
3A 0.1% 2% ✓ ✓
Dry molecular weight & gas density
US EPA Method 3 NA 5% ✓ ✓
Total solid particulates AS 4323.2 1 mg/m3 15% ✓ ✓
PM10 & PM2.5 US EPA Method
201A 1 mg/m3 15% ✓ ✓
Sulfur dioxide US EPA Method
6C 3 mg/m3 5% ✓ ✓
Carbon monoxide US EPA Method 10 1 mg/m3 5% ✓ ✓
Nitrogen oxides (as NO2) US EPA Method 7E 2 mg/m3 5% ✓ ✓
1. Chloride and fluoride analyses were performed by NMI, with results included in their Report No. RN1122062.2. Heavy metal analysis was performed on the various sample components by NMI, with results included in their Report No.
RN1122062.3. Hexavalent chromium analysis was performed by NMI, with results included in their Report No. RN1122062.4. PAH analysis was performed by NMI, with results included in their Analytical Certificate No. ORG16_043.
Report to Adelaide Brighton Cement Ltd, Birkenhead Test Report No. JUN16100.2
Air Emissions Monitoring of Release Points 4A & 4B on14 - 15th June 2016 Page 6 of 16
AirLabs Environmental NATA endorsed test report. This document shall not be reproduced, except in full.
DEFINITIONS
‘SA EPA’ South Australian Environment Protection Authority. ‘US EPA’ United States Environmental Protection Agency. ‘NSW EPA’ New South Wales Environment Protection Authority. ‘NMI’ National Measurement Institute (Australian Government), North Ryde, NSW. ‘tph’ Tonnes per hour. ‘K’ Absolute temperature in Kelvin (oC + 273). ‘mB’ Pressure in millibars. ‘lpm’ Gas flow rate in litres per minute. ‘STP’ Standard temperature and pressure (273K and 101.3 kPa). ‘m3’ Actual gas volume in cubic metres at stack conditions. ‘Nm3’ Gas volume in dry cubic metres at STP. ‘<’ Less than. The value stated is the limit of detection. ‘g’ Grams. ‘mg’ Milligrams (10-3 grams). ‘µg’ Micrograms (10-6 grams). ‘min’ Minute. ‘LOD’ Limit of detection. ‘FIA’ Flame ionisation analyser. ‘VOC’ Volatile organic compound. A VOC is defined as any chemical compound based on
carbon chains or rings with a vapour pressure greater than 2 mm of mercury (0.27 kPa) at 25°C. These compounds may contain hydrogen, oxygen, nitrogen and other elements, but specifically excluded are methane, carbon monoxide, carbon dioxide, carbonic acid, metallic carbides and carbonate salts.
‘PAHs’ Polycyclic aromatic hydrocarbons. ‘CARB’ California Air Resources Board. ‘OEHHA’ Office of Environmental Health Hazard Assessment (US). ‘BaP-PEF’ Benzo(a)pyrene Potency Equivalency Factor. ‘BAP-TEQPAH’ Benzo(a)pyrene Toxic Equivalents. ‘N/A’ Not applicable.
‘PM10’ Particulate matter with a nominal aerodynamic diameter ≤ 10 μm.
‘PM2.5’ Particulate matter with a nominal aerodynamic diameter ≤ 2.5 μm.
Report to Adelaide Brighton Cement Ltd, Birkenhead Test Report No. JUN16100.2
Air Emissions Monitoring of Release Points 4A & 4B on14 - 15th June 2016 Page 7 of 16
AirLabs Environmental NATA endorsed test report. This document shall not be reproduced, except in full.
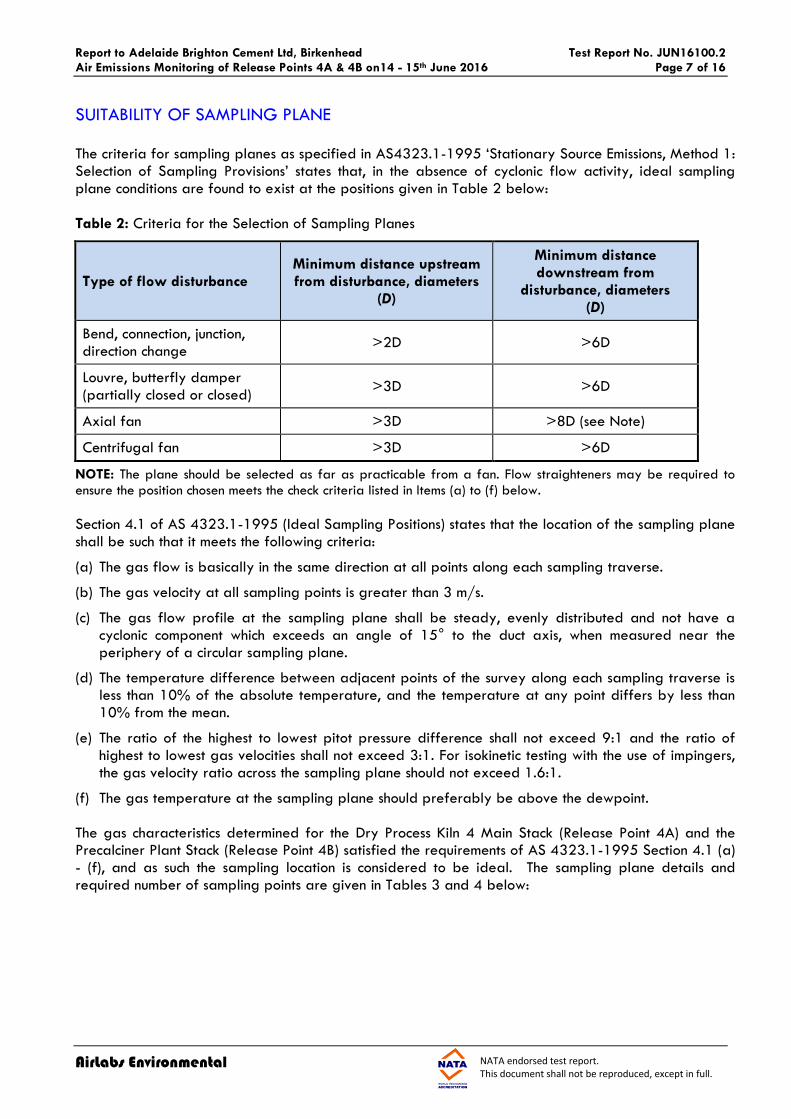
SUITABILITY OF SAMPLING PLANE
The criteria for sampling planes as specified in AS4323.1-1995 ‘Stationary Source Emissions, Method 1: Selection of Sampling Provisions’ states that, in the absence of cyclonic flow activity, ideal sampling plane conditions are found to exist at the positions given in Table 2 below:
Table 2: Criteria for the Selection of Sampling Planes
Type of flow disturbance Minimum distance upstream from disturbance, diameters
(D)
Minimum distance downstream from
disturbance, diameters (D)
Bend, connection, junction, direction change
>2D >6D
Louvre, butterfly damper (partially closed or closed)
>3D >6D
Axial fan >3D >8D (see Note)
Centrifugal fan >3D >6D
NOTE: The plane should be selected as far as practicable from a fan. Flow straighteners may be required to ensure the position chosen meets the check criteria listed in Items (a) to (f) below.
Section 4.1 of AS 4323.1-1995 (Ideal Sampling Positions) states that the location of the sampling plane shall be such that it meets the following criteria:
(a) The gas flow is basically in the same direction at all points along each sampling traverse.
(b) The gas velocity at all sampling points is greater than 3 m/s.
(c) The gas flow profile at the sampling plane shall be steady, evenly distributed and not have acyclonic component which exceeds an angle of 15° to the duct axis, when measured near theperiphery of a circular sampling plane.
(d) The temperature difference between adjacent points of the survey along each sampling traverse isless than 10% of the absolute temperature, and the temperature at any point differs by less than10% from the mean.
(e) The ratio of the highest to lowest pitot pressure difference shall not exceed 9:1 and the ratio ofhighest to lowest gas velocities shall not exceed 3:1. For isokinetic testing with the use of impingers,the gas velocity ratio across the sampling plane should not exceed 1.6:1.
(f) The gas temperature at the sampling plane should preferably be above the dewpoint.
The gas characteristics determined for the Dry Process Kiln 4 Main Stack (Release Point 4A) and the Precalciner Plant Stack (Release Point 4B) satisfied the requirements of AS 4323.1-1995 Section 4.1 (a) - (f), and as such the sampling location is considered to be ideal. The sampling plane details andrequired number of sampling points are given in Tables 3 and 4 below:
Report to Adelaide Brighton Cement Ltd, Birkenhead Test Report No. JUN16100.2
Air Emissions Monitoring of Release Points 4A & 4B on14 - 15th June 2016 Page 8 of 16
AirLabs Environmental NATA endorsed test report. This document shall not be reproduced, except in full.
SUITABILITY OF SAMPLING PLANE Continued
Table 3: Sampling Plane Details for the Kiln 4 Main Stack Figure 1: Kiln 4 Main Stack (RP 4A)
Parameter
Stack Shape Circular
Actual Stack Internal Diameter (m) 3.23
Stack Exit Diameter (m) 3.23
Direction of Discharge to Air Vertical
Type of Disturbance, Upstream Centrifugal Fan
Distance from Upstream Disturbance > 6 D
Type of Disturbance, Downstream Stack Exit
Distance to Downstream Disturbance > 2 D
Compliance with AS4323.1, Ideal Conditions Yes
Stack Height Above Ground Level (m) 75.5
Standard No. of Sampling Points per Traverse 12
Number of Traverses 2
Correction Factor N/A
Corrected No. of Sampling Points per Traverse N/A
Total No. of Sampling Points 24
Stratified No
Cyclonic No (< 15°)
Velocity Difference 1.5:1 (< 1.6:1)
Absolute Temperature Difference (K) < 10%
Minimum Velocity at any Sample Point (m/s) > 3
Table 4: Sampling Plane Details for the Precalciner Plant Stack Figure 2: Precalciner Plant Stack (RP 4B)
Parameter
Stack Shape Circular
Actual Stack Internal Diameter (m) 3.00
Stack Exit Diameter (m) 3.00
Direction of Discharge to Air Vertical
Type of Disturbance, Upstream Centrifugal Fan
Distance from Upstream Disturbance > 6 D
Type of Disturbance, Downstream Stack Exit
Distance to Downstream Disturbance > 2 D
Compliance with AS4323.1, Ideal Conditions Yes
Stack Height Above Ground Level (m) 96
Standard No. of Sampling Points per Traverse 12
Number of Traverses 2
Correction Factor N/A
Corrected No. of Sampling Points per Traverse N/A
Total No. of Sampling Points 24
Stratified No
Cyclonic No (< 15°)
Velocity Difference 1.5:1 (< 1.6:1)
Absolute Temperature Difference (K) < 10%
Minimum Velocity at any Sample Point (m/s) > 3
Report to Adelaide Brighton Cement Ltd, Birkenhead Test Report No. JUN16100.2
Air Emissions Monitoring of Release Points 4A & 4B on14 - 15th June 2016 Page 9 of 16
AirLabs Environmental NATA endorsed test report. This document shall not be reproduced, except in full.
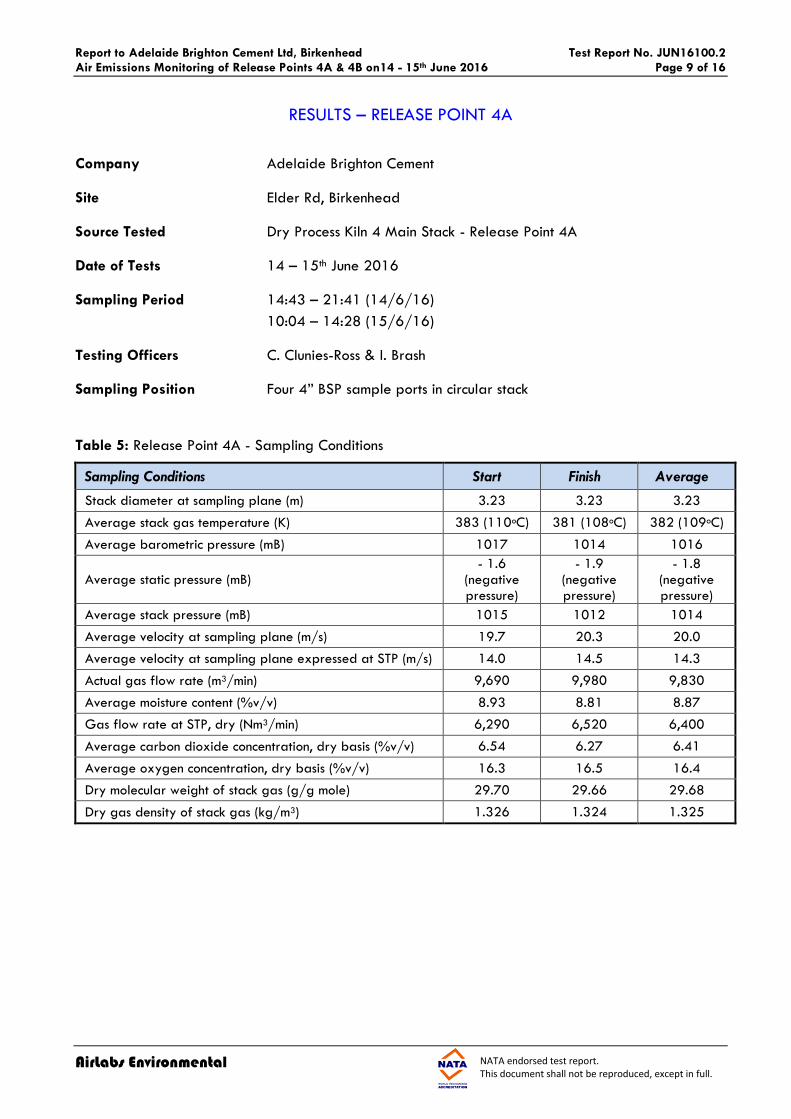
RESULTS – RELEASE POINT 4A
Company Adelaide Brighton Cement
Site Elder Rd, Birkenhead
Source Tested Dry Process Kiln 4 Main Stack - Release Point 4A
Date of Tests 14 – 15th June 2016
Sampling Period 14:43 – 21:41 (14/6/16)
10:04 – 14:28 (15/6/16)
Testing Officers C. Clunies-Ross & I. Brash
Sampling Position Four 4” BSP sample ports in circular stack
Table 5: Release Point 4A - Sampling Conditions
Sampling Conditions Start Finish Average
Stack diameter at sampling plane (m) 3.23 3.23 3.23
Average stack gas temperature (K) 383 (110oC) 381 (108oC) 382 (109oC)
Average barometric pressure (mB) 1017 1014 1016
Average static pressure (mB) - 1.6
(negative pressure)
- 1.9 (negative pressure)
- 1.8 (negative pressure)
Average stack pressure (mB) 1015 1012 1014
Average velocity at sampling plane (m/s) 19.7 20.3 20.0
Average velocity at sampling plane expressed at STP (m/s) 14.0 14.5 14.3
Actual gas flow rate (m3/min) 9,690 9,980 9,830
Average moisture content (%v/v) 8.93 8.81 8.87
Gas flow rate at STP, dry (Nm3/min) 6,290 6,520 6,400
Average carbon dioxide concentration, dry basis (%v/v) 6.54 6.27 6.41
Average oxygen concentration, dry basis (%v/v) 16.3 16.5 16.4
Dry molecular weight of stack gas (g/g mole) 29.70 29.66 29.68
Dry gas density of stack gas (kg/m3) 1.326 1.324 1.325
Report to Adelaide Brighton Cement Ltd, Birkenhead Test Report No. JUN16100.2
Air Emissions Monitoring of Release Points 4A & 4B on14 - 15th June 2016 Page 10 of 16
AirLabs Environmental NATA endorsed test report. This document shall not be reproduced, except in full.
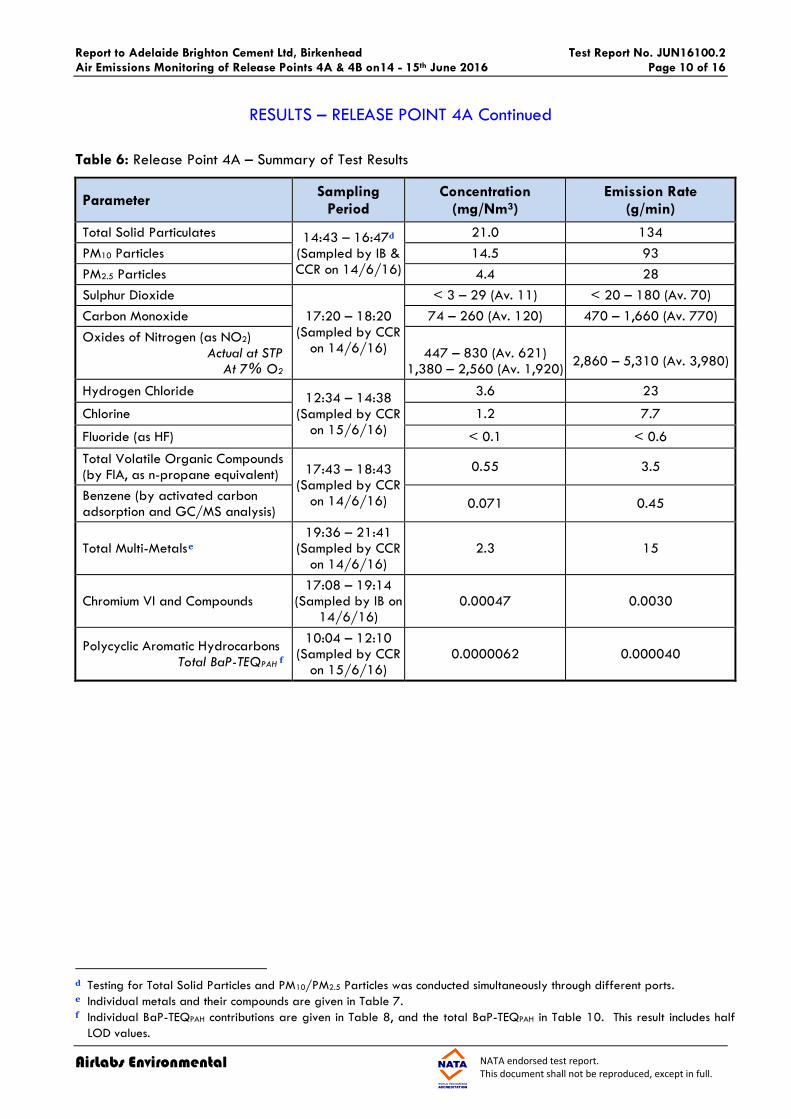
RESULTS – RELEASE POINT 4A Continued
Table 6: Release Point 4A – Summary of Test Results
Parameter Sampling
Period Concentration
(mg/Nm3) Emission Rate
(g/min)
Total Solid Particulates 14:43 – 16:47d (Sampled by IB & CCR on 14/6/16)
Oxides of Nitrogen (as NO2) Actual at STP At 7% O2
447 – 830 (Av. 621)
1,380 – 2,560 (Av. 1,920)
2,860 – 5,310 (Av. 3,980)
Hydrogen Chloride 12:34 – 14:38
(Sampled by CCR on 15/6/16)
3.6 23
Chlorine 1.2 7.7
Fluoride (as HF) < 0.1 < 0.6
Total Volatile Organic Compounds (by FIA, as n-propane equivalent) 17:43 – 18:43
(Sampled by CCR on 14/6/16)
0.55 3.5
Benzene (by activated carbon adsorption and GC/MS analysis)
0.071 0.45
Total Multi-Metals e
19:36 – 21:41 (Sampled by CCR
on 14/6/16) 2.3 15
Chromium VI and Compounds 17:08 – 19:14
(Sampled by IB on 14/6/16)
0.00047 0.0030
Polycyclic Aromatic Hydrocarbons Total BaP-TEQPAH f
10:04 – 12:10 (Sampled by CCR
on 15/6/16) 0.0000062 0.000040
d Testing for Total Solid Particles and PM10/PM2.5 Particles was conducted simultaneously through different ports. e Individual metals and their compounds are given in Table 7. f Individual BaP-TEQPAH contributions are given in Table 8, and the total BaP-TEQPAH in Table 10. This result includes half
LOD values.
Report to Adelaide Brighton Cement Ltd, Birkenhead Test Report No. JUN16100.2
Air Emissions Monitoring of Release Points 4A & 4B on14 - 15th June 2016 Page 11 of 16
AirLabs Environmental NATA endorsed test report. This document shall not be reproduced, except in full.
RESULTS – RELEASE POINT 4A Continued
Table 7: Release Point 4A – Metals and their Compounds
Metal Concentration
(mg/Nm3) Emission Rate
(g/min)
Antimony and its compounds 0.00013 0.00083
Arsenic and its compounds 0.00017 0.0011
Barium (soluble compounds) 0.0035 0.022
Beryllium and its compounds < 0.0001 < 0.00064
Cadmium and its compounds 0.000014 0.000090
Chromium (III) and its compounds 0.00056 0.0036
Copper oxide fume (as CuO) 0.0025 0.016
Iron oxide fume (as Fe2O3) 0.27 1.7
Lead and its compounds 0.00060 0.0038
Magnesium oxide fume (as MgO) 2.0 13
Manganese and its compounds 0.010 0.064
Mercury and its compounds (as Hg) Organic: < 0.000006 < 0.00004
Oxides of Nitrogen (as NO2) Actual at STP At 7% O2
627 - 802 (Av. 691)
894 – 1,140 (Av. 985)
2,770 – 3,540 (Av. 3,050)
Hydrogen Chloride 14:29 – 16:32
(Sampled by IB on 15/6/16)
4.5 20
Chlorine 2.3 10
Fluoride (as HF) < 0.1 < 0.4
Total Volatile Organic Compounds (by FIA, as n-propane equivalent) 11:56 – 12:56
(Sampled by CCR on 14/6/16)
1.3 5.7
Benzene (by activated carbon adsorption and GC/MS analysis)
0.21 0.93
Total Multi-Metals i 09:41 – 11:45
(Sampled by IB on 15/6/16)
3.0 13
Chromium VI and Compounds 12:07 – 14:11
(Sampled by IB on 15/6/16)
0.00024 0.0011
Polycyclic Aromatic Hydrocarbons Total BaP-TEQPAH j
10:42 – 12:48 (Sampled by IB on
14/6/16)
0.0000060
0.000026
h Testing for Total Solid Particles and PM10/PM2.5 Particles was conducted simultaneously through different ports. i Individual metals and their compounds are given in Table 13. j Individual BaP-TEQPAH contributions are given in Table 14, and the total BaP-TEQPAH in Table 16. This result includes half
LOD values.
Report to Adelaide Brighton Cement Ltd, Birkenhead Test Report No. JUN16100.2
Air Emissions Monitoring of Release Points 4A & 4B on14 - 15th June 2016 Page 15 of 16
AirLabs Environmental NATA endorsed test report. This document shall not be reproduced, except in full.
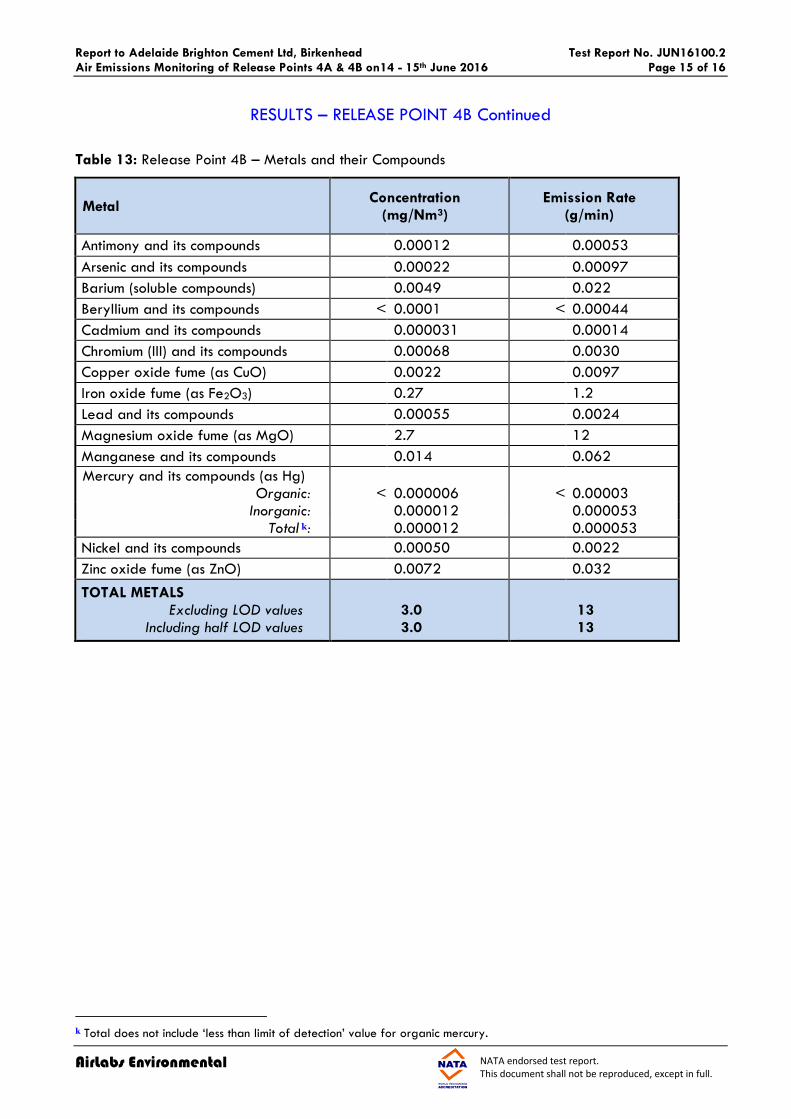
RESULTS – RELEASE POINT 4B Continued
Table 13: Release Point 4B – Metals and their Compounds
Metal Concentration
(mg/Nm3) Emission Rate
(g/min)
Antimony and its compounds 0.00012 0.00053
Arsenic and its compounds 0.00022 0.00097
Barium (soluble compounds) 0.0049 0.022
Beryllium and its compounds < 0.0001 < 0.00044
Cadmium and its compounds 0.000031 0.00014
Chromium (III) and its compounds 0.00068 0.0030
Copper oxide fume (as CuO) 0.0022 0.0097
Iron oxide fume (as Fe2O3) 0.27 1.2
Lead and its compounds 0.00055 0.0024
Magnesium oxide fume (as MgO) 2.7 12
Manganese and its compounds 0.014 0.062
Mercury and its compounds (as Hg) Organic: < 0.000006 < 0.00003
Inorganic: 0.000012 0.000053 Total k: 0.000012 0.000053
Nickel and its compounds 0.00050 0.0022
Zinc oxide fume (as ZnO) 0.0072 0.032
TOTAL METALS Excluding LOD values
Including half LOD values 3.0 3.0
13 13
k Total does not include ‘less than limit of detection’ value for organic mercury.
Report to Adelaide Brighton Cement Ltd, Birkenhead Test Report No. JUN16100.2
Air Emissions Monitoring of Release Points 4A & 4B on14 - 15th June 2016 Page 16 of 16
AirLabs Environmental NATA endorsed test report. This document shall not be reproduced, except in full.