Three-dimensional model evaluation of the Ozone DepletionPotentials for n-propyl bromide, trichloroethylene andperchloroethylene
D. J. Wuebbles1, K. O. Patten1, D. Wang1, D. Youn2, M. Mart ınez-Aviles3,*, and J. S. Francisco3
1Department of Atmospheric Sciences, University of Illinois at Urbana-Champaign, Urbana, IL, USA2School of Earth and Environmental Sciences Seoul National University Seoul, Seoul, South Korea3Department of Chemistry and Department of Earth and Atmospheric Sciences, Purdue University, West Lafayette, IN, USA* now at: National Institute of Water and Atmospheric Research Omakau, Central Otago, New Zealand
Received: 1 June 2010 – Published in Atmos. Chem. Phys. Discuss.: 26 July 2010Revised: 18 February 2011 – Accepted: 23 February 2011 – Published: 15 March 2011
Abstract. The existing solvents trichloroethylene (TCE) andperchloroethylene (PCE) and proposed solvent n-propyl bro-mide (nPB) have atmospheric lifetimes from days to a fewmonths, but contain chlorine or bromine that could affectstratospheric ozone. Several previous studies estimated theOzone Depletion Potentials (ODPs) for various assumptionsof nPB emissions location, but these studies used simplifiedmodeling treatments. The primary purpose of this study isto reevaluate the ODP for n-propyl bromide (nPB) using acurrent-generation chemistry-transport model of the tropo-sphere and stratosphere. For the first time, ODPs for TCEand PCE are also evaluated in a three-dimensional, global at-mospheric chemistry-transport model. Emissions represent-ing industrial use of each compound are incorporated on landsurfaces from 30◦ N to 60◦ N. The atmospheric chemical life-time obtained for nPB is 24.7 days, similar to past literature,but the ODP is 0.0049, lower than in our past study of nPB.The derived atmospheric lifetime for TCE is 13.0 days andfor PCE is 111 days. The corresponding ODPs are 0.00037and 0.0050, respectively.
1 Introduction
n-propyl bromide (chemical formula CH3CH2CH2Br, alsonamed 1-bromopropane and abbreviated below as nPB) hasbeen proposed as a potential replacement for compoundsthat have been used as solvents for many years including
trichloroethylene (TCE, chemical formula C2HCl3) and per-chloroethylene (PCE, chemical formula C2Cl4, also namedtetrachloroethylene). TCE is widely used as an industrial sol-vent; PCE is commonly used in fabrics dry-cleaning, metaldegreasing, as well as a feedstock for chemical manufac-ture. As discussed in the 2002 World Meteorological Or-ganization international stratospheric ozone assessment (Koet al., 2003), four modeling studies (Wuebbles et al., 1999,2001; Bridgeman et al., 2000; Olsen et al., 2000) have pre-viously evaluated Ozone Depletion Potentials (ODPs) fornPB. These studies used the modified concept for ODPs thataccounts for the location of emissions (Wuebbles and Ko,1999) as compared to the original definition developed forlonger-lived gases. However, none of the nPB studies evalu-ated the ODPs using a three-dimensional chemistry-transportmodel of the troposphere and stratosphere with complete rep-resentation of relevant chemistry processes. The purpose ofthis study is to update the ODPs for nPB using such a model.In addition, ODPs of TCE and PCE are evaluated, thoughthe primary environmental concerns about these compoundsrelate to their toxicity, as summarized in OEHHA (1999,2000).
In the earlier nPB studies, Wuebbles et al. (1999) used azonally-averaged two-dimensional (2-D) model to estimatethe ODP. Olsen et al. (2000) applied the low-resolution (8◦
latitude×10◦ longitude×9 layers) three-dimensional (3-D)UCI tropospheric chemical-transport model to determine theamount of very short-lived (VSL) substances for a rangeof atmospheric lifetimes, and for various seasons and lati-tudes of emission, reaching the tropical tropopause. Then byscaling the ODP values from 2-D model results (Wuebbleset al., 1999), they estimated ODP values for nPB ranging
Published by Copernicus Publications on behalf of the European Geosciences Union.
2372 D. J. Wuebbles et al.: Model evaluation of nPB, TCE, and PCE Ozone Depletion Potentials
from 0.0002 (for summer emissions at 56◦ N to 64◦ N) to aslarge as 0.06 for tropical emissions. Bridgeman et al. (2000)used the TOMCAT 3-D global chemical-transport model(5.6◦
×5.6◦×31 levels) to evaluate the atmospheric lifetime
and amount of nPB reaching the stratosphere as a functionof location and season of emission. They calculated ODPsempirically, based on the derived lifetime and the fraction ofnPB emissions reaching the stratosphere. For nPB, they de-rived ODPs that vary from 0.0033 for emissions from Europeto 0.0109 for emissions from Indonesia. The study assumedthat any bromine atoms released in the troposphere would beremoved by rainout with 100% efficiency before reaching thestratosphere. Thus, their derived ODPs only considered thedirect nPB reaching the stratosphere.
Wuebbles et al. (2001) used the MOZART-2 3-Dchemical-transport model (5◦
×5◦×34 levels) in combination
with studies using their 2-D model in examining the potentialeffects of nPB on stratospheric ozone and the correspond-ing set of ODPs for nPB, and attempted to quantify degrada-tion product effects. With available information, bromoace-tone was the intermediate degradation product which had thelargest concentration and had a local photochemical lifetimemore than 1 day. For nPB emitted equally over global landmasses north of 60◦ S and south of 70◦ N, their 3-D modelcalculations suggest that about 0.44% of the emitted bromineenters the stratosphere. About 33% of the bromine reachingthe stratosphere results from the direct transport of nPB to thestratosphere and about 19% due to the transport of bromoace-tone to the stratosphere. The rest (48%) is from transport ofinorganic bromine.
These studies indicated the potential importance of con-sidering both pathways in deriving the halogen reaching thestratosphere and the resulting ODPs for VSL gases like nPB.However, measurements by Burkholder et al. (2002) suggestthat the local lifetime of bromoacetone is a few hours ratherthan at least one day as assumed in Wuebbles et al. (2001).Ko et al. (2003) modified the Wuebbles et al. (2001) ODPvalues to account for this overestimate of the bromoacetoneatmospheric lifetime. For nPB emissions at midlatitudes(North America, Europe, and Asia – roughly 30◦ N to 60◦ N),the modified ODPs range from 0.017 to 0.026.
Since the earlier studies were published, much more hasbeen learned about the oxidation of nPB and the chemistryof nPB degradation products in the atmosphere. In additionto the Burkholder et al. (2002) study of bromoacetone, therehave been new measurements and analyses of nPB reactionwith OH (Gilles et al., 2002; Martınez-Aviles et al., 2008a)and of the specific reactions and reaction rates in the reactionmechanism after initiation (Martınez-Aviles et al., 2008b).We have incorporated these new findings into the reactionmechanism used in the modeling studies.
2 Methodology
The ODP concept (Wuebbles, 1981, 1983) arose as a meansof determining the relative ability of a chemical to destroystratospheric ozone. ODPs are an integral part of nationaland international considerations on ozone-protection policy,including the Montreal Protocol and its Amendments and theUS Clean Air Act. ODPs provide an important and relativelystraightforward way of analyzing the potential for a newchemical to affect ozone relative to the CFCs, Halons, andother replacement compounds. ODPs are currently deter-mined by two different means: calculations from chemistry-transport models of the global atmosphere (CTMs), and cal-culations using a semi-empirical approach (Solomon et al.,1992).
An ODP is a relative measure of the expected cumulativeeffect on stratospheric ozone per unit mass emission of a gascompared with the expected effect from the same mass emis-sion of CFC-11. Therefore, it is defined as the change in to-tal ozone per unit mass emission of the gas, relative to thechange in total ozone per unit mass emission of CFC-11.ODP by itself does not, however, indicate the actual emis-sions or the amount of ozone depletion that has occurred ormight occur.
Traditionally, zonally averaged 2-D CTMs were used forcalculating the ozone response in the stratosphere. Past ODPevaluations were conducted for chemicals with atmosphericlifetimes more than approximately one year. Such long-livedgases mixed well throughout the troposphere after surfacerelease, and large fractions of the surface emissions reachedthe stratosphere. However, many of the compounds now be-ing considered either for new applications or as replacementsfor substances controlled under the Montreal Protocol are de-signed to be short-lived, on the order of days to a few months,so as to reduce the impacts on ozone and climate. Theseshort-lived replacement gases still can be vertically trans-ported into the lower stratosphere by intense convection inthe tropical troposphere, which is relevant to possible effectson ozone from these compounds. Thus, the ODP of a VSLspecies depends upon its distribution in the atmosphere andthe location of its source (Wuebbles and Ko, 1999; Wueb-bles et al., 2001; Ko et al., 2003). Unfortunately, the de-termination of ODPs for these gases is not straightforwardbecause their short atmospheric lifetimes leave them poorlymixed in the troposphere. Because they lose halogens in thetroposphere, VSLSs can also cause O3 depletion in the tro-posphere, where both O3 precursors and loss processes arehighly variable with longitude and thus not easily treated inthe zonal average. Also, the traditional 2-D model analysis ofODPs is not sufficiently accurate to calculate the integratedamount of the halogenated VSL source and reaction productgases in the troposphere that enter the stratosphere (Wueb-bles et al., 2001).
3-D CTMs representing the complete troposphere andstratosphere are necessary for evaluating the halogen loading
D. J. Wuebbles et al.: Model evaluation of nPB, TCE, and PCE Ozone Depletion Potentials 2373
and ozone depletion for VSL species. Thus the definitionof ODPs has been revised for VSL compounds (Wuebbleset al., 2001; Ko et al., 2003). The new ODP definition forthe VSL compounds accounts for the variation that can oc-cur in the ODP as a function of where and when the com-pound is used and emitted. The most important factor inevaluating the ODP of VSL compounds is shown to be lat-itude distribution of the surface emissions because halogensfrom source gases emitted at higher latitudes are less likely toreach the stratosphere than from source gases emitted in thetropics (Bridgeman et al., 2000; Olsen et al., 2000; Wueb-bles et al., 2001). 3-D CTMs, which include a much morecomprehensive treatment of transport than available for 2-Dmodels, are now preferable for calculations of ODPs both forthe longer-lived gases and for the very short-lived candidatereplacement compounds. These models can not only deter-mine the amount of the substance reaching the stratospheredirectly but can also follow the processes affecting the reac-tion products. Studies suggest that most chlorine or brominethat reaches the stratosphere from VSL substances is trans-ported there in reaction products (Wuebbles et al., 2001; Koet al., 2003; Law et al., 2007).
2.1 Atmospheric model
This study uses the current-generation 3-D model of globalatmospheric chemistry and physics developed by the Na-tional Center for Atmospheric Research (NCAR) calledthe Model for OZone And Related Tracers version 3.1(MOZART-3). MOZART-3 has been used to explicitlycalculate the impact of halocarbon emissions added at theEarth surface into the atmosphere on ozone depletion. TheMOZART-3 CTM includes a complete representation of tro-pospheric, stratospheric, and upper atmospheric processes(Kinnison et al., 2007). It incorporates a full stratosphere, in-cluding the chemistry of chlorine species (Cly) and brominespecies (Bry) important in stratospheric ozone calculationas well as updated hydrogen, nitrogen, and hydrocarbonoxidation chemistry relevant to stratospheric and tropo-spheric chemistry included in the lower atmospheric ver-sion, MOZART-2 (Horowitz et al., 2003). The water-solubleCly species HCl, HOCl, and ClONO2 and the water-solubleBry species HBr, HOBr, and BrONO2 are removed from theMOZART-3 atmosphere by tropospheric wet deposition withthe same rate constant as used for HNO3. Representationsof relevant heterogeneous and physical processes for win-ter/spring polar vortex related to ozone destruction are alsofully included in the model. This model has been evalu-ated extensively via comparisons with measurements of at-mospheric trace gases from satellite data and measurementcampaigns (e.g., Wei et al., 2003; Pan et al., 2007).
Chemical reaction-rate constants and photochemical datafor reactions other than those of nPB, its degradation productbromoacetone, TCE, and PCE follow the recommendationsof Sander et al. (2003). The MOZART-3 CTM is driven
by meteorology fields derived from the Whole AtmosphereCommunity Climate Model (WACCM) version 1b (Sassi etal., 2004). MOZART-3 thus has a 2.8◦ resolution in latitudeand longitude and a hybrid sigma-pressure vertical coordi-nate including 66 layers from the surface to 5.1×10⁻⁶ hPa(approximately 140 km).
2.2 Atmospheric oxidation of nPB, TCE, and PCE
In this study, the initiating reaction of nPB with OH radicalis based on the rate constants from Gilles et al. (2002):
where the temperatureT is in K and rate constantsk arein cm3 molec−1 s−1. Analysis of the subsequent reactionsby the radicals produced by OH reaction with nPB fromMartınez-Aviles et al. (2008a, b) suggests that the onlyorganobromine degradation product to have a significant life-time against further reaction and to be produced in a sig-nificant fraction of the nPB input to the atmosphere is bro-moacetone, CH3C(O)CH2Br (abbreviated as BrAc below).The absorption cross sections and photolysis quantum yieldsfor BrAc of Burkholder et al. (2002) are used in this study.
The chloroalkenes PCE and TCE are expected to react inthe atmosphere primarily by addition of OH radical to theC=C double bond. The rate constants for these addition re-actions are taken as the high-pressure limit expressions fromthe JPL 2006 photochemical data evaluation by Sander etal. (2006):
k(PCE+OH) = 4.7×10⁻¹²exp(−990/T ) (2)
k(TCE+OH) = 8.00×10⁻¹³exp(300/T ) (3)
where the temperatureT is in K and rate constantsk are incm3 molec−1 s−1. The PCE + OH rate constant expressionin the IUPAC photochemical data evaluation (Atkinson et al.,2008) agrees with that in Sander et al. (2006) to within 6%for T of 200 to 300 K. The TCE + OH rate constant expres-sion from Atkinson et al. (2008) agrees with that given bySander et al. (2006) forT of 240 to 300 K; while the IUPACvalues are more than 10% higher for T below 240 K, this isnot expected to produce much difference in the TCE lifetimebecause limited amounts of TCE reach colder temperaturesin the upper troposphere (see Fig. 4a below).
Radicals produced by OH addition to PCE or TCE then arelikely to add O2, then react with NO to produce chlorinatedhydroxyalkoxy radicals. In this study, we have approximatedthe subsequent chemistry as release of all chlorine within onetime step. The chlorinated hydroxyalkoxy radicals are likelyto produce phosgene (CCl2O) for both TCE and PCE andchloroformaldehyde (CHClO) for TCE, which react furtherby both OH and photolysis under daytime conditions suitablefor oxidation of PCE or TCE.
2374 D. J. Wuebbles et al.: Model evaluation of nPB, TCE, and PCE Ozone Depletion Potentials
2.3 ODP from MOZART-3
We evaluate the atmospheric lifetimes and Ozone DepletionPotentials (ODPs) for the three compounds in the MOZART-3 CTM. A steady-state background atmosphere correspond-ing to the year 2000 was derived assuming fixed surfacemixing ratios for long-lived gases (such as nitrous oxide,methane, chlorofluorocarbons, and other halogenated sourcegases) and fixed emissions for short-lived gases. An ODPcalculation in an atmospheric CTM requires two perturba-tion runs for comparison to the CTM reference atmosphere:a CFC-11 (CFCl3, also known as trichlorofluoromethane)run and a run incorporating the compound under evalua-tion. The perturbations of CFC-11 or of the compound underevaluation are selected to give similar decreases in globally-averaged O3 that are less than one percent. Emissions ofnPB, TCE, and PCE were assumed to occur entirely on landat midlatitudes in the Northern Hemisphere, from 30◦ N to60◦ N (which corresponds to where the vast majority of cur-rent or future emissions are also expected to occur). In ad-dition, for nPB the atmospheric lifetime and ODP was de-termined assuming emissions evenly distributed over landglobally, from 60◦ S to 70◦ N. Each CTM perturbation is runto steady state, after which the change in total O3 burdenin the atmosphere and the flux of the substance causing theozone change are calculated for the CFC-11 run and for therun of the compound under study. The ODPs calculated inthis study use the global total O3 burden loss because O3absorbs harmful solar ultraviolet radiation whether or not itis located in the stratosphere; we do not attempt to separateODP into tropospheric and stratospheric components, thoughwe do note the fraction of O3 burden loss that occurs in thetroposphere for nPB, TCE, and PCE below.
The CFC-11 perturbation used in MOZART-3 for thisstudy is an increase of the fixed surface mixing ratio by80 ppt. This perturbation required 10 years of model timeto reach a steady state global O3 burden loss of−0.594%.The change in CFC-11 loss rate due to that perturbation is0.0335 Tg yr−1, which equals the increase of CFC-11 flux atthe surface in the model. nPB, TCE, and PCE fluxes added tothe model in this study are chosen to provide global O3 bur-den losses less than 1% and similar, ideally to within a fac-tor of two, to 0.594% as obtained for CFC-11; these fluxesare not intended to represent historic, current, or likely fu-ture emissions of any of these compounds. We ran all of themodel calculations on the same compute platform in order toavoid possible portability issues.
3 Results
This study considers three VSLSs with a variety of surfacefluxes introduced into the MOZART-3 CTM and a signifi-cant range of atmospheric lifetimes. In order to enable com-parison among these results, we sought to present them on a
common basis in the figures that follow. ODP is a measureof relative decrease in global O3 burden, so that we select1% decrease in global O3 burden arising from each VSLSscenario as that common basis. Because the O3 burden lossis expected to be proportional to the flux of each VSLS andto the increase in Cly or Bry resulting from addition of thatVSLS to MOZART-3, we divide each model output (annual-and zonal-average VSLS mixing ratios, Cly or Bry mixingratio perturbations, percent changes in O3 mixing ratio, andBrAc mixing ratios for nPB as the VSLS) presented in thefigures below by the total global O3 burden loss averagedover the year for that VSLS as calculated in MOZART-3.We refer to these values from MOZART-3 divided by globalO3 burden loss by the phrase “per 1% O3 burden loss” in thisdiscussion.
3.1 nPB
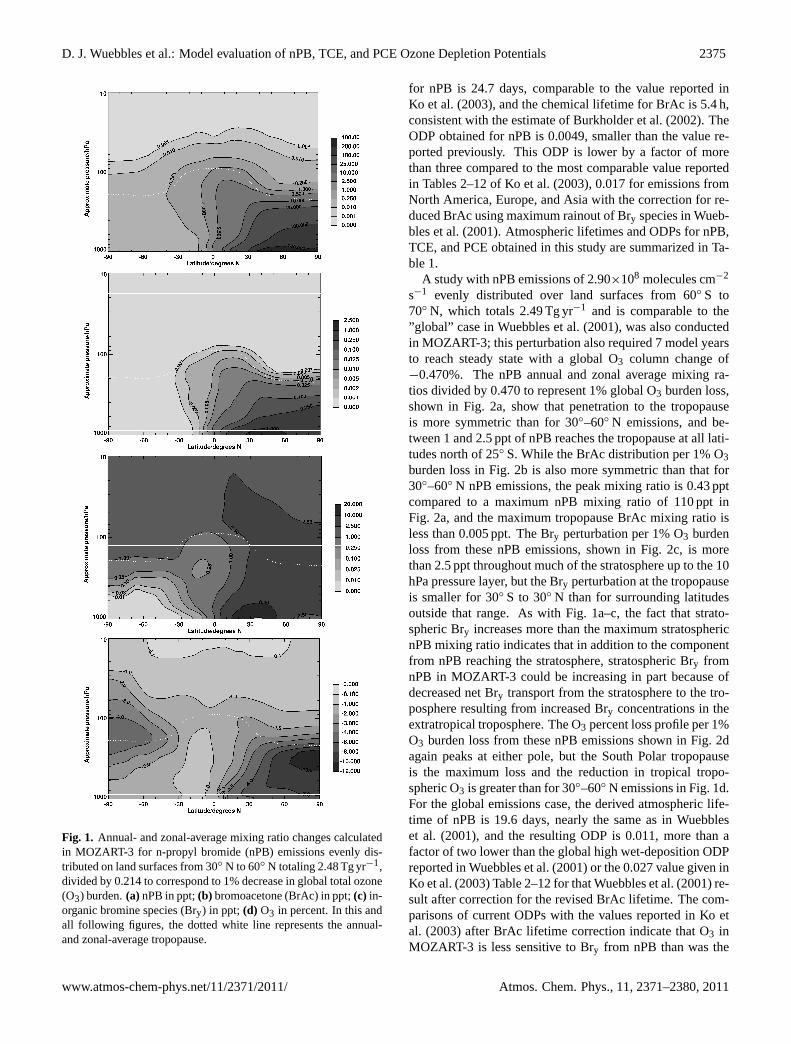
The nPB flux used to illustrate industrial use is a rateof 8.64×10⁸ molecules cm−2 s−1 from all land at latitudes30◦ N to 60◦ N, for a total nPB emission rate of 2.48 Tg yr−1.That flux required 7 model years to reach steady state andresulted in a global O3 burden decrease of 0.214%, of which0.123% was above the tropopause. Figure 1 shows the de-rived annual and zonal average distribution of nPB, the corre-sponding distribution of BrAc and change in Bry, and the re-sulting change in the distribution of tropospheric and strato-spheric O3 divided by the 0.214% decrease in global O3 bur-den. In each part of this and subsequent figures, the dot-ted white line indicates the average pressure level of theMOZART tropopause. The nPB mixing ratio per 1% O3burden loss in Fig. 1a peaks at the emissions region withlittle reaching the Southern Hemisphere, and no more than10 ppt, or 2% of the 349 ppt maximum mixing ratio, reachesthe tropopause. The potential product gas injection BrAcmixing ratio per 1% O3 burden loss peaks at 2.1 ppt nearthe surface in Fig. 1b, and its maximum mixing ratio at thetropopause is less than 0.02 ppt. However, the Bry pertur-bation per 1% O3 burden loss in the Northern Hemisphereexceeds 2.5 ppt for much of the lower stratosphere, as shownin Fig. 1c. The stratospheric Bry perturbation in excess ofnPB mixing ratios at the tropopause suggests that Bry in thestratosphere is increased by some means besides the nPB thatreaches the stratosphere. The minimum Bry perturbation inthe tropics suggests that the remainder of the stratosphericBry perturbation could be due to a decrease in the net Brytransport from the stratosphere to the troposphere caused bythe Bry increase in the Northern troposphere. nPB increasesBry by at least 1 ppt everywhere in and above the MOZARTstratosphere, and the O3 perturbation percentage per 1% O3burden loss in Fig. 1d includes both a peak in the Northernpolar upper troposphere and a secondary maximum near theSouth Polar tropopause with minimal O3 loss in the tropicsaround 10 hPa. The atmospheric chemical lifetime obtained
D. J. Wuebbles et al.: Model evaluation of nPB, TCE, and PCE Ozone Depletion Potentials 2375
17
Figure 1a 668
669
18
Figure 1b 670
671
19
Figure 1c 672
673
20
Figure 1d 674
675 Figure 1. Annual- and zonal-average mixing ratio changes calculated in MOZART-3 for 676 n-propyl bromide (nPB) emissions evenly distributed on land surfaces from 30°N to 677 60°N totaling 2.48 Tg yr
-1, divided by 0.214 to correspond to 1% decrease in global total 678
ozone (O3) burden. (a) nPB in ppt; (b) bromoacetone (BrAc) in ppt; (c) inorganic 679 bromine species (Bry) in ppt; (d) O3 in percent. In this and all following figures, the 680 dotted white line represents the annual- and zonal-average tropopause. 681 682
Fig. 1. Annual- and zonal-average mixing ratio changes calculatedin MOZART-3 for n-propyl bromide (nPB) emissions evenly dis-tributed on land surfaces from 30◦ N to 60◦ N totaling 2.48 Tg yr−1,divided by 0.214 to correspond to 1% decrease in global total ozone(O3) burden.(a) nPB in ppt;(b) bromoacetone (BrAc) in ppt;(c) in-organic bromine species (Bry) in ppt; (d) O3 in percent. In this andall following figures, the dotted white line represents the annual-and zonal-average tropopause.
for nPB is 24.7 days, comparable to the value reported inKo et al. (2003), and the chemical lifetime for BrAc is 5.4 h,consistent with the estimate of Burkholder et al. (2002). TheODP obtained for nPB is 0.0049, smaller than the value re-ported previously. This ODP is lower by a factor of morethan three compared to the most comparable value reportedin Tables 2–12 of Ko et al. (2003), 0.017 for emissions fromNorth America, Europe, and Asia with the correction for re-duced BrAc using maximum rainout of Bry species in Wueb-bles et al. (2001). Atmospheric lifetimes and ODPs for nPB,TCE, and PCE obtained in this study are summarized in Ta-ble 1.
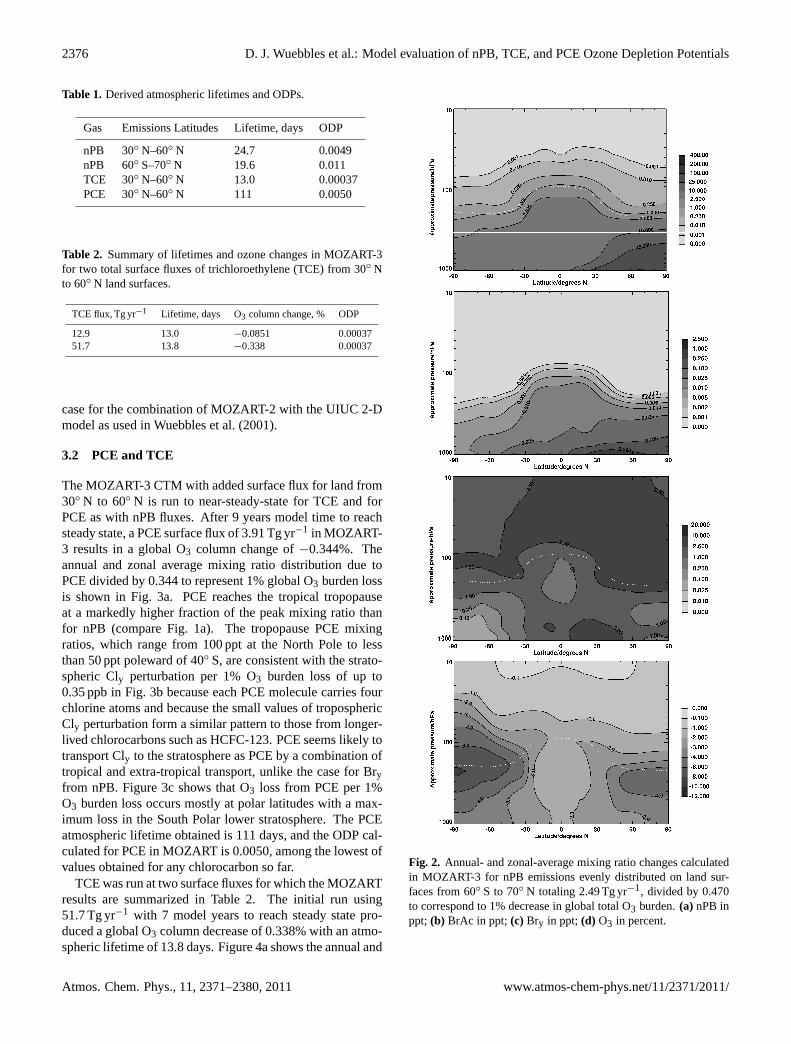
A study with nPB emissions of 2.90×10⁸ molecules cm−2
s−1 evenly distributed over land surfaces from 60◦ S to70◦ N, which totals 2.49 Tg yr−1 and is comparable to the”global” case in Wuebbles et al. (2001), was also conductedin MOZART-3; this perturbation also required 7 model yearsto reach steady state with a global O3 column change of−0.470%. The nPB annual and zonal average mixing ra-tios divided by 0.470 to represent 1% global O3 burden loss,shown in Fig. 2a, show that penetration to the tropopauseis more symmetric than for 30◦–60◦ N emissions, and be-tween 1 and 2.5 ppt of nPB reaches the tropopause at all lati-tudes north of 25◦ S. While the BrAc distribution per 1% O3burden loss in Fig. 2b is also more symmetric than that for30◦–60◦ N nPB emissions, the peak mixing ratio is 0.43 pptcompared to a maximum nPB mixing ratio of 110 ppt inFig. 2a, and the maximum tropopause BrAc mixing ratio isless than 0.005 ppt. The Bry perturbation per 1% O3 burdenloss from these nPB emissions, shown in Fig. 2c, is morethan 2.5 ppt throughout much of the stratosphere up to the 10hPa pressure layer, but the Bry perturbation at the tropopauseis smaller for 30◦ S to 30◦ N than for surrounding latitudesoutside that range. As with Fig. 1a–c, the fact that strato-spheric Bry increases more than the maximum stratosphericnPB mixing ratio indicates that in addition to the componentfrom nPB reaching the stratosphere, stratospheric Bry fromnPB in MOZART-3 could be increasing in part because ofdecreased net Bry transport from the stratosphere to the tro-posphere resulting from increased Bry concentrations in theextratropical troposphere. The O3 percent loss profile per 1%O3 burden loss from these nPB emissions shown in Fig. 2dagain peaks at either pole, but the South Polar tropopauseis the maximum loss and the reduction in tropical tropo-spheric O3 is greater than for 30◦–60◦ N emissions in Fig. 1d.For the global emissions case, the derived atmospheric life-time of nPB is 19.6 days, nearly the same as in Wuebbleset al. (2001), and the resulting ODP is 0.011, more than afactor of two lower than the global high wet-deposition ODPreported in Wuebbles et al. (2001) or the 0.027 value given inKo et al. (2003) Table 2–12 for that Wuebbles et al. (2001) re-sult after correction for the revised BrAc lifetime. The com-parisons of current ODPs with the values reported in Ko etal. (2003) after BrAc lifetime correction indicate that O3 inMOZART-3 is less sensitive to Bry from nPB than was the
case for the combination of MOZART-2 with the UIUC 2-Dmodel as used in Wuebbles et al. (2001).
3.2 PCE and TCE
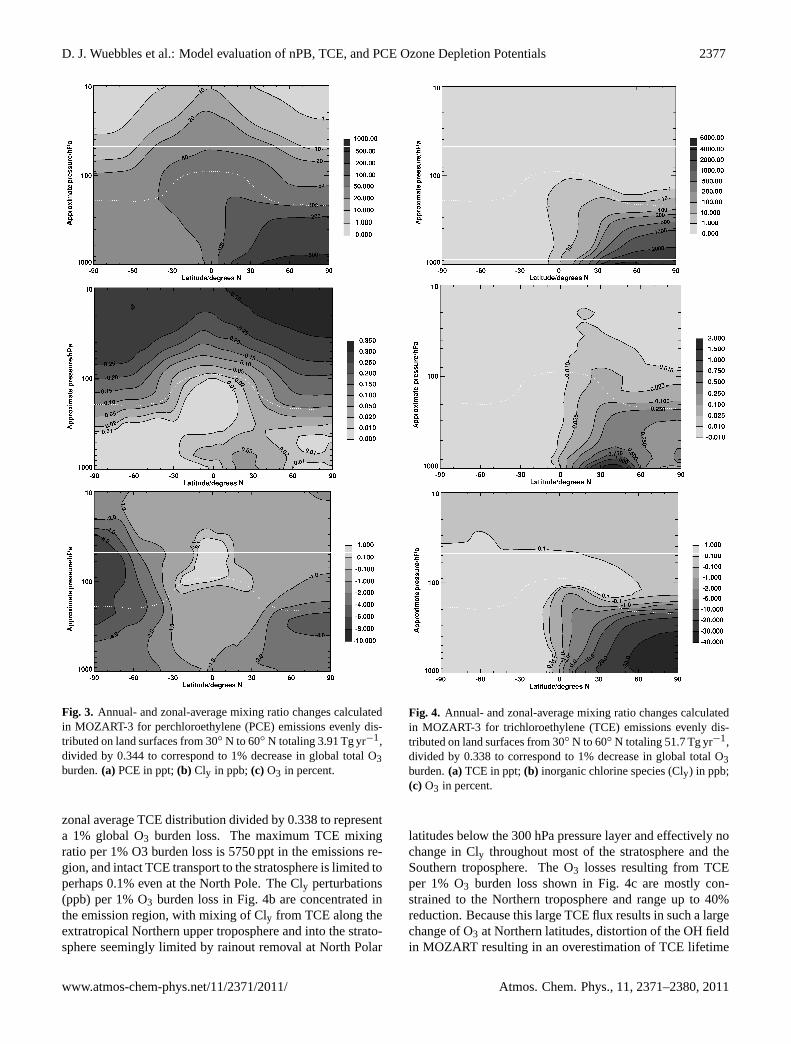
The MOZART-3 CTM with added surface flux for land from30◦ N to 60◦ N is run to near-steady-state for TCE and forPCE as with nPB fluxes. After 9 years model time to reachsteady state, a PCE surface flux of 3.91 Tg yr−1 in MOZART-3 results in a global O3 column change of−0.344%. Theannual and zonal average mixing ratio distribution due toPCE divided by 0.344 to represent 1% global O3 burden lossis shown in Fig. 3a. PCE reaches the tropical tropopauseat a markedly higher fraction of the peak mixing ratio thanfor nPB (compare Fig. 1a). The tropopause PCE mixingratios, which range from 100 ppt at the North Pole to lessthan 50 ppt poleward of 40◦ S, are consistent with the strato-spheric Cly perturbation per 1% O3 burden loss of up to0.35 ppb in Fig. 3b because each PCE molecule carries fourchlorine atoms and because the small values of troposphericCly perturbation form a similar pattern to those from longer-lived chlorocarbons such as HCFC-123. PCE seems likely totransport Cly to the stratosphere as PCE by a combination oftropical and extra-tropical transport, unlike the case for Bryfrom nPB. Figure 3c shows that O3 loss from PCE per 1%O3 burden loss occurs mostly at polar latitudes with a max-imum loss in the South Polar lower stratosphere. The PCEatmospheric lifetime obtained is 111 days, and the ODP cal-culated for PCE in MOZART is 0.0050, among the lowest ofvalues obtained for any chlorocarbon so far.
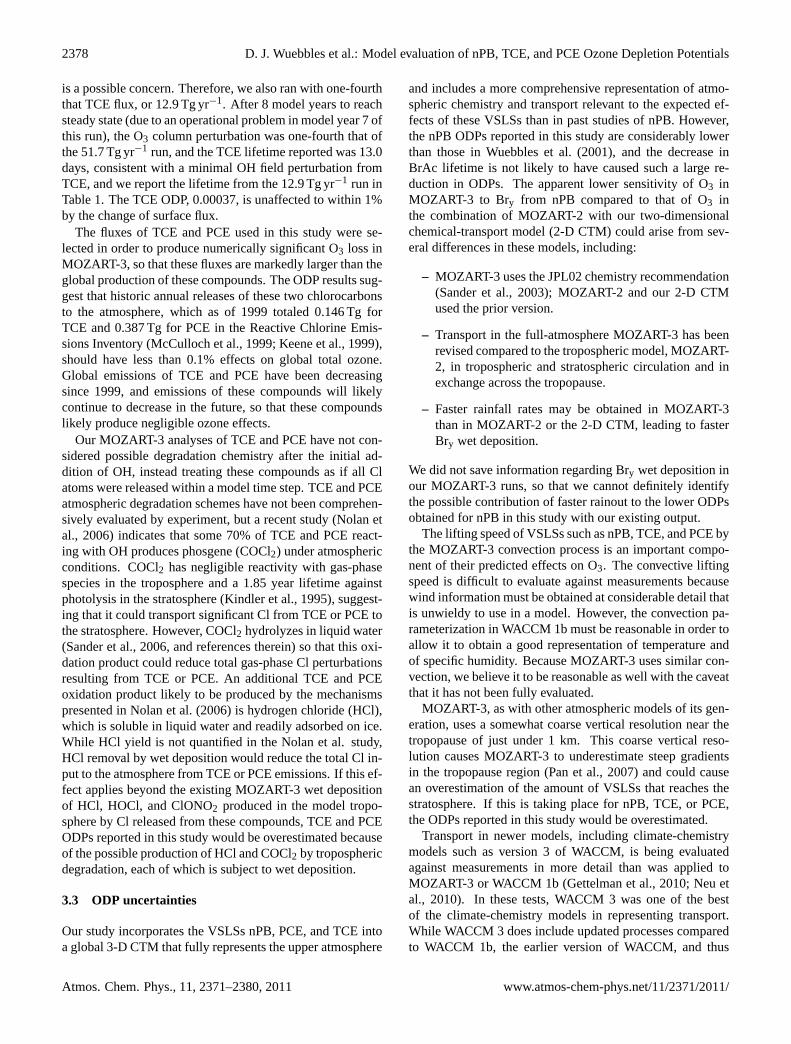
TCE was run at two surface fluxes for which the MOZARTresults are summarized in Table 2. The initial run using51.7 Tg yr−1 with 7 model years to reach steady state pro-duced a global O3 column decrease of 0.338% with an atmo-spheric lifetime of 13.8 days. Figure 4a shows the annual and
21
Figure 2a 683
684 685
22
Figure 2b 686
687 688
23
Figure 2c 689
690 691
24
Figure 2d 692
693 Figure 2. Annual- and zonal-average mixing ratio changes calculated in MOZART-3 for 694
nPB emissions evenly distributed on land surfaces from 60°S to 70°N totaling 2.49 Tg 695
yr-1
, divided by 0.470 to correspond to 1% decrease in global total O3 burden. (a) nPB in 696 ppt; (b) BrAc in ppt; (c) Bry in ppt; (d) O3 in percent. 697 698
Fig. 2. Annual- and zonal-average mixing ratio changes calculatedin MOZART-3 for nPB emissions evenly distributed on land sur-faces from 60◦ S to 70◦ N totaling 2.49 Tg yr−1, divided by 0.470to correspond to 1% decrease in global total O3 burden.(a) nPB inppt; (b) BrAc in ppt; (c) Bry in ppt; (d) O3 in percent.
D. J. Wuebbles et al.: Model evaluation of nPB, TCE, and PCE Ozone Depletion Potentials 2377
25
Figure 3a 699
700 701
26
Figure 3b 702
703 704
27
Figure 3c 705
706 Figure 3. Annual- and zonal-average mixing ratio changes calculated in MOZART-3 for 707 perchloroethylene (PCE) emissions evenly distributed on land surfaces from 30°N to 708 60°N totaling 3.91 Tg yr
-1, divided by 0.344 to correspond to 1% decrease in global total 709
O3 burden. (a) PCE in ppt; (b) Cly in ppb; (c) O3 in percent. 710
Fig. 3. Annual- and zonal-average mixing ratio changes calculatedin MOZART-3 for perchloroethylene (PCE) emissions evenly dis-tributed on land surfaces from 30◦ N to 60◦ N totaling 3.91 Tg yr−1,divided by 0.344 to correspond to 1% decrease in global total O3burden.(a) PCE in ppt;(b) Cly in ppb;(c) O3 in percent.
zonal average TCE distribution divided by 0.338 to representa 1% global O3 burden loss. The maximum TCE mixingratio per 1% O3 burden loss is 5750 ppt in the emissions re-gion, and intact TCE transport to the stratosphere is limited toperhaps 0.1% even at the North Pole. The Cly perturbations(ppb) per 1% O3 burden loss in Fig. 4b are concentrated inthe emission region, with mixing of Cly from TCE along theextratropical Northern upper troposphere and into the strato-sphere seemingly limited by rainout removal at North Polar
28
Figure 4a 711
712 713
29
Figure 4b 714
715 716
30
Figure 4c 717
718 Figure 4. Annual- and zonal-average mixing ratio changes calculated in MOZART-3 for 719 trichloroethylene (TCE) emissions evenly distributed on land surfaces from 30°N to 60°N 720 totaling 51.7 Tg yr
-1, divided by 0.338 to correspond to 1% decrease in global total O3 721
burden. (a) TCE in ppt; (b) inorganic chlorine species (Cly) in ppb; (c) O3 in percent. 722 723
Fig. 4. Annual- and zonal-average mixing ratio changes calculatedin MOZART-3 for trichloroethylene (TCE) emissions evenly dis-tributed on land surfaces from 30◦ N to 60◦ N totaling 51.7 Tg yr−1,divided by 0.338 to correspond to 1% decrease in global total O3burden.(a) TCE in ppt;(b) inorganic chlorine species (Cly) in ppb;(c) O3 in percent.
latitudes below the 300 hPa pressure layer and effectively nochange in Cly throughout most of the stratosphere and theSouthern troposphere. The O3 losses resulting from TCEper 1% O3 burden loss shown in Fig. 4c are mostly con-strained to the Northern troposphere and range up to 40%reduction. Because this large TCE flux results in such a largechange of O3 at Northern latitudes, distortion of the OH fieldin MOZART resulting in an overestimation of TCE lifetime
2378 D. J. Wuebbles et al.: Model evaluation of nPB, TCE, and PCE Ozone Depletion Potentials
is a possible concern. Therefore, we also ran with one-fourththat TCE flux, or 12.9 Tg yr−1. After 8 model years to reachsteady state (due to an operational problem in model year 7 ofthis run), the O3 column perturbation was one-fourth that ofthe 51.7 Tg yr−1 run, and the TCE lifetime reported was 13.0days, consistent with a minimal OH field perturbation fromTCE, and we report the lifetime from the 12.9 Tg yr−1 run inTable 1. The TCE ODP, 0.00037, is unaffected to within 1%by the change of surface flux.
The fluxes of TCE and PCE used in this study were se-lected in order to produce numerically significant O3 loss inMOZART-3, so that these fluxes are markedly larger than theglobal production of these compounds. The ODP results sug-gest that historic annual releases of these two chlorocarbonsto the atmosphere, which as of 1999 totaled 0.146 Tg forTCE and 0.387 Tg for PCE in the Reactive Chlorine Emis-sions Inventory (McCulloch et al., 1999; Keene et al., 1999),should have less than 0.1% effects on global total ozone.Global emissions of TCE and PCE have been decreasingsince 1999, and emissions of these compounds will likelycontinue to decrease in the future, so that these compoundslikely produce negligible ozone effects.
Our MOZART-3 analyses of TCE and PCE have not con-sidered possible degradation chemistry after the initial ad-dition of OH, instead treating these compounds as if all Clatoms were released within a model time step. TCE and PCEatmospheric degradation schemes have not been comprehen-sively evaluated by experiment, but a recent study (Nolan etal., 2006) indicates that some 70% of TCE and PCE react-ing with OH produces phosgene (COCl2) under atmosphericconditions. COCl2 has negligible reactivity with gas-phasespecies in the troposphere and a 1.85 year lifetime againstphotolysis in the stratosphere (Kindler et al., 1995), suggest-ing that it could transport significant Cl from TCE or PCE tothe stratosphere. However, COCl2 hydrolyzes in liquid water(Sander et al., 2006, and references therein) so that this oxi-dation product could reduce total gas-phase Cl perturbationsresulting from TCE or PCE. An additional TCE and PCEoxidation product likely to be produced by the mechanismspresented in Nolan et al. (2006) is hydrogen chloride (HCl),which is soluble in liquid water and readily adsorbed on ice.While HCl yield is not quantified in the Nolan et al. study,HCl removal by wet deposition would reduce the total Cl in-put to the atmosphere from TCE or PCE emissions. If this ef-fect applies beyond the existing MOZART-3 wet depositionof HCl, HOCl, and ClONO2 produced in the model tropo-sphere by Cl released from these compounds, TCE and PCEODPs reported in this study would be overestimated becauseof the possible production of HCl and COCl2 by troposphericdegradation, each of which is subject to wet deposition.
3.3 ODP uncertainties
Our study incorporates the VSLSs nPB, PCE, and TCE intoa global 3-D CTM that fully represents the upper atmosphere
and includes a more comprehensive representation of atmo-spheric chemistry and transport relevant to the expected ef-fects of these VSLSs than in past studies of nPB. However,the nPB ODPs reported in this study are considerably lowerthan those in Wuebbles et al. (2001), and the decrease inBrAc lifetime is not likely to have caused such a large re-duction in ODPs. The apparent lower sensitivity of O3 inMOZART-3 to Bry from nPB compared to that of O3 inthe combination of MOZART-2 with our two-dimensionalchemical-transport model (2-D CTM) could arise from sev-eral differences in these models, including:
– MOZART-3 uses the JPL02 chemistry recommendation(Sander et al., 2003); MOZART-2 and our 2-D CTMused the prior version.
– Transport in the full-atmosphere MOZART-3 has beenrevised compared to the tropospheric model, MOZART-2, in tropospheric and stratospheric circulation and inexchange across the tropopause.
– Faster rainfall rates may be obtained in MOZART-3than in MOZART-2 or the 2-D CTM, leading to fasterBry wet deposition.
We did not save information regarding Bry wet deposition inour MOZART-3 runs, so that we cannot definitely identifythe possible contribution of faster rainout to the lower ODPsobtained for nPB in this study with our existing output.
The lifting speed of VSLSs such as nPB, TCE, and PCE bythe MOZART-3 convection process is an important compo-nent of their predicted effects on O3. The convective liftingspeed is difficult to evaluate against measurements becausewind information must be obtained at considerable detail thatis unwieldy to use in a model. However, the convection pa-rameterization in WACCM 1b must be reasonable in order toallow it to obtain a good representation of temperature andof specific humidity. Because MOZART-3 uses similar con-vection, we believe it to be reasonable as well with the caveatthat it has not been fully evaluated.
MOZART-3, as with other atmospheric models of its gen-eration, uses a somewhat coarse vertical resolution near thetropopause of just under 1 km. This coarse vertical reso-lution causes MOZART-3 to underestimate steep gradientsin the tropopause region (Pan et al., 2007) and could causean overestimation of the amount of VSLSs that reaches thestratosphere. If this is taking place for nPB, TCE, or PCE,the ODPs reported in this study would be overestimated.
Transport in newer models, including climate-chemistrymodels such as version 3 of WACCM, is being evaluatedagainst measurements in more detail than was applied toMOZART-3 or WACCM 1b (Gettelman et al., 2010; Neu etal., 2010). In these tests, WACCM 3 was one of the bestof the climate-chemistry models in representing transport.While WACCM 3 does include updated processes comparedto WACCM 1b, the earlier version of WACCM, and thus
D. J. Wuebbles et al.: Model evaluation of nPB, TCE, and PCE Ozone Depletion Potentials 2379
MOZART-3 when driven with its meteorology, is likely tohave represented atmospheric processing of VSLSs as wellas any model of their generation. Transport is nonethelesslikely to be one of the most significant components of un-certainty in the ODPs derived in this study, and those valuesshould be taken as uncertain by at least 10% to 25%.
4 Summary
We have calculated atmospheric lifetimes and Ozone De-pletion Potentials (ODPs) for the currently-used compoundstrichloroethylene (TCE) and perchloroethylene (PCE) andthe proposed replacement compound n-propyl bromide(nPB) in the MOZART-3 chemical-transport model of theglobal atmosphere. Unlike previous studies of nPB in partic-ular, MOZART-3 represents the upper atmosphere fully andincludes detailed chemical and transport processes, whichleads to a more comprehensive prediction of the effects onozone to be expected from these gases. For emissions of nPBfrom all land surfaces between 30◦ N and 60◦ N, we obtaina lifetime of 24.7 days and an ODP of 0.0049. Emissions ofnPB from all land between 60◦ S and 70◦ N result in a life-time of 19.6 days and an ODP of 0.011. These are among thelowest ODPs obtained for a compound containing bromine inour studies so far, and the nPB ODP is lower than obtainedin past studies. For PCE emissions from all land surfaces be-tween 30◦ N and 60◦ N, the atmospheric lifetime is 111 daysand the ODP is 0.0050, and for TCE emissions from landfrom 30◦ N to 60◦ N, the lifetime is 13.0 days and the ODPis 0.00037. Neither nPB nor TCE are predicted to reach thestratosphere in large quantity to release bromine or chlorinedirectly, but significant PCE does reach the stratosphere in-tact to release chlorine.
Acknowledgements.This research was supported in part by theAlbemarle Corporation, by Enviro Tech International, Inc. and bythe US Environmental Protection Agency. The views expressed arethose of the authors and need not reflect those of the sponsoringorganizations. We thank Michael Danilin of Boeing Company forhis help in discovering erroneous ODP calculations in an earliermanuscript of this article, and we thank James Franklin and threeanonymous referees for their comments. The authors gratefullyacknowledge the financial support given by the US Departmentof Energy, Global Change Education Program-Graduate ResearchEnvironmental Fellowship to Monica Martınez-Aviles.
Edited by: P. Haynes
References
Atkinson, R., Baulch, D. L., Cox, R. A., Crowley, J. N., Hamp-son, R. F., Hynes, R. G., Jenkin, M. E., Rossi, M. J., and Troe,J.: Evaluated kinetic and photochemical data for atmosphericchemistry: Volume IV – gas phase reactions of organic halogenspecies, Atmos. Chem. Phys., 8, 4141–4496,doi:10.5194/acp-8-4141-2008, 2008.
Bridgeman, C. H., Pyle, J. A., and Shallcross, D. E.: A three-dimensional model calculation of the ozone depletion potentialof 1-bromopropane (1-C3H7Br), J. Geophys. Res., 105, 26493–26502, 2000.
Burkholder, J. B., Gilles, M. K., Gierczak, T., and Ravis-hankara, A. R.: The atmospheric degradation of 1-bromopropane(CH3CH2CH2Br): The chemistry of bromoacetone, Geophys.Res. Lett., 29, 1822–1825,doi:10.1029/2002GL014712, 2002.
Gettelman, A., Hegglin, M. I., Son, S.-W., Fujiwara, M., Tilmes,S., Pan, L., Hoor, P., Lee, H., Manney, G. L., Birner, T.,Stiller, G., Rex, M., Kremser, S., Wuebbles, D., Walker, K. A.,and Anel, J. A.: Upper Troposphere and Lower Stratosphere,Stratospheric Processes And Their Role in Climate (SPARC)Report on the Evaluation of Chemistry-Climate Models, editedby Eyring, V., Shepherd, T. G., and Waugh, D. W., World Me-teorological Organization, SPARC Report No. 5, WCRP-132,WMO/TD-No. 1526, chapter 7, 253–304, available online at:http://www.atmosp.physics.utoronto.ca/SPARC, June 2010.
Gilles, M. K., Burkholder, J. B., Gierczak, T., Marshall, P., and Rav-ishankara, A. R.: Rate coefficient and product branching mea-surements for the Reaction OH + Bromopropane from 230 to360 K, J. Phys. Chem. A, 106, 5358–5366, 2002.
Horowitz, L., Walters, S., Mauzerall, D., Emmons, L., Rasch,P., Granier, C., Tie, X., Lamarque, J.-F., Schultz, M., Tyn-dall, G., Orlando, J., and Brasseur, G. P.: Global simulation oftropospheric ozone and related tracers: Description and eval-uation of MOZART, version 2, J. Geophys. Res., 108, 4784,doi:10.1029/2002JD002853, 2003.
Keene, W. C., Khalil, M. A. K., Erickson III, D. J., McCulloch,A., Graedel, T. E., Lobert, J. M., Aucott, M. L., Gong, S. L.,Harper, D. B., Kleiman, G., Midgley, P., Moore, R. M., Seuzaret,C., Sturges, W. T., Benkovitz, C. M., Koropalov, V., Barrie, L.,A., and Li, Y. F.: Composite global emissions of reactive chlo-rine from anthropogenic and natural sources: Reactive ChlorineEmissions Inventory, J. Geophys. Res., 104, 8429–8440, 1999.
Kindler, T. P., Chameides, W. L., Wine, P. H., Cunnold, D. M.,Alyea, F. N., and Franklin, J. A.: The fate of atmospheric phos-gene and the stratospheric loadings of its parent compounds:CCl4, C2Cl4, C2HCl3, CH3CCl3, and CHCl3, J. Geophys. Res.,100, 1235–1251, 1995.
Kinnison, D. E., Brasseur, G. P., Walters, S., Garcia, R. R.,Marsh, D. R., Sassi, F., Harvey, V. L., Randall, C. E., Em-mons, L., Lamarque, J.-F., Hess, P., Orlando, J. J., Tie, X.X., Randel, W., Pan, L. L., Gettelman, A., Granier, C., Diehl,T., Niemeier, U., and Simmons, A. J.: Sensitivity of chem-ical tracers to meteorological parameters in the MOZART-3Chemical Transport Model, J. Geophys. Res., 112, D20302,doi:10.1029/2006JD007879, 2007.
Ko, M. K. W., Poulet, G., Blake, D. R., Boucher, O., Burkholder,J. H., Chin, M., Cox, R. A., George, C., Graf, H.-F., Holton, J.R., Jacob, D. J., Law, K. S., Lawrence, M. G., Midgley, P. M.,Seakins, P. W., Shallcross, D. E., Strahan, S. E., Wuebbles, D. J.,
2380 D. J. Wuebbles et al.: Model evaluation of nPB, TCE, and PCE Ozone Depletion Potentials
Yokouchi, Y., and contributors: Very Short-Lived Halogen andSulfur Substances, Scientific Assessment of Ozone Depletion:2002, World Meteorological Organization Global Ozone Re-search and Monitoring Project – Report No. 47, Geneva, Switzer-land, 2.1–2.57, 2003.
Law, K. S., Sturges, W. T., Blake, D. R., Blake, N. J., Burkholder, J.B., Butler, J. H., Cox, R. A., Haynes, P. H., Ko, M. K. W., Kre-her, K., Mari, C., Pfeilsticker, K., Plane, J. M. C., Salawitch, R.J., Schiller, C., Sinnhuber, B.-M., von Glasow, R., Warwick, N.J., Wuebbles, D. J., Yvon-Lewis, S. A., and contributors: Halo-genated Very Short-Lived Substances, Scientific Assessment ofOzone Depletion: 2006, WMO (World Meteorological Organi-zation) Global Ozone Research and Monitoring Project – ReportNo. 50, Geneva, Switzerland, 2.1–2.57, 2007.
Martınez-Aviles, M., Rosado-Reyes, C. M., and Francisco,J. S.: Hydroxyl-radical-initiated oxidation mechanismof bromopropane, J. Phys. Chem. A, 112, 7930–7938,doi:10.1021/jp8034506, 2008a.
Martınez-Aviles, M., Yang, S., and Francisco, J. S.: Struc-ture and vibrational spectra of bromine reservoir species fromthe atmospheric oxidations of bromoethane and bromopropane,Mol. Phys., 106, 2299–2314,doi:10.1080/00268970701798929,2008b.
McCulloch, A., Aucott, M. L., Graedel, T. E.., Kleiman, G., Midg-ley, P. M., and Li, Y.-F.: Industrial emissions of trichloroethene,tetrachloroethene, and dichloromethane: Reactive ChlorineEmissions Inventory, J. Geophys. Res., 104, 8417–8427, 1999.
Neu, J., Strahan, S., Braesicke, P., Douglass, A., Huck, P., Oman,L., Pendlebury, D., and Tegtmeier, S.: Transport, StratosphericProcesses And Their Role in Climate (SPARC) Report on theEvaluation of Chemistry-Climate Models, edited by Eyring, V.,Shepherd, T. G., and Waugh, D. W., World MeteorologicalOrganization, SPARC Report No. 5, WCRP-132, WMO/TD-No. 1526, chapter 5, 149–190, available online at:http://www.atmosp.physics.utoronto.ca/SPARC, June 2010.
Nolan, L., Guihur, A.-L., Manning, M., and Sidebottom, H.:Atmospheric oxidation of the chlorinated solvents, 1,1,1-Trichloroethane, Trichloroethene and Tetrachloroethene, in En-vironmental Simulation Chambers: Application to AtmosphericChemical Processes, edited by: Barnes, I. and Rudzinski, K. J.,Springer, The Netherlands, 171–179,doi:10.1007/1-4020-4232-9, 2006.
Office of Environmental Health Hazard Assessment (OEHHA):Acute Toxicity Summary: Perchloroethylene, State of California(USA) OEHHA, 5 pp., available online at:http://oehha.ca.gov/air/acuterels/pdf/127184A.pdf, last access: 20 July 2010, 1999.
Office of Environmental Health Hazard Assessment (OEHHA):Chronic Toxicity Summary: Trichloroethylene, State of Cali-fornia (USA) OEHHA, 8 pp., available online at:http://oehha.ca.gov/air/chronicrels/pdf/79016.pdf, last access: 20 July 2010,2000.
Olsen, S. C., Hannegan, B. J., Zhu, X., and Prather, M. J.: Evaluat-ing ozone depletion from very short-lived halocarbons, Geophys.Res. Lett., 27, 1475–1478, 2000.
Pan, L. L., Wei, J. C., Kinnison, D. E., Garcia, R. R., Wuebbles,D. J., and Brasseur, G. P.: A set of diagnostics for evaluatingchemistry-climate models in the extratropical tropopause region,J. Geophys. Res., 112, D09316,doi:10.1029/2006JD007792,2007.
Sander, S. P., Friedl, R. R., Golden, D. M., Kurylo, M. J., Huie,R. E., Orkin, V. L., Moortgat, G. K., Ravishankara, A. R., Kolb,C. E., Molina, M. J., and Finlayson-Pitts, B. J.: Chemical Ki-netics and Photochemical Data for Use in Atmospheric Studies.NASA/JPL Data Evaluation, JPL Publication 02-25 EvaluationNo. 14, NASA, Pasadena, California, USA, available online at:http://jpldataeval.jpl.nasa.gov/, 2003.
Sander, S. P., Friedl, R. R., Golden, D. M., Kurylo, M. J., Moort-gat, G. K., Keller-Rudek, H., Wine, P. H., Ravishankara, A. R.,Kolb, C. E., Molina, M. J., Finlayson-Pitts, B. J., Huie, R. E.,and Orkin, V. L.: Chemical Kinetics and Photochemical Data forUse in Atmospheric Studies, Evaluation Number 15, JPL Pub-lication 06-2, NASA Panel for Data Evaluation, Jet PropulsionLaboratory, California Institute of Technology, Pasadena, Cali-fornia, USA, available online at:http://jpldataeval.jpl.nasa.gov/,2006.
Sassi, F., Kinnison, D., Boville, B. A., Garcia, R. R., and Roble, R.:Effect of El Nino-Southern Oscillation on the dynamical, ther-mal, and chemical structure of the middle atmosphere, J. Geo-phys. Res., 109, D17108,doi:10.1029/2003JD004434, 2004.
Solomon, S., Mills, M., Heidt, L. E., Pollock, W. H., and Tuck, A.F.: On the evaluation of ozone depletion potentials, J. Geophys.Res., 97, 824–842, 1992.
Wei, C.-F., Kotamarthi, V. R., Ogunsola, O. J., Horowitz, L.W., Walters, S., Wuebbles, D. J.., Avery, M. A., Blake, D.R., Browell, E. V., and Sachse, G. W.: Seasonal variabilityof ozone mixing ratios and budgets in the tropical southernPacific: A GCTM perspective, J. Geophys. Res., 107, 8235,doi:10.1029/2001JD000772, 2003.
Wuebbles, D. J.: The Relative Efficiency of a Number of Halocar-bons for Destroying Ozone, Lawrence Livermore National Labo-ratory Report UCID-18924, Livermore, California, USA, 11 pp.,1981.
Wuebbles, D. J.: Chlorocarbon emission scenarios: potential im-pact on stratospheric ozone, J. Geophys. Res., 88, 1433–1443,1983.
Wuebbles, D. J., and Ko, M. K. W.: Summary of EPA/NASAWorkshop on the Stratospheric Impacts of Short-Lived Gases,30–31 March, Washington, D.C., available through the US Envi-ronmental Protection Agency, Stratospheric Protection Division,Washington, DC, USA, 1999.
Wuebbles, D. J., Kotamarthi, R., and Patten, K. O.: Updated eval-uation of Ozone Depletion Potentials for Chlorobromomethane(CH2ClBr) and 1-bromo-propane (CH2BrCH2CH3), Atmos. En-viron., 33, 1641–1643, 1999.
Wuebbles, D. J., Patten, K. O., Johnson, M. T., and Kotamarthi, R.:New methodology for Ozone Depletion Potentials of short-livedcompounds: n-Propyl bromide as an example, J. Geophys. Res.,106, 14551–14771, 2001.