45
Three years into a Periodical Use Study CIUG October 2001 Jill Ellern Western Carolina University
| Date post: | 28-Dec-2015 |
| Category: |
Documents |
| Upload: | claribel-green |
| View: | 218 times |
| Download: | 0 times |

Three years into a Periodical Use Study
CIUGOctober 2001
Jill Ellern
Western Carolina University

Outline• History and background of this
periodical use study
• How we are using Innopac and MSAccess to build a database
• A quick analysis of the data
• How we are using the data collected
• What’s next

Why Do a Use Study?
• Monitor the relevance of periodical collection– Is the collection meeting the needs of
students, faculty, community?
• Budgetary management concerns
• Detect trends unique to our institution
• Bolster credibility of our data

Traditional Questions
• titles receive no use or very low use – identifying possible candidates for
cancellation or alternative access
• titles receive use of only current issues– thus aiding retention decisions
• titles receive the most use– possible subject areas in need of strengthening
and protection from cancellation

Other Questions
• What are the effects of electronic databases on use of paper periodicals– Not so easy to deduce

Collection Development for Serials
• Collection development at WCU– 3-year cycle– Periodical review session with faculty– Cost and inflation info review process– Course review process– Network holdings
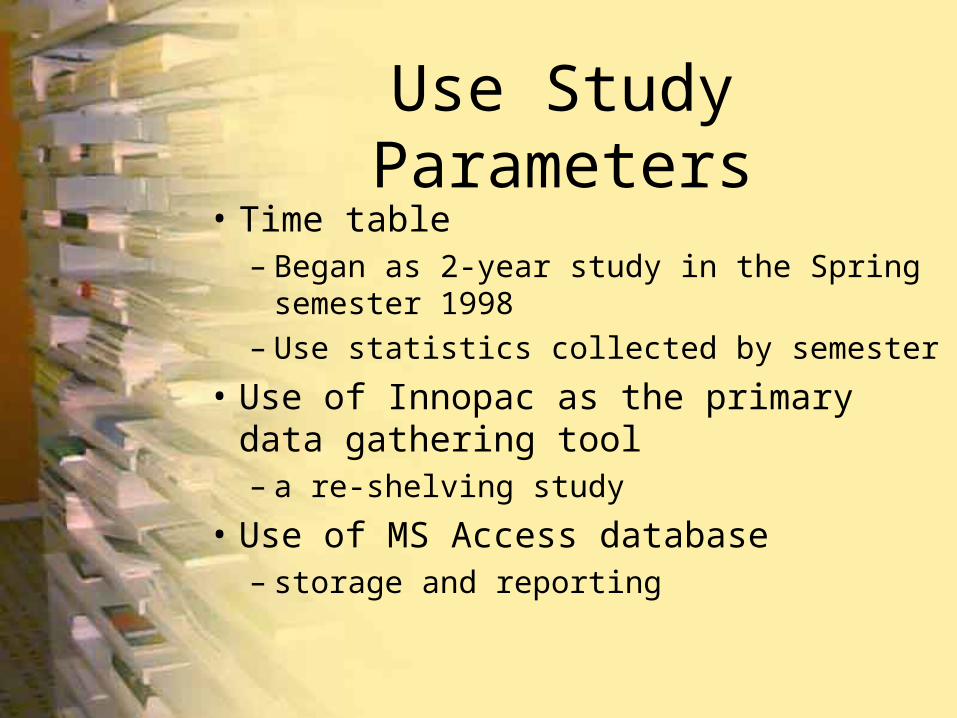
Use Study Parameters• Time table
– Began as 2-year study in the Spring semester 1998
– Use statistics collected by semester
• Use of Innopac as the primary data gathering tool– a re-shelving study
• Use of MS Access database – storage and reporting

Collection Group effort (life cycle of study)
• Cataloging and Serials (initial bar-coding)
• Circulation (daily data collection)
• Serials (semester download from III)
• Systems (semester upload to Access)
• Cataloging (semester reset of count data)
• Collection development, Serials, Systems– Analyzing of the data results– Reports

Initial Bar-coding ProjectWork of Cataloging and Serial Units
• Creation of Item Records– One for each bound item– Current unbound items given single item
record• Creation of a barcode file
• Began Spring ‘97– took about a year to complete

Work of Circulation Unit• Daily data collection
– Material gathered from tables, etc. and taken to Circulation sorting area
– Each piece counted using the “Count IN-LIBRARY use” function
• Card file for current unbound issues
– then material is re-shelved
• Became so much a part of staff routine they agreed to continue it indefinitely!

Work of Serials Unit
• At end of each semester– Creating the list– Extracting the data from Innopac
• Performing clean-up projects on Innopac and MS Access
• Come up with ideas for reports
• Help analyze the data

Work of Systems Unit
• At end of each semester– Clean up the data from Innopac– Import data into MS Access
• Create Reports – Creation of other tables/data– Moving data to other programs
• Maintain Data – Modify data structure as needed

Work of Cataloging Unit
• End of each semester– Reset counter field using rapid update
• Daily– Keeping up bibliographic data in Innopac– Reality check when we want more data

Creating a Collection Development Database
• Download or collect the data into a file
• Massage and clean up
• Import to MS Access or other DBMS
• Connect data elements in the software– Queries, data structure, relationships
• Create reports using data
• Adding other data or linking data

Types of Data Gathering
• Semester use data from Innopac
• Collecting other data from Innopac
• Collection development data– from campus info sources– from outside sources

Gathering Use Data from Innopac
(Done at the end of each Semester)• Innopac’s canned statistics
– Problems (We stopped using it)• Consortium data mixed in
• Time data not available
• Does record the zero use titles
• Create a list of items– IUSE > zero and location is WCU’s– Data needed includes bib number, volume field,
IUSE and LOC fields from item record

Downloading Procedures
• Using IFTP from FileSave– Move it to a local PC using FTP software
• What data and how it’s formatted– Separate data by locations– All in one file

How the Data Looks from Innopac
RECORD # = b16940568.
v.8(1976).
INTL USE = 1. LOCATION = cpbgf.
RECORD # = b16940568.
v.14(1980).
INTL USE = 1. LOCATION = cpbgf.

How We Want Data to Look
b16940568 v.8(1976) 1 cpbgf Sp98
b16940568 v.14(1980) 1 cpbgf Sp98
Bnumber Volume Use Location Semester
• Tabs delimited

Massaging and Cleaning Up Data
• Retrieve into MS Word
• Search and replace
• Fix multi bib problems
• Add semester data
• Add field names to top of columns
• Save as text
• Retrieve into MS Excel
• Check then save as Excel worksheet
• Load into MS Access

Cleaning Up after Successfully Downloading
• Resetting IUSE to zero for all item records
• Deleting the many transfer files– On Innopac and locally
• Deleting create lists
• Backing up database

Collecting other Data from Innopac
• Cost/price information– Done yearly
• Department assignments
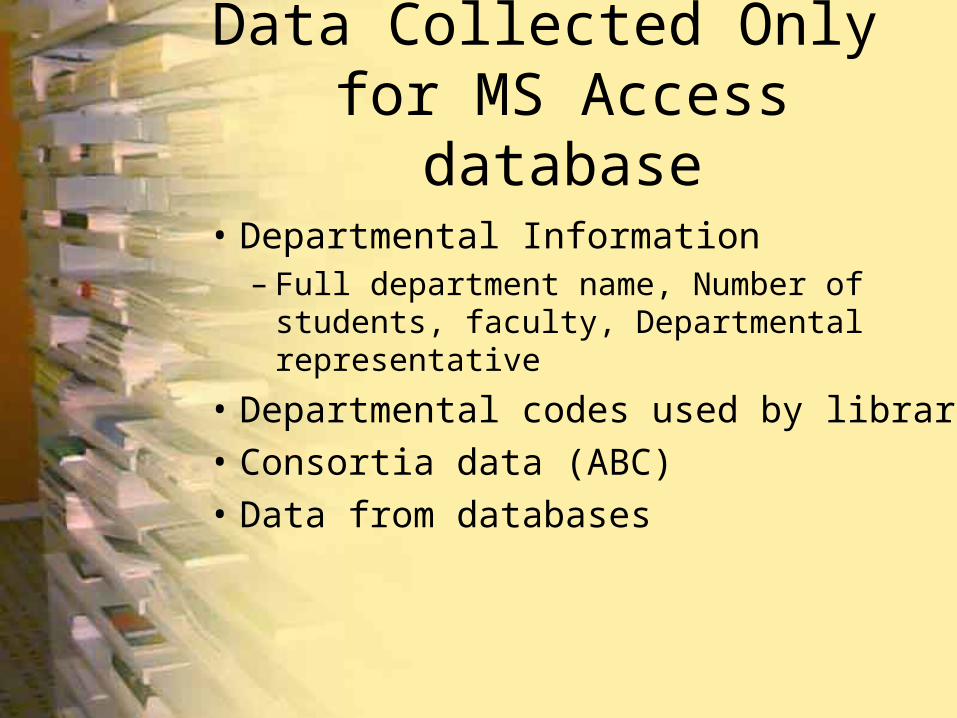
Data Collected Only for MS Access database
• Departmental Information– Full department name, Number of students,
faculty, Departmental representative
• Departmental codes used by library
• Consortia data (ABC)
• Data from databases

Major Tables in MS Access
• Title
• Use
• Price
• Department assignments • Department info (Department code key)
• Combo Price

Major Indexing of MS Access
• Most tables are indexed by the Innopac bnumber – That is the bibliographic number assigned by
the library system software (NOT the OCLC number)

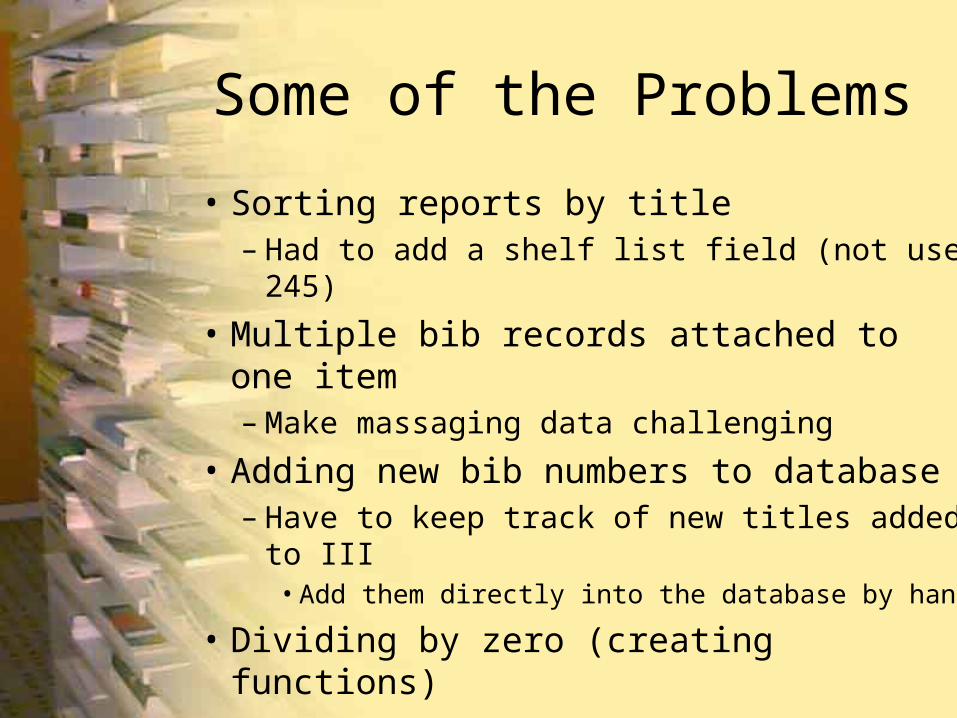
Some of the Problems
• Sorting reports by title– Had to add a shelf list field (not use 245)
• Multiple bib records attached to one item– Make massaging data challenging
• Adding new bib numbers to database– Have to keep track of new titles added to III
• Add them directly into the database by hand
• Dividing by zero (creating functions)

Advent and purchase of NCLive and other periodical databases
• Happened after our use study started

Incorporating electronic resources into the data
• Tried linking using title– first data from NCLive
• Downloaded ISSN info from vendors– cleaning up the data– definition of full-text– added fields into the title table
• Only just began to look at doing more

Comparing Apples with Oranges
• Providers of electronic resources don’t often tabulate usage by title of journal used– Count “use” by database hits– What is a hit?
• Are there other factors affecting periodical use? (we want to look at these…)– Gate count, reference questions, service desk
statistics, overall library usage
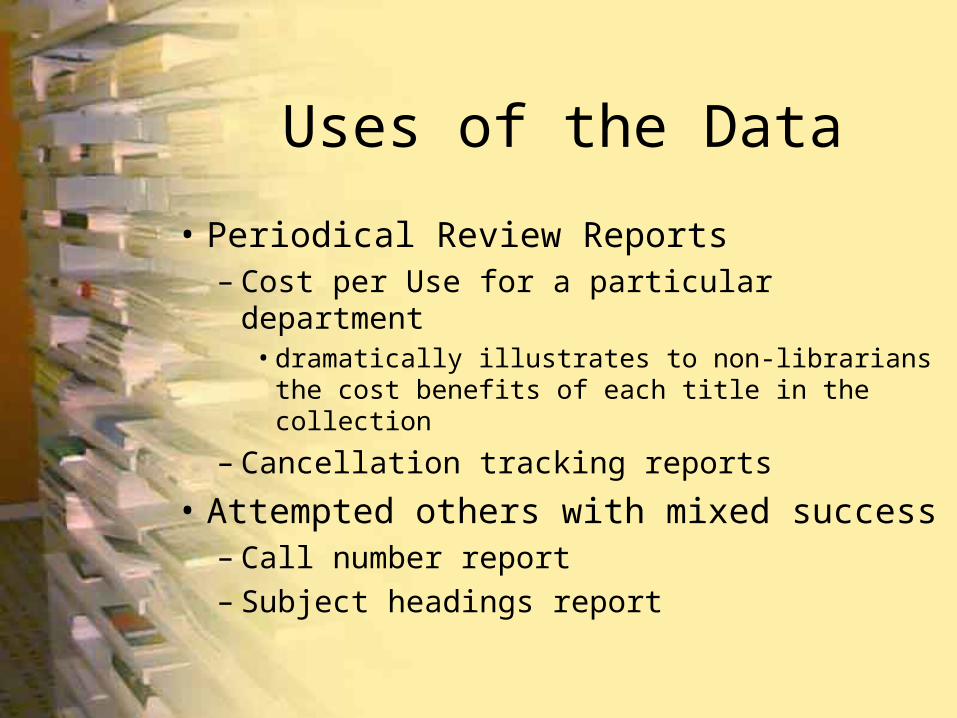
Uses of the Data
• Periodical Review Reports– Cost per Use for a particular department
• dramatically illustrates to non-librarians the cost benefits of each title in the collection
– Cancellation tracking reports
• Attempted others with mixed success– Call number report– Subject headings report


The data we gathered
• 4734 periodical titles were tracked over the past 3 years– dead titles (ceased and cancelled)– current subscriptions– microfilm– bound volumes – current, unbound issues– excluded currently received newspapers, but does
include newspapers on microfilm

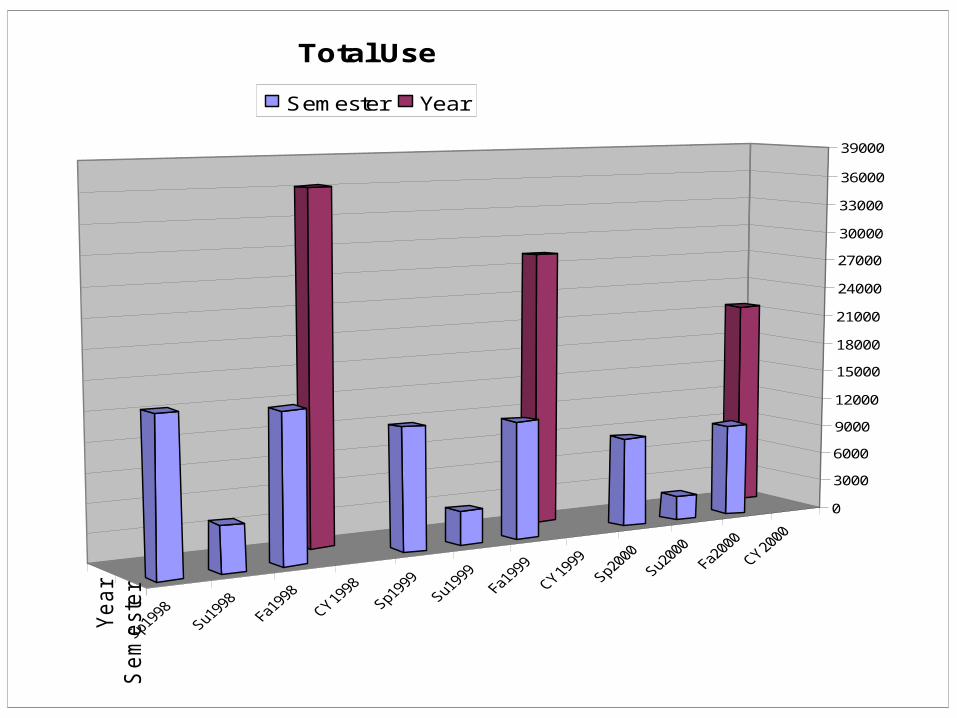
Overall decrease of use
• Accelerating each year– Down 21.6% between 1998 and 1999– Down 24.3% between 1999 and 2000
Se
me
ste
r
Ye
ar
0
3000
6000
9000
12000
15000
18000
21000
24000
27000
30000
33000
36000
39000
Total Use
Semester Year

Average Use per title
• Decreased each year (total use/number of titles)– 7.62 in ‘98, 5.98 in ‘99 and 4.53 in ‘00
• Titles with average or less uses decreased– 3,830 titles in ‘98, (81%) 3,803 titles in ‘99
(80%), and 3756 titles in ‘00 (79%)
• ILL might be a more efficient solution for more then 70% of the collection!

Spring98
Sum
mer9
8
Fall9
8
CY
98
Spring99
Sum
mer9
9
Fall9
9
CY
99
Spring00
Sum
mer0
0
Fall0
0
CY
00
0.00
1.00
2.00
3.00
4.00
5.00
6.00
7.00
8.00
Average Use
Semester Year

Titles with decreased use
• Not only were fewer titles used, but those used were used less often
1,468 titles decreased
in use(31%)
Between1998-1999
1,669 titles decreased
in use(35%)
Between1999-2000

Intermittent Use• Title use fluctuates greatly over time• Brief use studies will miss vital data
– For example: • While 1,594 titles had zero use throughout study, in ‘98 -
2364 had zero use, in ‘99 - 2,296 had zero use, in ‘00 - 2569 had zero use
• Of the 4734 titles, 3,842 (81%) had 2 consecutive semesters of zero use
• 112 titles had two consecutive semesters of zero use followed by a semester of more than five uses
• Studies should cover extended periods to provide a realistic picture of the data

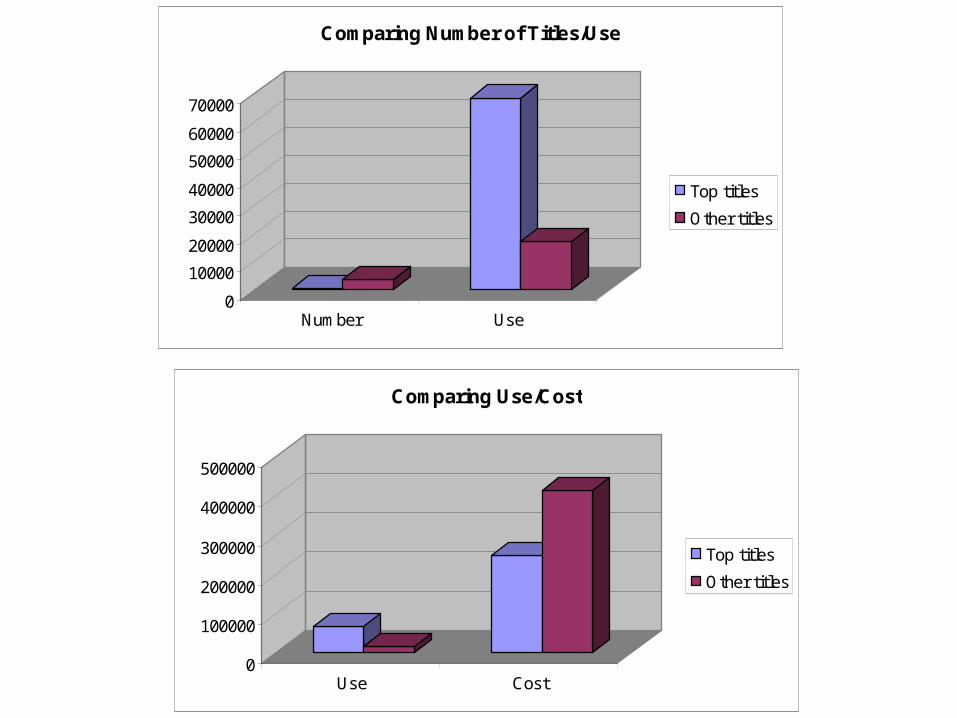
80/20 rule
• We looked at what portion of the title received 80% of the total use during the study– 15% of the titles (728 of the 4734 titles) received
80% of the use (68,684 of the 85,855 uses)
– Total cost of those 728 titles was $250,110 or 38% of our annual budget
– 62% of the serials budget is supporting only 20% of the use
0
100000
200000
300000
400000
500000
Use Cost
Comparing Use/Cost
Top titles
Other titles
0
10000
20000
30000
40000
50000
60000
70000
Number Use
Comparing Number of Titles/Use
Top titles
Other titles

Titles with Electronic Equivalents
• Looked at top 100 titles that decreased– 59% have electronic equivalents
• Looked at top 100 titles that increased– 27% have electronic equivalents
• More data is needed to prove cause/effect but we think there is a link

What’s next
• Just completed a large cancellation project– Figure out how to incorporate this into our
database
• Want to look in-depth at title(s) to attempt to find out more about how the electronic databases figure into use
• Looking at other data to incorporate– ILL and ABC express
• Thinking about a monograph use study

Three years into a Periodical Use Study
CIUGOctober 2001
Jill Ellern
Western Carolina University


