48


March 2001 PBV000-00-5599
__________________________________________________________________________________________________
THUKELA WATER PROJECT FEASIBILITY STUDYWATER RESOURCE EVALUATION AND SYSTEMS
ANALYSIS TASK
MAIN REPORT
Thukela Basin ConsultantsP O Box 221RIVONIA2128
Job No 2354/10March 2001

March 2001 PBV000-00-5599
________________________________________________________________________________________________
________________________________________________________________________________________________THUKELA WATER PROJECT FEASIBILITY STUDY
WATER RESOURCE EVALUATION AND SYSTEMS ANALYSIS TASKMAIN REPORT
i
This report is to be referred in bibliographies as:
Department of Water Affairs and Forestry, South Africa. 2001. Thukela WaterProject Feasibility Study. Water Resource Evaluation and Systems AnalysisTask. Main Report. Prepared by Thukela Basin Consultants as part of the ThukelaWater Project Feasibility Study. DWAF Report No. PBV000-00-5599.

March 2001 PBV000-00-5599
________________________________________________________________________________________________
________________________________________________________________________________________________THUKELA WATER PROJECT FEASIBILITY STUDY
WATER RESOURCE EVALUATION AND SYSTEMS ANALYSIS TASKMAIN REPORT
ii
Thukela Basin Consultants
A joint venture between
Stewart Scott Inc.P O Box 784506SANDTON2146
Knight Piésold ConsultingP O Box 221RIVONIA2128
Development EngineeringConsultants cc
Engineers, Project Managers and Community Based Consultants
decdecDevelopment Engineering Consultants cc513 Windermere RoadMORNINGSIDE4001
Fongoqa Skade Toyi & Associates CCP O Box 686GILLITTS3606
A i t d b i li t b lt t

March 2001 PBV000-00-5599
________________________________________________________________________________________________
________________________________________________________________________________________________THUKELA WATER PROJECT FEASIBILITY STUDY
WATER RESOURCE EVALUATION AND SYSTEMS ANALYSIS TASKMAIN REPORT
iii
STRUCTURE OF REPORTSM
AIN
REP
OR
TM
OD
ULE
REP
OR
TSSU
PPO
RTI
NG
DO
CU
MEN
TATI
ON
FEASIBILITY REPORT
PB V000-00-9700
SUMMARY
PB V000-00-9600
ENGINEERING REPORT
PB V000-00-3199
WATER RESOURCES REPORT
PB V000-00-5599
ENVIRONMENTAL REPORT
PB V000-00-6200
ECONOMIC AND FINANCIAL VIABILITY REPORT PB V000-00-9100
- Geology- Design Criteria- Klip vs Jana site selection- Flood Hydrology- Dam type selection- Outlet works- Spillways- Pump stations- Aqueducts- Access Roads- Labour-enhanced construction - Resource based costing- Review Panel Reports
EVALUATION OF ALTERNATIVE SOURCES OF WATER FOR LADYSMITH-EMNAMBITHI
PB V000-00-6099
PUBLIC INVOLVEMENT PROGRAMMEPB V000-00-8900
DECISION REGISTER & ARCHIVING BIBLIOGRAPHYPB V000-00-9000
REGIONAL DEVELOPMENT
PB V000-00-8799
LEGAL, INSTITUTIONAL & HYDROPOLITICAL ASPECTSPB V000-00-9900
- System Model- Klip vs Jana yield curves- Water resources evaluation report
Background Document & Environmental Issues Report
BASELINE STUDIES- Lake environments- Plant diversity- Faunal diversity- Natural Resource utilization- Tourism- Visual impact- Cultural history- Archaeological- Human health- Vaal River receiving environment- Hydrology- Geomorphology- Downstream impacts- Migration
Social Impact Assessment
Instream Flow, Estuarine Freshwater Requirements & Reserve Considerations

March 2001 PBV000-00-5599
________________________________________________________________________________________________
________________________________________________________________________________________________THUKELA WATER PROJECT FEASIBILITY STUDY
WATER RESOURCE EVALUATION AND SYSTEMS ANALYSIS TASKMAIN REPORT
iv
THUKELA WATER PROJECT : FEASIBILITY STUDYWATER RESOURCE EVALUATION AND SYSTEMS ANALYSIS TASK
MAIN REPORT
REPORT STRUCTURE
The following reports form part of the documentation produced during the WaterResource Evaluation and Systems Analysis Task. The shaded block depicts thisreport.
INCEPTION REPORTJune 1999
Report No. PB V000-00-1498
MAIN REPORT
Report No. PB V000-00-5599
Comparative Yield Curves forKlip and Jana sites
Report No. PB V000-00-5799
Water Resources SystemModel
Report No. PB V000-00-5899
Water Resources Evaluation
Report No. PB V000-00-5999


March 2001 PBV000-00-5599
________________________________________________________________________________________________
________________________________________________________________________________________________THUKELA WATER PROJECT FEASIBILITY STUDY
WATER RESOURCE EVALUATION AND SYSTEMS ANALYSIS TASKMAIN REPORT
vi
PREFACE
This Module Report on the Water Resource Evaluation and Systems Analysisassociated with the Thukela Water Project proposals emanating from the FeasibilityStudies was prepared by the Thukela Basin Consultants consortium. The authors wereappointed to undertake one of 15 modules in the Feasibility Study and obtainedinformation from and liased, inter alia, investigating teams assigned to the othermodules. The report was prepared under the direction of the Project ManagementTeam.
The report has been accepted as representing the outcome of the terms of referenceassigned to the Thukela Basin Consultants and has been used as an important sourcedocument for the preparation of a Main Feasibility Report on the Thukela Water Project.All the views, findings, interpretations and recommendations of the authors may notnecessarily have been included in full in the Main Feasibility Report. Deviations fromthis report are noted in the Main Feasibility Report.

March 2001 PBV000-00-5599
________________________________________________________________________________________________
________________________________________________________________________________________________THUKELA WATER PROJECT FEASIBILITY STUDY
WATER RESOURCE EVALUATION AND SYSTEMS ANALYSIS TASKMAIN REPORT
vii
THUKELA WATER PROJECT: FEASIBILITY STUDYWATER RESOURCE EVALUATION AND SYSTEMS ANALYSIS TASK
SUMMARY
1. INTRODUCTION
This summary gives an overview of the water resources evaluation andsystems analysis task as described in this report and three supportingtechnical reports.
The Thukela-Vaal Transfer Scheme (TVTS) reconnaissance, pre-feasibilityand interim studies served to eliminate a large number of potential damsites in the Thukela and its tributaries and to narrow development proposalsdown to two possible schemes, one in the upper Thukela and the southerntributaries, the other in the northern tributaries. The pre-feasibility studyproposed a series of dams in the southern tributaries, however, one of themain dams, Deeldrift, on the Little Thukela River, was ruled out primarily forenvironmental reasons. The interim study proposed two dams, one atMielietuin on the Bushmans River and one at either the Klip or Jana site onthe Thukela River. These proposals were examined in more detail in theThukela Water Project (TWP) Feasibility Study. The purpose of thefeasibility phase water resources study was to accurately determine the sizeof the two dams required to deliver water at a rate of 15 m3/s (up to 473million m3 /annum), the rate at which Eskom have indicated they can pumpadditional water up to Sterkfontein Dam and hence into the Vaal catchment.
The Water Resources Yield Model (WRYM) was used for the Pre-feasibilityand Interim study. Although an attempt to account for the Instream FlowRequirements (IFRs) was made during the Interim Study, the version ofWRYM available at that stage did not have a facility to model IFR releasesrealistically. The results obtained during the Interim Phase neverthelessindicated that supplying IFRs would reduce yields from storage significantly.Using the updated WRYM (Mark 5) which caters for IFR releases, IFRs andthe Estuarine Flow Requirement (EFR) were incorporated in the feasibilityphase system model.
2. FEASIBILITY PHASE
2.1 Water Resources System Model
The supporting report “Water Resources System Model” describes thevarious revisions to the system model including updating hydrology,improvements to the system model, particularly in the modelling releases forInstream Flow Requirements (IFRs) and increased system complexity,refinement of demands and elevation – area – storage data and revision ofpriorities for supplying demands. The Mooi River was modelled in more

March 2001 PBV000-00-5599
________________________________________________________________________________________________
________________________________________________________________________________________________THUKELA WATER PROJECT FEASIBILITY STUDY
WATER RESOURCE EVALUATION AND SYSTEMS ANALYSIS TASKMAIN REPORT
viii
detail in a separate study, the Mgeni River Augmentation Planning Study.This system was therefore included as an input channel to the Thukelasystem. Two dummy dams, Uitkyk in the Sundays and Buffelshoek in theBuffalo, were included in the system model and sized to supply demands inthe tributary catchments including IFR’s down to their confluences with theThukela. These revisions are summarised in this report and described indetail in the “Water Resources System Model” supporting report. Thecurrent natural runoff, demands, transfers, return flows and IFR details aresummarised in this report and the comparative tables are given in the“Water Resources System Model” report.
2.2 Comparative yield curves for Klip and Jana sites
Storage-yield curves for the Klip and Jana sites were required early in thestudy to facilitate the selection between the two mutually exclusive sites.Development of these curves is described in the supporting report“Comparative Yield Curves for Klip and Jana Sites”. The two sites aresituated close to one another in the Thukela so the effect of the rest of theThukela system on the yields from the two dams is taken to be similar.Therefore it was possible to use the pre-feasibility system model, updated toinclude the extended hydrology time series, the IFRs and the EFR.
The yield from storage at these sites was found to be very similar forequivalent dam sizes and therefore did not influence the preference for onesite over the other.
2.3 Water Resource Evaluation
2.3.1 Introduction
The “Water Resources Evaluation” supporting report describes the effect ofchanges in demands, IFRs and operating rules on yield from the proposeddams, determination of historic and stochastic yields and estimation of fillingtimes for Mielietuin and Jana Dams.
These analyses showed that small changes to the IFR patterns couldsignificantly increase yield from the Mielietuin and Jana Dams. Accordingly,proposals were made to the IFR specialist team, which resulted inadjustments being made to the IFR recommendations.
2.3.2 Operating rules
The yield model was set up to supply water to the various consumer usersectors at different priorities. The order of priority of supply was as follows:
a) IFRs (and EFR) to meet the ecological Reserveb) In-basin water requirements for industrial and domestic use, projected
to the year 2030.c) In-basin irrigation requirements, projected to the year 2030 but then
reduced by 75% to allow for a smaller assurance of supply. Thereasoning behind this is that irrigators should not receive a higher

March 2001 PBV000-00-5599
________________________________________________________________________________________________
________________________________________________________________________________________________THUKELA WATER PROJECT FEASIBILITY STUDY
WATER RESOURCE EVALUATION AND SYSTEMS ANALYSIS TASKMAIN REPORT
ix
assurance of supply following the construction of the Jana andMielietuin Dams than they receive currently.
d) The remaining water is assumed to be available for transfer to the VaalRiver System.
Operation of the system was set up so that the transferable yield fromMielietuin would be maximised. This is because Mielietuin Dam, situated ata higher elevation than Jana, provides a lower unit cost of water than JanaDam.
The existing transfer scheme was assumed to operate essentially as it hasin the past except that IFRs, not currently released from either the DrielBarrage or the Spioenkop Dam, were provided in the yield analyses at ahigher priority than transfers to the Vaal River System.
In setting up the system model it was assumed that water would be pumpedat a constant rate equivalent to the yields of Jana and Mielietuin Dams. Noallowance was made for downtime for maintenance purposes. This aspectneeds to be addressed in detail during the design phase of the project.
2.3.3 Instream Flow Requirements
IFRs, which are estimates of the minimum flow requirements to maintain theriverine ecology in an acceptable state, were determined at various points inthe Thukela system by a team of specialists. Initially IFRs were onlymodelled in the main stream of the Thukela and Bushmans River but it wasfound that this drastically reduced the transferable yield of the Jana Dam.Based on the reasoning that sufficient water would have to be releaseddown the tributaries of the Thukela, especially the Sundays, Buffalo andMooi Rivers, to meet the IFRs on these rivers, these flows were alsomodelled. In the case of the Sundays and Buffalo Rivers, it was found thatstorage will be required on these rivers in future if the in-basin requirementsup to the year 2030 are to be met, together with the IFRs. Thesehypothetical dams were included in the yield model.
It was found that inclusion of IFRs downstream of Driel Barrage andSpioenkop Dam reduces the amount of water that can currently betransferred through the existing Thukela-Vaal Scheme. However, while theIFRs downstream of the proposed new developments can be determinedwith fairly high confidence, it was not possible to determine the IFR requiredbelow the existing transfer scheme with the same certainty. The reason forthis is that while IFRs below new dam sites will normally be set to maintainthe river in its current ecological management class (EMC), an EMC of theriver downstream of the existing scheme must be negotiated to beacceptable to all stakeholders. On the other hand, in-basin stakeholders willrequire a high EMC to support recreation and agricultural activities whilewater users in the Vaal River System will strive to maximise the amount oftransferable water at minimum cost with a concomitant lower EMC. Thiscould not be negotiated in the Feasibility Study but will be addressed in aseparate study in which the Reserve is determined for the whole Thukelabasin. To cope with this uncertainty, a realistic upper and lower bound wasset to the IFR and the scheme configuration and transferable yields

March 2001 PBV000-00-5599
________________________________________________________________________________________________
________________________________________________________________________________________________THUKELA WATER PROJECT FEASIBILITY STUDY
WATER RESOURCE EVALUATION AND SYSTEMS ANALYSIS TASKMAIN REPORT
x
determined for these two possible extremes. This range of uncertainty onlyaffects the yield from the Jana Dam and not the yield from Mielietuin Dam. Itis expected that the actual Reserve will lie somewhere between the twoextremes.
2.3.4 Yield estimates
Yields were determined for both a high and low IFR scenario as describedin section 3.3.3 and a wide range of dam sizes at Mielietuin and Jana usinghistoric inflow time series. The results of these historic yield analyses aresummarised in Tables S1 to S3. For the low and high IFR scenarios, the transfers possible from the existingThukela-Vaal Scheme reduce from 527 million m3/a to 448 millionm3/annum and 357 million m3/annum respectively. Water released fromDriel Barrage and Spioenkop Dam to supply IFRs will, however, beavailable for transfer from Jana and it was found that the total averagetransfer from the combined existing Drakensberg scheme and Jana Dam isthe same for both high and low IFR scenario (see Figure S1). In otherwords, the amount of water, which can be transferred from the Thukelabasin to the Vaal River System, is essentially the same whether it ispumped from Jana Dam or the Driel Barrage. However, there is a pumpingcost implication because Jana Dam is, at a much lower elevation than theDriel barrage. The aqueduct capacity from the Jana/Mielietuin system wouldalso have to be greater for the high IFR scenario.
Table S1: Transferable yield from Mielietuin Dam (Historic analysis)
Full supply level (m amsl)
Working storage (million m3)
Transferable yield (million m3/a)
1010 206 1051015 250 1141020 297 1231025 352 1291030 417 1371033 464 1411035 498 143

March 2001 PBV000-00-5599
________________________________________________________________________________________________
________________________________________________________________________________________________THUKELA WATER PROJECT FEASIBILITY STUDY
WATER RESOURCE EVALUATION AND SYSTEMS ANALYSIS TASKMAIN REPORT
xi
Table S2: Transferable yield from Jana Dam (Historic analysis)
(Low IFR below existing transfer scheme)
Full supply level (mamsl)
Working storage(million m3)
Transferable yield(million m3/a)
800 364 204820 630 271840 991 322850 1213 335860 1469 351870 1763 368880 2177 393890 2639 422
TableS3: Transferable yield from Jana Dam (Historic analysis)
(High IFR below existing transfer scheme)
Full supply level (mamsl)
Working storage(million m3)
Transferable yield(million m3/a)
800 364 253820 630 347840 991 416850 1213 431860 1469 446870 1763 464880 2177 489890 2639 517

March 2001 PBV000-00-5599
________________________________________________________________________________________________
________________________________________________________________________________________________THUKELA WATER PROJECT FEASIBILITY STUDY
WATER RESOURCE EVALUATION AND SYSTEMS ANALYSIS TASKMAIN REPORT
xii
Figure S1: Average transferable yield from the existing Thukela-VaalScheme and the Jana Dam
2.3.5 Stochastic analyses
Once all modifications and enhancements to the feasibility study systemmodel had been incorporated and thoroughly tested using a single historicinflow time series, yield analyses were carried out using stochastic inflowtime series so as determine the assurance of supply of the proposedscheme (see Table S4 to S6).
Table S4: Transferable yield from Mielietuin Dam (Stochastic analysis)
Transferable yield at an assurance of:(million m3/a)
Reservoir FSL (m amsl)
95% 98% 99%1015 125 108 991025 136 120 1121033 147 129 122
Table S5: Transferable yield from Jana – low IFR scenario (Stochasticanalysis)
Transferable yield at an assurance of:(million m3/a)
Reservoir FSL (m amsl)
95% 98% 99%810 300 260 235840 390 338 315860 435 390 355890 520 455 420
AVERAGE TRANSFER FROM EXISTING THUKELA-VAAL SCHEME & JANA DAM
760
780
800
820
840
860
880
840 845 850 855 860 865 870 875 880 885 890
Jana Full Supply Level (masl)
Low IFR High IFR
Transferableyield (106m3/a)

March 2001 PBV000-00-5599
________________________________________________________________________________________________
________________________________________________________________________________________________THUKELA WATER PROJECT FEASIBILITY STUDY
WATER RESOURCE EVALUATION AND SYSTEMS ANALYSIS TASKMAIN REPORT
xiii
Table S6: Transferable yield from Jana – high IFR scenario (Stochasticanalysis)
Transferable yield at an assurance of:(million m3/a)
Reservoir FSL(m amsl)
95% 98% 99%810 380 340 310840 490 435 400860 530 485 450890 610 545 520
The Engineering module of the Feasibility Study identified a schemecomprising a dam with FSL at 860m at the Jana site and a dam with FSL at1025 at the Mielietuin site as the preferred layout.
Note that the contribution from the existing transfer scheme has not beenincluded in this analysis. This is because the water is supplied from DrielBarrage to Kilburn at well beyond this system's firm yield and is thereforenot comparable with the high assurance supply from the TWP. In order todetermine the assurance of supply of the combined scheme, the storageavailable in the Vaal River System must also be taken into account. Ananalysis of the combined Vaal and Thukela systems is currently beingcarried out under a separate contract in order to determine total yield andhence the incremental yield and its assurance as perceived in the VaalRiver System.
The required aqueduct capacities necessary for the proposed TWP schemelayout to deliver water at an assurance of 98% are shown in Table S7. Alarger capacity will almost certainly be required to cater for downtime andaqueduct losses.
Table 9: Aqueduct capacities required to deliver water at a 98% level ofassurance
IFR Scenario Mielietuin aqueduct capacity(m3/s)
Jana aqueduct capacity(m3/s)
High IFR 3.8 15.4Low IFR 3.8 12.4
2.3.6 Filling times
Filling times were assessed by simulation using 201 stochastic inflow timeseries and starting with the dams empty. Downstream IFRs and in-basindemands were supplied during filling. It was assumed that when fillingcommenced for Jana Dam, Mielietuin Dam would be fully operative. Thesimulation results were presented graphically in the form of boxplotsshowing projected water levels in the dam.

March 2001 PBV000-00-5599
________________________________________________________________________________________________
________________________________________________________________________________________________THUKELA WATER PROJECT FEASIBILITY STUDY
WATER RESOURCE EVALUATION AND SYSTEMS ANALYSIS TASKMAIN REPORT
xiv
These results are included in Appendix A of the “Water ResourcesEvaluation” supporting report. The number of years required to fill the damsat an assurance of 95%, to 100%, 75%, 50% and 25% of working storageare summarised in Table S8.
Table S8: Reservoir filling times (with 95% confidence)
Years to fill dam to (at assurance of 95%)Full supplylevel (m) 25% 50% 75% 100%
Mielietuin1033 3 4 5 61025 2 3 4 51020 2 3 4 5
Jana: Low IFR scenario890 4 6 8 10875 3 5 6 9860 3 4 5 8835 2 3 3 5
Jana: High IFR scenario890 3 5 6 8875 3 4 5 6860 3 4 5 6835 2 3 3 5
2.3.7 Water Quality
The Thukela and Klip rivers that will feed Jana carry good quality water withregard to inorganic constituent concentrations and will not affect any userdetrimentally. Water that will flow into Mielietuin will show the effects ofpollution from Estcourt as raised conductivity levels (but still low) andassociated ion concentrations. Elevated phosphate-P concentrations willstimulate algal growth, possibly resulting in mesotrophic conditions.
Possible problems with manganese, iron and ammonia are anticipated, asare low temperature releases form bottom outlets. Maximum temperaturedifferences between surface and bottom water of about 10°C are expectedto occur in January/February and this could cause considerable shock tothe ecosystem when monthly bottom water releases introduce much colderwater to the rivers. Temperature changes in the river immediatelydownstream of the dam should not exceed a few °C if serious impacts onthe aquatic environment are to be avoided. Dissolved oxygenconcentrations could also be depleted below 4 mg/l (lower limit for aquaticlife) and the great depths of Jana and Mielietuin may prevent mixing andresulting in bottom water releases being anoxic the whole year round.

March 2001 PBV000-00-5599
________________________________________________________________________________________________
________________________________________________________________________________________________THUKELA WATER PROJECT FEASIBILITY STUDY
WATER RESOURCE EVALUATION AND SYSTEMS ANALYSIS TASKMAIN REPORT
xv
Most of the detrimental water quality effects could be minimised by ensuringthat as much surface water as possible is released when monthly bottomwater releases are made and by providing dilution in tailponds beforeoverflow to the rivers. Spraying of water into tailponds will be necessary torapidly re-oxygenate the water before it enters the rivers.
3. CONCLUSIONS
• The system analysis model of the Thukela system developed during thefeasibility study adequately simulates operation of the system, includingsupplying water demands and IFR's.
• IFRs downstream of the proposed Jana and Mielietuin Damssignificantly reduce the transferable yield from these dams. Dummydams were included in the Sundays and Buffalo rivers to supply waterrequirements in these catchments as well as IFR's down to theconfluence with the Thukela. These tributary IFRs contribute to theIFRs in the lower Thukela River as well as the EFR and reduce thereleases that would otherwise be required from Jana Dam and henceincrease the transferable yield from the TWP.
• IFRs, which will in future be required below Driel Barrage andSpioenkop Dam, will reduce the transfers from the Thukela-VaalScheme. However, these IFRs will also increase flow into the JanaDam resulting in increased transferable yield from Jana. The net resultis that these IFRs will not significantly influence the total transferableyield from the combined scheme. Dams sized at the preferred FSLs(Mielietuin 1025 m amsl and Jana 860m amsl) will be able to deliveradditional flows of 3.8 m3/s (Mielietuin) and between 12.4 m3/s and 15.4m3/s (Jana) at an assurance of 98%. The impact of the TWP on theyield of the Vaal River System is being investigated under a separatecontract.
• The reduction in transfers from the Thukela-Vaal Scheme due to IFR
releases from Driel Barrage and Spioenkop Dam must be taken intoconsideration when sizing components of the proposed scheme. Thesize of Jana Dam is not affected by these IFRs but the capacity of theaqueduct from Jana to Kilburn Dam is.
• Both proposed dams are large relative to MAR and will take 6 to 10years to fill.
• Most of the detrimental water quality effects could be minimised byensuring that as much surface water as possible is included in monthlybottom water releases. Spraying of water into tailponds will benecessary to rapidly re-oxygenate the water before it enters the river.The quality of the transferred water should be good, since this wouldconsist mostly of surface water.

March 2001 PBV000-00-5599
_______________________________________________________________________________________________ ___
__________________________________________________________________________________________________THUKELA WATER PROJECT FEASIBILITY STUDY
WATER RESOURCE EVALUATION AND SYSTEMS ANALYSIS TASKMAIN REPORT
xix
THUKELA WATER PROJECT – FEASIBILITY STUDYWATER RESOURCE EVALUATION AND SYSTEMS ANALYSIS TASK
MAIN REPORT
ABBREVIATIONS
DSL Dead Storage LevelDWAF Department of Water Affairs and ForestryEFR Estuarine Flow RequirementFSL Full Supply LevelIFR Instream Flow RequirementMAR Mean Annual RunoffM AMSLMetres Above Mean Sea LevelPMT Project Management TeamToR Terms of ReferenceTVTS Thukela-Vaal Transfer SchemeTWP Thukela Water ProjectVAPS Vaal Augmentation Planning StudyWRYM Water Resources Yield Model

March 2001 PBV000-00-5599
_______________________________________________________________________________________________ ___
__________________________________________________________________________________________________THUKELA WATER PROJECT FEASIBILITY STUDY
WATER RESOURCE EVALUATION AND SYSTEMS ANALYSIS TASKMAIN REPORT
xvi
THUKELA WATER PROJECT – FEASIBILITY STUDYWATER RESOURCE EVALUATION AND SYSTEMS ANALYSIS TASK
MAIN REPORT
CONTENTS
SUMMARY
1 INTRODUCTION.............................................................................................................................. 1
2 STUDY OBJECTIVES ..................................................................................................................... 1
3 REVISIONS TO THE SYSTEM MODEL ......................................................................................... 2
3.1 Implementation of first phase revisions..................................................................................23.1.1 Hydrology update................................................................................................................. 23.1.2 Replacement of minimum flow channels ............................................................................. 23.1.3 Updating of elevation-area-storage data ............................................................................. 23.1.4 Implementation of IFR channels .......................................................................................... 2
3.2 Implementation of second phase revisions............................................................................33.2.1 Renumbering of nodes and channels .................................................................................. 33.2.2 Review and revision of priorities and penalties for supplying demands .............................. 3
3.3 Implementation of third phase revisions.................................................................................43.3.1 Farm dams........................................................................................................................... 43.3.2 Irrigation demands ............................................................................................................... 43.3.3 Mooi River system ............................................................................................................... 43.3.4 Zaaihoek hydrology.............................................................................................................. 53.3.5 Buffalo urban demands........................................................................................................ 53.3.6 Uitkyk and Buffelshoek Dams.............................................................................................. 5
3.4 Miscellaneous system changes ...............................................................................................53.4.1 System renumbering............................................................................................................ 53.4.2 Ladysmith demand............................................................................................................... 53.4.3 Revised instream flow requirements.................................................................................... 63.4.4 Elevation-area-storage revisions ......................................................................................... 63.4.5 General changes.................................................................................................................. 63.4.6 Driel IFR............................................................................................................................... 7
3.5 The Feasibility System Model...................................................................................................73.5.1 Inflow time series ................................................................................................................. 73.5.2 Water usage by afforestation and dryland sugar cane ........................................................ 83.5.3 Irrigation usage .................................................................................................................... 93.5.4 Urban, rural and industrial demand ................................................................................... 103.5.5 Return flows ....................................................................................................................... 103.5.6 Inter-basin transfers ........................................................................................................... 123.5.7 Instream and estuarine flow requirements......................................................................... 123.5.8 Elevation-storage-area data of Jana and Mielietuin .......................................................... 133.5.9 Dummy farm dams............................................................................................................. 14
4 COMPARATIVE YIELD CURVES FOR KLIP AND JANA SITES................................................ 15

March 2001 PBV000-00-5599
_______________________________________________________________________________________________ ___
__________________________________________________________________________________________________THUKELA WATER PROJECT FEASIBILITY STUDY
WATER RESOURCE EVALUATION AND SYSTEMS ANALYSIS TASKMAIN REPORT
xvii
4.1 Yield analyses ..........................................................................................................................15
4.2 Historic storage-yield ..............................................................................................................15
5 WATER RESOURCES EVALUATION.......................................................................................... 16
5.1 Sensitivity analyses.................................................................................................................165.1.1 Sensitivity of yield to changes in the IFR’s and the EFR ................................................... 165.1.2 Effect of the size of Mielietuin Dam on the transferable yield from Jana........................... 165.1.3 Irrigation upstream of Spioenkop Dam .............................................................................. 175.1.4 The current system ............................................................................................................ 175.1.5 2010, 2020 and 2030 demand scenarios .......................................................................... 175.1.6 Effect of Mhlathuze transfer on yield from Jana ................................................................ 17
5.2 Assessment of changes to the system model on transferable yield .................................175.2.1 Revised assessment of water demands ............................................................................ 175.2.2 Incorporation of additional farm dams ............................................................................... 185.2.3 Revision to Zaaihoek hydrology......................................................................................... 185.2.4 Revision to IFR’s and addition of new IFR’s ...................................................................... 185.2.5 Revised period of inflow time series .................................................................................. 195.2.6 Uitkyk and Buffelshoek Dams............................................................................................ 19
5.3 Feasibility yield analyses........................................................................................................195.3.1 Historic yield analyses ....................................................................................................... 19
5.4 Long-term stochastic analysis ...............................................................................................22
5.5 Reservoir filling time analysis ................................................................................................23
5.6 Short term yield analyses .......................................................................................................24
6 WATER QUALITY ......................................................................................................................... 25
7 CONCLUSIONS............................................................................................................................. 26

March 2001 PBV000-00-5599
_______________________________________________________________________________________________ ___
__________________________________________________________________________________________________THUKELA WATER PROJECT FEASIBILITY STUDY
WATER RESOURCE EVALUATION AND SYSTEMS ANALYSIS TASKMAIN REPORT
xviii
List of Tables
Table 3.1:Sub-catchment runoff time seriesTable 3.2: Mean annual afforestation and dry land sugar cane water requirementsTable 3.3 : Irrigation usage (full development assumed by 2010)Table 3.4: Urban, rural and industrial water demandsTable 3.5: Return flowsTable 3.6: Mean annual inter-basin transfers from the Thukela systemTable 3.7: IFR and the EFR sitesTable 3.8: Maximum, Minimum and Average IFR requirementsTable 3.9: Elevation-area-storage relationship for Jana DamTable 3.10: Elevation-area-storage relationship for Mielietuin DamTable 3.11: Dummy damsTable 5.1: Transferable yield from Mielietuin DamTable 5.2: Transferable yield from Jana Dam – “low” IFRTable 5.3: Transferable yield from Jana Dam – “high” IFRTable 5.4 : Transferable yield from Mielietuin (Stochastic analysis)Table 5.5: Transferable yield from Jana – “low” IFRTable 5.6: Transferable yield from Jana – “high” IFRTable 5.7: Reservoir filling times (with 95% confidence)Table 7.1 : Summary of Mielietuin (1025 MSL) and Jana (860mSL) option
List of Drawings
W1 Thukela Water Project : Proposed location of damsW5 Thukela Water Project : Final feasibility system network diagram

March 2001 PBV000-00-5599
_______________________________________________________________________________________________ ___
__________________________________________________________________________________________________THUKELA WATER PROJECT FEASIBILITY STUDY
WATER RESOURCE EVALUATION AND SYSTEMS ANALYSIS TASKMAIN REPORT
1
THUKELA WATER PROJECT : FEASIBILITY STUDYWATER RESOURCE EVALUATION AND SYSTEMS ANALYSIS TASK
MAIN REPORT
1 INTRODUCTION
The previous Thukela-Vaal Transfer Scheme (TVTS) pre-feasibility and interimstudies served to eliminate a large number of potential dam sites in theThukela and its tributaries and to narrow development proposals to twolayouts, one in the upper Thukela and the southern tributaries and one in thenorthern tributaries. The Thukela Water Project (TWP) Feasibility Studyfocuses primarily on the proposed development in the upper Thukela and thesouthern tributaries. The interim study defined the project as comprisingMielietuin in the Bushmans River and either Klip or Jana in the Thukela. Theproposed location of the dams is shown in Drawing W1.
The Water Resources Yield Model (WRYM) was used for the system analysisin the pre-feasibility study. An interim study then was undertaken in order toincorporate into the system analysis model Instream Flow Requirements(IFR’s). However, at that stage WRYM did not have a facility to model IFRreleases properly and, consequently, the results of the analysis wereinconclusive. The results did, however, indicate that supply of the IFR’s wouldreduce yield from the reservoirs. Channels to model IFR’s and the estuarineflow requirement (EFR) have since been added to the WRYM model and IFR’sand the EFR could be properly modelled in the system model for the feasibilitystudy.
2 STUDY OBJECTIVES
The main objectives of the study were to provide the following information:
• comparative storage-yield curves for the Klip and Jana sites to facilitateselection between the two sites.
• an assessment of the transferable yields using historic inflow time seriesfrom the proposed dams with due allowance to meet all projected in-basindemands including environmental requirements and existing and plannedinter-basin transfers.
• the yield-assurance relationships for the dams using long-term stochasticinflow time series.
• estimated filling times for the proposed dams from the results ofsimulations using multiple stochastic inflow time series.
March 2001 PBV000-00-5599
_______________________________________________________________________________________________ ___
__________________________________________________________________________________________________THUKELA WATER PROJECT FEASIBILITY STUDY
WATER RESOURCE EVALUATION AND SYSTEMS ANALYSIS TASKMAIN REPORT
2
3 REVISIONS TO THE SYSTEM MODEL
The report “Water Resources System Model” describes the various revisionsto the system model.
3.1 Implementation of first phase revisions
3.1.1 Hydrology update
The hydrological database used in the interim study spanned the period 1920to 1992 (hydrological years). Subsequently these time series of naturalstreamflow, afforestation and irrigation usage were extended by two years tothe end of the 1994 hydrological year (i.e. to September 1995). This coincideswith the end of the 90’s drought. When, for the sake of compatibility withanalyses done for the Mooi-Mgeni transfer, the Mooi-Mgeni system model wasused to generate an inflow time series for the Mooi River, the period of thehydrology data files was changed to the period used in the Mooi-Mgeni study(1925 to 1994).
3.1.2 Replacement of minimum flow channels
In the Mark 3 version of WRYM, there was a restriction on the number ofgeneral flow channels and minimum flow channels and a minimum flow of zerohad to be used. The maximum number of general flow channels wasincreased in the current Mark 5 version of WRYM and therefore minimum flowchannels could be replaced with general flow channels.
3.1.3 Updating of elevation-area-storage data
More detailed elevation-area-storage data for Mielietuin, Jana and Klip damswas supplied by DWAF and used in the model.
3.1.4 Implementation of IFR channels
The IFR channels introduced in the Mark 5 version of WRYM enabled theIFR’s and the EFR to be effectively modelled. Flow requirements werespecified for five IFR sites and the EFR that are shown in Drawing W5. Thesesites are:
IFR A Thukela River, downstream of Spioenkop DamIFR B Klip River, downstream of Qedusizi DamIFR 2 Thukela River, downstream of proposed Jana/Klip DamIFR 3 Bushmans River, downstream of proposed MielietuinIFR 5 Thukela River, upstream of Mooi river confluenceEFR Thukela River estuary
IFR data is entered in a new input datafile (F14 file). In this file the IFRrequirement is specified as a function of the inflow at up to ten nodes(reference nodes) having incremental inflow. The in-house program“RANKGRAF” was written to rank and plot, for each calendar month, the IFRflows and also to combine, rank and plot the reference node inflows. This

March 2001 PBV000-00-5599
_______________________________________________________________________________________________ ___
__________________________________________________________________________________________________THUKELA WATER PROJECT FEASIBILITY STUDY
WATER RESOURCE EVALUATION AND SYSTEMS ANALYSIS TASKMAIN REPORT
3
information was used to prepare the data for the F14 datafiles. The IFRchannel is a special case of the min-max channel and will not pass more thanthe specified flow, therefore a general flow channel was placed in parallel tothe IFR channel to allow floods to pass. Full details are given in the “WaterResources System Model Report”.
3.2 Implementation of second phase revisions
3.2.1 Renumbering of nodes and channels
Due to the addition of nodes and channels primarily for the IFR’s, it becamenecessary to renumber the nodes and channels to make the system moreordered and to facilitate checking and further revisions.
3.2.2 Review and revision of priorities and penalties for supplying demands
To refine and optimise the system operation, certain penalties were revised,the number of operating zones in the dams was increased to allow for thepossible inclusion of restrictions based on water level in the reservoirs and theprioritisation of supplying demands was revised.
In-basin demands and existing and planned transfers must be supplied inpreference to the new transfers to the Vaal. In accordance with this rule thefollowing priority for supplying users was adopted:
• IFR’s and the EFR• primary demands – industry, urban and rural,• inter basin transfers both existing and planned,• irrigation, • proposed Thukela Vaal transfer.
It should be noted that IFR’s should receive priority of supply but that actualpenalty values allocated were not the highest. However, as all in-basindemands must be supplied before water can be allocated to the proposedtransfer scheme, the IFR penalties were not of significance. Furthermorechecks were made to ensure that the IFR’s were fully supplied which in turnshowed that the other demands would also be fully supplied.
The order of supplying demands from reservoirs was set as listed below.
• Chelmsford• Craigieburn• Zaaihoek• Mearns (dummy dam in the Mooi system that was included to model the
Mooi-Mgeni transfer before the system was modified to utilise an inflowtime series from the Mooi-Mgeni system model).
• Jana• Spioenkop• Mielietuin• Wagendrift

March 2001 PBV000-00-5599
_______________________________________________________________________________________________ ___
__________________________________________________________________________________________________THUKELA WATER PROJECT FEASIBILITY STUDY
WATER RESOURCE EVALUATION AND SYSTEMS ANALYSIS TASKMAIN REPORT
4
The order of prioritising reservoirs was selected so that in-basin demandswould be supplied in preference from storage that could not supply water tothe proposed transfer scheme.
The WRYM system model utilises a system of penalties to decide whichdemands should be supplied in preference and from which storage demandscan be supplied. As the model developed changes had to be made to thepenalty system to ensure correct operation of the system. These changes aredescribed in detail in the “Water Resources System Model” report.
3.3 Implementation of third phase revisions
3.3.1 Farm dams
There are many farm dams in the tributaries of the Thukela River and waterstored in these dams is not available to supply downstream demands.Individually these dams are small but together have a combined capacity ofsome 338x106m3. The Mark 3 version of WRYM limited the number of damsthat could be modelled and in addition to the major dams only two dams couldbe included to represent groups of farm dams. The Mark 5 version of WRYMrelaxed this restriction and an additional five dummy dams were included inthe system model. The total storage in dummy dams is only two thirds of thetotal storage in farm dams. This is because the location of the other dams didnot permit them to be logically included in the system model withoutintroducing an unrealistic level of detail. The effect of ignoring these damswill, however, be negligible.
3.3.2 Irrigation demands
In times of drought, restrictions will be applied to irrigators. It was agreed thatrigorous modelling of irrigation supply, incorporating restrictions dependent onwater level in the reservoirs, was not warranted and that a suitablecompromise would be to supply 75% of the average irrigation demand on afirm basis. Accordingly the irrigation datafiles were adjusted to reflect only75% of irrigation demand.
3.3.3 Mooi River system
To ensure that the Mooi River was operated as postulated in the Mooi-Mgenistudy, it was requested that the system model utilised by the Mooi-Mgenistudy consultants be incorporated in the Thukela system model. This provedto be unrealistic as incorporating the significantly more detailed Mooi-Mgenisystem into the Thukela system model would have resulted in a very large,cumbersome model. Accordingly it was agreed to generate a time series ofinflow from the Mooi River to the Thukela using the Mooi-Mgeni system model.The hydrological time series for the Mooi-Mgeni system starts in 1925 andends in 1994. As the critical period is not at the beginning of the time series, itwas decided to shorten the Thukela hydrology to also start in 1925 rather thanextend the Mooi River hydrology. This would have no effect on the historicalanalyses but would affect stochastic generation of time series. However, theeffect would more than likely be conservative because the years beingremoved are better than average.

March 2001 PBV000-00-5599
_______________________________________________________________________________________________ ___
__________________________________________________________________________________________________THUKELA WATER PROJECT FEASIBILITY STUDY
WATER RESOURCE EVALUATION AND SYSTEMS ANALYSIS TASKMAIN REPORT
5
3.3.4 Zaaihoek hydrology
During the study the hydrology for the Zaaihoek Dam catchment was revised.The revisions had a knock-on effect on the TM26 and TM31 catchments sothe time series for these catchments were also revised. The combined meanannual runoffs for the revised inflow time series dropped by 28x106m3/a. Inaddition, the Zaaihoek Dam transfer to Majuba Power Station was reduced byabout 20x106m3/a for 2030 development levels (more recent information fromEskom).
3.3.5 Buffalo urban demands
Following recent trends in water use for Newcastle, the combined Newcastle,Madedeni and Osizweni urban demand in the Buffalo catchment was reducedby about 55x106m3/a for the 2030 development level resulting in an increase intransferable yield from Jana.
3.3.6 Uitkyk and Buffelshoek Dams
Growth in water demands in the Sundays and Buffalo rivers will reduce thecontribution from these catchments towards supplying IFR’s. For theseprojected growths to be realised, further development of water resources inthese catchments would also have to take place. IFR’s downstream of thesedevelopments would ensure that the contribution to supplying IFR’s in theThukela would be maintained and that the burden would not fall unrealisticallyon Jana Dam. Two dummy dams, Uitkyk in the Sundays and Buffelshoek inthe Buffalo, were included in the system model and sized to supply demandsin the tributary catchments including IFR’s down to their confluences with theThukela. The more realistic approach to modelling these tributaries resulted insignificantly more water being available for transfer from Jana Dam.
These assumptions will have to be tested with and without these dummy damsduring the Decision Support Phase of the study in order to provide decision-makers with indication of the relative impacts on the transfer to the Vaal RiverSystem.
3.4 Miscellaneous system changes
3.4.1 System renumbering
As for the second phase revisions, it became necessary to renumber thenodes and channels following further additions and modifications to thesystem.
3.4.2 Ladysmith demand
At times a portion of Ladysmith’s demand is supplied directly from SpioenkopDam. In the initial model the entire demand was abstracted from the Thukelaupstream of the Klip confluence. When the IFR downstream of Spioenkopwas introduced this was no longer acceptable because flow past the IFR sitewould incorrectly include the portion of the demand supplied directly from the

March 2001 PBV000-00-5599
_______________________________________________________________________________________________ ___
__________________________________________________________________________________________________THUKELA WATER PROJECT FEASIBILITY STUDY
WATER RESOURCE EVALUATION AND SYSTEMS ANALYSIS TASKMAIN REPORT
6
dam. Accordingly the model was modified to include the direct supply toLadysmith so that flow past the IFR site could be properly checked.
3.4.3 Revised instream flow requirements
During the study it was decided, based on the outcome of a detailedinvestigation that storage would not be provided at Qedusizi Dam. Withoutstorage, supply of the IFR in the Klip River cannot be controlled. Accordingly,IFR B in the Klip River was removed. At a workshop held in November 1998,IFR2 and IFR5 were modified to take account of improved measurement of thecross-sections at the sites.
The primary task of this workshop was to define the requirements at IFR Adownstream of Spioenkop Dam. The requirements for IFR A were significantlyhigher than determined using the “Rapid Assessment” method and now couldnot be fully supplied from Spioenkop Dam only. To supply IFR A fully thepenalties were modified to allow water to be released from Woodstock Dam aswell.
IFR 2 and IFR 5 were revised and a new IFR A was generated at theNovember 1998 workshop. IFR A is dealt with in detail in the supportingreport “Water Resources Evaluation”. It is important to note that IFR A is nowable to draw on Woodstock Dam in preference to everything else in thesystem. These assumptions will be tested during the Reserve Determinationscheduled for the Decision Support Phase.
The EFR was revised by the EFR team but had no impact on the transferableyield from Jana.
3.4.4 Elevation-area-storage revisions
DWAF improved the elevation-storage-area data for both Mielietuin and Janadams. For Jana these differences were negligible. Accurate surveys are onlyavailable up to 870m for Jana but have been extrapolated to 890m. ForMielietuin the changes were quite significant and resulted in a decrease intransferable yield for a given storage capacity. The elevation-area-storagedata is listed in Tables 3.9 and 3.10 in section 3.5.8 of this report. It isessential that if a dam with a FSL of greater than 870m at the Jana site isselected that the elevation-storage-area data above this level be determinedaccurately.
3.4.5 General changes
The source of supply for the Klip River urban and rural demand and irrigationat Nondlolothi was moved from the Thukela River to a postulated dam atUitkyk in the Sundays River. The working storage of Uitkyk Dam was set sothat these demands together with the IFR could be fully supplied.
There was some further revision of penalties to ensure that water wassupplied according to the priorities for supply

March 2001 PBV000-00-5599
_______________________________________________________________________________________________ ___
__________________________________________________________________________________________________THUKELA WATER PROJECT FEASIBILITY STUDY
WATER RESOURCE EVALUATION AND SYSTEMS ANALYSIS TASKMAIN REPORT
7
A buffer level was included in Woodstock Dam to reserve water for IFR A, theLadysmith demand (that portion abstracted from Spioenkop) and demandsbetween Woodstock and Spioenkop Dams because with IFR A in place thesedemands cannot be supplied from Spioenkop alone. The penalty for drawingwater from the buffer zone was set so that the existing Drakensberg transferscheme would not have access to this water.
3.4.6 Driel IFR
Late in the study an IFR was introduced downstream of Driel Barrage toensure the environmental integrity of the stretch of river between Driel Barrageand Spioenkop Dam. No IFR was considered downstream of Woodstock Dambecause the water level in Driel Barrage is such that it backs up almost to thetoe of Woodstock Dam with the result that there is no riverine environment inthis reach. The IFR specialist team investigated the river reach between DrielBarrage and Spioenkop Dam in order to determine the current ecologicalmanagement class. This IFR was therefore determined as a D and B classusing the “Desktop” method.
3.5 The Feasibility System Model
During the Feasibility study the system model was developed as described inthe previous sections. This section summarises the data and information thatis used in the Feasibility system analysis model shown in Drawing W5.
The Mooi River system is included as an inflow time series. For this reason,details of the runoff time series, demands and return flows from the Mooicatchment are not included in the tabulated data. These details are, however,included in the “Water Resources Evaluation” supporting report.
3.5.1 Inflow time series
The 32 sub-catchments used in the pre-feasibility and interim studies wereretained for the feasibility study. The Mooi catchment was input to the modelas a streamflow time series at the Mooi-Thukela confluence. This time serieswas generated using the Mooi-Mgeni system model. Accordingly the fourMooi River inflows in the original Thukela system model are excluded in thefeasibility study model. The inflow time series together with the MAR’s for theperiod 1925 to 1994 are listed in Table 3.1 below.

March 2001 PBV000-00-5599
_______________________________________________________________________________________________ ___
__________________________________________________________________________________________________THUKELA WATER PROJECT FEASIBILITY STUDY
WATER RESOURCE EVALUATION AND SYSTEMS ANALYSIS TASKMAIN REPORT
8
Table 3.1: Sub-catchment runoff time series
Catchmentname
Natural MAR(106m3/a)
Catchmentname
Natural MAR(106m3/a)
TM01.INC 73.24 TM15.INC 110.47
TM02.INC 357.59 TM16.INC 79.82
TM03.INC 19.24 TM17.INC 32.42
TM04.INC 217.90 TM18.INC 25.64
TM05.INC 87.40 TM19.INC 203.75
TM06.INC 30.68 TM24.INC 106.97
TM07.INC 15.07 TM25.INC 133.88
TM08.INC 300.83 TM26.INC 97.07
TM09.INC 6.77 TM27.INC 151.21
TM10.INC 87.95 TM28.INC 214.14
TM11.INC 226.63 TM29.INC 191.50
TM12.INC 35.33 TM30.INC 195.54
TM13.INC 19.63 TM31.INC 140.78
TM14.INC 82.84 TM32.INC 157.91
Total 3402.20
The MAR of the four Mooi River sub-catchments in the original system modeltotals 298.22x10⁶m3/a. Adding this to the 3402.12 x106m3/a gives a totalnatural MAR for the Thukela of 3700.42x106m3/a.
The average inflow for the Mooi system was 93.84x10⁶m3/a.
3.5.2 Water usage by afforestation and dryland sugar cane
The afforestation and dry land sugar cane demands for 1995 and projected to2030 are listed in Table 3.2.

March 2001 PBV000-00-5599
_______________________________________________________________________________________________ ___
__________________________________________________________________________________________________THUKELA WATER PROJECT FEASIBILITY STUDY
WATER RESOURCE EVALUATION AND SYSTEMS ANALYSIS TASKMAIN REPORT
9
Table 3.2: Mean annual afforestation and dry land sugar cane waterrequirements
Afforestation and dry land sugarusage
(106m3/a)
Afforestation and dry land sugarusage
(106m3/a)
CatchmentName
1995 2030
CatchmentName
1995 2030
TM01.AFF 0 0 TM15.AFF 0 0
TM02.AFF 0 0 TM16.AFF 0 0
TM03.AFF 0 0 TM17.AFF 0 0
TM04.AFF 1.19 2.86 TM18.AFF 2.66 4.80
TM05.AFF 0 0 TM19.AFF 0 0
TM06.AFF 0 0 TM24.AFF 0.34 2.00
TM07.AFF 0 0 TM25.AFF 0.84 4.86
TM08.AFF 0 0 TM26.AFF 0 0
TM09.AFF 0 0 TM27.AFF 1.74 6.38
TM10.AFF 0 0 TM28.AFF 1.74 6.38
TM11.AFF 0 0 TM29.AFF 1.46 2.54
TM12.AFF 3.08 5.89 TM30.AFF 2.54 2.94
TM13.AFF 2.89 5.23 TM31.AFF 0.95 5.41
TM14.AFF 0 0 TM32.AFF 2.47 2.87
Total 21.91 52.18
Note: The pre-feasibility TM20, TM21, TM22 and TM23 annual afforestation and sugar cane usagetotalling 3.78 and 6.60 x10⁶m3/a for 1995 and 2030 respectively is in the Mooi system
3.5.3 Irrigation usage
Irrigation demands are not supplied at the same assurance as primarydemands. To avoid unnecessarily complicating the system model irrigationdemands were set at 75% of full requirement rather than implement a systemof restricted supply based on water levels in the dams. Irrigation requirementswere determined as time series using WRSM90. In some months therequirements exceeded available runoff from the catchments. Accordinglyirrigation supply time series were generated by taking 75% of the demand withthe maximum for each month being the available runoff. These irrigation timeseries are listed in Table 3.3. All pre-feasibility “.IRR” data files have beenconverted to “.IRD” data files.
March 2001 PBV000-00-5599
_______________________________________________________________________________________________ ___
__________________________________________________________________________________________________THUKELA WATER PROJECT FEASIBILITY STUDY
WATER RESOURCE EVALUATION AND SYSTEMS ANALYSIS TASKMAIN REPORT
10
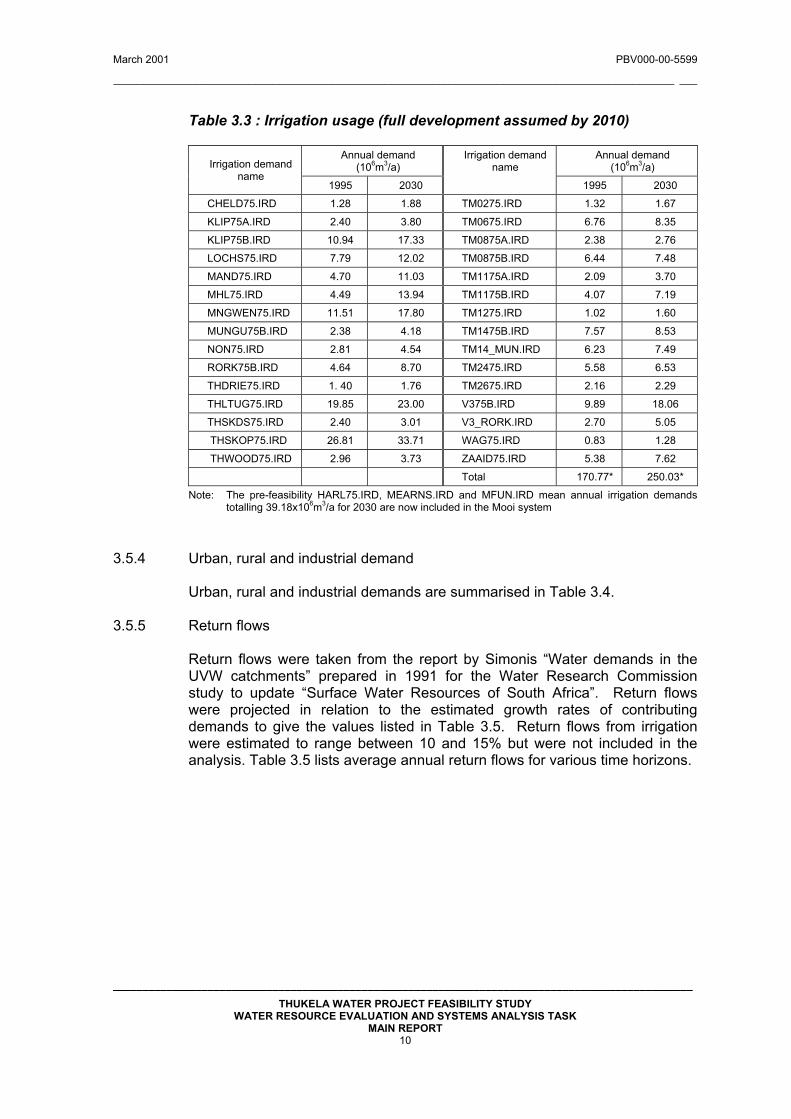
Table 3.3 : Irrigation usage (full development assumed by 2010)
Annual demand(106m3/a)
Annual demand(106m3/a)Irrigation demand
name1995 2030
Irrigation demandname
1995 2030
CHELD75.IRD 1.28 1.88 TM0275.IRD 1.32 1.67
KLIP75A.IRD 2.40 3.80 TM0675.IRD 6.76 8.35
KLIP75B.IRD 10.94 17.33 TM0875A.IRD 2.38 2.76
LOCHS75.IRD 7.79 12.02 TM0875B.IRD 6.44 7.48
MAND75.IRD 4.70 11.03 TM1175A.IRD 2.09 3.70
MHL75.IRD 4.49 13.94 TM1175B.IRD 4.07 7.19
MNGWEN75.IRD 11.51 17.80 TM1275.IRD 1.02 1.60
MUNGU75B.IRD 2.38 4.18 TM1475B.IRD 7.57 8.53
NON75.IRD 2.81 4.54 TM14_MUN.IRD 6.23 7.49
RORK75B.IRD 4.64 8.70 TM2475.IRD 5.58 6.53
THDRIE75.IRD 1. 40 1.76 TM2675.IRD 2.16 2.29
THLTUG75.IRD 19.85 23.00 V375B.IRD 9.89 18.06
THSKDS75.IRD 2.40 3.01 V3_RORK.IRD 2.70 5.05
THSKOP75.IRD 26.81 33.71 WAG75.IRD 0.83 1.28
THWOOD75.IRD 2.96 3.73 ZAAID75.IRD 5.38 7.62
Total 170.77* 250.03*
Note: The pre-feasibility HARL75.IRD, MEARNS.IRD and MFUN.IRD mean annual irrigation demandstotalling 39.18x10⁶m3/a for 2030 are now included in the Mooi system
3.5.4 Urban, rural and industrial demand
Urban, rural and industrial demands are summarised in Table 3.4.
3.5.5 Return flows
Return flows were taken from the report by Simonis “Water demands in theUVW catchments” prepared in 1991 for the Water Research Commissionstudy to update “Surface Water Resources of South Africa”. Return flowswere projected in relation to the estimated growth rates of contributingdemands to give the values listed in Table 3.5. Return flows from irrigationwere estimated to range between 10 and 15% but were not included in theanalysis. Table 3.5 lists average annual return flows for various time horizons.

March 2001 PBV000-00-5599
_______________________________________________________________________________________________ ___
__________________________________________________________________________________________________THUKELA WATER PROJECT FEASIBILITY STUDY
WATER RESOURCE EVALUATION AND SYSTEMS ANALYSIS TASKMAIN REPORT
11
Table 3.4: Urban, rural and industrial water demands
Annual demand (106m3/a)DemandName
DemandType 1995 2010 2020 2030
Description
DEM1 Urban 0.23 2.37 4.29 4.39 Bergville, Emmaus
DEM2 Rural 0.83 8.87 12.02 12.24 Community water supply
DEM3 Urban 0.00 0.00 2.27 6.22 Ladysmith (part)
DEM3b Urban 1.38 6.25 7.89 7.89 Ladysmith (drawing fromSpioenkop Dam)
DEM4 Urban 6.23 28.15 45.19 62.77 Ezhakeni, Pieters industry
DEM5 Urban/rural 0.54 2.43 3.16 4.39 Driefontein, Peacetown
DEM6 Urban 0.54 9.63 14.23 14.55 Winterton, Loskop
DEM7 Urban/rural 0.89 1.96 2.78 3.50 Colenso, Nkanyezi
DEM10 Urban 22.69 42.92 61.79 95.68 Newcastle, Madedeni, Osizweni
DEM11 Urban 5.26 8.77 12.56 23.32 Dundee, Glencoe, Utrecht
DEM12 Rural 2.83 12.18 21.46 32.63 Community water supply
DEM13 Urban/ind. 9.85 12.81 19.28 25.25 Mandini area
DEM14 Urban/rural 7.05 20.58 32.69 46.33 Klipriver area
DEM15 Urban/ind. 2.27 6.628 10.26 14.52 Tugela Ferry
DEM16 Urban 22.11 24.93 28.81 35.19 Estcourt area
DEM17 Urban 1.48 1.67 3.79 4.61 Weenen, Noodkamp
DEM18 Urban/rural 2.66 3.00 3.95 4.83 Kwadamini, KwaMazel, Sobabili
DEM19 Urban 0.14 0.32 0.73 1.07 Wakkerstroom, Esizamelani
DEM20 Urban 1.04 2.46 4.20 6.22 Volksrust, Charlestown
DEM21 Urban/ind. 1.06 2.53 4.61 6.82 Durnacol, Dannhauser
TOTAL 89.08 258.11 295.96 412.42
Note: The pre-feasibility DEM8 and DEM9 mean annual urban demands totalling 7.39x10⁶m3/a for 2030were included in the Mooi system
Table 3.5: Return flows
Annual return flow (106m3/a)Return flowname 1995 2010 2020 2030
Description
LADY 3.15 14.22 22.20 30.57 Ladysmith
UTREC 0.74 1.23 1.73 2.24 Utrecht
DUND 1.77 2.95 4.55 5.87 Dundee
VOLKS 16.42 38.89 53.29 78.92 Newcastle, Volksrust
DURN 0.61 1.46 2.30 3.42 Durnacol
ESCRT 8.07 9.10 14.41 17.74 Estcourt
TOTAL 30.76 67.85 98.48 138.76
Note: The pre-feasibility MOOI.RET mean annual return flows of 0.16, 0.43, 0.58 and 0.77x10⁶m3/a for1995, 2010, 2020 and 2030 respectively are included in the Mooi system

March 2001 PBV000-00-5599
_______________________________________________________________________________________________ ___
__________________________________________________________________________________________________THUKELA WATER PROJECT FEASIBILITY STUDY
WATER RESOURCE EVALUATION AND SYSTEMS ANALYSIS TASKMAIN REPORT
12
3.5.6 Inter-basin transfers
There are two current schemes to transfer water from the Thukela basin to theVaal. The largest is the Thukela-Vaal Scheme that diverts water primarily atDriel Barrage with inflow regulated by Woodstock dam. The design capacityof the combined scheme is 23m3/s but this is not available on a firm basis andthe scheme is normally operated to transfer at a maximum rate of 20m3/s.The average transfer rate achievable by this scheme is 17.3m3/s. Thesecond scheme is the transfer of 28x106m3/a from Zaaihoek dam (2030requirement) for Majuba power station.
It is proposed to transfer 250x106m3/a from the lower Thukela at Middledrift tothe Mhlathuze catchment. This scheme is currently transferring 34x106m3/aand is expected to reach full capacity by 2010.
A Mooi-Mgeni transfer scheme is planned and is expected to be in operationin the near future. The capacity of this scheme will be 120x106m3/a butdelivery will depend on water levels in the Mgeni dams. This transfer isincluded in the detailed Mooi system model that is used to provide the inflowtime series for the Thukela system model.
The average inter-basin transfers used in the system model are summarisedin Table 3.6.
Table 3.6: Mean annual inter-basin transfers from the Thukela system
Transfer (106m3/a)TransferName 1995 2010, 2020 &
2030
Description
Thukela-Vaal 631.15 631.15 Existing Drakensberg transfer to Vaal
Zaaihoek 1.99 47.34 Existing Zaaihoek transfer to Vaal
Mhlathuze 0.00 252.46 Proposed Middledrift transfer to Mhlathuze
TOTAL 633.14 930.95
Note: The MOOI-MGENI scheme transfers up to 120x106m3/a and is included in the Mooi system
3.5.7 Instream and estuarine flow requirements.
The IFR and the EFR sites are listed in Table 3.7.

March 2001 PBV000-00-5599
_______________________________________________________________________________________________ ___
__________________________________________________________________________________________________THUKELA WATER PROJECT FEASIBILITY STUDY
WATER RESOURCE EVALUATION AND SYSTEMS ANALYSIS TASKMAIN REPORT
13
Table 3.7: IFR and the EFR sites
IFR name Location
IFR 2 Thukela downstream of Jana Dam
IFR 3 Bushmans downstream of Mielietuin Dam
IFR 5 Thukela downstream of the , Bushmans and Sundays confluences
EFR Thukela estuary
IFR A Thukela downstream of Spioenkop Dam
IFR BUF Buffels at Thukela confluence
IFR SUN Sundays at Thukela confluence
IFR C Thukela downstream of Driel Barrage
Note: IFR's for the Mooi River are included in the Mooi system
The IFR specialists defined drought, maintenance flows and floods for theIFR’s. These requirements were used as input to specialist software togenerate an IFR time series. These time series were used together with thereference node time series to derive the data for the WRYM datafile. Thisdata gives the relationship between inflow at the reference node(s) and IFR foreach calendar month. These are included in Appendix M of the “WaterResources System Model” supporting report. The maximum, minimum andaverage requirement for each IFR over the 70-year simulation period is listedin Table 3.8. It should be noted that the values given in Table 3.8 are basedon the monthly IFR requirements. Actual flows at the IFR sites will oftenexceed the requirement because of water released for downstream users andbecause of the upstream reservoir spilling.
Table 3.8: Maximum, Minimum and Average IFR requirements
IFR site Maximum(m3/s)
Minimum(m3/s)
Average(m3/s)
IFR A (“low” IFR scenario) 21.26 0.65 3.47
IFR A (“high” IFR scenario) 27.60 1.24 7.04
IFR C (“low” IFR scenario) 19.49 0.63 4.01
IFR C (“high” IFR scenario) 33.04 0.77 7.79
IFR 2 40.59 1.00 8.18
IFR 3 8.60 0.40 2.17
IFR 5 56.22 1.40 12.08
IFR SUN 3.04 0.78 1.75
IFR BUF 4.47 0.19 1.13
EFR 10.00 1.00 5.88
3.5.8 Elevation-storage-area data of Jana and Mielietuin
The elevation-area-storage relationship used for Jana and Mielietuin dams arelisted in Tables 3.9 and 3.10 respectively.

March 2001 PBV000-00-5599
_______________________________________________________________________________________________ ___
__________________________________________________________________________________________________THUKELA WATER PROJECT FEASIBILITY STUDY
WATER RESOURCE EVALUATION AND SYSTEMS ANALYSIS TASKMAIN REPORT
14
Table 3.9: Elevation-area-storage relationship for Jana Dam
Elevation(m)
Area(km2)
Storage(106m3)
Elevation(m)
Area(km2)
Storage(106m3)
704 0.00 0.23 830 17.84 812.06
720 0.25 3.68 840 20.40 1004.29
740 1.60 22.98 850 23.89 1226.14
760 4.21 82.23 860 27.44 1482.56
780 7.06 197.57 870 31.27 1776.62
800 10.89 377.15 880 36.04 2190.00
810 13.17 498.31 890 41.27 2652.00
820 15.57 643.71
Table 3.10: Elevation-area-storage relationship for Mielietuin Dam
Elevation(m)
Area(km2)
Storage(106m3)
Elevation(m)
Area(km2)
Storage(106m3)
938 0.00 0.00 1002 6.84 150.45
950 0.09 0.32 1010 7.99 209.58
960 0.61 3.42 1018 9.57 279.27
970 1.71 14.57 1024 11.68 342.20
978 2.83 32.53 1030 14.58 420.57
986 4.30 60.86 1034 16.67 482.89
994 5.66 100.44 1040 20.34 594.07
3.5.9 Dummy farm dams
Seven dummy dams were used in the system model to represent thenumerous farm dams in the catchment. The location and capacities of thesedummy dams are listed in the Table 3.11.
Table 3.11: Dummy dams
Dummydam No.
Catchment description Storage(106 m3)
1 Upstream of Woodstock Dam 14.14
2 Downstream of Driel and upstream of Spioenkop Dam 32.38
3 Upper reaches of the Little Thukela river 36.16
4 Upper reaches of the Klip river 48.86
5 Between the confluence of the Klip with the Thukela rivers, and Jana, but noton the Thukela river
41.75
6 Upper reaches of the Sundays river 28.19
7 Between V3 and Rork irrigation of the Buffels river, but not on the Buffels river 38.18
Total storage in dummy dams 239.66
March 2001 PBV000-00-5599
_______________________________________________________________________________________________ ___
__________________________________________________________________________________________________THUKELA WATER PROJECT FEASIBILITY STUDY
WATER RESOURCE EVALUATION AND SYSTEMS ANALYSIS TASKMAIN REPORT
15
4 COMPARATIVE YIELD CURVES FOR KLIP AND JANA SITES
4.1 Yield analyses
The relationship between storage at full supply level and yield for the twoproposed dams (Klip and Jana) was required early in the study as importantinformation in the selection of the preferred site for storage in the ThukelaRiver. As the two sites are situated close to one another on the same river,the catchments are virtually the same and the effect of the rest of the Thukelasystem on the yields from the two proposed dams would be the same. It wastherefore appropriate to use the pre-feasibility system model suitably revisedto include IFR channels, updated elevation-area-storage data for the proposedreservoirs and the extended hydrology for the comparative analyses.
Historic firm yields from a range of storage sizes for Klip and Jana weredetermined for the following four scenarios:
• Total firm yield• Transferable yield• Transferable yield without IFR’s and the EFR supplied• Transferable yield with IFR’s but without the EFR supplied
These scenarios were necessary to assess the worth and cost effectiveness ofboth sites from a national and project perspective as well as the impact ofIFR’s and the EFR on system yield.
4.2 Historic storage-yield
The yield for a range of FSL’s at each site are given in section 4 of thesupporting report “Comparative Yield Curves for Klip and Jana Sites”. Theresults showed that 10% to 15% of the total yield from Jana or Klip Dam wouldbe required for downstream demands and transfers, 40% to 50% for IFR’s andonly 40% to 50% would be available for additional transfer to the Vaal.
It should be noted that the yield estimates presented in section 4 of the above-mentioned report are for comparison between the Jana and Klip sites only andshould not be used to assess transferable yield from the sites.
The estimates analyses show that for equal storage, yield from the two damswould be equal. Accordingly, selection between the two sites will not be afunction of the hydrology. Importantly, much larger storage could be providedat Jana as the FSL at Klip is limited by the proximity of Colenso Town.
After a comparative evaluation of the two sites taking all aspects into account,Jana site was selected for further consideration. Accordingly the rest of theWater Resources study focussed only on the Jana Site and no furtherreference is made to storage at Klip.

March 2001 PBV000-00-5599
_______________________________________________________________________________________________ ___
__________________________________________________________________________________________________THUKELA WATER PROJECT FEASIBILITY STUDY
WATER RESOURCE EVALUATION AND SYSTEMS ANALYSIS TASKMAIN REPORT
16
5 WATER RESOURCES EVALUATION
The “Water Resources Evaluation” supporting report describes the analysesthat were done to determine the effect of changes in demands and operatingrules on yield from the proposed dams, final historic and stochastictransferable yields and to estimate filling times for Mielietuin and Jana dams.
5.1 Sensitivity analyses
The Thukela system is large and extremely complex and it is not always easyto envisage how changes to one part of the system may affect the functioningof the rest of the system. Analyses were done to assess the effect ontransferable yield of the following:
• System sensitivity to IFR’s and the EFR• Effect of the size of Mielietuin Dam on the transferable yield from Jana
Dam• Irrigation upstream of Spioenkop Dam• The current system• 2010, 2020 and 2030 demand scenarios• Effect of Mhlathuze transfer on yield from Jana• Transferable yield curves for Uitkyk and Buffelshoek Dams• Mielietuin and Jana dams storage-transferable yield curves
These issues are briefly described in what follows.
5.1.1 Sensitivity of yield to changes in the IFR’s and the EFR
Analyses were done to assess the effect of changes in the IFR and the EFRon transferable yield. These changes included reducing the maintenance anddrought flows by 10% and increasing the frequency of drought flows. Theresults showed that a significant increase in transferable yield could beachieved, from a water resources perspective, with small changes in the IFR’s.These findings were presented to the IFR specialists at the November 1998workshop. The reductions in maintenance and drought flows, even by as littleas 10%, were regarded as unacceptable by the specialists. They did,however, propose changes that effectively extended the period of transitionbetween drought and maintenance flows. This philosophy was used in re-defining all IFR’s in the Thukela.
5.1.2 Effect of the size of Mielietuin Dam on the transferable yield from Jana.
Analyses to determine the effect on the transferable yield from Jana Dam ofchanging the size of Mielietuin Dam showed that the yield from Jana is notaffected as long as the firm transferable yield is abstracted at Mielietuin. Thisis because, when the firm yield from Mielietuin is being abstracted, the damwill only spill during very wet periods when there is plenty of water availablefrom the rest of the system to supply the downstream demands withoutreleases being made from Jana.

March 2001 PBV000-00-5599
_______________________________________________________________________________________________ ___
__________________________________________________________________________________________________THUKELA WATER PROJECT FEASIBILITY STUDY
WATER RESOURCE EVALUATION AND SYSTEMS ANALYSIS TASKMAIN REPORT
17
5.1.3 Irrigation upstream of Spioenkop Dam
Some concern was raised as to the likelihood of irrigation areas upstream ofSpioenkop Dam increasing as projected. Analyses showed that there was nodifference in the transferable yield from Jana whether the irrigation areastayed at its present level or increased as projected. However, with lessirrigation the average transfer through the existing Drakensberg PumpedStorage Scheme would increase slightly.
5.1.4 The current system
A present day analysis was done to gain an understanding of the currentsystem and to assess the effect that IFR's would have on supplying presentday demands. Analysis showed that only the transfers from the existingThukela-Vaal scheme would reduce if IFR's were implemented. This isbecause IFR A has to draw on Woodstock Dam to be fully supplied i.e. underpresent day conditions only the reach of river downstream of Spioenkop haslower flows than required by the IFR's.
5.1.5 2010, 2020 and 2030 demand scenarios
Comparative assessment was required for 2010, 2020 and 2030 demandscenarios to assess future trends in demand and identify possible watershortages and the need for future planning within the Thukela Basin. Allproposed dams and transfers were included in the analyses. Supply of in-basin demands for the three scenarios were not affected but transferable yieldfrom Jana and Mielietuin dams decreased over time.
5.1.6 Effect of Mhlathuze transfer on yield from Jana
The transferable yield from Jana was determined with the Mhlathuze transferset to 34, 85 and 250x106m3/a. In all cases the same yield was obtained atJana Dam. This shows that the Mhlathuze transfer is supported from theBuffalo River (Chelmsford Dam) and Mooi River and does not need to besupplied from Jana Dam. This finding confirms the conclusions drawn in theMhlathuze Basin augmentation feasibility study (DWAF) done some yearsago.
5.2 Assessment of changes to the system model on transferable yield
Numerous historic yield analyses have been carried out on Jana andMielietuin as a result of new and updated information as well asenhancements to the system model. Detailed checks on the system werecarried out at each stage of the revisions to the model and any shortfalls insupply were investigated and explained. Some changes resulted in anincrease and others in a decrease in transferable yield as follows:
5.2.1 Revised assessment of water demands
In line with the requirement that all in-basin demands should be fully suppliedbefore water is transferred, full irrigation demands were included at a highsecurity of supply. This is clearly unrealistic, as irrigators do not require the

March 2001 PBV000-00-5599
_______________________________________________________________________________________________ ___
__________________________________________________________________________________________________THUKELA WATER PROJECT FEASIBILITY STUDY
WATER RESOURCE EVALUATION AND SYSTEMS ANALYSIS TASKMAIN REPORT
18
same assurance of supply as primary users. Restricting supply to irrigatorsduring droughts was considered but regarded as too complex to implement inthe Thukela system model at this stage. It was agreed that supplying irrigatorswith 75% of their demand at the same assurance as primary users would be amore practical way of allowing for reduced supply to irrigators in the systemmodel. This approach will have to be refined in the next phase of the projectcycle. Reducing irrigation increased the water that could be transferred.
The assessment of transferable yield also increased after the Newcastle,Madedeni and Osizweni urban demand in the Buffalo catchment was revised.This demand was significantly reduced from the original 2030 projection in are-evaluation of projected demands. The decrease of about 55x106m3 (2030development level) resulted in an increase in transferable yield from Jana.
Transfers from Zaaihoek for Majuba Power Station were also reduced inaccordance with the latest information received from Eskom and resulted in anincrease in transferable yield from Jana.
5.2.2 Incorporation of additional farm dams
The inclusion of additional farm dams made possible using the Mark 5 versionof WRYM resulted in more water being available for irrigators. This reducesflow in the rivers resulting in lower inflow to Jana and a greater dependency onJana from downstream demands causing a reduction in transferable yield.
5.2.3 Revision to Zaaihoek hydrology
Inflow time series in the upper reaches of the Buffalo catchment were revised.The revision affected two of the system model inflow time series and resultedin a net decrease in inflow. This caused a reduction in the transferable yield.
5.2.4 Revision to IFR’s and addition of new IFR’s
Small changes made to IFR2, IFR3 and IFR5 had a negligible effect ontransferable yield. The inclusion of new IFR’s had a more significant effect.Inclusion of IFR’s in the Sundays and Buffalo rivers reduced the burden onJana Dam to release water for IFR5 and the EFR. This addition increasedtransferable yield from Jana Dam. The two new IFR’s upstream of Jana Damcause an increase in inflow to the dam. This causes the transferable yield toincrease, however, to fully supply these IFR’s, releases have to be made fromWoodstock and Spioenkop Dams. This reduces transfers by the existingThukela-Vaal Scheme. Overall transferable yield from the Thukela-Vaalscheme and the Jana Dam reduces when the FSL in Jana is less than 840mamsl because some of the water released from Woodstock for the IFR’s isspilled at Jana. Above 840m amsl losses from the Thukela-Vaal scheme aremade up by increases in transfers from Jana albeit at much increased cost asa result of the higher pumping and enlarged infrastructure that would berequired.
March 2001 PBV000-00-5599
_______________________________________________________________________________________________ ___
__________________________________________________________________________________________________THUKELA WATER PROJECT FEASIBILITY STUDY
WATER RESOURCE EVALUATION AND SYSTEMS ANALYSIS TASKMAIN REPORT
19
5.2.5 Revised period of inflow time series
The period of the streamflow time series was changed from 1920 to 1994 to1925 to 1994 to be compatible with the Mooi River inflow time seriesgenerated using the detailed Mooi-Mgeni system model. In the historicanalyses yields were not affected by the shorter simulation period because thediscarded years do not affect the critical period in the seventies. Thisshortened time series will affect generation of stochastic time series butbecause the discarded years are above average, yields determined using thestochastic time series will be conservative.
5.2.6 Uitkyk and Buffelshoek Dams
Including Uitkyk and Buffelshoek dams together with their IFR’s in the systemmodel increased transferable yield from Jana by 1.5m3/s. Shoulddevelopment of these dams to supply local demands and IFR's on theSundays and Buffalo Rivers, be delayed or not implemented, the transferableyield from Jana would decrease because the burden of meeting the IFR of thelower Thukela would become the responsibility of Jana Dam.
5.3 Feasibility yield analyses
The feasibility study transferable yields were determined using the systemmodel shown in Drawing W5 with inflow time series, data and information asdescribed in Section 3.5 of this report.
5.3.1 Historic yield analyses
The transferable yield from Mielietuin Dam depends on requirements in theBushmans River catchment only since it was assumed that Jana Dam wouldrelease water for demands downstream of the Bushmans-Thukela confluence.Also the transferable yield from Jana Dam was shown to be independent ofthe size of Mielietuin Dam as long as the firm transferable yield was abstractedfrom Mielietuin. Accordingly the system model was used to determine thetransferable yield from Mielietuin Dam for a range of dam sizes and then thecorresponding transferable yields for Jana Dam were determined bysimulation with Mielietuin Dam transferring at capacity. The transferable yieldfrom Jana Dam is affected by the upstream IFR’s (Woodstock andSpioenkop). The uncertainty relating to the IFR below the existing transferscheme could not be resolved during the feasibility study but will be resolvedin a separate study in which the Reserve is determined for the whole Thukelabasin. To cope with this uncertainty, an upper and lower likely bound was setto the IFR and the scheme configuration and transferable yields determinedfor these two possible extremes. This range of uncertainty only affects theyield from the Jana Dam and not the yield from Mielietuin Dam. It is expectedthat the actual Reserve will lie somewhere in between the two extremes. Thehistorical yield analysis results for the Mielietuin and the “low” and “high” IFRscenarios for Jana are summarised in Tables 5.1 to 5.3.

March 2001 PBV000-00-5599
_______________________________________________________________________________________________ ___
__________________________________________________________________________________________________THUKELA WATER PROJECT FEASIBILITY STUDY
WATER RESOURCE EVALUATION AND SYSTEMS ANALYSIS TASKMAIN REPORT
20
Table 5.1: Transferable yield from Mielietuin Dam
Full supply level(m amsl)
Working storage(106m3)
Transferable yield(106m3/a)
1010 206 105
1015 250 114
1020 297 123
1025 352 129
1030 417 137
1033 464 141
1035 498 143
Table 5.2: Transferable yield from Jana Dam – “low” IFR
Full supply level(m amsl)
Working storage(106m3)
Transferableyield (106m3/a)
800 364 204
820 630 271
840 991 322
850 1213 335
860 1469 351
870 1763 368
880 2177 393
890 2639 422
Table 5.3: Transferable yield from Jana Dam – “high” IFR
Full supply level(m amsl)
Working storage(106m3)
Transferable yield(106m3/a)
800 364 253
820 630 347
840 991 416
850 1213 431
860 1469 446
870 1763 464
880 2177 489
890 2639 517
For the low and high IFR scenarios, the transfers possible from the existingThukela-Vaal Scheme transfer reduce from the 527 million m3/a which iscurrently possible (using 2030 in-basin demands) to 448 million m3/annum and357 million m3/annum respectively. Water released from Driel Barrage andSpioenkop Dam to supply IFRs will, however, make more water available fortransfer from Jana and it was found that the total transferable yield from thecombined transfer schemes (existing plus Jana and Mielietuin Dams) is thesame for both high and low IFR scenario (see Figure 5.1). In other words, theamount of water which can be transferred from the Thukela basin to the Vaal

March 2001 PBV000-00-5599
_______________________________________________________________________________________________ ___
__________________________________________________________________________________________________THUKELA WATER PROJECT FEASIBILITY STUDY
WATER RESOURCE EVALUATION AND SYSTEMS ANALYSIS TASKMAIN REPORT
21
River System is essentially the same whether it is pumped from Jana Dam orthe Driel Barrage. However, there is a cost implication since the cost ofpumping from the Jana Dam, at a much lower elevation than the Driel barrage,will be higher. The aqueduct capacity from the Jana/Mielietuin system wouldhave also have to be greater for the high IFR scenario.
Figure 5.1: Average transferable yield from the existing Drakensberg
scheme and the Jana Dam
The target of the TWP is to transfer an additional 15m3/s to the Vaal RiverSystem. At the time of preparing the ToR for the study it was not envisagedthat operating policy in the Thukela would affect the existing transfer scheme.Simulations show that under current operating rules and 2030 in-basindemands the average transfer rate for this scheme is 16.7m3/s. Thus thecombined target delivery of the existing and proposed schemes would be31.7m3/s. Subsequently changes in operating strategies result in water beingreleased from Woodstock Dam to supply IFR's. Water released fromWoodstock Dam cause the average transfer via the existing Thukela-VaalScheme to reduce. However, as the water flows into Jana it can betransferred from there. To preserve the total target transfer of 31.7m3/s theproposed scheme should transfer 15m3/s plus the reduction in transfer via theexisting scheme. These operating rules must be optimised during the nextphase of the project cycle. It also should be noted that if Jana is not built, IFRswould still have to be released from the upper catchment storage units.
Transmission losses between the proposed dams at Mielietuin and Jana andKilburn are expected to be approximately 0.5m3/s for canal aqueducts andclose to zero for pipelines. This should also be included in transferable yieldsfrom the proposed dams.
AVERAGE TRANSFER FROM EXISTING THUKELA-VAAL SCHEME & JANA DAM
760
780
800
820
840
860
880
840 845 850 855 860 865 870 875 880 885 890
Jana Full Supply Level (masl)
Low IFR High IFR
Transferableyield (106m3a)

March 2001 PBV000-00-5599
_______________________________________________________________________________________________ ___
__________________________________________________________________________________________________THUKELA WATER PROJECT FEASIBILITY STUDY
WATER RESOURCE EVALUATION AND SYSTEMS ANALYSIS TASKMAIN REPORT
22
5.4 Long-term stochastic analysis
The historic yield analysis gives no indication of the assurance of yield. Inorder to determine assurance, long-term stochastic analyses were done using201 stochastic inflow sequences each 70-years long. The yield assurancerelationships for Jana and Mielietuin were analysed for a range of sizes foreach dam. The system operates so that Jana and not Mielietuin would supplydemands downstream of the confluence of the Bushmans and Thukela Rivers.Thus the transferable yield from Mielietuin is independent of the rest of thesystem. For Jana, water spilled from Mielietuin will be available to usersdownstream of the Bushmans-Thukela confluence and could therefore reducedemands on Jana. Thus theoretically the transferable yield from Jana willdepend on the size and draft on Mielietuin. However, both the historic andstochastic analyses showed that as long as the draft from Mielietuin equalledit’s firm yield for the desired assurance, the size of Mielietuin did not affect thetransferable yield from Jana.
Due to the fact that the IFR’s below Driel Barrage and Spioenkop Dam affectsthe transferable yield at Jana, results have been shown for the two IFRscenarios (“low” and “high”) between which the final IFR's for these sites isexpected to fall. The “low” scenario relates to reaches below Driel Barrageand Spioenkop Dam being both class ”D” rivers and the “high” scenario relatesto a class “B/C” below Driel Barrage and a class “B” below Spioenkop Dam.Tables 5.4 to 5.6 show the results of the stochastic analyses for Mielietuin andJana for levels of assurance of 95, 98 and 99 percent. The results show thatfor the “high” IFR scenario, the transferable yield from Jana is 2.5 to 3m3/smore than for the “low” scenario. Additional yield is available becauseWoodstock and Spioenkop dams have to release more water to satisfy the“high” IFR scenario. Both the “low” and “high” IFR scenarios reduce theaverage transfer to the Vaal from the existing Drakensberg scheme.
Table 5.4 : Transferable yield from Mielietuin (Stochastic analysis)
Transferable yield at assurance of
95% 98% 99%
Reservoir FSL(m amsl)
106m3/a 106m3/a 106m3/a
1015 125 108 99
1025 136 120 112
1033 147 129 122

March 2001 PBV000-00-5599
_______________________________________________________________________________________________ ___
__________________________________________________________________________________________________THUKELA WATER PROJECT FEASIBILITY STUDY
WATER RESOURCE EVALUATION AND SYSTEMS ANALYSIS TASKMAIN REPORT
23
Table 5.5: Transferable yield from Jana – “low” IFR1
Transferable yield at assurance of
95% 98% 99%
Reservoir FSL(m amsl)
106m3/a 106m3/a 106m3/a
810 300 260 235
840 390 338 315
860 435 390 355
890 520 455 420
Table 5.6: Transferable yield from Jana – “high” IFR1
Transferable yield at assurance of
95% 98% 99%
Reservoir FSL(m amsl)
106m3/a 106m3/a 106m3/a
810 380 340 310
840 490 435 400
860 530 485 450
890 610 545 520Note 1: Yields quoted for Jana Dam are correct only when abstraction at Mielietuin is at the same
assurance.
5.5 Reservoir filling time analysis
The time required to fill the proposed dams will affect the timing of the programfor design and construction so that the dams can be commissioned in time tosupply demands. Filling times were assessed by simulation using 201stochastic inflow time series and starting with the dams empty. Demandswere set to 2010 levels except for existing and planned transfers and the Mooisystem, which were left at 2030 level, both of which should have a minimalimpact. Filling times for Mielietuin Dam were determined with no TWPtransfers. For the Jana analysis, the level of Mielietuin was set at 1020m andthe 1:20 year transferable yield (i.e. 95 % level of assurance) was abstractedfrom the dam. No TWP transfers were imposed on Jana Dam for the analysis.The analyses results were processed using the in-house program PLOTANL.This program presented as a function of time “box and whiskers” plots of thewater levels in the dams. The number of wet seasons to fill the dams at anassurance of 95 percent to 25, 75 and 100 percent of working storage wasread off the plots and are summarised in Table 5.7. Analyses were done forJana Dam with both the “low” and “high” IFR scenarios.

March 2001 PBV000-00-5599
_______________________________________________________________________________________________ ___
__________________________________________________________________________________________________THUKELA WATER PROJECT FEASIBILITY STUDY
WATER RESOURCE EVALUATION AND SYSTEMS ANALYSIS TASKMAIN REPORT
24
Table 5.7: Reservoir filling times (with 95% confidence)
Wet seasons to fill dam at assurance of 95% toFull supplylevel (m) 25% 50% 75% 100%
Mielietuin1033 3 4 5 61025 2 3 4 51020 2 3 4 5
Jana “low” IFR scenario890 4 6 8 10875 3 5 6 9860 3 4 5 8835 2 3 3 5
Jana “high” IFR scenario890 3 5 6 8875 3 4 5 6860 3 4 5 6835 2 3 3 5
5.6 Short term yield analyses
It is intended that first delivery of water to the transfer scheme shouldcommence before the dams are full. How full the dams need to be beforetransfers commence depends on the accepted risk of shortfalls occurring inthe short term. Accordingly analyses were done to assess the risk of shortfallsif the full transfers were commenced when the dams were 25, 50 and 75% full.Only the preferred dam sizes at Mielietuin and Jana of 1025 m amsl and 860mamsl respectively were analysed.
The feasibility system model was used in the analyses with 201 stochasticinflow sequences each 5-years long and demands set at 2010 levels. Theresults showed that the short-term risk of failure to supply the target draftwould not be worse than 1:20 years.

March 2001 PBV000-00-5599
_______________________________________________________________________________________________ ___
__________________________________________________________________________________________________THUKELA WATER PROJECT FEASIBILITY STUDY
WATER RESOURCE EVALUATION AND SYSTEMS ANALYSIS TASKMAIN REPORT
25
6 WATER QUALITY
Consideration of water quality was limited to that pertaining to IFR releasesand transferable yield. This summary was taken from the report “SpecialistStudy on the Impacts Relating to the creation of Impoundment’s for theThukela Water Project on Water Quality and the Water Quality that will bereleased” undertaken by the Integrated Environmental Module of TWPFeasibility Study.
The Thukela and Klip rivers that will feed Jana show good water quality withregard to inorganic constituent concentrations that will not affect any userdetrimentally. Water that will flow into Mielietuin will show the effects ofpollution from Estcourt as raised (but still low) conductivity levels andassociated ion concentrations. Elevated phosphate-P concentrations willstimulate algal growth, possibly resulting in mesotrophic conditions.
Regarding the water quality in Jana and Mielietuin and the likely quality ofdownstream releases, three components were evaluated as follows:
• Inflow to the dams• dam surface water• water at the bottom of the dam
Due to settlement of sediment, bottom water releases will be turbid and henceincrease the turbidity in the relevant rivers whereas surface water spills willresult in far lower turbidity in the rivers than normal. Iron and manganeseconcentrations in downstream rivers would be reduced by a factor of abouttwo when surface water is spilled whereas when bottom water is released,high concentrations of reduced dissolved iron and manganese could haveharmful environmental effects. E. coli levels should drop drastically in thedams and in spilled and released water. The pH of surface water spills shouldnot affect the rivers much but bottom water releases are likely to have lowerpH values by about 0.5 to 1.0 pH units, which are potentially harmful to theecosystem (although the overall pH is generally within tolerable limits). Totalammonia concentrations are much higher in bottom water and about 45% ofbottom water releases could be harmful to the ecosystem due to the toxic freeammonia content.
Changes in temperature of the rivers below the dams will depend on the levelthe water is released from and the time of year. Maximum temperaturedifferences between surface and bottom water of about 10°C should occur inJanuary/February and could cause considerable shock to the ecosystem whenmonthly bottom water releases introduce much colder water to the rivers.Temperature changes for aquatic considerations should generally not exceed2°C. Dissolved oxygen concentrations could be depleted below 4 mg/l (lowerlimit for aquatic life) and the great depths of Jana and Mielietuin may preventmixing and as a result bottom water releases would be anoxic the whole yearround. These effects should be confined to a relatively short length of riverbelow the dams and could be mitigated by storage in tailponds.

March 2001 PBV000-00-5599
_______________________________________________________________________________________________ ___
__________________________________________________________________________________________________THUKELA WATER PROJECT FEASIBILITY STUDY
WATER RESOURCE EVALUATION AND SYSTEMS ANALYSIS TASKMAIN REPORT
26
7 CONCLUSIONS
A system analysis model of the Thukela River System was developed duringthe Feasibility Study that adequately simulates operation of the whole Thukelasystem including supplying water demands both inside and outside of thebasin and Instream Flow Requirements (IFR’s).
As can be expected, IFR's downstream of the proposed Jana and Mielietuindams significantly reduce the transferable yield from these dams. Dummydams were included in the Sundays and Buffalo rivers to supply local waterdemands in these catchments (assuming significant growth in irrigation waterdemand) as well as IFR's at their confluences with the Thukela. Thesedummy dams are to be either local developments or will later form part of apossible Northern Tributaries Transfer Development. Either way the dams willnot form part of the configuration of the currently proposed scheme. Thisreduced the burden on Jana dam to supply IFR's in the Thukela upstream ofthe Mooi confluence and the EFR allowing more water to be transferred. Thisassumption needs to be reviewed in the Decision Support Phase.
IFR's upstream of Jana Dam increase flow into the dam resulting in increasedtransferable yield from Jana. However, transfers via the existing Thukela-VaalScheme are reduced because releases have to be made from Woodstock andSpioenkop to supply the IFR's. The reduction in transfers via the existingDrakensberg Pumped Storage Scheme due to releases from Woodstock tosupply IFR's as well as transmission losses must be taken into considerationwhen sizing components of the proposed scheme. Releases from Woodstockto supply the IFR's will not affect the size of Jana Dam, but will affect thecapacity of the aqueduct from Jana. Based on the results of simulationanalyses to determine transferable yields from Mielietuin and Jana, acombination of dam sizes at the two sites could be selected to achieve thedesired delivery at Kilburn.
The preferred FSL’s for the dam are Mielietuin 1025 m amsl and Jana 860mamsl. The transferable yields for this option for the “low” and “high” IFRscenarios for the Woodstock and Spioenkop IFR's are shown in Table 7.1 .
Table 7.1 : Summary of Mielietuin (1025 MSL) and Jana (860mSL) option
IFRscenario
Assuranceof transfer
(%)
Average transferfrom existingDrakensberg
(m3/s)
Transferable yield fromMielietuin
(m3/s)
Transferable yield from Jana(m3/s)
95 14.4 4.3 13.8
98 14.4 3.8 12.4“low”IFR
99 14.4 3.6 11.3
95 11.5 4.3 16.8
98 11.5 3.8 15.4“high”IFR
99 11.5 3.6 14.3

March 2001 PBV000-00-5599
_______________________________________________________________________________________________ ___
__________________________________________________________________________________________________THUKELA WATER PROJECT FEASIBILITY STUDY
WATER RESOURCE EVALUATION AND SYSTEMS ANALYSIS TASKMAIN REPORT
27
The storages behind both the proposed dams are relatively large in terms ofthe catchment MAR at those points in the river system and therefore areexpected to take between 6 and 10 years to fill.
Most of the detrimental water quality effects downstream of the proposeddams could be minimised by ensuring that as much surface water is releasedas possible when monthly releases are made and that there is sufficientdilution in the dam tailponds. Spraying of water into tailponds is required torapidly re-oxygenate the water before entering the rivers. The effects ofvarying water quality should be further investigated in time. The quality of thetransferred water should be good, since this would comprise essentiallysurface water. Potential aggressiveness towards concrete needs to beinvestigated.


![LONGHORN PRICELIST - mainstream.co.ke · Pepea Na Kipepeo Utamu Kolea Series Usena Series ... [Kimeidhinishwa] Pamela M Ngugi 165.00 9966 36 222 3 Mgeni [Kimeidhinishwa] Prof Kitula](https://static.documents.pub/doc/80x56/5ae092887f8b9ad66b8e5472/longhorn-pricelist-na-kipepeo-utamu-kolea-series-usena-series-kimeidhinishwa.jpg)


