50
Tick Size Constraints, High Frequency Trading and Liquidity Chen Yao University of Warwick Mao Ye University of Illinois at Urbana-Champaign December 8, 2014
| Date post: | 29-Dec-2015 |
| Category: |
Documents |
| Upload: | jesse-greene |
| View: | 216 times |
| Download: | 0 times |

Tick Size Constraints, High Frequency Trading and Liquidity
Chen YaoUniversity of Warwick
Mao YeUniversity of Illinois at Urbana-Champaign
December 8, 2014

What Are Tick Size Constraints
Standard Walrasian equilibrium– Continuous price
Reality – Discrete prices– SEC rule 612: 1 penny tick size
• Prohibits stock exchanges from displaying orders in an increment smaller than $0.01 if the quotation, order, or indication of interest is priced equal to or greater than $1.00 per share.
– Price control • Price competition on liquidity provision is constrained
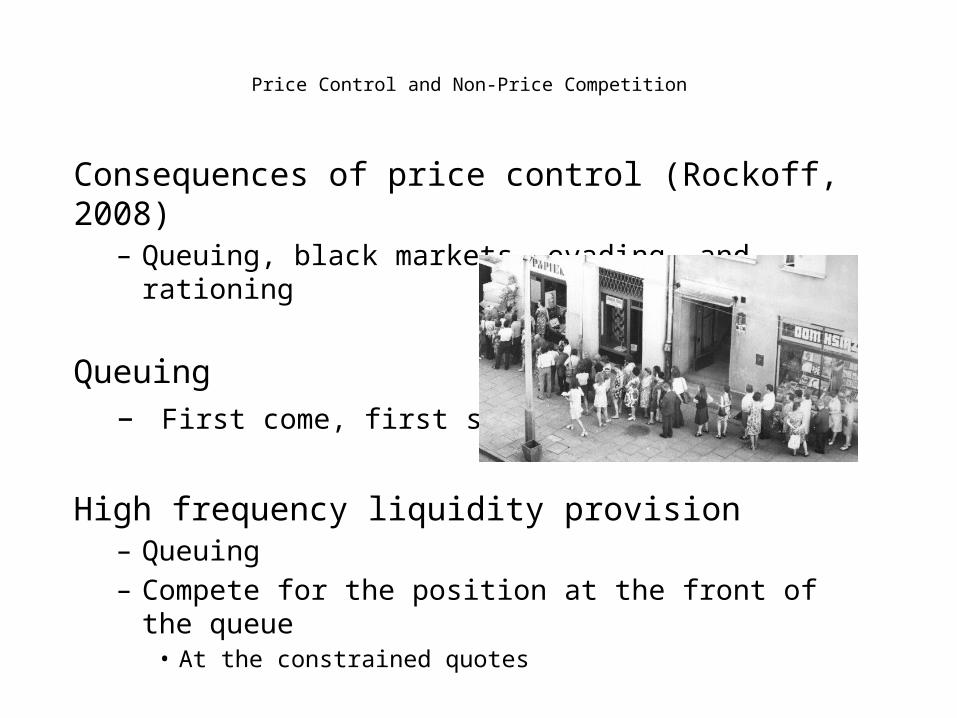
Price Control and Non-Price Competition
Consequences of price control (Rockoff, 2008) – Queuing, black markets, evading, and rationing
Queuing – First come, first served
High frequency liquidity provision – Queuing – Compete for the position at the front of the queue
• At the constrained quotes

Price vs. Time Priority
• NASDAQ market– Liquidity is provided by limit orders
• Price priority– limit orders offering better prices execute first • limit sells at lower prices• limit buys at higher prices
• Time priority– Limit orders at the same price are executed in the order in
which they have been submitted
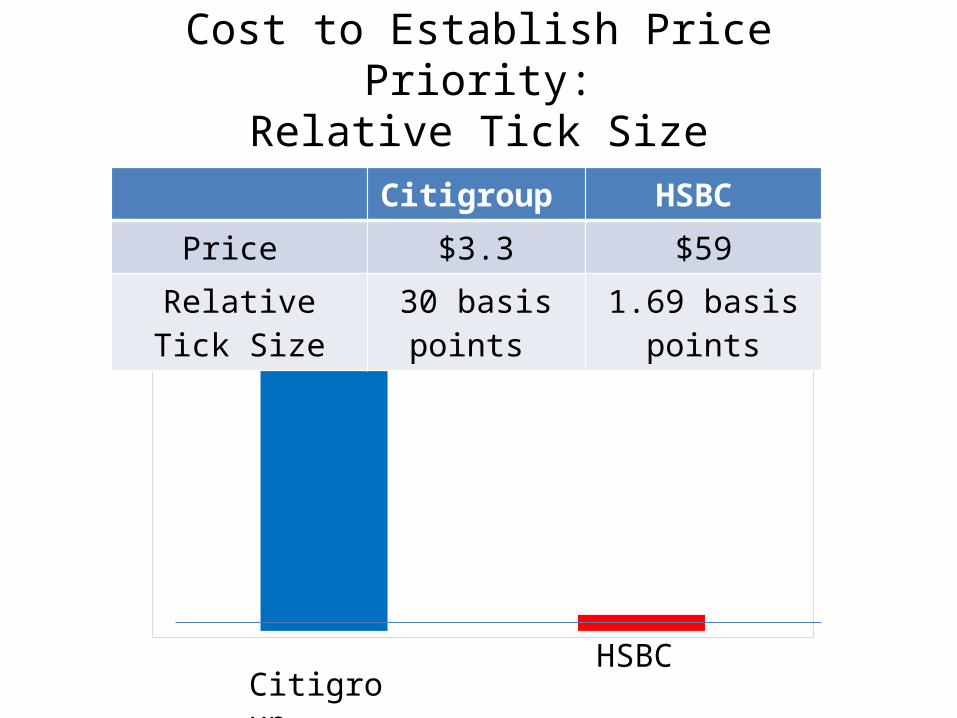
Cost to Establish Price Priority: Relative Tick Size
Citigroup HSBC Price $3.3 $59
Relative Tick Size 30 basis points 1.69 basis points
Citigroup HSBC

Price vs. Time Priority
HFT willing to quote proportional spread of 30
basis points
Non-HFT willing to quote proportional spread of 15
basis points

has time priority over (when they quote at the same price)
Relative Tick Size: 30 BPS
B
A
30 BPS
B
A
Willing to quote at 15 BPS
B
A
Willing to quote at 15 BPS
30 BPS

Relative Tick Size: 15 BPS
has price priority over
B
A
30 BPS
B
A
Willing to quote at 15 BPS
B
A
able to quote at 15 BPS
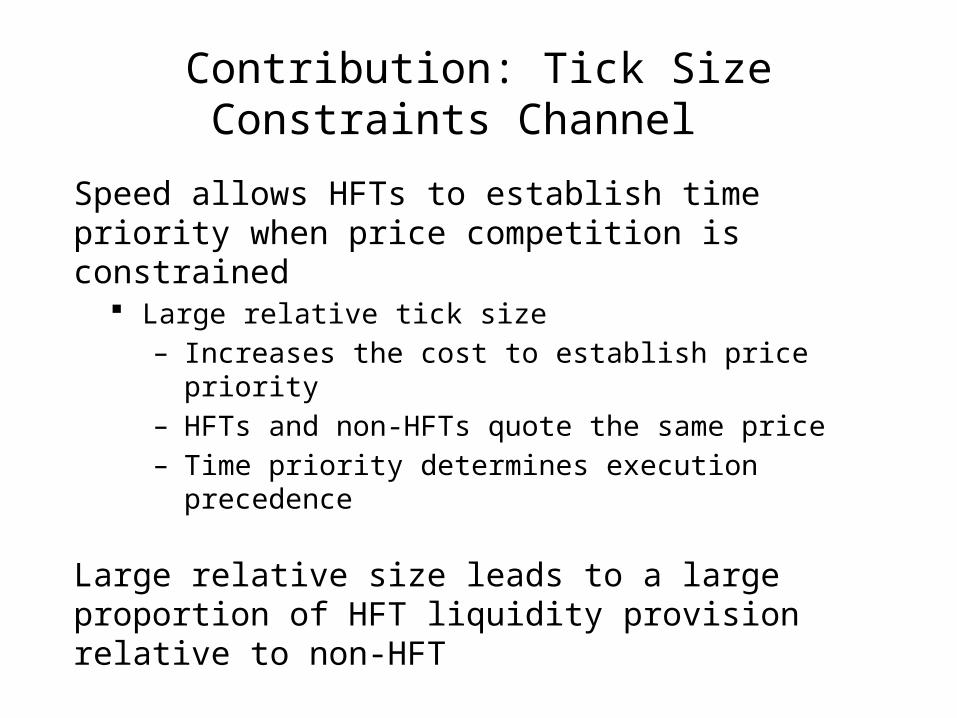
Contribution: Tick Size Constraints Channel
Speed allows HFTs to establish time priority when price competition is constrained
Large relative tick size– Increases the cost to establish price priority – HFTs and non-HFTs quote the same price – Time priority determines execution precedence
Large relative size leads to a large proportion of HFT liquidity provision relative to non-HFT

Two Existing Channels on HFTs
Price competition channel – Speed allows HFTs to provide better liquidity
• Avoid pick-off risk (Hendershott, Jones and Menkveld, 2011)• Better management of inventory (Brogaard et al , 2013)• Low cost of operation
Information channel– Speed allows HFTs to adversely select non-HFTs
• Fast access to information or Fast reaction to public information (Biais, Foucault and Moinas (2013) and Budish, Cramton and Shim (2013))

Compared to Price Competition Channel
We find that– HFTs do not quote better prices than non-HFTs
• Suggest the existence of other economic forces that encourage non-HFTs to establish price priority
– A large relative tick size increase the chances that HFTs and non-HFTs quote the same price • Facilitate HFTs to establish time priority • HFT liquidity provision is most active in low priced stocks

We identify – A non-informational driver of speed competition
• ETF Splits increase and reverse splits decrease HFT activity • Control group: ETFs track the same index but do not
splits/reverse splits – Same fundamental information
– Non-informational source of profit for speed competition• Large relative tick size leads to higher profits of liquidity
provision
Compared to Information Channel
Roadmap
Relative tick size and HFT liquidity provision – Double sorting – Regression analysis – Diff-in-diff test – Robustness checks
Relative tick size and profit of liquidity provision

Main Hypothesis on HFT Liquidity Provision
• Larger relative tick size causes more HFT liquidity provision relative to non-HFT
• Challenge: endogeneity (Roberts and Whited, 2012)– Omitted variables• Fail to control variables correlated with price as well as
HFT liquidity provision
– Reverse causality• HFT liquidity provision reduces nominal price

Identification Strategy
• Double sorting – Nominal share price is exogenous after controlling for
market cap (Benartzi, Michaely, Thaler and Weld , 2009)
• Regressions analysis – Variables that are correlated with nominal price – Variables that affect HFT liquidity provision
• Diff-in-diff regression of ETFs splits– Pilot: ETFs that split/reverse splits – Control: ETFs tracking the same index but are not treated

Roadmap
Relative tick size and HFT liquidity provision – Double sorting – Regression analysis – Diff-in-diff test – Robustness checks
Relative tick size and profit of liquidity provision

Data: NASDAQ HFT Dataset
• Snapshots of limit order book– The depth at best price from HFT and non-HFT in
each minute
• Trading volume with liquidity providers identified as HFTs or non-HFTs
• 120 stratified sample of stocks in October, 2010
Price Competition vs. Tick Size Constraints
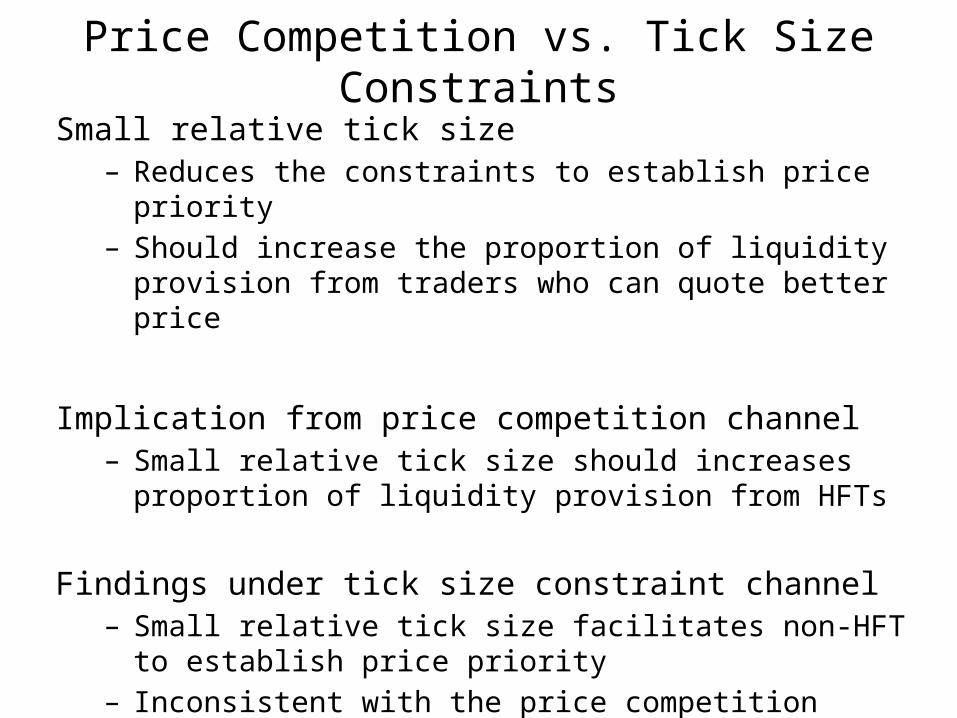
Small relative tick size – Reduces the constraints to establish price priority– Should increase the proportion of liquidity provision from traders
who can quote better price
Implication from price competition channel– Small relative tick size should increases proportion of liquidity
provision from HFTs
Findings under tick size constraint channel– Small relative tick size facilitates non-HFT to establish price priority – Inconsistent with the price competition channel– Suggests the existence of economic forces other than price
competition channel

(1) (2) (3) (4)
Relative Tick Size HFT Non-HFT HFT &
Ratio Only Only Non-HFT
Large
Cap
Large (Low Price) 1.60% 2.50% 95.90% 1.55
Medium (Medium Price) 11.90% 18.60% 69.60% 1.57
Small (High Price) 16.80% 37.70% 45.50% 2.25
Middle
Cap
Large (Low Price) 18.00% 15.20% 66.80% 0.84
Medium (Medium Price) 20.00% 56.60% 23.40% 2.83
Small (High Price) 20.70% 63.70% 15.70% 3.08
Small
Cap
Large (Low Price) 11.30% 54.70% 34.10% 4.86
Medium (Medium Price) 20.20% 55.80% 24.00% 2.77
Small (High Price) 18.60% 70.70% 10.70% 3.8
Total 15.40% 41.70% 42.90% 2.62
Tick Size Constraints and Price Priority

Tick Size Constraints and Time Priority
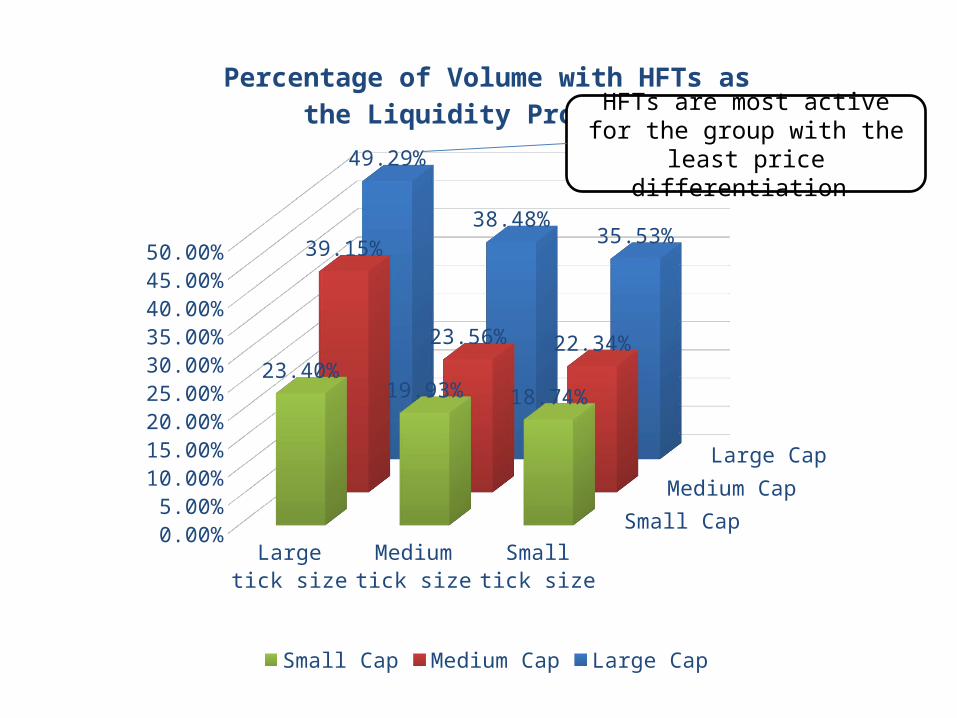
Low-priced stocks – High tick size constraints – Higher probability that HFTs and non-HFTs quote same
price– HFTs can establish time priority more easily
Prediction– Percentage of volume with HFTs as liquidity providers
increases in relative tick size
Large tick size Medium tick size
Small tick size0.00%
5.00%
10.00%
15.00%
20.00%
25.00%
30.00%
35.00%
40.00%
45.00%
50.00%
Small Cap
Medium Cap
Large Cap
23.40%19.93% 18.74%
39.15%
23.56% 22.34%
49.29%
38.48%35.53%
Percentage of Volume with HFTs as the Liquidity Providers
Small Cap Medium Cap Large Cap
HFTs are most active for the group with the least price
differentiation

Roadmap
Relative tick size and HFT liquidity provision – Double sorting – Regression analysis – Diff-in-diff test – More robustness checks
Relative tick size and profit of liquidity provision

Omitted Variable Bias
Causal relationship we aim to establish – Large relative tick size increases proportion of liquidity
provided by HFT
Biases occur if we fail to control variables correlated with both – Nominal prices (relative tick size)– HFT liquidity provision
We search for control variables affecting at least one of them– Benartzi, Michaely, Thaler and Weld (2009)

Factor Affecting Nominal Prices
Marketability hypothesis – lower price appeals to individual investors
Optimal tick size hypothesis – firms choose optimal relative tick size through split
Signaling hypothesis – Firms use stock splits to signal good news
Catering hypothesis
Low price predicts distress risk
Factors Affecting HFT Liquidity Provision
Probability of informed trading (PIN)– Control for information asymmetry
Volatility and turnover – Hendershott, Jones, and Menkveld (2011)
Past Returns

Tick Size Constraints and Time Priority
Execution due to price vs. time priority – HFT price priority
• Non-HFT limit orders offer worse price at the time of HFT execution
– HFT time priority • Non-HFT limit orders offer identical price at the time of HFT
execution
– Non-HFT price and time priority are similarly defined
: proportion of trades due to time priority – i: firm – t: time– n: non-HFT or HFT (two observations each firm)
Specification and Results
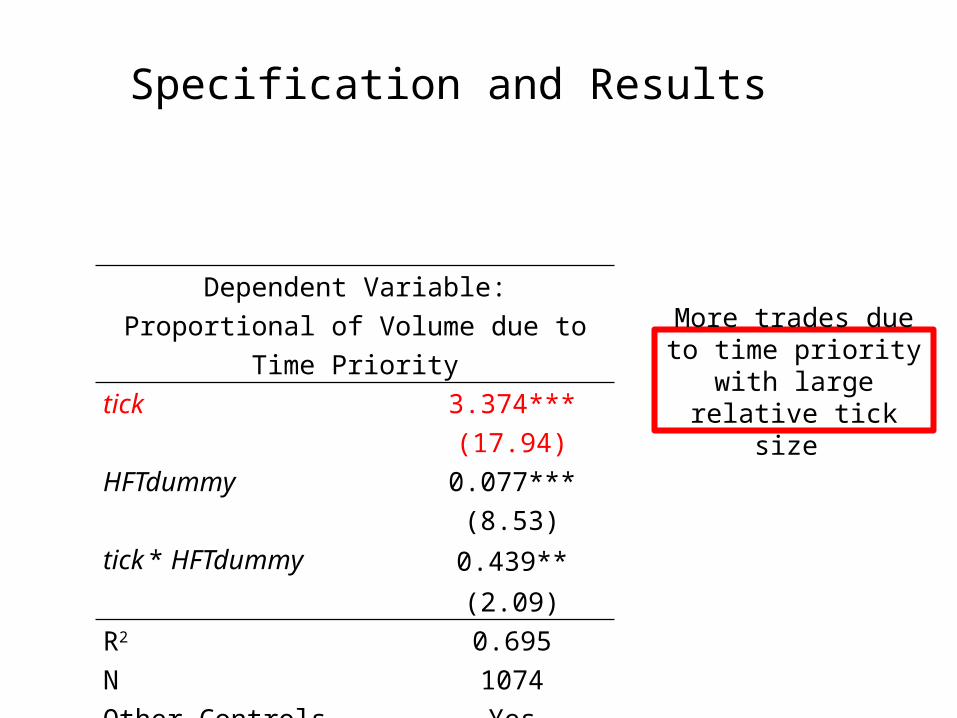
Dependent Variable: Proportional of Volume due to Time Priority
tick 3.374*** (17.94)HFTdummy 0.077*** (8.53)tick * HFTdummy 0.439** (2.09)R2 0.695N 1074Other Controls YesIndustry*time FE Yes
More trades due to time priority with large
relative tick size

Specification and Results
More trades due to time priority for HFT
Dependent Variable: Proportional of Volume due to Time Priority
tick 3.374*** (17.94)HFTdummy 0.077*** (8.53)tick * HFTdummy 0.439** (2.09)R2 0.695N 1074Other Controls YesIndustry*time FE Yes

Specification and Results
Dependent Variable: Proportional of Volume due to Time Priority
tick 3.374*** (17.94)HFTdummy 0.077*** (8.53)tick * HFTdummy 0.439** (2.09)R2 0.695N 1074Other Controls YesIndustry*time FE Yes
Large relative tick size increases the HFT proportion of trades due to time priority relative to that of non-HFT

Roadmap
Relative tick size and HFT liquidity provision – Double sorting – Regression analysis – Diff-in-diff test – More robustness checks
Relative tick size and profit of liquidity provision

Diff-in-Diff Regression
• Leveraged ETFs– ETFs amplifying the return of the underlying index– Appear in pairs: Bear and Bull– Dow Jones 30• UDOW +300% • SDOW-300%
• Similar issuance prices
• Issuers conduct splits/reverse splits after large price divergence

Empirical Design
• Treatment group: ETFs split/reverse split
• Control group: ETFs do not split/reverse split– Share the same underlying fundamentals with the
treatment group
• Dependent variables– Proxy for HFT liquidity provision: RunInProcess• Hasbrouck and Saar (2013)• Correlation: 0.77
– Liquidity measure: quoted spread, effective spread and depth

Regression Specification
Index by time fixed effect– Control for common fundamentals
: ETF fixed effect – Control for time invariant difference between two ETFs – Eg. : clientele before splits
: Treatment dummy– Treatment group: 1 after splits and 0 before splits – Control group: always 0

Without Tick Size Constraints
• Splits – Price – Normal spread
• Reverse splits – Price – Normal spread
• Proportional spread – Should not change – Cost to trade the same dollar amount should not be affected
• HFT liquidity provision – Should not change – Because of the same fundamentals

Splits(1) (2) (3) (7)
Qtspd pQtspd Depth1 RunsInProc
(in cent) (in bps) (in mn) (in .1sec)
Dummytreatment -9.697*** 1.007* 0.015 0.350***
(-16.02) (1.94) (1.39) (3.42)
return -8.880** -6.698** -0.009 -0.396
(-2.40) (-2.11) (-0.13) (-0.63)
Constant 10.062*** 14.484*** 0.129*** 1.856***
(8.39) (14.06) (6.23) (9.15)
R2 0.910 0.742 0.915 0.978
N 607 607 607 607
Index*time FE Y Y Y Y
ETF FE Y Y Y Y
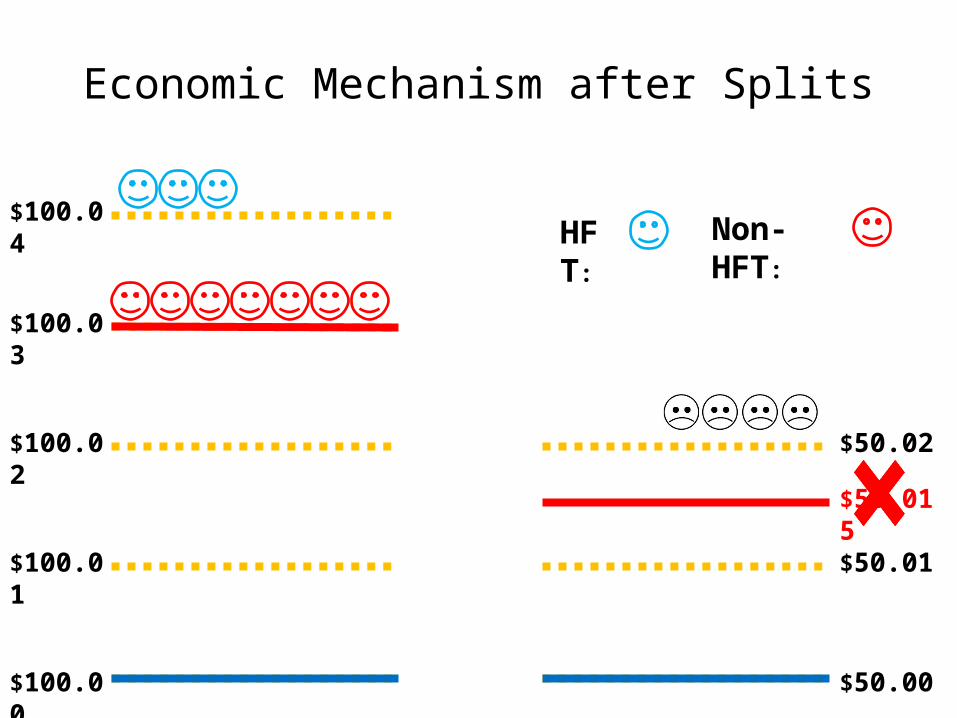
Economic Mechanism after Splits
$100.02
$100.00 $50.00
$50.01$100.01
$100.03
$50.02
$50.015
$100.04HFT:
Non-HFT:

Reverse Splits(1) (2) (3) (7)
Qtspd pQtspd Depth1 RunsInProc
(in cent) (in bps) (in mn) (in .1sec)
Dummytreatment 1.175*** -2.608*** -0.321*** -5.348***
(8.41) (-13.48) (-6.02) (-17.08)
return -1.648 -3.622** 0.878** -3.028
(-1.56) (-2.48) (2.19) (-1.28)
Constant 3.190*** 9.260*** 0.547*** 10.343***
(8.79) (18.42) (3.95) (12.71)
R2 0.834 0.883 0.787 0.797
N 2559 2559 2559 2559
Index*time FE Y Y Y Y
ETF FE Y Y Y Y

Economic Mechanism after Reverse Splits
$100.02
$100.00
$100.01
$100.03
$100.04
$50.00
$50.01
$50.02
HFT:
Non-HFT:

Roadmap
Relative tick size and HFT liquidity provision – Double sorting – Regression analysis – Diff-in-diff test – More robustness checks
Relative tick size and profit of liquidity provision

Alternative Hypotheses
HFTs prefer low-priced stocks for other reasons • Possibility 1: small capital requirement to trade same
amount of shares • Possibility 2: clientele effects (low priced stocks have
more retail traders)
“Falsification test”• Under alternative hypotheses, liquidity taking activities
are affected the same way• We find HFT liquidity taking activity does not increase
with relative tick size
Other Robustness Checks
• Active vs. Passive improvement of best quotes – Non-HFT may be present on the best quotes because
HFT withdraw• Eg: stale quotes
– Our results hold even if we only consider the case that best quotes are actively improved
• The tick size constraints channel – Not restricted to stocks with 1 cent spread

Roadmap
Relative tick size and HFT liquidity provision – Double sorting – Regression analysis – Diff-in-diff test – More robustness checks
Relative tick size and profit of liquidity provision
Microstructure on Real Economy
• Arms race in speed directly affect real resource allocation – Physical capital: investment in facilities to reduce latency– Human capital: competition for human talents
• Indirect channels for market structure to affect real economy – Asset pricing channel (through affecting cost of capital)
• Liquidity • Information risk • Ambiguity
– Corporate finance channel• Liquidity • Price discovery

Source of Profits for Arms Race in Speed
Literature: information advantage– Debate: whether information advantage is fair
This paper: tick size and time priority– Two predictions in the literature
• Large relative tick size leads to higher rents for liquidity provision – Harris (1994) and Foucault, Pagano, and Röell (2013)
• Time priority creates higher profit– Sandås (2001) and Biais, Hillion and Spatt (1995)– Speed allocates rents from large relative tick size
– We empirically test these two predictions

Profit Measure
Total Profit (Broggard, Hendershott and Riordan (2013))– Cash flows obtains through liquidity provision – Cumulative value changes for inventory
Unit profit – Total profit divided by dollar volume (in basis points)
We use different intervals of inventory clearance

Profit and Relative Tick Size
Dep. Var Unit Profit (bps) (5 minutes) (30 minutes) (1 hour) (Daily)tick 15.497*** 17.513*** 18.977*** 29.734**
(5.45) (3.97) (3.43) (2.31)HFTdummy 0.762*** 0.421** 0.243 -0.094
(6.43) (2.29) (1.06) (-0.18)tick * HFTdummy 7.054** 2.328 -0.261 -16.344
(2.21) (0.47) (-0.04) (-1.13)R2 0.220 0.214 0.203 0.194N 4484 4484 4484 4484Other Controls
Y Y Y Y
Industry*time FE Y Y Y Y
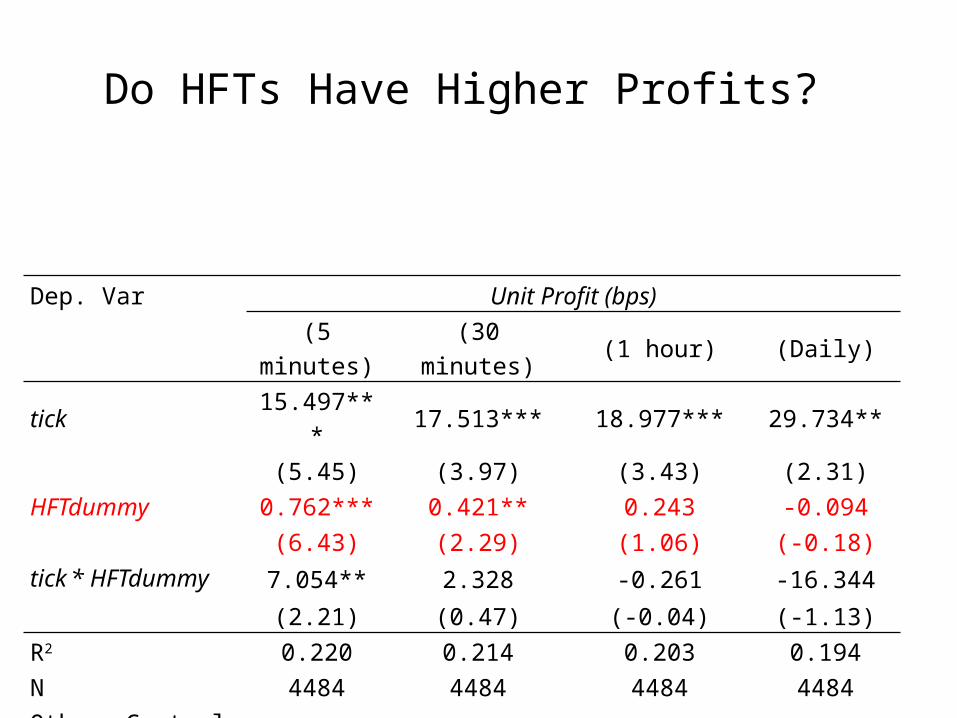
Do HFTs Have Higher Profits?
Dep. Var Unit Profit (bps) (5 minutes) (30 minutes) (1 hour) (Daily)tick 15.497*** 17.513*** 18.977*** 29.734**
(5.45) (3.97) (3.43) (2.31)HFTdummy 0.762*** 0.421** 0.243 -0.094
(6.43) (2.29) (1.06) (-0.18)tick * HFTdummy 7.054** 2.328 -0.261 -16.344
(2.21) (0.47) (-0.04) (-1.13)R2 0.220 0.214 0.203 0.194N 4484 4484 4484 4484Other Controls
Y Y Y Y
Industry*time FE Y Y Y Y
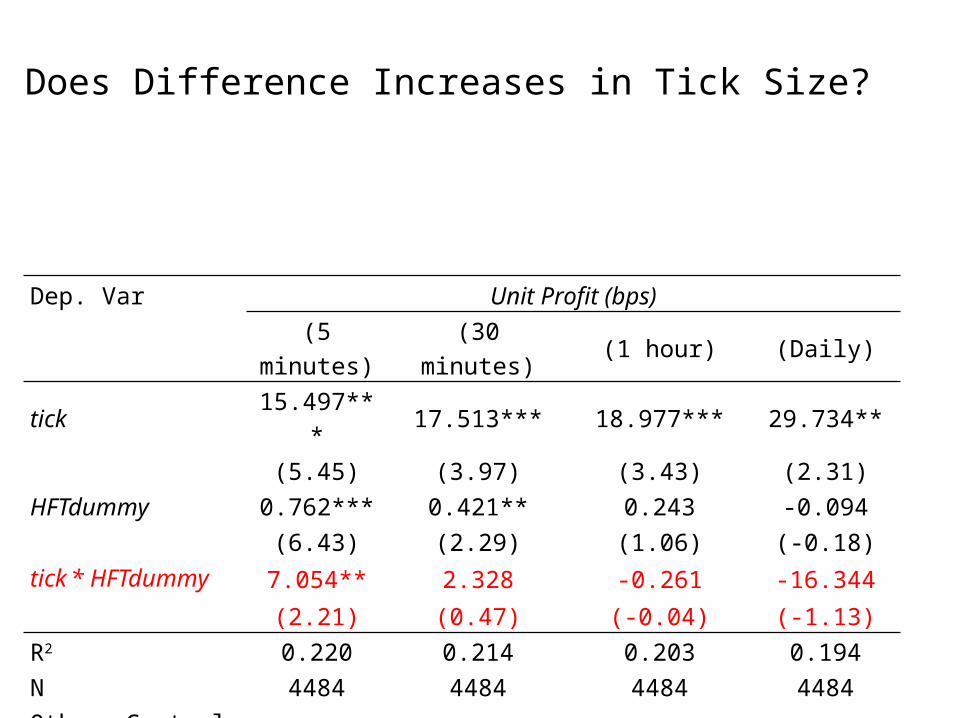
Does Difference Increases in Tick Size?
Dep. Var Unit Profit (bps) (5 minutes) (30 minutes) (1 hour) (Daily)tick 15.497*** 17.513*** 18.977*** 29.734**
(5.45) (3.97) (3.43) (2.31)HFTdummy 0.762*** 0.421** 0.243 -0.094
(6.43) (2.29) (1.06) (-0.18)tick * HFTdummy 7.054** 2.328 -0.261 -16.344
(2.21) (0.47) (-0.04) (-1.13)R2 0.220 0.214 0.203 0.194N 4484 4484 4484 4484Other Controls
Y Y Y Y
Industry*time FE Y Y Y Y
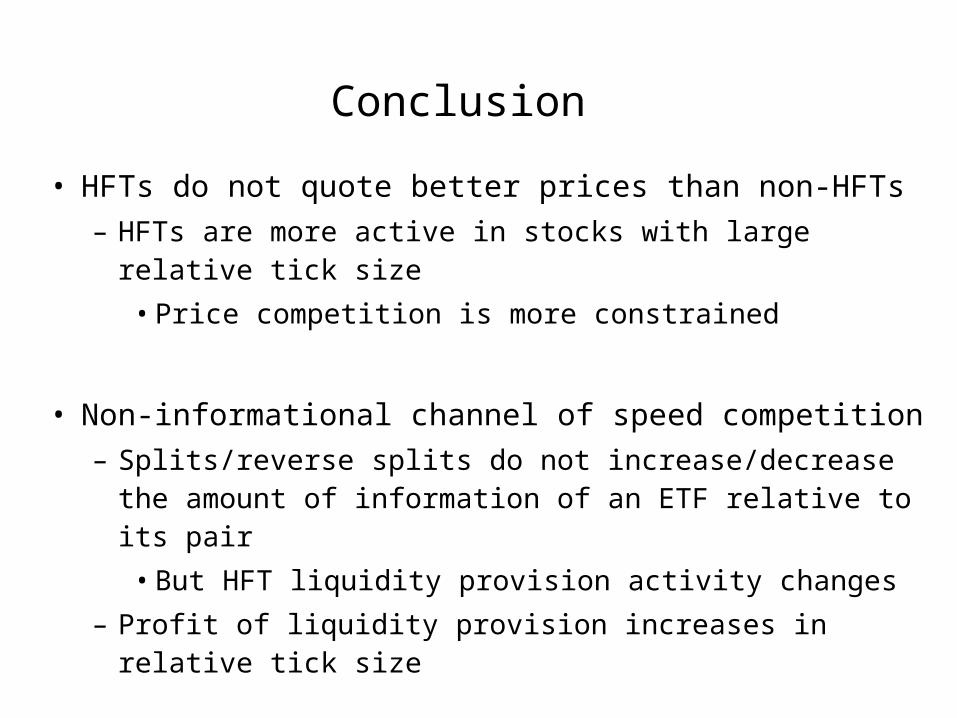
Conclusion
• HFTs do not quote better prices than non-HFTs– HFTs are more active in stocks with large relative tick size• Price competition is more constrained
• Non-informational channel of speed competition – Splits/reverse splits do not increase/decrease the amount of
information of an ETF relative to its pair• But HFT liquidity provision activity changes
– Profit of liquidity provision increases in relative tick size

Policy Implications
• Debates on HFT– Whether to pursue additional regulation on HFT– This paper: HFT can be consequence of existing regulation – Deregulation instead of more regulation?
• Tick size – SEC recently announced pilot program to increase tick size for
less liquid stocks– SEC argument: wider tick size increase liquidity and controls
HFT and finally increase IPO– We encourage SEC considering a pilot program to decrease tick
size for liquid stocks


