Life Under Your Feet: Measuring Soil Invertebrate Diversity
Richard L. Boyce Department of Biological Sciences Nunn Drive, Northern Kentucky University, Highland Heights, KY 41099, [email protected]
Table of Contents: ABSTRACT AND KEYWORD DESCRIPTORS...........................................................2 SYNOPSIS OF THE LAB ACTIVITY............................................................................4 DESCRIPTION OF THE EXPERIMENT
Introduction..............................................................................................................6 Materials and Methods............................................................................................9 Questions for Further Thought and Discussion.....................................................17 References and Links............................................................................................18 Tools for Assessment of Student Learning Outcomes..........................................22 Tools for Formative Evaluation of This Experiment.........…..................................23
NOTES TO FACULTY................................................................................................24 STUDENT COLLECTED DATA………………………………………………………..…27 ACKNOWLEDGMENTS, COPYRIGHT AND DISCLAIMER......................................28 CITATION:
Richard L. Boyce. April 2005, posting date. Life Under Your Feet: Measuring Soil Invertebrate Diversity. Teaching Issues and Experiments in Ecology, Vol. 3: Experiment #1 [online]. http://tiee.ecoed.net/vol/v3/experiments/soil/abstract.html
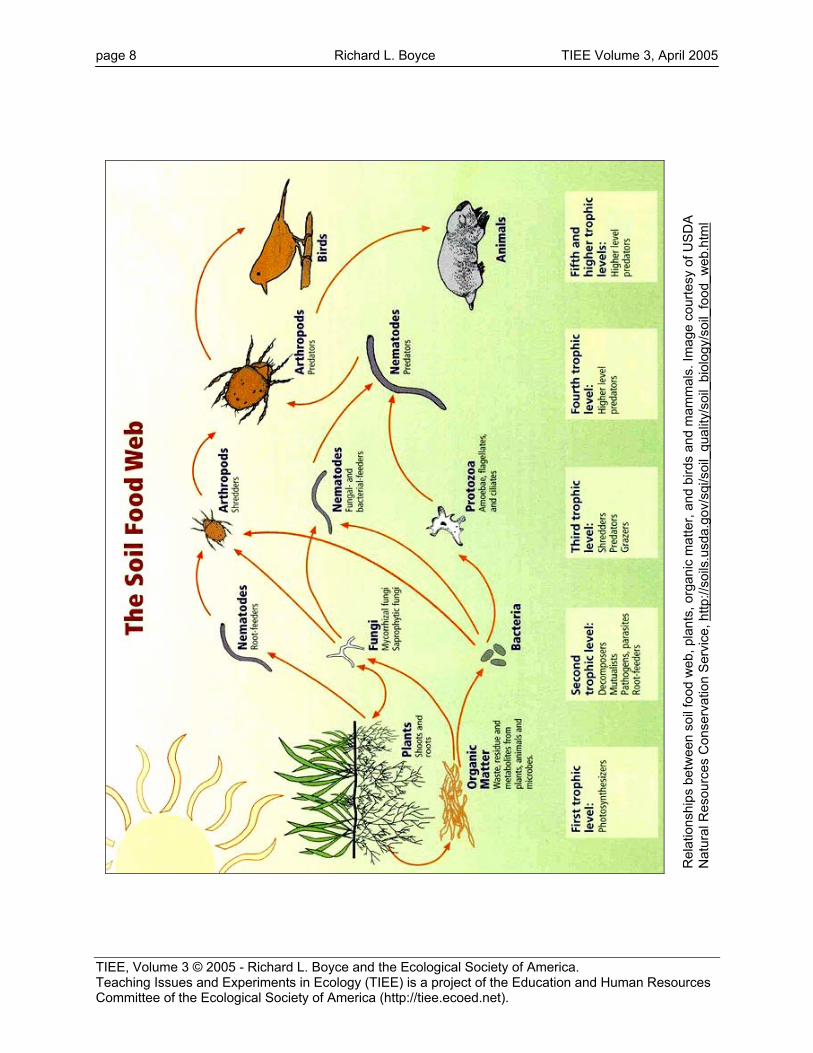
Courtesy of USDA Natural Resources Conservation Service (NRCS). http://soils.usda.gov/sqi/concepts/soil_biology/biology.html
Students determine soil invertebrate diversity in samples they have collected using Berlese-Tullgren funnels to test hypotheses that they have generated. For example, diversity could be compared in a deciduous versus a coniferous forest, or along a chronosequence of forest plots undergoing succession or regeneration after disturbance, such as logging or wind damage. This exercise will extend over two lab periods. Back in lab, students will extract and identify invertebrates, and quantify their abundance in samples. Using a spreadsheet, they will calculate diversity indices and test for differences among samples. Outside of class, they will write a research-style paper.
KEYWORD DESCRIPTORS
• Principal Ecological Question Addressed: What are the environmental correlates of variation in soil invertebrate community diversity?
• Ecological Topic Keywords: community ecology, biodiversity, Shannon index, species diversity, dominance, richness, soil invertebrates, edaphic conditions
• Science Methodological Skills Developed: field work, hypothesis generation and testing, invertebrate taxonomy, systematics, microscopy, statistics, graphics, data analysis, scientific writing
Two three-hour lab periods (1 for field trip and set-up, 1 for data collection and analysis).
OUTSIDE OF CLASS TIME
4-12 hours for students to finish their research papers.
STUDENT PRODUCTS
Students are assessed on their individual research papers that are based on student-collected data. If desired, students could also make oral or poster presentations.
TIEE: EXPERIMENTS Life Under Your Feet: Soil Invertebrate Diversity page 3
Outdoors: several areas with one or more kinds of different vegetative cover. As long as soil is accessible, there should be no seasonal issues.
Lab: a bench with enough room for a set of Berlese-Tullgren funnels (about 1 meter of bench or table top surface). Also needed are dissecting microscopes to identify soil invertebrates and computers for data analysis.
COURSE CONTEXT
Undergraduate biology and other science majors (course name: Ecology Laboratory, Bio 306, http://www.nku.edu/%7Eboycer/ecollab.html), 10-14 per lab section.
This activity is highly transferable. It could run in introductory lab courses in ecology, environmental science, or upper division courses in a variety of sub-disciplines, including entomology and zoology. It could also be modified to run in any undergraduate introductory biology lab course for majors at any college or university. It could also be modified for biology lab courses for non-majors and for grades 8-12.
In this lab, students measure the diversity of soil invertebrates that are collected from areas with different vegetation composition or cover, depending on the questions and hypothesis that the students generate. Student-generated questions include:
1. How does different vegetation affect soil invertebrate diversity?
2. How much does soil invertebrate diversity vary across a plant community?
3. How does sampling intensity affect soil invertebrate diversity measurements?
4. How do soil factors, such as chemistry, water status, etc. affect invertebrate diversity?
Students spend two four-hour lab sessions on this project. A field trip is made to the study site. Students, working in small groups, decide what question they are going to answer, develop a hypothesis, and design an experiment to test that hypothesis. After collecting soil and litter, they return to the lab where invertebrates are extracted from their samples using a set of Berlese-Tullgren funnels. Invertebrates are identified to Class, Order, and Family, when possible using keys provided in lab, or ecotype (morphologically based classification).
Data are entered in spreadsheets, diversity indices are calculated, and statistical tests are performed. Students then work alone and write a research-style paper with references made available to them by the instructor, in addition to others they locate on their own.
Lab Objectives
At the conclusion of the lab, students will:
1. Learn about the incredibly diverse invertebrate community found in soil (literally under their feet).
2. Learn how to quantify diversity of different soil invertebrate communities and generate hypotheses about underlying ecological processes that consider the factors that affect soil invertebrate diversity in different environments.
3. Understand some of the basics of asking and attempting to answer ecological questions (beginning with observations in the field, focusing broad questions towards narrower answerable ones, developing hypotheses, designing and conducting a field-based research project to answer these questions, using skills in experimental design and data analysis, e.g., use of spreadsheets, simple statistics, data reduction, developing clear figures and tables that address specific questions, and generating a formatted paper or presentation based on their research findings).
TIEE: EXPERIMENTS Life Under Your Feet: Soil Invertebrate Diversity page 5
4. Advance their scientific critical thinking skills by revising their initial questions and hypotheses due to their findings as well as findings by others in published literature.
5. Learn how to read scientific literature and place their work within its scientific context.
6. Advance their skills in scientific collaboration within their peer community.
7. Advance their skills in communicating scientific findings to peers (written and/or oral) presentation of research results).
Equipment/Logistics Required
• Field clothing
• Shovels & trowels, tapes or rulers
• Ziplock bags for transporting soil and litter samples
• Berlese-Tullgren funnels, with lights and alcohol or other preservative to catch invertebrates (Funnels can be purchased from Carolina Biological Supply (http://www.carolina.com). However, you can also construct your own. See the list of web sites below for instructions on how to make your own inexpensive, but highly effective, Berlese-Tullgren funnels.)
• Dissection microscopes
• Clear nail polish—Wet & Wild ® is the recommended brand
• Invertebrate guides (see Soil Invertebrate Key) and data sheets (see Data Tallysheet)
• Transportation to field site(s)
• Use of computers for a 2-3 hour block for data analysis
Summary of What is Due
From this lab, students individually submit an original research paper, based on the data their group collected and the literature that they consulted.
DESCRIPTION OF THE EXPERIMENT Introduction (written for students)
Diversity and the measurement of diversity are central to many issues in ecological research as well as for applying ecology to real world problems. Every textbook in ecology devotes considerable description and explanation of species diversity, species richness, and species evenness. Community ecologists use measures of diversity to study and explain ecological patterns in many different types of communities.
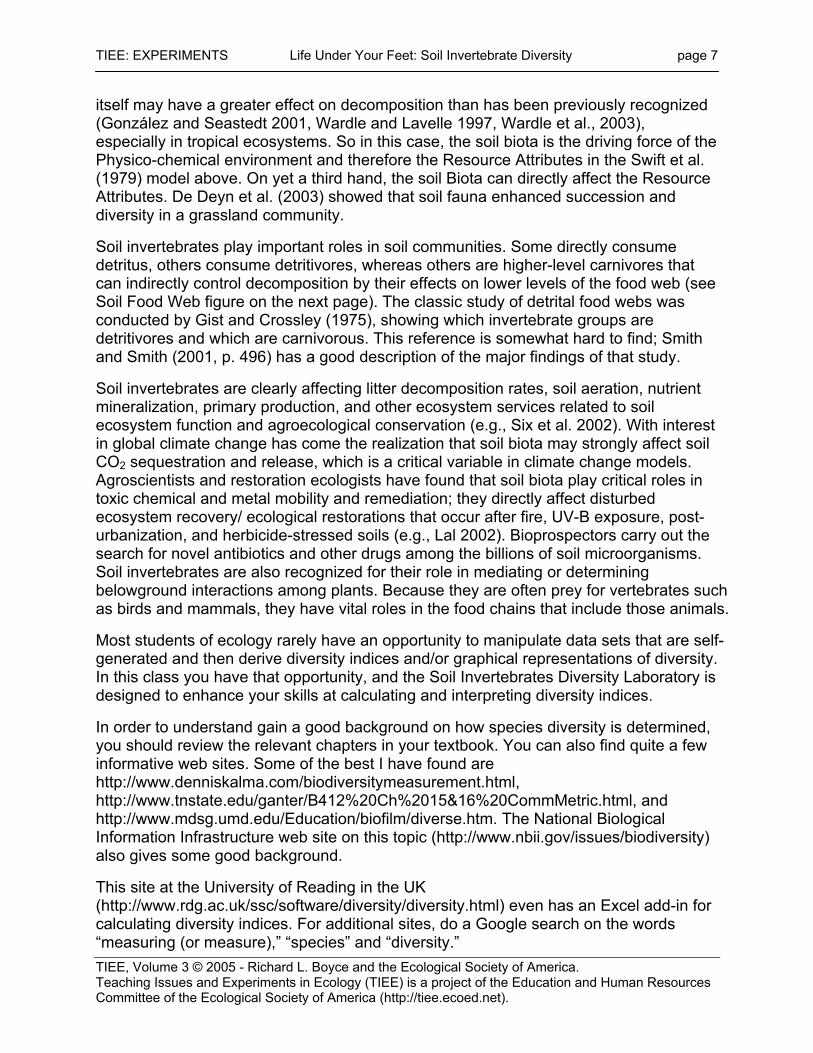
In terrestrial ecosystems, litter decomposition has important effects on processes such as nutrient cycling and community structure. Decomposition is affected by the type and quality of litter, climate, the edaphic conditions (including soil temperature, hydration, and chemistry), and the community of decomposer organisms (Swift et al. 1979).
Figure - Interactions among factors that control litter decomposition (from Swift et al. 1979).
This model shows the relationships among the three factors that govern litter decomposition rates: the Biota (structure and activity of the biotic soil food webs, i.e., microbes, invertebrates, vertebrates), the Physico-chemical environment (climate, habitat, edaphic factors, i.e., contributions from the non-living environment); and Resource Attributes (primarily plant species diversity and tissue chemistry, i.e., contributions from the living environment). Many studies have shown how both the living and the non-living environments affect soil community structure and diversity (Swift et al. 1979, Elliott et al. 1980, Ingham et al. 1982, Freckman & Virginia 1997). For example, decomposition of plant litter that is high in lignin and/or low in nutrients and is therefore difficult to decompose (resource quality) leads to dominance by fungal-feeding groups in the soil food web (namely, some taxa of nematodes, mites and Collembola), whereas easily broken-down litter is decomposed primarily by bacteria, which is reflected higher up the food chain (Coleman & Crossley 1996). And soil community diversity is at least partially determined by plant community diversity (Siemann et al. 1998). So in this case, the living environment is determining the soil community. On the other hand, recent work suggests that composition and biodiversity of soil organisms
TIEE: EXPERIMENTS Life Under Your Feet: Soil Invertebrate Diversity page 7
itself may have a greater effect on decomposition than has been previously recognized (González and Seastedt 2001, Wardle and Lavelle 1997, Wardle et al., 2003), especially in tropical ecosystems. So in this case, the soil biota is the driving force of the Physico-chemical environment and therefore the Resource Attributes in the Swift et al. (1979) model above. On yet a third hand, the soil Biota can directly affect the Resource Attributes. De Deyn et al. (2003) showed that soil fauna enhanced succession and diversity in a grassland community.
Soil invertebrates play important roles in soil communities. Some directly consume detritus, others consume detritivores, whereas others are higher-level carnivores that can indirectly control decomposition by their effects on lower levels of the food web (see Soil Food Web figure on the next page). The classic study of detrital food webs was conducted by Gist and Crossley (1975), showing which invertebrate groups are detritivores and which are carnivorous. This reference is somewhat hard to find; Smith and Smith (2001, p. 496) has a good description of the major findings of that study.
Soil invertebrates are clearly affecting litter decomposition rates, soil aeration, nutrient mineralization, primary production, and other ecosystem services related to soil ecosystem function and agroecological conservation (e.g., Six et al. 2002). With interest in global climate change has come the realization that soil biota may strongly affect soil CO2 sequestration and release, which is a critical variable in climate change models. Agroscientists and restoration ecologists have found that soil biota play critical roles in toxic chemical and metal mobility and remediation; they directly affect disturbed ecosystem recovery/ ecological restorations that occur after fire, UV-B exposure, post-urbanization, and herbicide-stressed soils (e.g., Lal 2002). Bioprospectors carry out the search for novel antibiotics and other drugs among the billions of soil microorganisms. Soil invertebrates are also recognized for their role in mediating or determining belowground interactions among plants. Because they are often prey for vertebrates such as birds and mammals, they have vital roles in the food chains that include those animals.
Most students of ecology rarely have an opportunity to manipulate data sets that are self-generated and then derive diversity indices and/or graphical representations of diversity. In this class you have that opportunity, and the Soil Invertebrates Diversity Laboratory is designed to enhance your skills at calculating and interpreting diversity indices.
In order to understand gain a good background on how species diversity is determined, you should review the relevant chapters in your textbook. You can also find quite a few informative web sites. Some of the best I have found are http://www.denniskalma.com/biodiversitymeasurement.html, http://www.tnstate.edu/ganter/B412%20Ch%2015&16%20CommMetric.html, and http://www.mdsg.umd.edu/Education/biofilm/diverse.htm. The National Biological Information Infrastructure web site on this topic (http://www.nbii.gov/issues/biodiversity) also gives some good background.
This site at the University of Reading in the UK (http://www.rdg.ac.uk/ssc/software/diversity/diversity.html) even has an Excel add-in for calculating diversity indices. For additional sites, do a Google search on the words “measuring (or measure),” “species” and “diversity.”
Materials and Methods (written for faculty) Study Site(s): The class will be measuring soil invertebrate density at a nearby site containing several different forest types, as well as nonforested areas. Our class has made use of the nearby St. Anne’s Convent in Melbourne, KY, near the Ohio River. We have several forest types that we can sample, including a Shumard oak (Quercus schumardii)—tulip-poplar (also called tulip tree and yellow-poplar; Liriodendron tulipifera) forest; a more mesic American beech (Fagus grandifolia) forest; a riparian forest growing along the banks of a stream; an eastern hemlock (Tsuga canadensis) forest; and several meadows.
Overview of Data Collection and Analysis Methods: Week 1: Beforehand, the class is given some readings on factors thought to drive soil invertebrate diversity, using some of the references described in the Introduction. Either before driving to the field site, or while driving out, the class can discuss what they have read and think about what kind of questions they might test. Depending on the level of your students, you should use either the “guided inquiry” or “bounded inquiry” method for asking questions, stimulating discussion and getting students seriously started on thoughtful experiments they can answer meaningful questions. See the Notes to Faculty section for some advice in this area.
The class travels to the field site. After looking at each of the sites, student groups (2-4 students) decide what question they will ask. They will then collect samples of soil and/or litter, using bulb planters/shovels/trowels and plastic zip-lock bags. Note that the soil and litter will have very different communities, so if these are separate horizons in your soils, make sure that you separate them if both are collected.
The samples are then brought back to the lab and placed in Berlese-Tullgren funnels (see Brower et al. 1998 or http://www.albany.edu/natweb/berlese.html for good explanations). The light source is allowed to drive invertebrates into the bottom of the funnel, where they fall into alcohol or other preservative. Light bulbs of various intensities could be used to see how this affects diversity measurements. Similar volumes of soils and/or litter should be used in each funnel. With Carolina Supply funnels, I have used 100 g samples; the soils I have worked with have similar bulk densities, so this translates to a similar volume. If you are working with samples of vastly different bulk densities, such as soil from a dry site vs. a moist site, I suggest using a bulb planter to help you get similar volumes. You may need to use a larger amount than this to get good results if your samples have low invertebrate densities. With Carolina Supply funnels, I have used 60 W bulbs suspended just above the sample. With homemade funnels, you may need to use different sizes of samples. Sample collections have run for a week, as this is the interval between class meetings, but my best estimate is that invertebrates will no longer be collected after 3-5 days. I have collected the invertebrates in 70% ethanol, although apparently others have had good luck with 50-95% alcohol. I strongly suggest a “dry” run before you let the students do this.
page 10 Richard L. Boyce TIEE Volume 3, April 2005
Week 2: Students identify the invertebrates in samples, using dissecting microscopes. Invertebrates can be preserved on glass slides with drops of clear nail polish. Identification down to species is quite difficult, but identification to higher taxa and then to ecological morphotype is relatively straightforward. We identify down to class or order (or occasionally phylum) for non-insects. For insects, we identify down to order. This is done with a dichotomous key and figure (see Soil Invertebrate Key; other resources include http://www.cals.ncsu.edu/course/ent591k/kwikey1.html, Edgar 1992, and Dunn and Dunn 1998). Record abundances in each sample by counting total number of each taxon or morphotype. Data are entered into a spreadsheet that can be set up to automatically calculate the Shannon index (see Data Tallysheet).
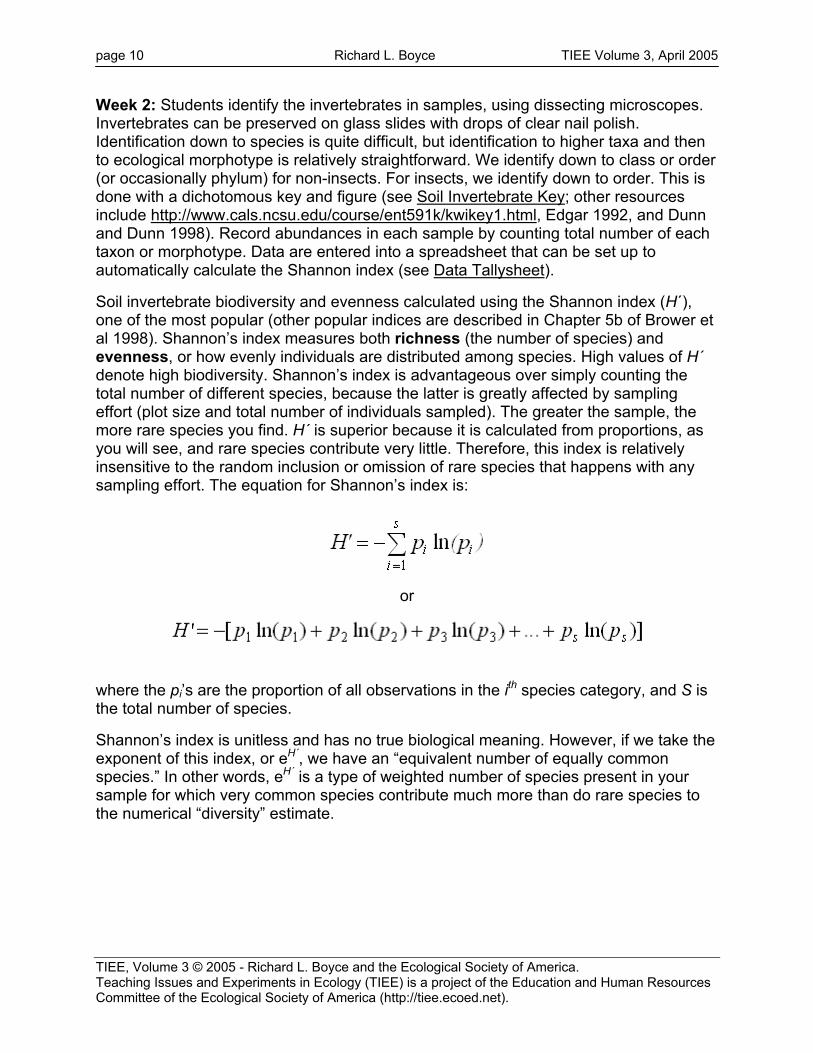
Soil invertebrate biodiversity and evenness calculated using the Shannon index (H´), one of the most popular (other popular indices are described in Chapter 5b of Brower et al 1998). Shannon’s index measures both richness (the number of species) and evenness, or how evenly individuals are distributed among species. High values of H´ denote high biodiversity. Shannon’s index is advantageous over simply counting the total number of different species, because the latter is greatly affected by sampling effort (plot size and total number of individuals sampled). The greater the sample, the more rare species you find. H´ is superior because it is calculated from proportions, as you will see, and rare species contribute very little. Therefore, this index is relatively insensitive to the random inclusion or omission of rare species that happens with any sampling effort. The equation for Shannon’s index is:
or
where the pi’s are the proportion of all observations in the ith species category, and S is the total number of species.
Shannon’s index is unitless and has no true biological meaning. However, if we take the exponent of this index, or eH´, we have an “equivalent number of equally common species.” In other words, eH´ is a type of weighted number of species present in your sample for which very common species contribute much more than do rare species to the numerical “diversity” estimate.
TIEE: EXPERIMENTS Life Under Your Feet: Soil Invertebrate Diversity page 11
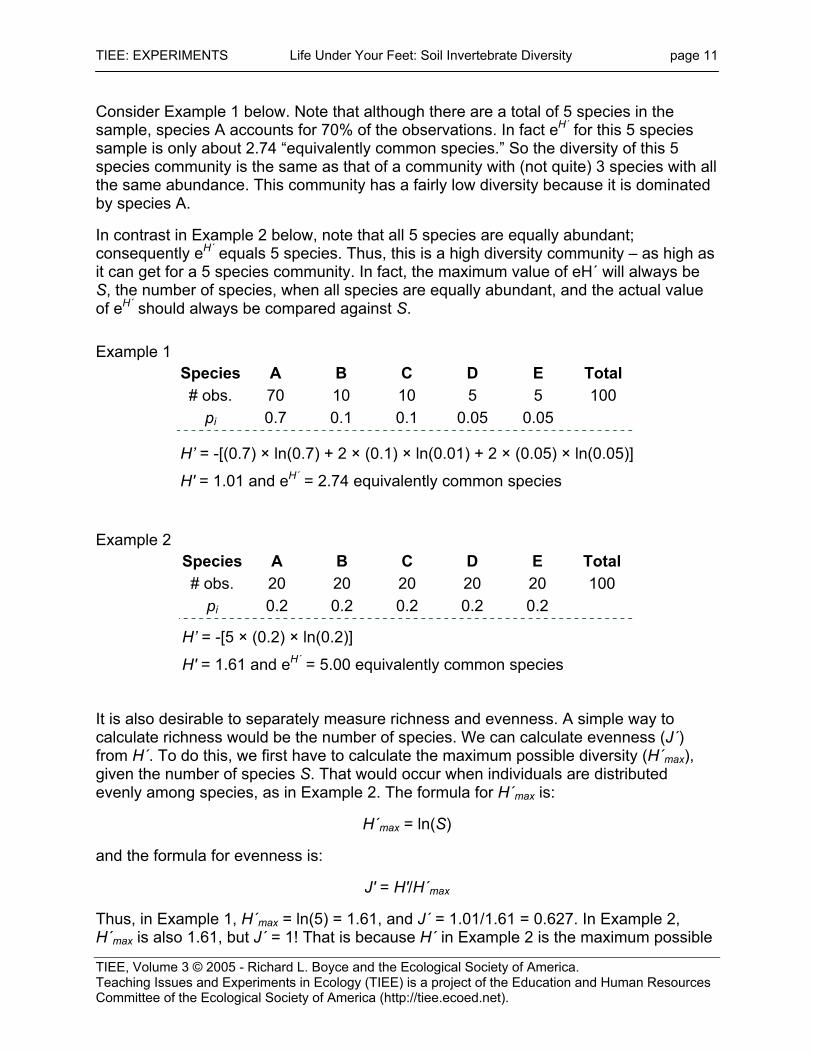
Consider Example 1 below. Note that although there are a total of 5 species in the sample, species A accounts for 70% of the observations. In fact eH´ for this 5 species sample is only about 2.74 “equivalently common species.” So the diversity of this 5 species community is the same as that of a community with (not quite) 3 species with all the same abundance. This community has a fairly low diversity because it is dominated by species A.
In contrast in Example 2 below, note that all 5 species are equally abundant; consequently eH´ equals 5 species. Thus, this is a high diversity community – as high as it can get for a 5 species community. In fact, the maximum value of eH´ will always be S, the number of species, when all species are equally abundant, and the actual value of eH´ should always be compared against S. Example 1
H' = 1.01 and eH´ = 2.74 equivalently common species
Example 2 Species A B C D E Total # obs. 20 20 20 20 20 100
pi 0.2 0.2 0.2 0.2 0.2
H’ = -[5 × (0.2) × ln(0.2)]
H' = 1.61 and eH´ = 5.00 equivalently common species
It is also desirable to separately measure richness and evenness. A simple way to calculate richness would be the number of species. We can calculate evenness (J´) from H´. To do this, we first have to calculate the maximum possible diversity (H´max), given the number of species S. That would occur when individuals are distributed evenly among species, as in Example 2. The formula for H´max is:
H´max = ln(S)
and the formula for evenness is:
J' = H'/H´max
Thus, in Example 1, H´max = ln(5) = 1.61, and J´ = 1.01/1.61 = 0.627. In Example 2, H´max is also 1.61, but J´ = 1! That is because H´ in Example 2 is the maximum possible
page 12 Richard L. Boyce TIEE Volume 3, April 2005
diversity, as the individuals are distributed evenly among species. Note that since we will usually miss rare species in a sample from a community, H´max is usually an underestimate and so J´ is an overestimate of evenness.
It is possible to carry out a t-test to compare the Shannon indices from two different communities provided that you have numerous replicates (and although it’s hard to say how many is a minimum number, a dozen samples per site would be a good target) (see p. 185 in Brower et al. 1998 or pp. 156-158 in Zar 1999). Since diversity indices are rarely normally distributed, a non-parametric test, such as the Mann-Whitney U test, or bootstrapping would be a safer bet. However, an easier, more straightforward, and more elegant way involves the non-parametric Kolmogorov-Smirnov test, which tests for differences in the trajectories of two bounded cumulative frequency distributions, which as it turns out perfectly characterizes the data you collected. Example 3 demonstrates this test.
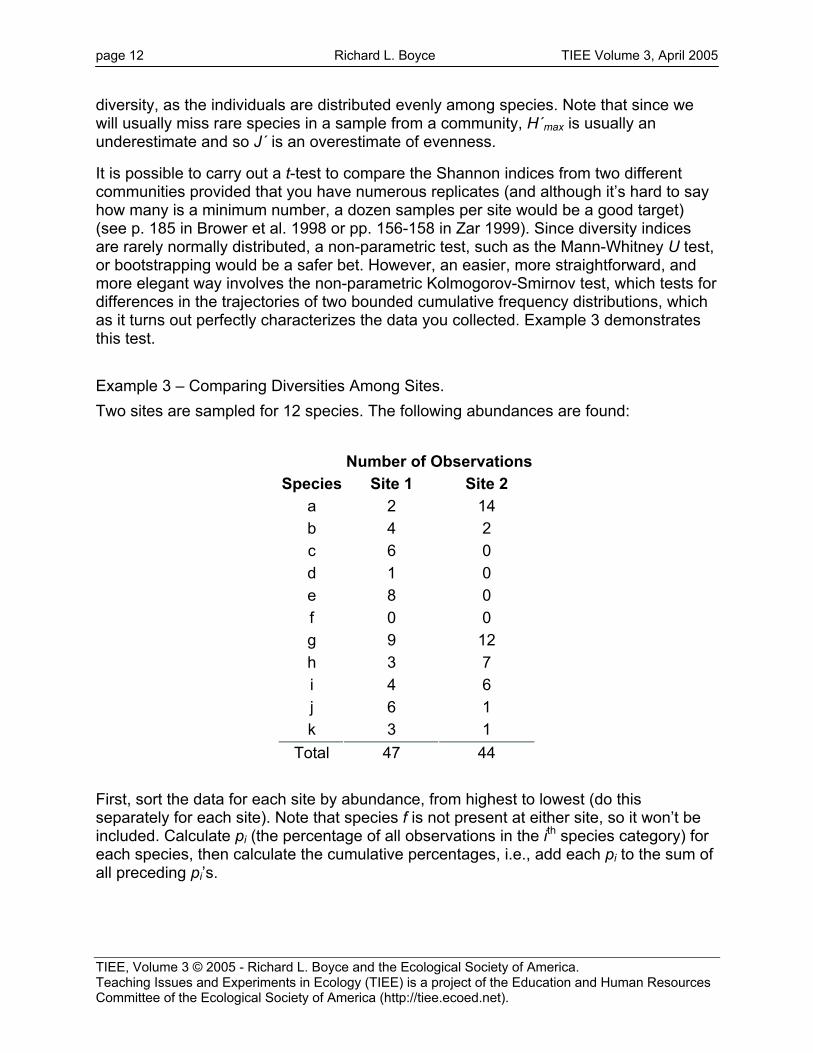
Example 3 – Comparing Diversities Among Sites. Two sites are sampled for 12 species. The following abundances are found:
Number of ObservationsSpecies Site 1 Site 2
a 2 14 b 4 2 c 6 0 d 1 0 e 8 0 f 0 0 g 9 12 h 3 7 i 4 6 j 6 1 k 3 1
Total 47 44 First, sort the data for each site by abundance, from highest to lowest (do this separately for each site). Note that species f is not present at either site, so it won’t be included. Calculate pi (the percentage of all observations in the ith species category) for each species, then calculate the cumulative percentages, i.e., add each pi to the sum of all preceding pi’s.
TIEE: EXPERIMENTS Life Under Your Feet: Soil Invertebrate Diversity page 13
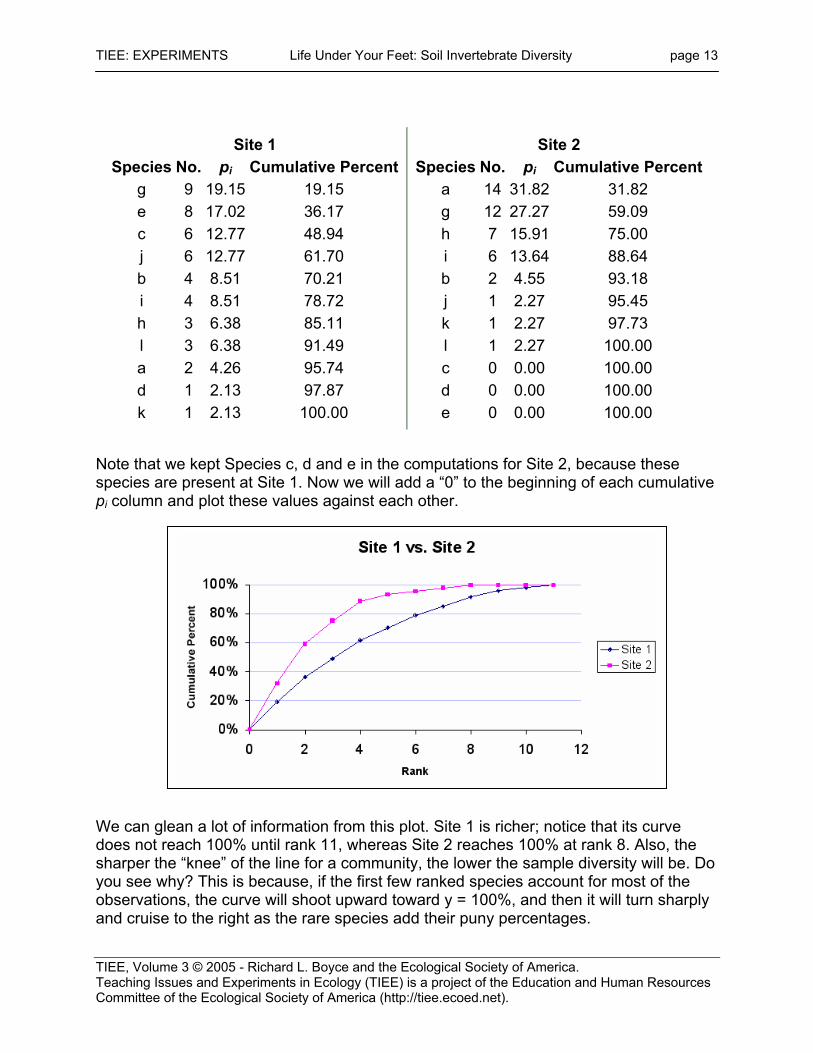
g 9 19.15 19.15 e 8 17.02 36.17 c 6 12.77 48.94 j 6 12.77 61.70 b 4 8.51 70.21 i 4 8.51 78.72 h 3 6.38 85.11 l 3 6.38 91.49 a 2 4.26 95.74 d 1 2.13 97.87 k 1 2.13 100.00
Site 2 Species No. pi Cumulative Percent
a 14 31.82 31.82 g 12 27.27 59.09 h 7 15.91 75.00 i 6 13.64 88.64 b 2 4.55 93.18 j 1 2.27 95.45 k 1 2.27 97.73 l 1 2.27 100.00 c 0 0.00 100.00 d 0 0.00 100.00 e 0 0.00 100.00
Note that we kept Species c, d and e in the computations for Site 2, because these species are present at Site 1. Now we will add a “0” to the beginning of each cumulative pi column and plot these values against each other.
full size image
We can glean a lot of information from this plot. Site 1 is richer; notice that its curve does not reach 100% until rank 11, whereas Site 2 reaches 100% at rank 8. Also, the sharper the “knee” of the line for a community, the lower the sample diversity will be. Do you see why? This is because, if the first few ranked species account for most of the observations, the curve will shoot upward toward y = 100%, and then it will turn sharply and cruise to the right as the rare species add their puny percentages.
page 14 Richard L. Boyce TIEE Volume 3, April 2005
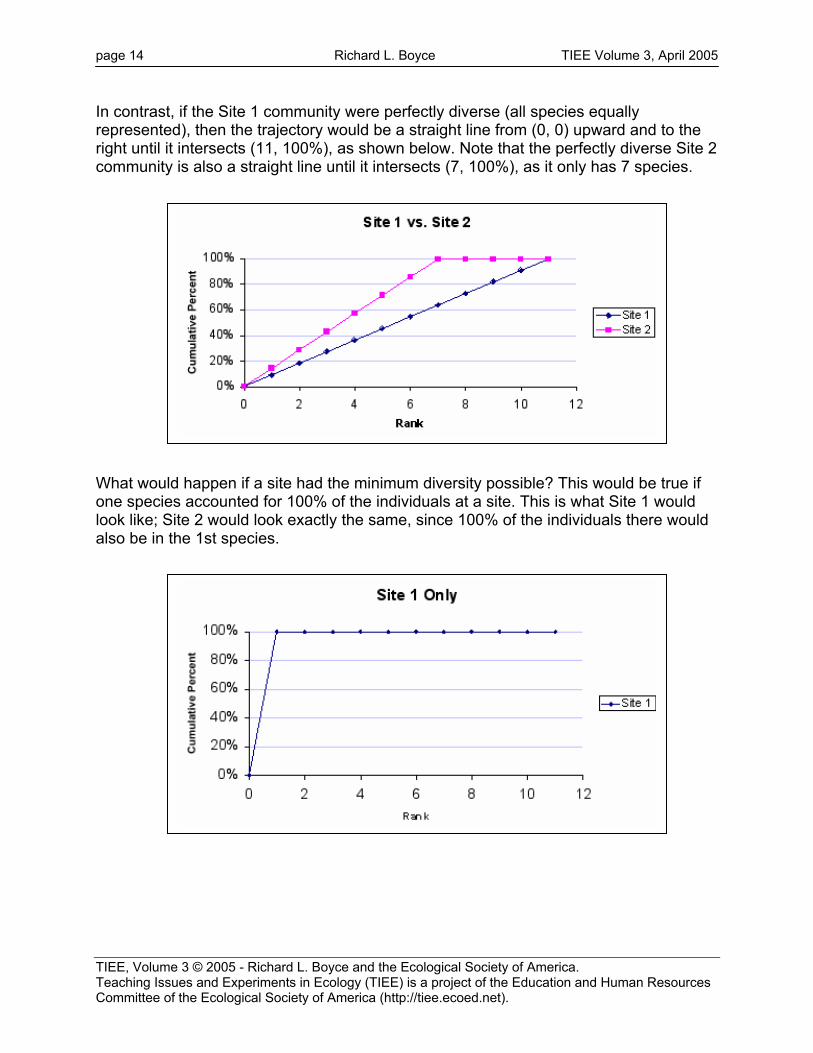
In contrast, if the Site 1 community were perfectly diverse (all species equally represented), then the trajectory would be a straight line from (0, 0) upward and to the right until it intersects (11, 100%), as shown below. Note that the perfectly diverse Site 2 community is also a straight line until it intersects (7, 100%), as it only has 7 species.
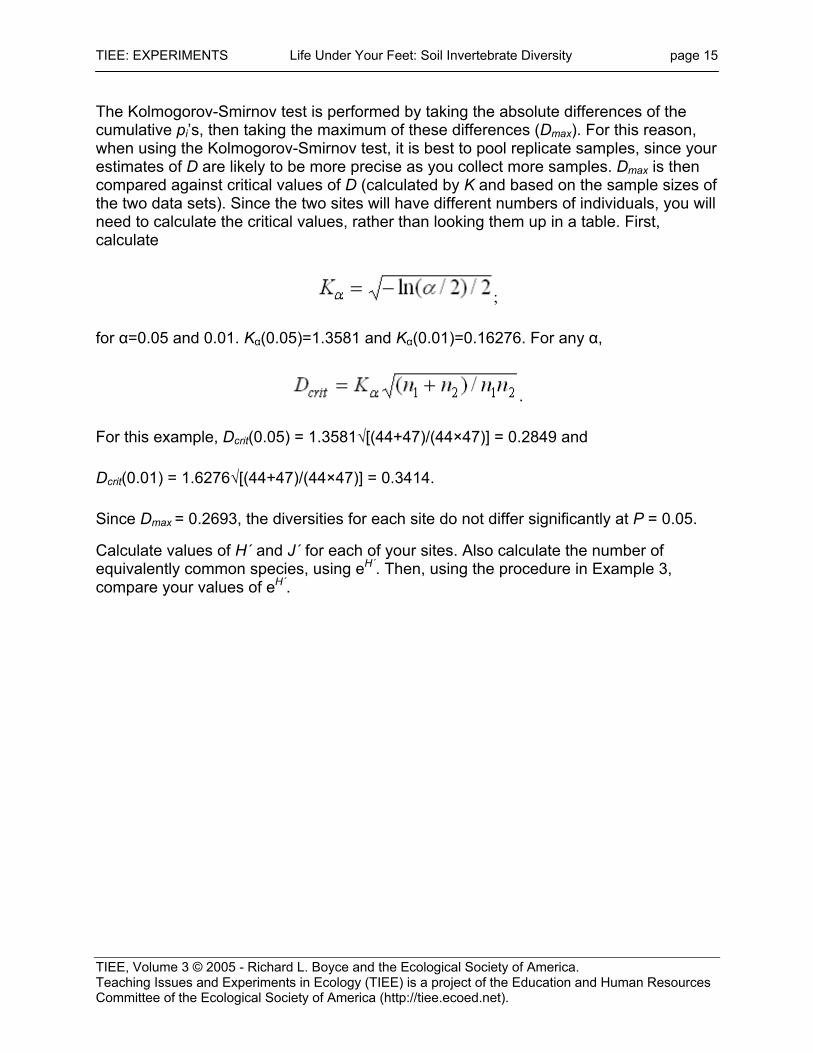
What would happen if a site had the minimum diversity possible? This would be true if one species accounted for 100% of the individuals at a site. This is what Site 1 would look like; Site 2 would look exactly the same, since 100% of the individuals there would also be in the 1st species.
TIEE: EXPERIMENTS Life Under Your Feet: Soil Invertebrate Diversity page 15
The Kolmogorov-Smirnov test is performed by taking the absolute differences of the cumulative pi’s, then taking the maximum of these differences (Dmax). For this reason, when using the Kolmogorov-Smirnov test, it is best to pool replicate samples, since your estimates of D are likely to be more precise as you collect more samples. Dmax is then compared against critical values of D (calculated by K and based on the sample sizes of the two data sets). Since the two sites will have different numbers of individuals, you will need to calculate the critical values, rather than looking them up in a table. First, calculate
;
for α=0.05 and 0.01. Kα(0.05)=1.3581 and Kα(0.01)=0.16276. For any α,
.
For this example, Dcrit(0.05) = 1.3581√[(44+47)/(44×47)] = 0.2849 and
Dcrit(0.01) = 1.6276√[(44+47)/(44×47)] = 0.3414.
Since Dmax = 0.2693, the diversities for each site do not differ significantly at P = 0.05.
Calculate values of H´ and J´ for each of your sites. Also calculate the number of equivalently common species, using eH´. Then, using the procedure in Example 3, compare your values of eH´.
page 16 Richard L. Boyce TIEE Volume 3, April 2005
Report Format The write-up will follow the format of a scientific paper, with a Title, Introduction, Methods & Materials, Results, Discussion, Acknowledgments, and References (or Literature Cited). If you are using Pechenik (2004) in your course, be sure to read Ch. 8 before writing your report, and also pay attention to the pertinent parts of Ch. 3-5. If you are not using Pechenik or a similar guide (or even if you are), you should look at the guidelines given in the TIEE Volume 1 Stomata experiment. The write-up should be no more than 4 double-spaced pages of text (12 point font, 1-inch margins) plus and tables.
• Title: Use the title given for this lab, or another that is short and descriptive.
• Introduction: Describe the purpose and rationale of this study. This is where you should describe your hypothesis, as well as a brief summary of the background references that led you to this hypothesis. This should take no more than 1-2 paragraphs.
• Methods: Describe (briefly) the Berlese-Tullgren funnel technique that we used, as well as how we sampled soil. You may find the chapter on soil invertebrate sampling in Brower et al. (p. 110) or one of the web sites on the funnel technique (given below) to be helpful here. This should be no more than 1-2 paragraphs.
• Results: The exact number of tables and figures may vary depending upon your hypothesis. At a minimum, however, you should be reporting H´, J´ and number of equivalently common species for each site that you have included. You should also report the results of your statistical analysis; a plot of cumulative pi vs. rank should also be included. Be sure that the tables and figures follow basic formal requirements (e.g., caption, columns appropriately labeled, etc.; see Journal of Ecology or Ecology for examples), that they are as easy to read as possible, that they are in the same format, and that they are referred to in the text by number. State in the text whether any of the indices differ from each other statistically (Chapter 3 in Pechenik (2004) or the TIEE Volume 1 Stomata experiment shows how to state this in your report). Also give a brief (no more than one double-spaced page) summary of the data, which will facilitate the reader’s understanding, not just repeat what is in the tables. Point out the largest similarities and differences between the soil communities you examined.
• Discussion: In the discussion section of your lab report, address the differences (if any) that you see for invertebrates in the communities you examined. Do your results support your hypothesis(es)? Revisit the references and show how your data might or might not support what they say. Would you need further data to do this?
• Acknowledgments: Be sure to acknowledge the help of anyone who helped you. This could include your lab partner, other members of the class, the TA and/or your instructor.
• References (or Literature Cited): Be sure to use the format of a journal like Ecology for this section. You may reference this handout, the text, and any other literature, and you may also reference personal communications from the instructor or others (see Pechenik (2004) or the TIEE Volume 1 Stomata experiment for proper format). List a reference only if it is cited in the text; make sure all citations have a matching entry in the References.
TIEE: EXPERIMENTS Life Under Your Feet: Soil Invertebrate Diversity page 17
1. According to the indices, which community has greatest taxa diversity? Do the measures of S, H´ and J´ give different perspectives on total diversity? Why?
2. Do your results suggest that litter quality drives the soil invertebrate community? Or rather, is it edaphic conditions, such as soil moisture, chemistry, etc.? Why or why not? Can litter quality and soil conditions be separated from one another in any meaningful way to answer this question? Could something else be going on? How could you design an experiment to test your hypotheses?
3. Where in the soil food web do most of your invertebrates fall (what is their trophic level)? What could this be telling you about the quality of litter, richness of the site, etc.?
4. There are a lot of ways in which your experimental setup could have affected your results. Remember, most of these invertebrates are small with limited mobility. What do you think you might have found if you had used a smaller amount of soil? A light bulb of a different wattage? How could you redesign your apparatus to collect a less biased sample?
5. As shown in the Swift et al. (1979) model, soil communities can be affected by both the Physico-chemical environment and the Resource Attributes, where the 1st factor refers to the non-living environment and the 2nd factor refers to contributions from the living environment, namely plant tissue. There’s another way of looking at this: a site could be physically disturbed, such as by fire, trampling by large herbivores, etc., which will change the Physico-chemical environment and will certainly change the soil invertebrate community. On the other hand, the plant community will undergo succession, and this will change the resource attributes and will presumably change the soil invertebrate community. Now, both disturbance (allogenic change) and plant community change over time (autogenic change) are considered part of the process of “succession.” Can you think of a way that you could separate the two parts of succession, using soil invertebrate communities? How could you design an experiment to do this? Koehler (1998) might give you some ideas in this area.
6. The composition and biodiversity of soil organisms may have a greater affect on litter decomposition than has been previously recognized. In what ways can changes in the soil invertebrate community affect litter decomposition? Both Behan-Pelletier and Newton (1999) and Hooper et al. (2000) are accessible yet well-referenced articles that can be used as a springboard for discussing this question.
7. What direct effects are your soil invertebrates likely to have on large animal (vertebrates) food chains? Could the different communities you have found explain some of the differences?
page 18 Richard L. Boyce TIEE Volume 3, April 2005
• Behan-Pelletier, V., and G. Newton. 1999. Linking soil biodiversity and ecosystem function: the taxonomic dilemma. Bioscience 49:149-152.
• Brower, J. E., J. H. Zar, and C. N. von Ende. 1998. Field and laboratory methods for general ecology. 4th edition. WCB/McGraw-Hill, Boston.
• Coleman, D. C., and D. A. Crossley, Jr. 1996. Fundamentals of soil ecology. Academic Press, San Diego.
• De Deyn, G. B., C. E. Raaijmakers, H. R. Zoomer, M. P. Berg, P. C. de Ruiter, H. A. Verhoef, T. M. Bezemer, and W. H. van der Putten. 2003. Soil invertebrate fauna enhances grassland succession and diversity. Nature 422:711-713.
• Dunn, G.A., and D.K. Dunn. 1998. The insect identification guide. 4th ed. Special Publication No. 6 of the Young Entomologists’ Society, Inc. Lansing, MI. (May be ordered online at http://members.aol.com/YESbugs/pubmenu.html#Special).
• Edgar, A. L. 1992. A quantitative study of litter and soil invertebrates utilizing the Berlese funnel. In Tested studies for laboratory teaching, Volume 6, Pages 73-89 in C. A. Goldman, S. E. Andrews, P. L. Hauta, and R. Ketchum (eds). Proceedings of the 6th Workshop of the Association for Biology Laboratory Education (ABLE), 161 pages. www.zoo.utoronto.ca/able/volumes/vol-6/4-edgar.pdf
• Freckman, D., and R. A. Virginia. 1997. Low diversity Antarctic soil nematode communities: Distribution and response to disturbance. Ecology 78:363-369.
• Gist, C. S., and D. A. Crossely, Jr. 1975. A model of mineral-element cycling for an invertebrate food web in a southeastern hardwood forest litter community. In Mineral cycling in Southeast ecosystems, Pages 84-106 in J.B. Gentry and M.H. Smith (eds.). National Technical Information Service, U.S. Dept. Commerce, Washington, DC.
• González, G., and T. R. Seastedt. 2001. Soil fauna and plant litter decomposition in tropical and subalpine forests. Ecology 82:955-964.
• Hooper, D. U., D. E. Bignell, V. K. Brown, L. Brussaard, J. M. Dangerfield, D. H. Wall, D. A. Wardle, D. C. Coleman, K. E. Giller, P. Lavelle, W. H. van der Putten, P. C. de Ruiter, J. Rusek, W. Silver, J. M. Tiedje, and V. Wolters. 2000. Interactions between above- and belowground biodiversity in terrestrial ecosystems: Patterns, mechanisms, and feedbacks. BioScience 50:1049-1061.
• Ingham, R. E., J. A. Trofymow, R. V. Anderson, and D. C. Coleman. 1982. Relationships between soil type and soil nematodes in a shortgrass prairie. Pedobiologica 24:139-144.
• Kalisz, P. J., and J. E. Powell. 2000. Effects of prescribed fire on soil invertebrates in upland forests on the Cumberland Plateau of Kentucky USA. Natural Areas Journal 20:336-341.
TIEE: EXPERIMENTS Life Under Your Feet: Soil Invertebrate Diversity page 19
• Koehler, H. 1998. Secondary succession of soil mesofauna: A thirteen year study. Applied Soil Ecology 9:81-86.
• Lal, R. 2002. Soil carbon sequestration in China through agricultural intensification, and restoration of degraded and desertified ecosystems. Land Degradation and Development 13:469-478. http://www.environmental-expert.com/magazine/wiley/1085-3278/pdf3.pdf
• Pechenik, J. A. 2004. A short guide to writing about biology. 5th ed. Pearson Longman, New York.
• Siemann, E., D. Tilman, J. Haarstad, and M. Ritchie. 1998. Experimental tests of the dependence of arthropod diversity on plant diversity. American Naturalist 152:738-750.
• Six, J., C. Feller, K. Denef, S. M. Ogle, J. C. de Moraes Sa, and A. Albrecht. 2002. Soil organic matter, biota and aggregation in temperate and tropical soils - Effects of no-tillage. Agronomie 22:755-775. http://www.casmgs.colostate.edu/pubs/files/283_file.pdf
• Smith, R. L., and T. M. Smith. 2001. Ecology and field biology. 6th ed. Benjamin Cummings, San Francisco.
• Stamm, A., State University of New York-Oswego. 1999. Invertebrates under the snow. http://www.oswego.edu/wscp/is.htm (accessed May 11, 2004).
• Swift, M. J., O. W. Heal, and J. M. Anderson. 1979. Decomposition in terrestrial ecosystems. Blackwell Scientific Publications, London.
• Wardle, D. A., and P. Lavelle. 1997. Linkages between soil biota, plant litter quality and decomposition. Pages 107-124 in G. Cadisch and K. E. Giller, eds. Driven by nature: plant litter quality and decomposition. CAB International, London.
• Wardle, D. A., G. W. Yeates, G. M. Barker, P. J. Bellingham, K. I. Bonner, and W. M. Williamson. 2003. Island biology and ecosystem functioning in epiphytic soil communities. Science 301: 1717-1720.
• Wolters, V., W. L. Silver, D. E. Bignell, D. C. Coleman, P. Lavelle, W. H. van der Putten, P. de Ruiter, J. Rusek, D. H. Wall, D. A. Wardle, L. Brussaard, J. M. Dangerfield, V. K. Brown, K. Giller, D. U. Hooper, O. Sala, J. Tiedje, and J. A. van Veen. 2000. Effects of global changes on above- and belowground biodiversity in terrestrial ecosystems: implications for ecosystem functioning. BioScience 50:1089-1098.
• Zar, J. H. 1999. Biostatistical analysis. 4th edition. Prentice-Hall, Inc., Upper Saddle River, NJ. 931 pp.
page 20 Richard L. Boyce TIEE Volume 3, April 2005
• K-12 lab includes simple microclimate measurements http://cires.colorado.edu/~k12/earthworks/stevens.html
• Microclimate changes in a restoration ponderosa pine site; examples of typical field measurements http://www.envsci.nau.edu/sisklab/recent_publications/meyer_etal_2001.pdf
Constructing Inexpensive Berlese-Tullgren Funnels This is a (by no means comprehensive) list of web sites showing how you can make your own Berlese-Tullgren funnels. Many materials can be used for the funnels, including soda/milk bottle tops, inexpensive funnels, and even heavy paper. For collection, I use 70% ethanol, although I've seen others use everything from 50-95% ethanol.
• A Community Underfoot: Density and Diversity of Invertebrates in Soil or Ground Cover This is an excellent site for constructing your own funnels http://www.nabt.org/sub/pdf/Density1.pdf
• Detrital Food Web in Soil—shows how invertebrates interact with other soil organisms http://www.fs.fed.us/psw/publications/documents/gtr-178/gtr-178-preface.pdf
• The Soil Food Web—a nice diagram http://www.fao.org/ag/AGL/agll/soilbiod/images/web.jpg
• University of San Diego Excel Tutorial—Basic information, including how to use functions, filling down, formatting, inserting, graphing http://www.usd.edu/trio/tut/excel/
• Florida Gulf Coast University Excel Tutorial—Basic information; included visuals http://www.fgcu.edu/support/office2000/excel/
• BayCon Group Excel Tutorial—Introductory information from a commercial site http://www.baycongroup.com/el0.htm
page 22 Richard L. Boyce TIEE Volume 3, April 2005
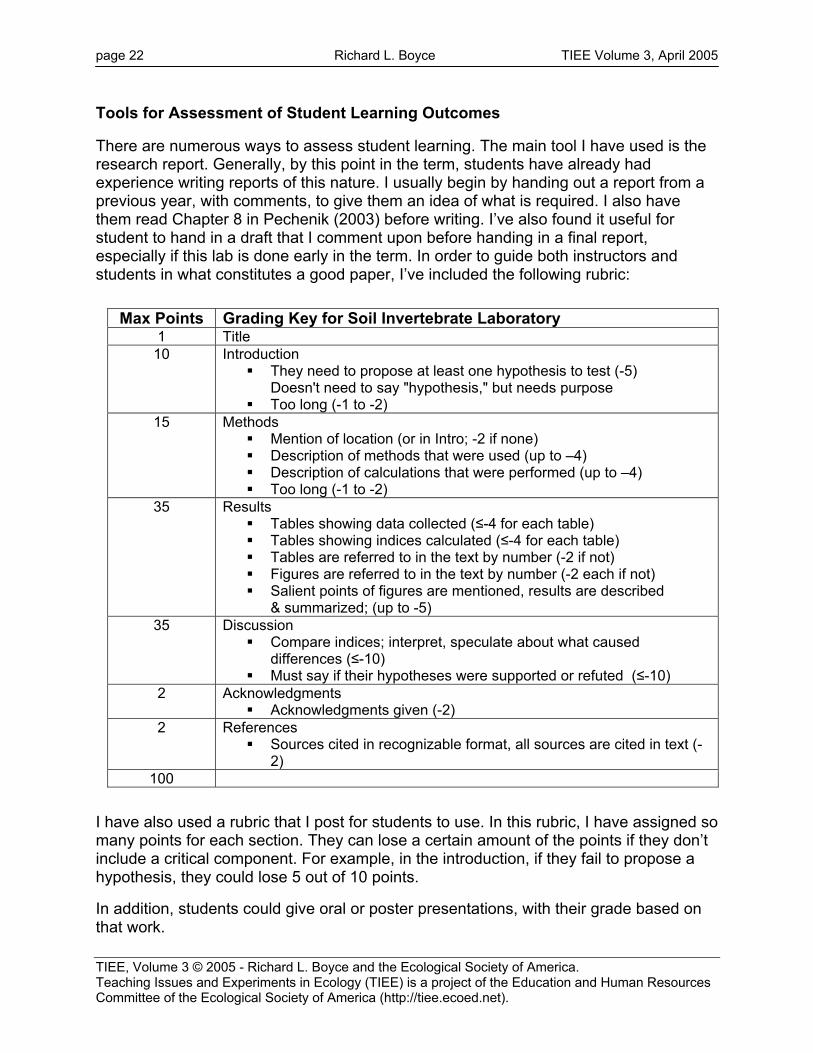
There are numerous ways to assess student learning. The main tool I have used is the research report. Generally, by this point in the term, students have already had experience writing reports of this nature. I usually begin by handing out a report from a previous year, with comments, to give them an idea of what is required. I also have them read Chapter 8 in Pechenik (2003) before writing. I’ve also found it useful for student to hand in a draft that I comment upon before handing in a final report, especially if this lab is done early in the term. In order to guide both instructors and students in what constitutes a good paper, I’ve included the following rubric:
Max Points Grading Key for Soil Invertebrate Laboratory 1 Title
10 Introduction They need to propose at least one hypothesis to test (-5)
Doesn't need to say "hypothesis," but needs purpose Too long (-1 to -2)
15 Methods Mention of location (or in Intro; -2 if none) Description of methods that were used (up to –4) Description of calculations that were performed (up to –4) Too long (-1 to -2)
35 Results Tables showing data collected (≤-4 for each table) Tables showing indices calculated (≤-4 for each table) Tables are referred to in the text by number (-2 if not) Figures are referred to in the text by number (-2 each if not) Salient points of figures are mentioned, results are described
& summarized; (up to -5) 35 Discussion
Compare indices; interpret, speculate about what caused differences (≤-10)
Must say if their hypotheses were supported or refuted (≤-10) 2 Acknowledgments
Acknowledgments given (-2) 2 References
Sources cited in recognizable format, all sources are cited in text (-2)
100 I have also used a rubric that I post for students to use. In this rubric, I have assigned so many points for each section. They can lose a certain amount of the points if they don’t include a critical component. For example, in the introduction, if they fail to propose a hypothesis, they could lose 5 out of 10 points.
In addition, students could give oral or poster presentations, with their grade based on that work.
TIEE: EXPERIMENTS Life Under Your Feet: Soil Invertebrate Diversity page 23
My formative evaluation has been conducted in several ways. First, I always ask students to describe, in the Discussion of their lab report, how the lab could be improved. Unlike the case at many other schools, Ecology Laboratory at Northern Kentucky University is a separate course from the lecture, so student may or may not be taking it at the same time. Thus, at the end of the course, when students fill out a course evaluation, I specifically ask them to comment on which labs they learned the most from and which the least, and why. Finally, I collect a lot of informal feedback while we are doing the lab. For example, the rubric above was generated by student request while a lab was being carried out. NOTE: An extensive discussion on Evaluation appears in the Teaching section of TIEE.
page 24 Richard L. Boyce TIEE Volume 3, April 2005
1. Developing testable hypotheses: Since my lab is in a course separate from ecology lecture, students often don’t have the background—or they’ve forgotten it—needed to easily come up with a good hypothesis. In this case, you may want to prepare them well with references and/or discussions beforehand. The references and web sites listed are a good place to start—you might also want to give a mini-lecture beforehand on soil communities to prime the pump for a discussion leading to testable hypotheses. On the other hand, you may find that giving students readings ahead of time constrains their creativity in designing their experiments. Also, if students think that we already know the correct answer, they may become less engaged in the exercise, and they may think they got the “wrong” answer if they find something different.
Here are some examples of hypothesis that students of mine or others have tested:
o How do invertebrate communities vary under a hardwood vs. hemlock canopy?
o What is the effect of soil pH on invertebrate diversity?
o What is the effect of an invasive plant on invertebrate diversity?
o In an agricultural setting, how do different tillage systems affect invertebrate diversity?
2. Identifying invertebrates: Most students think this is going to be impossible. I wondered myself, being a plant ecologist. However, at the level described here, it really is pretty straightforward! As long as you can identify the organism to phylum or class, the name of the species doesn’t matter in a biodiversity study—mite #1 works just as well as the Latin name.
3. Manipulating large data sets with a spreadsheet: Student familiarity with Excel is all over the map. In my course, students have generally had a good deal of experience with Excel by the time we get to this lab. If they haven’t, you may want to consider an “Excel 101” workshop before doing this lab. See some of the Excel Tutorial websites for pointers.
4. Writing a research-style paper: Again, students in my course have had experience by the time we get to this. If your students haven’t done this before, give them an example of a well-written paper from a previous class. For their first effort, have them hand in a draft that you write comments on. I’ve found that students really appreciate this and learn a lot quickly if you give them a chance on a draft. It also makes subsequent reports a lot easier to read and grade.
TIEE: EXPERIMENTS Life Under Your Feet: Soil Invertebrate Diversity page 25
Introducing the Lab to Your Students: Since my lab is not tied into a lecture, I find it helpful to discuss mechanisms of soil invertebrate diversity with students before this lab. I try to have students read beforehand and discuss what they found. The best kinds of questions to ask should be “explain how...,” “what if...,” and “how does _____ affect...?” types. Some examples: “How does litter quality typically affect functional types in the soil invertebrate community?”; “What would happen if a pasture was plowed to plant corn?”; “How does succession from an old field to a forest affect the community structure?”; “Explain why the litter community differs from the soil community.” With the levels of students I have, I find the “bounded inquiry” method works the best. Here, the research question can be either generated by the student or by the instructor. I try to get students to do this, but I guide the discussion so that they are likely to come up with a testable hypothesis. In bounded inquiries, the study system and methods can be either student-generated or given by the instructor. Again, I try to have them generate this, with my guidance. Both the data collection and analysis and presentation steps are done by the students.
Guided inquiry differs in that the research question and the study system and methods are given by the instructor, and the data collection can be either done by the students or given by the instructor. With highly motivated and well-prepared students, the instructor can use the “open-ended inquiry” model, where the research question is either student-generated or given by the instructor (ideally, it is student-generated with guidance from the instructor). Representative readings are listed in the Introduction; I would suggest any of the following as good places to start: Behan-Pelletier and Newton 1999, Hooper et al. 2000, Kalisz and Powell 2000, Six et al. 2002, Wardle and Lavelle 1997, and Wolters et al. 2000. For sampling methods, I suggest Brower et al. (1998), chapter 3d, or Southwood and Henderson (2000), chapter 6. You may also find many resources on the Internet. For example, using the phrase “soil biodiversity” at http://scholar.google.com will yield many useful hits.
Although I have not done this, it would be interesting to include measurements of soil and parameters, such as soil moisture, temperature, organic matter (loss on ignition), texture, chemistry, and an index or litter quality or quantity, and site parameters such as light levels and air temperature. In that case, you should give the students a reading from an ecological methods source that will help them. Brower et al. (1998) has quite a few suggestions for assessing soil properties such as parent material, soil moisture & temperature, soil organic matter and density, and soil texture in Chapter 2c, and soil chemistry measurements are outlined in Chapter 2e. However, both Hach and LaMotte1 make inexpensive soil test kits, which might also be included. Site parameters, such as light, temperature, etc. could also be measured; again, Brower et al. (1998), chapter 2b has some good suggestions.
1 — Lamotte AM-31 and AM-32 Soil Test Kits available at Forestry Suppliers (http://www.forestry-suppliers.com); Hach kits are available at Ben Meadows (http://www.benmeadows.com/search/results.asp?prodKeyword=hach).
page 26 Richard L. Boyce TIEE Volume 3, April 2005
Activities in the Lab: This lab has a lot of room for variation and local adaptation. The actual sampling could be fairly quantitative or it could just be a grab sample. You could have students focus on the effect of different wattage of light bulb on their results. Diversity indices other than Shannon can be used; Brower et al. (1998) has a good summary of them. Even if you use the Shannon index, you can use the t-test in Brower et al. (1998) or Zar (1999) instead of the Komolgorov-Smirnov test described here, provided that you replicate a fairly large number of times. It would also be possible to include visual ways of presenting diversity. This would include a species-area curve (really a taxa-area) curve and a log-normal curve. Note that Brower et al. (1998) describes both of these curves well in Chapter 5a. If you decide to go this route, you should have students measure the area and/or volume that they sample.
Questions for Further Thought
For #1, you want students to see that both richness and evenness contribute to overall diversity.
For #2, my goal is to get students to see that, in ecology, many factors co-vary, making it hard to see which one is driving the process you are interested in. It can take a lot of imagination to design an experiment that separates these different factors.
Question #3 will hopefully get students to dive into the literature and figure out what the functions are of the critters they have found. This may also get them to think about the quality of the litter these animals are feeding on, which will lead to them to see how vegetation can drive invertebrate communities.
Question #4 will lead students to think about the limitations of their sampling techniques, introducing the idea of bias. Perhaps they can come up with a better design than I have outlined here!
Concerning Question #5, I haven’t done anything with succession in this experiment, so I don’t have a lot of guidance to offer on this point. It also looks like few other ecologists have thought about, based on the paucity of references I could find in this area. Nonetheless, what we think of as plant succession is actually two different processes from the invertebrate community’s perspective. Ecology has a long history of lumping multiple processes together under one name. This question will illustrate another example of that occurrence; it may also potentially lead some students down a path that may make an important contribution to ecology someday!
Question #6 is trying to illustrate feedback loops, showing that not only does litter quality affect the invertebrate community and thus the litter decay rate, but the invertebrate community itself can also affect the litter decay rate.
The purpose of Question #7 is to link the soil food web with the vertebrate food web in the same community.
TIEE: EXPERIMENTS Life Under Your Feet: Soil Invertebrate Diversity page 27
A variety of assessment schemes are possible in addition to the written report. See the comments under #4 of Challenges to Anticipate and Solve. Oral or poster presentations, either individually or by a group, are also possible. I have not tried this with students in an ecology class before, but I have seen it work well in other types of courses. These kinds of presentations will take at least one lab period. Students in my program actually get this kind of experience in a research methods course, so I don’t have to do a lot of preparation in this area. If your students are unlikely to have this background, I highly recommend the in Pechenik (2001).
Evaluation of the Lab Activity
I think a formal written evaluation, similar to course evaluations, could be designed and given to students after they have been assessed in this lab, in order to evaluate the effectiveness of the lab.
Translating the Activity to Other Scales
1. Translating this experiment to larger scales: I generally teach this to a class of 11—14 junior and senior biology majors. With a larger class, it would certainly be possible to ask more quantitative questions. I suspect that it would be harder to find the time to have students come up with their own hypotheses. I also suspect that you will need to dispense with the oral/poster presentations, and you may need to cut back on the written part as well.
2. Translating this experiment to pre-college settings: You may want to dispense with most of the diversity calculations. Simply showing students the tremendous diversity of animals in the soil will be educational. Calculating H´ and eH´ might be sufficient at the high school level.
This lab is essentially a number of modules that can be mixed and matched as needed. For hypothesis generation, you may give hypotheses to students if they are not prepared or motivated enough to come up with their own. The sampling methodology can be as quantitative or qualitative as judged appropriate. The same is true for counting taxa; you may simply have students note presence or you may have them count numbers of individuals of each taxon. For evaluation, you may use the form of written report given here, or you may use another. If you wish to train students in oral presentation, you may use that instead or in addition to written work. STUDENT COLLECTED DATA FROM THIS EXPERIMENT Sample data are provided in the file: soil[Invert_Data].xls
page 28 Richard L. Boyce TIEE Volume 3, April 2005
The inspiration for this laboratory came from Buck Sanford at the University of Denver, from whom I received the original version. The invertebrate key and illustrations were adapted from a web page developed as part of the Winter Science Curriculum Project at the State University of New York at Oswego by Peter G. Weber and colleagues. Bruce Grant from Widener University was full of constructive comments that vastly improved the laboratory, especially regarding nail polishes. He also generously donated the data for the examples I use in this lab, and he relayed the insights that eH' is “the equivalent number of equally common species” and the use of the Kolmogorov-Smirnov test to compare H´ between two sites, which originated from unpublished work by John and Robert MacArthur. Both Bruce Grant and Charlene D’Avanzo (Hampshire College) made numerous insightful and constructive suggestions on an earlier draft of this experiment, as did an anonymous reviewer. I also want to thank the students of Bio 306, Ecology Laboratory, at Northern Kentucky University, who served as guinea pigs for the development of this laboratory.
COPYRIGHT STATEMENT
The Ecological Society of America (ESA) holds the copyright for TIEE Volume 3, and the authors retain the copyright for the content of individual contributions (although some text, figures, and data sets may bear further copyright notice). No part of this publication may be reproduced, stored in a retrieval system, or transmitted, in any form or by any means, electronic, mechanical, photocopying, recording, or otherwise, without the prior written permission of the copyright owner. Use solely at one's own institution with no intent for profit is excluded from the preceding copyright restriction, unless otherwise noted. Proper credit to this publication must be included in your lecture or laboratory course materials (print, electronic, or other means of reproduction) for each use.
To reiterate, you are welcome to download some or all of the material posted at this site for your use in your course(s), which does not include commercial uses for profit. Also, please be aware of the legal restrictions on copyright use for published materials posted at this site. We have obtained permission to use all copyrighted materials, data, figures, tables, images, etc. posted at this site solely for the uses described in the TIEE site.
Lastly, we request that you return your students' and your comments on this activity to the TIEE Managing Editor ([email protected]), for posting at this site.
GENERIC DISCLAIMER
Adult supervision is recommended when performing this lab activity. We also recommend that common sense and proper safety precautions be followed by all participants. No responsibility is implied or taken by the contributing author, the editors of this Volume, nor anyone associated with maintaining the TIEE web site, nor by their academic employers, nor by the Ecological Society of America for anyone who sustains injuries as a result of using the materials or ideas, or performing the procedures put forth at the TIEE web site, or in any printed materials that derive therefrom.