Agricultural and Biosystems Engineering Publications Agricultural and Biosystems Engineering 1993 Tillage and Nitrogen Management Effects on Nitrate-Nitrogen in the Soil Profile Peeyush Varshney Iowa State University Rameshwar S. Kanwar Iowa State University, [email protected]James L. Baker Iowa State University, [email protected]Carl E. Anderson Iowa State University Follow this and additional works at: hp://lib.dr.iastate.edu/abe_eng_pubs Part of the Agriculture Commons , Bioresource and Agricultural Engineering Commons , and the Soil Science Commons e complete bibliographic information for this item can be found at hp://lib.dr.iastate.edu/ abe_eng_pubs/699. For information on how to cite this item, please visit hp://lib.dr.iastate.edu/ howtocite.html. is Article is brought to you for free and open access by the Agricultural and Biosystems Engineering at Iowa State University Digital Repository. It has been accepted for inclusion in Agricultural and Biosystems Engineering Publications by an authorized administrator of Iowa State University Digital Repository. For more information, please contact [email protected].
Transcript
Agricultural and Biosystems EngineeringPublications Agricultural and Biosystems Engineering
1993
Tillage and Nitrogen Management Effects onNitrate-Nitrogen in the Soil ProfilePeeyush VarshneyIowa State University
Follow this and additional works at: http://lib.dr.iastate.edu/abe_eng_pubs
Part of the Agriculture Commons, Bioresource and Agricultural Engineering Commons, and theSoil Science Commons
The complete bibliographic information for this item can be found at http://lib.dr.iastate.edu/abe_eng_pubs/699. For information on how to cite this item, please visit http://lib.dr.iastate.edu/howtocite.html.
This Article is brought to you for free and open access by the Agricultural and Biosystems Engineering at Iowa State University Digital Repository. Ithas been accepted for inclusion in Agricultural and Biosystems Engineering Publications by an authorized administrator of Iowa State UniversityDigital Repository. For more information, please contact [email protected].
Tillage and Nitrogen Management Effects on Nitrate-Nitrogen in the SoilProfile
AbstractA field study was conducted on Nicollet loam soils to determine the effects of tillage and nitrogen (N)management on the residual nitrate-nitrogen (NO3-N) in the soil profile. Two replications of two tillagesystems (no-till and moldboard plow) and two N management practices (single application of N at the rate of175 kg/ha and three applications totaling 125 kg/ha) were used for continuous-corn production. Soil sampleswere taken periodically each year to a depth of 150 cm at three locations within each of the six experimentalplots (9 m apart, one along and two on either side of a tile drain running down the center of the plot). No-tilland three N applications with a lower total application rate reduced the residual NO3-N in the soil profile.Regression analysis of the data showed less residual NO3-N under no-till system having a definite decreasingtrend with depth. Eight years (1984-1991) of data indicate that corn yields were not affected by tillage or Nmanagement practices.
P. Varshney, R. S. Kanwar, J. L. Baker, STUDENT MEMBER MEMBER MEMBER
ASAE ASAE ASAE
C. E. Anderson MEMBER
ASAE
ABSTRACT. A field study was conducted on Nicollet loam soils to determine the effects of tillage and nitrogen (N) management on the residual nitrate-nitrogen (NOyN) in the soil profile. Two replications of two tillage systems (no-till and moldboard plow) and two N management practices (single application of N at the rate of 175 kg I ha and three applications totaling 125 kg/ha) were used for continuous-corn production. Soil samples were taken periodically each year to a depth of 150 cm at three locations within each of the six experimental plots (9 m apart, one along and two on either side of a tile drain running down the center of the plot). No-till and three N applications with a lower total application rate reduced the residual NO yN in the soil profile. Regression analysis of the data showed less residual NOyN under no-till system having a definite decreasing trend with depth. Eight years (1984-1991) of data indicate that corn yields were not affected by tillage or N management practices. Keywords. Tillage, Nitrogen, Fertilizer, Nutrients, Management, Corn, Soil samples.
Increased nitrate-nitrogen (NO3-N) concentrations in tile drainage water and in deeper groundwater sources, as a result of higher application rates of nitrogen (N) fertilizer, have been documented in several studies
(Baker and Johnson, 1981; Gast et al., 1978; Kanwar et al., 1988; Kanwar and Baker, 1991; Schepers et al., 1986). Tillage is one of the major agricultural activities affecting the transport of NO3-N to groundwater. It directly affects soil water properties of the surface as well as subsurface soil and therefore leaching characteristics. Tillage disturbs the network of macropores thus potentially reducing preferential flow. Timing and rates of N-fertilizer applications can affect both the availability of N for crop growth and the amount of NO3-N remaining in the soil profile (Gast et al., 1978; James, 1978; Jokela, 1992; Kanwar etal., 1985).
The amount and distribution of inorganic N, primarily NO3-N, remaining in the soil profile at the end of the growing season (residual N) is greatly affected by fertilizer management as well as by the soil moisture regime. Application rates of N greater than those needed for optimum crop yields can cause an accumulation of large amounts of NO3-N in the soil profile and, in some cases, movement beyond the root zone (Nelson and MacGregor, 1973; Jolley and Pierre, 1977; Olsen et al., 1970). In
Article was submitted for publication in August 1992; reviewed and approved for publication by the Soil and Water Div. of ASAE in March 1993.
Journal Paper No. J-14899 of the Iowa Agricultural and Home Economics Experimental Station, Ames. Project No. 3003. This project was supported in part by the Integrated Farm Demonstration Project through the Iowa Department of Agriculture and Land Stewardship, Iowa Department of Natural Resources and the Leopold Center with funds provided from the Iowa Groundwater Protection Act.
The authors are Peeyush Varshney, Graduate Research Assistant, Rameshwar S. Kanwar, Professor, James L. Baker, Professor, and Carl E. Anderson, Associate Professor, Dept. of Agricultural and Biosystems Engineering, Iowa State University, Ames.
several studies in Nebraska, N application later in the season has consistently shown larger amounts of residual N and a greater proportion near the surface than application at planting time (Herron et al., 1971; Russelle et al., 1981; Johnston and Fowler, 1991). Residual N potentially available for the following year's crop is also susceptible to loss by leaching or denitrification. A field study in Wisconsin (Olsen et al., 1970) showed greater leaching of NO3-N over the winter than during the growing season.
Herron et al. (1971) conducted field experiments to study the residual mineral N accumulation in soil and its utilization by irrigated com. Delayed fertilizer application resulted in greater crop use efficiency and more residual N than with preplant application, suggesting greater losses through leaching and gaseous evolution with the preplant application in early spring months when there are no active crop roots for rapid uptake of N.
As part of this study, field experiments were conducted by Kanwar et al. (1988) to study the effects of no-till and conventional tillage, and single and multiple N applications, on the leaching of NO3-N with subsurface drainage water below the root zone of continuous com. Comparisons were made between conventional and no-till with a single N application of 175 kg/ha at the time of planting, and between a single application of 175 kg/ha and three N applications at a total of 125 kg/ha with the no-till system. No significant effects of tillage and N management were observed in the first year of the experiments. However, in the third year a significant reduction of NO3-N in subsurface drainage water with no-till relative to conventional tillage was observed. Also with no-till, three N applications at a lower total rate reduced NO3-N concentrations in drainage water compared with the single, higher rate of application.
Nyborg and Malhi (1989) conducted field experiments in north-central Alberta to compare the effect of no-till versus conventional tillage on soil NO3-N content, soil water content, and soil temperature on two soils with two
Single application (175 kg/ha) 23 May 2 May 20 May 15 May 20 May 15 May 9 May 10 May Three applications (125 kg / ha) (25 kg / ha) 1st 23 May 17 May Sf Jun 15 May 20 May 31 May 8 May 20 May (50 kg/ha) 2nd 26 Jun 5 Jun 25 Jun 16 Jun 3 Jun 3 Jun 27 Jun 6 Jun (50 kg/ha) 3rd 3 Jul 24 Jun 15 Jul 1 Jul 23 Jun 6 Jul 19 Jul 26 Jun
Harvesting 2 Oct 11 Oct 21 Oct 6 Oct 6 Oct 26 Oct 17 Oct 2 Oct
* Planting rate, actual population estimated to be about 10% less. t Rainfall prevented earlier application.
tillage treatments and two rates of applied N. The first crop did not show much of a response to applied N and yields were similar among treatments, but by the third crop, no-till plots without N produced significantly less yield than conventional tillage. However, yields on the no-till plots approached those of the conventional tilled plots when N was added. Since NO3-N is subject to losses by denitrification and leaching, lower N mineralization rates under no tillage may reduce potential for NO3-N loss. Timmons and Cruse (1990, 1991) in studies conducted in central Iowa found that, about one year after application, an average of 20% of the applied N remained in the soil profile and 95% of that was found in the organic N pool. Labeled N accumulation in corn grain was affected by fertilization method but not by tillage. Jokela and Randall (1989) found that residual NO3-N in the fall was consistently increased by delayed application of the high N rate from the planting (PL) to eight-leaf (8L) stage, with most of the increase occurring in the upper 60 cm of the profile. In a similar study, Jokela (1992) found negligible effect of the time of N application on yield. Samples taken before planting and after harvesting from 1.5 m soil profile showed increases in soil NO3-N that were related to the amounts of manure and fertilizer N applied.
Tracy et al. (1990) found that untilled soils accumulated more NO3-N than plowed soils in the 0- to 5-cm layer. Tillage did not influence net N mineralization below the 5-cm soil depth. Varvel and Peterson (1990) found that high N application resulted in greater residual NO3-N concentrations for continuous com and continuous grain sorghum than for any other crop. Residual NO3-N concentrations were low (< 4 mg/kg at depths below 30 cm) at all N application rates for continuous soybean and 2- and 4-year cropping systems. Considerable amounts of fertilizer N have been found in the soil organic N fraction. Kitur et al. (1984) reported that 28 to 42% of the fertilizer N applied to com remained in the soil, depending on the N rate and tillage. The objective of this research was to determine the effect of two tillage practices (namely, moldboard plowing and no-till) and two fertilizer management practices (single and three N applications, with the three applications at a lower total rate) on the residual soil profile NO3-N and com yield.
1989 1990
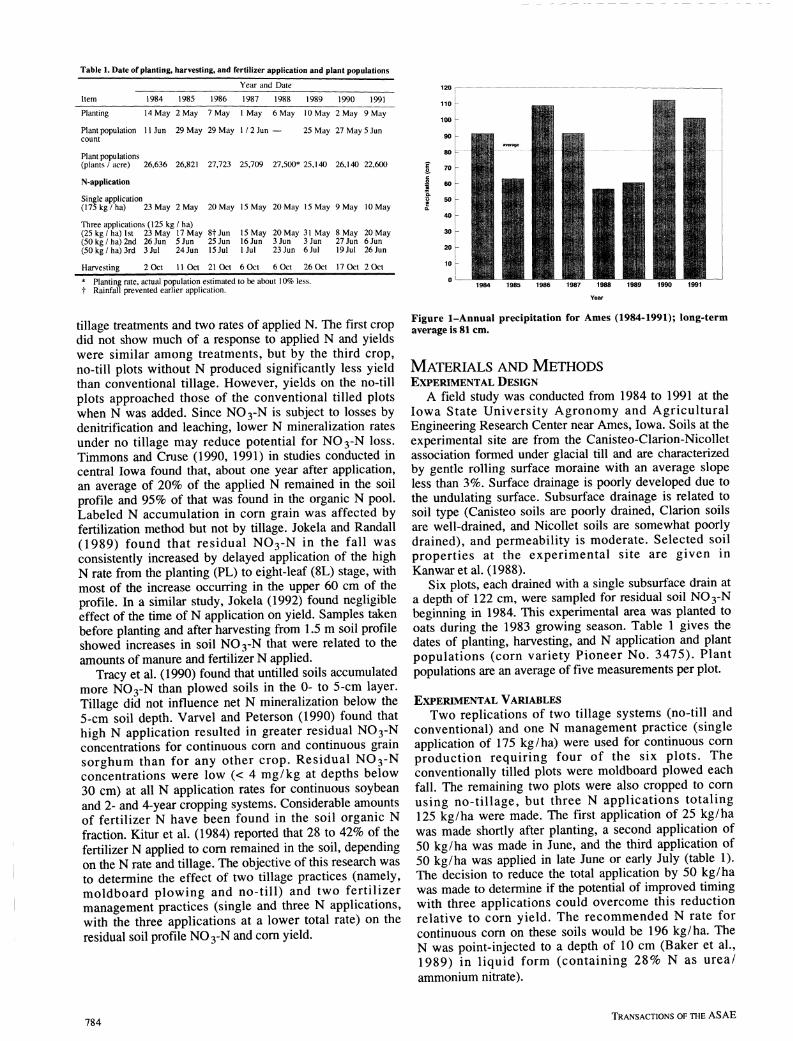
Figure 1-Annual precipitation for Ames (1984-1991); long-term average is 81 cm.
MATERIALS AND METHODS EXPERIMENTAL DESIGN
A field study was conducted from 1984 to 1991 at the Iowa State University Agronomy and Agricultural Engineering Research Center near Ames, Iowa. Soils at the experimental site are from the Canisteo-Clarion-Nicollet association formed under glacial till and are characterized by gentle rolling surface moraine with an average slope less than 3%. Surface drainage is poorly developed due to the undulating surface. Subsurface drainage is related to soil type (Canisteo soils are poorly drained. Clarion soils are well-drained, and Nicollet soils are somewhat poorly drained), and permeability is moderate. Selected soil properties at the experimental site are given in Kanwaretal. (1988).
Six plots, each drained with a single subsurface drain at a depth of 122 cm, were sampled for residual soil NO3-N beginning in 1984. This experimental area was planted to oats during the 1983 growing season. Table 1 gives the dates of planting, harvesting, and N application and plant populations (corn variety Pioneer No. 3475). Plant populations are an average of five measurements per plot.
EXPERIMENTAL VARIABLES
Two replications of two tillage systems (no-till and conventional) and one N management practice (single application of 175 kg/ha) were used for continuous com production requiring four of the six plots. The conventionally tilled plots were moldboard plowed each fall. The remaining two plots were also cropped to com using no-tillage, but three N applications totaling 125 kg/ha were made. The first application of 25 kg/ha was made shortly after planting, a second application of 50 kg/ha was made in June, and the third application of 50 kg/ha was applied in late June or early July (table 1). The decision to reduce the total application by 50 kg/ha was made to determine if the potential of improved timing with three applications could overcome this reduction relative to corn yield. The recommended N rate for continuous com on these soils would be 196 kg/ha. The N was point-injected to a depth of 10 cm (Baker et al., 1989) in liquid form (containing 28% N as urea/ ammonium nitrate).
784 TRANSACTIONS OF THE A S A E
* 60 z 'n
O 50
I ° c 20 CO
o S 10
0
80
-^ 70
I so I 40 a 30
^ 20
S S 10
0
80
'« 70
I; 60 z 0 50
1 40 8 Q. 30
20 & S s 10
'^^^^ ' Number of SamDnnqDate8=2 ^ ^ l
1
a
1
n aj
1 a [ 1 li.l rfl nn rn 0-15 15-30 30-60 60-90 90-120 120-150
1986 Number of Sampling Date8g8 ^ ^ CTS ES23NTS
0-15
( a
1
\^ rib a a
b i
15-30 30-60 60-90 90-120 120-150
Number of Sampling DatesaS C D CTS CZ3NTS
1988
l a a a
0-15 15-30 30-60 60-90
Depth (cm)
80
90-120 120-150
80
70
60
50
40
30
20
10
0
80
70
60
50
40
30
20
10
0
80
70
60
50
40
30
20
10
0
1 9 8 5 I Number of Sampling Date8=8 [S23 NTS
b a m 0-15 15-30 30-60 60-90 90-120 120-150
M " ^ ' I Number of Sampling Date8=6
•rnnnRnnifT
^ C T S ES3 NTS
iPn 0-15 15-30 30-60 60-90 90-120 120-150
Number of Sampling Date8=2
-
-
a a f — ]
a
tt
b a a pf
E33NTS
198! i\
a . a
0-15 15-30 30-60 60-90 Depth (cm)
90-120 120-150
I Number of Sampling Date8=1 a
dz] CTS tzziNTS
1990
0-15 15-30 30-60 60-90 90-120 120-150 Depth (cm)
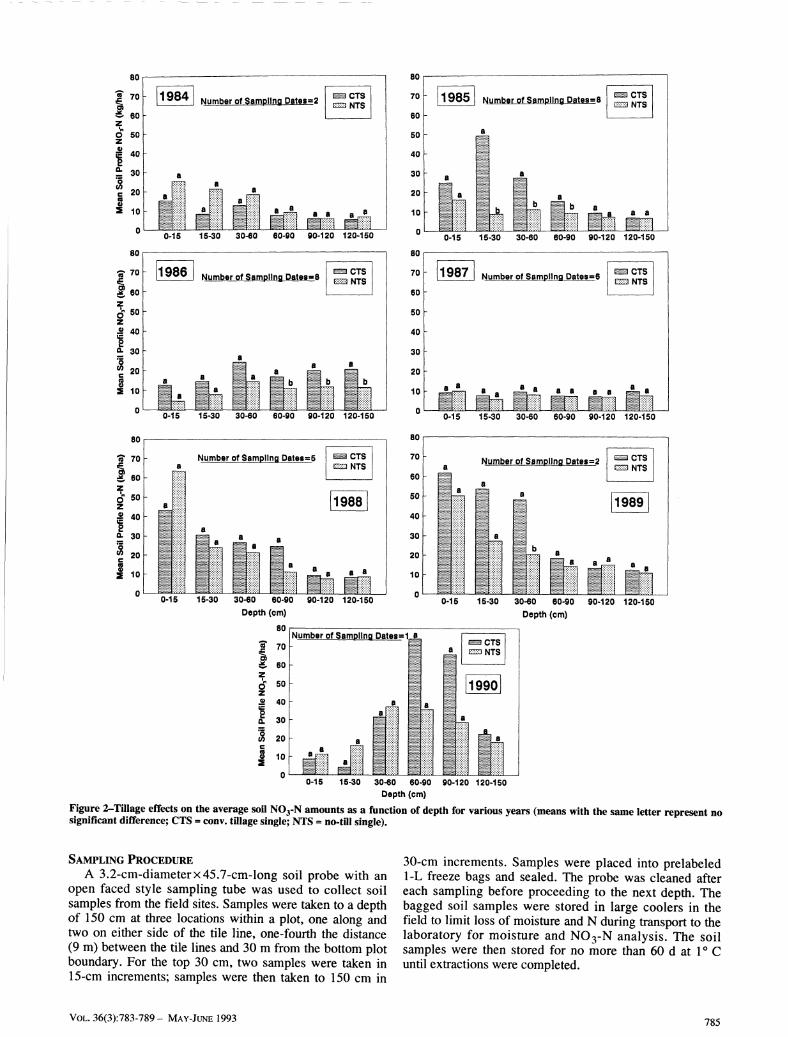
Figure 2-Tillage effects on the average soil NO3-N amounts as a function of depth for various years (means with the same letter represent no significant difference; CTS = conv. tillage single; NTS « no-till single).
SAMPLING PROCEDURE
A 3.2-cm-diameterx45.7-cm-long soil probe with an open faced style sampling tube was used to collect soil samples from the field sites. Samples were taken to a depth of 150 cm at three locations within a plot, one along and two on either side of the tile line, one-fourth the distance (9 m) between the tile lines and 30 m from the bottom plot boundary. For the top 30 cm, two samples were taken in 15-cm increments; samples were then taken to 150 cm in
30-cm increments. Samples were placed into prelabeled 1-L freeze bags and sealed. The probe was cleaned after each sampling before proceeding to the next depth. The bagged soil samples were stored in large coolers in the field to limit loss of moisture and N during transport to the laboratory for moisture and NO3-N analysis. The soil samples were then stored for no more than 60 d at 1° C until extractions were completed.
Figure 3-Effect of N management on soil NO3-N amounts by depth (means with the same letter represent no significant difference; ^ S = no-
till single; NTT -= no-till three).
SAMPLE ANALYSIS
A 2-N potassium chloride extraction solution was used to extract NO3-N from soil samples (Keeney and Nelson, 1982). Soil moisture was determined gravimetrically. Soil solution extracts were analyzed for NO3-N by the cadmium-reduction method using a Technicon Analyzer II system (Kanwar et al., 1988).
STATISTICAL ANALYSIS
Statistical analyses of the NO3-N amounts in the soil profile at each depth and with time were performed to determine significant differences in means by using the analysis of variance procedure (ANOVA) with SAS (SAS Institute, 1985). All analyses were performed at the 95% probability level. Analyses were broken into two parts:
• Conventional tillage versus no-till at the same rate of N application (175 kg/ha) to evaluate the effect of tillage on soil profile residual NO3-N.
786 TRANSACTIONS OF THE A S A E
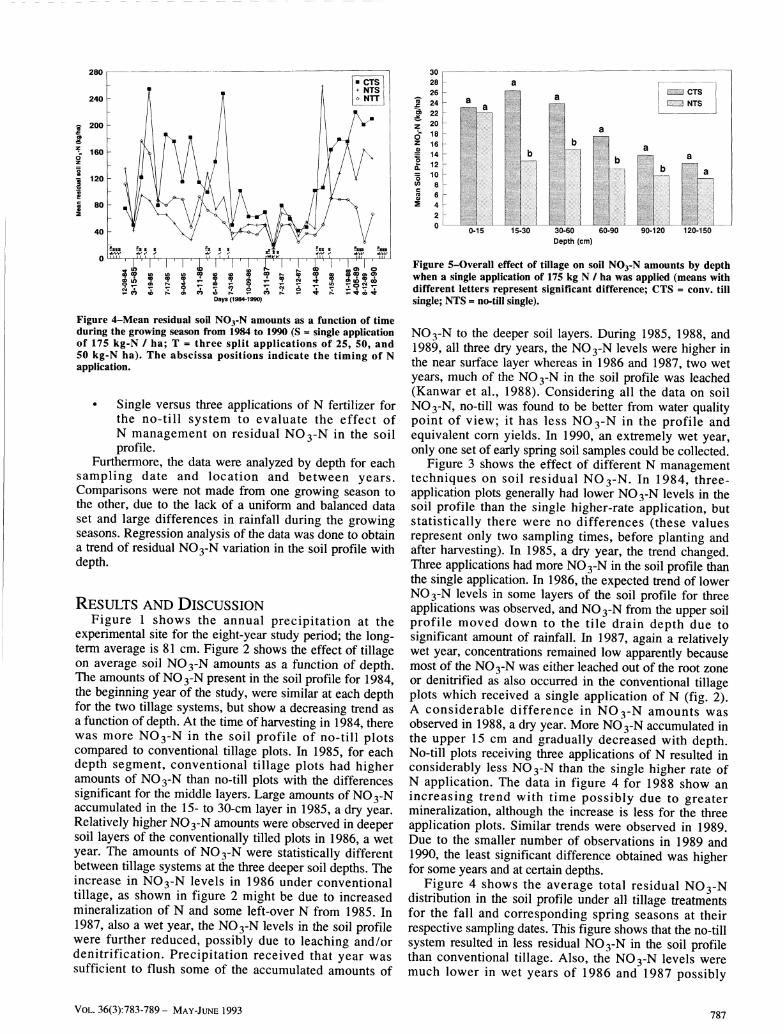
Figure 4-Mean residual soil NO3-N amounts as a function of time during the growing season from 1984 to 1990 (S = single application of 175 kg-N / ha; T = three split applications of 25, 50, and 50 kg-N ha). The abscissa positions indicate the timing of N application.
Single versus three applications of N fertilizer for the no-till system to evaluate the effect of N management on residual NO3-N in the soil profile.
Furthermore, the data were analyzed by depth for each sampling date and location and between years. Comparisons were not made from one growing season to the other, due to the lack of a uniform and balanced data set and large differences in rainfall during the growing seasons. Regression analysis of the data was done to obtain a trend of residual NO3-N variation in the soil profile with depth.
RESULTS AND DISCUSSION Figure 1 shows the annual precipitation at the
experimental site for the eight-year study period; the long-term average is 81 cm. Figure 2 shows the effect of tillage on average soil NO3-N amounts as a function of depth. The amounts of NO3-N present in the soil profile for 1984, the beginning year of the study, were similar at each depth for the two tillage systems, but show a decreasing trend as a function of depth. At the time of harvesting in 1984, there was more NO3-N in the soil profile of no-till plots compared to conventional tillage plots. In 1985, for each depth segment, conventional tillage plots had higher amounts of NO3-N than no-till plots with the differences significant for the middle layers. Large amounts of NO3-N accumulated in the 15- to 30-cm layer in 1985, a dry year. Relatively higher NO3-N amounts were observed in deeper soil layers of the conventionally tilled plots in 1986, a wet year. The amounts of NO3-N were statistically different between tillage systems at the three deeper soil depths. The increase in NO3-N levels in 1986 under conventional tillage, as shown in figure 2 might be due to increased mineralization of N and some left-over N from 1985. In 1987, also a wet year, the NO3-N levels in the soil profile were further reduced, possibly due to leaching and/or denitrification. Precipitation received that year was sufficient to flush some of the accumulated amounts of
0-15 15-30 30-60 60-90 90-120 120-150 Depth (cm)
Figure 5-Overall effect of tillage on soil NO3-N amounts by depth when a single application of 175 kg N / ha was applied (means with different letters represent significant difference; CTS = conv. till single; NTS = no-till single).
NO3-N to the deeper soil layers. During 1985, 1988, and 1989, all three dry years, the NO3-N levels were higher in the near surface layer whereas in 1986 and 1987, two wet years, much of the NO3-N in the soil profile was leached (Kanwar et al., 1988). Considering all the data on soil NO3-N, no-till was found to be better from water quality point of view; it has less NO3-N in the profile and equivalent corn yields. In 1990, an extremely wet year, only one set of early spring soil samples could be collected.
Figure 3 shows the effect of different N management techniques on soil residual NO3-N. In 1984, three-application plots generally had lower NO3-N levels in the soil profile than the single higher-rate application, but statistically there were no differences (these values represent only two sampling times, before planting and after harvesting). In 1985, a dry year, the trend changed. Three applications had more NO3-N in the soil profile than the single application. In 1986, the expected trend of lower NO3-N levels in some layers of the soil profile for three applications was observed, and NO3-N from the upper soil profile moved down to the tile drain depth due to significant amount of rainfall. In 1987, again a relatively wet year, concentrations remained low apparently because most of the NO3-N was either leached out of the root zone or denitrified as also occurred in the conventional tillage plots which received a single application of N (fig. 2). A considerable difference in NO3-N amounts was observed in 1988, a dry year. More NO3-N accumulated in the upper 15 cm and gradually decreased with depth. No-till plots receiving three applications of N resulted in considerably less NO3-N than the single higher rate of N application. The data in figure 4 for 1988 show an increasing trend with time possibly due to greater mineralization, although the increase is less for the three application plots. Similar trends were observed in 1989. Due to the smaller number of observations in 1989 and 1990, the least significant difference obtained was higher for some years and at certain depths.
Figure 4 shows the average total residual NO3-N distribution in the soil profile under all tillage treatments for the fall and corresponding spring seasons at their respective sampling dates. This figure shows that the no-till system resulted in less residual NO3-N in the soil profile than conventional tillage. Also, the NO3-N levels were much lower in wet years of 1986 and 1987 possibly
VOL. 36(3):783-789 - MAY-JUNE 1993 787
L h
1 3
_ -_ _ _
- " - " •
a
a a
a
-f_--
1 a
a
^ ^ NTS
i H l ] NTT
. r ^ 3 « b b """" — ~ i
f 1 ?« o z 1 1 s 3 o
1
160
140
120
100
80
60
40
20
0 0-15 15-30 30-60 60-90 90-120 120-150
Depth (cm)
Figure 6-Overall effect of N management on soil NO3-N amounts by depth under no-till system (means with different letters represent significant difference; NTS = no-till single; NTT = no-till three).
1986 1987 Year
Figure 8-Effect of single vs. three N applications on annual average cumulative NO3-N under no-till system (NTS = no-till single; NTT = no-till three).
indicating the effects of denitrification and/or increased leaching of NO3-N to groundwater.
Figures 5 and 6 show the overall effects of tillage treatments and N management on NO3-N contents in the soil profile. These figures show the mean NO3-N amounts for each depth for all years. Significant differences in the NO3-N amounts were observed at several depths in the soil profile. Under conventional tillage, more NO3-N accumulated in the upper soil layers where most of the macropores were destroyed due to tillage activity, while the soil structure below the 60-cm depth remains undisturbed. In the no-till system, where macropores are allowed to develop and persist, the structure at the soil surface could be markedly different, but may be similar to that in conventional tillage at greater depths. The no-till system under both N management practices indicates significantly lower NO3-N amounts in parts of the soil profile with the lower rate, three application treatment, with nearly constant values at the depth near the tile drain.
Figures 7 and 8 show the cumulative amounts of NO3-N in the soil profile for the three treatments for all years. Cumulative soil NO3-N amounts (profile totals of all five depths in kg/ha) were used to evaluate the effect of tillage and N management practice on soil NO3-N. Figure 7 compares the tillage treatments at the single N application rate of 175 kg/ha. Except for the first year, 1984, no-till
resulted in, on the average, less residual NO3-N in the profile than conventional tillage. In years where fewer soil samples could be collected, 1984, 1989, and 1990, the least significant difference values were considerably higher than for years 1985, 1986, 1987, and 1988 where at least five sets of soil samples were collected. The NO3-N trend was markedly influenced by climatic conditions for all the tillage treatments. In wet years (1986 or 1987) lower amounts of NO3-N were observed in the soil profile under all the three treatments indicating increased leaching to groundwater and/or denitrification. Also, higher corn yields of 1986 and 1987 suggest increased N uptake by the plants leaving less NO3-N in the soil profile.
Figure 9 shows the quadratic regression models giving NO3-N levels in the soil profile as a function of depth for the three N management/tillage treatments. Regression equations and their R^ values are also shown. The observed cumulative NO3-N amounts in conventional tillage single, no-till single and no-till three were 116.4, 79.6, and 65.9 kg/ha, respectively. These results indicate that conventional tillage single and no-till single treatments have more NO3-N than no-till three treatment, throughout the profile which accounts for low risk of potential groundwater contamination. The results are in accordance with the reported findings of Kanwar et al. (1988).
Figure 10 shows average com yields as a function of tillage and N-fertilizer application rate (single application
1986 1987 Year
Figure 7-Annual average cumulative NO3-N amounts in the soil profile as a function of tillage and year (means with the same letter represent no significant difference; n = no. of samplings / yr; CTS = conv. tillage single; NTS = no-till single).
o
CTS
\"
~ NTS \ ^
• Conv Tillage (CTS) Y • n .«n • O.IMII + o.oo4ix'
0 NSSrrsingle (NTS) Y • 43.(1] - 0.fr7ii • 0.0033/
Figure 9-Regression models predicting the average NO3-N levels in the soil profile as a function of depth, tillage, and method of N application.
788 TRANSACTIONS OF THE A S A E
12
11
10
9
^ 8
I? O 5
S ' 3
2
1
0
iHM NTS E m NTT
i
I 1984 1985 1986 1987 1988 1989 1990 1991
Year
Figure 10-Comparison of corn yield under the two tillage treatments.
of 175 kg/ha and three applications totaling 125 kg/ha). Statistically, no significant differences were found either between tillage or between N management practices. This figure also shows that higher com yields were obtained in wet years of 1986, 1987, 1990, and 1991. Yields peaked near 11.2 M g / h a in 1986 , 9.5 M g / h a in 1987 and 9.7 Mg/ha in 1990. However, yields were considerably reduced in 1988 due to extremely dry conditions resulting in higher amounts of NO3-N remaining in the soil profile. The yield for three applications, however, was equal to that obtained from the single application.
SUMMARY AND CONCLUSIONS A field study was conducted to determine the effects of
tillage and N management practices on the residual NO3-N in the soil profile. This study supports the following conclusions:
No-till with three split N applications totaling 125 kg /ha resulted in lower amounts of residual NO3-N in the soil profile in comparison to a single N application of 175 kg/ha. Com yields obtained from three split applications were not significantly different from the single higher N application rate under either tillage system. This result indicates that farmers can somet imes apply less N fertil izer without reducing com yields with possible benefits of reducing the potential for NO3-N leaching to groundwater.
Under conventional tillage system, more residual N accumulated in the top 60 cm of the soil profile than under no-till system. This possibly was due to higher rates of mineralization and less leaching to the groundwater.
REFERENCES Baker, J. L. and H. P. Johnson. 1981. Nitrate-nitrogen in tile
drainage as affected by fertilization. J. Environ. Qual. 10519-522.
Baker, J. L., T. S. Colvin, S. J. Marley and M. Dawelbeit. 1989. A point-injector applicator to improve fertilizer management. Applied Engineering in Agriculture 5(3):334-338.
Cast, R. G., W. W. Nelson and G. W. Randall. 1978. Nitrate accumulation in soils and loss in tile drainage following nitrogen applications to continuous com. J. Environ. Qual. 7:258-261.
Herron, G. M., A. F. Dreier, A. D. Flowerday, W. L. Colville and R. A. Olson. 1971. Residual mineral nitrogen accumulation in soil and its utilization by irrigated com. Agron. J. 63:322-327.
James, D. W. 1978. Diagnostic soil testing for nitrogen availability: The effect of nitrogen fertilizer rate, time, method of application and cropping pattem on residual soil nitrogen. Bull. 497. Logan, UT: Utah Agric. Exp. Stn.
Johnston, A. M. and D. B. Fowler. 1991. No-till winter wheat dry matter and tissue nitrogen response to N fertilizer form and placement. Agron. J. 83:1035-1043.
Jokela, W. E. and G. W. Randall. 1989. Com yield and residual soil nitrate as affected by time and rate of nitrogen application. Agron.J.%\\120-126.
Jokela, W. E. 1992. Nitrogen fertilizer and dairy manure effects on com yield and soil nitrate. Soil Sci. Soc. Am. J. 56:148-154.
Jolley, V. D. and W. H. Pierre. 1977. Profile accumulation of fertilizer-derived nitrate and total nitrogen recovery in two long-term nitrogen rate experiments with com. Soil Sci. Soc. Am^r. 7.41:373-378.
Kanwar, R. S., J. L. Baker and J. M. Laflen. 1985. Nitrate movement through the soil profile in relationship to tillage system and fertilizer application method. Transactions of the A5A£ 28(6): 1802-1807.
Kanwar, R. S., J. L. Baker and D. G. Baker. 1988. Tillage and split N-fertilizer effects on subsurface drainage water quality and crop yields. Transactions of the A5AE 31(2): 453-460.
Kanwar, R. S. and J. L. Baker. 1991. Long-term effects of tillage and reduced chemical application on the quality of subsurface drainage and shallow groundwater. In Proc. of the Conference on Environmentally Sound Agriculture, 103-110.
Keeney, D. R. and D. W. Nelson. 1982. Nitrogen-inorganic forms. In Methods of Soil Analysis, Part 2, ed. A. L. Page, 643-698. Madison, WI: ASA.
Kitur, B. K., M. S. Smith, R. L. Blevins and W. W. Frye. 1984. Fate of deplete ammonium nitrate applied to no-tillage and conventional tillage com. Agron. J. 76:240-242.
Nelson, W. W. and J. M. MacGregor. 1973. Twelve years of continuous com fertilization with ammonium nitrate or urea nitrogen. Soil Sci. Soc. Am. Proc. 37:583-586.
Nyborg, M. and S. S. Malhi. 1989. Effect of zero and conventional tillage on barley yield and nitrate nitrogen content, moisture and temperature of soil in north-central Alberta. Soil and Tillage Research 15(1-9).
Olsen, R. J., R. F. Hensler, O. J. Attoe, S. A. Witzwl and L. A. Peterson. 1970. Fertilizer nitrogen and crop rotation in relation to movement of nitrate nitrogen through soil profile. Soil Sci. Soc. Am. Proc. 34:448-452.
Russelle, M. P., B. J. Deibert, R. D. Hauck, M. Stevanivic and R. A. Olson. 1981. Effect of water and nitrogen management on yield and N-depleted fertilizer use efficiency of irrigated com. Soil Sci. Soc. Am. J. 45:553-558.
SAS Institute. 1985. 5.45' User's Guide. Statistics version, 5th Ed. Gary, NC: SAS Inst.
Schepers, J. S., K. D. Franks and C. Bourgs. 1986. Effect of yield goal and residual soil nitrogen considerations on fertilizer BMPs for irrigated maize in Nebraska (submitted for publ.) J. Fert. Issues.
Timmons, D. R. and R. M. Cmse. 1990. Effect of fertilization method and tillage on nitrogen recovery by com. Agron. J. 82:777-784.
. 1991. Residual nitrogen-15 recovery by com as influenced by tillage and fertilization methods. Agron. J. 83:357-363.
Tracy, P. W., D. G. Westfall, E. T. Elliot, G. A. Peterson and C. V. Cole. 1990. Carbon, nitrogen, phosphoms and sulphur mineralization in plow and no-till cultivation. Soil Sci. Soc. Am. J. 54:457-461.
Varvel, G. E. and T. A. Peterson. 1990. Residual soil N as affected by continuous two-year, and four-year crop rotation systems. Agron J. S2:95S-962.