ISSN 1330-3651 (Print), ISSN 1848-6339 (Online) https://doi.org/10.17559/TV-20170406121055 Preliminary communication Time-Space Relationship Analysis Model on the Bus Driving Characteristics of Different Drivers Based on the Traffic Performance Index System Li WANG, Jingfeng YANG, Nanfeng ZHANG, Ji YANG, Yong LI, Jiarong HE, Feng YANG, Handong ZHOU Abstract: With the extensive application of the concept of green traffic, the relationship between the driving characteristics of different drivers and energy consumption and traffic performance conditions, etc. is gradually becoming a research hotspot. Based on bus status data recorded by travel data recorders with a vehicle-mounted satellite positioning function and in view of external bus behaviours and driver’s performance, a bus driving characteristic model of drivers is established. A time-space analysis model of the driving characteristics of different drivers based on traffic performance index is also established through fuzzy association rules and a type-2 fuzzy set prediction algorithm. Test results show that the prediction algorithm can accurately describe the time-space relationship between the traffic congestion index and bus driving characteristic model and achieve relatively high prediction accuracy. The problem of the lagging release of traffic performance index caused by massive calculation for floating vehicle data can be effectively solved through this algorithm, which can serve as an important reference for analyzing traffic performance conditions, as well as the energy conservation and emission reduction of buses. Keywords: bus driving characteristics of different drivers; fuzzy association rules; time-space analysis; traffic performance index; type-2 fuzzy set 1 INTRODUCTION The driving characteristics of different bus drivers directly influence the safe and stable performance of buses. In addition, different driving behaviours also directly influence fuel consumption (gas and power consumption) value, which influences the bus company’s economic benefit to some extent. Hence, various mathematical models on these behaviours have been proposed by scholars both domestically and abroad. When divided generally, the quantitative model for behaviour description of domestic and foreign drivers can be divided into three types: aided driving, driving safety, and energy consumption monitoring. In the aspect of the research on aided driving, He et al. [1] established the fuzzy PID driver model according to the characteristics and complementation of two control methods, namely, fuzzy intelligent control and traditional PID control; Liu [2] divided the driver model into a driver model based on people–vehicle–environment closed-loop system vehicle handling stability, driving characteristic model of different drivers based on intelligent traffic system, and driver fatigue model based on traffic safety, as well as analyzed and discussed the shortages of various driver models; Xie et al. [3] studied a driver model based on OCC (Ortony–Clore–Collins) in simplified road conditions, Markov model for the emotional state spontaneous transfer process, and Hidden Markov model, HMM [4], for emotional state stimulation transfer. Also, the group proposed emotional models in two situations of changes to road conditions and no road condition, and studied drivers’ emotional changes in the following: changing-over-lane and overtaking process. In the aspect of automobile driving safety, Song et al. [5] established safe and reliable quantitative screening analysis data model of automobile drivers by the average of a random group testing algorithm, which provides theoretical basis for selecting automobile drivers. With respect to energy consumption research, Huang et al. [6] analyzed the energy consumption differences and influential factors of vehicles when driven by different drivers, and carried out test analyses on the influences of vehicle acceleration, speed, energy feedback, driving condition, and motor overload on the energy consumption of purely power- driven vehicles; Li et al. [7] proposed to make remote recognition and monitoring on bus driving behaviours through intelligent traffic technology, and applied it in bus energy consumption management. At present, however, most driving characteristic models involving different drivers fail to consider the traffic performance index’s influence structure on the driving characteristics of different drivers, as well as the time–space description on the model through geographic information technology. On the basis of traffic performance index based on GIS, in this paper, a time–space relationship analysis method on driving characteristics of different bus drivers is proposed to describe the influence of time–space and traffic performance conditions on the driving model. Fuzzy association rules are based on driver quantitative index, and the traffic performance index prediction is realized through type-2 fuzzy set, thus effectively solving the problem of delayed release of traffic performance index because of massive calculations for floating vehicle data. 2 TRAFFIC PERFORMANCE INDEX AND DRIVING CHARACTERS’ MODEL OF DIFFERENT DRIVERS The driving characteristic model of different drivers was quantized according to bus performance, or the attribute of bus drivers to drive along a fixed route and stop at a fixed station, based on neighbouring bus stations, and division of neighbouring station sections is made for driving behaviours on the bus driver’s route. The specific division method included leaving the station at departure to the first berthing station, wherein the bus driver completes a process from starting to berthing. By describing the driving characteristics of different drivers during the process and by combining traffic performance index conditions between neighbouring stations, the time– space relationship between traffic performance index and bus driving characteristics of different drivers is described. 236 Technical Gazette 25, 1(2018), 236-244
Transcript
ISSN 1330-3651 (Print), ISSN 1848-6339 (Online) https://doi.org/10.17559/TV-20170406121055 Preliminary communication
Time-Space Relationship Analysis Model on the Bus Driving Characteristics of Different Drivers Based on the Traffic Performance Index System
Li WANG, Jingfeng YANG, Nanfeng ZHANG, Ji YANG, Yong LI, Jiarong HE, Feng YANG, Handong ZHOU
Abstract: With the extensive application of the concept of green traffic, the relationship between the driving characteristics of different drivers and energy consumption and traffic performance conditions, etc. is gradually becoming a research hotspot. Based on bus status data recorded by travel data recorders with a vehicle-mounted satellite positioning function and in view of external bus behaviours and driver’s performance, a bus driving characteristic model of drivers is established. A time-space analysis model of the driving characteristics of different drivers based on traffic performance index is also established through fuzzy association rules and a type-2 fuzzy set prediction algorithm. Test results show that the prediction algorithm can accurately describe the time-space relationship between the traffic congestion index and bus driving characteristic model and achieve relatively high prediction accuracy. The problem of the lagging release of traffic performance index caused by massive calculation for floating vehicle data can be effectively solved through this algorithm, which can serve as an important reference for analyzing traffic performance conditions, as well as the energy conservation and emission reduction of buses.
Keywords: bus driving characteristics of different drivers; fuzzy association rules; time-space analysis; traffic performance index; type-2 fuzzy set
1 INTRODUCTION
The driving characteristics of different bus drivers directly influence the safe and stable performance of buses. In addition, different driving behaviours also directly influence fuel consumption (gas and power consumption) value, which influences the bus company’s economic benefit to some extent. Hence, various mathematical models on these behaviours have been proposed by scholars both domestically and abroad. When divided generally, the quantitative model for behaviour description of domestic and foreign drivers can be divided into three types: aided driving, driving safety, and energy consumption monitoring. In the aspect of the research on aided driving, He et al. [1] established the fuzzy PID driver model according to the characteristics and complementation of two control methods, namely, fuzzy intelligent control and traditional PID control; Liu [2] divided the driver model into a driver model based on people–vehicle–environment closed-loop system vehicle handling stability, driving characteristic model of different drivers based on intelligent traffic system, and driver fatigue model based on traffic safety, as well as analyzed and discussed the shortages of various driver models; Xie et al. [3] studied a driver model based on OCC (Ortony–Clore–Collins) in simplified road conditions, Markov model for the emotional state spontaneous transfer process, and Hidden Markov model, HMM [4], for emotional state stimulation transfer. Also, the group proposed emotional models in two situations of changes to road conditions and no road condition, and studied drivers’ emotional changes in the following: changing-over-lane and overtaking process. In the aspect of automobile driving safety, Song et al. [5] established safe and reliable quantitative screening analysis data model of automobile drivers by the average of a random group testing algorithm, which provides theoretical basis for selecting automobile drivers. With respect to energy consumption research, Huang et al. [6] analyzed the energy consumption differences and influential factors of vehicles when driven by different drivers, and carried out test analyses on the influences of vehicle acceleration,
speed, energy feedback, driving condition, and motor overload on the energy consumption of purely power-driven vehicles; Li et al. [7] proposed to make remote recognition and monitoring on bus driving behaviours through intelligent traffic technology, and applied it in bus energy consumption management. At present, however, most driving characteristic models involving different drivers fail to consider the traffic performance index’s influence structure on the driving characteristics of different drivers, as well as the time–space description on the model through geographic information technology. On the basis of traffic performance index based on GIS, in this paper, a time–space relationship analysis method on driving characteristics of different bus drivers is proposed to describe the influence of time–space and traffic performance conditions on the driving model. Fuzzy association rules are based on driver quantitative index, and the traffic performance index prediction is realized through type-2 fuzzy set, thus effectively solving the problem of delayed release of traffic performance index because of massive calculations for floating vehicle data.
2 TRAFFIC PERFORMANCE INDEX AND DRIVING CHARACTERS’ MODEL OF DIFFERENT DRIVERS
The driving characteristic model of different drivers was quantized according to bus performance, or the attribute of bus drivers to drive along a fixed route and stop at a fixed station, based on neighbouring bus stations, and division of neighbouring station sections is made for driving behaviours on the bus driver’s route. The specific division method included leaving the station at departure to the first berthing station, wherein the bus driver completes a process from starting to berthing. By describing the driving characteristics of different drivers during the process and by combining traffic performance index conditions between neighbouring stations, the time–space relationship between traffic performance index and bus driving characteristics of different drivers is described.
236 Technical Gazette 25, 1(2018), 236-244
Li WANG et al.: Time-Space Relationship Analysis Model on the Bus Driving Characteristics of Different Drivers Based on the Traffic Performance Index System
Tehnički vjesnik 25, 1(2018), 236-244 237
2.1 Traffic Performance Index System
Real-time traffic performance index that relies on the intelligent traffic information acquisition, processing, and analysis, as well as considers traditional parameters, such as flow, density, occupancy, and speed as basis, has gradually become a hotspot both locally and overseas [8]. Beijing [9], Guangzhou [10], and others, have respectively issued local technology standards for traffic performance indices. Combining characteristics of traffic performance index at different locations and on the basis of road traffic performance index grade classification of Guangzhou traffic performance index [10], the congestion range proportions of different section grades are taken into the scope of index calculation. According to the bus performance rules and taking the sections between neighbouring stations as the index calculation object, the key index for neighbouring section traffic performance of the bus station is proposed as:
(1) Section weight coefficient: ( , 1)
( , 1)
( , 1)1
i i
i i
i i
S
S N
Si
VKT
VKTρ +
+
+=
=
∑,
where ( , 1)i iSρ +
is the weight coefficient to calculate section
( , 1)i iS + between two neighbouring stations within the
statistic interval; ( , 1)i iSVKT
+is the VKT value to calculate
section ( , 1)i iS + between two neighbouring stations within
the statistic interval; and N is the number of sections of road network between neighbouring stations.
(2) Average travel speed: ( , 1) ( , 1)
( , 1)
( , 1)1
i i i i
i i
i i
S SS N
Si
L qV
T
+ +
+
+=
×=
∑ , where
( , 1)i iSV+
is the average travel speed for section ( , 1)i iS +
between two neighbouring stations;( , 1)i iSL
+is the length of
section ( , 1)i iS + between two neighbouring stations;( , 1)i iSq
+
is the traffic volume passing section ( , 1)i iS + between two
neighbouring stations; and( , 1)i iST
+ is the travel time for
vehicle to pass section ( , 1)i iS + between two neighbouring stations;
(3) Road traffic performance index [10]:
2
1
1
N
ijj
i m
ikk
L
Lj =
=
=∑
∑,
where ij is the Grade i road heavy congestion range
proportion; ijL is the section length of Grade i road at a
heavy congestion grade; 2N is the number of heavy
congestion sections of the Grade i road; ikL is the length of various sections in the Grade i road; and m is thenumber of sections of the Grade i road.
(4) Road network stability index: 2
( , 1)1
1 ( )T
i ii
V vTP
v
+=
−=
∑, where P is the time varying
coefficient for the peak period of section; T is the number of statistic time intervals; ( , 1)i iV + is the average velocity within i time interval at the peak period of the section during workdays or non-workdays; and v is the average velocity of the peak period for all workdays and non-workdays in the last month.
(5) Other indices, such as weighted average velocity, congestion range proportion, congestion time of duration, number of section often congested, etc.
Notably, the index calculation method for neighbouring sections of a single station and the overall traffic performance index of all stations are the same.
2.2 Driving Characters’ Model of Different Drivers
Bus driving characteristics of different drivers for a fixed route generally cannot be described through quantitative methods. In view of the characteristics in the bus industry, bus status modelling is proposed in the present paper, which reflects the driving characteristics of different drivers by establishing a bus performance status model. In view of kinematics, buses can generally be divided into four statuses, namely, acceleration, deceleration, constant, and parking. The four statuses have different respective definitions for buses with different power sources.
For buses with traditional power sources (gasoline, diesel, LPG, LNG, etc.), the acceleration, deceleration, constant, and parking status with power, as well as power-free sliding and braking, are defined as follows:
the acceleration mode is the continuous driving process with vehicle acceleration a > 0.15m/s2; deceleration is the continuous driving process with acceleration a < −0.15 m/s2; constant is the driving process with instant acceleration |a| < −0.15 m/s2; parking mode is defined as the driving status with an actual travel speed of 0 km/h; sliding refers to the driving status in which the vehicle acceleration pedal is completely loosened, the brake pedal is not stepped on, and travel speed is not 0 km/h; finally, braking is the status wherein the driver steps down the brake pedal and the travel speed is not 0 km/h.
However, for new-energy buses (purely power-driven, journey increasing type, hybrid), the acceleration, deceleration, constant, and parking status with power, as well as sliding and braking, are defined as follows:
the acceleration mode is the continuous driving process with vehicle acceleration a > 0.15 m/s2; deceleration is the continuous driving process with acceleration a < −0.15 m/s2; constant is the driving process with instant acceleration |a| < −0.15 m/s2; parking mode is defined as the driving status wherein the battery pack is powered on, the driving motor system supplies power, and the actual travel speed is 0 km/h; sliding refers to the driving status wherein the vehicle acceleration pedal is completely loosened, the brake pedal is not stepped on, the vehicle is at energy feedback status,
Li WANG et al.: Time-Space Relationship Analysis Model on the Bus Driving Characteristics of Different Drivers Based on the Traffic Performance Index System
238 Technical Gazette 25, 1(2018), 236-244
and travel speed is not 0 km/h; braking is the status wherein the driver steps on the brake pedal and the travel speed is not 0 km/h, and little energy is fed back in this status.
Notably, for new-energy buses, the inappropriate energy consumption factors in purely power-driven bus driving characteristics of different drivers mainly reflect that the energy consumption for different drivers in equivalent conditions can vary from each other by 58 %, [6.7] because of vehicle starting and parking, acceleration and deceleration, travel speed, way of energy feedback, driving condition, motor overload, and other factors. In the process of actual driving, the speed per hour of purely power-driven bus is seldom higher than 60 km/h, and its average speed per hour is invariably at 20–30 km/h. Although the speed interval executes weak magnetic control on the motor, the overall efficiency of the motor system is maintained at a relatively high level, and the efficiency value is at a stable state with a high value. The influence of the relatively stable travel speed is considered in the key influential factors on the description of the driving characteristics of different drivers. In fact, the factors influencing the drivers’ travel speed mainly include the following: driving condition, arriving at the station, leaving station behaviours, and others. Thus, speed is considered as an influential factor on the route conditions in the present paper. The case of motor overload is also similar, and the performance process of purely power-driven buses seldom occurs. According to the test results in numerous aspects, a good energy feedback can be realized when driving at a relatively low speed and by adopting sliding; thus, the longer the bus slides, the more preferential prolonging the vehicle driving range is. Besides vehicle speed, motor overload, and energy feedback, the starting and parking of the vehicle, acceleration and deceleration, and driving conditions are key factors in describing the driver’s driving habits. To sum up, the quantized indices describing the driving characteristics of different drivers mainly include acceleration times, deceleration times, acceleration range, deceleration range, braking range, stable range, acceleration time proportion, deceleration time proportion, proportion of constant time, proportion of sliding time, proportion of braking time, energy feedback proportion, average acceleration, and average deceleration, among others.
2.3 Time–Space Analysis Algorithm on Bus Driving Characteristic Model of Different Drivers Based on Traffic Performance Index
Using the proportion of acceleration and deceleration time, proportion of constant time, proportion of sliding time, proportion of braking time, average acceleration, average deceleration, acceleration and deceleration range proportion, constant range proportion, sliding range proportion, braking range proportion, average acceleration range, average deceleration range as bus driving characters of different drivers description at neighbouring sections of the station (in case of new energy buses, energy feedback proportion, and energy feedback range shall be added on the basis as contents of driving characteristic description of different drivers), by
combining traffic performance index at neighbouring sections of station, the correlation between traffic performance index of the station and bus driving characters of different drivers is described through fuzzy association rules, which is described as follows [11, 12]:
Assume the attribute set 1 2{ , , , }mI i i i= and
database 1 2{ , , , }nD d d d= , the calculation expressions for the minimum support and the minimum confidence of fuzzy association rules are, respectively [11, 12]:
( ( ) ( ) )( )
A B A Bd D
d dSupport A B
D
µ µ ε∧ ∧∈
≥⇒ =
∑ (1)
( ( ) ( ) )( )
( ( ) ( ) )
A B A Bd D
A Ad D
d dConfidence A B
d d
µ µ ε
µ µ ε
∧ ∧∈
∈
≥⇒ =
≥
∑∑ (2)
where ε is the specified threshold value; D general collection of transaction database;|D| is total number of transaction; ( )A dµ is sample d’s fuzzy membership
number on fuzzy set A ; ( )A B dµ ∧ refers to sample d’s
fuzzy membership number on fuzzy set A B∧ ; ( ( ) ( ) )A B A B
d Dd dµ µ ε∧ ∧
∈
≥∑ is the sum that ( )A B dµ ∧ islarger than the specified threshold value ε in item set A B∧ ; and ( ( ) ( ) )A A
d Dd dµ µ ε
∈
≥∑ is the sum
that ( )A dµ is larger than the specified threshold value ε in item set A.
2.4 Type-2 Fuzzy Set Traffic Performance Index Prediction Algorithm
Fuzzy time series can accurately predict an element’s membership degree on the concrete fuzzy set, making it applicable for the prediction of traffic performance index and the calculation of weight. Multi-uncertainty exists in elements, such as passenger flow, road network performance index, driver on duty and his driving habit, etc. In addition, the shape of membership degree function itself or uncertainty of parameter, and the concrete impact elements’ uncertainty on the membership degree of the overall energy consumption fuzzy set constitute direct impacts on the fuzzy time series prediction result of multi-impact elements. To further strengthen fuzzy time series and strengthen the capacity of description and processing uncertainty, type-2 fuzzy set method applicable to the existence of multi-uncertainty is adopted in this paper traffic performance index time series model, which expands the traditional fuzzy set, and provides fuzzy degree of membership degree value in energy consumption impact element set. Therefore, the membership degree of its set elements becomes a fuzzy number for the [0,1] interval through the three-dimensional membership degree function.
In the domain of discourse { }1 2, , , , 5nU u u u n= = , the membership degree function for its type-2 fuzzy set
iA~ can be represented as JiA~ Uf ]1 ,0[: → , for any
Li WANG et al.: Time-Space Relationship Analysis Model on the Bus Driving Characteristics of Different Drivers Based on the Traffic Performance Index System
Tehnički vjesnik 25, 1(2018), 236-244 239
t U∈ in iA~ , it is type-1 fuzzy set in [0,1]; that is,
{ } ].1 ,0[0)( ,)(
)( ⊆>== ∫∈
uf|uJuuftf tt
tJu
tiA~ For the
domain of definition Jt of the main membership function )(tf
iA~ of type-2 fuzzy set, t U∀ ∈ , it is the main
membership degree of t. For a certain specific t U∈ , tu J∀ ∈ , its corresponding membership function
value is defined as type-2 fuzzy set iA~ ‘s secondary membership in t; similarly, ft is a specific secondary membership function in t.
Suppose traffic performance index system is the required predicted value, three predicted values are generated from the type-2 fuzzy set, which corresponds to three membership degrees accordingly. According to the size of data, from large to small, the three predicted values that are respectively defined as optimistic value, probable value, and pessimistic value of energy consumption, are respectively recorded as ( )pN t , ( )hN t , and ( )lN t , and the corresponding fuzzy logical relationship is respectively { }1 2
( ) , , ,pp p p p pN t Set N N N→ = ,
{ }1 2( ) , , ,
hh h h h hN t Set N N N→ = , and { }1 2( ) , , ,
ll l l l lN t Set N N N→ = .
After the type-2 fuzzy set establishes a fuzzy logical relationship matrix and undergoes fuzzy rule reasoning, an exact predicted value calculation is realized through deblurring. When the fuzzy logical relationship matrix is not established for deblurring, a union set and intersection of different layers are obtained by directly unifying ( m∨ )
and intersecting ( m∧ ) number of union set. The intersection is calculated as the prediction basis [13]:
∈
=
=+∈
∨
∈
∨ ∑
},,{
},,{
when ,
when ,
)1(lphS slp
m
i i
lphS sp
m SetNK
m
Setm
tFval
φ
(3)
∈
=
=+∈
∧
∈
∧ ∑
},,{
},,{
when ,
when ,
)1(lphS slp
m
i i
lphS sp
m SetNK
m
Setm
tFval
φ
(4)
where mp is the number of elements in the union set. The intersection of central values
m
pK∨ and m
pK∧ of the
corresponding fuzzy set interval ( )pN t is pSet , hSet ,
and ( )lN t , respectively. The comprehensive form of the overall prediction formula is represented on this basis [13]:
( 1) ( 1)
( 1)2
m mm
Fval t Fval tFval t ∨ ∧+ + +
+ =
(5)
According to engineering technology prediction
experience, the following formula is proposed for the application layer to calculate TPI predicted value at neighbouring sections of the bus station:
( 1) 4 ( 1) ( 1)( 1)6
l m hFval t Fval t Fval tFval t + + × + + ++ =
(6)
where Fvall(t+1) is the minimum value of TPI at neighbouring sections of the station. Fvalh(t+1) is the maximum value of TPI at neighbouring sections of the station.
3 TESTS AND RESULTS 3.1 Test Data Description
A bus driving character model of different drivers is
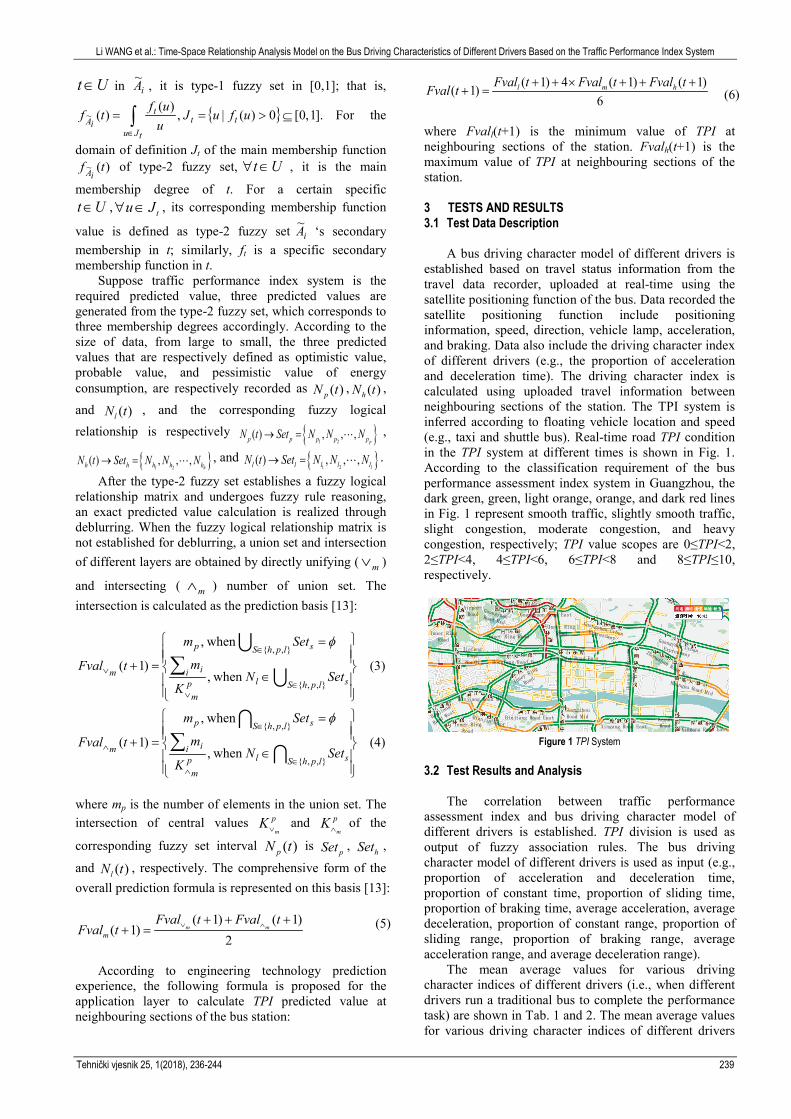
established based on travel status information from the travel data recorder, uploaded at real-time using the satellite positioning function of the bus. Data recorded the satellite positioning function include positioning information, speed, direction, vehicle lamp, acceleration, and braking. Data also include the driving character index of different drivers (e.g., the proportion of acceleration and deceleration time). The driving character index is calculated using uploaded travel information between neighbouring sections of the station. The TPI system is inferred according to floating vehicle location and speed (e.g., taxi and shuttle bus). Real-time road TPI condition in the TPI system at different times is shown in Fig. 1. According to the classification requirement of the bus performance assessment index system in Guangzhou, the dark green, green, light orange, orange, and dark red lines in Fig. 1 represent smooth traffic, slightly smooth traffic, slight congestion, moderate congestion, and heavy congestion, respectively; TPI value scopes are 0≤TPI<2, 2≤TPI<4, 4≤TPI<6, 6≤TPI<8 and 8≤TPI≤10, respectively.
assessment index and bus driving character model of different drivers is established. TPI division is used as output of fuzzy association rules. The bus driving character model of different drivers is used as input (e.g., proportion of acceleration and deceleration time, proportion of constant time, proportion of sliding time, proportion of braking time, average acceleration, average deceleration, proportion of constant range, proportion of sliding range, proportion of braking range, average acceleration range, and average deceleration range).
The mean average values for various driving character indices of different drivers (i.e., when different drivers run a traditional bus to complete the performance task) are shown in Tab. 1 and 2. The mean average values for various driving character indices of different drivers
Li WANG et al.: Time-Space Relationship Analysis Model on the Bus Driving Characteristics of Different Drivers Based on the Traffic Performance Index System
240 Technical Gazette 25, 1(2018), 236-244
(i.e., when different drivers run a hybrid bus to complete the performance task) are shown in Tab. 3 and 4. The two buses travel along the same bus route and the statistic data
source is only calculated from the situation of the same driver; no screening according to time and section was initiated.
Table 1 Driving characters of different drivers in a traditional bus
The proportion of acceleration and deceleration time,
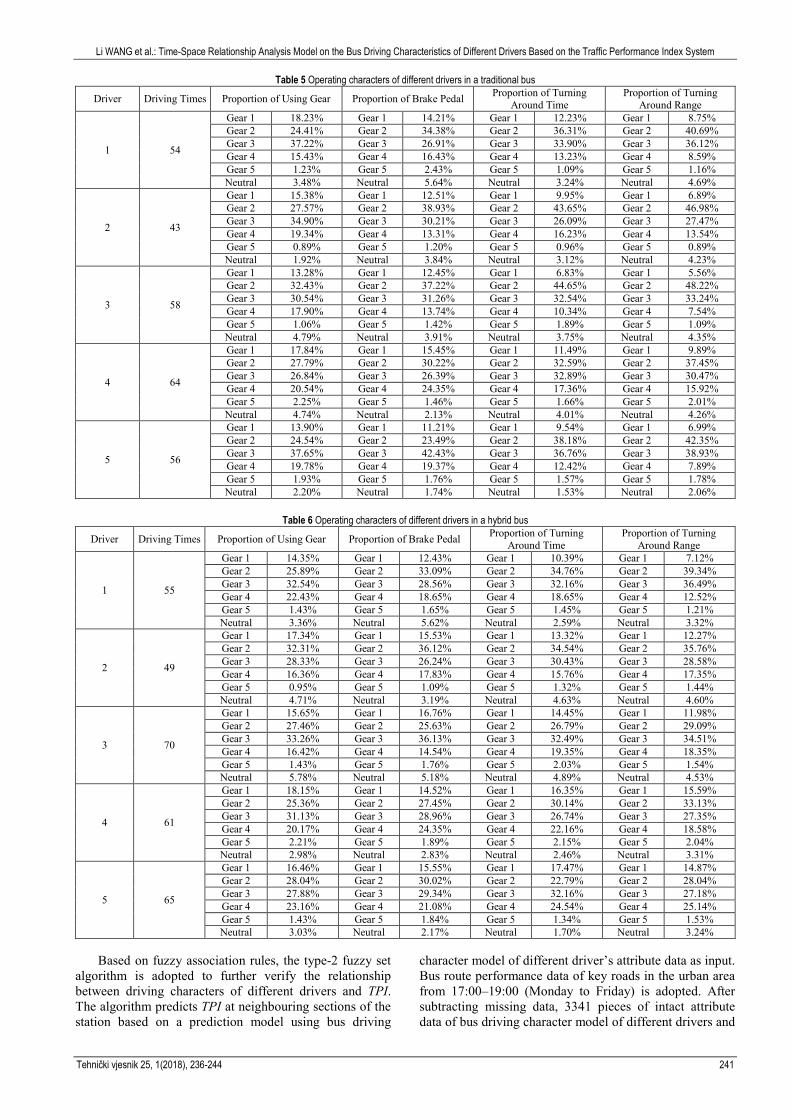
proportion of constant time, proportion of sliding time, proportion of braking time, and average acceleration, are important indices describing external vehicle performance. The proportion of brake pedal (i.e., proportion of brake pedal usage times at different gears in total braking times), proportion of gear use (i.e., proportion of usage time of every gear in total gear usage time), proportion of using time of gear, proportion of turning around time (i.e., proportion of corresponding gear in overall turning around times when turning left or right), proportion of turning around range (i.e., proportion of corresponding gear ranges calculated in the whole process of turning left or right to complete gear recovery in the sum of overall turning around range; in the case of multi-gears, accumulative ranges are calculated as per the average range of every gear) are important indices representing driver performance. In view of actual performance, these driving character indices are related to the macro situation of traffic performance and specific lathe situations. Statistical data of the partial performance information for drivers running a traditional bus and a hybrid bus are shown in
Tab. 5 and 6, respectively. Driver performance index (e.g., proportion of using brake pedal, proportion of turning around time, and proportion of turning around range) need to be calculated separately according to gear situation.
Statistical data of intact behaviours model attributes of drivers under different traffic performance indices (i.e., when the same driver runs a traditional bus in the same driving section, lane 483, from 07:00–09:00 on a Monday) are shown in Tab. 7.
A time–space analysis model based on fuzzy association rules is established using the bus driving character model of different drivers as input and TPI as output, as well as combining traffic GOS. With one week as the unit, data of the same driver at the same time every week (i.e., driving behaviours data of the same bus driver from 07:00–09:00 during Mondays) is chosen for model verification and result analysis. The key function of fuzzy association rules is to realize the relationship between the performance method of driving characters of different drivers and TPI. The relationship is realized through changes in driving characters of different drivers at different TPIs.
Li WANG et al.: Time-Space Relationship Analysis Model on the Bus Driving Characteristics of Different Drivers Based on the Traffic Performance Index System
Tehnički vjesnik 25, 1(2018), 236-244 241
Table 5 Operating characters of different drivers in a traditional bus Driver Driving Times Proportion of Using Gear Proportion of Brake Pedal Proportion of Turning
Based on fuzzy association rules, the type-2 fuzzy set
algorithm is adopted to further verify the relationship between driving characters of different drivers and TPI. The algorithm predicts TPI at neighbouring sections of the station based on a prediction model using bus driving
character model of different driver’s attribute data as input. Bus route performance data of key roads in the urban area from 17:00–19:00 (Monday to Friday) is adopted. After subtracting missing data, 3341 pieces of intact attribute data of bus driving character model of different drivers and
Li WANG et al.: Time-Space Relationship Analysis Model on the Bus Driving Characteristics of Different Drivers Based on the Traffic Performance Index System
242 Technical Gazette 25, 1(2018), 236-244
corresponding TPI data were obtained, including 1756 pieces of traditional bus driver data and 1585 pieces of hybrid bus driver data. For the traditional bus, 89 pieces had smooth status (0≤TPI<2), 312 pieces had slightly smooth status (2≤TPI<4), 612 pieces had slight congestion status (4≤TPI<6), 437 pieces had moderate congestion status (6≤TPI<8), and 306 pieces had heavy congestion status (8≤TPI≤10). For the hybrid bus, 106 pieces had
smooth status (0≤TPI<2), 294 pieces had slightly smooth status (2≤TPI<4), 478 pieces had slight congestion status (4≤TPI<6), 467 pieces had moderate congestion status (6≤TPI<8), and 240 pieces had heavy congestion status (8≤TPI≤10). Bus driving character model prediction of different drivers based on TPI and actual data results is shown in Tab. 8.
Table 7 TPI and parts of driving characters of different drivers in a traditional bus
Traffic Performance Index
Proportion of Acceleration and Deceleration Time Proportion of Constant Time Proportion of Acceleration and
Smooth 64 46 4 0 0 71.91 Smooth Almost 18 219 76 37 0 70.19 Slight Congestion 7 42 469 68 18 76.63 Moderate Congestion 0 5 60 329 34 75.29 Heavy Congestion 0 0 3 4 254 83.01 SUM of Accurate Rates 1335 76.03
Hybrid Buses
Smooth 80 32 2 0 0 75.47 Smooth Almost 17 231 56 16 0 78.57 Slight Congestion 9 29 369 46 19 77.20 Moderate Congestion 0 2 48 356 45 76.23 Heavy Congestion 0 0 3 49 176 73.33 SUM of Accurate Rates 1212 76.47
Based on the results in Tab. 8, only 74 pieces of
"skipping a grade" exist in the confusion matrix of the traditional bus driver driving character model, accounting for 4.21 % of the sum total; only 41 pieces exist for the hybrid bus driver driving character model, accounting for 2.59 % of the sample total. The misjudgement is at an extremely low level. The misjudgement number below the confusion matrix diagonal is less than that above the diagonal in the traditional bus driver driving character model, showing that the algorithm easily misjudges low congestion as the TPI of a high congestion. The misjudgement number below the confusion matrix diagonal is less than that above the diagonal in the hybrid
bus driver driving character model, showing the same circumstance as the traditional bus driver. The test shows that the method used in the paper accurately describes the time–space relationship between traffic congestion index and bus driver driving character model, which serves as an important reference to analyze traffic performance situations, as well as bus energy conservation and emission reduction.
The true TPI value for Wednesday at 08:35, predicted value of traditional bus driver driving character model through the time–space analysis model, and predicted value of hybrid bus driver driving character model through the time–space analysis model in the testing data
Li WANG et al.: Time-Space Relationship Analysis Model on the Bus Driving Characteristics of Different Drivers Based on the Traffic Performance Index System
Tehnički vjesnik 25, 1(2018), 236-244 243
are shown in Fig. 2. Viewing the geographic distribution in the trunk road part of urban traffic, we observe that misjudgement data is concentrated in the nearby sections along the intersections of Zhongshan Road and Huangpu Dadao. These sections are subject to great traffic signal influence. Viewing the numerical value, misjudgement data is mostly concentrated beside the TPI grade classification cut-off point. Therefore, dealing with sharp resolution issues is a difficult problem needing further research and solutions in the algorithm.
Beltway
Guangyuan Road MidAirport Road
Inner Ring Road
Jiefang Road North
Inner Ring Road
Guangyuan Urban Expressway
Huangshi Road East
Inner Ring Road
Huan
an E
xpre
sswa
y
Binjiang Road Mid
Inner Ring Road
Dongfeng Road East
(a) True Values
Beltway
Guangyuan Road Mid
Airport Road
Inner Ring Road
Jiefang Road North
Inner Ring Road
Guangyuan Urban Expressway
Huangshi Road East
Inner Ring Road
Huan
an E
xpre
sswa
y
Binjiang Road Mid
Inner Ring Road
Dongfeng Road East
Guangyua
n Road E
ast
(b) Predicted Values for Traditional Buses
Beltway
Guangyuan Road Mid
Airport Road
Inner Ring Road
Jiefang Road North
Inner Ring Road
Guangyuan Urban Expressway
Huangshi Road East
Inner Ring Road
Huanan Expressway
Binjiang Road Mid
Inner Ring Road
Dongfeng Road East
Guangyua
n Road E
ast
(c) Predicted Values for Hybrid Buses Figure 2 True and predicted values of TPI
4 CONCLUSION
Based on the existing TPI system, a proposed TPI
system was first established to determine the relationship between driving characters of different drivers and TPI. Driving character models of different drivers were established to quantify the driving characters of different drivers; external bus performance and driver performance data were used based on bus status data recorded from the travel data recorder with a satellite positioning function. A time–space analysis model on the driving characters of different drivers based on TPI was then established through fuzzy association rules and the type-2 fuzzy set TPI prediction algorithms. Bus performance status data of Guangzhou was used for testing. Our main conclusions include:
(1) TPI is obtained through a large amount of floating vehicle data. Both data volume and calculation amount are large. Consequently, release cycle is generally long and issued data is lagging. Real-time traffic performance situations are reflected to a certain extent through quantified driver character information (i.e., combining bus character model and driver performance data). TPI release speed can be improved.
(2) The prediction algorithm accurately describes the time–space relationship between the traffic congestion index and driving character model of different drivers. We used bus route performance data on key roads in the urban area from 17:00 until 19:00 (Monday to Friday) for prediction. The TPI accuracy rate of performance status data for a traditional bus reaches 76.03%, whereas a hybrid bus reaches as high as 76.47%. The prediction algorithm has a relatively high accuracy. Therefore, the prediction algorithm serves as an important reference to analyze traffic performance situation, as well as bus energy conservation and emission reduction.
(3) Difference between the prediction accuracy of the two bus types is small based on the collected performance status data for traditional buses and hybrid buses. Relevant analysis on TPI can be realized, implying that bus type has low influence on the algorithm. Therefore, policies regarding new energy vehicles currently promoted on a large scale do not need to make large adjustments to the algorithm. Consequently, high algorithm stability is ensured.
Acknowledgements
The research is supported by Science and Technology
Planning Project of Guangdong Province, China (2012B091100345, 2013B010102018, 2013B090600152, 2014B010112008, 2015B010106001, 2015B010129003, 2016B010109007), Pearl River S&T Nova Program of Guangzhou (201610010034), Science and Technology Program of Guangzhou, China (2014Y2-00044) and the Science Program of General Administration of Quality Supervision, Inspection and Quarantine the People’s Republic of China (2014IK183). 5 REFERENCES [1] He, Y. S., Li, X. Q. & Xu, Z. M. (2008). Handling stability
assessment of vehicle control system based on driver model. Journal of Chongqing University, 31(10), 1098-1103.
[2] Liu, J. X. (2010). Research status and development trend of vehicle driver model. Auto mobile Science & Technology, 7(5), 18-23.
[3] Xie, L., Wang, Z. L., Ren, D. C., et al. (2010). Research on driver emotion model in the mode of simplified road condition. Acta Automatica Sinica, 36(12), 1732-1744. https://doi.org/10.3724/SP.J.1004.2010.01732
[4] Nomura, T., Kanda, T., Suzuki, T. & Kato, K. (2008). Prediction of human behavior in human-robot interaction using psychological scales for anxiety and negative attitudes toward robots. IEEE Transactions on Robotics, 24(2), 442-451. https://doi.org/10.1109/TRO.2007.914004
[5] Song, D. M., Zhao, C. & Zhao, Y. B. (2011). Mathematical model analysis on driver reliability screening. Mathematical Practice and Analysis, 41(13), 241-244.
Li WANG et al.: Time-Space Relationship Analysis Model on the Bus Driving Characteristics of Different Drivers Based on the Traffic Performance Index System
244 Technical Gazette 25, 1(2018), 236-244
[6] Huang, W. Y., Cheng, Y., Ji, S. B., et al. (2013). Influences of driving quality of driver on energy consumption of purely power-driven vehicle. Journal of Beijing Institute of Technology, 33(2), 144-150.
[7] Li, Y., Tan, H. Y. & Liu, D. (2013). Research on driving behavior and public traffic energy consumption management strategy. Journal of Chongqing University (Social Science Edition), 19(4), 67-72.
[8] Zheng, S. J. & Yang, J. F. (2014). Research on the calculation methods for traffic jam evaluation indexes in China and abroad. Highways and Auto Transport, 30(3), 57-61.
[9] Beijing Bureau of Quality and Technical Supervision. (2011). Urban road traffic performance assessment index system, Beijing, Beijing Bureau of Quality and Technical Supervision.
[10] Guangzhou Bureau of Quality and Technical Supervision. (2013). Urban road traffic performance assessment index system, Guangzhou, Guangzhou Bureau of Quality and Technical Supervision.
[11] Yang, J. F., Xue, Y. J, Hu, Y. M., Chen, Z. M. & Chen, Q. (2008). Research on grouping fuzzy judgment method based on simplified fuzzy classification association rules. System Engineering Theory and Practice, 28(3), 139-143.
[12] Yang, J. F., Xue, Y. J. & Hu, Y. M. (2008). Research based on association rules and fuzzy judgment assessment method. Transactions of the Chinese Society of agricultural Engineering, 24(5), 74-77.
[13] Narges, S. B. & Assef, Z. (2011). Forecasting TAIEX using improved type 2 fuzzy time series. Expert Systems with Applications, 38(3), 5816-5821.
Contact information: Dr. Li WANG The School of Computer Software, Section A, Building 55, Tianjin University Beiyangyuan Campus, No. 135, Ya Guan Road, Jinnan District, Tianjin, 300354, China E-mail: [email protected] Dr. Jingfeng YANG Corresponding Author Open Laboratory of Geo-Spatial Information Technology and Application of Guangdong Province, Guangzhou Institute of Geography, 100 Xianliezhong Road, Guangzhou 510070, China Guangzhou Yuntu Information Technology CO, LTD, & Open Laboratory of Geo-Spatial Information Technology and Application of Guangdong Province, Guangzhou Institute of Geography,100 Xianliezhong Road, Guangzhou 510070, China E-mail: [email protected] Dr. Nanfeng ZHANG Senior Engineer, Chief Engineer of Guangzhou Entry Exit Inspection and Quarantine Bureau laboratory. Mechanical and electrical integration, vehicle detection and fault diagnosis. Members of Society of automotive engineering of China, science and technology expert of Guangdong Provincial Department of Science and Technology, expert of Guangzhou City Auto Repair Association. E-mail: [email protected] Dr. Ji YANG Open Laboratory of Geo-Spatial Information Technology and Application of Guangdong Province, Guangzhou Institute of Geography,100 Xianliezhong Road, Guangzhou 510070, China, E-mail: [email protected] Dr. Yong LI Open Laboratory of Geo-Spatial Information Technology and Application of Guangdong Province, Guangzhou Institute of Geography, 100 Xianliezhong Road, Guangzhou 510070, China E-mail: [email protected] Ms. Jiarong HE Deputy Chief of integrated four division in Foshan municipal people's government office. E-mail: [email protected] Ms. Feng YANG Open Laboratory of Geo-Spatial Information Technology and Application of Guangdong Province, Guangzhou Institute of Geography, 100 Xianliezhong Road, Guangzhou 510070, China, E-mail: [email protected] Ms. Handong ZHOU Guangzhou Yuntu Information Technology CO, LTD, & Open Laboratory of Geo-Spatial Information Technology and Application of Guangdong Province, Guangzhou Institute of Geography,100 Xianliezhong Road, Guangzhou 510070, China. E-mail: [email protected]