Accepted Manuscript Review TiO 2 photocatalyst for removal of volatile organic compounds in gas phase – A review Zahra Shayegan, Chang-Seo Lee, Fariborz Haghighat PII: S1385-8947(17)31652-2 DOI: https://doi.org/10.1016/j.cej.2017.09.153 Reference: CEJ 17738 To appear in: Chemical Engineering Journal Received Date: 16 August 2017 Revised Date: 22 September 2017 Accepted Date: 24 September 2017 Please cite this article as: Z. Shayegan, C-S. Lee, F. Haghighat, TiO 2 photocatalyst for removal of volatile organic compounds in gas phase – A review, Chemical Engineering Journal (2017), doi: https://doi.org/10.1016/j.cej. 2017.09.153 This is a PDF file of an unedited manuscript that has been accepted for publication. As a service to our customers we are providing this early version of the manuscript. The manuscript will undergo copyediting, typesetting, and review of the resulting proof before it is published in its final form. Please note that during the production process errors may be discovered which could affect the content, and all legal disclaimers that apply to the journal pertain.
Transcript
Accepted Manuscript
Review
TiO2 photocatalyst for removal of volatile organic compounds in gas phase – Areview
Received Date: 16 August 2017Revised Date: 22 September 2017Accepted Date: 24 September 2017
Please cite this article as: Z. Shayegan, C-S. Lee, F. Haghighat, TiO2 photocatalyst for removal of volatile organiccompounds in gas phase – A review, Chemical Engineering Journal (2017), doi: https://doi.org/10.1016/j.cej.2017.09.153
This is a PDF file of an unedited manuscript that has been accepted for publication. As a service to our customerswe are providing this early version of the manuscript. The manuscript will undergo copyediting, typesetting, andreview of the resulting proof before it is published in its final form. Please note that during the production processerrors may be discovered which could affect the content, and all legal disclaimers that apply to the journal pertain.
cotton fibers [59], and glass fibers (GFs) [86] have been used as support.
Glass and silica substrates are among the widest used materials because they are transparent.
Activated carbon has high porosity, which creates a high specific surface area and enhances
photocatalyst activity. Carbonized cotton fibers (CCFs) are an alternative support for TiO2. CCFs
25
have great corrosion and temperature resistance, high conductivity, and strength. In addition,
glass fibers (GFs) are flexible and easier to handle than other supports [59, 86].
Pham et al. [109] considered gaseous toluene degradation on V-doped TiO2. Porous
polyurethane (PU) was used as a support for immobilizing the photocatalyst and so increases its
adsorption ability to remove toluene under visible light irradiation. In another study [63], they
used PU as a substrate for Cu doped TiO2 for benzene degradation. Immobilized on a porous
support, Cu–TiO2 showed improvement in both adsorption capacity and photocatalytic oxidation
for benzene removal. Jo et al. [101] studied the aluminum sheet-based S-doped TiO2 for BTEX
photodegradation. Aluminum is considered a flexible low-cost substrate. Yang et al. [86] stated
that stabilizing the nanocatalyst on the substrate in air purification system is essential. They
considered BTEX photodegradation on Fe-doped TiO2, which supported on the glass fiber. They
examined the applicability of glass fiber supported photocatalyst for eliminating VOCs under
visible and UV light irradiation. Zhong et al. [7] studied the photocatalytic oxidation process of
TiO2 coated on fiberglass fibers (FGFs) and carbon cloth fibers (CCFs). In this study, the
photolysis effects under vacuum ultraviolet (VUV) and ultraviolet (UVC) irradiation for a
different kind of VOCs were investigated in a pilot duct system. The single-pass removal
efficiency of considered compounds showed the following sequence: TiO2/CCFs+VUV >
TiO2/FGFs+VUV > TiO2/FGFs+UVC. According to their results, coating nano-TiO2 particles on
the CCFs provided a large surface area that produced high photocatalytic activity. In a different
study, Zhong et al. [61] reported that TiO2 /FGFs catalyst possesses hydrophilic characteristics.
Because of this, the adsorption coefficient for polar VOCs was higher than that of non-polar
VOCs at the same RH level. Moreover, the BET surface area of TiO2/CCFs being higher than
that of TiO2/FGFs led to a greater adsorption capacity [61].
A desirable coating technique should have the following requirements: a) a durable and stable
coating; b) an efficient and appropriate contact between the catalyst and the contaminant; c) be
non-selective for different substrates; and d) be cost-effective and suitable for large-scale
application [153]. Generally, the dip coating and spray coating are used for immobilizing TiO2
on the catalyst support [6, 40, 154]. Dip coating forms a thin and controllable layer, while spray
coating may be used to create a thicker layer [59].
26
6.3. Application in industrial, civil and building construction
General studies considering the PCO for removal of a wide range of VOCs in the gas phase are
reviewed in this paper. However, most reported studies are based on bench-scale operating in
laboratory conditions and there are only a few papers dealing with full-scale or industrial
application of PCO technology [7, 53, 61, 155, 156]. Although, the acceptable efficiency of PCO
is proved in laboratory scales, there are some limitations during the scaling up the system which
are operating in real conditions [157]. For example, the most reported research were done for a
single compound with low airflow rate (in L/min level) and high VOCs concentration (in
hundreds ppm level), which is far from real indoor applications [158]. Consequently, results
from these research may not appropriately accurate and practical for the design of large-scale
application of PCO for removal of VOCs [158].
Despite enormous studies on UV-PCO for removal of VOCs in the laboratory, limited research
has been studied the catalyst deactivation problem, by-product production and moderate removal
efficiency [158]. By-products and intermediates production and their accumulation on the
surface of catalyst may cause the deactivation of catalyst [156, 159]. An additional concern that
restricts full-scale applications of PCO in air purification system is their moderate efficiency,
particularly when they are operating in high flow rate that is more similar to the real application
[158]. Improvement of the catalyst surface characteristics in order to reduce the catalyst
deactivation may address this limitation. The deactivation may be reduced through deferent
strategies: a) expand the light absorption edge into the visible range that more photon could be
used; b) reduce the recombination rate of charge carriers to enhance the quantum yield; c) design
the PCO reactor with the configuration that the maximum light reach to the full surface of
catalyst [158].
The large-scale applications of photocatalytic process were used for air purification and self-
cleaning purposes for the first time in Japan, in middle of the 1990s [157]. One of the most
successful self-cleaning coatings, which are used in the practical applications, is TiO2-based
photocatalytic coating. Many substrates such as window glass for building, concrete for
construction and bridges, metal for traffic infrastructure and architecture, and polymers for
27
outdoor objects have been modified with TiO2-based coating to achieve self-cleaning
performance [160].
Zhong et al. [7] studied different VOCs removal in a pilot-scale application. They considered the
operational parameters such as contaminant concentration, relative humidity, and residence time
quite similar to the real conditions. They also reported the generated by-products for each
compound. He et al. [156] studied the paint plant’s waste gas removal in a pilot-scale system
combined with PCO and biotrickling filtration (BTF). They reported that the combination of
PCO and BTF is efficient for the removal of the high concentration and multicomponent VOCs
from waste gas of paint plant.
7. Conclusion
PCO is a promising technology for air purification that can eliminate indoor air contaminants
effectively at room temperature. PCO degrades hydrocarbon contaminants to carbon dioxide and
water. However, in most cases, some hazardous by-products will inevitably form during PCO.
Various factors such as humidity, light type and intensity, photocatalyst concentration,
contaminant concentration, and flow rate can affect PCO efficiency.
TiO2, the most used semiconductor photocatalysts in PCO, requires UV light irradiation to
activate given its relatively wide band gap. As a result, visible light does not have sufficient
energy to excite the electrons from the valence band to the TiO2 conduction band. Doping TiO2
with metal, non-metal and different composite semiconductors are promising methods for
overcoming its inherent limitations and for enhancing photocatalytic activity under visible light
irradiation. In addition, the effective reduction of electron and hole recombination rate is another
result of doping.
Metal components create the dopant state near the conduction band, however, non-metal
components form the new state closest to the valence band that lower the band gap and expand
the TiO2 light absorption edge. Moreover, the synergistic effects between metal and non-metal
dopants in co-doped TiO2 improve electron and hole separation, followed by enhancing TiO2
photocatalytic activity under visible light. Coupling TiO2 with other semiconductors that
generally have lower band gap energy improves the TiO2 photoactivity, accelerate electron and
hole separation, and expands its light absorption to the visible region.
28
Furthermore, it is essential to find an optimum amount of dopant to increase the separation of
charge carriers and prevent the formation of a recombination center. Additionally, choosing an
appropriate synthesizing or coating method to improve the catalyst features should also be
considered.
References
1. Yu, B.F., et al., Review of research on air-conditioning systems and indoor air quality
control for human health. International Journal of Refrigeration, 2009. 32(1): p. 3-20. 2. Cheng, Y.-H., C.-C. Lin, and S.-C. Hsu, Comparison of conventional and green building
materials in respect of VOC emissions and ozone impact on secondary carbonyl
emissions. Building and Environment, 2015. 87: p. 274-282. 3. Guieysse, B., et al., Biological treatment of indoor air for VOC removal: Potential and
challenges. Biotechnology Advances, 2008. 26(5): p. 398-410. 4. Bahri, M. and F. Haghighat, Plasma-Based Indoor Air Cleaning Technologies: The State
of the Art-Review. CLEAN – Soil, Air, Water, 2014. 42(12): p. 1667-1680. 5. Zhang, G., et al., Synthesis of bicrystalline TiO2 supported sepiolite fibers and their
photocatalytic activity for degradation of gaseous formaldehyde. Applied Clay Science, 2014. 102: p. 231-237.
6. Yang, L., et al., Design consideration of photocatalytic oxidation reactors using TiO2-
coated foam nickels for degrading indoor gaseous formaldehyde. Catalysis Today, 2007. 126(3–4): p. 359-368.
7. Zhong, L., et al., Performance of ultraviolet photocatalytic oxidation for indoor air
applications: Systematic experimental evaluation. Journal of Hazardous Materials, 2013. 261: p. 130-138.
8. Farhanian, D. and F. Haghighat, Photocatalytic oxidation air cleaner: Identification and
quantification of by-products. Building and Environment, 2014. 72: p. 34-43. 9. Gaya, U.I. and A.H. Abdullah, Heterogeneous photocatalytic degradation of organic
contaminants over titanium dioxide: A review of fundamentals, progress and problems. Journal of Photochemistry and Photobiology C: Photochemistry Reviews, 2008. 9(1): p. 1-12.
10. Tseng, T.K., et al., A Review of Photocatalysts Prepared by Sol-Gel Method for VOCs
Removal. International Journal of Molecular Sciences, 2010. 11(6): p. 2336. 11. Ji, J., et al., Mesoporous TiO2 under VUV irradiation: Enhanced photocatalytic oxidation
for VOCs degradation at room temperature. Chemical Engineering Journal, 2017. 327(Supplement C): p. 490-499.
12. Tejasvi, R., M. Sharma, and K. Upadhyay, Passive photo-catalytic destruction of air-
borne VOCs in high traffic areas using TiO2-coated flexible PVC sheet. Chemical Engineering Journal, 2015. 262(Supplement C): p. 875-881.
13. Lopes, F.V.S., et al., Insights into UV-TiO2 photocatalytic degradation of PCE for air
decontamination systems. Chemical Engineering Journal, 2012. 204(Supplement C): p. 244-257.
29
14. Galliano, S., et al., Photoanode/Electrolyte Interface Stability in Aqueous Dye-Sensitized
Solar Cells. Energy Technology, 2017. 5(2): p. 300-311. 15. Bella, F., et al., Unveiling the controversial mechanism of reversible Na storage in TiO2
nanotube arrays: Amorphous versus anatase TiO2. Nano Research, 2017. 10(8): p. 2891-2903.
16. Bella, F., et al., Paper-based quasi-solid dye-sensitized solar cells. Electrochimica Acta, 2017. 237(Supplement C): p. 87-93.
17. Hou, X., et al., Efficient quasi-mesoscopic perovskite solar cells using Li-doped
hierarchical TiO2 as scaffold of scattered distribution. Chemical Engineering Journal, 2017. 330(Supplement C): p. 947-955.
18. Yu, J., et al., Enhancement of Photocatalytic Activity of Mesporous TiO2 Powders by
Hydrothermal Surface Fluorination Treatment. The Journal of Physical Chemistry C, 2009. 113(16): p. 6743-6750.
19. Zeng, L., et al., A modular calcination method to prepare modified N-doped TiO2
nanoparticle with high photocatalytic activity. Applied Catalysis B: Environmental, 2016. 183: p. 308-316.
20. Feng, Y., et al., Improved Catalytic Capability of Mesoporous TiO2 Microspheres and
Photodecomposition of Toluene. ACS Applied Materials & Interfaces, 2010. 2(11): p. 3134-3140.
21. Khan, R. and T.-J. Kim, Preparation and application of visible-light-responsive Ni-doped
and SnO2-coupled TiO2 nanocomposite photocatalysts. Journal of Hazardous Materials, 2009. 163(2–3): p. 1179-1184.
22. Zhao, W., et al., Synthesis, Characterization, and Photocatalytic Properties of
SnO2/Rutile TiO2/Anatase TiO2 Heterojunctions Modified by Pt. The Journal of Physical Chemistry C, 2014. 118(40): p. 23117-23125.
23. Khan, R., et al., Comparative study of the photocatalytic performance of boron–iron Co-
doped and boron-doped TiO2 nanoparticles. Materials Chemistry and Physics, 2008. 112(1): p. 167-172.
24. Bianchi, C.L., et al., N-doped TiO2 from TiCl3 for photodegradation of air pollutants. Catalysis Today, 2009. 144(1–2): p. 31-36.
25. Ferrari-Lima, A.M., et al., Synthesis, characterisation and photocatalytic activity of N-
doped TiO2–Nb2O5 mixed oxides. Catalysis Today, 2015. 254: p. 119-128. 26. Burns, A., et al., Neodymium ion dopant effects on the phase transformation in sol–gel
derived titania nanostructures. Materials Science and Engineering: B, 2004. 111(2–3): p. 150-155.
27. Chen, H., C.E. Nanayakkara, and V.H. Grassian, Titanium Dioxide Photocatalysis in
Atmospheric Chemistry. Chemical Reviews, 2012. 112(11): p. 5919-5948. 28. Dhada, I., P.K. Nagar, and M. Sharma, Challenges of TiO2-Based Photooxidation of
Volatile Organic Compounds: Designing, Coating, and Regenerating Catalyst. Industrial & Engineering Chemistry Research, 2015. 54(20): p. 5381-5387.
29. Sarkar, D., et al., Three Dimensional Ag2O/TiO2 Type-II (p–n) Nanoheterojunctions for
Superior Photocatalytic Activity. ACS Applied Materials & Interfaces, 2013. 5(2): p. 331-337.
30. Vildozo, D., et al., Photocatalytic treatment of indoor air: Optimization of 2-propanol
removal using a response surface methodology (RSM). Applied Catalysis B: Environmental, 2010. 94(3–4): p. 303-310.
30
31. Guo, L., Y. Wang, and H.P. Lu, Combined Single-Molecule Photon-Stamping
Spectroscopy and Femtosecond Transient Absorption Spectroscopy Studies of Interfacial
Electron Transfer Dynamics. Journal of the American Chemical Society, 2010. 132(6): p. 1999-2004.
32. Yamada, Y. and Y. Kanemitsu, Determination of electron and hole lifetimes of rutile and
anatase TiO2 single crystals. Applied Physics Letters, 2012. 101(13): p. 133907. 33. Ozawa, K., et al., Electron–Hole Recombination Time at TiO2 Single-Crystal Surfaces:
Influence of Surface Band Bending. The Journal of Physical Chemistry Letters, 2014. 5(11): p. 1953-1957.
34. Lee, M.H., E. Geva, and B.D. Dunietz, Calculation from First-Principles of Golden Rule
Rate Constants for Photoinduced Subphthalocyanine/Fullerene Interfacial Charge
Transfer and Recombination in Organic Photovoltaic Cells. The Journal of Physical Chemistry C, 2014. 118(18): p. 9780-9789.
35. Mohtasebi, A., et al., Interfacial Charge Transfer between Phenyl-Capped Aniline
Tetramer Films and Iron Oxide Surfaces. The Journal of Physical Chemistry C, 2016. 120(51): p. 29248-29263.
36. Wang, J., et al., Highly Efficient Oxidation of Gaseous Benzene on Novel Ag3VO4/TiO2
Nanocomposite Photocatalysts under Visible and Simulated Solar Light Irradiation. The Journal of Physical Chemistry C, 2012. 116(26): p. 13935-13943.
37. Zhan, S., et al., Rapid degradation of toxic toluene using novel mesoporous SiO2 doped
TiO2 nanofibers. Catalysis Today, 2014. 225: p. 10-17. 38. Dong, F., H. Wang, and Z. Wu, One-Step “Green” Synthetic Approach for Mesoporous
C-Doped Titanium Dioxide with Efficient Visible Light Photocatalytic Activity. The Journal of Physical Chemistry C, 2009. 113(38): p. 16717-16723.
39. Jo, W.-K. and J.-T. Kim, Application of visible-light photocatalysis with nitrogen-doped
or unmodified titanium dioxide for control of indoor-level volatile organic compounds. Journal of Hazardous Materials, 2009. 164(1): p. 360-366.
40. Han, Z., et al., Experimental study on visible-light induced photocatalytic oxidation of
gaseous formaldehyde by polyester fiber supported photocatalysts. Chemical Engineering Journal, 2013. 218: p. 9-18.
41. Hussain, M., N. Russo, and G. Saracco, Photocatalytic abatement of VOCs by novel
optimized TiO2 nanoparticles. Chemical Engineering Journal, 2011. 166(1): p. 138-149. 42. Le Bechec, M., et al., Comparison of kinetics of acetone, heptane and toluene
photocatalytic mineralization over TiO2 microfibers and Quartzel® mats. Applied Catalysis B: Environmental, 2015. 179: p. 78-87.
43. Hussain, M., et al., Synthesis, characterization, and photocatalytic application of novel
TiO2 nanoparticles. Chemical Engineering Journal, 2010. 157(1): p. 45-51. 44. Agatino Di Paola , Marianna Bellardita, and a.L. Palmisano, Brookite, the Least Known
TiO2 Photocatalyst. catalysts, 2013: p. 36-73. 45. Guimaraes, R.R., A.L.A. Parussulo, and K. Araki, Impact of nanoparticles preparation
method on the synergic effect in anatase/rutile mixtures. Electrochimica Acta, 2016. 222(Supplement C): p. 1378-1386.
46. Verbruggen, S.W., TiO2 photocatalysis for the degradation of pollutants in gas phase:
From morphological design to plasmonic enhancement. Journal of Photochemistry and Photobiology C: Photochemistry Reviews, 2015. 24: p. 64-82.
47. Pfeifer, V., et al., Energy Band Alignment between Anatase and Rutile TiO2. The Journal of Physical Chemistry Letters, 2013. 4(23): p. 4182-4187.
31
48. Wang, C. and T. Wu, TiO2 nanoparticles with efficient photocatalytic activity towards
gaseous benzene degradation. Ceramics International, 2015. 41(2, Part B): p. 2836-2839. 49. Bianchi, C.L., et al., Photocatalytic degradation of acetone, acetaldehyde and toluene in
gas-phase: Comparison between nano and micro-sized TiO2. Applied Catalysis B: Environmental, 2014. 146: p. 123-130.
50. Nakata, K. and A. Fujishima, TiO2 photocatalysis: Design and applications. Journal of Photochemistry and Photobiology C: Photochemistry Reviews, 2012. 13(3): p. 169-189.
51. Sun, Q., et al., Influence of calcination temperature on the structural, adsorption and
photocatalytic properties of TiO2 nanoparticles supported on natural zeolite. Powder Technology, 2015. 274: p. 88-97.
52. Aghighi, A. and F. Haghighat, Using physical–chemical properties of reactants to
estimate the performance of photocatalytic oxidation air cleaners. Building and Environment, 2015. 85: p. 114-122.
53. Farhanian, D., et al., Impact of design parameters on the performance of ultraviolet
photocatalytic oxidation air cleaner. Building and Environment, 2013. 66(Supplement C): p. 148-157.
54. Mamaghani, A.H., F. Haghighat, and C.-S. Lee, Photocatalytic oxidation technology for
indoor environment air purification: The state-of-the-art. Applied Catalysis B: Environmental, 2017. 203: p. 247-269.
55. Fresno, F., et al., Photocatalytic degradation of toluene over doped and coupled
(Ti,M)O2 (M = Sn or Zr) nanocrystalline oxides: Influence of the heteroatom distribution
on deactivation. Applied Catalysis B: Environmental, 2008. 84(3–4): p. 598-606. 56. Korologos, C.A., C.J. Philippopoulos, and S.G. Poulopoulos, The effect of water presence
on the photocatalytic oxidation of benzene, toluene, ethylbenzene and m-xylene in the
gas-phase. Atmospheric Environment, 2011. 45(39): p. 7089-7095. 57. Sharmin, R. and M.B. Ray, Application of ultraviolet light-emitting diode photocatalysis
to remove volatile organic compounds from indoor air. Journal of the Air & Waste Management Association, 2012. 62(9): p. 1032-1039.
58. Takeuchi, M., et al., Effect of H2O vapor addition on the photocatalytic oxidation of
ethanol, acetaldehyde and acetic acid in the gas phase on TiO2 semiconductor powders. Applied Catalysis B: Environmental, 2010. 96(1–2): p. 218-223.
59. Wang, B., et al., High photocatalytic activity of immobilized TiO2 nanorods on
carbonized cotton fibers. Journal of Hazardous Materials, 2013. 263, Part 2: p. 659-669. 60. Muñoz-Batista, M.J., et al., Sunlight-driven toluene photo-elimination using CeO2-TiO2
composite systems: A kinetic study. Applied Catalysis B: Environmental, 2013. 140–141: p. 626-635.
61. Zhong, L., C.-S. Lee, and F. Haghighat, Adsorption performance of titanium dioxide
(TiO2) coated air filters for volatile organic compounds. Journal of Hazardous Materials, 2012. 243: p. 340-349.
62. Wu, Y.-T., et al., Enhanced xylene removal by photocatalytic oxidation using fiber-
illuminated honeycomb reactor at ppb level. Journal of Hazardous Materials, 2013. 262: p. 717-725.
63. Pham, T.-D., B.-K. Lee, and C.-H. Lee, The advanced removal of benzene from aerosols
by photocatalytic oxidation and adsorption of Cu–TiO2/PU under visible light
irradiation. Applied Catalysis B: Environmental, 2016. 182: p. 172-183.
32
64. Tseng, H.-H., et al., Degradation of xylene vapor over Ni-doped TiO2 photocatalysts
prepared by polyol-mediated synthesis. Chemical Engineering Journal, 2009. 150(1): p. 160-167.
65. Jo, W.-K. and J.-T. Kim, Decomposition of gas-phase aromatic hydrocarbons by
applying an annular-type reactor coated with sulfur-doped photocatalyst under visible-
light irradiation. Journal of Chemical Technology & Biotechnology, 2010. 85(4): p. 485-492.
66. Han, Z., et al., Experimental study on visible-light induced photocatalytic oxidation of
gaseous formaldehyde by polyester fiber supported photocatalysts. Chemical Engineering Journal, 2013. 218(Supplement C): p. 9-18.
67. Yang, L., et al., Degradation of indoor gaseous formaldehyde by hybrid VUV and
TiO2/UV processes. Separation and Purification Technology, 2007. 54(2): p. 204-211. 68. da Costa Filho, B.M., et al., Intensification of heterogeneous TiO2 photocatalysis using
an innovative micro-meso-structured-photoreactor for n-decane oxidation at gas phase. Chemical Engineering Journal, 2017. 310(Part 2): p. 331-341.
69. Zhu, X., et al., Inherent rate constants and humidity impact factors of anatase TiO2 film
in photocatalytic removal of formaldehyde from air. Chemical Engineering Journal, 2015. 279: p. 897-903.
70. El-Roz, M., et al., New Operando IR Technique to Study the Photocatalytic Activity and
Selectivity of TiO2 Nanotubes in Air Purification: Influence of Temperature, UV
Intensity, and VOC Concentration. The Journal of Physical Chemistry C, 2012. 116(24): p. 13252-13263.
71. Daghrir, R., P. Drogui, and D. Robert, Modified TiO2 For Environmental Photocatalytic
Applications: A Review. Industrial & Engineering Chemistry Research, 2013. 52(10): p. 3581-3599.
72. Fan, D., Z. Weirong, and W. Zhongbiao, Characterization and photocatalytic activities of
C, N and S co-doped TiO 2 with 1D nanostructure prepared by the nano-confinement
effect. Nanotechnology, 2008. 19(36): p. 365607. 73. Sun, S., et al., Photocatalytic degradation of gaseous toluene on Fe-TiO2 under visible
light irradiation: A study on the structure, activity and deactivation mechanism. Applied Surface Science, 2012. 258(12): p. 5031-5037.
74. Pinho, L., M. Rojas, and M.J. Mosquera, Ag–SiO2–TiO2 nanocomposite coatings with
enhanced photoactivity for self-cleaning application on building materials. Applied Catalysis B: Environmental, 2015. 178: p. 144-154.
75. Liu, B. and X. Zhao, A kinetic model for evaluating the dependence of the quantum yield
of nano-TiO2 based photocatalysis on light intensity, grain size, carrier lifetime, and
76. Salvadó-Estivill, I., D.M. Hargreaves, and G. Li Puma, Evaluation of the Intrinsic
Photocatalytic Oxidation Kinetics of Indoor Air Pollutants. Environmental Science & Technology, 2007. 41(6): p. 2028-2035.
77. Huang, H., et al., Photocatalytic Oxidation of Gaseous Benzene under VUV Irradiation
over TiO2/Zeolites Catalysts. Catalysis Today, 2017. 281, Part 3: p. 649-655. 78. Huang, H., et al., Photocatalytic destruction of air pollutants with vacuum ultraviolet
(VUV) irradiation. Catalysis Today, 2011. 175(1): p. 310-315.
33
79. Huang, H., et al., Enhanced degradation of gaseous benzene under vacuum ultraviolet
(VUV) irradiation over TiO2 modified by transition metals. Chemical Engineering Journal, 2015. 259: p. 534-541.
80. Huang, H. and W. Li, Destruction of toluene by ozone-enhanced photocatalysis:
Performance and mechanism. Applied Catalysis B: Environmental, 2011. 102(3–4): p. 449-453.
81. Zhong, L., F. Haghighat, and C.-S. Lee, Ultraviolet photocatalytic oxidation for indoor
environment applications: Experimental validation of the model. Building and Environment, 2013. 62: p. 155-166.
82. Moulis, F. and J. Krýsa, Photocatalytic degradation of several VOCs (n-hexane, n-butyl
acetate and toluene) on TiO2 layer in a closed-loop reactor. Catalysis Today, 2013. 209: p. 153-158.
83. Abbas, N., et al., Studies on the activity and deactivation of novel optimized TiO2
nanoparticles for the abatement of VOCs. Chemical Engineering Journal, 2011. 175: p. 330-340.
84. Guo, T., et al., Influence of relative humidity on the photocatalytic oxidation (PCO) of
toluene by TiO2 loaded on activated carbon fibers: PCO rate and intermediates
accumulation. Applied Catalysis B: Environmental, 2008. 79(2): p. 171-178. 85. Boulamanti, A.K., C.A. Korologos, and C.J. Philippopoulos, The rate of photocatalytic
oxidation of aromatic volatile organic compounds in the gas-phase. Atmospheric Environment, 2008. 42(34): p. 7844-7850.
86. Yang, S.-B., et al., Iron-functionalized titanium dioxide on flexible glass fibers for
photocatalysis of benzene, toluene, ethylbenzene, and o-xylene (BTEX) under visible- or
ultraviolet-light irradiation. Journal of the Air & Waste Management Association, 2015. 65(3): p. 365-373.
87. Christoforidis, K.C., S.J.A. Figueroa, and M. Fernández-García, Iron–sulfur codoped
TiO2 anatase nano-materials: UV and sunlight activity for toluene degradation. Applied Catalysis B: Environmental, 2012. 117–118: p. 310-316.
88. Albrbar, A.J., et al., Visible-light active mesoporous, nanocrystalline N,S-doped and co-
doped titania photocatalysts synthesized by non-hydrolytic sol-gel route. Ceramics International, 2016. 42(15): p. 16718-16728.
89. Chu, S.-Z., et al., Fabrication and Photocatalytic Characterizations of Ordered
Nanoporous X-Doped (X = N, C, S, Ru, Te, and Si) TiO2/Al2O3 Films on ITO/Glass. Langmuir, 2005. 21(17): p. 8035-8041.
90. Tieng, S., A. Kanaev, and K. Chhor, New homogeneously doped Fe(III)–TiO2
photocatalyst for gaseous pollutant degradation. Applied Catalysis A: General, 2011. 399(1–2): p. 191-197.
91. Murcia, J.J., et al., Ethanol partial photoxidation on Pt/TiO2 catalysts as green route for
acetaldehyde synthesis. Catalysis Today, 2012. 196(1): p. 101-109. 92. Barakat, T., et al., Total oxidation of toluene over noble metal based Ce, Fe and Ni doped
titanium oxides. Applied Catalysis B: Environmental, 2014. 146: p. 138-146. 93. Huang, H. and D.Y.C. Leung, Complete elimination of indoor formaldehyde over
supported Pt catalysts with extremely low Pt content at ambient temperature. Journal of Catalysis, 2011. 280(1): p. 60-67.
94. Murcia, J.J., et al., Cyclohexane photocatalytic oxidation on Pt/TiO2 catalysts. Catalysis Today, 2013. 209: p. 164-169.
34
95. Houšková, V., et al., Efficient gas phase photodecomposition of acetone by Ru-doped
Titania. Applied Catalysis B: Environmental, 2009. 89(3–4): p. 613-619. 96. Menéndez-Flores, V.M. and T. Ohno, High visible-light active Ir-doped-TiO2 brookite
photocatalyst synthesized by hydrothermal microwave-assisted process. Catalysis Today, 2014. 230: p. 214-220.
97. Kim, M.-S., et al., Preparation of porous carbon-doped TiO2 film by sol–gel method and
its application for the removal of gaseous toluene in the optical fiber reactor. Journal of Industrial and Engineering Chemistry, 2011. 17(2): p. 223-228.
98. Dong, F., et al., Enhancement of the Visible Light Photocatalytic Activity of C-Doped
TiO2 Nanomaterials Prepared by a Green Synthetic Approach. The Journal of Physical Chemistry C, 2011. 115(27): p. 13285-13292.
99. Wang, H., Z. Wu, and Y. Liu, A Simple Two-Step Template Approach for Preparing
Carbon-Doped Mesoporous TiO2 Hollow Microspheres. The Journal of Physical Chemistry C, 2009. 113(30): p. 13317-13324.
100. Khalilzadeh, A. and S. Fatemi, Spouted bed reactor for VOC removal by modified nano-
TiO2 photocatalytic particles. Chemical Engineering Research and Design, 2016. 115,
Part A: p. 241-250. 101. Jo, W.-K. and H.-J. Kang, Aluminum sheet-based S-doped TiO2 for photocatalytic
decomposition of toxic organic vapors. Chinese Journal of Catalysis, 2014. 35(7): p. 1189-1195.
102. Nishijima, K., et al., Development of an S-doped titania nanotube (TNT) site-selectively
loaded with iron(III) oxide and its photocatalytic activities. Applied Catalysis B: Environmental, 2008. 84(3–4): p. 584-590.
103. Li, Y., C. Zhang, and H. He, Significant enhancement in activity of Pd/TiO2 catalyst for
formaldehyde oxidation by Na addition. Catalysis Today, 2017. 281, Part 3: p. 412-417. 104. Zhou, M. and J. Yu, Preparation and enhanced daylight-induced photocatalytic activity
of C,N,S-tridoped titanium dioxide powders. Journal of Hazardous Materials, 2008. 152(3): p. 1229-1236.
105. Ferrari-Lima, A.M., et al., Photodegradation of benzene, toluene and xylenes under
visible light applying N-doped mixed TiO2 and ZnO catalysts. Catalysis Today, 2015. 241, Part A: p. 40-46.
106. Lee, J.Y. and W.-K. Jo, Heterojunction-based two-dimensional N-doped TiO2/WO3
composite architectures for photocatalytic treatment of hazardous organic vapor. Journal of Hazardous Materials, 2016. 314: p. 22-31.
107. Vargas Hernández, J., et al., Effects of metal doping (Cu, Ag, Eu) on the electronic and
optical behavior of nanostructured TiO2. Journal of Alloys and Compounds, 2017. 710: p. 355-363.
108. Pham, T.-D. and B.-K. Lee, Selective removal of polar VOCs by novel photocatalytic
activity of metals co-doped TiO2/PU under visible light. Chemical Engineering Journal, 2017. 307: p. 63-73.
109. Pham, T.-D. and B.-K. Lee, Novel adsorption and photocatalytic oxidation for removal of
gaseous toluene by V-doped TiO2/PU under visible light. Journal of Hazardous Materials, 2015. 300: p. 493-503.
110. Stucchi, M., et al., Copper NPs decorated titania: A novel synthesis by high energy US
with a study of the photocatalytic activity under visible light. Ultrasonics Sonochemistry, 2016. 31: p. 295-301.
35
111. Choi, J., H. Park, and M.R. Hoffmann, Effects of Single Metal-Ion Doping on the Visible-
Light Photoreactivity of TiO2. The Journal of Physical Chemistry C, 2010. 114(2): p. 783-792.
112. Shao, G.N., et al., Investigation of the influence of vanadium, iron and nickel dopants on
the morphology, and crystal structure and photocatalytic properties of titanium dioxide
based nanopowders. Journal of Colloid and Interface Science, 2016. 474: p. 179-189. 113. Korologos, C.A., et al., Photocatalytic oxidation of benzene, toluene, ethylbenzene and
m-xylene in the gas-phase over TiO2-based catalysts. Journal of Photochemistry and Photobiology A: Chemistry, 2012. 244: p. 24-31.
114. Li, X., et al., Photocatalytic degradation of gaseous toluene over Ag-doping TiO2
nanotube powder prepared by anodization coupled with impregnation method. Chemosphere, 2011. 83(5): p. 674-679.
115. Mogal, S.I., et al., Single-Step Synthesis of Silver-Doped Titanium Dioxide: Influence of
Silver on Structural, Textural, and Photocatalytic Properties. Industrial & Engineering Chemistry Research, 2014. 53(14): p. 5749-5758.
116. Cheng, Z., et al., Synthesis, characterization, and photocatalytic activity of porous La–N–
co-doped TiO2 nanotubes for gaseous chlorobenzene oxidation. Journal of Environmental Sciences, 2016. 46(Supplement C): p. 203-213.
117. Yurtsever, H.A. and M. Çiftçioğlu, The effect of rare earth element doping on the
microstructural evolution of sol-gel titania powders. Journal of Alloys and Compounds, 2017. 695: p. 1336-1353.
118. Li, F.B., et al., Enhanced photocatalytic degradation of VOCs using Ln3+–TiO2
catalysts for indoor air purification. Chemosphere, 2005. 59(6): p. 787-800. 119. Xiao, J., et al., Preparation, phase transformation and photocatalytic activities of cerium-
doped mesoporous titania nanoparticles. Journal of Solid State Chemistry, 2006. 179(4): p. 1161-1170.
120. Dong, F., et al., Marked enhancement of photocatalytic activity and photochemical
stability of N–doped TiO2 nanocrystals by Fe3+/Fe2+ surface modification. Journal of Colloid and Interface Science, 2010. 343(1): p. 200-208.
121. Hung, W.-C., et al., Synthesis and characterization of TiO2 and Fe/TiO2 nanoparticles
and their performance for photocatalytic degradation of 1,2-dichloroethane. Applied Surface Science, 2008. 255(5, Part 1): p. 2205-2213.
122. Chun, H.-H., J.Y. Lee, and W.-K. Jo, Photocatalysis of low-concentration gaseous
organic pollutants over electrospun iron-doped titanium dioxide nanofibers. Solid State Sciences, 2013. 25: p. 103-109.
123. Yu, H., et al., Photocatalytic activity of TiO2 thin film non-uniformly doped by Ni. Materials Chemistry and Physics, 2006. 97(1): p. 59-63.
124. Tobaldi, D.M., et al., Visible light activated photocatalytic behaviour of rare earth
modified commercial TiO2. Materials Research Bulletin, 2014. 50: p. 183-190. 125. Inturi, S.N.R., et al., Visible-light-induced photodegradation of gas phase acetonitrile
using aerosol-made transition metal (V, Cr, Fe, Co, Mn, Mo, Ni, Cu, Y, Ce, and Zr)
doped TiO2. Applied Catalysis B: Environmental, 2014. 144: p. 333-342. 126. Chen, D., et al., Carbon and Nitrogen Co-doped TiO2 with Enhanced Visible-Light
127. Burda, C., et al., Enhanced Nitrogen Doping in TiO2 Nanoparticles. Nano Letters, 2003. 3(8): p. 1049-1051.
36
128. Pandian, R., et al., Types of nitrogen incorporation in reactively sputtered titania thin
films: Influence on UV–visible, photocatalytic and photoconduction properties. Thin Solid Films, 2016. 616: p. 466-476.
129. Di Valentin, C., G. Pacchioni, and A. Selloni, Theory of Carbon Doping of Titanium
Dioxide. Chemistry of Materials, 2005. 17(26): p. 6656-6665. 130. Kavitha, R. and L.G. Devi, Synergistic effect between carbon dopant in titania lattice and
surface carbonaceous species for enhancing the visible light photocatalysis. Journal of Environmental Chemical Engineering, 2014. 2(2): p. 857-867.
131. Ma, D., et al., Fabrication and photocatalytic properties of cationic and anionic S-doped
TiO2 nanofibers by electrospinning. Applied Catalysis B: Environmental, 2014. 147: p. 49-57.
132. Ohno, T., et al., Preparation of S-doped TiO2 photocatalysts and their photocatalytic
activities under visible light. Applied Catalysis A: General, 2004. 265(1): p. 115-121. 133. Yu, J.C., et al., Efficient Visible-Light-Induced Photocatalytic Disinfection on Sulfur-
134. Zhang, C., et al., Alkali-Metal-Promoted Pt/TiO2 Opens a More Efficient Pathway to
Formaldehyde Oxidation at Ambient Temperatures. Angewandte Chemie International Edition, 2012. 51(38): p. 9628-9632.
135. Zhang, C., et al., Sodium-Promoted Pd/TiO2 for Catalytic Oxidation of Formaldehyde at
Ambient Temperature. Environmental Science & Technology, 2014. 48(10): p. 5816-5822.
136. Lei, X.F., et al., Effect of calcination temperature on the structure and visible-light
photocatalytic activities of (N, S and C) co-doped TiO2 nano-materials. Applied Surface Science, 2015. 332: p. 172-180.
137. Li, D., et al., Visible-light-driven nitrogen-doped TiO2 photocatalysts: effect of nitrogen
precursors on their photocatalysis for decomposition of gas-phase organic pollutants. Materials Science and Engineering: B, 2005. 117(1): p. 67-75.
138. Li, Y.-F., et al., Mechanistic Study of Codoped Titania with Nonmetal and Metal Ions: A
Case of C + Mo Codoped TiO2. ACS Catalysis, 2012. 2(3): p. 391-398. 139. Feng, C., et al., Visible light photocatalytic behavior of manganese carbonate/titanium
dioxide nanocomposites based on photoinduced interfacial charge transfer. Materials Letters, 2015. 155: p. 23-26.
140. Liu, Z., et al., Photocatalytic degradation of gaseous benzene with CdS-sensitized TiO2
film coated on fiberglass cloth. Journal of Molecular Catalysis A: Chemical, 2012. 363–
364: p. 159-165. 141. Gholami, M., et al., Comparison of Benzene & Toluene removal from synthetic polluted
air with use of Nano photocatalyticTiO2/ ZNO process. Journal of Environmental Health Science and Engineering, 2014. 12(1): p. 45.
142. Xu, Y. and M.A.A. Schoonen, The absolute energy positions of conduction and valence
bands of selected semiconducting minerals. American Mineralogist, 2000. 85(3-4): p. 543-556.
143. Yu, J., J.C. Yu, and X. Zhao, The Effect of SiO2 Addition on the Grain Size and
Photocatalytic Activity of TiO2 Thin Films. Journal of Sol-Gel Science and Technology, 2002. 24(2): p. 95-103.
144. Guan, K., Relationship between photocatalytic activity, hydrophilicity and self-cleaning
effect of TiO2/SiO2 films. Surface and Coatings Technology, 2005. 191(2–3): p. 155-160.
37
145. Zou, L., et al., Removal of VOCs by photocatalysis process using adsorption enhanced
TiO2–SiO2 catalyst. Chemical Engineering and Processing: Process Intensification, 2006. 45(11): p. 959-964.
146. Li, X., J. Yu, and M. Jaroniec, Hierarchical photocatalysts. Chemical Society Reviews, 2016. 45(9): p. 2603-2636.
147. Liu, R., et al., Fabrication of TiO2/ZnO composite nanofibers by electrospinning and
their photocatalytic property. Materials Chemistry and Physics, 2010. 121(3): p. 432-439.
148. Gomathi Devi, L. and R. Kavitha, A review on plasmonic metalTiO2 composite for
generation, trapping, storing and dynamic vectorial transfer of photogenerated electrons
across the Schottky junction in a photocatalytic system. Applied Surface Science, 2016. 360, Part B: p. 601-622.
149. Chen, Q., et al., Visible-light-activated Ce–Si co-doped TiO2 photocatalyst. Applied Surface Science, 2009. 255(18): p. 7918-7924.
150. Yuan, J., et al., Ozone-assisted photocatalytic degradation of gaseous acetaldehyde on
TiO2/M-ZSM-5 (M = Zn, Cu, Mn). Catalysis Today, 2013. 201: p. 182-188. 151. Cao, S., et al., Highly antibacterial activity of N-doped TiO2 thin films coated on
stainless steel brackets under visible light irradiation. Applied Surface Science, 2014. 309: p. 119-127.
152. Daram, P., et al., Microstructure and photocatalytic activities of thermal sprayed titanium
dioxide/carbon nanotubes composite coatings. Surface and Coatings Technology, 2016. 306, Part A: p. 290-294.
153. Han, Z., et al., Preparation of TiO2-Coated Polyester Fiber Filter by Spray-Coating and
Its Photocatalytic Degradation of Gaseous Formaldehyde. Aerosol and Air Quality Research, 2012. 12: p. 1327–1335.
154. Aghighi, A. and F. Haghighat, Evaluation of nano-titanium dioxide (TiO2) catalysts for
ultraviolet photocatalytic oxidation air cleaning devices. Journal of Environmental Chemical Engineering, 2015. 3(3): p. 1622-1629.
155. Monteiro, R.A.R., et al., Evaluation of a solar/UV annular pilot scale reactor for 24h
continuous photocatalytic oxidation of n-decane. Chemical Engineering Journal, 2015. 280(Supplement C): p. 409-416.
156. He, Z., et al., Treatment of organic waste gas in a paint plant by combined technique of
biotrickling filtration with photocatalytic oxidation. Chemical Engineering Journal, 2012. 200(Supplement C): p. 645-653.
157. Hüsken, G., M. Hunger, and H.J.H. Brouwers, Experimental study of photocatalytic
concrete products for air purification. Building and Environment, 2009. 44(12): p. 2463-2474.
158. Zhong, L. and F. Haghighat, Photocatalytic air cleaners and materials technologies –
Abilities and limitations. Building and Environment, 2015. 91: p. 191-203. 159. Krichevskaya, M., et al., Gas-phase photocatalytic oxidation of refractory VOCs
mixtures: Through the net of process limitations. Catalysis Today, 2017. 280(Part 1): p. 93-98.
160. Xu, F., et al., Preparation of photocatalytic TiO2-based self-cleaning coatings for
painted surface without interlayer. Progress in Organic Coatings, 2017. 113(Supplement C): p. 15-24.
38
39
Highlights
• The limitations of the TiO2-based photocatalyst for photocatalytic degradation of VOCs are
reviewed.
• The approaches for modifying TiO2-based photocatalyst to improve the performance of
photodegradation of VOCs are discussed.
• Applications of TiO2 and modified-TiO2 photocatalysts for VOCs removal in the gas phase
are summarized.
• Fundamental of metal and non-metal doped TiO2, co-doped TiO2, and composite TiO2 with
other semiconductors are considered.
• The effects of key controlling parameters on PCO efficiency are reviewed.
40
41
Figure 1. Basic principle of PCO for removal of VOCs.
42
0
10
20
30
40
50
60
70
80
90
1000
0.5 1 2 5 10 0 2 4 6 8 10
1.32
3.64
4.23
4.87 0.
5 1 2 2 4 6 8 10
0.00
5
0.01
0.05
0.1
0.5
0.00
1
0.00
4
0.00
8
0.01
2 0
0.00
5
0.02
0.05 0.
1
0.5 1 2
wt%
m-Xylene, Mn-doped TiO2[64]
wt%
Toluene, V-doped TiO2[109]
wt%
p-Xylene, Ni-doped TiO2
[66]
wt%
Cyclohexane, Pt-doped
TiO2[94]
wt%
Benzene, Cu-doped TiO2/PU
[65]
wt%
Toluene, Fe-doped TiO2[86]
wt%
Toluene, Fe-doped TiO2
[122]
wt%
Toluene, Fe-doped N/TiO2 [120]
Rem
oval
Eff
icie
ncy
%
Figure 2. Influence of the amount of different metal dopants (wt.%) on VOCs degradation by TiO2 photocatalyst.
43
Figure 3. Schematic energy level of Fe (transition metal) doping TiO2.
44
Figure 4. Schematic energy level of (a) N-doped TiO2, (b) C-doped TiO2, (c) S-doped TiO2.
Figure 5. Schematic energy level of metal and non-metal doped TiO2.
45
Figure 6. Figure 6. Schematic energy level of TiO2 composite (a) SnO2 (data extracted from [21, 22,
142]), (b) CdS (data extracted from [140, 142]), (c) WO3 (data extracted from [106, 142]), (d) ZnO (data
extracted from [146]).
46
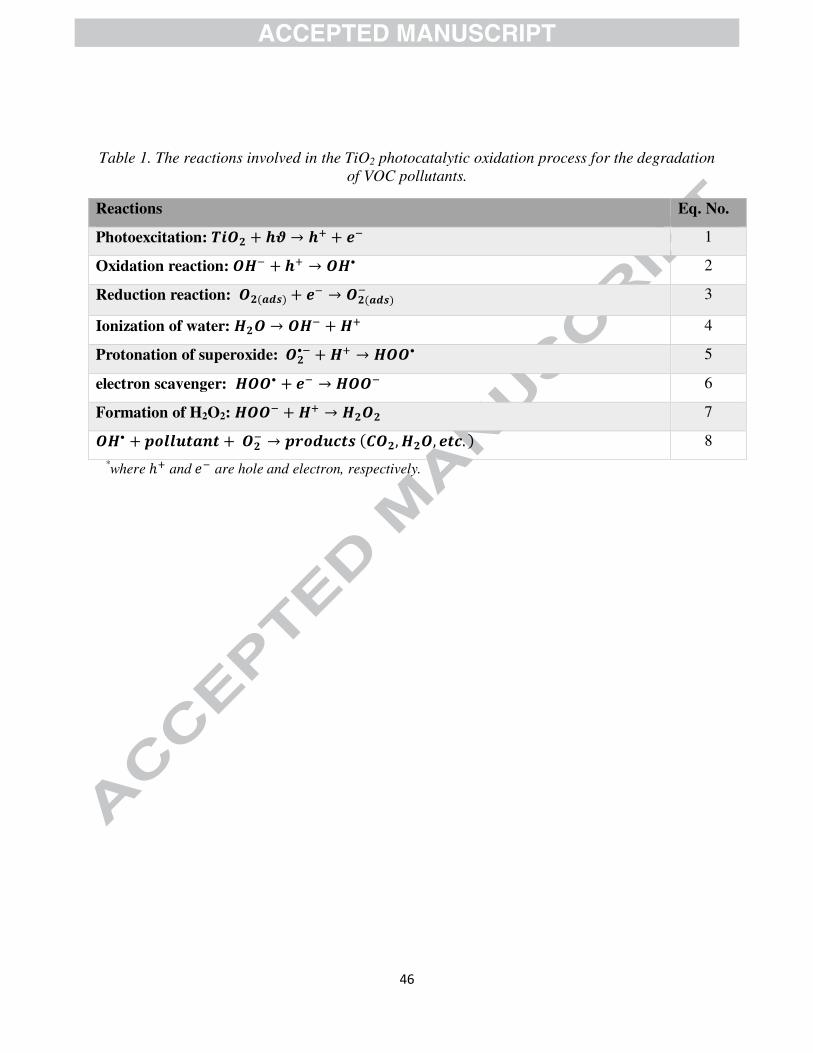
Table 1. The reactions involved in the TiO2 photocatalytic oxidation process for the degradation
TiO2/FGFs or CCFs+VUV: • Hexane: formaldehyde, acetaldehyde, 2-
butenal, propanal, butanal, tolualdehyde, and hexanal.
• Octane: formaldehyde, acetaldehyde, acetone, propanal, butanal and pentanal
• Ethanol: formaldehyde, acetaldehyde, 2-butenal, and propanal.
• 1-Butanol: formaldehyde, acetaldehyde, 2-butenal, propanal, and butanal.
• Toluene: formaldehyde, acetaldehyde, acetone, 2-butenal, butanal, and benzaldehyde.
• MEK: formaldehyde, acetaldehyde, acetone, and hexanal.
• Acetone: formaldehyde and acetaldehyde.
• Single-pass removal efficiency was varied as: TiO2/CCFs+VUV>TiO2/FGFs+VUV>TiO2/FGFs+UVC.
• The lower initial concentrations led to the higher conversion efficiencies.
[7]
Ethylene, Propylene, and
Toluene (200 ppm)
TiO2 (TNPs )
T=25 ºC; RH=60%;
RT=220 min; Lamps=
Combination of UVA (13.6 W) and
UVB (3 W)
Ethylene: about 73%; Propylene: about 37%;
and Toluene: about 61%
For Propylene: • polyethylene and polypropylene
• Calcination at 400 ºC for 3 h were the optimum calcination temperature and time for TNP catalyst
• The surface area of the optimized photocatalyst was 3 times higher than Degussa P25 catalyst (53 m2/g).
• An increase in calcination time from 1 to 3 h enhanced the surface area as a result of the absence of impurities and water molecules.
• The required surface area for the total adsorbed of toluene is 19.425 m2/g which is higher than the available 15 m2/g. This means multilayer adsorption happened during the tested conditions.
[41]
48
Ethylene, Propylene, and
Toluene (200 ppm)
TiO2 (TNPs)
T=20 to 80 ºC; AFR=100 mL/min;
Lamps: Combination of
UVA (13.6 W) and UVB (3 W)
Ethylene: 66.3%; Propylene: 80.4%;
and Toluene: 46%
For Ethylene: • polyethylene and polypropylene.
For propylene:
• polyethylene and polypropylene.
For Toluene: • NA
• Calcination at 400 ºC for 3 h were the optimum calcination temperature and time for TNP catalyst
• The commercial Degussa P25 showed the lower conversion efficiencies than TNPs.
• The highest conversion was achieved at 20 ºC. Moreover, by increasing the temperature from 20 to 80 ºC, the conversion was decreased.
• In the absence of water vapor, the photocatalytic degradation of toluene did not occur.
• The toluene illustrated the maximum adsorption capacity on TNP.
[83]
Ethanol (0.25, 0.5, and 1
ppm)
TiO2; Support:
FGFs and CCFs
T=23 ºC; RH=15-30%;
Lamp: UVC (18.4 W);
Intensity= 29-39 mWcm-2
17-38% for FGFs+UVC; 19-43% for FGFs+VUV;
and 31-53% for CCFs+VUV
NA
• TiO2/FGFs indicated that for the polar VOCs, the adsorption coefficients were roughly one order of magnitude higher than nonpolar VOCs for a specific RH level.
• TiO2/FGFs filter showed higher adsorption capacity for polar VOCs.
• TiO2/CCFs was better than TiO2/FGFs in the case of BET surface area, adsorption capacity, resistance against water vapor and photocatalytic activity.
[61]
Toluene (400 ppmv)
Evonik P25, Cristal PC105,
Kronos 1077, and Cristal AT-1; Support: Flat
glass disk
T=250 ºC; RH=40%; Lamp: Iron
halogenide lamp (500 W);
Intensity = 3 mWcm-2
52% (after 6 hr) for P25; 50% (after 6 hr) for PC105; 46% (after 6 hr) for Kronos
• No by-products were detected above the detection limit (150 ppbv) and CO2 was the only detected product.
• No conversion of BTEX neither in the case of photolysis (UV irradiation without catalyst) nor catalysis (catalyst without UV irradiation) was observed.
• The PCO of toluene and benzene were improved by increasing the water vapor concentration up to the optimum amount, however, the conversions were slightly decreased at more than that concentration.
• The increase in residence time led to increase in the conversion.
• No gas-phase intermediates were detected in the case of benzene, toluene, and ethylbenzene.
• Ethylbenzene was produced as by-product in high concentration for m-Xylene while in the case of o,p-Xylene was produced in low concentration.
• Adsorption on the catalyst surface for aromatic compounds was in the following order: Toluene>m-Xylene>p-Xylene>o-Xylene>Benzene> Ethylbenzene
•
[85]
Benzene (~47 ppm),
Toluene (~42 ppm),
Ethylbenzene (~39 ppm),
p,m-Xylene (~41ppm),
and o-Xylene (~27 ppm)
TiO2; Support: glass
T= 30.1 ± 0.7 ºC; RH=42.2 ± 3.2%; RT= 7.0 ± 0.25
min; Lamps: UVC
(8,11,16 W, 254 nm)
Benzene: 82.8%; Toluene: 35.8%;
Ethylbenzene: 97.9%; p,m-Xylene: 58.9%
and o-Xylene: 67%
• High formation of intermediates for toluene degradation such as benzaldehyde and benzoic acid led to decrease degradation rate constant much faster than the other considered VOCs.
• The particle size of TiO2 was 10.2±1.43 nm and uniformly dispersed on the surface of the catalyst.
• By decreasing the particle size specifically under the 30 nm, the photocatalytic activity of TiO2 and the number of active surface sites increased.
• The BET surface area of the catalyst powder was 9 m2/g.
[28]
Benzene (25ppmv)
TiO2; Support: Zeolite
(ZSM-5 with Si/Al of 200 and 470, MCM-41);
T= NA; RH=50%;
AFR= 1 L/min; Lamps: Two VUV (4 W), Two UVC
100% for TiO2/ZSM-5 (250 min) and 95% (360 min)
100% for TiO2/MCM-41 (180
min) and 87% (360 min)
NA
• No considerable rutile phase was detected in the XRD pattern of TiO2/MCM-41. However, the small diffraction peak of rutile phase was observed on TiO2/ZSM-5 (200) and TiO2/ZSM-5 (470).
[77]
50
(4 W, 254 nm)
• The stable benzene degradation efficiency for the various catalysts followed the order: TiO2/ZSM-5(200)>TiO2/ZSM-5(470)>TiO2/MCM–41>P25.
• TiO2/ZSM-5(200) displayed the highest CO2 concentration which is represented that it was a reliable catalyst for ozone degradation.
• All the supported TiO2 catalysts demonstrated higher photoactivity for benzene removal.
Acetone and Acetaldehyde (400 ppmv)
Evonik P25, Cristal PC105,
Kronos 1077, and Cristal AT-1; Support: Flat
glass disk
T=250 ºC; RH=40%; Lamp: Iron
halogenide lamp (500 W);
Intensity= 3 mWcm-2
Acetone: 100% (after 70 min) for P25,
100% (after 60 min) for PC105, 100% (after 90 min) for Kronos
1077, and 49% (after 120 min) for
Cristal AT-1 Acetaldehyde:
100% (after 60min) for P25, 100% (after 50min) for PC105, 100% (after 70min) for Kronos
1077, and 46% (after 120 min) for Cristal
AT-1
Acetone: • No by-product in the case of Evonik
P25, Cristal PC105 and Kronos 1077.
• By-products for Cristal AT-1 were acetaldehyde, acetic acid, formaldehyde, formic acid, and carbon dioxide.
Acetaldehyde: • No by-product in the case of Evonik
P25, Cristal PC105 and Kronos 1077.
• Evonik P25 and PC105 presented high photocatalytic efficiency and performance within the shorter reaction time.
• Micro-sized catalyst had a higher hydrophilicity/ hydrophobicity ratio.
[49]
T: Temperature
RH: Relative Humidity
AFR: Air Flow Rate
RT: Residence Time
NA: Not Available
TNP: Titanium nanoparticle
FGFs: Fiberglass fibers
CCFs: Carbon cloth fibers
ACFs: Activated carbon fibers
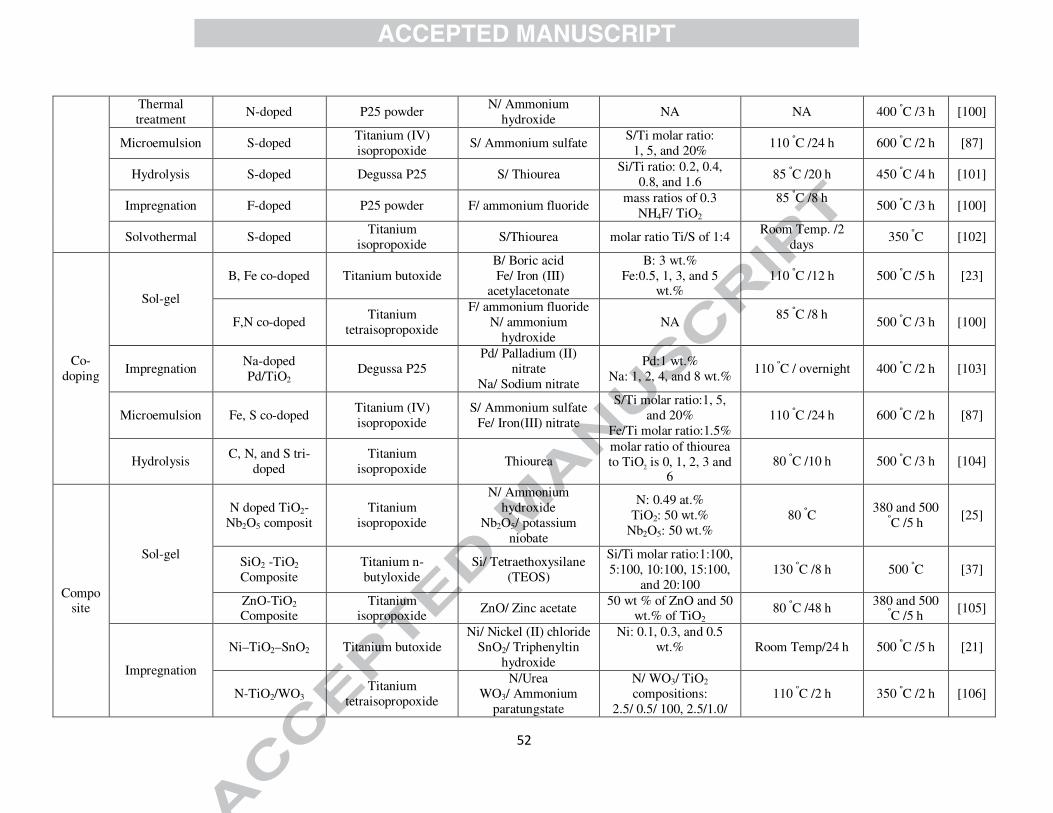
Table 3. Common preparation method of modified TiO2 photocatalyst for PCO.
Synthesize Method
Photocatalyst Precursor Dopant/source Ratio (dopant/ TiO2) Treatment
Temp./Duration Cal. Temp./
Duration Ref.
Metal Sol-gel Mn-doped, Tetra butyl titanate Mn, Cu, Co, Ni, and Fe 1% 120 ºC /6 h 550 ºC /4 h [79]
Ethylbenzene: 15-89% for Pt/P25, 5-80% for Fe/P25,
and 10-92% for Ce/P25;
m-Xylene: 9-83% for Pt/P25, 6-81% for Fe/P25,
and 9-86% for Ce/P25
NA
• In the case of PCO of benzene, only Ce/P25 catalyst was efficient.
• PCO rates over P25/Ce were higher by a factor of 1.5-10 than those over P25.
• For PCO of toluene, P25 catalyst proved to be the most active.
• For PCO of ethylbenzene, all doped catalysts followed the same trend.
• For all ethylbenzene concentration range, the P25/Ce catalyst was superior to others.
• In the case of m-xylene, there was no catalyst superior to the others at all concentration range.
• The PCO conversions of ethylbenzene and m-xylene indicated a great dependence on the initial concentration of the target compound.
[113]
BTEX (0.1 ppm)
Fe-doped TiO2; Support: Glass
Fiber; Synthesize
method: Sol-gel;
Fe-to Ti ratio: 0.005, 0.01,
0.05, 0.1, and 0.5
T=NA; RH=45%;
AFR=1 L/min;
Lamp: UVA-visible
Under
visible light: 0% for
Benzene; 5% for
Visible light and 0.01-GF-Fe-TiO2
Benzene: 4%; Toluene: 33%;
Ethylbenzene: 51% and
NA
• The calculated diameter of TiO2 crystal was 21.5 nm which was similar to the calculated diameters of the Fe-TiO2 composites (20.9−21.7 nm).
• The GF-Fe-TiO2 composites showed higher photocatalytic activity for BTEX rather than the GF-TiO2 (reference) photocatalyst.
[86]
54
Coating method:
Dip-coating
(daylight and black light
lamp); Visible light intensity=
2.7 mWcm-2 and
UV light intensity=
0.4 mWcm-2
Toluene; 16% for
Ethylbenzene and
29% for o-Xylene
Under UV
light: 68% for Benzene, 90% for Toluene, 96% for
Ethylbenzene, and
97% for o-Xylene
o-Xylene: 74%
UV light and 0.5-GF-Fe-TiO2
Benzene: 15%; Toluene: 63%;
Ethylbenzene:79% and
o-Xylene: 86%
• The photocatalytic activities of BTEX for GF-Fe-TiO2 under visible light reduced gradually by increasing the Fe-to-Ti ratio from 0.01 to 0.50.
• The BTEX photocatalytic efficiencies of GF-Fe-TiO2 under UV were lower than those obtained for GF-TiO2.
• The GF-TiO2 photocatalyst demonstrates an absorption edge at λ ≈ 410 nm.
Benzene (50 ppmv)
R-doped TiO2
(R: Mn, Co, Cu, Fe, and Ni),
undoped TiO2 and P25;
Synthesize method: Sol-gel
Mn, Co, Cu, Fe,
and Ni
1wt.%
T=NA; RH=50%;
AFR=1 L/min;
RT=30 s; Lamps:
UVC and VUV, 4 W
45.7% for undoped
TiO2
and 50.2% for P25
58% for Mn/TiO2; 51.5% for Co/TiO2; 50.9% for Cu/TiO2; 45.3% for Fe/TiO2
and 50.3% for Ni/TiO2
(Under VUV)
NA
• BET surface area of pure TiO2 was 96.6 m2/g while it declined to less than 50 m2/g for all doped catalysts.
• It is possible that the presence of transition metals blocked the pores of TiO2 and increase the growing of particles which lead to the reduction of specific surface area.
[79]
Benzene (100 ppm)
Cu-doped TiO2; Support: Porous
polyurethane (PU)
Cu: 2, 4, 6, 8, and 10 wt.%
T= NA; RH=40, 60,
80%; AFR= 100 mL/min;
Lamps= two 20 W light bulbs (400-700 nm);
Intensity= 50 mWcm-2
NA 86.3% for 6 wt.%-
Cu-TiO2/PU
3.20 eV for TiO2/PU; 3.05 eV for 2 wt.% -Cu-
TiO2/PU; 2.92 eV for 4 wt.% -Cu-
TiO2/PU; 2.85 eV for 6 wt.% -Cu-
TiO2/PU; 2.79 eV for 8 wt.% -Cu-
TiO2/PU and 2.75 eV for 10 wt.%-Cu-
TiO2/PU
• Optimal humidity conditions for the photocatalytic oxidation of benzene in Cu–TiO2/PU photocatalyst, was 60% RH.
• Water molecules played an important role in the photocatalytic oxidation process of benzene.
• The Cu+/Cu2+ ratios, the benzene removal efficiency and the degree of mineralization enhanced with the increase in the Cu/TiO2 ratios reached up to 6 wt%, and then gradually decreased with the further increase in ratios (8 and 10 wt%).
[63]
Toluene (370 ppmv)
Fe-doped TiO2; Support: glass
fiber;
Fe (Fe/Ti atom
T=Room temperature; RH=60%;
Efficiency NA
Efficiency NA
40-96.5%
3.18 eV for 0.1%-Fe-TiO2;
• No degradation of toluene was observed on the surface of the catalyst in absence of irradiation.
• Only about 5.8% of the toluene was converted [73]
55
Synthesize method: Sol gel
ratio: 0.1-
1.5%)
Lamp: UV-visible, 300 W (UV cut-
off filter)
14.9% mineralizatio
n for TiO2
mineralization (Maximum for Fe/Ti
ratio of 0.7%)
3.12 eV for 0.3% Fe-TiO2; 3.08 eV for 0.5% Fe-TiO2; 3.02 eV for 0.7% Fe-TiO2; 3.00 eV for 1.0% Fe-TiO2 and 2.96 eV for 1.5% Fe-TiO2
after 2h irradiation without the photocatalyst. • By increasing Fe concentration to reach Fe/Ti
ratio of 0.7%, the degradation rate of toluene increased significantly and reached the maximum level. Further Fe concentration led to a gradual decrease of the degradation rate.
• The Fe ion could replace with Ti4+ ions in TiO2 lattice which leads to extend the photoactivity of TiO2 to visible range and increase the electron and hole pairs’ formation.
Toluene (120 ppm)
Ag-doped TiO2 nanotube
Ag 1 wt.%
T=NA; RH=NA;
Lamps: UV (8W) and
visible light (500W Xe);
UV light intensity=
0.87 mWcm-2 Visible light intensity=
0.87 mWcm-2
79% for P25 (after 6 h)
90% for pure TiO2 under
UV
98% (after 4 h) under UV NA
• By doping Ag into the TiO2 nanotubes, the density of surface defects was increased and acts as rutile nucleation sites and result in promoting of phase transfer.
• The concentration of surface oxygen vacancy of anatase particles was improved in the Ag-doping TiO2 nanotubes, which caused Ag dopant could promote the transformation of anatase to rutile phase at lower calcination temperature.
• The surface area of 1% Ag-doping TiO2 nanotubes was 78.5 m2 g-1 and it was higher than P25 (52 m2 g-1).
• The pore size distribution of the catalyst was in the range of 1.0 and 30 nm, however, the main pore volume was found in the mesopores with diameters varying from 1.4 to 20 nm.
[114]
Toluene (200 ppm)
V-doped TiO2
V: 0, 2, 4, 6, 8 and 10 wt.%
T=NA; RH=50%; AFR= 200 mL/min; Lamp:
visible light, 20 W (400-700 nm);
Intensity= 50 mWcm-2
About 2% for undoped
TiO2
80% for 6 wt.% V-TiO2
3.20 eV for TiO2/PU; 3.09 eV for 2 wt.% -V-
TiO2/PU; 2.93 eV for 4 wt.% -V-
TiO2/PU; 2.83 eV for 6 wt.% -V-
TiO2/PU; 2.76 eV for 8 wt.% -V-
TiO2/PU and 2.70 eV for 10 wt.%-V-
TiO2/PU
• The optimum value for V content in V/TiO2 catalyst which showed the highest photocatalytic activity and high mineralization was 6 wt%.
• The band gap energy of V-TiO2/PU was gradually decreased with increase in the V/TiO2 ratios.
[109]
p-Xylene (80 ppm),
Ni doped TiO2 and Degussa
Ni: 0, 1.32,
T=NA; RH=30-
p-Xylene: 33%,
p-Xylene: about 20-60%;
NA • The concentration of xylene did not change with photolysis (under UV irradiation without
[64]
56
m-Xylene (70 ppm),
and o-Xylene
(60 ppm)
P25; Support:
Granular silicate glass;
Coating method:
impregnation
3.64, 4.23, 4.87, 4.46, 4.57,
and 4.74 wt.%
90%; RT= 54 s;
Lamp: UVC, 10 W (254
nm)
m-Xylene: 35%, and o-Xylene:
32%
m-Xylene: about 18-58%;
and o-Xylene:
about 18-54%
photocatalyst) or catalysis (under dark conditions in the presence of the photocatalyst).
• The photocatalytic degradation of xylene over TiO2 can be improved by doping Ni at a concentration lower than 4.2 wt.%, otherwise, the photocatalytic activity of modified TiO2 would be worse than that of pure TiO2.
m-Xylene (207 ppb)
Mn-doped TiO2
Mn: 0.5, 1, 2, 5, and 10
wt%
T=100 ºC; RH=23-25% and 75-80%;
RT=0.55-3.11s;
AFR=12 L/min;
Lamp: UV lamp
33.5±4.8% 2wt.%-Mn-TiO2
50±3.3 %
3.2 eV for TiO2; 3.1 eV for 0.5 wt.%-Mn-
TiO2; 3.06 eV for 1 wt.%-Mn-
TiO2; 3.01 eV for 2 wt.%-Mn-
TiO2; 2.8 eV for 5 wt.%-Mn-
TiO2 and 1.2 eV for 10 wt.%-Mn-
TiO2
• The loaded Mn provided more active sites on the photocatalyst surface, thus increased the photocatalytic activity.
• Mn-doped TiO2 results in narrowing the band gap.
• Mn dopants ions caused to reduce the charge carrier recombination rate and improved the separation rate of electron–hole pairs.
• Removal efficiency increased by loading Mn up to 2 wt%. However, an excess amount of Mn on the surface of catalyst led to decreeing in removal efficiency.
[62]
Isopropanol (1100 ppm)
Rare earth-doped TiO2
(RE= cerium, lanthanum,
europium and yttrium),
Undoped P25; Method: Thermal
treatment (Cal. Temp: 900 and
1000 ºC
Ce, La, Eu, and Y: 0.01
and 0.025 mol
T=23±2 ºC; RH=25-
30%; Lamp:
Xenon lamp, 300 W (400-
800 nm); Intensity= 16
mWcm-2
Efficiency NA
Acetone
formation (ppm h-1) at
Cal. Temp:900 For P25= 15
Efficiency NA
Acetone formation (ppm h-1) at Cal.
Temp:900 for La (0.01 mol)=26;
La (0.025 mol)=32; Eu (0.01 mol)=27;
Eu (0.025 mol)=19; Y (0.01 mol)=18;
Y (0.025 mol)=21; Ce (0.01 mol)<0.5
and Ce (0.01 mol)<0.5
3.01 eV for P25; 3.04 eV for La (0.01 mol);
3.04 eV for La (0.025 mol);
3.03 eV for Eu (0.01 mol); 3.04 eV for Eu (0.025
mol); 3.03 eV for Y (0.01 mol); 3.03 eV for Y (0.025 mol); 2.91 eV for Ce (0.01 mol)
and 2.90 eV for Ce (0.025
mol)
• The thermal treatment of the undoped P25 powder, caused to a decrease of its photocatalytic activity due to the concomitant size growth of the titania particles, and the decrease of its specific surface area.
• The three catalysts La (0.025 mol)-900, Eu (0.01 mol)-900 and La (0.01 mol)-900 all had high photocatalytic activity under visible-light irradiation.
• The rare earth doped TiO2 modifications led to attach more hydroxyl groups to the surface of the photocatalyst and generate chemical oxidative species, such as hydroxyl radicals which enhanced the photocatalytic activity.
[124]
Ethanol (0.2 vol. %)
(Concentrati
on of 0.2 vol.%, in
Pt-doped TiO2
Pt: 0.5 and 1 wt.%
T=60,80, and 100 ºC; RH=NA;
AFR=20-70 L/h;
Lamps= two
For undoped TiO2:
69%, 82% and 80% (at 60, 80, and
100 ºC,
98% for 0.5wt.%-Pt/TiO2 (at 80 ºC)
and 80% for 1 wt.%
Pt/TiO2 (at 80 ºC)
3.2 eV for TiO2; 2.8 eV for 0.5 wt.%-Pt-
TiO2 and
3.0 eV for 1 wt.%-Pt-TiO2
• No ethanol conversion was observed in dark adsorption for all tested temperature (60, 80 or 100 ºC).
• The conversion of ethanol enhanced when the reaction temperature increased to 80 ºC and then decreased for the reaction temperature of 100 ºC.
[91]
57
helium flow with an
oxygen/ethanol ratio of
2)
UVA-LEDs modules
(Each module
consisted of 40 UV-LEDs,
365nm); Intensity= 90
mWcm-2
respectively) • Ethanol conversion achieved with the catalysts with 1 wt.% Pt was slightly lower than those obtained with 0.5 wt.% Pt.
• Acetaldehyde was the main reaction product observed in all tests.
Acetonitrile (500 ppm)
M-doped TiO2
M: V, Cr, Fe, Co, Mn, Mo,
Ni, Cu, Y, Ce, and Zr
Ti/M=20 atomic ratio
(M: V, Cr, Fe,
Co, Mn, Mo, Ni,
Cu, Y, Ce, and Zr)
T=30-33 ºC; RH=NA;
AFR=100, 200, 300, and 500 mL/min;
Lamps: Six fluorescent white light lamps, 8W
4.5% for
P25
70% for Cr-TiO2; 21% for Fe-TiO2; 3.3% for Co-TiO2; 3.5% for Ce-TiO2; 5% for Cu-TiO2;
16.5% for V-TiO2; 2% for Ni-TiO2;
3.5% for Mn-TiO2; 2.3% for Mo-TiO2;
4.5% for Zr-TiO2 and 3% for Y-TiO2
3.11 eV for P25; 2.82 eV for Cr-TiO2; 2.69 eV for Fe-TiO2; 2.54 eV for Co-TiO2; 3.13 eV for Ce-TiO2; 2.86 eV for Cu-TiO2; 2.63 eV for V-TiO2; 2.37 eV for Ni-TiO2; 2.86 eV for Mn-TiO2; 3.19 eV for Mo-TiO2;
3.21 eV for Zr-TiO2 and 3.20 eV for Y-TiO2
• The Cr, Fe and V-doped TiO2 nanoparticles showed better photocatalytic efficiency under the visible light.
• The incorporation of the other transition metals including Mn, Mo, Ce, Co, Cu, Ni, Y, and Zr demonstrated an inhibition effect on the photocatalytic activity.
• Cr-doped TiO2 exhibited a superior photocatalytic activity and the rate constant for this modified catalyst was about 8–19 times higher than the other tested metal doped catalysts.
[125]
Acetaldehyde (500 ppm)
and Toluene (100 ppm)
Ir-doped TiO2; Support: glass
dish; Coating method:
Spray Coating
Ir: 0.25, 0.5, 0.75, and 1.5 wt.%
T= Room temperature; Lamp: LED (455 ± 0.1
nm); Intensity= 1
mWcm-2
Efficiency NA
About 270
CO2 ppm for undoped
TiO2
Efficiency NA
500 ppm CO2 for 0.5 wt% Ir-doped
TiO2
3.14 eV for bare TiO2 (brookite) and 1.88 eV
for 0.5wt.%-Ir-TiO2
• The specific surface areas for 0.25, 0.5, 0.75 and 1.5 wt% Ir-doped TiO2 brookite corresponded to 172.13, 208.41, 219.67, and 231.15 m2g−1 respectively, and for the undoped brookite was 128.18 m2g−1.
• 0.5 wt% Ir-doped TiO2 had the highest photocatalytic activity for decomposition of both acetaldehyde and toluene.
• The band gaps of the undoped and 0.5wt% Ir-doped TiO2 catalyst were 3.14 eV and 1.88 eV respectively.
[96]
Acetone (NA)
Ru-doped TiO2
Ru: 0.75, 0.5, 0.25, 0.1, 0.05, 0.01 and 0.005 g
Lamps: UV (365 nm and
400 nm)
Efficiency NA
Rate
constant for P25 Degussa was 0.00041
Efficiency NA
Rate constant for 0.05-Ru-TiO2 was
0.00059 and for 0.01-Ru-TiO2 was 0.00058
3.2 eV for TiO2; 2.7 eV for 0.75g-Ru-
TiO2; 2.9 eV for 0.5g-Ru-TiO2;
2.9 eV for 0.25g-Ru-TiO2;
2.9 eV for 0.1g-Ru-TiO2;
• The photocatalytic activities of Ru-doped TiO2 catalysts under visible light were strongly affected by the decreasing band gap energy.
• The rate constant (k) of the degradation of acetone under visible light was highest for the catalyst 0.05-Ru-TiO2.
• The total pore volume and a pore radius of
[95]
58
3.1 eV for 0.05g-Ru-TiO2;
3.1 eV for 0.01g-Ru-TiO2 and
3.15 eV for 0.005g-Ru-TiO2
catalyst increased with increasing content of Ru ions in the TiO2 lattice.
• Ru-doped TiO2 catalyst structure was microporous with pore sizes in the range from 2 to 4 nm.
T: Temperature
RH: Relative Humidity
AFR: Air Flow Rate
RT: Residence Time
NA: Not Available
Table 5. Summary of the common non-metal dopants in the TiO2 photocatalyst with their operated photocatalytic conditions and maximum
efficiencies.
Contaminant (Concentration)
Photocatalyst Dopant Experimental
condition Efficiency
before doping Efficiency
after doping Band gap Remarks
Ref.
Toluene (40 ppm)
C-doped TiO2; Support: dish
C
T=25±1 ºC; RH=60%;
Lamp: Xe-lamp, 150 W (λ>425
nm)
About 5% About 58.5%
3.10 eV for TiO2 and
2.30 eV for C-TiO2-200 ºC
• C-TiO2 at post-thermal temperature of 200 ºC showed the higher activity.
• The rate constant of the pseudo-first-order reaction of C-TiO2-200 was 7.69×10⁻³ min-1 while for undoped TiO2 was 0.49×10⁻³ min-1.
• The specific surface area of undoped TiO2 and C-TiO2-200 were 118.97 and 79.11 m2/g, respectively.
• Un-doped TiO2 only absorbed the UV light, however, C-TiO2 exhibited absorption of visible light.
[98]
Toluene (40 ppm)
C-doped TiO2; Support: dish;
Method: Hydrothermal
C 0.9,
2.1, and 3.4 wt.%
T=25±1 ºC; RH= Controlled
by a CaCl2 dryer;
Lamp: Visible light, 150 W, (λ>425 nm)
5.2% for undoped TiO2 and 8.9% for
P25 (after 2 h)
2.1 wt.% C-doped TO2
81.8% (after 2 h)
3.10 eV for TiO2; 2.97 eV for 0.9 wt.%-C-TiO2; 2.90 eV for 2.1
wt.%-C-TiO2 and 2.78 eV for 3.4 wt.%-C-TiO2
• C-doped TiO2 with 2.1 wt.% showed the maximum photocatalytic activity which considered as the optimum value for carbon doping in this study.
• C-doping did not change the particles size and the crystal structure of catalysts significantly.
• The TEM images for C-doped TiO2 (2.1 wt.%) and undoped TiO2 showed the mesoporous structure which consists of the huge amount of mono-dispersed particles with a size of nearby 10-12 nm.
• C-doped TiO2 catalyst was prepared by green synthesis method.
[38]
59
Toluene (100 ppm)
C- doped TiO2;
Support: optical fiber; Method: Sol-gel and dip
coating (1 to 5 times coating,
the film thickness of
TiO2 was 1.6, 2.6, 3.2, 4.0,
4.2 µm)
C 0.2 g
carbon particle (with
average diameter less than 50 nm)
T=25 ºC; RH=30%;
AFR= 3 L/min; Lamp: Hg lamp,
(300 nm, 405 nm, 436 nm)
35-79% (during 0.5
min to 30 min)
62-94% (during 0.5
min to 30 min)
Calculated band gap: 3.07 and
2.85 eV for N -TiO2
• Photodegradation efficiency was enhanced as the TiO2 thickness film was increased from 1.6 µm to 3.2 µm. However, by increasing thickness over 3.2 µm, the efficiency was decreased as the excessive film layer prevented UV light from passing through the TiO2 film.
• The specific surface area for TiO2 film (thickness 3.2 µm) was 55 m2g-1 and for C-TiO2 was 230 m2g-1
• By-products were formic acid and ethyl ester.
[97]
Toluene (66.3 ppm)
C-doped TiO2 and Degussa
P25; Support: dish;
Method: Hydrothermal
C
T=25±1 ºC; RH=NA;
Lamp: Xe lamp, 150 W
Efficiency NA
Rate constant k= 0.0008
min-1
Efficiency NA
Rate constant k= 0.0037
min-1
NA eV for P25; 2.80 eV for C-
TiO2-500 ºC and 2.90 eV for C-TiO2-600 ºC
• The PCO of toluene followed the pseudo-first-order reaction.
• The average diameter of the TiO2 hollow spheres after calcination at 500ºC for 1 hr was 0.5-3.0 µm.
• Degussa P25 exhibited lower activity rather than C-doped TiO2.
• The superior activity of C-doped TiO2 at 500 ºC resulted of the crystal structure and the mesoporous microstructure.
• The band gap of the C-doped TiO2 was narrower than that of the pure TiO2.
[99]
BTEX (0.03 to 3.1
ppm)
S-doped TiO2 and Degussa
P25; Support: glass
S Molar ratio
Titanium isopropoxide/thiour
ea was 1:4
T=19-25 ºC; RH=10-20, 50-
60, and 80-90%; AFR=0.5-6.0
L/min; Lamp:
Fluorescent Visible light, 8
W (400-700 nm);
Intensity= 1.9 mWcm-2
About 5% for Benzene; 14% for Toluene; 13% for
Ethylbenzene; 11% for m,p-Xylene and 13% for o-
Xylene
About 41-1.3% for Benzene;
about 85-1% for Toluene;
about 97-13% for
Ethylbenzene; about 97-53%
for m,p-Xylene and
about 95-51% for o-Xylene (in the range
of 0.03 ppm to 3.1 ppm)
Calculated band gap: 3.11-1.73 eV
for S -TiO2
• By increasing the AFR from 0.5 to 6 L/min, the degradation of BTEX decreased, thus, for the lowest AFR, the decomposition efficiency was maximum.
• The degradation efficiency of toluene and benzene exhibited a great dependency on RH and the decomposition efficiency of it increased by decreasing the relative humidity.
• The efficiency of Ethylbenzene and m,p-xylene decomposition exhibited a less dependency on RH and almost equal for both 10-20% and 50-60%. Then the efficiency decreased by increasing the RH to 80-90%.
• The degradation efficiency of BTEX exhibited an increasing trend with decreasing initial concentration because of competitive adsorption between pollutant molecules on the photocatalyst surface.
[65]
60
BTEX (0.1, 0.5, 0.7, and 0.9 ppm)
S-doped TiO2; Support:
Aluminum sheet
S/Ti ratio:
0.2, 0.4, 0.8, and
1.6
T=NA; RH= 45%;
AFR=1, 2, 3, and 4 L/min;
RT= 2, 2.6, 3.9, and 7.8 s;
Lamp: Daylight (8 W);
Intensity= 2.8 mWcm-2
TiO2-AS About 2% for
Benzene; 11% for Toluene; 21% for
Ethylbenzene; and 36% for
Xylene
For S-TiO2-0.8-AS
about 34% for Benzene;
about 78% for Toluene;
about 91% for Ethylbenzene;
and about 94% for
Xylene
3.02 eV for TiO2 and
2.75 eV for S‐TiO2‐0.8‐AS
• The photocatalytic degradation efficiencies of BTEX under visible irradiation enhanced with increasing S/Ti ratios from 0.2 to 0.8, then decreased when the ratio increased to 1.6.
• The photocatalytic degradation efficiencies of all target compounds over S-TiO2-0.8-AS decreased with increasing air flow rate.
• The XRD of both S-TiO2-0.8-AS and TiO2‐AS samples showed an anatase crystal structure with a major band at 2θ= 25.2° and a rutile crystal structure with a major band at 2θ = 27.4°.
• The photocatalytic degradation efficiencies showed an increasing pattern with decreasing initial contaminant concentration.
[101]
BTEX (100 ppb)
N-doped TiO2 and Degussa
P25; Support:
Pyrex
N
T=19-25 ºC; RH=10-20, 50-
60, and 80-90%; AFR=0.5,1.0, and 2.0 L/min;
RT= 22, 11, and 5.5 s; Lamp:
Fluorescent visible light, 8
W (400-700 nm); Intensity= 1.9
mWcm-2
About 14% for Benzene;
17% for Toluene; 16% for
Ethylbenzene; 12% for m,p-Xylene and 17% for o-
xylene
About 24% for Benzene;
about 64% for Toluene;
about 93% for Ethylbenzene; about 96% for
m,p-Xylene and
about 91% for o-Xylene (AFR=0.5
L/min, RH=50-60%)
Calculated band gap: 3.11-1.73 eV
for N -TiO2
• For all three examined flow rates, the PCO degradation efficiency for ethyl benzene and o,m,p-xylenes were higher than that of toluene or benzene.
• The PCO degradation efficiency of all target compounds increased as the flow rate decreased.
• Benzene exhibited the lowest degradation. • Increasing the distance of the catalyst from the light
source led to the decrease in the light intensity in the reactor and caused a drop in the degradation efficiency of the target compounds.
[39]
Toluene (500 ppm)
N-doped TiO2, undoped TiO2,
A-287, PC105,
DegussP25, and PC103;
Support: Pyrex
N N/Ti molar
ratio of 6.6,
7.6 and 9.2
T=NA; RH=60 %;
Lamp: Solar lamp, 300 W
(380-600 nm); Intensity= 1.2×10⁻⁵
Einstein dm-3 s-1
13.7% for T9 (undoped TiO2
at pH=9) 55.8% for A-
287, 47.7% for
PC105, and 56% for P25
79.6% for TN9 (prepared
at pH=9)
Calculated band gap: 3.27-2.07 eV
for N -TiO2
• The reaction kinetics for all synthesized catalyst could be explained as a pseudo-first-order rate equation.
• The N-doped TiO2 (prepared at pH=9 has the fastest kinetics constant which value is k = 6.0×10⁻³ min-1
[24]
Acetaldehyde (600–3650 ppm)
N-doped TiO2; Method: Thermal treatment
N
T=25 ºC; RH=NA;
AFR=1000 mL/min;
88.1% for 600 ppm;
77.3% for 1000 ppm;
100% for 600 ppm;
92.1% for 1000 ppm;
3.16 eV for P25 and
2.91 eV for N-TiO2
• The absorption range of N-doped TiO2 photocatalyst was expanded to the visible range.
[100]
61
Lamp: High pressure Hg lamp, 80 W
(185–580 nm)
66.1% for 1700 ppm; 58.8% for
2200 ppm; and 51.2% for 3650 ppm
87.2% for 1700 ppm; 81.2% for
2200 ppm and 77.6% for 3650 ppm
Toluene (NA)
B-doped TiO2; Support: Pyrex;
Method: Sol- gel
Br: 1, 3, and
5 wt.%
T=70 ºC; RH=NA;
Lamp: UVC (10 W, 254 nm) and
halogen (150 W,400 nm)
92 % About 100% for B-doped
TiO2
Calculated band gap: 3.11 eV for
B-TiO2
• All samples were pure anatase TiO2 after calcination and no phase change happened during the doping process.
• In XRD pattern, the crystallite size reduced with doping B into the TiO2.
• The most characteristic feature of B-doping was that both surface area and pore volume of TiO2 were increased.
• All reactions followed pseudo first- order kinetics.
[23]
Acetaldehyde (600–3650 ppm)
F-doped TiO2; Method:
Impregnation F
T=25 ºC; RH=NA;
AFR=1000 mL/min;
Lamp: High pressure Hg lamp, 80 W
(185–580 nm)
88.1% for 600 ppm;
77.3% for 1000 ppm; 66.1% for 1700 ppm; 58.8% for
2200 ppm and 51.2% for 3650 ppm
97% for 600 ppm;
81% for 1000 ppm;
76% for 1700 ppm;
68% for 2200 ppm and
62% for 3650 ppm
3.16 eV for P25 and
3.09 eV for F-TiO2
• The F-doped TiO2 catalyst exhibited a stronger light absorption in the UV region, but did not have any significant photoactivity in visible range.
• The F-doped TiO2 reduced the recombination process of charge carrier and led to the formation of new active sites.
• The F-doped TiO2 led to increase pollutants adsorption capacity and photocatalytic activity.
• F-doped TiO2 photocatalyst had less specific surface area compared to P25, which it indicates that crystals’ growth was improved.
[100]
T: Temperature
RH: Relative Humidity
AFR: Air Flow Rate
RT: Residence Time
NA: Not Available
Table 6. Summary of the common co-doped TiO2 photocatalyst with their operated photocatalytic conditions and maximum efficiencies.
Contaminant Photocatalyst Dopant Experimental Efficiency Efficiency Band gap Remarks
62
(Concentration) condition before doping
after doping Ref.
Toluene (40 and 133
ppm)
N, C, and S tri-doped
TiO2; Support: dish
The molar ratio of Ti:R 1:0, 1:1,
1:2 and 1:3, (TCNS0,
TCNS1, TCNS2 and TCNS3)
T=25±1 ºC; RH=NA;
Lamp: Xe-lamp, 150 W
Efficiency NA
Rate constant, k (min-1) for
P25= 6.95×10⁻²
Efficiency NA
Rate constant, k (min-1)= 12.8×10⁻²
3.18 eV for TCNS0; 3.0 eV for TCNS1; 2.88 eV for TCNS2
and 2.67 eV for TCNS3
• TCNS1 (R-doped TiO2, R=1, Ti: R=1:1) showed the higher activity under UV-vis light irradiation.
• The rate constant of the pseudo-first-order reaction of TCNS0, TCNS1 under UV-vis light were 5.54×10⁻² min-1 and 12.7×10⁻² min-1
respectively. • The specific surface area of TCNS0 and
TCNS1 were 155.1 and 154.3 m2/g respectively.
[72]
Formaldehyde (200±10 ppm)
N, C, and S tri-doped TiO2
and P25
N, C, and S. The molar ratio of thiourea to
TiO2 was 0, 1, 2, 3 and 6
T= Ambient temperature;
RH=NA; Lamp: daylight
(420 nm); Intensity= 0.46 ± 0.01 mWcm-2
2% for undoped TiO2 and
5% for P25
32.6% for N, C, and S-
doped TiO2-3
3.0 eV for P25; 3.2 eV for TiO2;
2.8 eV for N-C,S-TiO2-1;
2.5 eV for N-C,S-TiO2-2;
2.4 eV for N-C,S-TiO2-3 and
2.2 eV for N-C,S-TiO2-6
• The tri-doped catalysts could be activated by visible light and more photogenerated charge carriers can be generated and participate in the photocatalytic reactions.
• The C, N, S tri-doped TiO2 catalyst caused band gap narrowing and reduced the recombination of photo-generated charge carriers and thus enhanced photocatalytic activity.
[104]
Acetaldehyde (600–3650 ppm)
F and N co-doped;
Method: Sol-gel
F and N
T=25 ºC; RH=NA;
AFR=1000 mL/min;
Lamp: High-pressure Hg lamp, 80 W
(185–580 nm)
88.1% for 600 ppm; 77.3% for 1000 ppm; 66.1% for 1700 ppm; 58.8% for 2200 ppm
and 51.2% for 3650 ppm
100% for 600 ppm;
98.2% for 1000 ppm; 94.1% for 1700 ppm; 87.1% for
2200 ppm and 80.7% for 3650 ppm
3.16 eV for P25 and 2.86 eV for F-N-
TiO2
• The absorption ranges of F and N co-doped TiO2 photocatalysts was extended to the visible light.
• The F and N co-doped TiO2 catalyst had demonstrated the highest photocatalytic activity than other catalysts.
• Doping both N and F ions caused synergy effects such a narrowing band gap, formation of new active sites and enhancement of photoactivity.
• By increasing the initial contaminant concentration in the gas phase, the number of the available active sites of the catalyst became less than the amount of the pollutants.
• The F and N co-doped TiO2 photocatalyst had less specific surface area compared to P25, which it indicates that crystals’ growth was improved.
[100]
63
Hexane and Butyl acetate
(100 ppm each) and their mixture
Ag and V co-doped TiO2;
Support: polyurethane
Ag and V (0-6 wt.%)
T=NA; RH=50 %; AFR=100 mL/min; RT= 72s;
Lamps: Two white light
lamps, 20 W (400<λ<700); Intensity= 50
mWcm-2
NA
Individual: 93.7% for
Hexane and 95.5% for
Butyl acetate
In mixture: 75% for Butyl acetate and 48 % for Hexane
3.20 eV for TiO2/PU; 3.02 eV for 6Ag/0V-
TiO2/PU; 2.91 eV for 5Ag/1V-
TiO2/PU; 2.86 eV for 4Ag/2V-
TiO2/PU; 2.79 eV for 3Ag/3V-
TiO2/PU; 2.77 eV for 2Ag/4V-
TiO2/PU; 2.81 eV for 1Ag/5V-
TiO2/PU and 2.83 eV for 0Ag/6V-
TiO2/PU
• The optimum catalyst (4Ag/2V-TiO2/PU) had combination weight ratios of 4wt% Ag/TiO2 and 2wt% V/TiO2 led to the highest BET surface area of 230.5 (m2/g).
• The surface area of the co-doped photocatalyst was also higher than that of the undoped and single-dopant photocatalysts.
• Due to the high polarity of butyl acetate, higher amount of butyl acetate was adsorbed on the surface of 4Ag/2V-TiO2/PU than hexane.
[108]
Acetone (NA)
C and Mo co-doped TiO2
and undoped TiO2 (Degussa
P25); Support: dish
Mo: 2 at. % and C: 1 at. %
T=NA; RH=NA;
Lamp: UV lamp, 125 W
and glass filter to produce
visible light
53% 76.5% Calculated band gap: 2.96 eV for C, Mo-
TiO2
• Doping a small amount of C had no obvious effect on the crystalline size, while, the crystalline size of the Mo-doped and co-doped samples were smaller than that of the undoped one.
• C and Mo enhanced both the absorption ability of visible light and promoted the separation of photogenerated charge carriers.
• The surface area and pore size of C, Mo co-doping TiO2 significantly increase compared with those for P25.
[138]
Toluene (39.8 and
132.68 ppm)
Fe and N co-doped TiO2
Fe: 0, 0.005, 0.02, 0.05, 0.1, 0.5,
1.0 and 2.0 wt.%
T=25±1 ºC; RH= 60%;
Lamp: Xe-lamp, 150 W
63% Around 97% Calculated band gap:
2.92 eV for Fe, N-TiO2
• The optimum concentration of Fe ions was 0.02wt.% for the maximum photodegradation of toluene.
• The Fe, N co-doped TiO2 catalyst demonstrated about three times higher photoactivity than that of N–TiO2 nanocrystals.
• The reused Fe/N–TiO2 photocatalyst did not demonstrate an apparent change in photocatalytic activity.
[120]
Toluene (NA)
B and Fe co-doped TiO2; Method: Sol-
gel
B: 3 wt.% Fe: 0, 0.5, 1, 3,
and 5 wt.%
T=70 ºC; RH=NA;
Lamps: UVC (10 W, 254 nm)
and halogen
Under Visible
light About
8.8% (after
Under Visible light:
About 87.9% (after 180
min)
Calculated band gap: 3.11-2.07 eV for B,
Fe-TiO2
• All samples were pure anatase TiO2 after calcination and no phase change happened during the co-doping process.
• In XRD pattern, the crystallite size reduced with
[23]
64
lamp (150, 400 nm);
Visible light emitting flux:
3.9×10⁻⁶ Einstein/s
and UV light emitting flux:
1.47×10⁻⁶ Einstein/s
180 min) doping B and Fe ions into the TiO2 and the decrease of crystallite size was more result of B-doping than with Fe-doping.
• All reactions follow pseudo first- order kinetics rate.
Toluene (800 ppmv)
S and Fe co-doped TiO2;
Support: Pyrex
Fe: 1.5% S/Ti molar
ration: 1% to 20%
T=Room temperature; RH=75%; AFR= 100 mL/min;
Lamps: UVA and simulating
sunlight, 6W for both
Efficiency NA
Reaction rate for
P25 (mol/s.m2): 3.87634×
10-10
Efficiency NA
Reaction rate for S, Fe co-doped TiO2 (mol/s.m2):
4.77957× 10⁻¹⁰
NA
• The S, Fe co-doped TiO2 catalyst has improved photoactivity compared to the single-doped Fe-TiO2 and P25 under both sunlight and UV-light irradiation.
• The XRD patterns of both S, Fe co-doped, and S-doped TiO2 were included 100% anatase crystal phase.
• In the S, Fe co-doped TiO2 catalysts, adding the S content led to a gradual increase of the BET surface area value and pore size.
• All S, Fe co-doped TiO2 catalysts showed great absorption in the visible light compared to the S-doped TiO2 catalysts.
• Generated by-product was benzaldehyde.
[87]
T: Temperature
RH: Relative Humidity
AFR: Air Flow Rate
RT: Residence Time
NA: Not Available
Table 7. Summary of the common semiconductor coupled TiO2 photocatalyst with their operated photocatalytic conditions and maximum efficiencies.
Contaminant (Concentration)
Photocatalyst Dopant Experimental
condition
Efficiency before doping
Efficiency after doping
Band gap Remarks
Ref.
Propylene (NA)
MnCO3 -TiO2 and P25;
Support: glass plate
MnCO3/TiO2 ratios: 1:10,
1.5:10, and 2:10
T=NA; RH=NA;
RT=8 min; AFR=200
mL/h;
0% for MnCO3, and 7% for P25
70%
Calculated band gap: 2.96 eV for
MnCO3 -TiO2
• MnCO3-TiO2 (2:10) exhibited the highest activity for degradation of propylene.
• The majority of MnCO3 was nanoparticle (NP) with an average size of 4–5nm.
• Comparing with P25 and MnCO3, MnCO3-TiO2
[139]
65
Lamp: Xenon lamp,500 W (λ≥420 nm); Intensity= 25
mWcm-2
represented high absorption in visible light, especially in 400–500 nm region.
• The photocatalytic degradation efficiency of the WO3–N–TNS catalysts enhanced by increasing in WO3 loading from 0.5% to 4.0%, while, a further increase in the WO3 loading to 6.0% resulted decreasing in photocatalytic efficiency.
• The deposition of WOx species on the TiO2 surface provided a higher surface area, however, the excess amount of WO3 caused partial blockage the TiO2 pores and led to the lower surface area.
• The photocatalytic degradation efficiency for pure IPA was higher than that for pure hexane.
• The photocatalytic degradation efficiency for hexane mixed with IPA, was lower than that for pure hexane, while the IPA decomposition efficiency remained relatively constant.
[106]
Toluene (NA)
Pt-SnO2-R/TiO2-
A/TiO2 and Titania
nanotubes (TNT)
Sn/Ti ratio: 2(S1), 6(S2),
10(S3), 15(S4) at. % and P1 was S3 doped with Pt (1
wt.%)
NA
Efficiency NA
CO2
production rate: 20.43
ppm/h
Efficiency NA
CO2
production rate: 113.81
ppm/h
3.13 eV for Pt-SnO2-TiO2
• The anatase phase was observed in all photocatalysts. However, the rutile and SnO2 appeared just for S3, S4, and P1 catalysts.
• The specific surface area was in the order S0 < S3 < P1, demonstrating that the number of mesoporous structures existing in the photocatalysts increased the specific surface area.
• S3 and P1 demonstrated larger pore volumes, pore diameters, more active site and better adsorption than TNT.
• By increasing the Sn/Ti ratio to 10 at. % the photocatalytic efficiency was enhanced. However, by more increasing from 10 to 15 at.% the efficiency was decreased.
[22]
Toluene (177 ppm)
xNi- TiO2-SnO2;
Method: Sol-gel and wet-impregnation
x=0.1, 0.3, and 0.5 wt% SnO2: 1 wt%
T=70 ºC; RH=NA; AFR=320 cm3/min;
Lamp: Halogen
5.7% 51% Calculated band gap: 3.11 eV for Ni-SnO2-TiO2
• All reactions for all different catalysts followed pseudo first-order kinetics as the rate of reaction for certain amount of catalyst depends only on toluene concentration.
• The rate constant for 0.3 wt% Ni–TiO2–SnO2 had the
[21]
66
lamp, 150W; Visible light emitting flux:
3.9×10⁻⁶ Einstein s-1
highest value (0.0058 min−1) among the tested catalysts.
• xNi-doped TiO2 was active in visible light while a composite of SnO2 onto the TiO2 surface further increase the efficiency of these catalysts.
• The Ni-doped TiO2 nanoparticles host SnO2 on their surface caused to reduce the recombination rate.
• TiO2 and TiO2–SnO2 catalyst were inactive under visible light irradiations
Toluene (7 ppm)
SiO2 doped TiO2;
Method: Sol-gel
Si/Ti molar ratio of
1:100, 5:100, 10:100,
15:100, and 20:100
T=NA; Humidity=1.6
g/m3; Lamp: UVA
mercury lamp, 300 W (365 nm)
69.6% for undoped TiO2 and 70.5% for
P25
90.6% NA
• The 10% SiO2 doped TiO2 fibrous catalyst calcined at 400 ºC had the highest degradation rate compared to the other catalysts.
• Based on the results 400ºC was selected as the optimum temperature to remove organic compounds.
• The surface area for SiO2 doped TiO2 ratio at 10% was 266 m2/g.
[37]
Benzene (280 ppm)
Ag3VO4 -TiO2 And pure TiO2
(TiO2 at cal. Temp:500 ºC);
Method: Hydrothermal
mass fraction of Ag3VO4 in
nanocomposites was 0.1, 0.5, 1, 2, and
5 %,
T=30±1 ºC; RH=NA; AFR= 20 cm3/min;
Lamps: Xe-arc lamp, 500 W (450<λ<900),
and Xe-arc lamp, 500 W
(λ<450)
Under visible light:
8.9%
Under solar light: 43%
Under visible light:
40%
Under solar light: 94.5%
Calculated band gap: 2.76 eV for Ag3VO4-TiO2
• By increasing the amount of Ag3VO4 in Ag3VO4/TiO2 nanocomposites, the anatase phase was increased.
• 0.5% Ag3VO4 in nanocomposites catalyst presented optimum activity for benzene degradation under visible light irradiation.
• The absorption edge and band gap of Ag3VO4 were estimated to be 560 nm and 2.2 eV.
• By increasing the amount of Ag3VO4 till 2% the BET specific surface area of Ag3VO4/TiO2 increased, and more increasing of that resulted in decreasing of the surface area.
• The specific surface area for 0.5% Ag3VO4/TiO2 nanocomposites and TiO2 were determined to be 48.98 and 28.24 m2g−1, respectively.
[36]
Benzene (NA)
CdS-TiO2; Support: fiber
glass; Method: Sol-
gel
Cd/Ti: 5.65, 7.93, 9.20, and 22.5 %
T=NA;
RH=NA; Lamp: High-
pressure mercury, 160 W
55.4% for TiO2/FGC
92.8% for 5.65%-CdS / TiO2-FGC under UV-
vis and and 32.7% for 5.65%-CdS / TiO2-FGC under
Calculated band gap: 3.11 eV for
CdS-TiO2
• By increasing the CdS amount, the photocatalytic activity of catalysts initially increased and then showed a downward trend.
• All the catalysts with different amount of CdS under visible light irradiation showed greater photocatalytic activities than TiO2-FGC.
• The recombination rate of charge carriers in CdS-TiO2 composite was effectively decreased.
[140]
67
visible
Benzene (31.3-62.6 ppb)
and Toluene (26.54-53.07
ppb)
TiO2 composite
ZnO
50% TiO2 and 50%
ZnO
T=NA; RH=NA;
AFR=0.42 -
2.54 L/min;
RT=5–30 min; Lamp: UVA
(365-400 nm); Intensity= 0.4,
0.6, and 1 mWcm-2
NA
93% of Toluene
and 78% of Benzene
Calculated band gap: 3.11 eV for
ZnO-TiO2
• The toluene and benzene degradation enhanced with increase UV light intensity in a different amount of catalyst and times.
• The removal efficiency of benzene was less than that of toluene.
• Toluene & benzene removal on TiO2/ZnO catalyst under UV light followed by first-order kinetic reactions rate.
[141]
Benzene, Toluene,
o, m and p-Xylene (BTX)
(NA)
N doped TiO2-Nb2O5
composite; Method: Sol-
gel
N: 0.49 at.% TiO2: 50
wt.% Nb2O5:50
wt.%
T=25±2 ºC; RH=NA;
Lamp: White LED (16 W)
and Black (46 W)
78.5% for TiO2 (UVA)
19% for TiO2 (Vis)
p-Xylene: 97.5% for N-
TiO2, 84.6% for N- TiO2/Nb2O5
(UVA)
62% for N-TiO2,
56% for N- TiO2/Nb2O5
(Vis)
3.18 eV for TiO2-500 ºC;
2.78 eV for N-TiO2-500 ºC; 3.28 eV for
TiO2-Nb2O5 -500 ºC and
3.02 eV for N- TiO2-Nb2O5 -500
ºC
• The photo-oxidation reactions were followed pseudo first-order kinetics.
• The N–Ti calcined at 500 ºC had the highest efficiency under UVA and visible light, with an apparent reaction rate constant of 0.0243 and 0.0076 min−1, respectively.
• According to results, the heterojunction of TiO2 and Nb2O5 was not effective for the photocatalytic performance.
• The anatase phase was detected in the TiO2-Nb2O5 mixed catalysts.
• Results showed that all the efficiencies of N-doped catalysts were better than its undoped TiO2 catalyst.
[25]
Benzene, Toluene, and
Xylenes (BTX) (100 ppm each)
N doped ZnO-TiO2
composite; Method: Sol-
gel
50 wt% of ZnO and 50 wt% of TiO2
T=25 ºC; RH=NA;
Lamp: white LED, 16 W (439.8 nm);
NA
86% for Benzene, 87% for
Toluene, and 86% for Xylene
NA eV for TiO2 3.36 eV for ZnO-TiO2-500 ºC and 2.88 eV for N-
ZnO-TiO2-500 ºC
• Doped photocatalysts exhibited higher specific surface area.
• The presence of nitrogen led to control nucleation and growth of crystallites, as well as the formation of a well-order porous structure.
• The N-doped TiO2 had visible light absorption due to the interstitial doping.
• The N-TiO2-ZnO composite caused to photosensitize ZnO in visible wavelength region and reduce recombination rate of charge carriers.
• The highest efficiency was achieved by N-TiO2-ZnO calcined at 500 ºC.