29

Project/Program BackgroundNorman Alternative Fuel ProgramNorman Grant FundingNorman CNG FleetNatural Gas Industry FactsNorman CNG Fueling StationPros & Cons of Norman ProgramReturn on Investment in NormanQ & A
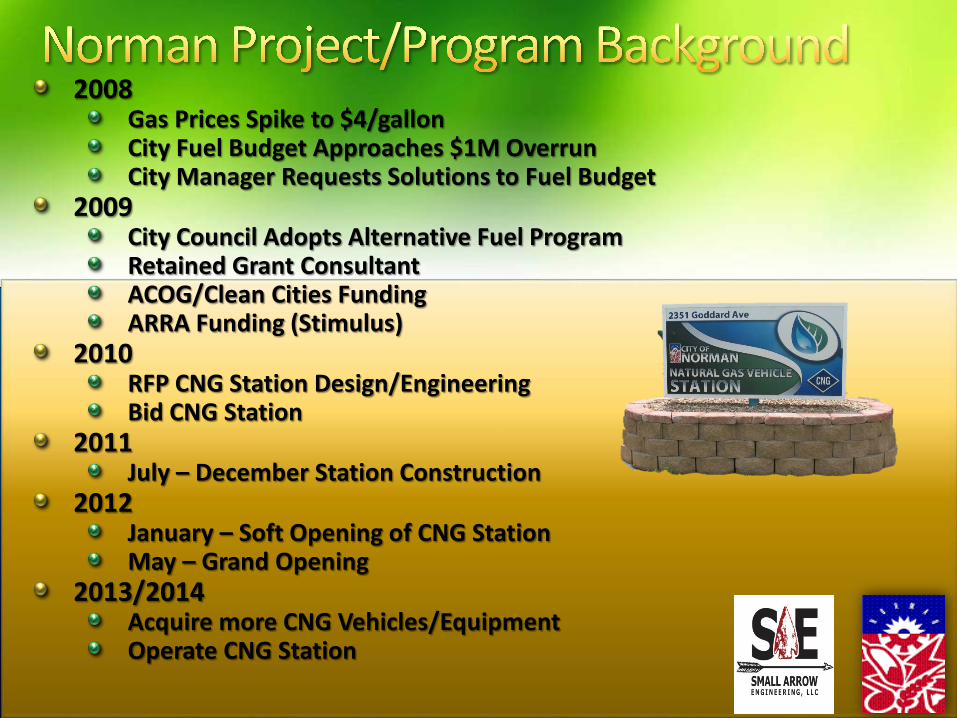
2008Gas Prices Spike to $4/gallonCity Fuel Budget Approaches $1M OverrunCity Manager Requests Solutions to Fuel Budget
2009City Council Adopts Alternative Fuel ProgramRetained Grant ConsultantACOG/Clean Cities FundingARRA Funding (Stimulus)
2010RFP CNG Station Design/EngineeringBid CNG Station
2011July – December Station Construction
2012January – Soft Opening of CNG StationMay – Grand Opening
2013/2014Acquire more CNG Vehicles/EquipmentOperate CNG Station

Adopted by City Council in October 2008City Fleet = 867 Vehicles/EquipmentRecommended AFVs – CNG & Flex FuelFull Cost Savings Realized with CNG Fueling InfrastructureAFV Grants Available131 AFVs in first five years572 AFVs (66%) in first five years if biodiesel & E85 used

2009 to DateEquipment
3 Refuse Trucks1 Field Service Truck1 Bucket Truck1 Light Duty Truck1 SUV1 Street Sweeper1 Zero Turn Mower$454,500 Total
2009 to DateCNG Infrastructure
Slow FillFast FillGrant Funding $1,629,366City Match$507,033Total Cost $2,136,400

By the End of 201411 Refuse Trucks43 Pickups 5 Sedans1 Bucket Truck2 Street Sweepers2 Mowers6 Generators
Maximum Possible Conversions - 300
Total CNG Fleet – 70
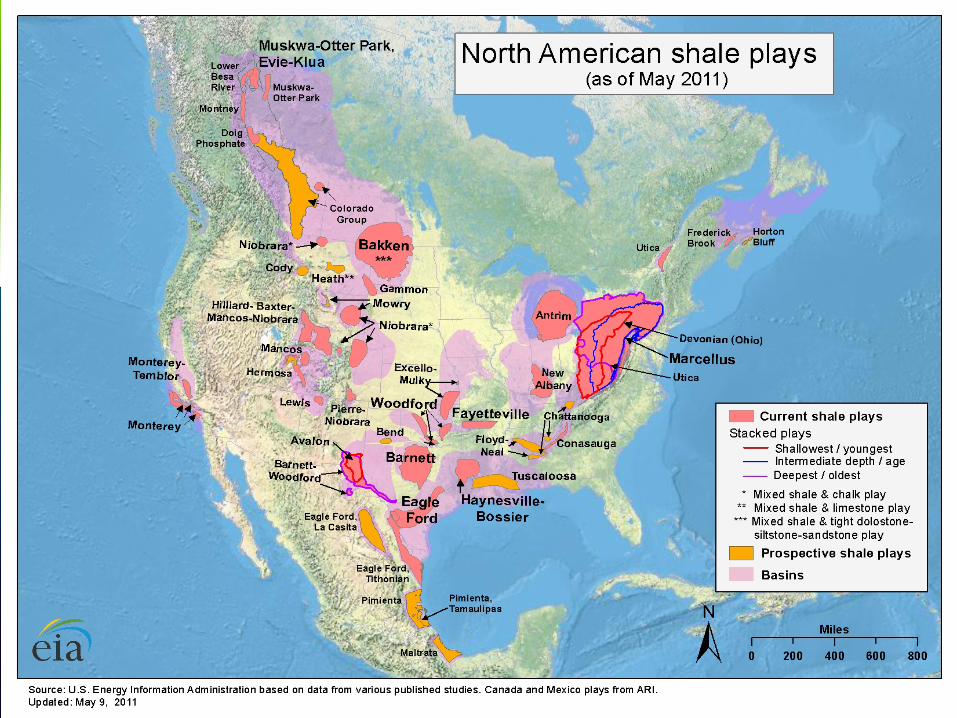


Source: U.S. Energy Information Administration
1. United States25,636
2. Russia22,757
3. Canada7,369
4. Algeria7,1055. Iran
6,3726. Norway
4,988
7. Qatar3,209
8. Saudi Arabia3,051
9. Netherlands2,961
10. Indonesia2,883
All Others45,327
Total World Production137,170

Source: U.S. Energy Information Administration
1. United States29,54215.2%
2. Russia23,0531.3%
3. Iran8,17928.4%4. Algeria
6,4489.2%
5. Canada6,30714.4%
6. Qatar5,73478.7%
7. Norway5,67313.7%
8. Saudi Arabia4,00431.2%
9. China3,81041.9%
10. Indonesia3,0877.1%
All Others45,8391.1%
Total World Production147,476
7.5%
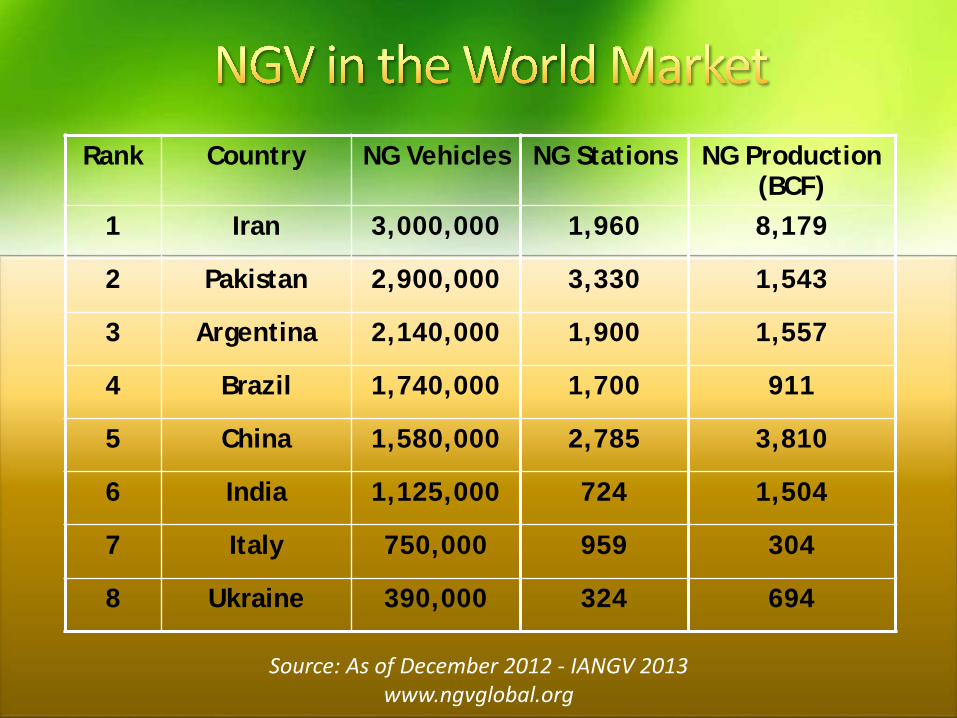
Rank Country NG Vehicles NG Stations NG Production (BCF)
1 Iran 3,000,000 1,960 8,179
2 Pakistan 2,900,000 3,330 1,543
3 Argentina 2,140,000 1,900 1,557
4 Brazil 1,740,000 1,700 911
5 China 1,580,000 2,785 3,810
6 India 1,125,000 724 1,504
7 Italy 750,000 959 304
8 Ukraine 390,000 324 694
Source: As of December 2012 - IANGV 2013 www.ngvglobal.org

Rank Country NG Vehicles NG Stations NG Production (BCF)
9 Colombia 380,000 690 1,110
10 Thailand 358,000 470 1,587
>>>
18 United States 127,735 1,120 29,542
>>>
29 Canada 12,500 47 6,307
Total World Wide 16,733,000 21,290 147,476
Source: As of December 2012 - IANGV 2013 www.ngvglobal.org
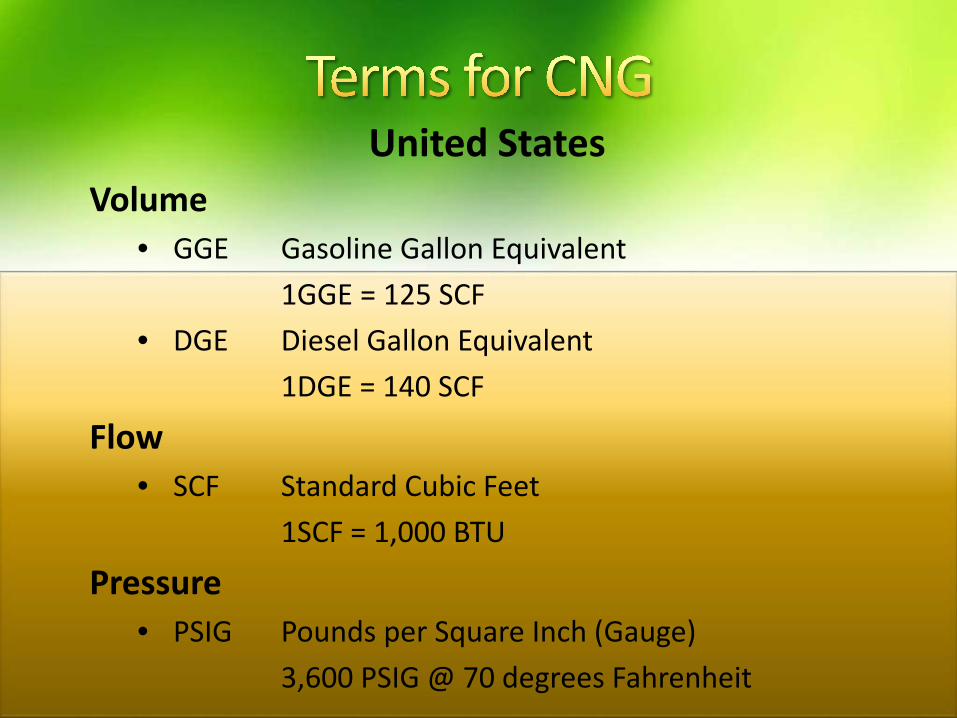
United StatesVolume
• GGE Gasoline Gallon Equivalent1GGE = 125 SCF
• DGE Diesel Gallon Equivalent1DGE = 140 SCF
Flow• SCF Standard Cubic Feet
1SCF = 1,000 BTU
Pressure• PSIG Pounds per Square Inch (Gauge)
3,600 PSIG @ 70 degrees Fahrenheit

CanadaVolume
• GLE Gasoline Liter Equivalent
Flow• NM3/H Normal Cubic Meter per Hour• SM3/H Standard Cubic Meter per Hour
Pressure• BAR
• 200 Bar ≈ 3,000 PSI• 250 Bar ≈ 3,600 PSI
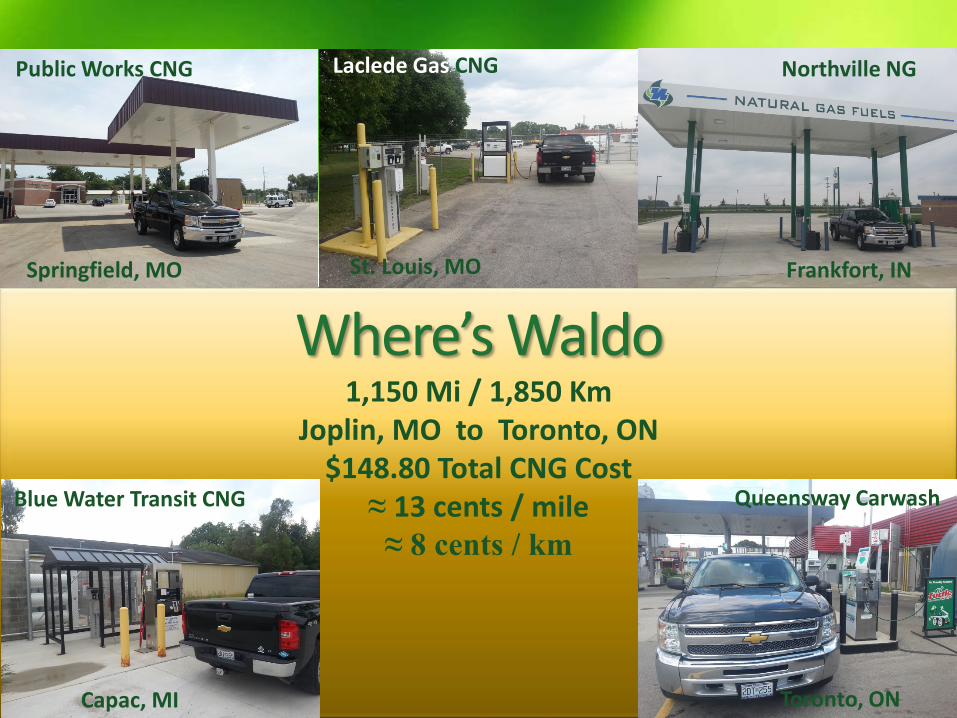
Where’s Waldo
Public Works CNG
Springfield, MO
Laclede Gas CNG
St. Louis, MO
Northville NG
Frankfort, IN
Blue Water Transit CNG
Capac, MI
Queensway Carwash
Toronto, ON
1,150 Mi / 1,850 KmJoplin, MO to Toronto, ON
$148.80 Total CNG Cost≈ 13 cents / mile
≈ 8 cents / km
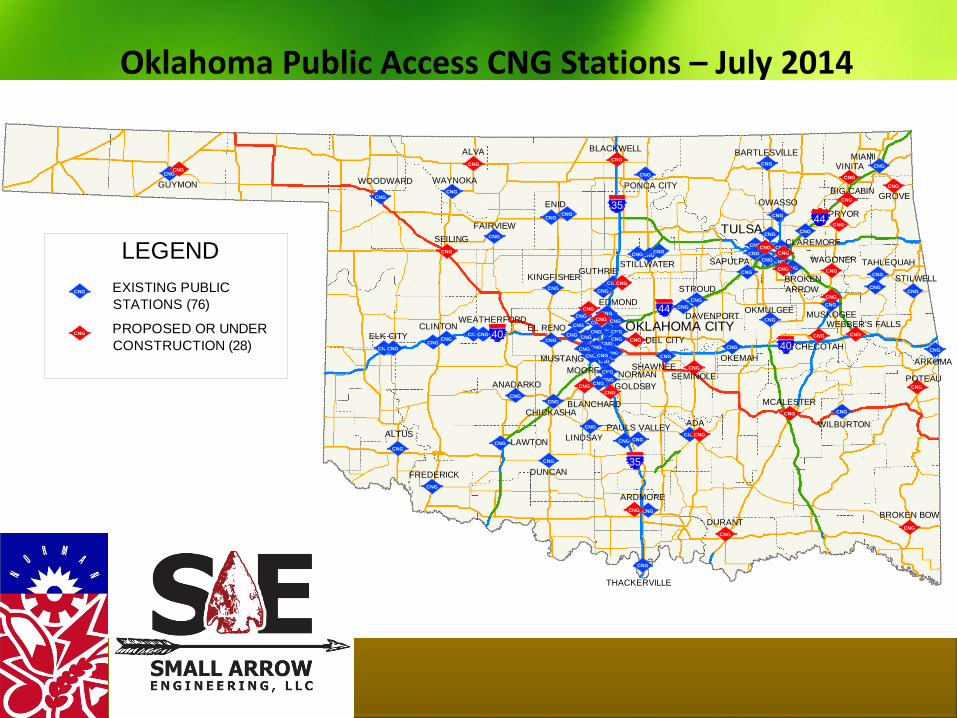
Oklahoma Public Access CNG Stations – July 2014
CNGCNG
CNG
CNG
CNG
CNG
CNG
CNG
CNG
CNG
CNG
CNGCNG
CNG
CNG
CNG
CNGCNG
CNGCNG
CNG
CNG CNG
CNG
CNGCNG
CNG
CNG
CNGCNG
CNG
CNGCNG
CNG
CNG
CNG
CNG
CNG
CNG
CNGCNG
CNGCNGCNG
CNGCNG
CNG
CNG
CNGCNGCNG
CNG
CNG
CNG
CNG
CNG
CNG
CNGCNG
CNG
CNG
CNG
CNG
CNG
CNG
CNG
CNGCNG
CNG
CNGCNG
CNG
CNG
CNGCNG
CNG
CNG
CNG
CNG
CNG
CNG
CNG
CNG
CNG
CNGCNG
CNG
CNG
CNG
CNG
CNG
CNG
CNG
CNG
CNG
CNG
CNG
CNG
CNG
CNG
CNG
CNG
CNG
CNG
BARTLESVILLE
BROKENARROW
CHICKASHA
CLAREMORE
ELK CITY
ARKOMA
ARDMORE
ANADARKO
ALTUSADA
LAWTON
EL RENODAVENPORT
CLINTON
ENID
GUYMON
MIAMI
TULSA
OKLAHOMA CITY
NORMAN
GUTHRIE
DUNCANFREDERICK
EDMOND
LINDSAY
MOOREMUSTANG
OKMULGEE
OWASSO
OKEMAH
PAULS VALLEY
SAPULPA
KINGFISHER
FAIRVIEW
DEL CITY
STILLWATER
WEATHERFORD
MCALESTER
PONCA CITY
DURANT
MUSKOGEE
SHAWNEE
STROUD
ALVA
WOODWARD
WILBURTON
WAYNOKA
THACKERVILLE
TAHLEQUAH
STILWELL
WEBBER'S FALLS
BLANCHARD
GOLDSBY
GROVE
SEILING
SEMINOLE POTEAU
VINITA
BLACKWELL
PRYOR
CHECOTAH
BROKEN BOW
BIG CABIN
WAGONER
4040
35
35
44
44
LEGENDEXISTING PUBLICSTATIONS (76)
CNG
CNG PROPOSED OR UNDERCONSTRUCTION (28)


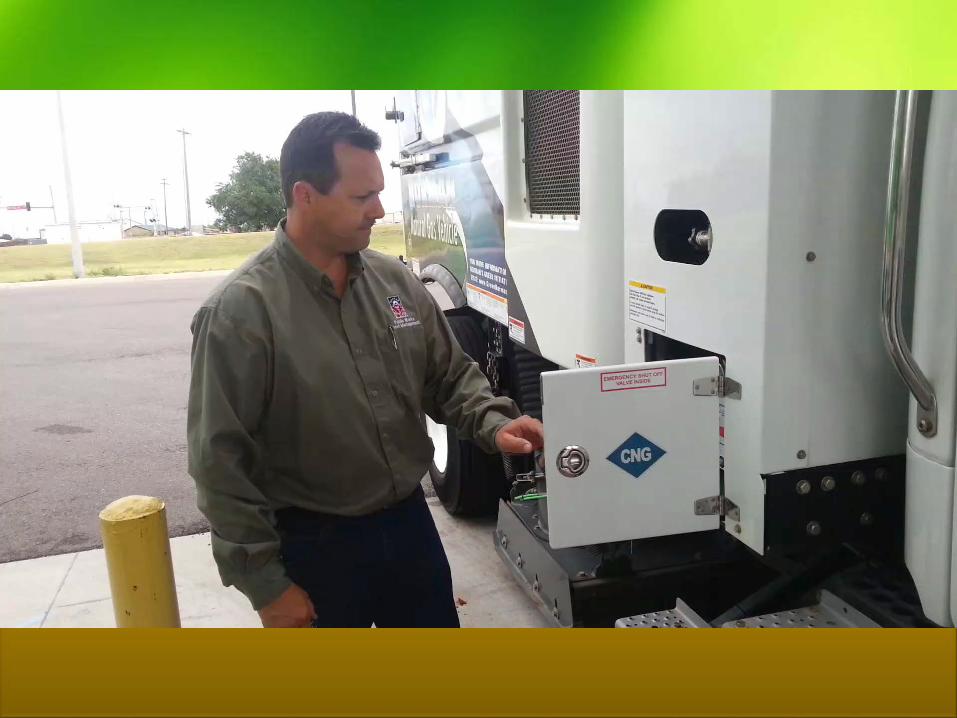
4 Fast Fill Dispensers20 Slow Fill Dual Hose Dispensers2 125 HP Compressors1 72 HP NG Drive Backup Compressor1 NG Backup Generator480 gge Available StorageOpen to the Public 24/7

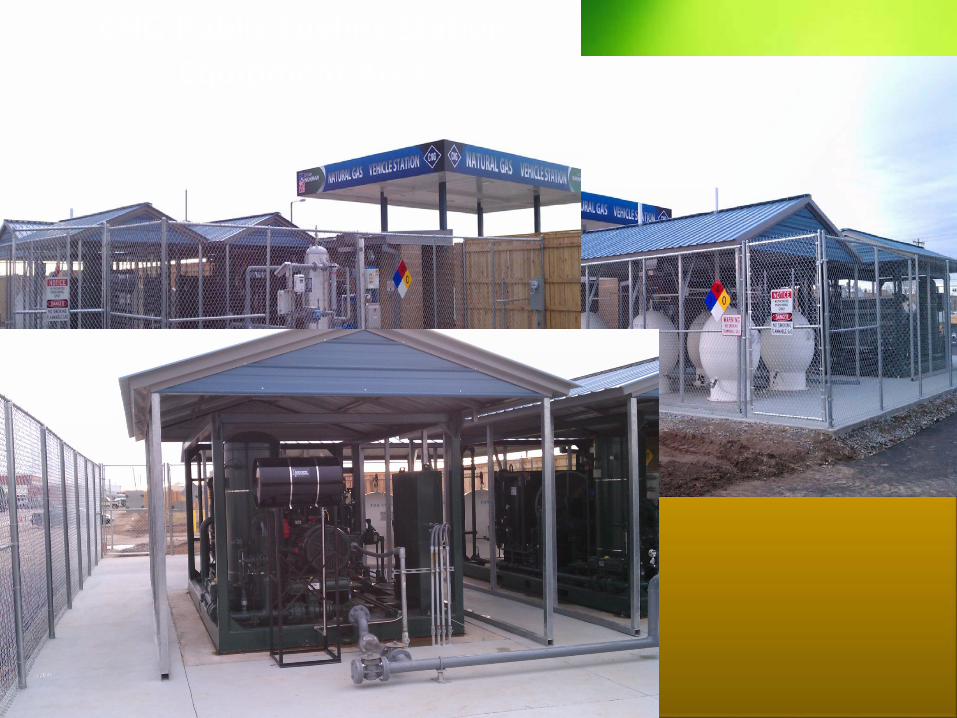
CNG Public Fueling StationEquipment Area

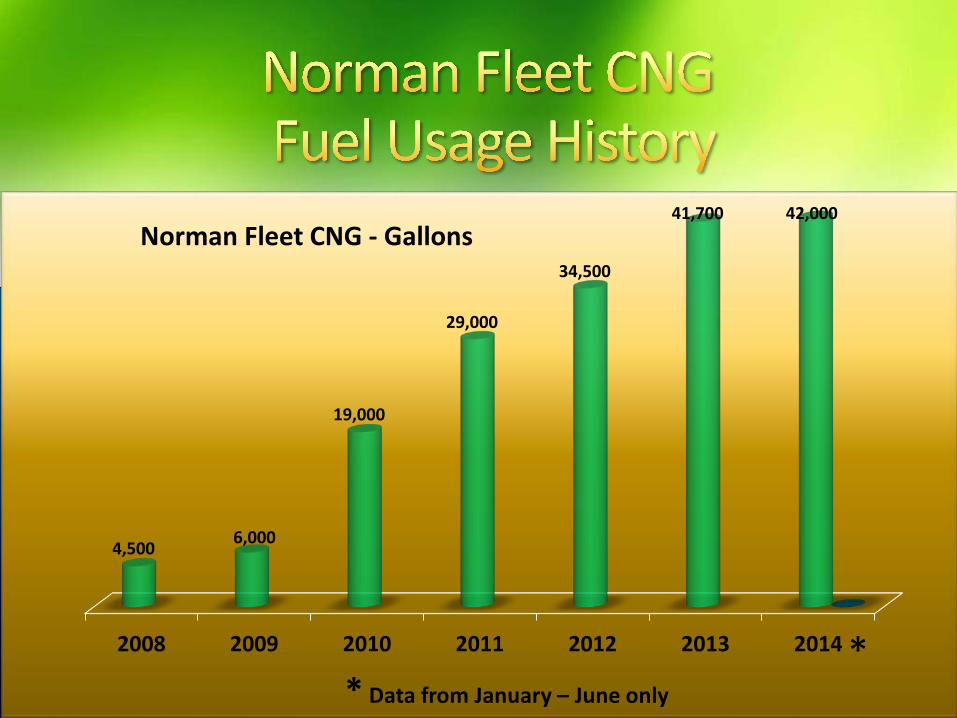
2008 2009 2010 2011 2012 2013 2014
4,500 6,000
19,000
29,000
34,500
41,700 42,000Norman Fleet CNG - Gallons
** Data from January – June only

0
5000
10000
15000
20000
25000
Jan-
12
Feb-
12
Mar
-12
Apr-
12
May
-12
Jun-
12
Jul-1
2
Aug-
12
Sep-
12
Oct
-12
Nov
-12
Dec-
12
Jan-
13
Feb-
13
Mar
-13
Apr-
13
May
-13
Jun-
13
Jul-1
3
Aug-
13
Sep-
13
Oct
-13
Nov
-13
Dec-
13
Jan-
14
Feb-
14
Mar
-14
Apr-
14
May
-14
Jun-
14
Public CNG Gallons
TOTAL SOLD GALLONS TO DATE: 321,389.072

Public Sales:
Base Price Per Gallon $0.61Maintenance $0.35Electricity $0.14Gas Transportation $0.02Depreciation and Reserve $0.25Federal Gas Tax $0.18State Gas Tax $0.05
Total Pump Price $1.60
Norman Fleet Sales:
Base Price Per Gallon $0.61Maintenance n/aElectricity $0.14Gas Transportation $0.02Depreciation and Reserve n/aFederal Gas Tax n/a State Gas Tax n/a
Total Pump Price $0.77

Refuse TruckAdditional Cost $45,000Recovery 4.3 Years
Street SweeperAdditional Cost $78,000Recovery 6.8 Years
Pickup Truck Additional Cost $10,500Recovery 5.5 Years
MowerAdditional Cost $3,600Recovery 2.5 Years
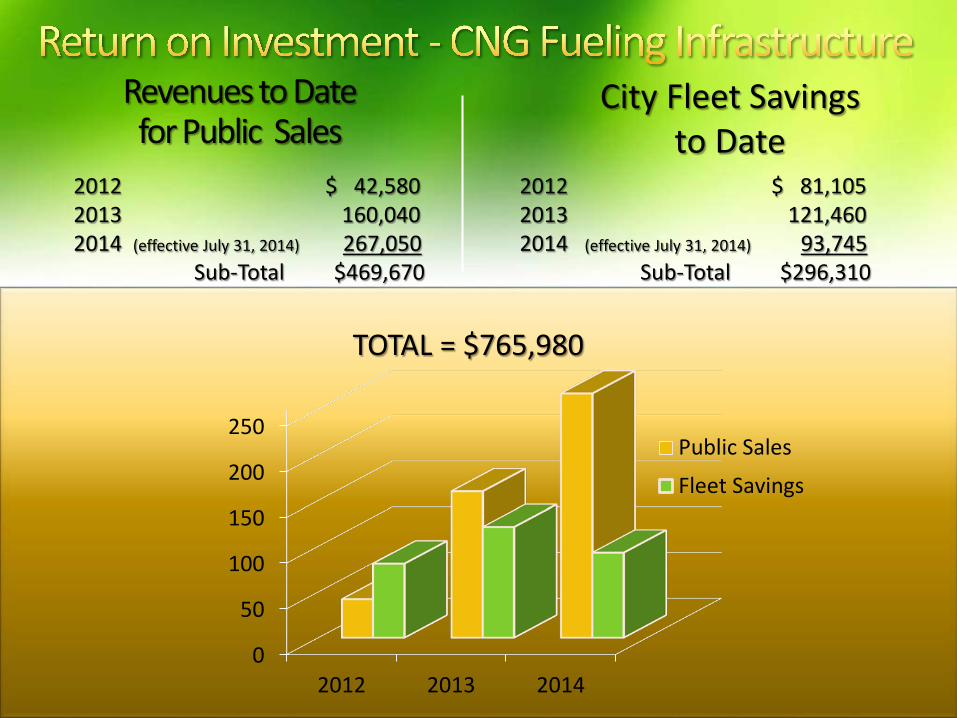
Revenues to Date for Public Sales
2012 $ 42,5802013 160,0402014 (effective July 31, 2014) 267,050
Sub-Total $469,670
City Fleet Savings to Date
2012 $ 81,1052013 121,4602014 (effective July 31, 2014) 93,745
Sub-Total $296,310
0
50
100
150
200
250
2012 2013 2014
Public Sales
Fleet Savings
TOTAL = $765,980
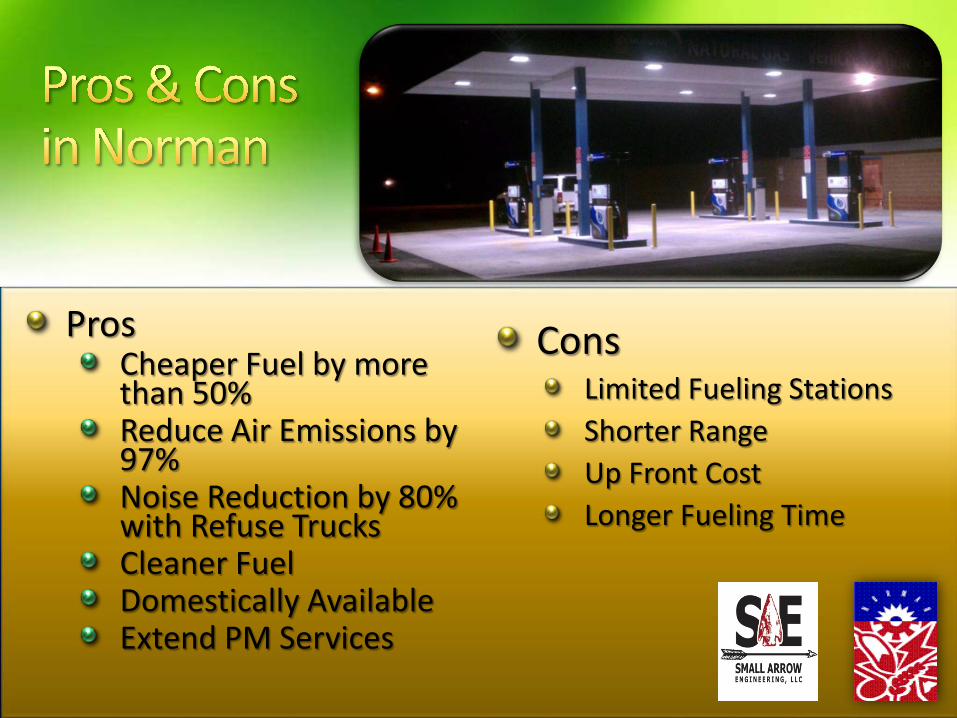
ProsCheaper Fuel by more than 50%Reduce Air Emissions by 97%Noise Reduction by 80% with Refuse TrucksCleaner FuelDomestically AvailableExtend PM Services
ConsLimited Fueling StationsShorter RangeUp Front CostLonger Fueling Time

Shawn O’Leary, P.E.Director of Public WorksCity of Norman, [email protected]
John H. Bolte, P.E., PrincipalSmall Arrow Engineering, LLCJoplin, [email protected]


