RIVM report 267002002/2006 A double-blind, randomized, placebo- controlled, cross-over study on the pharmacokinetics and effects of cannabis Tj.T. Mensinga, I. de Vries, M. Kruidenier, C.C. Hunault, I.S. van den Hengel-Koot, J.W. Fijen, M.E.C. Leenders, J. Meulenbelt This investigation has been performed by order and for the account of the Ministry of Health, Welfare, and Sport of the Netherlands, within the framework of project V/267002, A double- blind, randomized, placebo-controlled, cross-over study on the pharmacokinetics and effects of cannabis. RIVM, P.O. Box 1, 3720 BA Bilthoven, telephone: 31 - 30 - 274 91 11; telefax: 31 - 30 - 274 29 71 Contact: Tj.T. Mensinga Nationaal Vergiftigingen Informatie Centrum [email protected]
Transcript
RIVM report 267002002/2006 A double-blind, randomized, placebo-controlled, cross-over study on the pharmacokinetics and effects of cannabis Tj.T. Mensinga, I. de Vries, M. Kruidenier, C.C. Hunault, I.S. van den Hengel-Koot, J.W. Fijen, M.E.C. Leenders, J. Meulenbelt
This investigation has been performed by order and for the account of the Ministry of Health, Welfare, and Sport of the Netherlands, within the framework of project V/267002, A double-blind, randomized, placebo-controlled, cross-over study on the pharmacokinetics and effects of cannabis.
Contact: Tj.T. Mensinga Nationaal Vergiftigingen Informatie Centrum [email protected]
page 2 of 52 RIVM report 267002002
Abstract
A double-blind, randomized, placebo-controlled, cross-over study on the pharmaco-kinetics and effects of cannabis Systematic measurements of the concentration of the psycho-active substance delta-9- tetrahydrocannabinol (THC) in ‘netherweed’ cannabis obtained from coffeeshops in the Netherlands have revealed that the mean THC concentrations have steadily increased from circa 8.6% in December 1999-January 2000 to 17.7% in December 2004-January 2005. Smoking cannabis with higher THC contents (external exposure: 9.75 to 23.12% THC) was associated with a dose-related increase of the serum concentrations of THC (internal exposure). Smoking cannabis with higher THC contents was also associated with a dose-related increase of physical effects (such as increase of heart rate, and decrease of blood pressure) and psychomotor effects (such as reacting more slowly, being less concentrated, making more mistakes during testing, having decreased functioning of motor control, and having more drowsiness). Results as mentioned above were derived from a clinical study with 24 cannabis users. Key words: Human risk assessment, cannabis, tetrahydrocannabinol, THC, pharmacokinetics, physical effects, psychomotor effects
RIVM report 267002002 page 3 of 52
Het rapport in het kort
Een dubbel-blind, gerandomiseerd, placebo-gecontrolleerd, 4-weg gekruist onderzoek naar de farmacokinetiek en effecten van cannabis Systematische metingen van de concentratie van de psychoactieve stof THC in ‘nederwiet’ cannabis afkomstig van coffeeshops in Nederland, hebben laten zien dat de gemiddelde THC concentraties geleidelijk aan zijn gestegen van circa 8,6% in december 1999-januari 2000 tot 17,7% in december 2004-januari 2005. Het roken van cannabis met hogere THC-gehaltes (externe blootstelling: 9,75 tot 23,12% THC) gaat gepaard met een dosis-gerelateerde toename van de serumconcentratie van THC (de inwendige blootstelling). Het roken van cannabis met hogere THC-gehaltes vervolgens gaat tevens gepaard met een dosis-gerelateerde toename van lichamelijke effecten (zoals hartslagverhoging, bloeddruk-verlaging) en psychomotorische effecten (zoals trager reageren, concentratievermindering, het maken van meer fouten bij het testen en het slechter functioneren van de spiercoördinatie en meer slaperigheid). Bovengenoemde resultaten komen voort uit een klinische studie met 24 cannabisgebruikers. Trefwoorden: Humane risicoanalyse, cannabis, tetrahydrocannabinol, THC, farmacokinetiek, lichamelijke effecten, psychomotorische effecten
page 4 of 52 RIVM report 267002002
RIVM report 267002002 page 5 of 52
Preface
This report describes the results of the clinical study on the pharmacokinetics and effects of exposure to cannabis with high THC concentrations. To perform this study, multiple disciplines were involved. We thank the scientific review committee for their valuable contribution during the design stage of the study and during the data analysis stage of the study. The committee members are listed below:
L.A.G.J.M. van Aerts, PhD, National Institute for Public Health and the Environment W. Best, MS, Health Care Inspectorate M. de Kort, PhD, Ministry of Health, Welfare, and Sport M.W. van Laar, PhD, Trimbos Institute R.J.M. Niesink, PhD, Trimbos Institute J.G. Ramaekers, PhD, Maastricht University W.K. Scholten, PhD, Office of Medical Cannabis M.J. van de Velde, PhD, Office of Medical Cannabis Prof. F.A. de Wolff, PhD, University Medical Center Leiden M. Wouters, MS, University of Amsterdam W.M. de Zwart, MS, Ministry of Health, Welfare, and Sport
We thank the study participants for their contribution to the study and to keep to the study protocol. We thank the Office of Medical Cannabis, for supply of the precise quality of the cannabis needed for this study. We thank the National Institute on Drug Abuse (U.S.A.), for the supply of the placebo cannabis. We thank the University Medical Center Utrecht, in particular the Central Pharmacy Department, for the supply of appropriate cannabis joints for the 4-way cross-over exposures. We thank the DeltaLab, for their laboratory analyses for measurement of cannabinoid concentrations in cannabis materials and for measurements of THC and metabolites in serum. We thank the Trimbos Institute, for their expertise on cannabis smoking practices. We thank the Utrecht University, in particular the Faculty of Psychopharmacology, for their support regarding the implementation of psychomotor tests. We thank the Center for Quality Control of Chemical-Pharmaceutical Products of the National Institute for Public Health and the Environment, for their help in the design stage of the study to obtain appropriate joint preparation descriptions. The above mentioned persons and institutes contributed all to the quality of this study. Bilthoven, May 2006
page 6 of 52 RIVM report 267002002
RIVM report 267002002 page 7 of 52
Contents
Summary 9
1. Introduction 11
1.1 Background 11 1.2 Smoking practice user groups 12 1.3 Cannabis receptors and occurrence of effects 12
1.3.1 Cannabis receptors 12 1.3.2 Occurrence of effects 12
1.4 Study objectives 13
2. Materials and methods 15
2.1 Materials 15 2.1.1 Study population 15 2.1.2 Cannabis materials 15
2.2 Methods 17 2.2.1 Study protocol, design, and procedures 17 2.2.2 Data management and analysis 21
3. Results 23
3.1 Study population 23 3.2 Smoking duration 23 3.3 Pharmacokinetics 23 3.4 Effects 25
Summary Cannabis sativa L. is a leafy plant, cultivated both indoors and outdoors for the production of hemp (the stalks) and marihuana (the flowering tops). Marihuana in particular contains (pre-cursors of) the compound delta-9-tetrahydrocannabinol (THC), which is rapidly absorbed in the body during smoking. People smoke cannabis mainly for its psycho-active capabilities, with psychedelic and relaxant effects. Among the general population in Europe, cannabis is the most used illicit drug, 14-37% have used cannabis at least once. In the Netherlands, circa 5% of the population is current cannabis user. Among young subjects, 15-35 years of age, current use is specifically high, 11.8%. Over the last six years the concentration of the psycho-active compound THC in ‘netherweed’ cannabis has steadily increased from circa 8.6% in December 1999-January 2000 to 17.7% in December 2004-January 2005 (data Trimbos Institute, the Netherlands). Associated with this phenomenon, concerns have been developed about the possible implications for public health. There were no study data in the literature on the pharmacokinetics and occurrence of effects at these higher dose levels. The present study was designed to bridge that gap, using cannabis THC concentrations in joints ranging from 9.75 to 23.12 % THC. There are different smoking practice groups (Korf 2004)5. The group that is probably most at risk are relatively young blowers, who strive for the ‘strongest high’ feeling. They do not limit their consumption, tend to inhale deeply, and smoke the entire joint individually. The population in our study, adult smokers (aged 18-45 years), represent users striving to experience a ‘stable high’ feeling, with moderate psychedelic and relaxant effects. Usually, they share joints and do not finish an entire joint individually. To model for the ‘strongest-high’ practices, the participants all had to finish the entire joints within circa 22 minutes. From the results of the present study, we conclude that smoking of cannabis with higher THC concentrations (as currently sold in coffeeshops in the Netherlands) leads to higher THC concentrations in serum (the internal dose). Furthermore, we also noted that smoking of cannabis with higher THC concentrations leads to increase of the occurrence of effects. Smoking of cannabis with higher THC contents was associated with a dose-related increase of physical effects (such as increase of heart rate, and decrease of blood pressure) and psychomotor effects (such as reacting more slowly, being less concentrated, making more mistakes during performance tests, having less motor control and experience more drowsiness).
page 10 of 52 RIVM report 267002002
RIVM report 267002002 page 11 of 52
1. Introduction
1.1 Background Cannabis sativa L. is a leafy plant, cultivated both indoors and outdoors for the production of hemp (the stalks) and marihuana (the flowering tops). Marihuana in particular contains acid precursors of the compound delta-9-tetrahydrocannabinol (THC). Heating, in the process of smoking, transforms the precursors into THC. People smoke cannabis mainly for its psycho-active capabilities, with psychedelic and relaxant effects. Among the general population in Europe, cannabis is the most used illicit drug, 14-37% have used cannabis at least once.1 In the Netherlands, approximately 5% of the population is current cannabis user.2 Among young subjects, 15-35 years of age, current use is specifically high, 11.8%.2 Cannabis from outside the Netherlands, mainly grown outdoors, contains on average 5.5% THC.3 However, concerns regarding THC content in cannabis have been renewed because of recent developments in indoor hydroponic cultivation techniques.1 These efforts have enhanced the THC content in Dutch cannabis, so-called ‘netherweed’. Systematic measure-ments of THC in netherweed obtained from coffeeshops in the Netherlands (data Trimbos Institute) have revealed that the mean concentrations of THC have steadily increased from circa 8.6% in December 1999-January 2000 to 17.7% in December 2004-January 2005 (Figure 1).4 Over the years, the highest THC concentrations measured have doubled from circa 16% up to almost 30%.4
0
5
10
15
20
25
30
2000 2001 2002 2003 2004 2005
Figure 1. Percentage of THC in ‘netherweed’ (data Trimbos Institute) in recent years. Top and bottom of vertical lines represent the highest and lowest measured values. The boxes represent mean percentage values plus minus one standard deviation.
page 12 of 52 RIVM report 267002002
1.2 Smoking practice user groups If people would smoke cannabis cigarettes in the same way as they did in the past, the external dose would have increased in recent years. However, this is not true for all cannabis smoking persons. Different user types exist.5 Part of the users adapted their smoking behaviour, and smoke until they reach their desired state of ‘high’ (‘stable-high’ smokers). They usually do not finish the entire joint. This means that their exposure level has probably not changed very much. However, there are also users that do not limit their consumption, inhale deeply, and smoke the entire joint. Among users of this group, a relatively high part are young blowers. They strive for the strongest effect (‘strongest-high’ smokers). When these individuals smoke cannabis with higher THC contents, the external dose is probably higher than in the past. They are probably more at risk for receiving a higher systemic dose (internal dose). At present, it is unknown whether or not an increase of the external dose goes along with a dose-dependent increase in the internal dose. If true, we may expect an increase in the occurrence of effects. A third group of users, usually older males, use a constant amount of cannabis (‘stable-amount’ smokers). They have years of smoking experience. The three different smoking practice user groups may stand for a particular smoking practice sequence during lifetime, at younger ages starting with the strive for the strongest high, followed by a period of more controlled use, and in later years a more selected group of those who keep on smoking.5 Cannabis is most commonly smoked in the form of hand-rolled cigarettes (‘joints’). The smoking habit preference differs per country. In the Netherlands more than 95% of the users smoke cannabis mixed with tobacco.5
1.3 Cannabis receptors and occurrence of effects
1.3.1 Cannabis receptors The human body contains so-called cannabis receptors on nerve cells. These receptors are binding sites for specific chemical substances (endogenous cannabinoids) for modulation of impulse conduction. Anandamide is an example of such a cannabinoid substance produced in the body. Cannabis receptors are present in the brain and in some peripheral tissues (such as nerves in walls of arterial blood vessels). THC inhaled during smoking of cannabis has a strong capability to bind and activate the aforementioned receptors. THC’s affinity for the receptors is higher than the receptor binding of the endogenous cannabinoids.
1.3.2 Occurrence of effects Once in the blood stream, and distributed through the body, THC may induce (amongst others) the following effects:
RIVM report 267002002 page 13 of 52
• Physical effects: due to the fact that cannabis receptors are present on nerve cells inside the wall of arterial blood vessels, THC may induce a strong decrease in blood pressure (hypotension). THC may also induce a strong increase of heart rate (tachycardia).
• Psychomotor effects: under the influence of THC, brain functions necessary for an appropriate functioning in normal daily live may be influenced disadvantageously. Smokers may react more slowly, concentrate less optimally, have an impaired short term memory, make more mistakes, have less motor control and experience more drowsiness.
1.4 Study objectives It is the internal dose of THC that causes the effects. Therefore, data on the internal dose of THC from cannabis smoking are crucial in risk assessment. At present, information about the internal dose of THC is limited to cannabis exposure with low THC contents (<5%, absolute doses <39 mg when smoked pure).6-8 There are no data on pharmacokinetics and occurrence of effects at higher THC dose levels, which considerably hampers our understanding of the extent of intoxication. The present clinical study was designed to gain more insight and to give answers to the following two questions: • Does a higher THC content in cannabis (external dose) lead to a higher THC concentra-
tion in serum (internal dose)? To investigate this, we studied the pharmacokinetics of THC and its metabolites 11-OH-THC and THC-COOH after smoking joints with four different doses of THC: placebo, 9.75%, 16.38%, and 23.12% THC, respectively.
• Does a higher internal dose lead to an increase of the occurrence of effects? It concerns the nature and seriousness of the effects. To investigate this, we studied the occurrence of physical and psychomotor effects after having established higher serum THC concentrations.
page 14 of 52 RIVM report 267002002
RIVM report 267002002 page 15 of 52
2. Materials and methods
2.1 Materials
2.1.1 Study population Male volunteers (aged 18-45 years, body weight 65-95 kg) with a self-reported history of regular cannabis use (smoking 2-9 times per month) were recruited through advertisements in local and national newspapers. Prior to inclusion, subjects were screened for participation. Subjects were excluded if they had a history of psychiatric illness, respiratory disease, liver or cardiovascular disease, a severe or chronic disease, or if they used medication chronically, or if there was evidence of excessive alcohol abuse or if they used non-cannabis drugs. In the present study, we investigated males only, because THC is a highly lipophilic substance and males and females differ in their constitution with respect to adipose tissue. Furthermore, males comprise about 63% of the user population in the Netherlands.1 Participants were selected with regard to cannabis smoking frequency. On the one hand, they needed to have some cannabis smoking experience (no novices), so that they were familiar with the effects they could expect during the exposure to cannabis. On the other hand they should not be heavy users (chosen cut-off point 10 or more times per month), who might be too accustomed to THC.
2.1.2 Cannabis materials The test products consisted of cannabis cigarettes, further referred to as ‘joints’. The raw cannabis material was obtained from the Office for Medicinal Cannabis of the Ministry of Health, Welfare, and Sport in the Netherlands. Furthermore, a batch of cannabis with less than 0.003% THC (placebo) was obtained from the National Institute on Drug Abuse in the U.S.A. The test joints were prepared by the Central Pharmacy Department of the University Medical Centre Utrecht; authorized by an opium exemption to supply the test joints (Appendix1, p. 41). Although there are many different ways to prepare a cannabis cigarette, it is usually a conic shaped joint as presented in Figure 2a. A cannabis joint is usually longer than a normal cigarette. A filter tip ─ called roach ─ is situated at the small end of the joint, forming the mouthpiece. It is fabricated from a thin card strip, rolled into a little tube (Figure 2b). Roaches do not filter the smoke like a normal cigarette, but prohibit cannabis to dissolve in the oral cavity (unpleasant). Each joint was filled with 300 milligram cannabis and 700 mg tobacco. The raw cannabis material was investigated to establish the THC content concentration. For the measurements, samples of four different cannabis batches were taken (placebo, lowest, middle, and highest dose, respectively). The Central Pharmacy Department of the University Medical Center Utrecht (UMC Utrecht) produced the four cannabis batches by sieving and mixing the raw cannabis material, to get homogeneous material for exposure. The cannabis concentrations were determined (by DeltaLab, Poortugaal, the Netherlands) in sample sizes of 30 draws of 75 mg. General descriptive statistics on the results of the THC contents of the
page 16 of 52 RIVM report 267002002
raw cannabis material are shown in Table 1. The mean THC concentrations of the four different batches were sufficiently apart (0%, 9.75%, 16.38%, and 23.12%, respectively). There is no overlap between the different batches. Recalculating the percentages to milligrams, the dose levels per joint were 0 mg (placebo), 29.3 mg (lowest dose), 49.1 mg (middle dose), and 69.4 mg (highest dose), respectively. Besides THC, cannabis may also contain two other cannabinoids important to mention, cannabidiol (CBD), and cannabinol (CBN). Although CBD is not psychoactive, it may weaken or strengthen certain aspects of the experienced ‘high’. The chosen raw cannabis material should preferably contain as little CBD as possible in order not to influence the results of the study and not to hamper the interpretation of the results. Here, the mean CBD concentrations were less or equal to 0.36% (Table 1). The CBN concentrations in raw cannabis reflect the freshness of the material; preferably less than 1%, here on average up to 0.95% (Table 1).
(a)
(b) Figure 2. (a) Normal cigarette, and an example of a cannabis joint; (b) filter tip in the joint
RIVM report 267002002 page 17 of 52
Table 1. Means (±SD) of the contents of raw cannabis (%) by dose
THC CBD CBN
Dose Mean SD Mean SD Mean SD
Placebo 0.01 0.21 0.00 0.00 0.00 0.00
Lowest dose 9.75 0.77 0.32 0.02 0.64 0.05
Middle dose 16.38 1.01 0.34 0.02 0.76 0.04
Highest dose 23.12 0.89 0.36 0.01 0.95 0.04
2.2 Methods
2.2.1 Study protocol, design, and procedures Protocol: the study was carried out according to the approved protocol (review board: Ethical Committee UMC Utrecht). Each subject was informed about the possible risks and the adverse effects of exposures, and signed an informed consent document (Appendix 2). Subjects were treated according to Good Clinical Practice (GCP) conditions. The research unit is certified for GCP compliance (Appendix 3). The study was monitored to ensure that the study was conducted, recorded, and reported in accordance with Standard Operating Procedures, GCP and other applicable legislation and regulations (Appendix 4). Design: the study was a double-blind, randomized, placebo-controlled, 4-way cross-over study. Double-blind means that neither the participants nor the researchers knew which dose was given and when; to prevent that the outcomes of the study will be influenced by fore-knowledge. During study performance, the Central Pharmacy Department supplied the doses using a coded list. To prevent that the order of exposures influences the results, the dose sequences were randomly assigned to the participants. Cross-over, means that each participant receives each of the four different joints (each joint with a different THC percentage: 0, 9.75, 16.38, and 23.12, respectively). To prevent that the effects of a previous exposure influence the next exposure, a wash-out period of seven days (or more) between successive exposures was used. One of the doses was a placebo, with almost zero percent THC. In this way, it was possible to establish that smoking of other cannabis components did not distort the results of the study. During exposure to cannabis, participants were placed in a sitting position, at rest. Ascending dose phase: prior to the definitive study, a pilot study with ascending doses was performed (with a limited number of subjects) to evaluate the risks of exposure to high THC concentrations. In order to limit the health risks for participants, in the study protocol an upper limit for the heart rate was set on 170 beats per min and a lower limit for the mean arterial blood pressure was set on 55 mmHg. The enforced criteria for maximum heart rate and minimum mean arterial blood pressure were never violated. This pilot study was also used for the fine-tuning of the blood sampling scheme, psychomotor test procedures and
page 18 of 52 RIVM report 267002002
smoking procedures. It is important to uniform the exposure circumstances to cannabis for every participant in the study and at each dose level. Therefore, smoking instructions were cued by a set of tasks, shown on a monitor screen: ‘get ready’ for 3 seconds, ‘inhale’ for 2 s, ‘hold your breath’ for 3 s, ‘exhale and breath normal’ for 32 s. The whole joint needs to be smoked in circa 22 min. Procedures (serum concentration measurements): for measurement of serum concentrations, venous blood samples (10 ml) were drawn into Vacutainer® serum separator tubes (BD, USA), allowed to clot (½-2 hours), centrifuged (10 min at 1300 g), and stored at -20°C until analysis. THC concentrations were measured over time: 30 min before exposure and up to 8 hours post dose (-30, 5, 10, 15, 20, 25, 30, 42, 55 min, 1½, 2, 3, 5, and 8 hours after smoking start). The two primary metabolites of THC, 11-OH-THC and THC-COOH were also measured. The first metabolite is psycho-active, the latter one is not. Serum concentration measurements were performed by DeltaLab, Poortugaal, the Netherlands. The limits of quantitation (LOQ, defined as coefficience of variance < 15% by n=6) for THC, 11-OH-THC, and THC-COOH were 0.5, 0.5, and 1.0 μg/L, respectively. Procedures (psychomotor tests): the software package ERTS (Experimental Run Time System; Berisoft Corporation, Frankfurt, Germany) was used to perform the psychomotor tests.
Experimental Setup
ERTS was originally designed to run reliable cognitive test batteries in pharmaceutical drug studies, and supports the input of an external 4-key response pad. This pad is connected to the parallel port of a personal computer and records responses of the participants with very high timing accuracy of 0.6 milliseconds. The response pad has a build-in key-event buffer, and is therefore able to register multiple and simultaneous responses. In the tests, subjects had to respond to visual stimuli presented in the center of a monitor screen. On the evening prior to the first exposure, subjects were individually trained to perform the tests. Participants were instructed which buttons they had to press in which situation.
4-Key response pad
Parallel port
*
In the Simple Reaction Time test (performed 37 min, 3 and 5 hrs post dose, respectively), there is only one stimulus (symbol: *) and one response option. Stimuli (90 consecutive) are presented with random time interval (100-1000 milliseconds) and location (3 positions). Subjects are supposed to spot the symbol and press the response key as quickly as possible. Reaction time (RT), in milliseconds, is the outcome measure.
RIVM report 267002002 page 19 of 52
In the Selective Attention test (performed 44 min post dose), there are two stimuli (symbols: <, and >), with two corresponding response options (buttons: left, and right). The concerning symbols are presented in the middle of a set of seven symbols. Participants were instructed to only pay attention to the symbol in the middle. The total number of consecutively presented symbol sets was 120. The middle symbol was always flanked by six identical symbols (<, =, or >), three on either side. Depending on the distracting flanker symbols, there are 3 different presentation conditions: congruent (stimulus and flankers identical), neutral (flankers are = symbols), and incongruent (stimulus and flankers opposite). In the brain, due to capacity limitations, the central stimulus and flankers are processed one by one (termed selective attention). The reaction times (milliseconds) and number of mistakes are recorded.
In the Short Term Memory test (performed 60 min post dose), there are ten possible digit symbols (digits 0-9), with two response options (buttons: left and right). In comparison to the former tests, the reaction time is slower, associated with the larger number of possible stimuli. First, subjects have to memorize a set of two presented digits. Then, single digit symbols are presented sequentially. If a symbol belongs to the memorized set, subjects should press the right button, otherwise the left one. This procedure is repeated with memory sets of three, four, and five digits (112 single symbol presentations in total). The reaction times (milliseconds) and number of mistakes are recorded.
Examples of a
2-digit memory set
6 8
respectively 5-digit memory set
2 5 9 1 7
In the Motor Control test (performed 70 min post dose), muscle co-ordination was tested. The stimulus consists of a vertical bar which constantly moves across the screen, left and right, with varying speed (unstable position). The response consists of a counteracting movement with a joystick device, to keep the bar in the center position. If the bar hits an outside border (left or right), it is interpreted as loss of control (mistake). The task is repeated for three different levels of difficulty, depending on the speed and acceleration settings (instability) of the moving bar. The outcome measures were deviation from the central position over fixed time intervals (expressed in root mean square units, RMS), and number of mistakes.
page 20 of 52 RIVM report 267002002
6
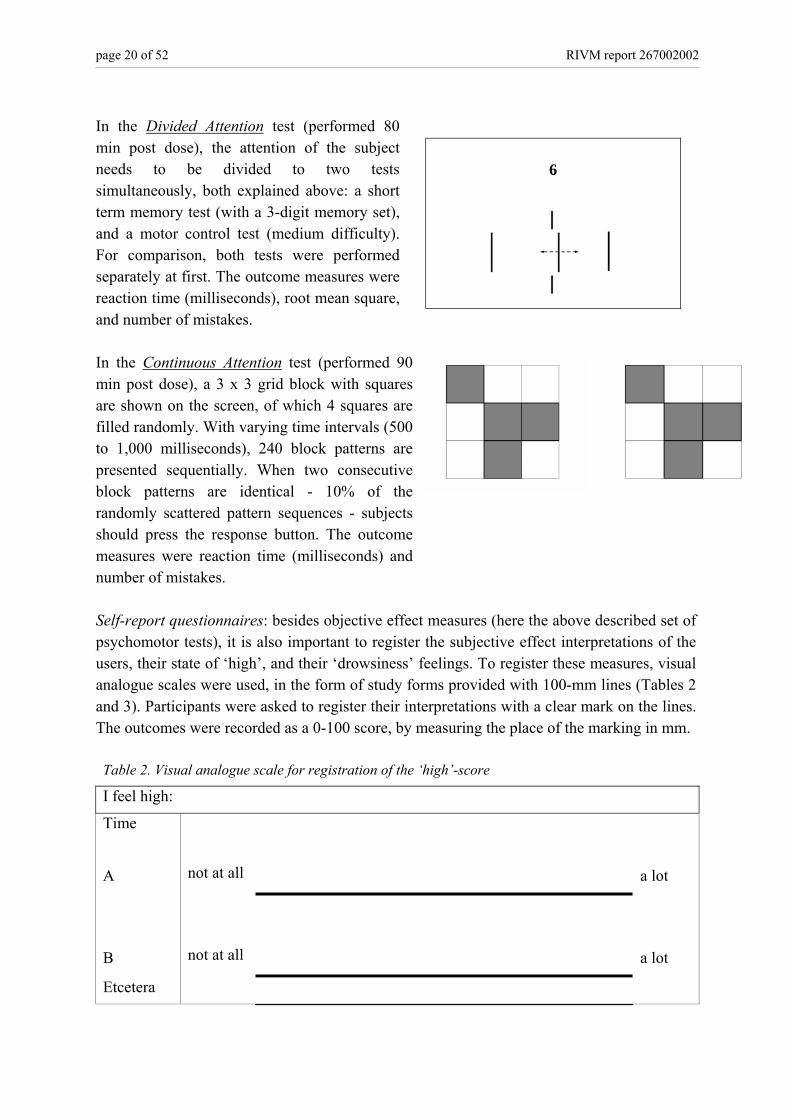
In the Divided Attention test (performed 80 min post dose), the attention of the subject needs to be divided to two tests simultaneously, both explained above: a short term memory test (with a 3-digit memory set), and a motor control test (medium difficulty). For comparison, both tests were performed separately at first. The outcome measures were reaction time (milliseconds), root mean square, and number of mistakes. In the Continuous Attention test (performed 90 min post dose), a 3 x 3 grid block with squares are shown on the screen, of which 4 squares are filled randomly. With varying time intervals (500 to 1,000 milliseconds), 240 block patterns are presented sequentially. When two consecutive block patterns are identical - 10% of the randomly scattered pattern sequences - subjects should press the response button. The outcome measures were reaction time (milliseconds) and number of mistakes.
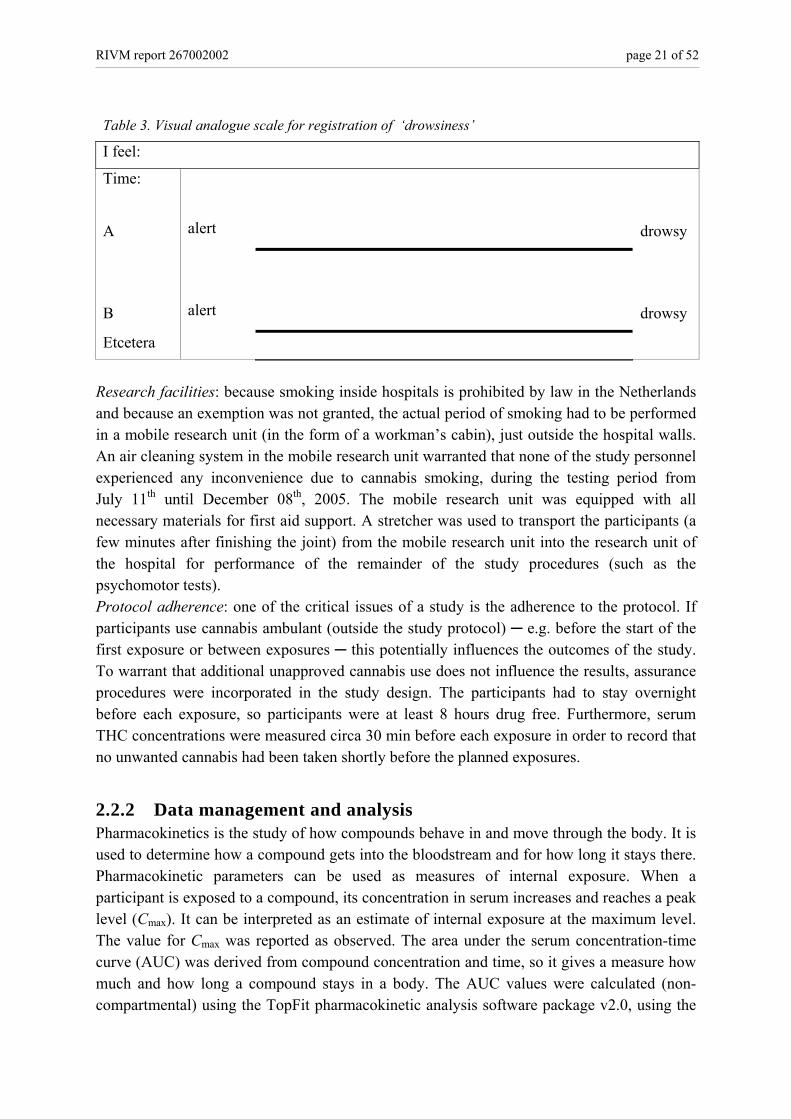
Self-report questionnaires: besides objective effect measures (here the above described set of psychomotor tests), it is also important to register the subjective effect interpretations of the users, their state of ‘high’, and their ‘drowsiness’ feelings. To register these measures, visual analogue scales were used, in the form of study forms provided with 100-mm lines (Tables 2 and 3). Participants were asked to register their interpretations with a clear mark on the lines. The outcomes were recorded as a 0-100 score, by measuring the place of the marking in mm. Table 2. Visual analogue scale for registration of the ‘high’-score
I feel high:
Time
A
not at all
a lot
B
not at all
a lot
Etcetera
RIVM report 267002002 page 21 of 52
Table 3. Visual analogue scale for registration of ‘drowsiness’
I feel:
Time:
A
alert
drowsy
B
alert
drowsy
Etcetera
Research facilities: because smoking inside hospitals is prohibited by law in the Netherlands and because an exemption was not granted, the actual period of smoking had to be performed in a mobile research unit (in the form of a workman’s cabin), just outside the hospital walls. An air cleaning system in the mobile research unit warranted that none of the study personnel experienced any inconvenience due to cannabis smoking, during the testing period from July 11th until December 08th, 2005. The mobile research unit was equipped with all necessary materials for first aid support. A stretcher was used to transport the participants (a few minutes after finishing the joint) from the mobile research unit into the research unit of the hospital for performance of the remainder of the study procedures (such as the psychomotor tests). Protocol adherence: one of the critical issues of a study is the adherence to the protocol. If participants use cannabis ambulant (outside the study protocol) ─ e.g. before the start of the first exposure or between exposures ─ this potentially influences the outcomes of the study. To warrant that additional unapproved cannabis use does not influence the results, assurance procedures were incorporated in the study design. The participants had to stay overnight before each exposure, so participants were at least 8 hours drug free. Furthermore, serum THC concentrations were measured circa 30 min before each exposure in order to record that no unwanted cannabis had been taken shortly before the planned exposures.
2.2.2 Data management and analysis Pharmacokinetics is the study of how compounds behave in and move through the body. It is used to determine how a compound gets into the bloodstream and for how long it stays there. Pharmacokinetic parameters can be used as measures of internal exposure. When a participant is exposed to a compound, its concentration in serum increases and reaches a peak level (Cmax). It can be interpreted as an estimate of internal exposure at the maximum level. The value for Cmax was reported as observed. The area under the serum concentration-time curve (AUC) was derived from compound concentration and time, so it gives a measure how much and how long a compound stays in a body. The AUC values were calculated (non-compartmental) using the TopFit pharmacokinetic analysis software package v2.0, using the
page 22 of 52 RIVM report 267002002
linear-logarithmic trapezoidal rule (up to the last concentration which is greater or equal to the limit of quantitation). Study data were entered in electronic files using double-entry verification. All statistical tests were conducted using SAS v9.1 (SAS Institute Inc., USA). A p-value less or equal to 0.05 was considered to be statistically significant. Paired t-tests were used to assess whether the means of study parameters of two exposures were statistically significantly different from each other. Performing multiple paired t-tests increases the probability to find a significant result by chance; the Bonferroni correction was therefore used to adjust for this phenomenon. Since each subject was tested four times, four datasets of outcome values were obtained per subject. These outcome values correlate with each other because they were observed in the same subject. Therefore, analysis of variance (ANOVA) with repeated measurements was chosen to analyze the data. The linear trend analyses were conducted, using a polynomial contrast specification. Reciprocal transformation was used to normalize the variables reaction time (milliseconds) and deviation from central (root mean square) in the ANOVA analyses. To correct for sphericity, all p-values derived from ANOVA were based on Huynh-Feldt’s corrected degree of freedom. The numbers of mistakes in the performance tests were analyzed using the non-parametric Friedman test, since these data were not distributed normally.
RIVM report 267002002 page 23 of 52
3. Results
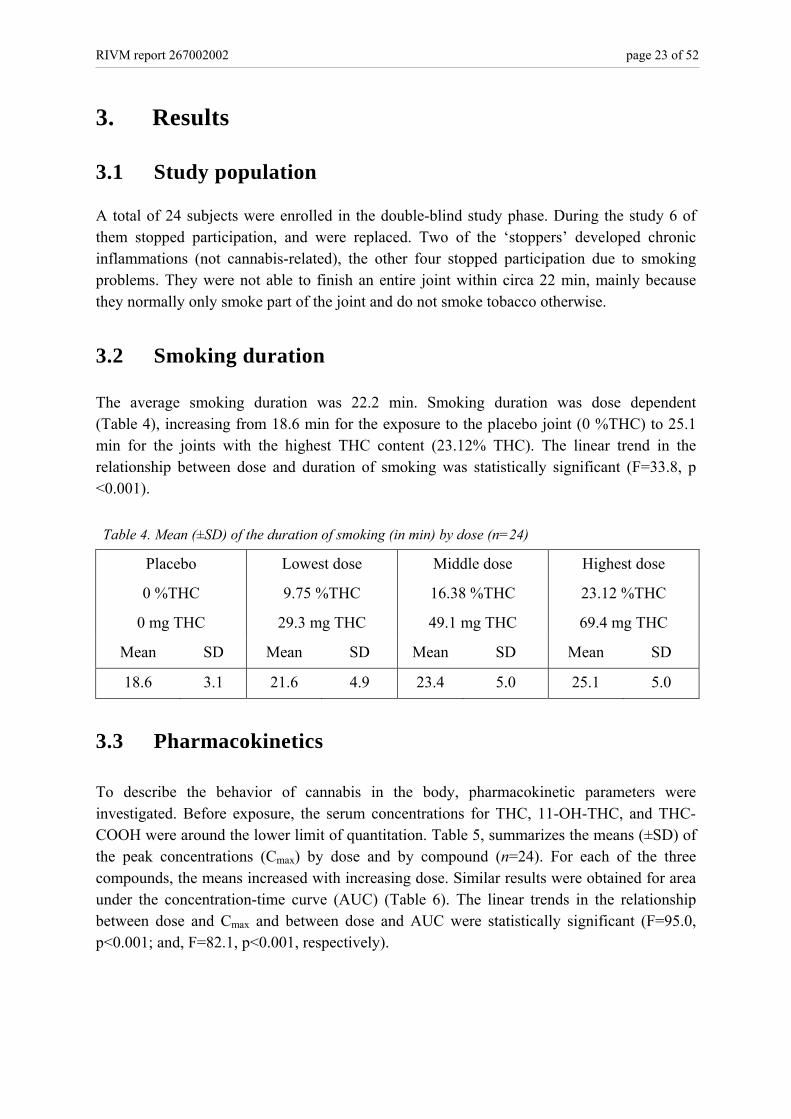
3.1 Study population A total of 24 subjects were enrolled in the double-blind study phase. During the study 6 of them stopped participation, and were replaced. Two of the ‘stoppers’ developed chronic inflammations (not cannabis-related), the other four stopped participation due to smoking problems. They were not able to finish an entire joint within circa 22 min, mainly because they normally only smoke part of the joint and do not smoke tobacco otherwise.
3.2 Smoking duration The average smoking duration was 22.2 min. Smoking duration was dose dependent (Table 4), increasing from 18.6 min for the exposure to the placebo joint (0 %THC) to 25.1 min for the joints with the highest THC content (23.12% THC). The linear trend in the relationship between dose and duration of smoking was statistically significant (F=33.8, p <0.001). Table 4. Mean (±SD) of the duration of smoking (in min) by dose (n=24)
Placebo
0 %THC
0 mg THC
Lowest dose
9.75 %THC
29.3 mg THC
Middle dose
16.38 %THC
49.1 mg THC
Highest dose
23.12 %THC
69.4 mg THC
Mean SD Mean SD Mean SD Mean SD
18.6 3.1 21.6 4.9 23.4 5.0 25.1 5.0
3.3 Pharmacokinetics To describe the behavior of cannabis in the body, pharmacokinetic parameters were investigated. Before exposure, the serum concentrations for THC, 11-OH-THC, and THC-COOH were around the lower limit of quantitation. Table 5, summarizes the means (±SD) of the peak concentrations (Cmax) by dose and by compound (n=24). For each of the three compounds, the means increased with increasing dose. Similar results were obtained for area under the concentration-time curve (AUC) (Table 6). The linear trends in the relationship between dose and Cmax and between dose and AUC were statistically significant (F=95.0, p<0.001; and, F=82.1, p<0.001, respectively).
page 24 of 52 RIVM report 267002002
Table 5. Means (±SD) of Cmax-concentrations (μg/L) by dose (n=24)
THC 11-OH-THC THC-COOH
Dose Mean SD Mean SD Mean SD
Placebo* - - - - - -
Lowest 124.7 66.3 9.5 7.7 34.5 25.1
Middle 195.5 118.5 15.2 14.2 56.0 53.1
Highest 213.5 110.8 16.4 10.2 57.0 36.5
* Means for the placebo dose were not displayed, concentrations were around the lower limit of quantitation.
Table 6. Means (±SD) of AUC values (μg*h/L) by dose (n=24)
THC 11-OH-THC THC-COOH
Dose Mean SD Mean SD Mean SD
Placebo* - - - - - -
Lowest 73.8 38.8 26.4 19.4 108.4 97.1
Middle 112.9 63.7 32.0 24.9 139.4 125.0
Highest 138.7 72.3 38.1 18.4 189.6 128.7
* Means for the placebo dose were not displayed, concentrations were around the lower limit of quantitation. As an example, the pharmacokinetics of for one of the 24 subjects (participant 24) is shown in Figure 3. This figure depicts the serum concentrations of each of the three compounds THC, 11-OH-THC, and THC-COOH for the highest dose (with 23.12% THC, 69.4 mg per joint). The figure shows that THC increases very rapidly at first, reaches its top very quickly, and subsequently decreases rapidly as well. At the highest dose level it takes about 5 hours to return to baseline. The concentrations for THC were much higher than the ones for 11-OH-THC (psycho-active), which are only slightly visible in the first hours post dose. The concentrations of the other metabolite THC-COOH (not psycho-active), reach intermediate levels, with peaks 1-2 hours post dose, and decreased much slower than the concentrations of THC (it takes more than 8 hours to return to baseline).
RIVM report 267002002 page 25 of 52
Figure 3. Serum concentrations of THC, 11-OH-THC, and THC-COOH over time for the highest dose (23.12% THC, 69.4 mg/joint) for participant 24
3.4 Effects
3.4.1 Cardiovascular measures 3.4.1.1 Heart rate Before exposure, the average heart rate of subjects was circa 74 beats per min (bpm). Because subjects were a little nervous in such a study, the mean heart rate (n=24) also rised a little in case of exposure to the placebo dose (temporarily up to ca. 100 bpm). In case of non-placebo exposures the heart rate rised more quickly and to higher levels. Table 7, summarizes the means (±SD) of change of heart rate by dose. With the term change of heart rate we refer to the difference between the highest heart rate after exposure minus the heart rate prior to exposure, calculated for each subject and dose. The data show that the heart rate generally increases with increasing dose. The linear trend in the relationship between dose and heart rate was statistically significant (F=86.2, p <0.001). The heart rate changes were also illustrated in Figure A.1 (Appendix 5). In 4 out of 72 non-placebo exposures, two different subjects, participants 2 and 12 (lowest dose, 2; middle dose, 1; and highest dose, 1) had to stop smoking temporarily because they reached the maximum limit of 170 bpm as set down in the study protocol. Both subjects were allowed to restart smoking again after a short delay, on both occasions. 3.4.1.2 Blood pressure Before exposure, the average blood pressure (BP, in mmHg) of subjects was circa 136 (systolic), circa 76 (diastolic), and circa 102 (mean arterial). Table 7, summarizes the means (±SD) of change of blood pressure (systolic, diastolic, and mean arterial) by dose. The data show that blood pressure generally decreased with increasing dose, but are not statistically different from the placebo values (with the exception of the diastolic BP for the highest dose).
page 26 of 52 RIVM report 267002002
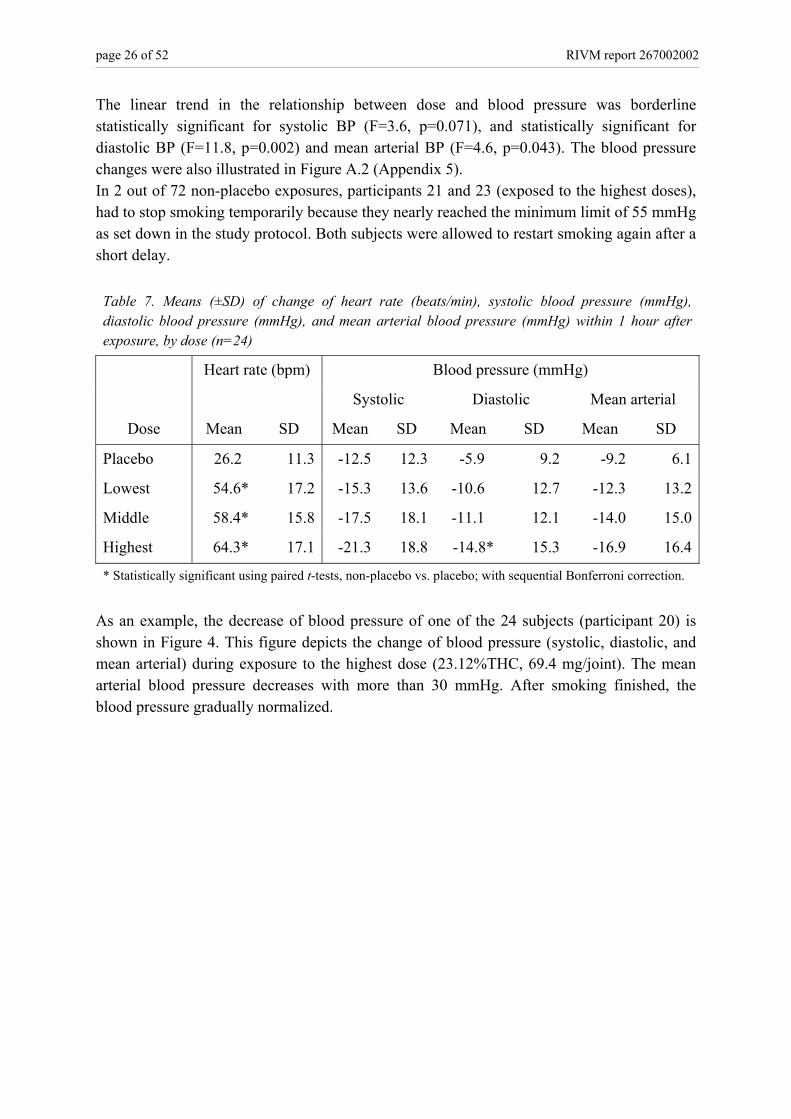
The linear trend in the relationship between dose and blood pressure was borderline statistically significant for systolic BP (F=3.6, p=0.071), and statistically significant for diastolic BP (F=11.8, p=0.002) and mean arterial BP (F=4.6, p=0.043). The blood pressure changes were also illustrated in Figure A.2 (Appendix 5). In 2 out of 72 non-placebo exposures, participants 21 and 23 (exposed to the highest doses), had to stop smoking temporarily because they nearly reached the minimum limit of 55 mmHg as set down in the study protocol. Both subjects were allowed to restart smoking again after a short delay. Table 7. Means (±SD) of change of heart rate (beats/min), systolic blood pressure (mmHg), diastolic blood pressure (mmHg), and mean arterial blood pressure (mmHg) within 1 hour after exposure, by dose (n=24)
* Statistically significant using paired t-tests, non-placebo vs. placebo; with sequential Bonferroni correction.
As an example, the decrease of blood pressure of one of the 24 subjects (participant 20) is shown in Figure 4. This figure depicts the change of blood pressure (systolic, diastolic, and mean arterial) during exposure to the highest dose (23.12%THC, 69.4 mg/joint). The mean arterial blood pressure decreases with more than 30 mmHg. After smoking finished, the blood pressure gradually normalized.
RIVM report 267002002 page 27 of 52
Figure 4. Change of blood pressure (systolic, diastolic, and mean arterial) after exposure to the highest dose (23.12% THC, 69.4 mg/joint), for participant 20. For this individual, the mean arterial blood pressure decreases with more than 30 mmHg during smoking.
3.4.2 Psychomotor measures For ease of reading, with the term post dose time, we mean the time after starting the smoking procedure; it lasts on average 22 min. After smoking, participants were transported into the research unit of the hospital for the performance of the psychomotor tests and other procedures. The first psychomotor test started around 37 min post dose (approximately 15 min after smoking finished). Table 8 shows which psychomotor tests were performed and at what post dose time: Table 8. Order of performance tests, by post dose time*
• Simple Reaction Time, 1st test 37 min • Selective Attention 44 min • Short Term Memory 60 min • Motor Control 70 min • Divided Attention 80 min • Continuous Attention 90 min • Simple Reaction Time, 2nd test 3 hours • Simple Reaction Time, 3rd test 5 hours
* Post dose time, is the time period after starting the smoking procedure. For the Simple Reaction Time (SRT) tests, performed on three post dose time points (37 min, 3 hours, and 5 hours, respectively) Table 9 summarizes the means (±SD) of the reaction time (in milliseconds) by dose. For the Selective Attention (SA) test, for three different stimulus types (congruent, neutral, and incongruent, respectively) Table 10 summarizes the means (±SD) of the reaction time (in
page 28 of 52 RIVM report 267002002
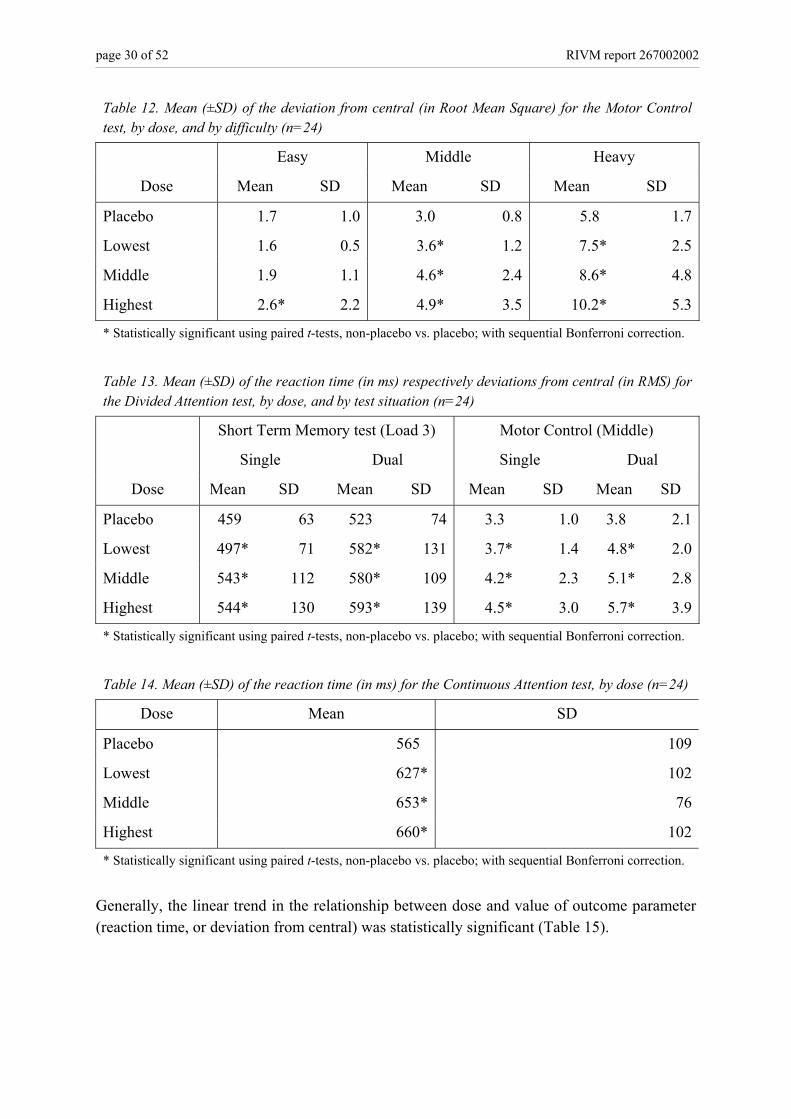
milliseconds) by dose. The terms congruent, neutral, and incongruent, refer to the three different stimulus presentation conditions. The presentation condition was congruent if the middle symbol (the one, participants were instructed to only pay attention to) was identical to the six flanker symbols. The presentation condition was neutral if the flanker symbols are = symbols. And the presentation condition was incongruent if the middle symbol and the flanker symbols were opposite. For the Short Term Memory (STM) test, for four different memory set loads (2, 3, 4, and 5 digits, respectively) Table 11 summarizes the means (±SD) of the reaction time (in milliseconds) by dose. The procedures of this test in short, it starts with the presentation of 2 digits which participants have to memorize. Then, single digit symbols are presented sequentially. If a symbol belongs to the memorized set, subjects should press the right button, otherwise the left one. This procedure is repeated with memory sets of three, four, and five digits. For the Motor Control (MC) test, for three different test difficulties (easy, middle, and heavy, respectively) Table 12 summarizes the means (±SD) of the deviation from central (in root mean square) by dose. The procedures of this test in short, participants have to counteract the movement of the vertical bar presented on screen with a joystick device. The task is repeated for three different levels of difficulty, depending on the speed and acceleration settings (instability) of the moving bar. For the Divided Attention (DA) test, for single respectively dual task circumstances, Table 13 summarizes the means (±SD) of the reaction time (in ms) respectively deviation from central (in root mean square) by dose. The performance of this test starts with the performance of a single test, a Short Term Memory test with a memory set of 3 digits, followed by the performance of another single test, a Motor Control test with middle difficulty. Finally, both of these tests were performance simultaneously. And finally, for the Continuous Attention (CA) test Table 14 summarizes the means (±SD) of the reaction time (in milliseconds) by dose. The procedures of this test in short, 240 block patterns are presented sequentially. When two consecutive block patterns are identical, participants should press the response button. Generally, the data show that the value of the outcome parameters (reaction time or the deviation from central) increases with increasing dose. Figures A.3 - A.9 (Appendix 5), show the data on the performance tests in a graphical form.
RIVM report 267002002 page 29 of 52
Table 9. Mean (±SD) of the reaction time (in ms) for the Simple Reaction Test, by dose, and by time of test performance (n=24)
37 min post dose 3 hours post dose 5 hours post dose
Dose Mean SD Mean SD Mean SD
Placebo 229 28 231 28 228 25
Lowest 253* 47 255* 42 246* 44
Middle 253* 38 267* 46 262* 61
Highest 264* 60 272* 48 252* 43
* Statistically significant using paired t-tests, non-placebo vs. placebo; with sequential Bonferroni correction.
Table 10. Mean (±SD) of the reaction time (in ms) for the Selective Attention test, by dose, and by stimulus type (n=24)
Congruent Neutral Incongruent
Dose Mean SD Mean SD Mean SD
Placebo 352 68 358 69 412 89
Lowest 388* 137 387* 107 441* 157
Middle 380* 84 384* 87 435* 105
Highest 399* 127 399* 129 463* 193
* Statistically significant using paired t-tests, non-placebo vs. placebo; with sequential Bonferroni correction.
Table 11. Mean (±SD) of the reaction time (in ms) for the Short Term Memory test, by dose, and by load (n=24)
Load 2 Load 3 Load 4 Load 5
Dose Mean SD Mean SD Mean SD Mean SD
Placebo 419 134 433 107 485 135 539 168
Lowest 469* 165 494* 166 562* 203 644* 242
Middle 482* 206 510* 174 587* 205 663* 267
Highest 476* 160 534* 201 619* 222 685* 299
* Statistically significant using paired t-tests, non-placebo vs. placebo; with sequential Bonferroni correction.
page 30 of 52 RIVM report 267002002
Table 12. Mean (±SD) of the deviation from central (in Root Mean Square) for the Motor Control test, by dose, and by difficulty (n=24)
Easy Middle Heavy
Dose Mean SD Mean SD Mean SD
Placebo 1.7 1.0 3.0 0.8 5.8 1.7
Lowest 1.6 0.5 3.6* 1.2 7.5* 2.5
Middle 1.9 1.1 4.6* 2.4 8.6* 4.8
Highest 2.6* 2.2 4.9* 3.5 10.2* 5.3
* Statistically significant using paired t-tests, non-placebo vs. placebo; with sequential Bonferroni correction.
Table 13. Mean (±SD) of the reaction time (in ms) respectively deviations from central (in RMS) for the Divided Attention test, by dose, and by test situation (n=24)
Short Term Memory test (Load 3) Motor Control (Middle)
Single Dual Single Dual
Dose Mean SD Mean SD Mean SD Mean SD
Placebo 459 63 523 74 3.3 1.0 3.8 2.1
Lowest 497* 71 582* 131 3.7* 1.4 4.8* 2.0
Middle 543* 112 580* 109 4.2* 2.3 5.1* 2.8
Highest 544* 130 593* 139 4.5* 3.0 5.7* 3.9
* Statistically significant using paired t-tests, non-placebo vs. placebo; with sequential Bonferroni correction.
Table 14. Mean (±SD) of the reaction time (in ms) for the Continuous Attention test, by dose (n=24)
Dose Mean SD
Placebo 565 109
Lowest 627* 102
Middle 653* 76
Highest 660* 102
* Statistically significant using paired t-tests, non-placebo vs. placebo; with sequential Bonferroni correction.
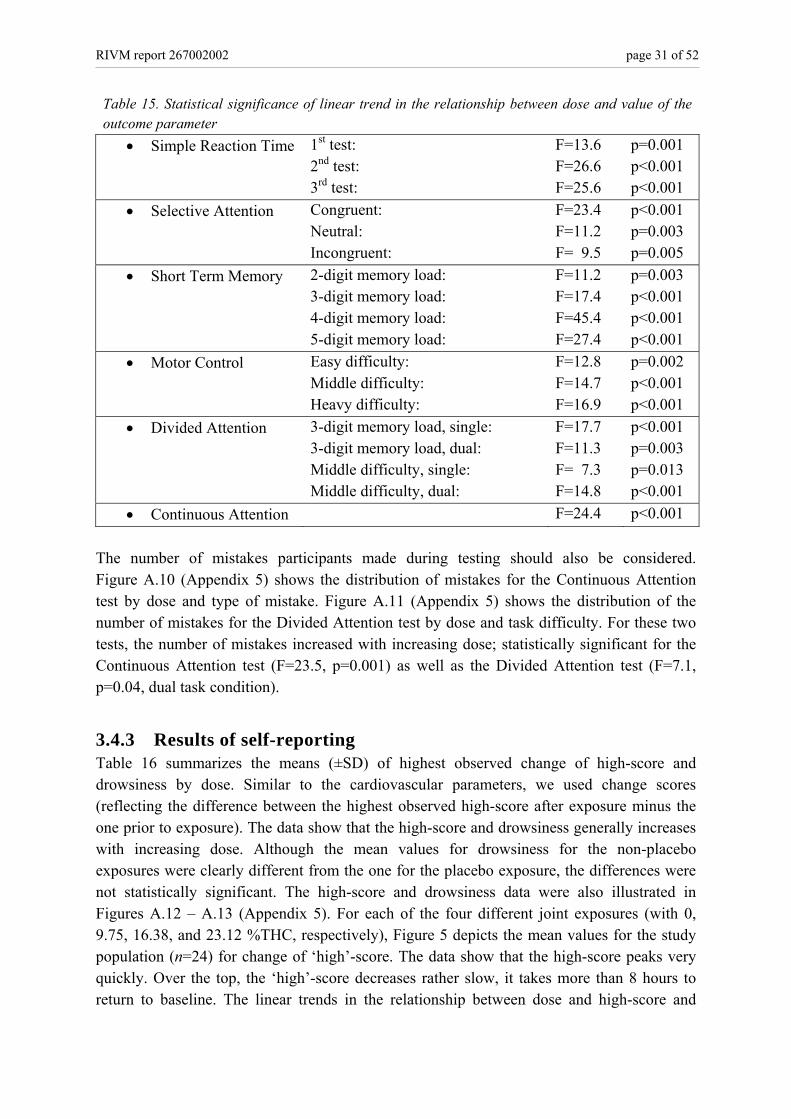
Generally, the linear trend in the relationship between dose and value of outcome parameter (reaction time, or deviation from central) was statistically significant (Table 15).
RIVM report 267002002 page 31 of 52
Table 15. Statistical significance of linear trend in the relationship between dose and value of the outcome parameter
• Simple Reaction Time 1st test: 2nd test: 3rd test:
• Continuous Attention F=24.4 p<0.001 The number of mistakes participants made during testing should also be considered. Figure A.10 (Appendix 5) shows the distribution of mistakes for the Continuous Attention test by dose and type of mistake. Figure A.11 (Appendix 5) shows the distribution of the number of mistakes for the Divided Attention test by dose and task difficulty. For these two tests, the number of mistakes increased with increasing dose; statistically significant for the Continuous Attention test (F=23.5, p=0.001) as well as the Divided Attention test (F=7.1, p=0.04, dual task condition).
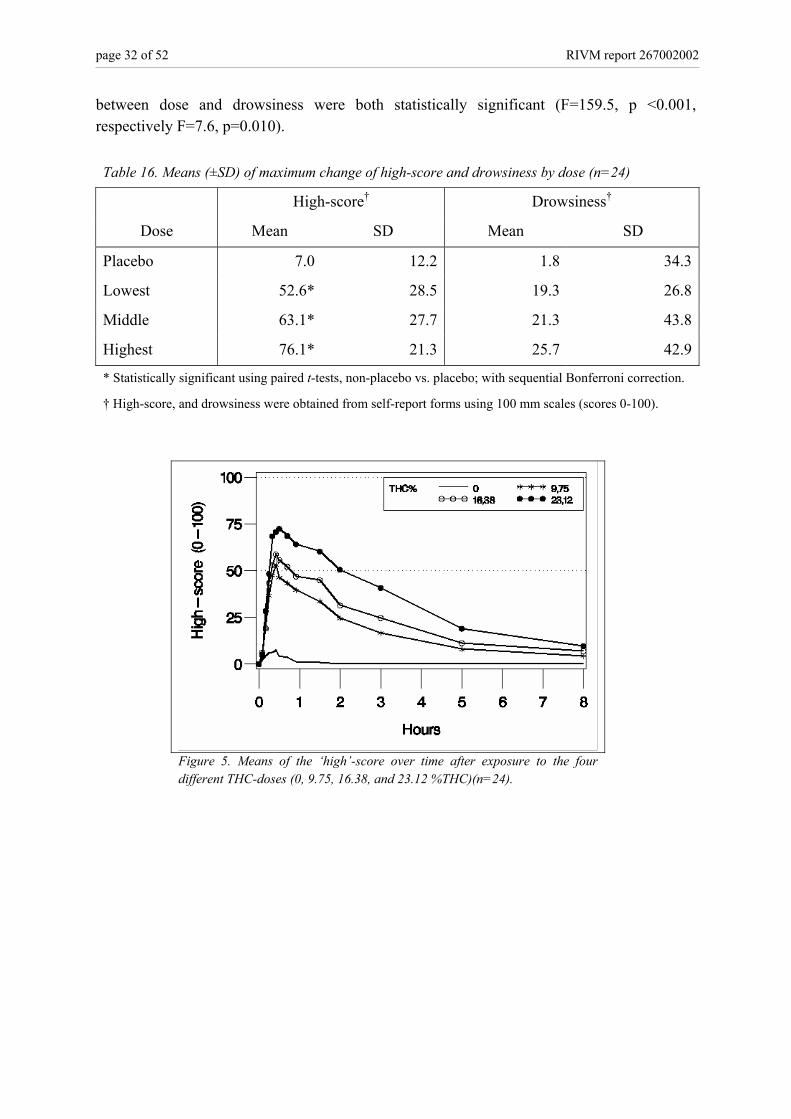
3.4.3 Results of self-reporting Table 16 summarizes the means (±SD) of highest observed change of high-score and drowsiness by dose. Similar to the cardiovascular parameters, we used change scores (reflecting the difference between the highest observed high-score after exposure minus the one prior to exposure). The data show that the high-score and drowsiness generally increases with increasing dose. Although the mean values for drowsiness for the non-placebo exposures were clearly different from the one for the placebo exposure, the differences were not statistically significant. The high-score and drowsiness data were also illustrated in Figures A.12 – A.13 (Appendix 5). For each of the four different joint exposures (with 0, 9.75, 16.38, and 23.12 %THC, respectively), Figure 5 depicts the mean values for the study population (n=24) for change of ‘high’-score. The data show that the high-score peaks very quickly. Over the top, the ‘high’-score decreases rather slow, it takes more than 8 hours to return to baseline. The linear trends in the relationship between dose and high-score and
page 32 of 52 RIVM report 267002002
between dose and drowsiness were both statistically significant (F=159.5, p <0.001, respectively F=7.6, p=0.010). Table 16. Means (±SD) of maximum change of high-score and drowsiness by dose (n=24)
High-score† Drowsiness†
Dose Mean SD Mean SD
Placebo 7.0 12.2 1.8 34.3
Lowest 52.6* 28.5 19.3 26.8
Middle 63.1* 27.7 21.3 43.8
Highest 76.1* 21.3 25.7 42.9
* Statistically significant using paired t-tests, non-placebo vs. placebo; with sequential Bonferroni correction.
† High-score, and drowsiness were obtained from self-report forms using 100 mm scales (scores 0-100).
Figure 5. Means of the ‘high’-score over time after exposure to the four different THC-doses (0, 9.75, 16.38, and 23.12 %THC)(n=24).
RIVM report 267002002 page 33 of 52
4. Discussion
The present investigation was designed and performed to evaluate the pharmacokinetics and effects of acute cannabis exposure. As far as we know, THC serum concentrations and effects were never before assessed for smoking joints with THC content concentrations of 40 milligram and above. The THC serum concentration was increased with increasing external dose of THC during the 3-5 hours post smoking. A linear trend was observed between the external dose (% THC in the joint smoked by the subject) and the maximum THC peak serum concentration measured. This means that there was an overall increase in the THC peak serum concentration (Cmax) as the THC concentration of the joint increased. Similarly, a linear trend was observed between external dose and the area under the serum concentration-time curve (AUC). The maximum THC concentrations observed in the present study were much higher than reported in literature about acute cannabis exposure. In the present study, the maximum THC serum concentration was higher than 200 ng/mL, in 25 out of the 72 non-placebo exposures (35%). Physical and psychomotor effects were observed, both associated with binding of THC to cannabis receptors in the human body. Regarding the physical effects, if THC activates cannabis receptors on nerves of arterial blood vessel walls, dilatation of the blood vessel may occur. If the human body does not counteract, than decrease of blood pressure and insufficient blood volume is inevitable. As a consequence, organs are deprived of sufficient food and oxygen. This is a situation that may only exist for a brief period of time. To accomplish that the blood volume will be at an appropriate level, the heart rate may accelerate. This effect was observed during the study. Significant changes in heart rate were observed across doses between pre and post smoking time. The relationship between heart rate and cannabis exposure was dose-related. This means that significant differences in heart rate were observed between the four doses (placebo, lowest, middle, and highest, respectively) and that the heart rate increased with increasing dose. In 4 out of 72 non-placebo exposures, two subjects reached the maximum limit of 170 bpm as set down in the study protocol and had to stop smoking temporarily for safety reasons. The largest changes in heart rate observed during the study are therefore not the maximum changes that could occur in reality. Blood pressure drops can be observed when compensation mechanisms fail. In the study, a significant change in diastolic blood pressure was observed for the highest dose between pre and post time, with a dose-effect relation between diastolic and mean arterial blood pressure and cannabis exposure. In 2 out of 72 non-placebo exposures, two subjects were asked to stop smoking temporarily because of blood pressure drop. Disturbed psychomotor performance and psychological effects were also observed. Subjects had significantly worse motor control, performed significantly more slowly and made significantly more mistakes in tests assessing divided and continuous attention. These effects were qualitatively similar to those reported in other studies but the impairment observed in
page 34 of 52 RIVM report 267002002
this study was quantitatively more important or observed at a lower level of difficulty with the middle and high doses. For instance, the easiest level of the motor control test was significantly impaired with the highest dose (69.4 mg THC) whereas it was not affected in a previous study in which the maximum THC exposure was 39 mg.8 In the same way, even the Simple Reaction Time test was impaired in our study whereas reported as unaffected in a previous study in which the maximum THC exposure was 35.5 mg.9 Besides, the impairment in the Simple Reaction Time test was still significant at 3 and 5 hours post dose. Subjective effects were also observed. The ‘high’-score increased significantly with increasing dose. In comparison with previous studies from the literature however, the nice feeling of ‘high’ changed very often in an unpleasant ‘stoned’ feeling with the high dose. Also, subjects tended to become drowsier with increasing dose of cannabis, until 5 hours post smoking (significant linear trend). What do these outcomes mean for the health of an individual? Concerning heart rate, healthy individuals can cope with a heart rate up to 200 beats per min, as also may happen during intensive sport activities. However, individuals with pre-existent heart complaints may be more at risk for dysfunction of high heart rates. Blood pressure drop is generally more serious since the brain in particular, is deprived of sufficient oxygen and food. As a result, the individual may loose consciousness, and may no longer be able to stand upright. Rapid recovery can usually be accomplished by putting the subject in a backward position, with legs upward. In that case, effects are only temporary. It should however be noticed that the individual concerned, as a consequence of diminished consciousness, may fall and suffer injury. Furthermore, it should be noted, that the time point of diminished consciousness may set the risk. In traffic situations this may be highly dangerous. Finally, it can not be excluded that some individuals with pre-existent cardiac disease may be at risk during a relevant blood pressure drop. The psychomotor effects observed in the study mean that under the influence of THC, brain functions necessary for an appropriate functioning in normal daily live activities are usually impaired. After acute exposure to cannabis, an individual reacts more slowly, with less optimal concentration, impaired short term memory and less motor control. To drive a vehicle in this situation is potentially dangerous, for the subject himself or for other persons. To evaluate the risk of smoking cannabis with higher THC contents, it is necessary to discuss the existence of three different habits in the Netherlands5: the ‘stable amount smokers’, the ‘strongest high smokers’ and the ‘stable high smokers’. The ‘stable high smokers’ are adults who smoke mainly in weekends, and often share a joint with 2-3 friends. They usually adjust their practice of smoking dependent of the strength of the joint and strive for a ‘stable high’. As soon as they reach that state of body and mind, they stop smoking. After several hours, when the state of high has returned to baseline, they may smoke another piece of joint. The ‘strongest high smokers’ strive for the strongest effect. This kind of blower exhibits risk behaviour. A relatively large part of this user group consists of adolescents and young adults. They tend to inhale deeper and individually smoke an entire joint without interruption. In respect to this group, the present results may underestimate the effects of cannabis exposure. The ‘stable amount smokers’ usually smoke alone. These users mainly consist of older experienced smokers with fixed smoking patterns, hardly influenced by the strength of the
RIVM report 267002002 page 35 of 52
joints. Although they are exposed to higher levels of cannabis, their risk for acute intoxication is probably small. The enrolled participants represent a subgroup of the ‘stable high smokers’. For safety reasons, the participants had to have sufficient user experience. For the weekend users, the present study was an extraordinary exposure because the participants had to smoke the joints entirely, in a relatively short period of time. All subjects mentioned that they normally would have stopped earlier and would not have finished the entire joint all at once. On the other side, the participants adapted their smoking behavior through the sessions by inhaling less deeply and by smoking more slowly when they felt they became ‘high’ very quickly. The smoking duration was overall significantly increased with increasing dose, varying between 19 min for the placebo to 25 min for the highest dose. This has probably limited the amount of THC inhaled. So the possible overestimation related to the ‘worst case scenario’ could be counterbalanced by the underestimation related to the adaptation of the smoking behavior of the participants. The length of smoking experience differed between participants (minimum 2 years, maximum 18 years). Some of the participants changed their habits over the years, from ‘strong high smokers’ at younger age to ‘stable high smokers’ in later years. Data about the duration of cannabis smoking and the amount of cannabis smoked in the early years are no robust parameters since these are recalled parameters and are impossible to check. Furthermore, the existence of chronic effects of cannabis use is still debated currently in the literature. It is therefore difficult to estimate the influence of longstanding cannabis smoking of the participants in the past, on the current results. The suitability of the applied cannabis doses is also an important issue for the interpretation of the study results. It is relevant to realize that cannabis is a natural product, and therefore that a wide range of concentrations can be expected. The applied concentrations reflect the content levels of netherweed as currently sold in coffeeshops in the Netherlands. The three selected cannabis concentrations in this study showed a suitable THC concentration with a range that had no overlap with the others (Table 1). Further, measurements have shown that the placebo dose was indeed a placebo (near 0% THC). This study yields neither information on chronic exposure to cannabis with higher THC contents nor on effects observed after cumulative acute exposures to cannabis. What was well observed is that the effects based on single dose exposure may last for more than 8 hours. The reaction time was still significantly slower about 5 hours after smoking. At that time, the THC serum concentration was low, but still present. This means that even when individuals have the impression that their state has returned to baseline and that they can smoke another piece of joint, the effect of the first joint may be still present. When subjects smoke on several occasions per day, accumulation of THC may occur. Consequently, the effects may become more severe because the THC of the previous exposure is not fully cleared by the body. The enrolled participants were all male subjects. Female were excluded because of their higher proportion of fat-containing tissues, compared to males. This difference could influence the distribution of THC in body tissues since THC and its metabolites are rapidly
page 36 of 52 RIVM report 267002002
taken up by fat-containing tissues after smoking. The inclusion of women in the study would have obliged us to analyse data separately and therefore to include twice the number of participants. However, there is no reason to think that the linear trend observed between external dose and internal dose of THC would not be observed also among women. We focused on the effect of cannabis alone in this study and did not investigate the effect of a simultaneous exposure to cannabis and alcohol for instance. It has been reported in the literature that the effects of cannabis and alcohol tended to be additive, but no study has assessed the effects of the combination alcohol and cannabis at doses reflecting the content levels of netherweed as currently sold in coffeeshops in the Netherlands.10 Further investigation is needed on this issue. In conclusion, smoking of cannabis with higher THC concentrations was related to increased THC serum concentrations, with increased cardiovascular effects (increase in heart rate and drop in blood pressure) and with increased psychomotor effects (worse motor control, slower reaction time and impaired divided and continuous attention). Mainly, the results indicate that even experienced users have considerable effects during and after exposure.
RIVM report 267002002 page 37 of 52
5. Conclusions
Over the last six years the content concentration of the psycho-active compound THC in ‘netherweed’ cannabis has steadily increased from circa 8.6% in December 1999-January 2000 to 17.7% in December 2004-January 2005 (data Trimbos Institute, the Netherlands). Associated with this phenomenon, concerns have been developed about the possible implications for public health. There were no study data in the literature on the pharmacokinetics and occurrence of effects at these higher dose levels. The present study was designed to bridge that gap, using cannabis THC content concentrations ranging from 9.75 to 23.12 % THC. There exist different smoking practice user groups. The group that is probably most at risk are relatively young blowers, who strive for the ‘strongest high’ feeling. They do not limit their consumption, tend to inhale deeply, and smoke the entire joint individually. The chosen study population consisted of adults (aged 18-45 years). They represent users striving to experience a ‘stable high’ feeling, with moderate psychedelic and relaxant effects. Usually, they share joints and do not finish an entire joint individually. To model for the ‘strongest high’ practices, the participants all had to finish the entire joints within circa 22 minutes. We do not think that the results of this study are considerably influenced by the choice of the study population. From the results of the present study, we conclude that smoking of cannabis with higher THC concentrations (as currently sold in coffeeshops in the Netherlands) may lead to higher THC concentrations in serum (the internal dose). Furthermore, we conclude that smoking of cannabis with higher THC concentrations leads to an increase of the occurrence of effects. Smoking of cannabis with higher THC concentrations was associated with a dose-related increase of physical effects (such as increase of heart rate, and decrease of blood pressure) and psychomotor effects (such as reacting more slowly, being less concentrated, making more mistakes during performance testing, having less motor control, and experience more drowsiness).
page 38 of 52 RIVM report 267002002
RIVM report 267002002 page 39 of 52
References 1. World Health Organization. Programme on substance abuse. Cannabis: a health
perspective and research agenda. WHO/MSA/PSA/97.4, 1-46. 1997. Geneva, Switzerland, World Health Organization.
2. Rigter H, van Laar M, Rigter S, and Kilmer B. Cannabis; feiten en cijfers 2003. Achtergrondstudie Nationale Drugsmonitor. 2003. Utrecht, the Netherlands, Bureau NDM.
3. Baardman R. Verkenning medicinale cannabis. Complex Simplex. 1-105. 1-5-2003. The Hague, the Netherlands, ZonMw.
4. Niesink RJM, Rigter S, Hoek J. THC-concentraties in wiet, nederwiet en hasj in Nederlandse coffeeshops (2004-2005). 2005. Trimbos Instituut, Utrecht, the Netherlands.
5. Korf DJ, Wouters M, Benschop A, and Ginkel van P. Sterke wiet. Blow gedrag, schadelijkheid en afhankelijkheid van cannabis. 2004. Amsterdam, the Netherlands, Rozenberg Publishers.
6. Nahas GG. The pharmacokinetics of THC in fat and brain: resulting functional responses to marihuana smoking. Hum Psychopharmacol Clin Exp 2001;16:247-55.
7. Huestis MA, Henningfield JE, Cone EJ. Bood cabbinoids: I. Absorption of THC and formation of 11-OH-THC and THC-COOH during and after smoking marijuana. J Anal Toxicol 1992;16(5):276-82.
8. Hart CL, Gorp van W, Haney M, Foltin RW, Fischman MW. Effects of acute smoked marijuana on complex cognitive performance. Neuropsychopharmacology 2001;25:757-65.
9. Heishman SJ, Arasteh K, Stitzer ML. Comparative effects of alcohol and marijuana on mood, memory, and performance. Pharmacol Biochem Behav. 1997;58:93-101.
10. Chait LD, Perry JL. Acute and residual effects of alcohol and marijuana, alone and in combination, on mood and performance. Psychopharmacology. 1994;115:340-9.
page 40 of 52 RIVM report 267002002
RIVM report 267002002 page 41 of 52
Appendix 1: Opium Exemption
Continued
page 42 of 52 RIVM report 267002002
Continued
RIVM report 267002002 page 43 of 52
Appendix 2: Informed Consent
page 44 of 52 RIVM report 267002002
Appendix 3: GCP certificate
RIVM report 267002002 page 45 of 52
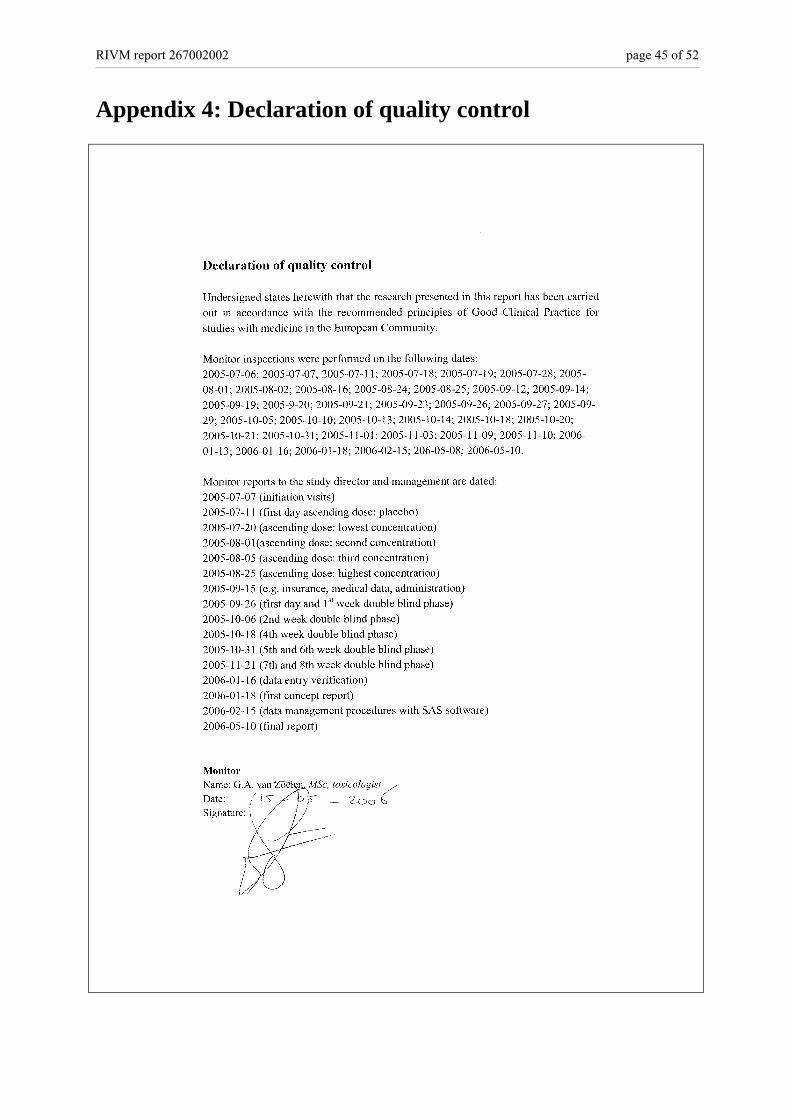
Appendix 4: Declaration of quality control
page 46 of 52 RIVM report 267002002
Appendix 5: Additional figures
Figure A.1. Means (±SD) of change in heart rate (post smoking – pre smoking) by dose (n=24); P= placebo; L=lowest; M=middle; and H=highest dose)
Figure A.2. Means (±SD) of change (post smoking – pre smoking) in mean arterial blood pressure (mmHg) by dose (n=24); P= placebo; L=lo-west; M=middle; and H=highest dose
RIVM report 267002002 page 47 of 52
Figure A.3. Mean (±SD) reaction times (ms) for the Simple Reaction Time test by post dose time (37 min, 3 hours, and 5 hours), and by dose (P= placebo; L= lowest; M= middle; and H= highest)
Figure A.4. Mean (±SD) reaction times (ms) for the Selective Attention test, by dose (P= placebo; L= lowest; M= middle; and H= highest)
page 48 of 52 RIVM report 267002002
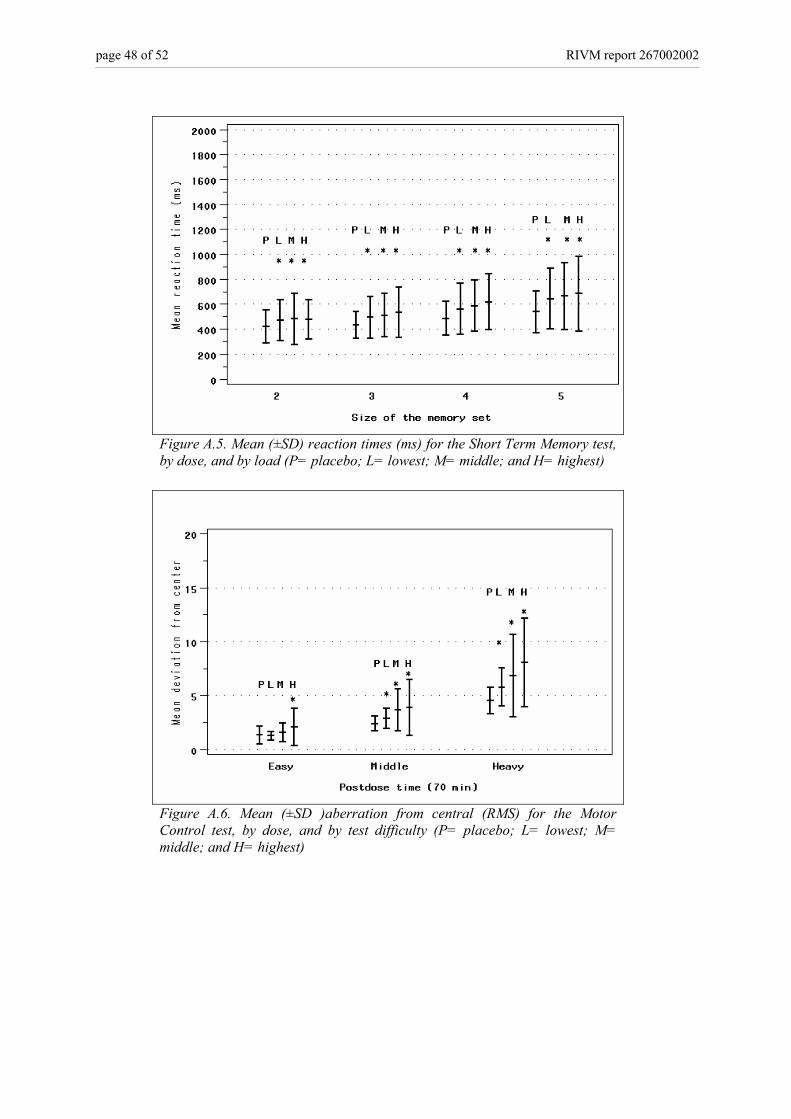
Figure A.5. Mean (±SD) reaction times (ms) for the Short Term Memory test, by dose, and by load (P= placebo; L= lowest; M= middle; and H= highest)
Figure A.6. Mean (±SD )aberration from central (RMS) for the Motor Control test, by dose, and by test difficulty (P= placebo; L= lowest; M= middle; and H= highest)
RIVM report 267002002 page 49 of 52
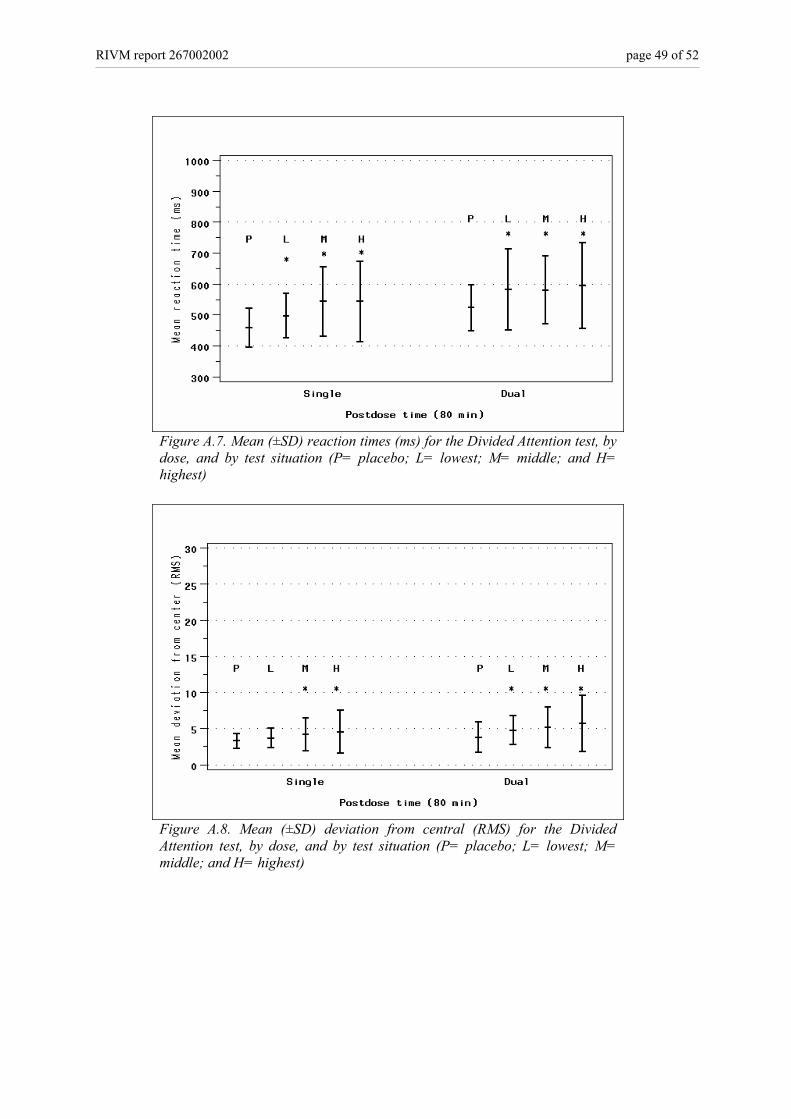
Figure A.7. Mean (±SD) reaction times (ms) for the Divided Attention test, by dose, and by test situation (P= placebo; L= lowest; M= middle; and H= highest)
Figure A.8. Mean (±SD) deviation from central (RMS) for the Divided Attention test, by dose, and by test situation (P= placebo; L= lowest; M= middle; and H= highest)
page 50 of 52 RIVM report 267002002
Figure A.9. Mean (±SD) reaction times (ms) for the Continuous Attention test, by dose (P= placebo; L= lowest; M= middle; and H= highest)
Figure A.10. Number of mistakes made during the Continuous Attention test by dose and by type of mistake (FP=false positive, FN=false negative)(n=24)
RIVM report 267002002 page 51 of 52
Figure A.11. Number of mistakes made during the Divided Attention test by dose and by task difficulty (S=single task, D=dual task)(n=24)
Figure A.12. Mean (±SD) change in high-score (post-smoking minus pre-smoking), by dose (P= placebo; L= lowest; M= middle; and H= highest)
page 52 of 52 RIVM report 267002002
Figure A.13. Mean (±SD) change in drowsiness (post-smoking minus pre-smoking), by dose (P= placebo; L= lowest; M= middle; and H= highest)