26
TM Project web site www.arl.org/libqual/ Invited Address Invited Address October, 2004 South Africa
| Date post: | 22-Dec-2015 |
| Category: |
Documents |
| Upload: | dustin-holmes |
| View: | 213 times |
| Download: | 1 times |

TM
Project web site www.arl.org/libqual/
Invited AddressInvited Address
October, 2004
South Africa

Presented byPresented by::Bruce ThompsonBruce Thompson
“22 Items and a Box:LibQUAL+TM as One Measure ofPerceived Library Service Quality”

The LibQUAL+The LibQUAL+™ Premise™ Premise
PERCEPTIONS SERVICE
“….only customers judge quality;all other judgments are essentiallyirrelevant”
Note. Zeithaml, Parasuraman, Berry. (1999). Delivering quality service. NY: The Free Press.

Note. A. Parasuraman. The SERVQUAL Model: Its Evolution And Current Status. (2000). Paper presented at ARL Symposium on Measuring Service Quality, Washington, D.C.
Multiple MethodsMultiple Methodsof Listening to Customersof Listening to Customers
Mystery shopping Transactional surveys* New, declining, and lost-customer surveys Focus group interviews Customer advisory panels Service reviews Customer complaint, comment, and inquiry
capture Total market surveys* Employee field reporting Employee surveys Service operating data capture *A SERVQUAL-type instrument is most
suitable for these methods

“In an age of accountability, there is a pressing need for an effective and practical process to evaluate and compare research libraries. In the aggregate, among the 124 Association of Research Libraries (ARL) alone, over $3.2 billion dollars were expended in 2000/2001 to satisfy the library and information needs of the research constituencies in North America.”
The Imperative for our The Imperative for our ResearchResearch
Note. M. Kyrillidou and M. Young. (2002).ARL Statistics 2000-01. Washington, D.C.: ARL, p.5.

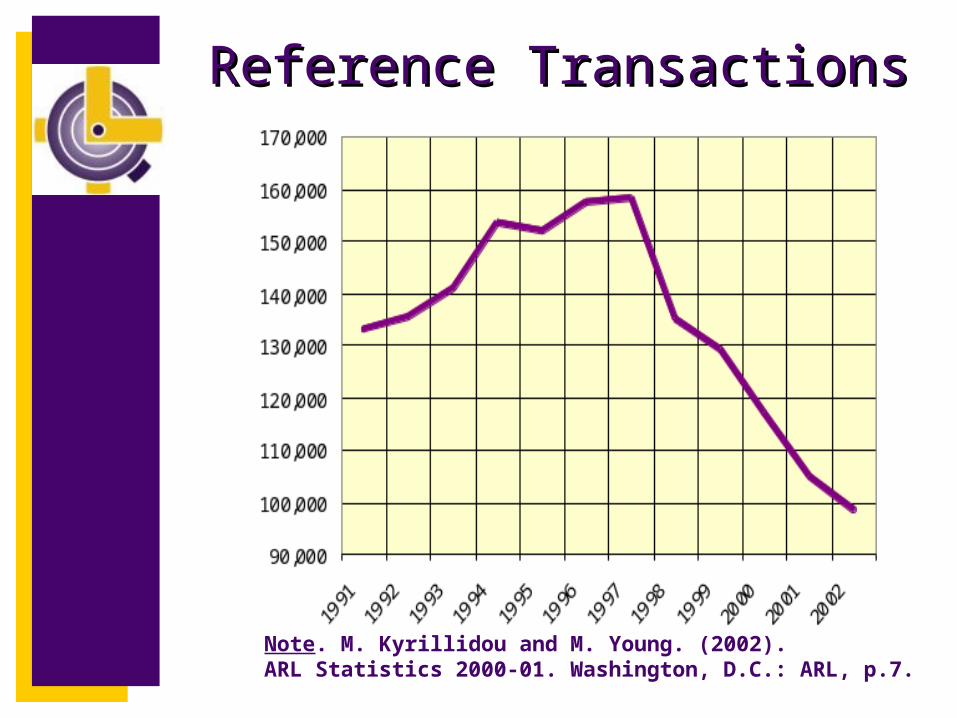
Note. M. Kyrillidou and M. Young. (2002).ARL Statistics 2000-01. Washington, D.C.: ARL, p.7.
Total CirculationTotal Circulation
Note. M. Kyrillidou and M. Young. (2002).ARL Statistics 2000-01. Washington, D.C.: ARL, p.7.
Reference TransactionsReference Transactions

Spring2000
Year 112
Participants
English
For More Information about Participants:
Visit the LibQUAL+ web site.
Year 243
Participants
Year 3164
Participants
316 Participants
EnglishDutchFrench
Swedish
Year 4
Spring2001
Spring2002
Spring2003
LibQUAL+LibQUAL+ Participants Participants

13 LibrariesEnglish LibQUAL+™ Version
4000 Respondents
QUAL
QUAN
QUAL
QUAL
QUAN
QUAL
PURPOSE DATA ANALYSIS PRODUCT/RESULTDescribe library environment;build theory of library service quality from user perspective
Test LibQUAL+™ instrument
Refine theoryof service quality
Refine LibQUAL+™ instrument
Test LibQUAL+™ instrument
Refine theory
Unstructured interviewsat 8 ARL institutions
Web-delivered survey
Unstructured interviews at Health Sciences and the Smithsonian libraries
E-mail to surveyadministrators
Web-delivered survey
Focus groups
Content analysis:(cards & Atlas TI)
Reliability/validityanalyses: CronbachsAlpha, factor analysis,SEM, descriptive statistics
Content analysis
Content analysis
Reliability/validity analyses including Cronbachs Alpha,factor analysis, SEM, descriptive statistics
Content analysis
VignetteRe-tooling
Iterative
Emergent2000
2004315 Libraries English, Dutch, Swedish,
German LibQUAL+™ Versions160,000 anticipated respondents
LibQUAL+LibQUAL+™ Project™ Project
Case studies1
Valid LibQUAL+™ protocol
Scalable process
Enhanced understanding of user-centered views of service quality in the library environment2
Cultural perspective3
Refined survey delivery process and theory of service quality4
Refined LibQUAL+™ instrument5
Local contextual understanding of LibQUAL+™ survey responses6

Why the Box is so Damn Important
LibQUAL+LibQUAL+

1. About 40% of participants provide open-ended comments, and these are linked to demographics and quantitative data.
LibQUAL+LibQUAL+

2. Users elaborate the details of their concerns.
LibQUAL+LibQUAL+
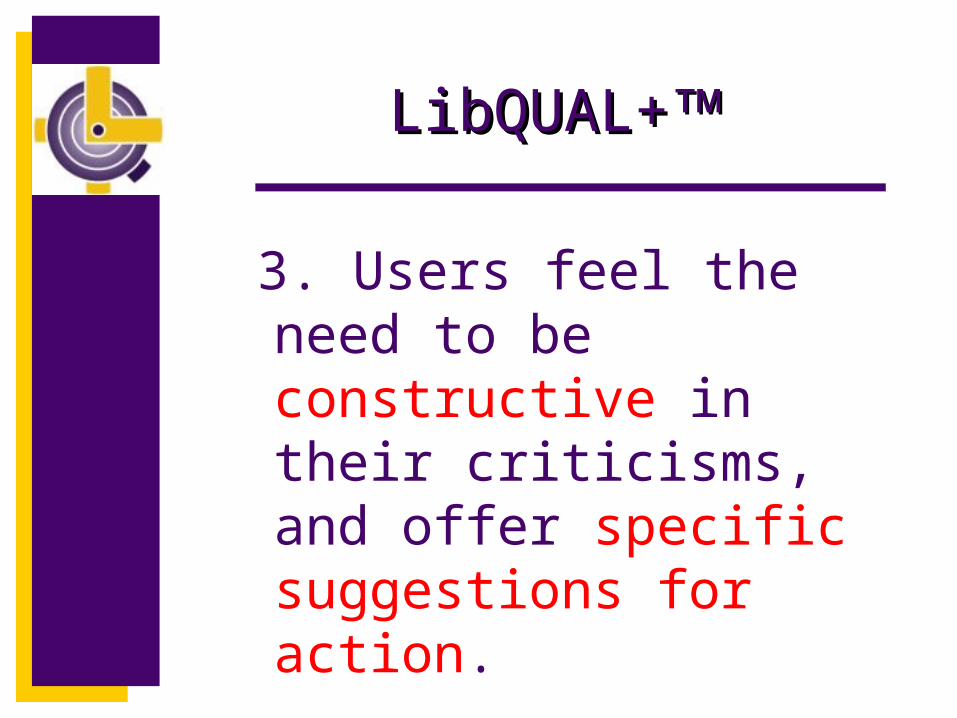
3. Users feel the need to be constructive in their criticisms, and offer specific suggestions for action.
LibQUAL+LibQUAL+

Survey InstrumentSurvey Instrument

Dimensions of LibraryDimensions of LibraryService QualityService Quality

By LanguageService Info. Lib as
Group n Affect Control Place TOTALAmerican (all) 59,318 .95 .91 .88 .96British (all) 6,773 .93 .87 .81 .94French (all) 172 .95 .90 .89 .95
alpha By Languagealpha By Language
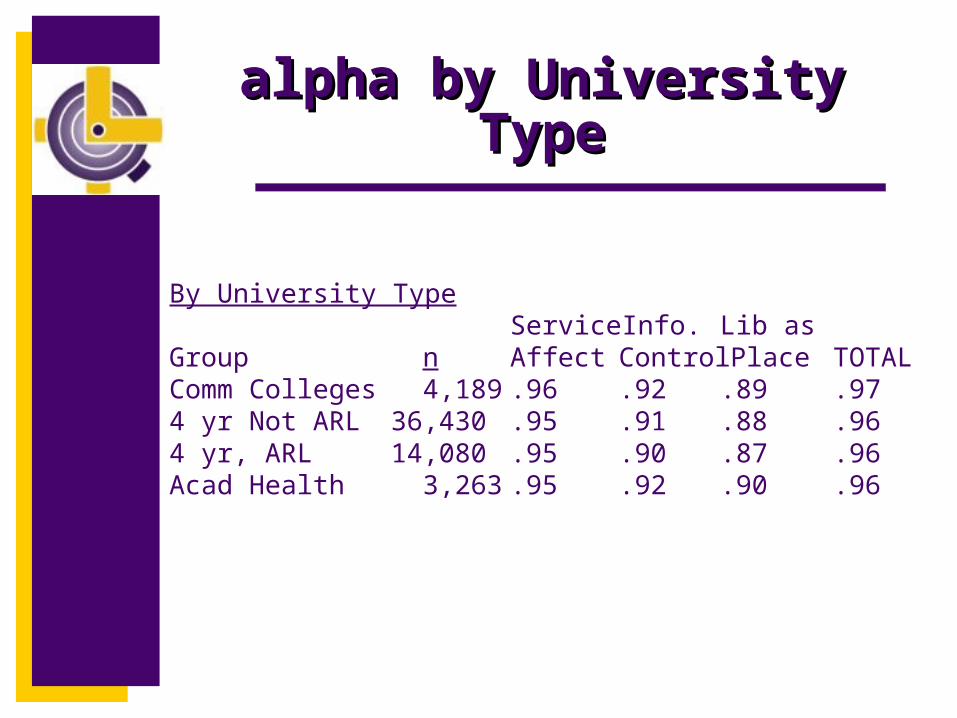
By University TypeService Info. Lib as
Group n Affect Control Place TOTALComm Colleges 4,189 .96 .92 .89 .974 yr Not ARL 36,430 .95 .91 .88 .964 yr, ARL 14,080 .95 .90 .87 .96Acad Health 3,263 .95 .92 .90 .96
alpha by University Typealpha by University Type
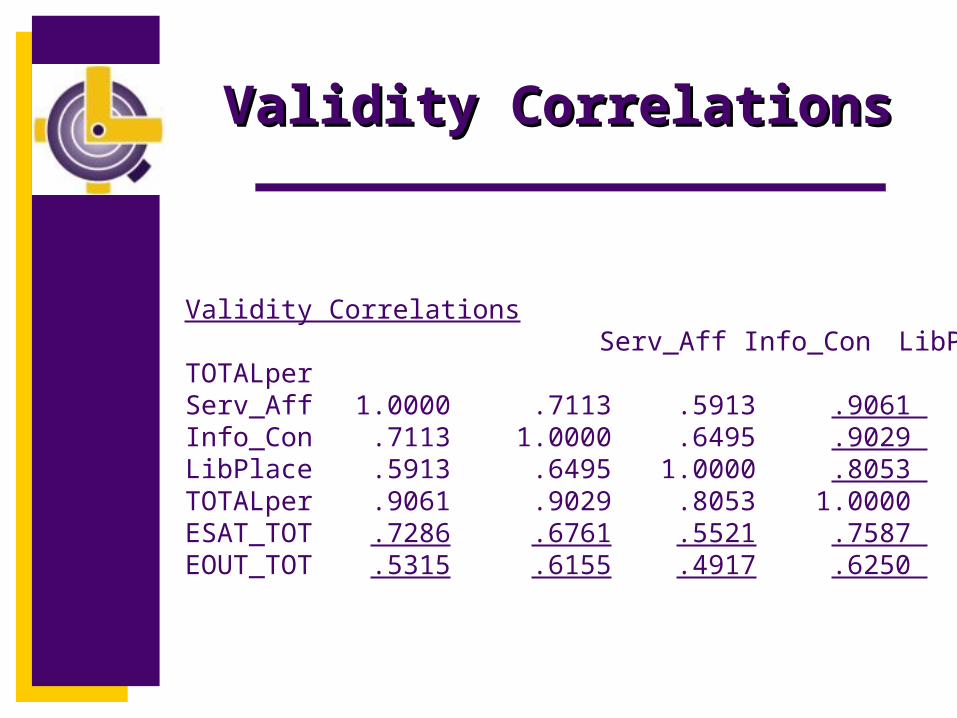
Validity CorrelationsValidity Correlations
Validity Correlations Serv_Aff Info_Con LibPlace TOTALperServ_Aff 1.0000 .7113 .5913 .9061 Info_Con .7113 1.0000 .6495 .9029 LibPlace .5913 .6495 1.0000 .8053 TOTALper .9061 .9029 .8053 1.0000ESAT_TOT .7286 .6761 .5521 .7587 EOUT_TOT .5315 .6155 .4917 .6250

LibQUAL+™ 2003 Summary LibQUAL+™ 2003 Summary Colleges or UniversitiesColleges or Universities

Score NormsScore Norms
Norm Conversion Tables facilitate the interpretation of observed scores using norms created for a large and representative sample.
LibQUAL+ norms have been created at both the individual and institutional level
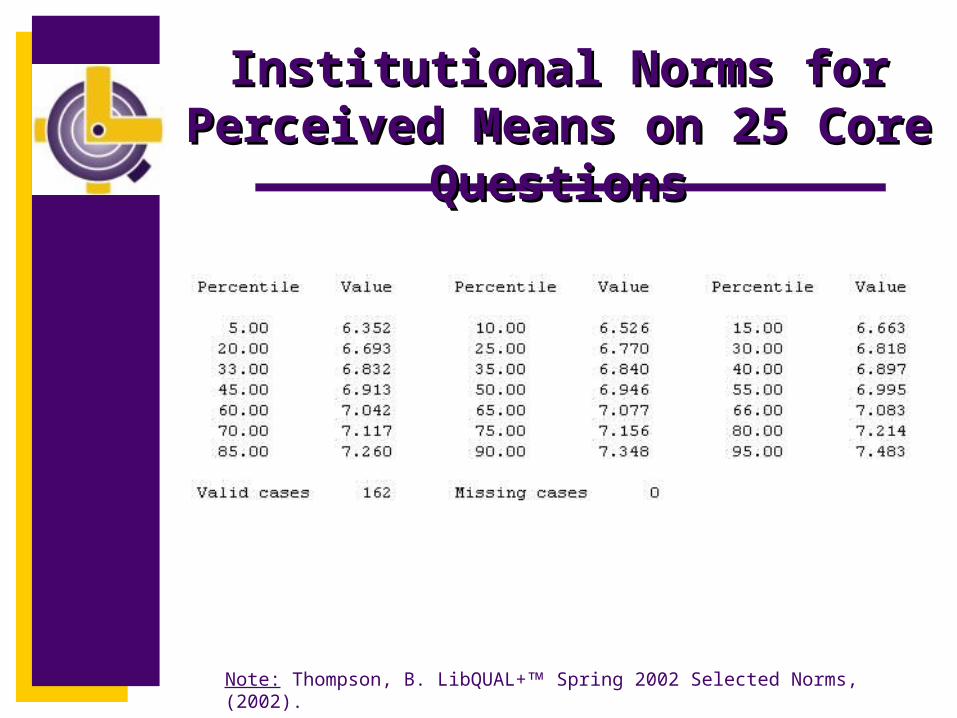
Institutional Norms for Perceived Institutional Norms for Perceived Means on 25 Core QuestionsMeans on 25 Core Questions
Note: Thompson, B. LibQUAL+ Spring 2002 Selected Norms, (2002).

2003 LibQUAL+™ Survey 2003 LibQUAL+™ Survey ActivityActivity
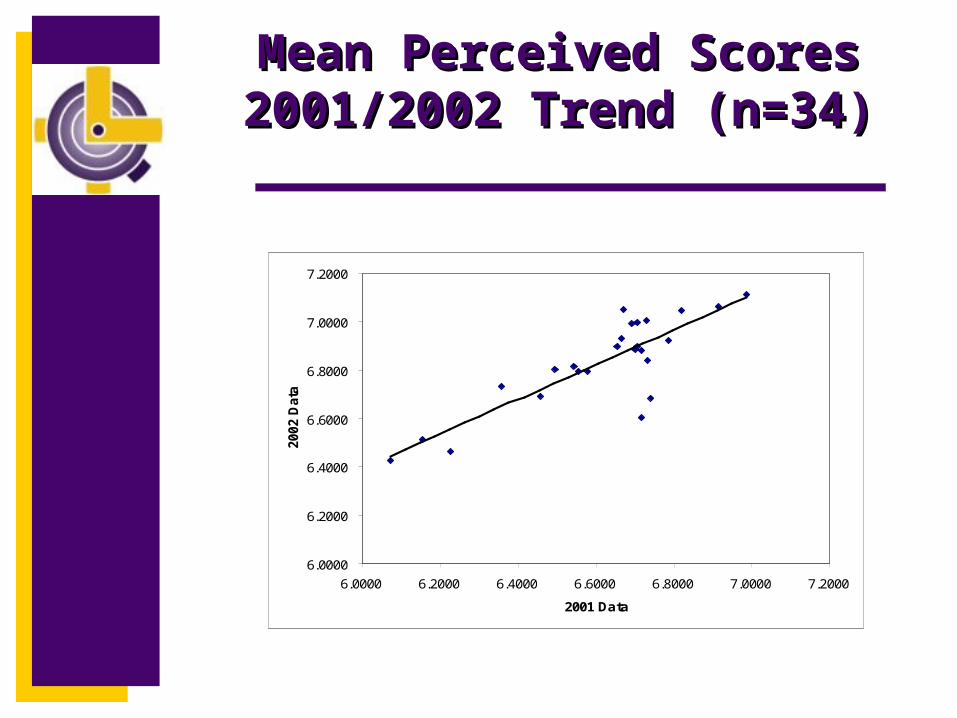
6.0000
6.2000
6.4000
6.6000
6.8000
7.0000
7.2000
6.0000 6.2000 6.4000 6.6000 6.8000 7.0000 7.2000
2001 Data
2002 D
ata
Mean Perceived ScoresMean Perceived Scores2001/2002 Trend (n=34)2001/2002 Trend (n=34)

LibQUAL+LibQUAL+ Related Related DocumentsDocuments
LibQUAL+LibQUAL+ Web Site http://www.libqual.org/
LibQUAL+LibQUAL+ Bibliographyhttp://www.coe.tamu.edu/~bthompson/servqbib
Survey Participants Procedures Manual http://www.libqual.org/information/manual/index.cfm

LibQUAL+LibQUAL+ Related Related DocumentsDocuments
Sample Library Results ReportsSample Library Results Reports http://www.libqual.org/information/related_sites/index.cfm
Sample LibQUAL+Sample LibQUAL+ Notebookshttp://www.libqual.org/documents/samplelibqualnotebook.pdf


