1 GO-FILTER TM TURBIDITY REDUCTION FIELD DEMONSTRATIONS May 2010 Turbidity reduction field demonstrations are described below using three Go-Filter TM designs: • Trailer mounted Standard, • Skid mounted low profile (SLP), and • Trailer mounted low profile (LP). Chattanooga, Tennessee A rural pond that receives runoff water from native sandy clay soil was selected as a winter field demonstration site for the Standard Go-Filter TM design (Figure 1). Figure 1. Standard Go-Filter TM design system at Chattanooga, Tennessee turbidity reduction demonstration site. System components include two Aqua-Swirl ® Models AS-4 and a three row filtration chamber.
Transcript
1
GO-FILTERTM
TURBIDITY REDUCTION FIELD DEMONSTRATIONS
May 2010
Turbidity reduction field demonstrations are described below using three Go-FilterTM
designs:
• Trailer mounted Standard,
• Skid mounted low profile (SLP), and
• Trailer mounted low profile (LP).
Chattanooga, Tennessee
A rural pond that receives runoff water from native sandy clay soil was selected as a winter field
demonstration site for the Standard Go-FilterTM
design (Figure 1).
Figure 1. Standard Go-FilterTM
design system at Chattanooga, Tennessee turbidity
reduction demonstration site. System components include two Aqua-Swirl® Models AS-4
and a three row filtration chamber.
2
Turbid water was pumped from the pond to the first swirl chamber at a flow rate of 100 gpm. A
granular flocculent was added to the influent stream at the first swirl device by gravity feed. The
flocculent was determined based on site-specific water conditions. An influent water sample was
collected near the influent hose intake at the edge of the pond. Effluent samples were collected
directly at the terminus of the discharge hose. The flocculation period was 30 minutes. Table 1
summarizes the turbidity results of influent and effluent samples. Influent turbidity was 153
NTUs and was reduced to 16.3 NTUs, an 89.3% turbidity reduction at the end of the 30 minute
period. Effluent (post-filtration) samples exhibited a noticeable visual decrease in turbidity after
15 minutes of continuous treatment. An even greater reduction in turbidity was noticed at the 18
minute mark. After 30 minutes of continuous flow, a further reduction in visible turbidity was
observed. Testing was discontinued since the effluent water was beginning to provide treatment
to the source water. Figure 2 shows the influent and effluent samples and the turbidity reduction
achieved during the field demonstration.
Table 1
Standard Go-FilterTM
Field Demonstration Results
Chattanooga, Tennessee
Sample
Influent
Turbidity
(NTUs)
Effluent
Turbidity
(NTUs)
Turbidity
Reduction
(%)
Pond 153.0
15 Minutes 66.3 56.7
18 Minutes 26.1 82.9
30 Minutes 16.3 89.3
Figure 2. Influent pond samples (153 NTUs) and Go-FilterTM
effluent samples
showing turbidity reduction.
153 NTUs 66.3 NTUs 26.1 NTUs 16.3 NTUs
3
Calhoun, Georgia
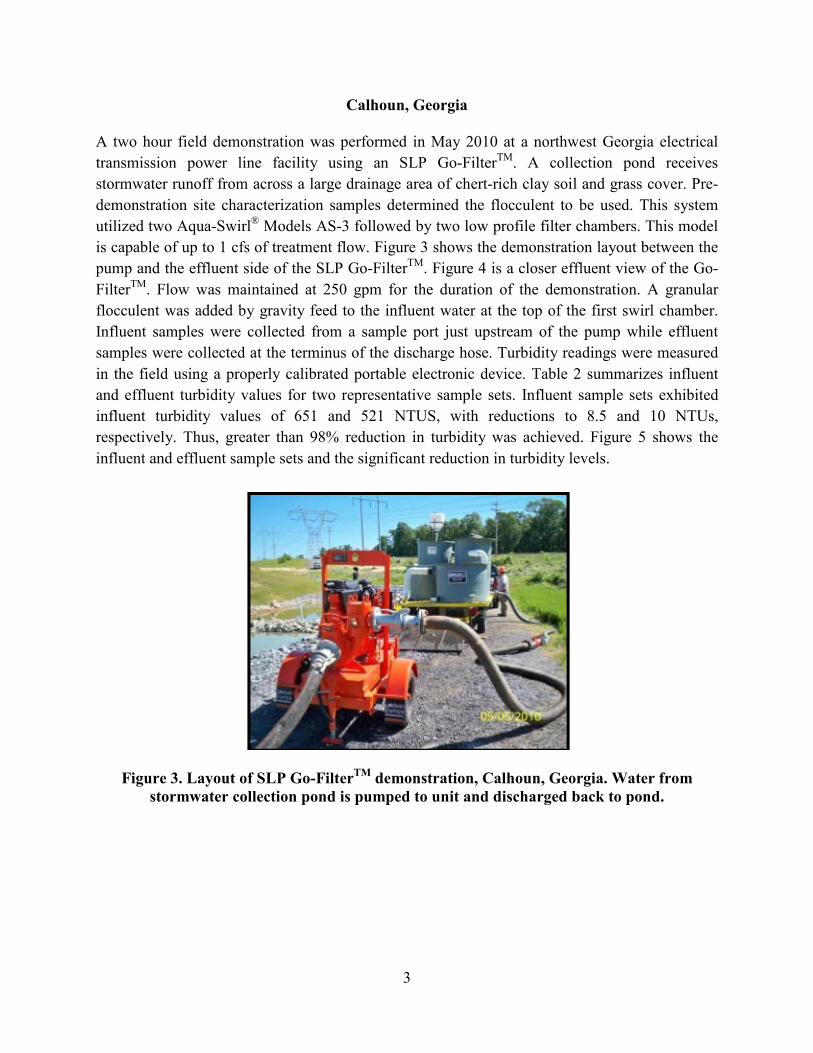
A two hour field demonstration was performed in May 2010 at a northwest Georgia electrical
transmission power line facility using an SLP Go-FilterTM
. A collection pond receives
stormwater runoff from across a large drainage area of chert-rich clay soil and grass cover. Pre-
demonstration site characterization samples determined the flocculent to be used. This system
utilized two Aqua-Swirl® Models AS-3 followed by two low profile filter chambers. This model
is capable of up to 1 cfs of treatment flow. Figure 3 shows the demonstration layout between the
pump and the effluent side of the SLP Go-FilterTM
. Figure 4 is a closer effluent view of the Go-
FilterTM
. Flow was maintained at 250 gpm for the duration of the demonstration. A granular
flocculent was added by gravity feed to the influent water at the top of the first swirl chamber.
Influent samples were collected from a sample port just upstream of the pump while effluent
samples were collected at the terminus of the discharge hose. Turbidity readings were measured
in the field using a properly calibrated portable electronic device. Table 2 summarizes influent
and effluent turbidity values for two representative sample sets. Influent sample sets exhibited
influent turbidity values of 651 and 521 NTUS, with reductions to 8.5 and 10 NTUs,
respectively. Thus, greater than 98% reduction in turbidity was achieved. Figure 5 shows the
influent and effluent sample sets and the significant reduction in turbidity levels.
Figure 3. Layout of SLP Go-FilterTM
demonstration, Calhoun, Georgia. Water from
stormwater collection pond is pumped to unit and discharged back to pond.
4
Figure 4. Effluent view of SLP Go-FilterTM
, Calhoun, Georgia site. Flocculent hopper
positioned above first Aqua-Swirl®. Note that skid is positioned atop a trailer to facilitate
transportation. The system normally operates at ground level, hopper would be lower.