Page 1
1
TMR Quality as Related to Mixer Wagons
Dennis R. Buckmaster
Purdue University
Agricultural & Biological Engineering
For a copy, visit …
https://engineering.purdue.edu/~dbuckmas
look under “outreach related”
Outline
Introduction
Variation Among Batches
Variation Within Batches
Experimenting on the farm
◦ How
◦ Example analysis
Operators Manual Excerpts
Page 2
2
Goals of TMR Delivery
Consistent blend in the feed bunk
◦ over time
◦ across location
◦ despite feedstuff changes
Proper particle size
Low labor & equipment cost
Long equipment life & low
energy use
Questions of focus
How do you know if the TMR is adequately
blended?*
If TMR blending is not adequate, how can you
improve it?
* I am purposefully avoiding the question “how good is good enough?”;
you don’t want an engineer answering that anyway.
Page 3
3
Open Loop Control
Describe
the
animals
Characterize
the
feeds
Balance
the
ration
Deliver
the
ration
Closed Loop Control
Describe
the
animals
Characterize
the
feeds
Balance
the
ration
Deliver
the
ration
Monitor
the ration
Page 4
4
Grammar of Acronyms
TMR
MTR
MPR
PMTR
TMTR
Grammar of Acronyms
TMR Total Mixed Ration
MTR Mixed Total Ration
MPR Mixed Partial Ration
PMTR Partially Mixed Total Ration
TMTR Totally Mixed Total Ration
Page 6
6
TMTR
Acronym conclusion
PMTR
You can’t afford it!
MPR
Page 7
7
Uniformity AMONG Batches
In a ration with 5 ingredients, there are 15
reasons for the ration NDF, CP, NEL, or other
characteristic to be different than the target!
◦ DM content (%)
◦ Nutrient concentration (% of DM)
◦ Amount in the mix (lb as is)
feeds
fractionlb
feeds
fractionlb
rationDMAMT
NDFDMAMT
NDF
%
%,
Uniformity AMONG Batches
Monitor
◦ ingredient nutrient concentrations
◦ ingredient DM concentrations
◦ particle size reduction
Control
◦ amounts in the ration
◦ mixing protocol (fill order & mixing time)
Page 8
8
Variation AMONG Batches
EXAMPLE 1
◦ Ration with:
haycrop silage
corn silage
grain premix
◦ Haycrop silage moisture goes up (a 5 to 10
percentage point swing over a week time span is
certainly possible)
Variation AMONG Batches
EXAMPLE 1 (haycrop moisture increases)
◦ Consequences if no corrective action is taken
less haycrop DM in ration
lower protein in the ration
higher energy concentration in the ration
likely reduced effective fiber in the ration
more grain consumption than planned
◦ Corrective action: adjust amounts in the ration
Page 9
9
Variation AMONG Batches
EXAMPLE 2
◦ Ration with:
haycrop silage
corn silage
grain premix
◦ Corn silage amount swings widely from batch to
batch
Variation AMONG Batches
EXAMPLE 2 (corn silage amount varies)
◦ Consequences if no corrective action is taken
inconsistent energy concentration in the ration
inconsistent protein concentration in the ration
inconsistent effective fiber in the ration
intake is inconsistent and likely decreases
◦ Corrective action: meter in more consistently or
vary other ingredients proportionally
Page 10
10
Variation AMONG Batches
EXAMPLE 3
Fill order #1 Fill order #2
haycrop silage grain premix
corn silage corn silage
grain premix haycrop silage
Mixer (which is designed to do some particle size
reduction) is run during filling
Variation AMONG Batches
EXAMPLE 3 (varied fill order)
◦ Consequences if no corrective action is taken
inconsistent particle size distribution in the ration
inconsistent effective fiber in the ration
◦ Corrective action: Implement a consistent mixing
protocol
Page 11
11
Confounded in CA
More ingredients
Larger variety of ingredients
Uniformity WITHIN Batches
Mixer capacity
◦ select for minimum batch size
◦ select for maximum batch size
Mixer management
◦ fill order
◦ mixing time
◦ particle size reduction
Page 12
12
Mixer SizingDon’t overlook the obvious
Maybe not all groups get the same number of
batches per day
Most mixers don’t work well when “full” (likely 70%
full -- the fine print is always most important!)
Size for maximum batch size
Size for minimum batch size
Mixer Management
General principles
Mix long enough (assure uniformity)
Don’t mix too long (avoid excessive wear,
particle size reduction, energy & labor)
Control particle size reduction
Understand the material flow in the mixer
Page 13
13
Material Flow is a Big Deal
Page 14
14
Mixer Management
Sample Mixing Protocol
Mixer off during loading
Small quantity and liquid ingredients loaded in
first
Haycrop silage loaded last
Mix 3-5 minutes after filling is complete
Unload quickly, mixer off except when
unloading
Monitoring your TMR
DM content
◦ microwave, Koster tester, vortex dryer, or drying oven
Particle size distribution
◦ Penn State separator or lab analysis
Nutrient concentrations
◦ Lab analysis
Tracers in the ration
Page 15
15
Experimenting on the Farm
Rules for on-farm experimenting:
◦ Replicate, replicate, replicate
◦ Change one thing at a time
◦ Be consistent and document what you are doing
◦ Use appropriate (likely simple) statistics
◦ Ask for advice when you should
Be looking for
variability among and within batches.
Experimenting on the Farm
1. Exploring mix uniformity by varying
mixing protocol
◦ change fill order
◦ change mixing time (count revolutions instead of
time)
◦ try not running the mixer during filling & transport
(or run it slowly)
corn hay silage 1 silage 2 premix
Page 16
16
Experimenting on the Farm
1. Uniformity ... (how to measure)
◦ Add a tracer such as whole shelled corn, cotton
seeds, corn cobs, mini carrots, or other safe,
physically identifiable objects. Look for variation
along the bunk.
Use enough but not too much
◦ Take samples from the bunk for lab analysis
Experimenting on the Farm
2. Exploring particle size reduction
◦ “mix” a single forage (vary time and monitor particle
size reduction)
◦ hand mix a mini-ration as a comparison
◦ compute weighted average particle size distribution
from ingredients used
Page 17
17
Experimenting on the Farm
2. Particle size ... (how to measure)
◦ Penn State separator
◦ Laboratory analysis
Note: To a degree, particle size analysis of samples within a batch (along the feed bunk) can be useful for identifying within batch variation.
Example Analysis #1
15 lb of whole shelled corn was added for each
ton of TMR which otherwise did not contain
whole kernels
2 lb samples were pulled along the feed bunk
Kernel counts per 2 lb sample is reported.
Page 18
18
Example Analysis #1
Example Analysis #2
Five similar replicate batches
◦ Same mixer
◦ Same ingredients from the same structures
◦ Same fill order
◦ Same mixer operation and procedure
2 lb samples pulled from bunk
Hay was a significant part of the ration
% long particles (top sieve of PSU separator)
reported
Page 19
19
What should be evaluated?
% long material
CV of % long material
Confidence interval of CV of % long material
It’s time to think about the CV of
CVs
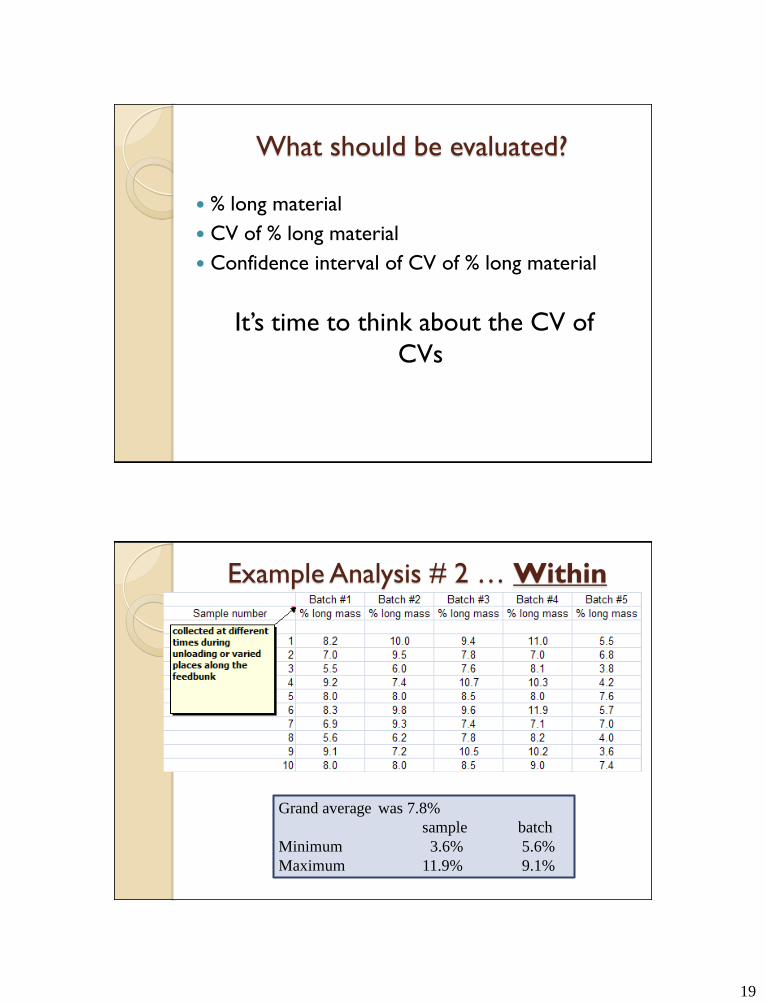
Example Analysis # 2 … Within
Grand average was 7.8%
sample batch
Minimum 3.6% 5.6%
Maximum 11.9% 9.1%
Page 20
20
Example Analysis # 2 … Within
Example Analysis # 2 … Among
Considering all 50 samples …
95% confidence interval is 7.8 ± 0.52
Page 21
21
Example Analysis # 3 … Comparison Same mixer, as with previous example, new
procedure
Grand average was 7.8%
sample batch
Minimum 3.6%5.0% 5.6%6.2%
Maximum 11.9% 10.3% 9.1%8.6%
Example Analysis # 3 …Comparison
Previous example
Same mixer, new procedure
Page 22
22
Example Analysis # 3 …Comparison
Example Analysis # 3 …Comparison
Page 23
23
About this example
50 samples, 10 each from 5 batches
Batch CV averages 13.7 vs. 19.2 (p=0.041)
Average of meals 7.8% (long material) in both
cases
Even so, if procedure 2 “didn’t cost anything” …
Mixer Manual Excerpts
What follows is some good information from
actual operators manuals and mixer
manufacturer websites.
Page 24
24
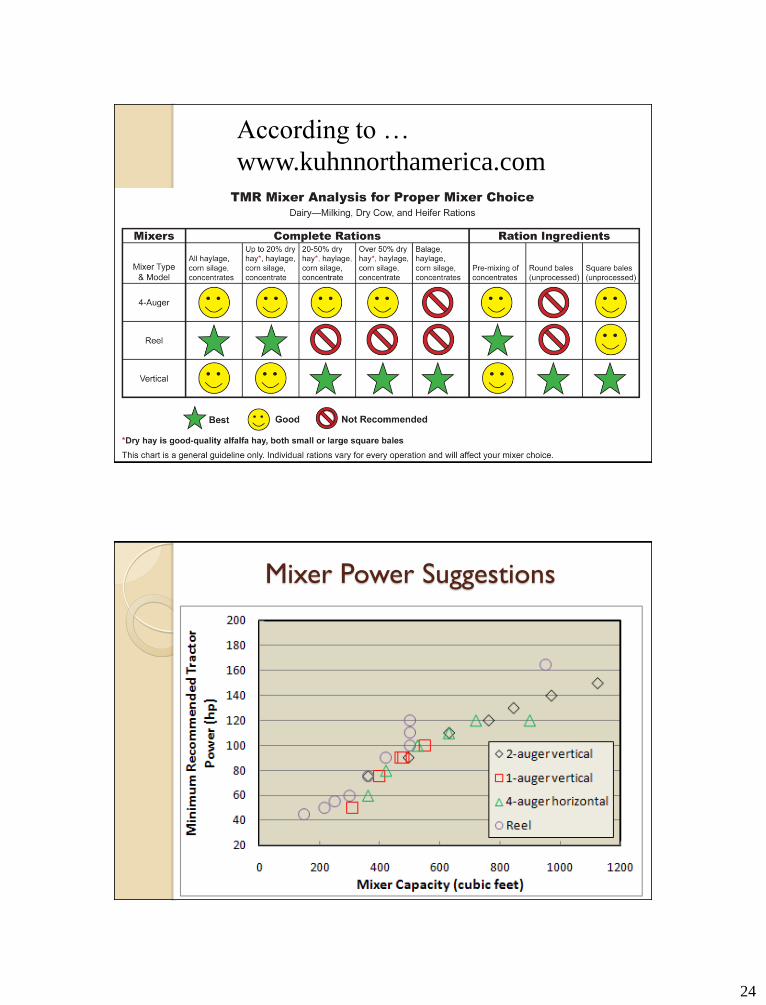
According to …
www.kuhnnorthamerica.com
Mixer Power Suggestions
Page 25
25
Mixer Maintenance … applicable to all
brands & types
Frequent cleaning
Keep proper belt tension
Keep proper chain tension
Grease appropriately
Check oil levels (always use the correct oil)
Operate PTO shaft at proper angle
Use correct shear pins
Maintain scales (protect wires, calibrate)
Sharpen knives and maintain proper clearances between cutting elements
Keep proper tire pressure
Mixer Manual Excerpts … general
Page 26
26
Manual Excerpts … Keenan
Manual excerpts … Oswalt
Page 27
27
Manual excerpts … Oswalt
Manual Excerpts … Rotomix
Page 28
28
Quality Control in TMR Delivery
Where is the weakest link?Feed sampling Lab nutrient analysis
Dry matter content estimation Ration balancing
Mixer management Bunk management
TMR Delivery ... the Bottom Line
Don’t have any weak links!Feed sampling Lab nutrient analysis
Dry matter content estimation Ration balancing
Mixer management Bunk management
Page 29
29
https://engineering.purdue.edu/~dbuckmas
… look under “outreach related”


![Welcome [] - The Nuts... · Mixer Basics The Common TMR ... Truck • Maneuverability ... with 2 planetary gearboxes • Handles wetter roughages better Single Narrow Auger • Smaller](https://static.documents.pub/doc/80x56/5b91845609d3f2c05d8bb881/welcome-the-nuts-mixer-basics-the-common-tmr-truck-maneuverability.jpg)


