TECHNICAL MANAGEMENT TEAM BOR : John Roache / Mary Mellema BPA : Robyn MacKay / Scott Bettin NOAA-F: Paul Wagner USFWS : David Wills / Steve Haeseker OR : Rick Kruger / Ron Boyce ID : Russ Kiefer WA : Cindy LeFleur MT : Jim Litchfield COE: Cindy Henriksen / Cathy Hlebechuk TMT CONFERENCE CALL Wednesday January 03, 2007 09:00 - 12:00 pm 1125 N.W. Couch Street, Suite 4A34 Portland, Oregon 97208 Conference call line: 503-808-5190 Note: If you plan on attending the meeting in our building you will now need to call ahead and let Cathy Hlebechuk or Jim Adams know so your name can be added to the TMT Visitor List for access to the Building. Also you will need to present a form of ID at the Guards Station so a photo can be taken and ID badge will be issued for the day. If you are a Federal Employee you will only need to present your Government ID. We have had disruptions on the phone because people are not hitting 'mute' after dial in. Please MUTE your Phone All members are encouraged to call Donna Silverberg with any issues or concerns they would like to see addressed. Please e-mail her at [email protected] or call her at (503) 248-4703. AGENDA 1. Welcome and introductions 2. 3. 4. 5. 6. 7. Operations Review Reservoirs Fish Power System Water Quality 8. Other Set agenda for next meeting - [Reference Calendar 2007] Questions about the meeting may be referred to Cathy Hlebechuk at (503) 808-3942, Jim Adams at (503) 808-3938, or Cindy Henriksen at (503) 808-3945
Transcript
T E C H N I C A L M A N A G E M E N T T E A MBOR : John Roache / Mary Mellema BPA : Robyn MacKay / Scott BettinNOAA-F: Paul Wagner USFWS : David Wills / Steve HaesekerOR : Rick Kruger / Ron Boyce ID : Russ KieferWA : Cindy LeFleur MT : Jim Litchfield
1125 N.W. Couch Street, Suite 4A34 Portland, Oregon 97208
Conference call line: 503-808-5190
Note: If you plan on attending the meeting in our building you will now need to call ahead and let Cathy Hlebechuk or Jim Adams know so your name can be added to the TMT
Visitor List for access to the Building. Also you will need to present a form of ID at the Guards Station so a photo can be taken and ID badge will be issued for the day.
If you are a Federal Employee you will only need to present your Government ID.
We have had disruptions on the phone because people are not hitting 'mute' after dial in.Please MUTE your Phone
All members are encouraged to call Donna Silverberg with any issues or concerns they would like to see addressed. Please e-mail her at [email protected] or call her at (503) 248-4703.
8. OtherSet agenda for next meeting - [Reference Calendar 2007]
Questions about the meeting may be referred to Cathy Hlebechuk at (503) 808-3942, Jim Adams at (503) 808-3938, or Cindy Henriksen at (503) 808-3945
T E C H N I C A L M A N A G E M E N T T E A MBOR : John Roache / Mary Mellema BPA : Robyn MacKay / Scott BettinNOAA-F: Paul Wagner USFWS : David Wills / Steve HaesekerOR : Rick Kruger / Ron Boyce ID : Russ KieferWA : Cindy LeFleur MT : Jim Litchfield
COE: Cathy Hlebechuk / Jim Adams
TMT MEETING Wednesday January 17, 2007 10:00 - 12:00
NOTE: DUE TO INCLEMENT WEATHER, START TIME CHANGED TO 10 A.M. WILL REASSESS WEDNESDAY MORNING IF TIME NEEDS TO BE ADJUSTED FURTHER
NOTE: DIFFERENT LOCATION FOR THIS MEETING ONLY NOAA Fisheries
Mt.St.Helens Room, 10th floor (check in on 11th floor first) 1201 N.E. Lloyd Blvd
Portland, Oregon
Conference call line: 503-808-5190
Before going to the 10th floor you must check in on the 11th floor.
We have had disruptions on the phone because people are not hitting 'mute' after dial in.Please MUTE your Phone
All members are encouraged to call Robin Harkless with any issues or concerns they would like to see addressed. Please e-mail her at [email protected] or call her at (503) 248-4703.
AGENDA
1. Welcome and introductions2. Review Minutes [Minutes 2006] 3. Chum incubation status4. Water Management Plan and Fall / Winter Update comments.5. Operations Review
ReservoirsFishPower SystemWater Quality
6. OtherSet agenda for next meeting - January 31, 2007 [Calendar 2007]
Questions about the meeting may be referred to Cathy Hlebechuk at (503) 808-3942 or Jim Adams at (503) 808-3938
Technical Management Team Meeting Notes
January 17, 2007 1. Welcome and Introductions Due to snow conditions in Portland, TMT held a conference call facilitated by Cathy Hlebechuk in place of the scheduled face-to-face meeting. The following is a summary (not a verbatim transcript) of the topics discussed and decisions made at the meeting. Anyone with questions or comments should provide them to the TMT Chair or bring them to the next TMT meeting. 2. Comments on Meeting Minutes The minutes for 2007 are posted on the Corps website at: http://www.nwd-wc.usace.army.mil/tmt/agendas/2007/. There were no comments at this meeting regarding previous meeting minutes. 3. Water Supply Forecasts, Precipitation Data and Climate Predictions
A. Chum Incubation Status. USFWS is expecting to get complete GPS coordinates for chum redd locations in the lower Columbia from ODFW at any time, Dave Wills said. ODFW will be providing the GPS coordinates to USFWS. Then, Joe Skalicky (USF&WS) will use his digital elevation model to estimate redd elevations and associated Bonneville outflows. The salmon managers have discussed the chum incubation issue, but are waiting until Joe Skalicky’s modeling results are available before deciding to make any outflow recommendations. Dave Wills said he hopes the modeling results will be available in a few weeks. Those present on the call requested that Joe provide an update at the next TMT meeting on January 31st.
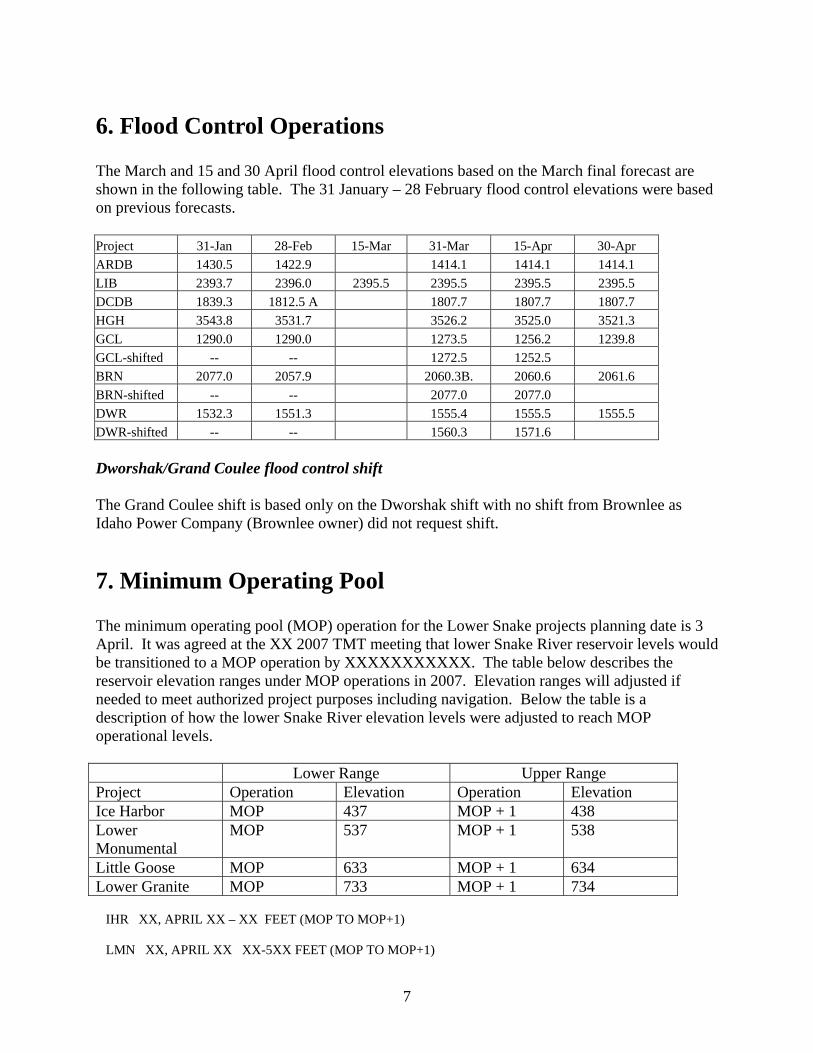
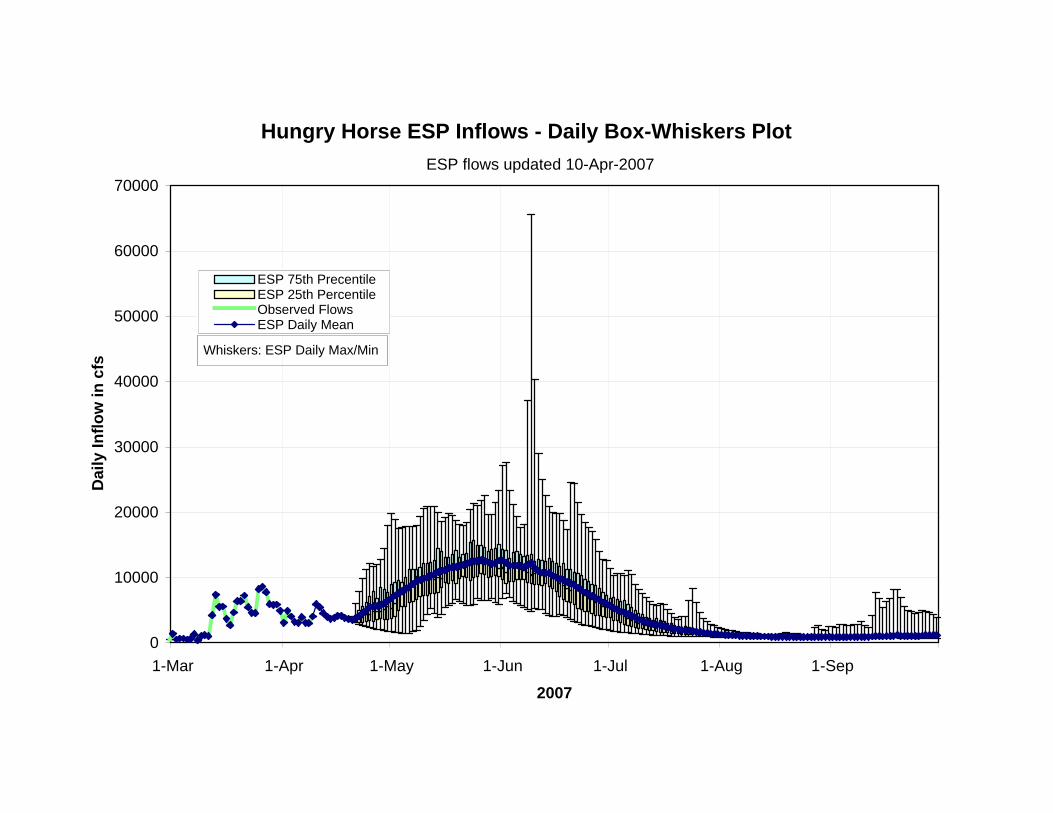
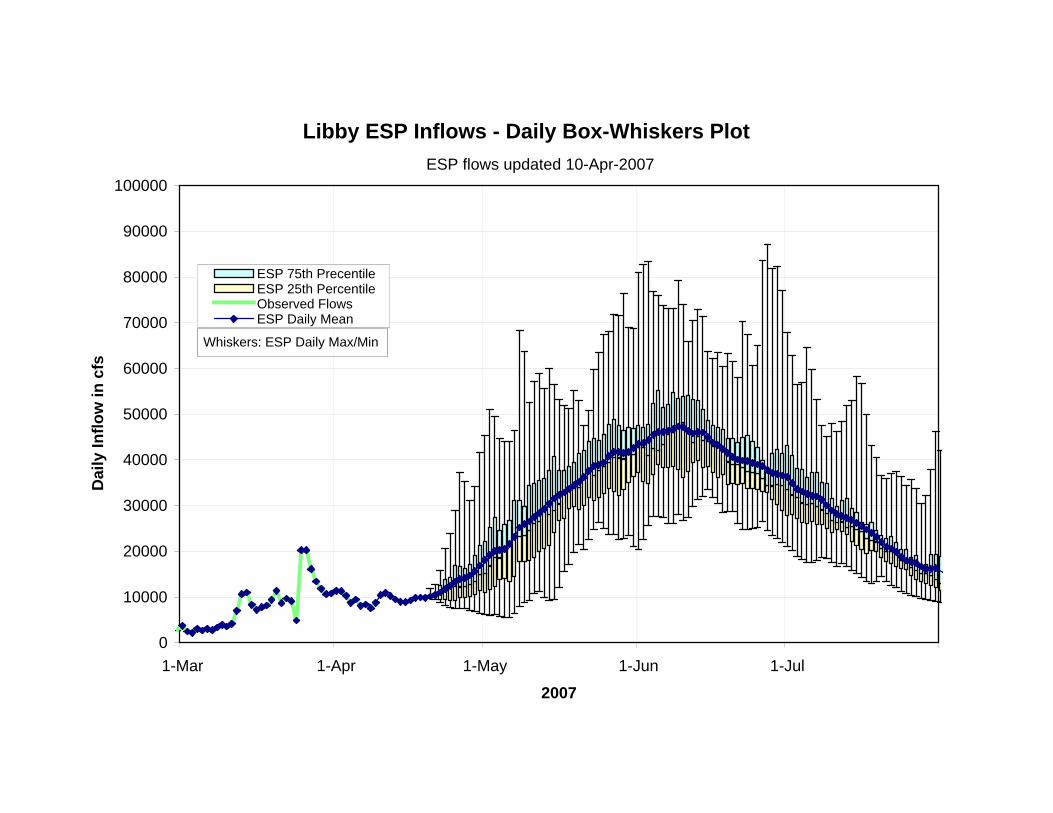
B. Operations Review. Hungry Horse is at 3,537.8 feet elevation, and is releasing about 2,500 cfs to maintain the minimum required 3,500 cfs at Columbia Falls, John Roache said. BOR plans to continue at the present operations level without making any flood control releases until March or April. Grand Coulee is at elevation 1,283.5 feet, drafting to meet power demands. Libby is at approximately 2,400 feet elevation, releasing about 13 Kcfs, Hlebechuk said. The water is being shaped around cold weather and heavy flows will taper off at the end of the month. Dworshak is at 1,539 feet elevation, releasing 8 Kcfs, and the Corps will be targeting a flood control elevation for it by the end of January. Albeni Falls is still operating in the 1-foot range at 2,052.6 feet elevation. The Libby forecast for the year was 110% of normal and drafting to a January flood control target of 2,393.7 feet elevation. Dworshak was 108% of forecast, drafting to 1,532 feet elevation. The next round of forecasts will be done in February, Hlebechuk said. Dworshak forecasting will be done before Libby, which gets slowed down by receipt of Canadian precipitation data.
1
Bonneville Dam is spilling water now because it’s above turbine capacity. The group agreed to work together further on the Bonneville issue after today’s meeting.
C. Power System Update. No report was given at this meeting. D. Water Quality Update. TDG levels at Bonneville have been 97-98% so
there’s been no problem with gas, Jim Adams said. The only TDG gage currently operating below Bonneville dam is the Warrendale gage.
A couple of weeks ago (January 5-6) at Lower Monumental, there was a maintenance operation to replace disconnects for transformer units 1 through 4. During the operation, one unit (5 or 6) was to be operated at “speed-no-load” and the remainder of the flow would be spilled. The work began on in the morning of the 5th, but the crews were unable to complete the work by the end of the day. As a result, the speed-no-load operation continued through the night. The workers came back the next day to finish up, but were unable to due to high wind conditions. The maintenance operation was suspended at 1500 hrs on January 6th and project operations went back to regular generation. On Monday, January 8th, the workers returned and completed the repair. TDG levels during the maintenance operation got as high as 118% [editors note: actual TDG levels got as high as 120.7%].
E. Water Management Plan. The draft Water Management Plan and
Fall/Winter Updates are on the TMT website. The goal is to finalize both the Water Management Plan and Fall/Winter Update on February 1, after the next TMT meeting. Five agencies so far have submitted comments on the water management plan; these comments are available on the website. Hlebechuk asked people to review the latest draft plans and comment before the Jan. 31 TMT meeting. The group discussed the possibility of using a reformatted version of the Water Management Plan which is more user friendly in future, trying it as a test for a year. The also group discussed the timing of finalizing the Fish Passage Plan. Final comments were due January 19th and a final draft of the plan would be available for the February 8th FPOM meeting. Finalization of the plan is scheduled for February 28th. Also discussed was the Fish Passage Implementation Plan that was submitted to the Court. Last year, the Corps made the fish spill implementation plan an addendum to its spring/summer update although this year it is uncertain if another spill implementation plan will be developed as there has been no court order this year as of yet, Hlebechuk said. The Corps expects to finalize the water management plan on Feb. 1, a day after the next TMT meeting. 4. Next TMT Meeting Date and Agenda
Hlebechuk listed some of the speakers for the next TMT meeting Jan. 31:
2
• Joe Skalicky (USFWS) – Model results for redd locations, GPS coordinates, and associated tailwater elevations (check with Wills on the tailwater part)
• Cindy Hendrickson (COE) – Libby 2007 operations. • Harold Opitz (NWS) – Water supply forecast, January final forecast
with precipitation maps, also climate predictions and modeling
• Cathy Hlebechuk – Operations review and final water management plan for 2007
These items and others will be listed on the agenda at the website shortly before the next meeting. This summary prepared by BPA contractor Pat Vivian.
Technical Management Team Meeting Participants
January 17, 2007 Name Affiliation Kyle Dittmer CRITFC John Roache BOR Cathy Hlebechuk COE Robyn MacKay BPA Russ Keifer IDFG Scott Bettin BPA Richelle Beck D. Rohr & Associates Carolyn Fitzgerald COE Tom Le PSE Dan Spear BPA David Wills USFWS Paul Wagner NOAA Jim Adams COE Bern Klatte COE Holly Krebs Shane Scott Jeff Laufle COE Tony Norris BPA
3
T E C H N I C A L M A N A G E M E N T T E A MBOR : John Roache / Mary Mellema BPA : Robyn MacKay / Scott BettinNOAA-F: Paul Wagner USFWS : David Wills / Steve HaesekerOR : Rick Kruger / Ron Boyce ID : Russ KieferWA : Cindy LeFleur MT : Jim Litchfield
COE: Jim Adams / Cathy Hlebechuk
TMT MEETING Wednesday January 31, 2007 09:00 - 12:00
1125 N.W. Couch Street, Suite 4A34 Portland, Oregon 97209
Conference call line: 503-808-5190
If you plan on attending the meeting in our building you will now need to call ahead and let Jim Adams (503)808-3938 or Cathy Hlebechuk (503)808-3942 know, so your name can be added to the TMT Visitor List for access to the building. Also you will need to present a form of ID at the guard's station so a photo can be taken
and an ID badge issued for the day.
If you are a federal employee you will only need to present your government ID.
We have had disruptions on the phone because people are not hitting 'mute' after dial in.Please MUTE your Phone
All members are encouraged to call Robin Harkless with any issues or concerns they would like to see addressed. Please e-mail her at [email protected] or call her at (503) 248-4703.
AGENDA
1. Welcome and introductions2. [Review Minutes] 3. January Final Water Supply Forecasts, precipitation data and climate predictions,
Steve King - National Weather Service, River Forecast Center[Main water supply page - Overview][Current Month precip][Seasonal Month Precip][Snow]Water Supply/ESP
[LGDW1][GCDW1][TDAO3]
Climate Prediction Center Forecasts 1-month outlook
11. OtherSet agenda for next meeting - February 14, 2007 [Calendar 2007]
Questions about the meeting may be referred to Jim Adams at (503) 808-3938 or Cathy Hlebechuk at (503) 808-3942,
1
Distribution and Elevation calculations for 217 Chum redds mapped in the Ives Is. Complex during the 2006 Spawning Season
December 22, 2006.
Figure 1. General distribution of all 217 chum redds excavated in the Ives Island complex below Bonneville Dam and mapped with GPS by ODFW/WDFW survey crews. An additional 40 redds were mapped after 11-22-3006. Note: this analysis does not include redds mapped at any of the downstream spawning areas including Multnomah and I-205.
2
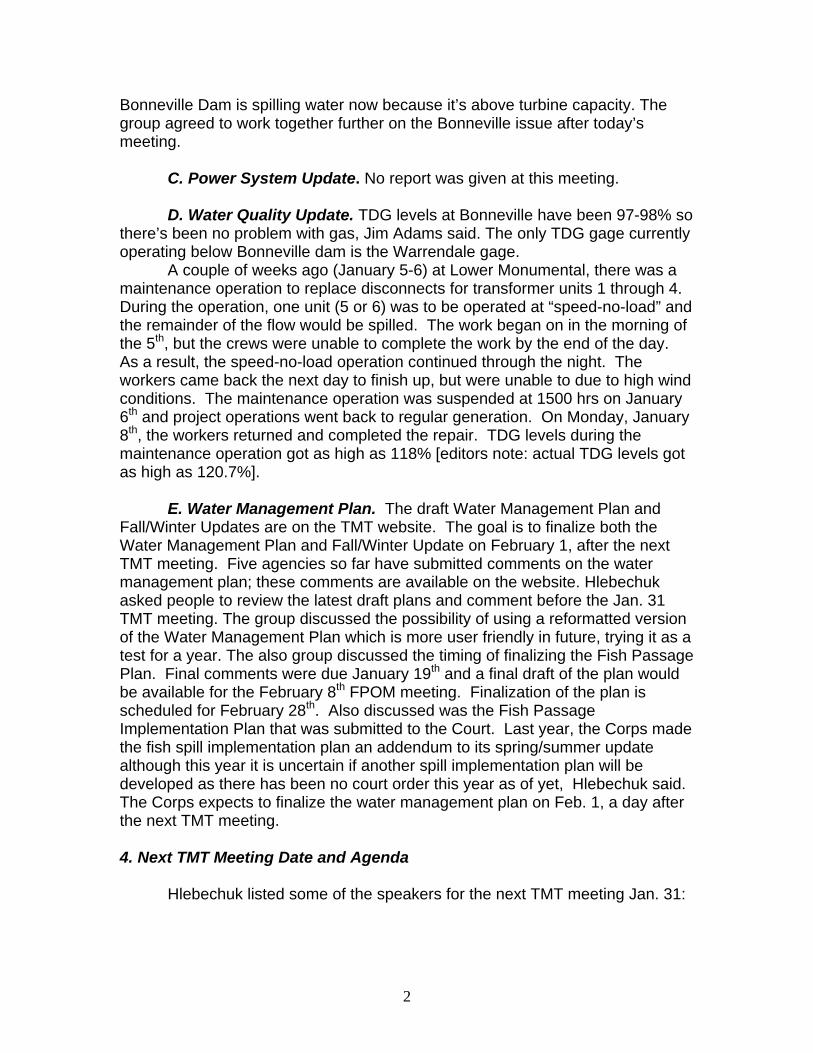
Table 1. Computed redd elevations for all 217 Redds.
Figure 2. Graphic describing the relationship between the Bonneville tailwater and the chum spawning locations. Water flows downhill, it does not follow the dashed line in the figure above, which if it did would make managing by just redd bed elevations a snap! What we require is the relationship between the Bonneville tailwater and the water surface elevations over the redd spawning areas. Note that the redd elevations computed in Table 1 cannot be used solely as a bases for management.
2006 Chum Redd Distribution!( Pre 11-22-06 Redds (177)
!( Post 11-22-06 Redds (40)
120k - Steady State
120 - 130k wetted area
130 - 140k wetted area
140 - 150k wetted area
150 - 160k wetted area
Figure 3. Distribution of chum redds, plotted on modeled wetted area simulations (flow bands) ranging from 120 to 160 kcfs at 10 kcfs intervals. Table 2. Distribution of chum redds vs. 10kcfs flow band for both the original analysis conducted for 177 redds mapped through 11-22-2006 and all redds including the additional 40 redds mapped through 12-22-2006.
Redds through 11-22-06 All Redds - 12-22-06 Flow Band Redds % Total Flow Band Redds % Total Redd Delta 120 - steady 18 10.2% 120 - steady 42 19.4% 24 120-130 67 37.9% 120-130 75 34.6% 8
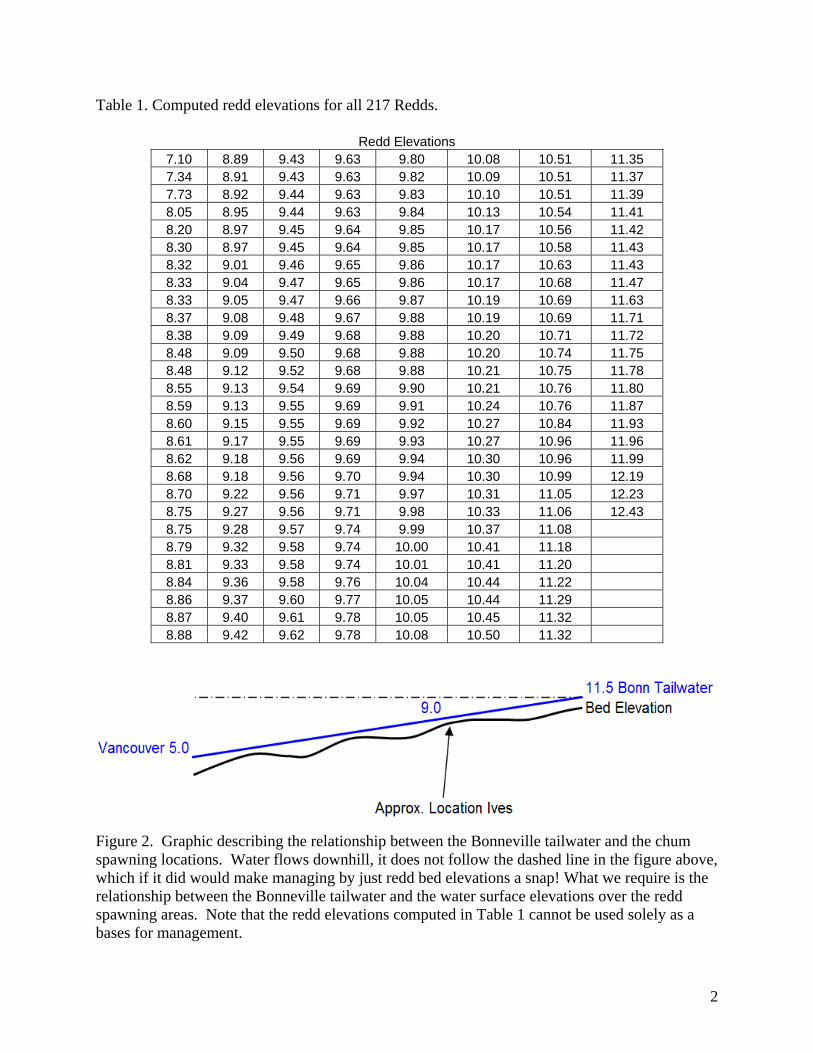
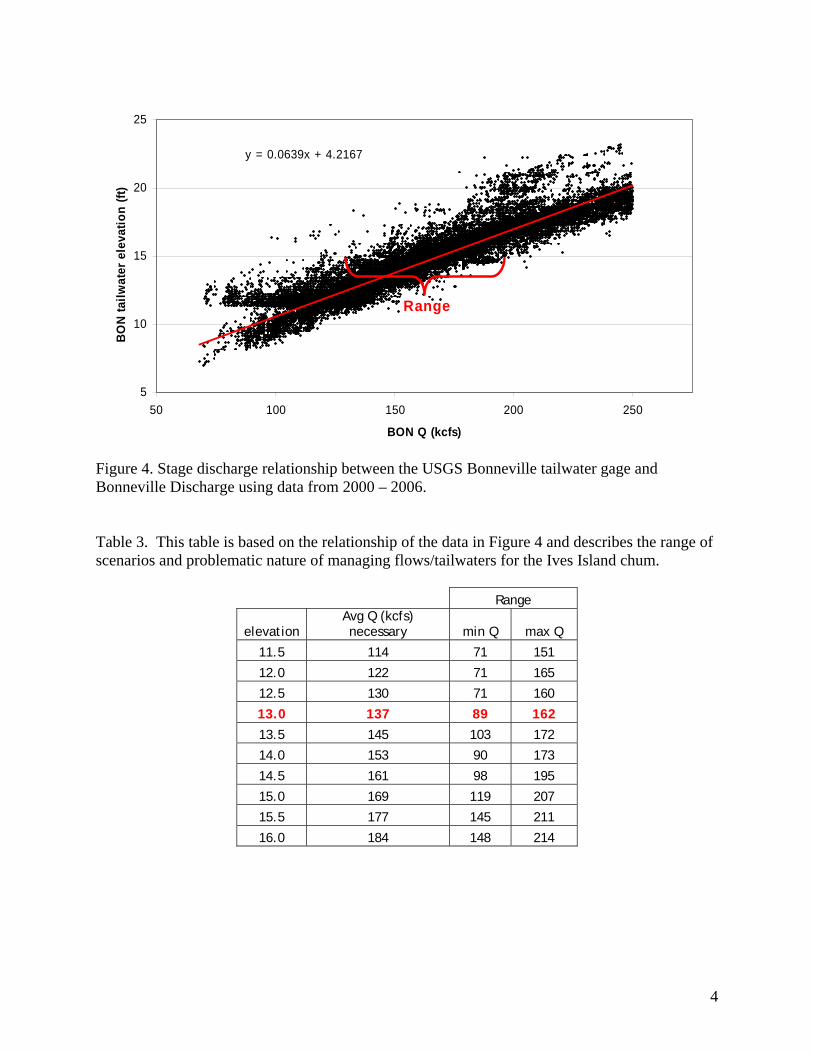
Figure 4. Stage discharge relationship between the USGS Bonneville tailwater gage and Bonneville Discharge using data from 2000 – 2006. Table 3. This table is based on the relationship of the data in Figure 4 and describes the range of scenarios and problematic nature of managing flows/tailwaters for the Ives Island chum.
Range
elevation Avg Q (kcfs) necessary min Q max Q
11.5 114 71 151
12.0 122 71 165
12.5 130 71 160
13.0 137 89 162 13.5 145 103 172
14.0 153 90 173
14.5 161 98 195
15.0 169 119 207
15.5 177 145 211
16.0 184 148 214
11
Libby Flood Control Operation Libby Flood Control Operation
VARQ in 2007VARQ in 2007TMT Meeting January 31, 2007TMT Meeting January 31, 2007
Cindy HenriksenCindy HenriksenUS Army Corps of Engineers US Army Corps of Engineers
22
Libby Dam OperationsLibby Dam Operations
2006 Documentation2006 DocumentationFinal Upper Columbia EISFinal Upper Columbia EISPublic Meeting briefingsPublic Meeting briefingsAfter Action ReportAfter Action Report
January Determination and FindingJanuary Determination and FindingWhat to Expect in 2007What to Expect in 2007
Reduced Flexibility in 2007Reduced Flexibility in 2007
33
2006 Documentation2006 Documentation
Final Upper Columbia EISFinal Upper Columbia EIShttp://www.nws.usace.army.mil/Template/Display/More_http://www.nws.usace.army.mil/Template/Display/More_
Hot_Topics.cfm?recnoHot_Topics.cfm?recno=56=56Public Meeting at Bonners Ferry September 6, 2006Public Meeting at Bonners Ferry September 6, 2006
http://www.nws.usace.army.mil/PublicMenu/Menu.cfm?http://www.nws.usace.army.mil/PublicMenu/Menu.cfm?sitename=PUBLICAFFAIRS&pagename=SpringEvensitename=PUBLICAFFAIRS&pagename=SpringEvent2006t2006Public Meeting at Bonners Ferry November 6, 2006Public Meeting at Bonners Ferry November 6, 2006After Action Report posted on the web page aboveAfter Action Report posted on the web page above
44
January DeterminationJanuary Determinationand Findingand Finding
Signed by General Martin January 5, 2007Signed by General Martin January 5, 2007http://www.nws.usace.army.mil/PublicMenu/dochttp://www.nws.usace.army.mil/PublicMenu/doc
uments/PUBLICAFFAIRS/Libby_Decision_Douments/PUBLICAFFAIRS/Libby_Decision_Document_07.pdfcument_07.pdfThis is a one year decisionThis is a one year decisionOperate in accordance with the VARQ Operate in accordance with the VARQ procedures such that there will be no procedures such that there will be no reduction in flood storage capabilityreduction in flood storage capability
55
What to Expect in 2007What to Expect in 2007
VARQ Flood ControlVARQ Flood ControlAdhere to the VARQ proceduresAdhere to the VARQ proceduresDraft through March using VARQ SRDDraft through March using VARQ SRDBegin VARQ refill outflow at Libby 10 days prior to Begin VARQ refill outflow at Libby 10 days prior to the ICFthe ICFVARQ outflow will be calculated each weekVARQ outflow will be calculated each weekVARQ outflow will not be reduced except for one or VARQ outflow will not be reduced except for one or two days to protect human life and safetytwo days to protect human life and safetyManage to avoid exceeding a stage of elevation 1764 Manage to avoid exceeding a stage of elevation 1764 feet at Bonners Ferry to the extent practicablefeet at Bonners Ferry to the extent practicable
66
What to Expect in 2007What to Expect in 2007
Sturgeon OperationSturgeon OperationMeet the volume recommended for the Meet the volume recommended for the sturgeon tier sturgeon tier Current WSF is 6.995 MAF (110%)Current WSF is 6.995 MAF (110%)The corresponding tiered volume is 1.169 The corresponding tiered volume is 1.169 MAF (approximately 28 days at full MAF (approximately 28 days at full powerhouse)powerhouse)Discussion will be initiated to determine the Discussion will be initiated to determine the 2007 sturgeon flow operation2007 sturgeon flow operation
77
Reduced Flexibility in 2007Reduced Flexibility in 2007VARQ refill outflow will begin on schedule ten VARQ refill outflow will begin on schedule ten days prior to the Initial Controlled Flow (ICF) days prior to the Initial Controlled Flow (ICF) at The Dallesat The Dalles
If the ICF date is computed to be later, VARQ If the ICF date is computed to be later, VARQ outflow may be reduced during the next outflow may be reduced during the next calculationcalculationIf the ICF date is earlier, VARQ outflow may be If the ICF date is earlier, VARQ outflow may be
greater and spill may be needed to meet the flowgreater and spill may be needed to meet the flowStart of Sturgeon flow will be coordinated Start of Sturgeon flow will be coordinated through the TMTthrough the TMT
88
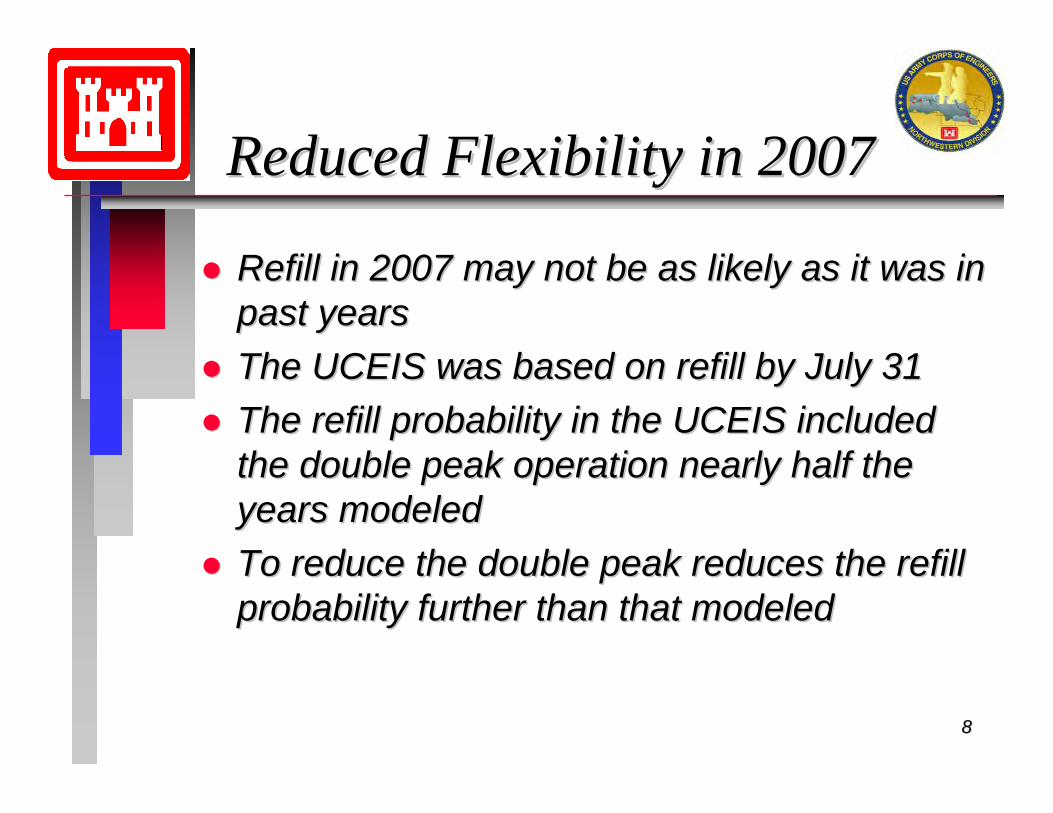
Reduced Flexibility in 2007Reduced Flexibility in 2007
Refill in 2007 may not be as likely as it was in Refill in 2007 may not be as likely as it was in past yearspast yearsThe UCEIS was based on refill by July 31The UCEIS was based on refill by July 31The refill probability in the UCEIS included The refill probability in the UCEIS included the double peak operation nearly half the the double peak operation nearly half the years modeledyears modeledTo reduce the double peak reduces the refill To reduce the double peak reduces the refill probability further than that modeledprobability further than that modeled
VARQ operations can have fish flows overlaid VARQ operations can have fish flows overlaid ––Impact to refill was characterized in UCEISImpact to refill was characterized in UCEIS
(LVI is Libby Operation with VARQ flood control and a (LVI is Libby Operation with VARQ flood control and a sturgeon operation at full powerhouse outflow. LV2 is sturgeon operation at full powerhouse outflow. LV2 is
Standard Flood Control with full powerhouse plus 10,000 cfs)Standard Flood Control with full powerhouse plus 10,000 cfs)
313110 10 LV2LV2
101066LS2LS2
313112 12 LV1LV1
121266LS1LS1
Percent of years with peak Libby ReservoirPercent of years with peak Libby ReservoirElevation Elevation >> 2454 feet 2454 feet
(5 ft from full pool elevation by July 31)(5 ft from full pool elevation by July 31)
Percent of years with peak Libby Reservoir Percent of years with peak Libby Reservoir elevation elevation >> 2458 feet2458 feet
(1 ft from full pool elevation before July 31)(1 ft from full pool elevation before July 31)AlternativeAlternative
1010
Reduced Flexibility in 2007Reduced Flexibility in 2007
May be increased chance of double May be increased chance of double peakpeakPotential for spill to meet required Potential for spill to meet required VARQ outflowVARQ outflowPotential spill to meet VARQ outflow if a Potential spill to meet VARQ outflow if a unit or transmission outage occursunit or transmission outage occurs
Libby OperationsBased on Jan Final Forecast
6.955 MAF
0
10
20
30
40
50
60
70
80
90
31 Dec 31 Jan 28 Feb 31 Mar30 Apr
31 May 30 Jun 31 Jul31 Aug
Flow
(kcf
s)
2370
2380
2390
2400
2410
2420
2430
2440
2450
2460
Inflow Outflow Elevation VARQ SRD
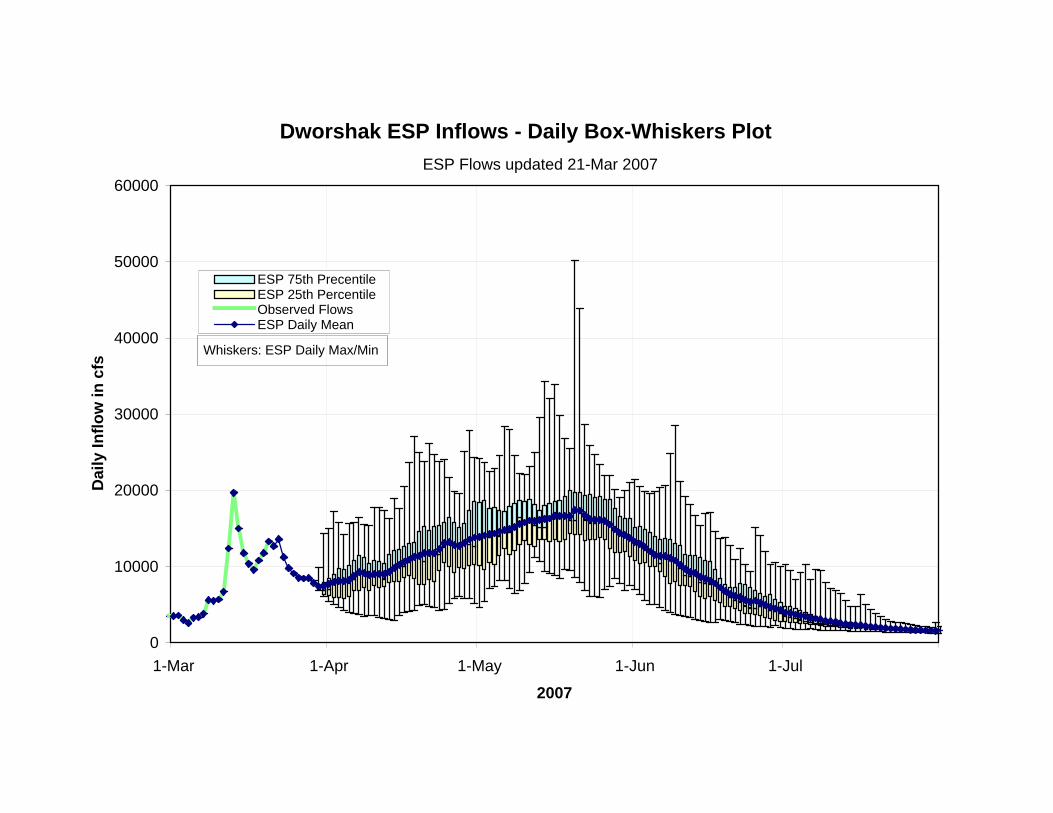
ESP (1/23/07) INFLOWS USED STARTING 1/29/07
APR-AUG VOLUME=6.890 MAF
Libby OperationsBased on Feb Final Forecast
6.5 MAF
0
10
20
30
40
50
60
70
80
90
31 Dec 31 Jan 28 Feb 31 Mar30 Apr
31 May 30 Jun 31 Jul31 Aug
Flow
(kcf
s)
2370
2380
2390
2400
2410
2420
2430
2440
2450
2460
Inflow Outflow Elevation VARQ SRD
ESP (1/23/07) INFLOWS USED STARTING 1/29/07
APR-AUG VOLUME=6.589 MAF
Lower Monumental Outage26 January 2007
0
10
20
30
40
50
60
70
80
90
100
1/25/07 1/26/07 1/27/07 1/28/07
Date
Flow
(kcf
s)
65
70
75
80
85
90
95
100
105
110
115
% T
otal
Dis
solv
ed G
as
Outflow Power Gen Spill %TDG
1
COLUMBIA RIVER REGIONAL FORUM
TECHNICAL MANAGEMENT TEAM January 31, 2007 Meeting
FACILITATOR’S SUMMARY NOTES ON FUTURE ACTIONS
Facilitator: Robin Harkless Notes: Erin Halton
The following notes are a summary of issues that are intended to point out future actions or issues that may need further discussion at upcoming meetings. These notes are not intended to be the “record” of the meeting, only a reminder for TMT members. Water Supply Forecasts Steve King, National Weather Service River Forecast Center, presented several links available on the NWS website to TMT. King described the 2007 seasonal conditions as not necessarily typical of an El Niño year: higher than average precipitation in Canada, which decreases south / southeast and into Idaho. Water supply forecast runs displayed in the links show two tools: regression and ESP models, generated every week to reflect what physically is coming through the system. It was noted that the two models showed similar predictions. January-July 2007 regression model predictions are 84% of average precipitation in the Snake River area with extremely light snow conditions, and 100% of precipitation average for Grand Coulee, with average snow conditions in the Grand Coulee / The Dalles / Lower Granite areas. King informed TMT members of additional details available in the links: comparisons to the past years, contingency forecasts, details on runoff and trends, normal vs. observed statistics, and other year-to-year comparisons. King noted that the climate predictions issued by NOAA showed above average temperatures in the Midwest/west, for both one month and 90-day forecasts. The following is a link to the Northwest River Forecast Center’s water supply forecast page: http://www.nwrfc.noaa.gov/water_supply/ws_fcst.cgi. 2007 Libby Operations Cindy Henriksen, COE, gave a power point presentation on the COE’s January 5, 2007 one year decision to operate Libby under VARQ flood control procedures. The COE uses a Principal Component Analysis for water supply forecasts for Libby. The STP hydrologic model will be used to determine the Initial Controlled Flow (ICF) at The Dalles to trigger the start of the VARQ refill/outflow at Libby. Henriksen said that exceptions for Libby VARQ outflow operations would include a need to protect human life/safety and the need to maintain an elevation of 1764' at Bonners Ferry. Henriksen noted that discussion on 2007 Sturgeon operations will occur in-season and be coordinated through TMT. Henriksen cautioned that refill at Libby may not be as likely this year as it was in previous years, and that reducing the likelihood of a double peak might further reduce the refill probability. Henriksen noted that the need for coordination will continue, in order to balance all the needs in the river, especially during the spring and summer months. Henriksen concluded her presentation with an operation scenarios
2
overview, based on the January final forecast and a later, slightly lesser water supply forecast. Monthly calculations of water supply forecasts will be used to determine the draft and the STP will be used to determine outflows/refill. TMT members acknowledged the COE’s decision to operate to VARQ this year, and will work together to help coordinate in-season management of the operations. Chum Redd GPS Joe Skalisky, USFWS, gave a power point presentation on redd counts through December 2006: an additional 40 redds were counted at the Ives Island area, and added to the 11/22 assessment for a year-end total of 217. He noted that the locations of the redds were centered around the Ives Island area - Multnomah Falls and 1-205 surveys were also conducted but not included in this presentation. Skalisky noted that the numbers in those areas appeared to be less populated than in the past, due perhaps to higher velocities. Results from the Multnomah Falls and I-205 surveys will likely be available at the TMT meeting on 2/14. Skalisky’s presentation included slides with detail on computed redd elevations; redd distribution at flow band levels, and regression between Bonneville tailwater and discharge. Skalisky noted that surveys on bed changes in spawning areas will be conducted this year, and that information will be included in the analysis next year.
Action/Next Steps: A Chum status update will be on the agenda for the 2/14 TMT meeting.
Chum Incubation Status Paul Wagner, NOAA, recommended on behalf of the Salmon Managers maintaining 13' tailwater at Bonneville through the incubation phase. Surveys were to begin later this week.
Action/Next Steps: Continue the current operation of a minimum tailwater of 13', with one nighttime pulse as needed. TMT will have a chum incubation update on the agenda for the 2/14 meeting.
SOR #2007-01 Tom Lorz, CRITFC, presented an SOR to the Action Agencies to maintain the minimum 13' tailwater below Bonneville, and, based on the water supply forecasts for January and February, recommended conservative use of Grand Coulee to insure no impact on April 10 flood control rule curves. John Roache, BOR, said that the recent cold snap had caused the slight draft at Grand Coulee, and that BOR was cognizant of the priorities of chum operations and power conditions. The COE and BPA also acknowledged the request, and all share an interest with the Salmon Managers in maintaining balance for all needs in the system Bonneville Outage Don Faulkner, COE, reported that the COE will need to take 3 power lines out for one day (0700 – 1700 hours), and tentatively suggested 4/16. Faulkner said the goal is to minimize any effects on juveniles in the river, and that 5-7 units would still be available.
3
The Salmon Managers expressed the need to have this outage coordinated with the end of chum emergence. 2007 Water Management Plan Bernard Klatte, COE, thanked TMT members for their comments and said that the latest draft would be posted on the web by the end of 2/2. The latest draft will include the Libby VARQ operation and chum updates. Jim Adams, COE, asked TMT members to pay special attention to revisions in Appendix 4, Section 3.1, on the spill program.
Action/Next Steps: TMT members are asked to review the draft WMP and Fall/Winter Update and submit edits, comments, etc. based on 2007 expectations to Bernard Klatte, COE, before the next TMT meeting on 2/14.
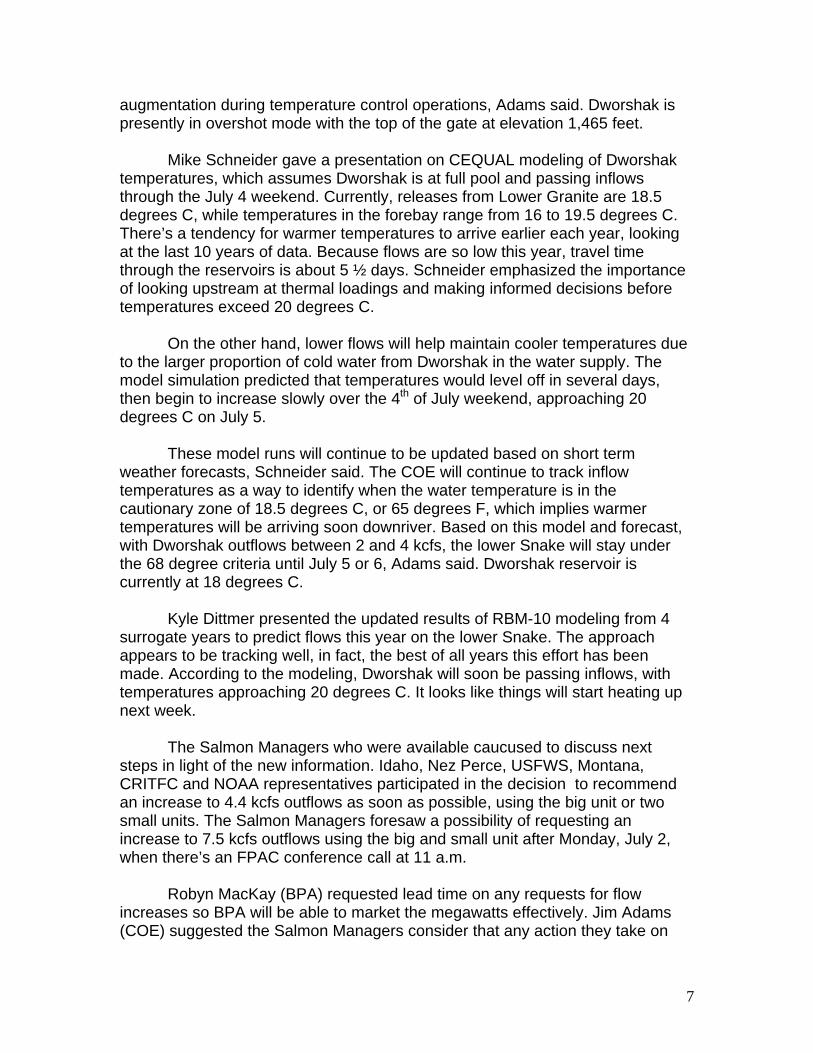
Operations Review Reservoirs: Grand Coulee was at 1273.5', releasing outflows to meet power needs; Hungry Horse was at 3535.82, ', meeting Columbia Falls minimums; Libby was at 2093.1', with outflows at 8.8 kcfs and an end of January target of 2393.7' Dworshak elevation was at 1531.8', releasing 5.8 kcfs and with an end of January target of 1532.3'. Albeni Falls was operating within a 1' range, between 2052.3' – 2053.3', with outflows at 15 kcfs. Fish: (See chum status) Paul Wagner, NOAA, said he expects NOAA’s transportation permit to extend for another year, while awaiting a new BiOP. There will be a more detailed update on this at the 2/14 TMT meeting Power: Nothing to report at this time. Water quality: Jim Adams, COE, reported a one-day outage at Lower Monumental on 1/26: the project went to speed/no load for 8-10 hours and TDG levels were between 113-114%. Next TMT Face-to-Face Meeting, February 14th, 9:00-noon Agenda Items will include: • Final Water Supply Forecasts • Chum Incubation Status and Survey Update • WMP – latest draft comments due before 2/14! • Transportation Permit - Official Update • Operations Review
4
Technical Management Team Meeting Notes
January 31, 2007 1. Welcome and Introductions Today’s meeting was chaired by Robin Harkless, with representatives from COE, NOAA-F, BPA, USFWS, BOR, NWRP, and the states of Oregon, Washington, Idaho and Montana in attendance. The following is a summary (not a verbatim transcript) of the topics discussed and decisions made at the meeting. Anyone with questions or comments about these notes should provide them to the TMT chair or bring them to the next TMT meeting. 2. Review Minutes There were no comments on the January 17, 2007, meeting minutes, which are posted on the Corps website at: http://www.nwd-wd.usace.army.mil/tmt/agendas/2007/. 3. January Water Supply Forecasts A. Main Water Supply Page – Overview. Steve King of the National Weather Service gave a presentation explaining the final water supply forecasts on the Northwest River Forecast Center web page (www.nwrfc.noaa.gov). The mid month water supply forecast for April-Sept. 2007 shows above normal water supply in the Northern Cascades, Washington and Canada, and below normal supply in the Snake River area and southeastern Oregon. B. Current Month Precipitation. The January final forecast had an assumption of 75% precipitation from Jan. 15-Feb. 1, then normal precipitation for the rest of the month. The current month’s forecast will include the early bird forecast, showing 60% precipitation basinwide from Feb. 1-15, then normal precipitation throughout the rest of February.
King explained the three different types of forecasts. The final forecast, typically issued on the 6th working day of each month from January to July, incorporates all information gathered regarding snow, precipitation and runoff through the previous month. It is the most official forecast of the region’s water supply. To provide updates, the RFC also issues a midmonth forecast and an early bird forecast, issued near the first of each month.
C. Seasonal Month Precipitation. The weekly update of seasonal
precipitation (Oct. 1-Jan.22) shows fairly wet conditions for the season in the northern Cascades, healthy conditions in Canada, and dry conditions in the south and east, particularly southeastern Oregon.
5
D. Snow. Snow conditions are light at present throughout much of the Columbia Basin. Precipitation in fall has been warmer and wetter than usual. Snow conditions in the Snake are extremely sparse and dry. Approximately 30% of runoff in the Pacific Northwest comes from Canada, where snow conditions are generally above normal, and another 30% comes from the northern Rockies, where snow conditions are light at present. Conditions are average in the northern Cascades. Overall, King said. We can expect to see reasonably healthy water supplies at Grand Coulee this year, and lesser than normal water supplies in Lower Granite, with The Dalles reflecting a combination of the two forecasts.
E. Water Supply Seasonal Volume Forecast/ESP. King noted that we
are in an El Nino year, but that in many cases, observed weather patterns have not reflected what is assumed to be typical for El Nino years. Conditions are drier than normal this spring. The RFC runs several different models for forecasts, including a traditional regression-based forecast, and one based on ensemble streamflow predictions, or ESP. King showed the two forecasts side by side for three areas.
Lower Granite Dam/Snake River (Jan.-July 2007). The most expected
water volume is 84% of normal now, reflecting low observations of snow and rain according to the regression forecast. The ESP forecast is 25 maf, which is equivalent to the 25 maf regression forecast for the same period.
Grand Coulee Dam/Columbia River (Jan-July 2007). The regression
forecast shows water supplies at Grand Coulee as approximately 100% of normal thanks to a large snowpack in Canada. The ESP forecast for the same period is 55 maf, which is quite a bit drier than the regression forecast. ESP forecasts are more up to date, King said. Both forecasts use reliable techniques of prediction. Many NWRFC customers use forecasts based on traditional regression techniques, however, one use of ESP forecasts is to use it as a trending tool.
The Dalles Dam/ Columbia River (Jan/July 2007). This isn’t as close to
normal as Grand Coulee, said King. The Jan-July regression forecast is103 maf, 96% of normal. The ESP forecast for the same period is 94.6 maf, also lower than normal.
King gave a brief overview on how to navigate the NWRFC web page. On
a graph showing the history of forecasts issued this year for The Dalles, every water supply forecasts showed a downward trend. He demonstrated a climate forecast product that indicated that areas of the Columbia Basin are likely to be warmer than normal for February.
6
4. Libby 2007 Operations Cindy Henriksen (COE) gave a presentation on VARQ flood control operations at Libby Dam for 2007. Other documents that contributed to the operations decision for 2007 were the Corps After Action Report of November 2006and the final Upper Columbia EIS in April 2006.These documents can be found on the web at the following link: http://www.nws.usace.army.mil/Template/Display/More. The EIS is final, although the Corps hasn’t signed the ROD yet, Henriksen said. The Corps has signed a ROD on the 2006 USFWS BiOp.
In 2007, people can expect reduced flexibility than previous years as the Corps implements strict VARQ flood control. In addition there will releases for sturgeon and summer salmon runs. On Jan. 5, 2007, General Martin signed a determination and finding for flood control and operation at Libby, which is available at the following link: http://www.nws.usace.army.mil/PublicMenu/documents/PUBLICAFFAIRS/Libby.
Henriksen explained how the one-year determination to operate in accordance with strict VARQ procedures will affect operations at Libby. The outflow from Libby will not be reduced below the VARQ outflow if the reduction will reduce the flood storage capability that may be available at Libby from April to June. The only exception is that Libby may reduce the outflow fro one or two days to keep the stage at Bonners Ferry below elevation 1764 feet. If the National Weather Service lowers the flood stage at Bonners Ferry to elevation 1762 feet, the Crops will operate to elevation 1764 feet this year. Libby is currently on track to meet January VARQ flood control elevations.
VARQ Refill Outflow Calculations. During the refill period, VARQ refill
outflow will begin 10 days prior to the initial controlled flow (ICF) at The Dalles. Both regression and ESP forecasts could be used to make various decisions regarding reservoir operations in the Northwest. Regression forecasts are generally water supply forecasts or volumes of water over a period of time. The Corps uses the ESP forecast as a streamflow, inflow forecast for hydrologic operation of reservoirs. At Libby, the Corps prepares its own water supply forecast to determine the end of month draft. These forecasts are very similar to the water supply forecasts the RFC prepares. At Libby, the Corps will begin refill outflow 10 days prior to the initial controlled flow at The Dalles. Based on forecasts, the Corps might have to begin a VARQ draft with a quick turnaround time at Libby. Once VARQ outflow is calculated, the Corps won’t reduce outflows below that amount unless needed to protect human life and safety downstream of Libby Dam. The Corps will, to the extent practical, avoid exceeding the flood stage of 1,764 feet elevation at Bonner’s Ferry.
Sturgeon Operations in 2007. The Corps expects to release water from
Libby Dam to meet tiered volume outflows specified in the USFWS 2006 BiOp.
7
The current water supply forecast prepared by the Corps is 6.995 maf, 110% of normal. The corresponding tiered volume is 1.169 maf, or approximately 28 days of outflow full-powerhouse from Libby Dam. Every year, sturgeon flow timing is a bit different, and the Corps will work with USFWS to determine the objectives of sturgeon flows this year. However, the Corps won’t use the anticipated release of the sturgeon volume to lower a VARQ outflow because releasing less than VARQ flows could potentially compromise flood control storage capacity.
However, when VARQ outflows are combined with sturgeon flows, less
refill can be expected this year than in 2003-06, Henriksen said. The combination might also result in a double peak operation at Libby, which is a high flow in May or early June for sturgeon, followed by lower flows to refill in June, then high flows in July and August to reach the draft limit of elevation 2,439 at Libby. Refill in 2007 might not be as likely as it was in past years, and reducing the double peak operation in June would make refill even less likely. The Upper Columbia EIS was based on refill during the month of July and included the double peak operation during nearly half the years modeled. The planning of sturgeon flows, as well as any double peaks, will be coordinated through the TMT.
Probabilities of refill under different scenarios are shown in the Upper
Columbia EIS, as well as online at the Corps website shown on page 1 of these notes. The probability of refill table is Table 3-15 of the EIS document. Under Alternative LV1, or Libby operation with VARQ flood control and a sturgeon operation at full powerhouse outflow beginning May 20, the probability of refill in July to within 1 foot of full was 12%; to within 5 feet of full, 31%.
There may be spill to meet VARQ outflow if there is an unexpected
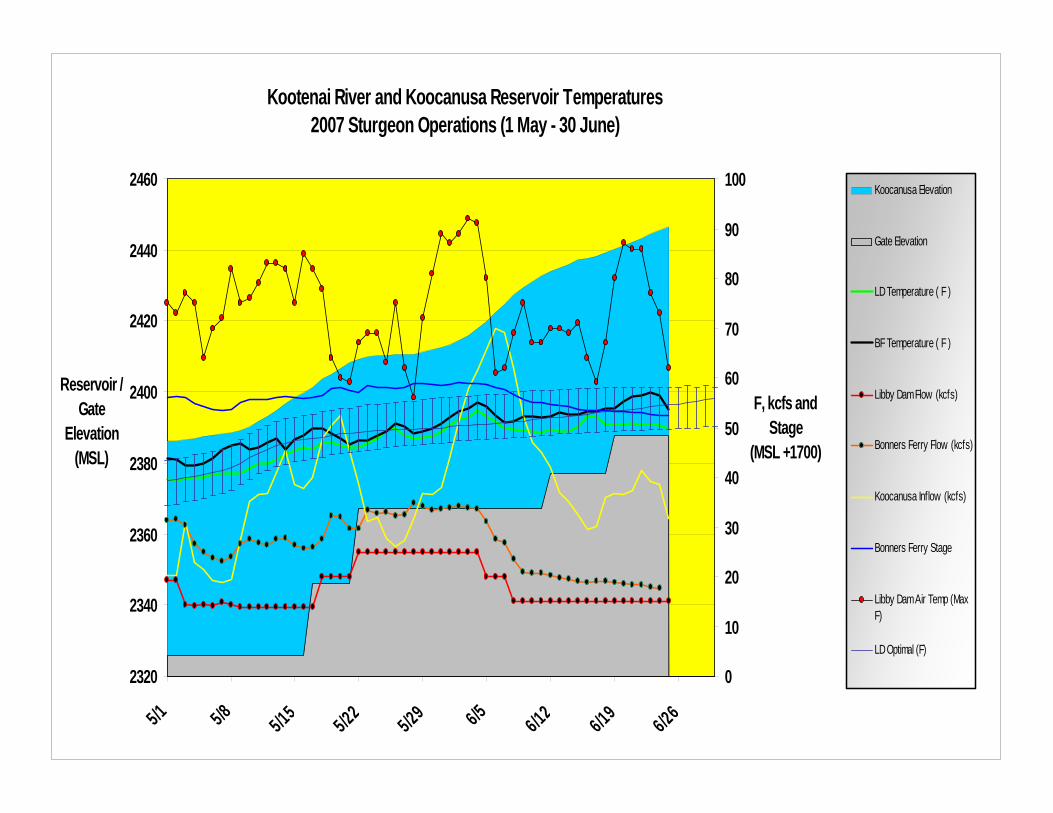
outage. The Corps will try to make the best choices for May-July operations to meet all goals of the ESA under VARQ constraints, Henriksen said. A graph modeling an inflow volume of 6.995 maf – which is close to the Corps’ January final water supply forecast – shows Libby drafting through the end of April, then beginning VARQ refill on May 1. The sturgeon outflow began May 20 and released the tiered volume per the 2006 US Fish and Wildlife BiOp. In this scenario the reservoir filled to about elevation 2445 feet, about 14 feet from full. TMT will be informed as to the requirements of drafting to VARQ draft points, and the refill outflow. There is also a scenario where the Libby inflow volume was 6.5 MAF. In this scenario the VARQ outflow began May 1 and the sturgeon outflow began May 20. Because of the shape of the inflow in this second scenario, the VARQ outflow was low for the first two weeks of May until the sturgeon outflow began. This was a later inflow shape than the other scenario and the reservoir filled to about elevation 2455 feet, about 4 feet from full. The message here is that the shape of the inflow will influence the reservoir refill and the potential need for a double peak operation at Libby in 2007.
Initial Controlled Flow. ICF is the unregulated flow – as if there were no
dams in the Columbia basin – as measured at The Dalles. ICF determines when
8
refill of upstream reservoirs should begin. This is an important factor in VARQ operations. Once the unregulated flow at The Dalles reaches that quantity, which varies by year , the objective will be to regulate outflow at the dams to meet that particular flow as a regulated flow at The Dalles for the remainder of the refill period. The TMT web page has links to end-of-month flood control elevation targets for all of the Pacific Northwest dams. Monthly ICF calculations are shown at the bottom of that flood control web page. ICF is based on many variables updated frequently – it is a constantly moving technical target, Henriksen said. Flood control elevations are calculated monthly, with water supply forecasts prepared by the National Weather Service, primarily.
In the past, in the ongoing tradeoff between the river and the reservoir,
double peaks have been damaging to the river environment, Jim Litchfield (Montana) said. Montana would like to see stable flows in summer months into September. The operation Montana favors would be managing outflows at Libby in late June through September to produce the most stable outflows possible, based on storage volume plus expected inflows, with weekly or biweekly adjustments based on how inflows are changing. The point is to avoid crashing in June and July, then maxing outflows in August to move salmon downstream, which is damaging to the river environment. Jim Litchfield observed that the modeling prepared for the EIS included nearly half the years modeled having a double peak operation. I did not do the modeling, Henriksen said, but I understand that 44% of the years modeled had a double peak. With this low level of refill and the double peak, we need to be mindful of the end of season sturgeon operation, said Litchfield. Even with the scenarios you showed in your presentation, these steady outflows are not necessarily what Montana would like to see. Reducing outflow to 20 kcfs flow for the entire summer is not particularly attractive in Montana, where the resulting high flows would cause problems for resident fish. 5. Chum Redd GPS Locations and Modeled Tailwater Elevations Joe Skalicky (USFWS) gave an update on his studies of chum incubation in the Columbia River near Ives Island. Redds have been mapped through December, including an additional 40 to the previous assessment of 177, for a total of 217 redds in the Ives area. Four pages of maps at the end of the SOR considered today (see discussion to follow in these notes) show the exact chum redd locations. Unlike other years none of the redds are documented on the Oregon shore or downstream at the I-205 area – all are in an isolated area near Ives Island. Skalicky noted that redds are particularly hard to sight this year due to turbid conditions and limited depth visibility of only a foot or so. Paul Wagner (NOAA-F) noted that the area on the Oregon side of the river between Ives Island and the shoreline – normally a popular area for spawning – is less populated this year than usual. Skalicky said that might be due to the fact that flows have been higher, so redds are planted deeper in the river and harder to
9
sight than normal, given recent poor visibility. For the most part, river velocities have been too high this year for chum to spawn in that area. Skalicky cautioned against making false assumptions that redds will be safe if their elevations are below tailwater elevations. Because water flows downhill, the decrease in water surface elevations is hard to predict. He provided all redd elevations (Table 1 in the SOR) but can’t say, for any given tailwater elevation, how many redds will remain underwater (Table 2 in the SOR). The vast majority of redds most likely to survive low flows are at the mouth of Hamilton Creek, where there has been an intentional effort to keep redds at lower elevations. The effort has apparently succeeded, Skalicky noted. Skalicky’s presentation includes a regression flow model, which shows a 13-foot tailwater corresponds to approximately a 140 kcfs flow; the map depicts which redds would be covered and which exposed. Table 3 describes the range of scenarios and problematic natures of managing flows and tailwaters for the Ives Island chum. Tidal effects on tailwater levels were not analyzed, but could be considered later, Skalicky said. 6. Chum Incubation Status Maintaining a 13 foot tailwater is of enormous value to chum incubation, said Wagner. Half a foot less in elevation means another 30% of the chum population would probably dry up. The main objective this year is to maintain a 13 foot elevation at the Tanner Creek gage, if at all possible; that is the preferred alternative for salmon managers. The current operation level is to maintain a minimum tailwater of 13 feet with at least one pulse of 20 minutes’ duration or greater than 13.5 feet once a day, Bernard Klatte (COE) said.
Harkless asked, should chum incubation be a standing TMT agenda item? Wills (USFWS) replied that the February water supply forecast will be available by the next TMT meeting. Wills said he would supply numbers for the I-205 and Multnomah Falls chum redd counts on the TMT web page, so this item can be covered in subsequent emails and doesn’t need to be on the next agenda. Cathy Hlebechuk reiterated what Bernard Klatte had said, the current operation is to maintain a minimum tailwater of 13 feet with at least one pulse of 20 minutes duration greater than 13.5 feet once a day. 7. Bonneville SOR #2007-01 In light of the previous two presentations (VARQ operations requirements and chum spawning elevations), Tom Lorz (CRITFC) presented the salmon managers’ concerns for this year. They are asking for judicious operation of Grand Coulee to maintain the 13 foot elevation below BON through chum spawning season, given that dropping to lower elevations may mean a loss of 30% of the redds. John Roache (Reclamation) said Reclamation is aware of the declining water supply conditions and have been discussing future operations
10
with BPA accordingly. He also stated Grand Coulee’s operational priorities for this time of year are to meet ESA obligations (April 10 URC and chum flows) as well as the power requirements that are placed on the project. Robyn MacKay (BPA) reiterated these statements adding that below normal temperatures in the Northwest load centers in January resulted in the increased draft rate at Grand Coulee and that temperatures in February are forecasted to be warmer. Cathy Hlebechuk of the Corps said the Corps defers to Reclamation and BPA on this issue. Maintenance of drum gates at Grand Coulee may proceed if flood control drafts the project below a 1,255-60-foot elevation for a five week period, Roache said. 8. Bonneville Transmission Outage The tentative outage date is April 16, from 7 am to 5 pm, which was chosen because it’s likely to be after chum have emerged. Three power lines will be out of service for one day, which means approximately 5-7 units will remain available. Spill for juvenile salmonid migration will start on April 10. Daytime operation at Bonneville is supposed to be 100 kcfs of spill for 24 hours/day at that time. Five to seven units are planned to be on, Scott Bettin (BPA) said. At least 3 units must be operating to get minimum generation requirements. This would be happening during a spill period, so spill would be occurring anyway, Wagner noted. Once the date is chosen, it is inflexible. Delaying it would mean moving into May, when flows are higher and chances of exceeding the gas cap increase dramatically. The TMT agreed on April 16 for the outage.
Chum are still incubating, so there are no predictions yet regarding emergence. Regarding spill, one of ODFW’s concerns is that, if spill doesn’t start until April 10, field sampling will be delayed. It appears that spill will be needed prior to April 10 to do the chum study, Rick Krueger (Oregon) said. If researchers wait too long, they won’t get fish. The TMT will receive chum incubation information before the next TMT meeting.
9. Water Management Plan TMT members have until the next meeting on Feb. 14 to comment on the fall/winter update to the Water Management Plan, Klatte (COE) said. There have been updates since TMT members last commented on the plan; the current version is posted on the TMT website. The latest draft includes new language regarding chum incubation, as well as VARQ information, so Klatte urged TMT members to review it. The revisions appear in track-changes mode so they are visible; Klatte said there should be no big surprises.
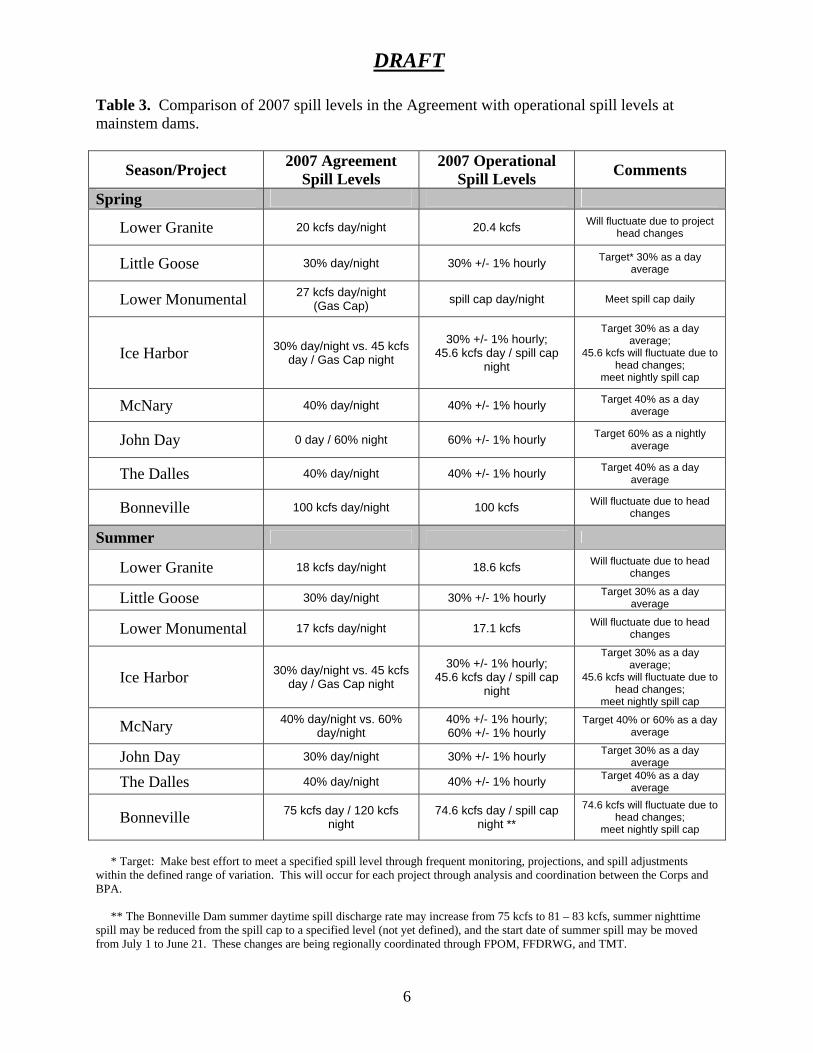
Appendix 4, dated Jan. 18, includes a table describing the proposed spill program, project by project, based on an agreement between the action agencies and tribes that was submitted to the court, Adams said. Adams gave an example of how the material in the table has been interpreted. Last year, the Corps
11
assumed that the prescribed operation for Lower Monumental was 27 kcfs during spring, meaning that 27 was a maximum. This year, it’s considered an estimate, and the Corps will spill to the spill cap, which may be less than the maximum spill rate. Questions and comments on Appendix 4 and on the water management plan should be directed to Klatte. The TMT will finalize the plan at their next meeting Feb. 14. The IT has requested a briefing on it at their March 1 meeting. 10. Operations Review A. Reservoirs. Hungry Horse is at 35.82 elevation; putting out 25-26 kcfs. This operation level will continue until the next forecast, Roache said.
Grand Coulee is at 1,273.5 elevation; with releases being made to meet power demands and maintain a 13 foot tailwater.
Libby is at 2,394, with 8.8 kcfs outflow. The end of January flood control
elevation is 2,393.7 feet. Dworshak elevation is 1,531.18. The end of January flood control
elevation is 1,532.3. Albeni Falls is still operating within a range of 2,052.3-2,053.3 elevation,
with 15 kcfs outflow. B. Fish. Other than the chum concerns already discussed, the only thing to report is that the transportation permit will be extended for another year until the BiOp is complete, Wagner said. There will be an official update at the next TMT on transportation.
C. Power System. There is nothing new to report, McKay said. D. Water Quality. During a one-day outage at Lower Monumental, gas
levels got as high as 113-114%. 11. Next TMT Meeting The group will meet next on Feb. 14, Valentines Day. The agenda will include the final water supply forecast, chum incubation status, an update on the chum spawning study, final water management plan, transportation permit status, and the usual operations review. Anyone with agenda items to add should contact Cathy Hlebechuk or Robin Harkless. This summary prepared by BPA contractor Pat Vivian.
12
Technical Management Team Meeting Participants
January 31, 2007 Name Affiliation Cathy Hlebechuk COE Robyn MacKay BPA Jim Litchfield Montana Ray Gonzales COE Paul Wagner NOAAF Dave Wills USF&WS Rick Kruger ODFW John Roache BOR Rich Demangue NOAAF Cindy Henriksen COE Don Faulkner COE Bernard Klatte COE Jim Adams COE Tim Hazenrader PPM Energy Holly Krebs Sempra West Power Marketing Jennifer Miller Steve King RFC Russ Kiefer IDFG Tony Norris BPA Erin Halton DS Consulting Mike Butchko PowerEx Barry Espenson Columbia Basin Bulletin Scott Bettin BPA Tom Le AVISTA Joe Skalicky USF&WS John Senowich ?? PUD Ruth Burris PGE Bruce Mackay Consultant Terry Wiek Carolyn Fitzgerald COE-NWS Shane Scott NW River Partners
T E C H N I C A L M A N A G E M E N T T E A MBOR : John Roache / Mary Mellema BPA : Robyn MacKay / Scott BettinNOAA-F: Paul Wagner USFWS : David Wills / Steve HaesekerOR : Rick Kruger / Ron Boyce ID : Russ KieferWA : Cindy LeFleur MT : Jim Litchfield
COE: Cathy Hlebechuk / Jim Adams
TMT MEETING Wednesday February 14, 2007 09:00 - 12:00
1125 N.W. Couch Street, Suite 4A34 Portland, Oregon 97209
Conference call line: 503-808-5190
If you plan on attending the meeting in our building you will now need to call ahead and let Cathy Hlebechuk (503)808-3942 or Jim Adams (503)808-3938 know, so your name can be added to the TMT Visitor List for access to the building. Also you will need to present a form of ID at the guard's station so a photo can be taken and an
ID badge issued for the day.
If you are a federal employee you will only need to present your government ID.
We have had disruptions on the phone because people are not hitting 'mute' after dial in.Please MUTE your Phone
All members are encouraged to call Robin Harkless with any issues or concerns they would like to see addressed. Please e-mail her at [email protected] or call her at (503) 248-4703.
AGENDA
1. Welcome and introductions2. Review Minutes: [Meeting Minutes] 3. Final Water Supply Forecasts.
[Columbia River Summary][Libby Forecast][Dworshak Forecast][RFC Forecast]
4. Finalize - Water Management Plan and Fall / Winter Update.
5. Chum Incubation Status; I-205 and Multnomah Falls Survey Update.6. Adult Fallback Hydroacoustic Study, Bernard Klatte, COE.7. Transportation Permit - Official Update.8. Ice Harbor Spring/Summer Outage - Mike Viles, BP. [Sacajawea Transformer Failure] 9. Operations Review
ReservoirsFish
[2007 Forecasts For Columbia River Spring Chinook, Summer Chinook, Sockeye and Steelhead]
[COLUMBIA RIVER FALL CHINOOK 2007 PRESEASON FORECASTS]
Power SystemWater Quality
10. OtherSet agenda for next meeting - February 28, 2007 [Calendar 2007]
Questions about the meeting may be referred to Cathy Hlebechuk at (503) 808-3942 or Jim Adams at (503) 808-3938
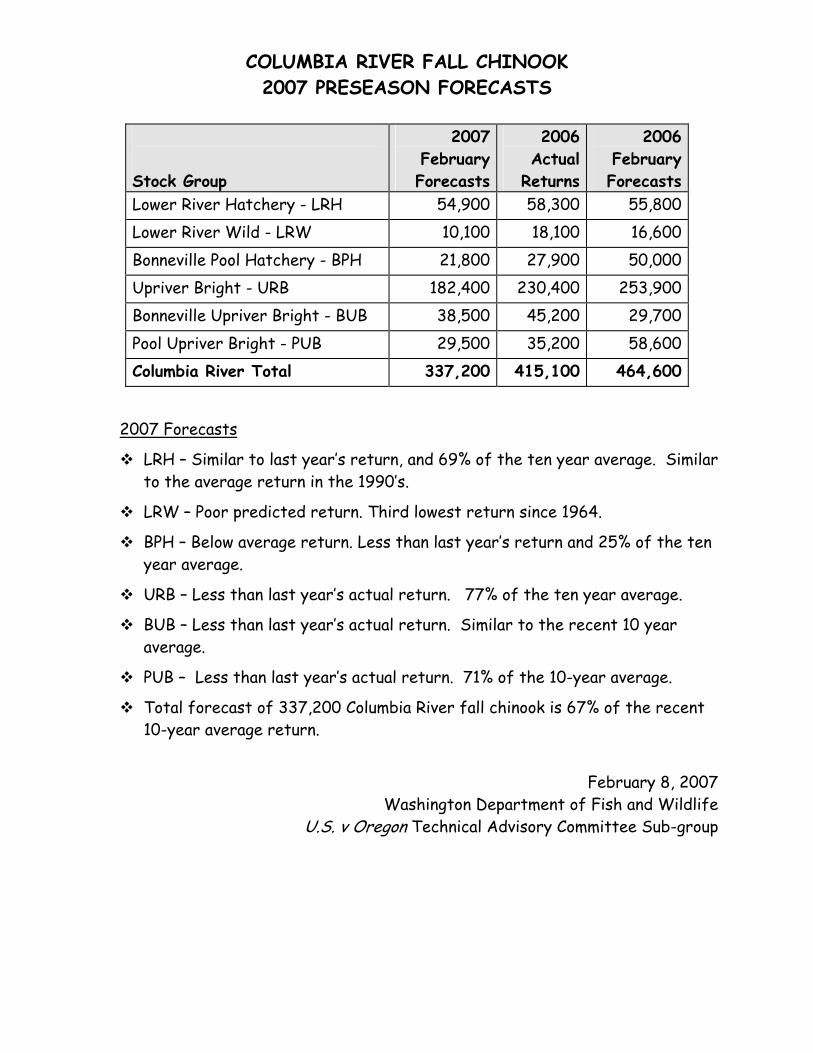
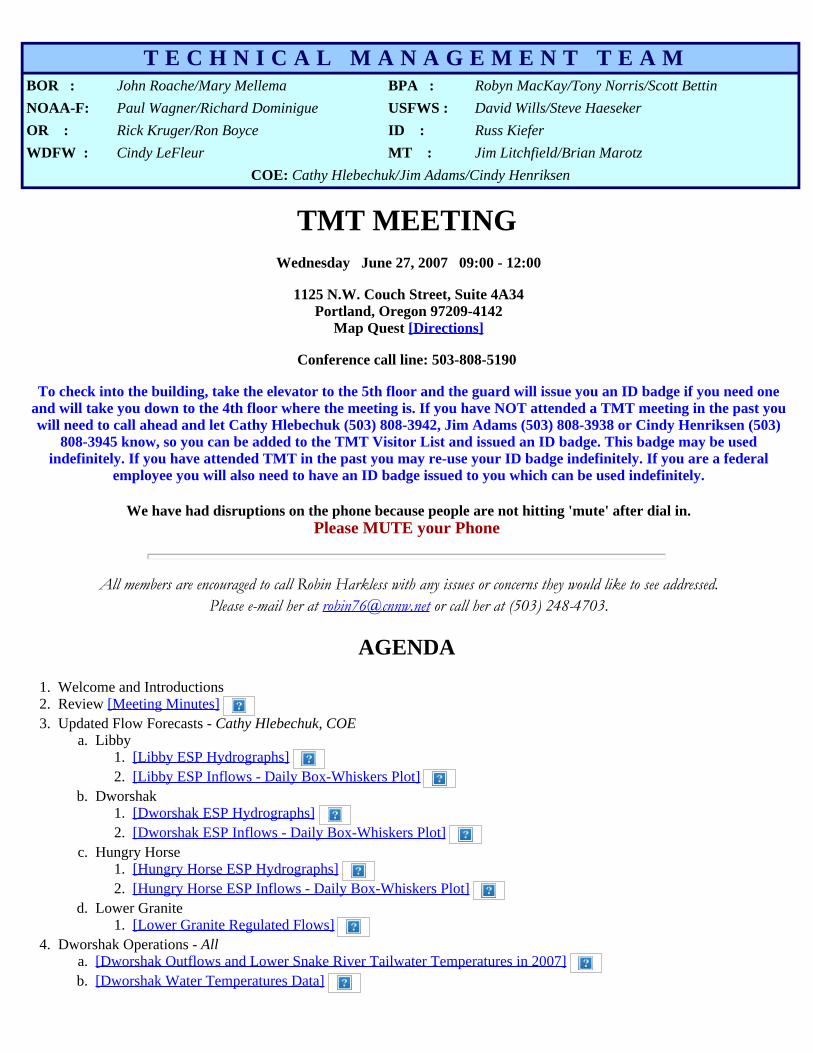
COLUMBIA RIVER FALL CHINOOK 2007 PRESEASON FORECASTS
Stock Group
2007 February Forecasts
2006 Actual
Returns
2006 February Forecasts
Lower River Hatchery - LRH 54,900 58,300 55,800 Lower River Wild - LRW 10,100 18,100 16,600 Bonneville Pool Hatchery - BPH 21,800 27,900 50,000 Upriver Bright - URB 182,400 230,400 253,900 Bonneville Upriver Bright - BUB 38,500 45,200 29,700 Pool Upriver Bright - PUB 29,500 35,200 58,600 Columbia River Total 337,200 415,100 464,600
2007 Forecasts
LRH – Similar to last year’s return, and 69% of the ten year average. Similar to the average return in the 1990’s.
LRW – Poor predicted return. Third lowest return since 1964.
BPH – Below average return. Less than last year’s return and 25% of the ten year average.
URB – Less than last year’s actual return. 77% of the ten year average.
BUB – Less than last year’s actual return. Similar to the recent 10 year average.
PUB – Less than last year’s actual return. 71% of the 10-year average.
Total forecast of 337,200 Columbia River fall chinook is 67% of the recent 10-year average return.
February 8, 2007
Washington Department of Fish and Wildlife U.S. v Oregon Technical Advisory Committee Sub-group
2007 Forecasts_spring-10Jan07.doc
2007 Forecasts For Columbia River
Spring Chinook, Summer Chinook, Sockeye and Steelhead 2006
Forecast 2006
Return 2007
Forecast Upriver Spring Chinook 1/ 88,400 132,100 78,500 Snake River Spring/Summer Chinook 2/ 46,200 53,000 38,500 Snake River Wild Spring/Summer Chinook 3/ 14,600 16,700 13,100 Upper Columbia Spring Chinook 2/ 12,600 21,100 9,200 Upper Columbia Wild Spring Chinook 4/ 1,600 2,800 1,200Upper Columbia Summer Chinook 49,000 76,200 45,600Willamette Spring Chinook 46,500 59,700 52,000Cowlitz, Kalama, Lewis River Spring Chinook6 15,200 20,100 15,900Yakima Spring Chinook6 6,700 6,000 4,100Klickitat Spring Chinook6 1,300 1,700 1,200Wind6 7,500 4,700 2,100Little White Salmon6 12,500 10,500 6,000Sockeye5/ 31,100 37,100 27,300 Wenatchee Stock 7,800 10,300 6,600 Okanogan Stock 23,300 26,700 20,700 Snake River Sockeye 21 79 300 Steelhead Wild Winter Steelhead 16,000 16,600 16,200Summer Steelhead Skamania Hatchery 11,800 7,700 12,300 Skamania Wild 3,800 2,200 4,400 A-Index Hatchery 187,300 181,400 199,900 A-Index Wild 66,100 63,700 41,600 B-Index Hatchery 45,600 65,700 45,600 B Index Wild 9,800 8,500 10,800 Total Summer Steelhead 324,400 329,200 314,600 1/ Includes Snake River Summer Chinook.
2/ Included in Upriver Spring Chinook number.
3/ Included in Snake River Spring/Summer Chinook number.
4/ Included in Upper Columbia Spring Chinook number.
5/ Includes Wenatchee, Okanogan, and Snake River stocks.
6/ To mouth of tributary
Prepared by U.S. v Oregon Technical Advisor Committee December 11, 2006
Revised January 10, 2007
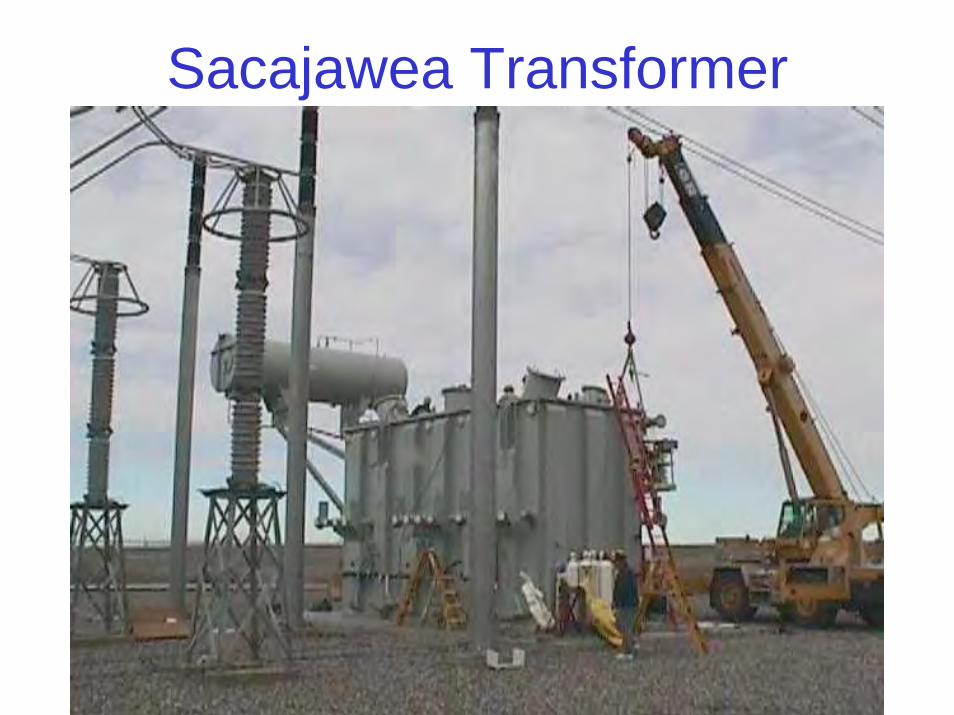
Sacajawea 500/115 kV Transformer Failure
Mike Viles – BPA Transmission Operations
Technical Management Team
February 14, 2007
Background• On November 22, 2006, BPA’s
Sacajawea transformer T-1755 was tripped off by a sudden pressure relay.– Subsequent inspection indicates there are
internal problems that cannot be fixed on site
– Repair of the transformer could take up to a year
Sacajawea Transformer
Sacajawea Transformer
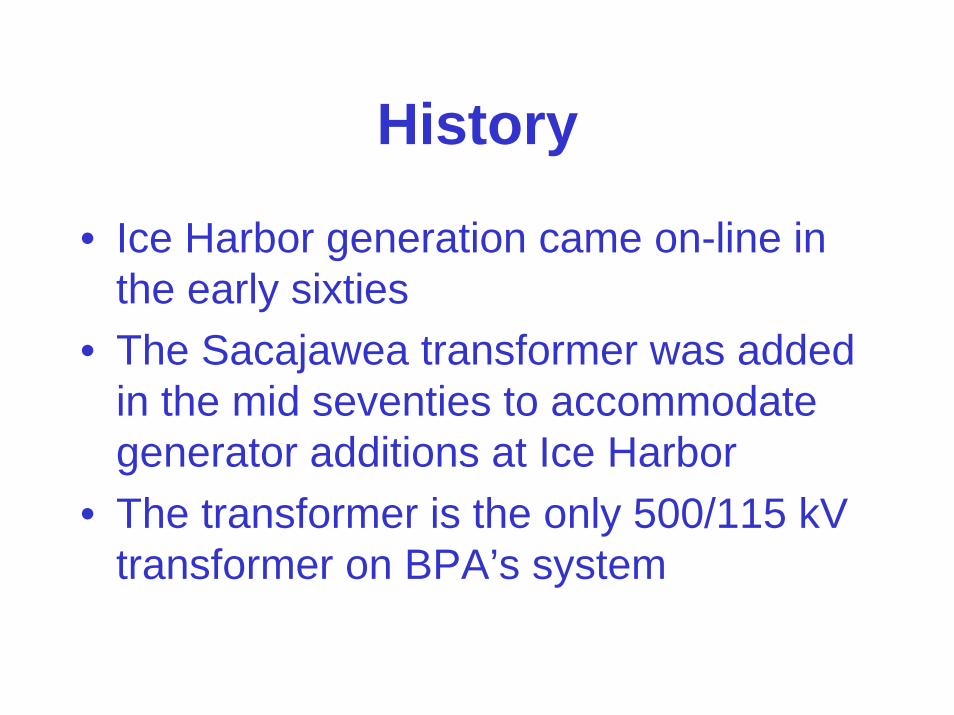
History
• Ice Harbor generation came on-line in the early sixties
• The Sacajawea transformer was added in the mid seventies to accommodate generator additions at Ice Harbor
• The transformer is the only 500/115 kV transformer on BPA’s system
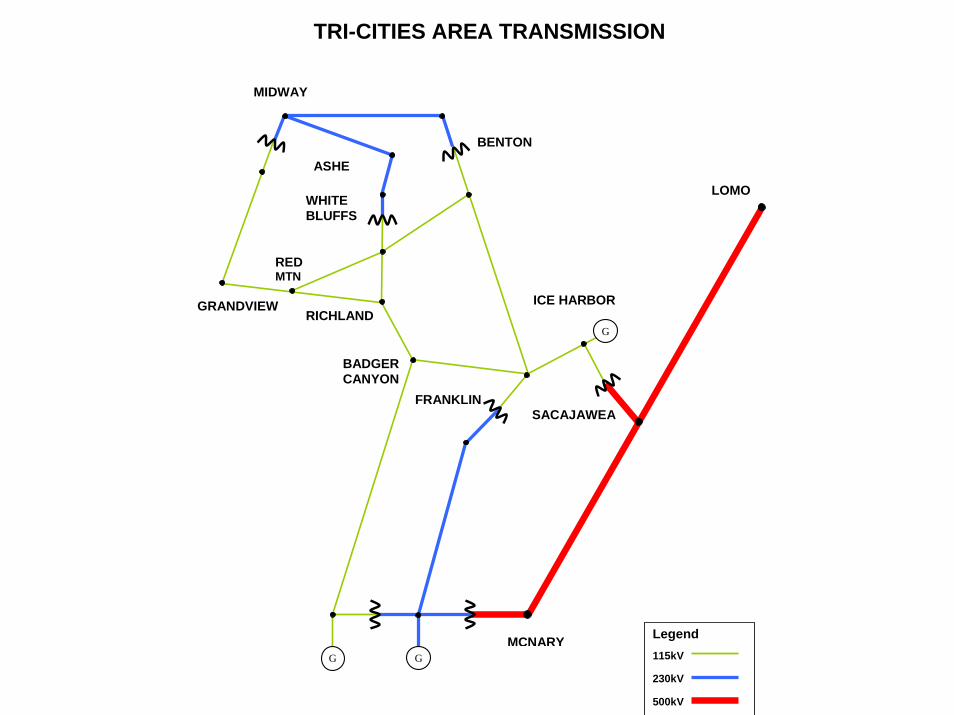
Existing Transmission System• There are three main sources of
power and voltage support in the Franklin substation area (see next slide)
Problems with the SacajaweaTransformer Out of Service
• Two Ice Harbor units need to be on-line to provide voltage support following an unplanned outage of the McNary-Franklin 230 kV transmission line or the Franklin 230/115 kV transformer
• Keeping two Ice Harbor unit on-line can be a challenge in April prior to the run-off and July-August after the run-off
Solution Until Transformer Fixed
• Adding one 20 MVAR mobile capacitor group at Franklin by April 1 will reduce the Ice Harbor units needed to one during spring
• Summer load can be up to 25% higher than spring
• Adding a second 20 MVAR mobile capacitor group at Franklin by July 1 will reduce the Ice Harbor units needed to one during summer
• With these capacitor additions, only one Ice Harbor unit will be required to be on-line
Questions?
1
COLUMBIA RIVER REGIONAL FORUM
TECHNICAL MANAGEMENT TEAM February 14, 2007 Meeting
FACILITATOR’S SUMMARY NOTES ON FUTURE ACTIONS
Facilitator: Robin Harkless Notes: Erin Halton
The following notes are a summary of issues that are intended to point out future actions or issues that may need further discussion at upcoming meetings. These notes are not intended to be the “record” of the meeting, only a reminder for TMT members. Final Water Supply Forecasts Cathy Hlebechuk, COE, presented on several water supply forecast links to the TMT agenda, including end of month flood elevation targets and 2007 runoff forecasts. The end of February flood control target for Libby is 2396'. The April-August forecast for Libby is 6.6 maf / 103.9% of normal. The Dalles April-August forecast is 88.2 maf / 94.8% of normal. The Grand Coulee January-July forecast is 102% of normal of normal. Forecast for Lower Granite is 78% of normal, which is among the lowest in the basin. TMT members noted that Dworshak forecasts from the National Weather Service River Forecast Center (RFC) were much higher than those forecasted by the COE (93% vs. 78%, respectively.) Hlebechuk said that the March final forecasts will be available on the RFC site sometime the week of 3/5. Action/Next Steps: Cathy Hlebechuk, COE, said she would look into why there was a significant difference between the COE and RFC forecasts for Dworshak, and report via email to TMT. Note: Hlebechuk sent out an email response, following the TMT meeting, summarized below: “The main difference is for the February final forecast the Corps' equations do not include rain, just snow. In contrast, the RFC's equations include both rain (extremely heavy in November) and snow. Please note the RFC Lower Granite February Final forecast is 78% of normal for the April - July period. * The Corps uses the 71-year average of 2683 to come up with the percent of average and the RFC uses the 30 year normal of 2644 to come up with the percent.” 2007 Water Management Plan Bernard Klatte, COE, said that he had received comments from NOAA and that if other agencies wished to comment on the revised draft of the 2007 WMP, they could still do so. CRITFC and ID said that they planned to submit comments, and would send them to Klatte before the next TMT meeting on 2/28.
2
Action: TMT members were reminded to review the draft WMP and submit edits, comments, etc. based on 2007 expectations to Bernard Klatte, COE, before the next TMT meeting on 2/28. Chum Incubation Status Rick Kruger, OR, said that the total chum population estimates for Multnomah Falls were 288 +/- 37; I-205 numbers were 918 +/- 31; Hamilton Creek numbers were 192 +/- 125; and the final numbers for Ives Island were 406 +/- 156. Action/Next Steps: Rick Kruger said that he would post final chum data (counts/maps of redds) for TMT as soon as it is available. Cindy LeFleur, WA, said that she would get final numbers posted as soon as it is available, and Margaret Filardo, Fish Passage Center, said that she would add final chum numbers to the FPC website when they become available. Adult Kelt Passage Study Bernard Klatte, COE, said the NW Portland District had requested an extension to operate the Corner Collector past March 31, to April 10th for a Kelt Passage hydroacoustic evaluation at the Bonneville corner collector. Klatte said the additional 10 days of 5 kcfs spill should not affect TDG or storage levels. Klatte also added that the large crane used to move and install the Turbine Intake Extension Screen (TIES) will be out of service until the end of August and that a mobile crane (100-ton) needs to be brought to the project to open/close the corner collector headgate/bulkhead. Also, since the crane is out of service (OOS) the TIES will not be installed in the B2 powerhouse, which could impact any study results and fish movement in the B2 forebay. Klatte also reported that the corner collector cannot be operated until after a barge has completed delivering Vertical Barrier Screens (VBS) in the forebay at B2 main unit 11 on 26-27 February. If BON needs to spill more than the corner collector (5 kcfs), it may require up to 16' tailwater to avoid TDG exceedances of 105% as measured at the Warrendale gauge. Robin MacKay, BPA, said that the potential for increased flow needs and drawing from Grand Coulee storage will need to be carefully balanced with maintaining the 13' tailwater, as requested for chum incubation. Jim Adams said the COE ran scenarios that looked at historical actual operations of different spill levels, and their corresponding TDG levels confirmed that the extra spill, if needed, would increase TDG levels as measured at Warrendale to approximately 114-115% with 50 kcfs spill and 116-117% with 75 kcfs spill. Those TMT members present at the meeting: BOR, OR, ID, WA, NOAA, BPA, did not object to the extending the operation of the B2 Corner Collector for the Kelt passage evaluation. Transportation Permit Update Paul Wagner, NOAA, said that the transportation permit would officially be extended for 1 year, as the new BiOP has not yet been completed. Ice Harbor Summer Outage Mike Viles, BPA Transmission Operations, gave a power point review of an 11/2006 tripped Sacagawea transformer, which is currently out of service. This transformer, he
3
noted, is very important in transferring power into the Tri-Cities area. In order to address this, a mobile capacitor group will be installed around 4/1 and another by 7/1; both of which will be used until the transformer can be brought back online. BPA does not expect this issue to cause any in operational restrictions, and hope to have the transformer back in service by next spring. Operations Review Reservoirs: Grand Coulee elevation was at 1270.6' with outflows of about 100kcfs to meet the 13' minimum tailwater below Bonneville and the 70 kcfs minimum below Priest Rapids; Hungry Horse was at 3533.85' and releasing 2.5kcfs to meet Columbia Falls minimums; and Libby was at 2390.08', with minimum outflows and an end of February target elevation of 2396'. Albeni Falls was at 2052.9' and outflows of 15 kcfs; Dworshak was at 1530.2', with an end of February target elevation of 1531'*; Bonneville tailwater was at 13'. * (Cathy Hlebechuk, COE, corrected the Dworshak end of February target via an email: “The end of February flood control target is 1551', not 1531', as was stated during the 2.14.07 meeting.”) Fish: Cindy LeFleur, WA, reported 2007 spring/summer forecasts for adult fish: Upriver Spring Chinook - 78,500 (vs. 132,100 returns in ’06); Summer Chinook above Priest - 45,600 (vs. 76,200 in ’06); Sockeye - 27,300 (vs. 37,100 in ’06 – noted as a continued poor return); Upriver Steelhead – 314,600 (vs. 329,200 in ’06); Columbia Fall Chinook above Bonneville – 182,400 (vs.230,400 in ’06); Bonneville Pool Spring Creek Hatchery stock – 21,800 (vs. 27,900 in ’06 – noted as a very poor return); and a total for Columbia River Fall stocks of 327,000 (vs.415,100 in ’06). LeFleur noted that it was early for Spring Chinook, but that a few had been caught already in fisheries. LeFleur also said that OR and WA were beginning an active sea lion hazing program, in the hopes of hazing while the sea lions are targeting sturgeon. Action/Next Steps: LeFleur said she would send a summary report of the spring/summer adult forecasts to the COE, for posting on the TMT website. Power: Nothing to report at this time. Water quality: Jim Adams, COE, said that monitors at Camas/Washougal will likely be up and running by 4/1. Next TMT Face-to-Face Meeting, February 28th, 9:00-noon Agenda Items include: • WMP final review • Spring Creek Hatchery • Chum Emergence Update • Tentative: Sea Lion Update
4
Columbia River Regional Forum Technical Management Team Meeting
February 14, 2007 1. Welcome and Introductions Today’s meeting was chaired by Cathy Hlebechuk, with representatives from COE, BPA, NOAA-F, CRITFC, PNGC, BOR, and the states of Idaho, Washington and Oregon in attendance either in person or by phone. The following is a summary (not a verbatim transcript) of the topics discussed and decisions made at the meeting. Anyone with questions or comments about these notes should provide them to the TMT chair or bring them to the next meeting. 2. Review of Meeting Minutes There were no comments on the January 31, 2007, minutes as posted on the TMT website. 3. Final Water Supply Forecasts A. Columbia River Summary. Cathy Hlebechuk (COE) showed TMT members how to access the Corps’ water supply forecasts and end-of-month flood control elevation targets, which are attached to the TMT agenda for this meeting. By clicking the first link on each page, it is possible to see a summary of Columbia River flood control for all the dams, which the Corps prepares every month.
B. Libby Dam. The water supply forecast for April - August is 6.6 maf, which is 104% of normal. The end-of-January flood control elevation target for Libby was 2,393.7 feet, based on the January final forecast. The target for the end of February is 2,396 feet, based on the February final forecast, which is higher than the end-of-month forecast last month. This is because the water supply decreased from 110% to 104% of normal. This is why Libby is currently on minimum flows, Hlebechuk said. The end-of-month target for March at Libby is 2,392.4 feet. Hlebechuk explained that the second link is for the COE Libby forecast, which is more detailed than the summary sheet.
C. Dworshak Dam. The chart shows the end of March flood control elevation target for Dworshak is 1,551 feet. Paul Wagner (NOAA-F) questioned the discrepancy between the RFC and COE forecasts for Dworshak, which are 93% vs. 73% of normal, respectively. Hlebechuk contacted the Corps and RFC forecasters to explain the discrepancy. The two offices use different equations to develop the forecasts. The RFC forecast includes rain, which was heavy in November, and snow; the COE forecasts do not include rain, just snow.
5
D. RFC Forecasts. This link from the TMT webpage goes to the National Weather Service’s data on various forecasts, which Steve King described in greater detail at the January 31, 2007, TMT meeting, Hlebechuk said.
The January-July forecast for Grand Coulee is 63.9 maf, 102% of normal.
The April-August forecast for The Dalles is 88.2 maf, 95% of normal. The April-July forecast for Lower Granite is 16.8 maf, 78% of normal. The Snake basin is the driest of all the river basins, Hlebechuk noted. Russ Kiefer (Idaho) asked what the 30-day to 90-day precipitation forecast is for the basin. The 90-day extended forecast shows that El Nino trend is breaking down, so we could see a late winter blast of moisture from the mountains, Kyle Dittmer (CRITFC) said. 4. Finalization of Water Management Plan Fall/Winter Update The Water Management Plan and fall/winter update have been posted to the TMT website; the group decided to finalize them at the February 28 TMT meeting, given that more comments are coming. Bernard Klatte (COE) asked people to review Appendix 1, Emergency Protocols. Robin Harkless noted three areas of change for people to review: Libby operations, chum spawning considerations, and Snake River operations. Comments on the fall/winter update should be sent to Bernard Klatte (COE). 5. Chum Incubation Status – I-205 and Multnomah Falls Surveys.
Rick Kruger (ODFW) gave preliminary estimates of the number of chum spawners in the Columbia this season. In the Multnomah Creek area, it’s 288 plus or minus 37. In the I-205 area, it’s 918 plus or minus 31. For Hamilton Creek, it’s 192 plus or minus 125. These preliminary estimates are based on live and dead recoveries using live tagging and adults removed for broodstock.
For Ives Island, the final population estimate is 406 plus or minus 156,
based on carcasses only. These numbers include fish of both genders, all of whom were there to spawn, regardless of whether they succeeded. Scott Bettin (BPA) asked, is it possible the counts are low because it was a high flow year? The counts are indeed low, but there’s a high confidence level in these estimates, due to the method of recovering carcasses, Kruger replied. Cindy LeFleur (WDFW) will give the final chum redd population numbers to Kruger for posting on the TMT website when they are available. The group agreed to add chum incubation to the TMT meeting agenda after the final numbers become available. Kruger said he will compile the final information on redd locations. Bettin requested that the numbers also be posted on the Fish Passage Center website.
6
6. Adult Fallback Hydroacoustic Study The Corps Northwest Portland District has been preparing to do a study of steelhead kelt passage through the Bonneville Second Powerhouse corner collector through March. Klatte reported that the BON Turbine Intake Extension Screen (TIES) crane is currently out of service. Initially, it was planned to be out until April, but now it will probably be out until the end of August. The crane is used to insert TIES which are large square structures that extend the pier noses and change the hydraulics to enhance fish passage. The crane is also used to open and close the Corner Collector headgate and bulkhead. With the TIE crane out, a 100-ton mobile crane will be required onsite to open and close the headgate and bulkhead to the Corner Collector. Klatte introduced Bob Wurtheimer (COE), a lead researcher for the kelt passage study. COE requested an extension of the study end date from March 31 to April 10, which will require that a mobile crane be used only to open the corner collector in March and close it at the end of the fish passage season (31 August) or in the event of TDG exceedances below BON. Based on the existing protection level for chum of maintaining a 13 foot tailwater below Bonneville, the additional 10 days of spill into April should not affect TDG levels or storage, based on the most recent forecasts. Klatt noted that at Powerhouse 2 main unit 11, a barge unloading vertical barrier screens (VBS) will require the corner collector to be closed on February 26-27.
Regarding potential impacts to fish, Russ Kiefer (Idaho) asked, would higher entrainment of the turbines affect the corner collector? It could go either way, Wurtheimer said, noting that the TIES cranes haven’t been as successful in improving fish survival rates as there were expected to be. The mobile crane will arrive onsite March 1 to open the corner collector for the fallback study, Klatte said. If the Corps request for an extension is accepted, they will keep the corner collector open from April until the end of spill season on Aug. 31. The request involves keeping the corner collector open for an additional 9 days and 23 hours. Russ Kiefer (Idaho) Robyn MacKay (BPA), Paul Wagner (NOAA-F) and other group members approved the COE request to extend the study for the extra time the Corner Collector will be open.
The group discussed the merits of changing the study name. Fallback has
negative implications for migrating adults, but getting kelts to go downstream of dams is a good thing, Russ Kiefer (Idaho) said. He suggested calling it a kelt passage study.
The group also discussed the Spring Creek Hatchery release and the
effects of drafting additional water from GCL to produce additional spill for these fish and protect chum redds from TDG, all while meeting the April 10 required elevation of 1,280 feet at GCL. Spill through the spillway at 50 or 75 kcfs would require a tailwater of at least 16 feet below Bonneville to keep TDG at a level that would not harm chum redds, Jim Adams (COE) said. Raising the tailwater at
7
Bonneville requires additional flow, which would come from Grand Coulee, and we’re already walking a tight line between keeping flows high enough for chum and having enough storage left for spill season beginning April 10, Robyn MacKay (BPA) said. The tradeoff for each foot of tailwater is 5-10 kcfs drawn from Grand Coulee storage. She asked, does the Corner Collector have gas impacts? It generates high levels of gas particularly when tailwater elevations are low, Adams said, citing a study done when the tailwater was at 8 feet. Because we’re already operating at a 13-foot elevation, and the corner collector is at 16 feet, the outflow experiences only a 3-foot plunge, so gas impacts should be minimal.
Jim Adams (COE) showed the group how to access historical data regarding the relationship of tailwater elevations to TDG levels. This information is available on the TMT website’s historical page. According to SYSTDG modeling, COE estimated flat outflows of 140 kcfs total with a 13 foot tailwater would result in TDG levels of around 116%, Adams said. That would require nearly 4 feet of compensation passage, meaning COE would have to run the tailwater at 17 feet with 140 kcfs total outflows. With 75 kcfs of spill, gas levels would be around 116%. With 50 kcfs of spill, total outflows would be 120-130 kcfs, with a 12 foot tailwater and TDG levels around 114%. With 114% TDG, 3 feet of compensation passage would be needed, based on data from April 2005. Kiefer (Idaho), MacKay (BPA), Wagner (NOAA-F) and other group members approved the COE request to keep the corner collector open. 7. Transportation Permit Update NMFS will extend the transportation permit for another year, Paul Wagner (NOAA-F) said. Normally a new permit is issued with each BiOp and environmental assessment, but this year the remand process has put the previous BiOp on hold, and the new BiOp isn’t finished yet. Instead of issuing a new permit, which the court would regard as a significant action, NMFS will extend the current permit in accordance with the remand process. 8. Ice Harbor Spring/Summer Outage Mike Viles (BPA) gave a Powerpoint presentation on what is currently the highest transmission reliability problem in the Northwest electrical grid. On Nov. 22, the Sacajawea transformer near the Tri Cities area tripped out of service. The giant piece of equipment must be removed from the site for repairs, which could take up to a year. Sacajawea is a 500/115-KV transformer with all three phases in one unit, a configuration that creates internal reliability problems. Its absence poses a risk to voltage stability in the Tri Cities. Because it is the only transformer of its kind on BPA’s system, there is no replacement to use during the outage. Ice Harbor came online in the early ‘60s, and Sacajawea was added in the mid-‘70s to transmit the power from new generators at Ice Harbor out of the area.
8
Viles described the current transmission system in the Tri Cities area. There are three main sources of power and voltage support going into Franklin Substation: generation from Ice Harbor, the Franklin 230/115 kV bank, and the Sacajawea 530 kV bank. The absence of Sacajawea means one less source of voltage support for the Tri Cities area, as it is the main source of 500 kV transmission there. The 500/115 bank that goes to Sacajawea integrates Ice Harbor generation from McNary to Franklin Substation. If Sacajawea is not available, and generation levels are low at Ice Harbor, the Franklin transformer – a vital source of voltage support – could go out of service. Weaker 115-kV adjacent transmission lines wouldn’t support the system if the Franklin transformer goes out. Viles presented BPA’s solution: two 20 MVAR mobile capacitors at Ice Harbor, which can be moved from substation to substation as needed. They provide reactive power which can boost voltage in the event of an outage. One of the capacitors will arrive at Franklin by April 1, the second by July 1, Viles said. Hopefully, this will smooth over the voltage reliability situation in the Tri Cities during the Sacajawea repairs. A participant asked how this would impact the summer peak in the Tri Cities. By adding the capacitors, it should be possible to operate safely with just one generator on at Ice Harbor, Viles said. There is no ceiling on how much generation can be safely transmitted out of the area. The problem basically involves protecting the system in the event of extremely heavy loads. BPA is considering the possibility of maintaining a spare replacement for Sacajawea. 9. Operations Review A. Reservoirs. Grand Coulee is at 70.6 kcfs of spill in order to maintain a 13 foot tailwater at BON and 70 kcfs of Hanford Reach protection flows at Priest Rapids, John Roache (BOR) reported.
Hungry Horse is at about 2,500 feet elevation, releasing 33.85 kcfs to maintain the Columbia Falls minimum flow.
Libby is at 2,390.08’ elevation with minimum flows, Cathy Hlebechuk
(COE) said. For the end of the month, another 3 feet of elevation will be needed to reach the end of February flood control target and inflows have been below 4 feet, so that might be a problem. The reason for this is that the January final forecast was 110% and February final forecast was 104%, with a significant difference of 17 feet between the two forecasts for the end of February flood control targets.
Dworshak is at 1,530 feet, with about a foot of increase needed by the end
of the month for flood control, which shouldn’t be a problem.
9
[Correction: Cathy Hlebechuk, COE, corrected the Dworshak end of February target via an email: “The end of February flood control target is 1551. The project is on minimum flow to try to fill to this elevation. The project will be below 1551 at the end of the month.”]
Albeni Falls is at 2,052.9 feet, with 15 kcfs of spill. Bonneville is running close to a 13 foot tailwater.
B. Fish. For upriver spring chinook destined for above Bonneville, WSFS is predicting a run of 78,500 fish this year, Cindy LeFleur (WSFS) said. That compares with last year’s return of about 132,100 fish, down about half from last year’s return.
For summer chinook June 13-July 31 runs, WSFS is predicting 45,600; these fish go only above Priest Rapids Dam, not in the Snake River system. That compares with a run of 76,200 fish last year. LeFleur explained that the COE and WSFS use different accounting systems for spring and summer chinook. The WSFS counts spring chinook at Bonneville Dam through June 15. Sockeye runs are at 27,300, compared to 37,100 last year, which continues a trend of poor sockeye returns in recent years.
Summer steelhead upriver above Bonneville are predicted to be at 314,600, compared to last year’s count of 329,200. Steelhead runs have been fairly steady for a number of years.
Fall chinook destined for the area above Bonneville (which includes Hanford, Priest Rapids hatchery, the Snake, Deschutes and Yakima rivers) are at 182,400, compared to last year’s return of 230,400 fish. Other important stocks above Bonneville Dam are primarily the Bonneville Pool hatchery stock, Spring Creek hatchery fish, with a prediction of 21,800 this year, compared to 27,900 last year. LeFleur emphasized that is a very poor return for these fish. At least 7,000 are needed in the hatchery to meet escapement goals.
Fall chinook stocks in the upper and lower Columbia are predicted to be at 337,200, compared to an actual return of 415,100 fish last year.
Across the board, all of the runs are down compared to last year, LeFleur
said. The group agreed they would like to see a one-page summary regarding fall and spring/summer sockeye returns linked to today’s agenda on the TMT website.
10
Kyle Dittmer (CRITFC) asked about sea lion sightings; LeFleur said they had been preying on sturgeon below Bonneville since December. Wurtheimer (COE) noted this is the earliest the sea lions have shown up there. The trend is for them to arrive earlier and stay longer. WSFWS will be beginning an active hazing program soon, if it hasn’t already begun, a cooperative effort between two states and possibly other agencies, LeFleur said. C. Power. There is no news at this time, Robyn MacKay (BPA) said. D. Water Quality. Forebay monitors will be in place by April 1 prior to the beginning of spill in the Snake River, Jim Adams (COE) said. No installations have been scheduled yet for the Columbia. Monitors will be installed in the Bonneville forebay and at Camas/Washougal gage by March 23 in preparation for Spring Creek Hatchery runs. Warrendale gage is up and running continually until the end of chum emergence in late May. Installation of the Cascade Island monitor is an area of uncertainty, Adams said. The COE is waiting for Spring Creek Hatchery deliberations to conclude because there is no point in placing a water quality monitor there if no spill will be coming through the spillway. 10. Next TMT Meeting The next meeting is scheduled for Feb. 28, Harkless said. The following items will be on the agenda: finalizing the Water Management Plan fall/winter update, a Spring Creek Hatchery update, an update on sea lion predation, and the usual operations review. Chum emergence is a tentative item, depending on when temperature information becomes available, Kruger (ODFW) said. Russ Kiefer gave a heads up that Idaho is beginning internal discussions of the Lake Pend Oreille decision tree. Anyone with items to add to the Feb. 28 TMT agenda should contact Jim Adams or Cathy Hlebechuk. This summary prepared by BPA contractor Pat Vivian. Name Affiliation Russ Kiefer Idaho Robyn MacKay BPA Jim Adams COE Paul Wagner NMFS Rick Kruger ODFW Cathy Hlebechuk COE Kyle Dittmer CRITFC Erin Halton DSC Ruth Burris PGE Tony Norris BPA Scott Bettin BPA Bob Wurtheimer COE Dan Spear BPA
11
Donna Silverburg DSC Holli Krebs Bear Energy Jennifer Miller Susquehanna Bernard Klatte COE-RCC Terry Weeks PNGC Don Faulkner COE Russ George WMCI Mike Viles BPA Phone: Mike Butchko PowerEx John Wasach Bear Energy Cindy LeFleur WDFW Katrina Starr XX Catherine Fitzgerald COE Seattle District Bruce McKay Consultant Liz Nyfal XX Margaret Filardo FPC Shane Scott NWRP John Roache BOR Blake Shafer XX Tom Le Puget Sound
T E C H N I C A L M A N A G E M E N T T E A MBOR : John Roache / Mary Mellema BPA : Robyn MacKay / Scott BettinNOAA-F: Paul Wagner USFWS : David Wills / Steve HaesekerOR : Rick Kruger / Ron Boyce ID : Russ KieferWA : Cindy LeFleur MT : Jim Litchfield
COE: Cathy Hlebechuk / Jim Adams
TMT MEETING Wednesday February 28, 2007 09:00 - 12:00
1125 N.W. Couch Street, Suite 4A34 Portland, Oregon 97209
Conference call line: 503-808-5190
To check into the building, take the elevator to the 5th floor and the guard will issue you an ID badge if you need one and will take you down to the 4th floor where the meeting is. If you have NOT attended a TMT meeting in
the past you will need to call ahead and let Cathy Hlebechuk (503) 808-3942 or Jim Adams (503) 808-3938 know, so you can be added to the TMT Visitor List and issued an ID badge. This badge may be used indefinitely. If you have attended TMT in the past you may re-use your ID badge indefinitely. If you are a federal employee you will
also need to have an ID badge issued to you which can be used indefinitely.
We have had disruptions on the phone because people are not hitting 'mute' after dial in.Please MUTE your Phone
All members are encouraged to call Robin Harkless with any issues or concerns they would like to see addressed.
Please e-mail her at [email protected] or call her at (503) 248-4703.
AGENDA
1. Welcome and introductions2. Review Minutes: [Meeting Minutes] 3. Discussion of Dworshak Water Supply Forecast
NWRFC Water Supply Forecast Procedure for Dworshak Inflow, Stephen King & Rick van der Zweep, NWRFCDworshak Water Supply Forecast - 2007 Update, Randy Wortman, COE
4. WMP final review: [Water Management Plan - 2007]
5. Spring Creek Hatchery: [SOR #2007-02 - Feb-27-2007]
9. OtherSet agenda for next meeting - March 14, 2007 [Calendar 2007]
Questions about the meeting may be referred to Cathy Hlebechuk at (503) 808-3942 or Jim Adams at (503) 808-3938
1
COLUMBIA RIVER REGIONAL FORUM
TECHNICAL MANAGEMENT TEAM February 28, 2007 Meeting
FACILITATOR’S SUMMARY NOTES ON FUTURE ACTIONS
Facilitator: Robin Harkless Notes: Erin Halton
The following notes are a summary of issues that are intended to point out future actions or issues that may need further discussion at upcoming meetings. These notes are not intended to be the “record” of the meeting, only a reminder for TMT members. Changes to the 2.14.07 TMT Meeting Minutes Robin Harkless, facilitator, noted that there had been several edits made to the facilitator’s summary, and that a new version was posted on the TMT website for review. Paul Wagner, NOAA, asked for the word ‘chum’ to be removed from the transport section of the minutes; and Cathy Hlebechuk, COE, asked to be identified as the TMT chair in the minutes. Water Supply Forecasts Cathy Hlebechuk, COE, noted that this agenda item was a follow up from the last TMT meeting and the subsequent requests from TMT members to have further discussion on how the NWRFC and COE forecasts are generated. Hlebechuk told the group that there is no one “best” forecast, and introduced Steve King and Rick van der Zweep from NWRFC and Randy Wortman from the COE to address the topic. Their power point presentations, linked to the TMT agenda, illustrated some of the primary differences between the two forecasts: the COE uses a 71 year average and the RFC uses a 30 year average to come up with their percentages; and the COE does not use rain precipitation in their equations (just snow), while the RFC includes both rain and snow. TMT members said they appreciated both the RFC and COE forecasts, the use of the best available science in the interest of not over-drafting the reservoirs, and thanked King, van der Zweep, and Wortman for their willingness to explain their process to TMT. A suggestion to coordinate with the climate change impact group was made to both the RFC and the COE forecasters. 2007 Water Management Plan Bernard Klatte, COE, said that the COE hoped to finalize the fall/winter update to the Water Management Plan today. CRITFC said that they still planned to submit comments, and would send them to Klatte by the end of the week. IDFG said they finished their review of the Fall/Winter update and had no further comments. Those TMT members present at the meeting: BOR, USFWS, ID, WA, NOAA, BPA, COE, did not object to finalizing the WMP fall/winter update and the 2007 WMP as it was currently posted. Dave Wills, USFWS, suggested the use of ‘strike through’ version for ease in reviewing edited versions of documents in the future.
2
Action/Next Steps: Comments from CRITFC will be posted to the TMT web site and discussed at the next TMT, for inclusion in the final version of the WMP spring/summer update. Cathy Hlebechuk, COE, will brief IT on the WMP fall/winter update at the meeting on 3/1.
SOR #2007-2 Spring Creek Hatchery Paul Wagner presented the SOR, attached to the TMT agenda, on behalf of the following Salmon Managers: ODFW, WDFW, Shoshone-Bannock Tribes, and CRITFC. The SOR requested four days of 75 kcfs spill at Bonneville during either the first (March 5) or second (March 9) release of fish from Spring Creek hatchery, whichever is determined by the Action Agencies as best for overall Columbia River operations. This request is being made to provide spill to support fish passage and passage survival tests underway for 2007. TMT members discussed the SOR and those present were polled on their level of support: WA and ID were supportive; USFWS and did not support or object; BOR did not support or object and deferred to the COE; CRITFC could not support spill, but was supportive of operation of the corner collector; NOAA chose not to participate and was neutral; BPA deferred to the COE; Bernard Klatte, COE, said that the COE thanked the Salmon Managers for the efforts that went into the SOR, but that the COE could not support spill this year. Klatte reported that the COE had worked with USFWS, BPA and NOAA to review technical data and determined the following plan:
• The COE plans to operate Bonneville project in the following manner, beginning no later than March 1, to accommodate the hatchery fish release: 1. Operate the second powerhouse as first priority. 2. Operate the second powerhouse corner collector (5 kcfs discharge). 3. Operate fish passage facilities in accordance with the Fish Passage Plan 4. Operate turbine units within the 1% of best efficiency range. 5. Operate first powerhouse Minimum Gap Runner (MGR) units on a first on/last off basis when that powerhouse operates. Follow FPP unit operating priorities at both powerhouses.
• Given the data reviewed by the workgroup, the operations are expected to result in high survival for fish passing the project. The spill and corner collector treatments will not be provided for tests in 2007, for a variety of reasons.
Next Steps: Given the lack of consensus amongst TMT members, Paul Wagner, speaking on behalf of OR, requested elevating the following question to IT for further discussion at their meeting on 3/1:
“Should spill (and associated flow required for chum redd depth compensation downstream) be provided for a four-day period during the Spring Creek hatchery release? This would allow evaluation of the effects of spill plus corner collector vs. corner collector only operations and support a spread the risk operation for this release group. Additionally, the same flow is requested for both release groups to insure that both released groups pass the project under similar flow conditions.”
3
Chum Incubation Update Paul Wagner, NOAA, reported that seining had begun and fish were present near Ives Island, signaling the beginning of emergence. Wagner added that the timing seemed comparable to that of previous years, and that end of April is the typical time for the end of emergence. Next Steps: A chum update will be on the agenda for the 3/14 TMT meeting. Sea Lion Update: Bernard Klatte, COE, shared information from Robert Stansell, COE, who had said there were 7 California sea lions and 7 stellar seal lions observed near the Bonneville Dam area. Klatte said there had been joint state and federal (COE, ODFW, and USDA-APHIS) hazing meetings, a hazing training was held on 2/28, and hazing was slated to begin on 3/1 with some constraints within the Boat Restricted Zone (BRZ). Only 3-5 seal ‘bombs’ will be used on an animal per occurrence, until the fish count reaches 1k passing Bonneville dam in a 24-hour period. Klatte added that the Sea Lion Exclusion Devices (SLEDS) are in place. A question was raised on whether any studies on the effects on sturgeon or monitoring was happening, which prompted the next step below:
Action/Next Steps: A suggestion was made to bring Stansell in to make a more thorough presentation to TMT at an upcoming meeting. Klatte will update TMT on the sea lion efforts as the season progresses.
Operations Review Reservoirs: Grand Coulee was at 1281.5' with outflows being made to meet the 13' minimum tailwater below Bonneville and the 70 kcfs minimum below Priest Rapids; Hungry Horse was at 3531.99' and releasing 2.4kcfs to meet Columbia Falls minimums; and Libby was at 2389.03', with minimum flows and 7' below its end of February target elevation of 2396'. Dworshak was at 1537.9', and 12.5' below its end of February target elevation of 1550.4'; Bonneville outflows were in the 140 range.
NOTE: March final flood control targets and shifts will be discussed at the TMT meeting on 3/14.
Fish: Cindy LeFleur, WA, sent a summary report of the spring/summer adult forecasts to the COE, posted on the TMT website. LeFleur and Paul Wagner, NOAA, said that it was too early in the season for anything but a chum emergence update. Power: Nothing to report at this time. Water quality: Jim Adams, COE, said that gauges at Cascade Island, Camas/Washougal and Bonneville were up and running.
4
Next TMT Face-to-Face Meeting, March 14th, 9:00-noon Agenda Items include: • Water Supply Forecasts • Spring Creek Hatchery After Action Report • Hanford Reach fall Chinook Emergence / Spring Protection • Tentative: Sea Lion Presentation • Flood Control Targets / Shifts • Operations Review
5
Columbia River Regional Forum Technical Management Team Meeting
February 28, 2007 1. Welcome and Introductions Today’s TMT meeting was chaired by Cathy Hlebechuk and facilitated by Robin Harkless, with representatives from COE, USFWS, BPA, NOAA-F, CRITFC, PNGC, BOR, and the states of Idaho and Washington in attendance either in person or by phone. The following is a summary (not a verbatim transcript) of the topics discussed and decisions made at the meeting. Anyone with questions or comments about these notes should provide them to the TMT chair or bring them to the next meeting. 2. Review of Meeting Minutes Paul Wagner noted that “chum” (WHERE IS IT?) should be deleted from the transportation update in the Feb. 14 meeting minutes. [Hlebechuk comment: It is in Jan 31 minutes. Robin Harkless also asked me to change the Feb. 14 minutes to reflect Cathy Hlebechuk is the TMT chair, not Robin Harkless.] 3. Discussion of Dworshak Water Supply Forecast As of the last TMT meeting, the COE water supply forecast for Dworshak was 79% of normal and the RFC forecast was 93% of normal. In response to concerns about the discrepancy, Cathy Hlebechuk (COE) invited Steve King (RFC) and Randy Wortman (COE) to explain to the TMT how their respective agencies calculate water forecasts. A. RFC Forecasting. There are three basic components of the RFC water supply forecasting process, Steve King (RFC) said. First comes a regression-based model. Second, the model is manually adjusted to examine the reasonableness of the answer and whether it really represents what is happening across all the spill bays at the dam. An important tool at this stage is a comparison with water supplies in nearby basins, which tend to balance out through the season. Finally, the RFC forecast is coordinated with other forecasts, primarily USGS. RFC uses a single equation to represent observed precipitation, snow and runoff for the entire forecast period, which is a unique approach. For October and November, the overall runoff at Dworshak was 174% of normal. For November through January precipitation, the seasonal weighted mean was 142% of normal, while the aerial weighted mean for snowpack was 82% of normal. Forecasting accuracy improves as the season progresses, King said. At the last TMT meeting, predictions were drier than normal, but things have
6
changed so that we’ll probably end up with at least a normal water supply for February. B. COE Forecasting. The COE model was refitted by the NRCS after the 1994-95 seasons, which was similar to this season in terms of a very wet November, Randy Wortman (COE) said. In 2005, COE refit the model again using all available data and stations. That model serves for the current water supply forecast and was calibrated to 44 years of observed data. The latest model performs quite similarly to the previous generations of models, except that the December forecast has been significantly improved after reinstating a November precipitation variable that had been previously dropped.
This year, the forecast for Dworshak was very high in December at 3,465 KAF, dropping significantly to 2,905 KAF in January and further down to 2,126 KAF in February. What’s of note is that the December 1 forecast is based on the effects of El Nino and one precipitation station. Statistically this one precipitation station provides a better result in the model than any combination of precipitation stations, or no stations at all. There’s no snow worth measuring in November, so that November’s precipitation, measured at 10.79 inches (218% of normal) had a great influence on the forecast volume. This single precipitation value was responsible for almost 2 MAF of the 3.5 MAF forecasted that month. The February forecast of 2.1 MAF is a more balanced forecast, with more variables and no precipitation component.
Wortman showed the current (February 27) NCRS assessment of
Dworshak basin across all snow stations as 88% of average water content in the basin, and the Corps’ early estimate of the 1-March forecast as 83% of normal. COE percentages of runoff compared to average are measured against 71 years of data, while the Weather Service percentages are measured against approximately 30 years of data. The COE forecasts are currently lower than RFC forecasts because the extremely wet fall precipitation measurements of this year are no longer influencing the computations, and the snow conditions in February are now a predominate influence on the COE model. Wortman said that COE forecasters strive for accuracy over consistency from month to month.
Kyle Dittmer (CRITFC) asked, why don’t COE and RFC coordinate their
forecasts, given that both methods appear to be based on sound science? With two forecasts, you can see the range of uncertainty involved in the forecasting business, King said. Wortman reported that the Corps is responsible to provide the ”official” forecast for their projects and that any subjective adjustments (e.g. coordination) to the forecasts would eliminate any quantification of the “standard error”, and the standard error is a necessary component to the Corps’ refill calculations. What hurts the salmon community most is when forecasts go down, and suddenly there’s not enough water for fish, Dittmer said. He urged the agencies involved to do what they can to avoid that. Waffling on forecasts is
7
appropriate for the fisheries objective of trying not to overdraft reservoirs and being responsive to current conditions, Paul Wagner (NOAA-F) said.
The group discussed the potential impacts of climate change on forecasts
that have been based on historic trends. Wortman and King agreed that any climate change issues at this point are extremely negligible compared to error based on natural data variability, Wortman said.
4. Water Management Plan Final Review
Finalization of the Water Management Plan was agreed to by all present
at TMT with the exception of allowing a few more days to give the CRITFC and Idaho representatives more time to submit their comments. BOR, USFWS, NOAA-F, BPA, Idaho and Washington representatives accepted the plan as published on the website. Oregon and Montana representatives were absent from the meeting but have already commented, Bern Klatte (COE) said. Robyn MacKay and Robin Harkless suggested that CRITFC and COE representatives work independently to publish the final plan on the website alongside CRITFC’s comments so TMT members can see the changes.
Dave Wills (USFWS) suggested using a strikeout format for electronic
revisions; Klatte agreed that changes are difficult to identify when they appear in balloon format. Harkless noted that the final water management plan would be a topic of discussion at the IT meeting on March 1. 5. Spring Creek Hatchery SOR #2007-02, Feb. 27, 2007 Paul Wagner (NOAA-F) presented this SOR on behalf of ODFW, WDFW, CRITFC and the Shoshone-Bannock tribe.
The SOR requested 4 days of 75 kcfs spill at Bonneville during either the March 5 or March 9 releases of 7.5 million subyearling fall Chinook salmon from Spring Creek Hatchery. Discretion was left to the Action Agencies regarding which of the March releases should receive the spill treatment. This operation would allow evaluation of the effects of spill plus corner collector vs. corner collector only operations and support a spread-the-risk operation for this release group. Additionally, the same flow was requested for both release groups to insure that both groups would pass the project under similar flow conditions. In 2004, there was an evaluation of fish passing through the corner collector vs. fish passing through spill only, Wagner said. Complete return for these fish occurs over a four-year period. So far, there are two years of data on hand. Preliminary results indicate that fish passing through the spillway have a better survival rate than fish passing through the corner collector. The corner collector is already scheduled to be open for a kelt passage study beginning March 1. The key change described in this SOR is asking for four days of 75 kcfs
8
spill on top of the operation of the corner collector prior to the beginning of spill season on April 10, Wagner said. John Roache (BOR) asked, what’s the total discharge involved? Wagner estimated that 1.5 to 2 feet of depth compensation would be needed to keep chum redds below Bonneville safe from TDG, resulting in a tailwater depth of approximately 14.5 feet. The COE estimates that TDG levels would be around 117% with 75k of spill, resulting in roughly 4 feet of depth compensation needed to protect chum redds, Jim Adams (COE) said. Steve King (NOAA-NWRFC) said numbers based on existing modeling have compared a total volume of 150 kcfs to just corner collector operation, 50 kcfs of spill, and 75 kcfs of spill. That modeling exercise yielded estimates of 104-108% TDG levels, assuming high forebay gas levels of 104-108% and a high spill level. Assuming it takes about 4-5 days for all fish to pass Bonneville, the National Weather Service projected volumes of 158-172 kcfs for one day. Passing 160 kcfs through Bonneville is known to result in a tailwater of 14.5 to15 feet, he said. Robyn MacKay (BPA) asked for clarification that one of the four-day tests would be with spill, corner collector, and depth compensation and the other 4-day test would be without spill, but with the corner collector and similar flows or volume as the spill/corner collector treatment. There are three potential operations with the corner collector online – spill only, corner collector operation only, and corner collector operation with spill, Steve Haeseker (USFWS) said. The primary purpose of this SOR goes back to discussions in 2004 regarding a comparative evaluation of those three operations, Hasaeker said.
The TMT could not come to consensus on the SOR, so ODFW requested that it be elevated to the IT for further discussion the following day. Individual TMT representatives gave their votes. Due to an agreement between CRITFC and BPA, CRITFC can’t support the spill provision, but does support the corner collector treatment, Dittmer said. Idaho and Washington both support the SOR, Russ Kiefer and Cindy LeFleur said. NOAA-F is neutral, Paul Wagner said. USFWS also takes a neutral position, David Wills said, while recognizing that the SOR aligns itself with the goals of testing begun in 2004. BPA looks to the COE for an outcome to those ongoing discussions between BPA, COE and the USFWS regarding continuation of that testing, Robyn MacKay said. John Roache stated that the BOR did not support or object to the SOR and deferred to the COE. Bernard Klatte (COE) stated that the COE planned operation for the Spring Creek Release, based on considering the input provided at the previous technical and policy meetings, is to operate the Bonneville second powerhouse corner collector to accommodate the fish hatchery release in accordance with the
9
Fish Passage Plan. He listed the COE’s reasons for not providing spill and corner collector treatments for testing in 2007, they are:
1. Spillway survival rates are currently lower than desired. 2. The COE is aggressively evaluating spillway mortality in 2007, and it is
premature to run tests until the results, which will be available this fall, are used to improve spillway survival.
3. While preliminary results of a CWT study found that tagged fish showed higher adult returns for spillway operations, these results don’t yet include age-4 fish or harvest data.
4. TIEs will not be installed at the 2nd powerhouse due a broken crane, which might influence passage patterns and compromise results of a CWT test in 2007.
5. Fish reprogramming discussions for John Day mitigation and hatchery production are underway, which could eliminate the need for a March release from Spring Creek Hatchery.
6. Chum salmon spawned at higher elevations than usual in 2006, making it more difficult to provide TDG depth compensation for chum redds during a spill treatment.
6. Chum Emergence Update Seining has begun, said Paul Wagner (NOAA-F), meaning the dragging of nets through water to evaluate whether fish are present. Fish have been found below the Ives Island area, which indicates the beginning of chum emergence. If this year is like similar years, emergence should continue through April. Robin Harkless said she would ask ODFW for information regarding chum emergence to be linked to the next meeting agenda on the TMT website. 7. Sea Lion Update Bernard Klatte (COE) provided an update on pinnipeds below Bonneville Dam and passed around photographs of a stellar sea lion eating a white sturgeon, taken near Government Island. A total of 7 california sea lions were observed below Bonneville Dam on Feb. 26, with 4 of the seven sea lions arriving that day. There are also 7 stellar sea lions now in the vicinity of Bonneville Dam.
Starting March 1, ODFW and USDA will conduct a joint hazing program during daylight hours for 7 days a week until the end of May, Klatte said. The hazing effort will be more intense this year than last year. Seal bombing will be allowed at the rate of 3-5 bombs per individual per hazing occurrence until the fish count gets to a thousand fish passing Bonneville in a 24-hour period. Hazing will also be conducted from shore using rubber bullets and pyrotechnics. TMT members wondered whether a thousand fish means cumulatively or a daily
10
count; David Wills (USFWS) said he would find out and report back. A participant asked whether SLEDS (sea lion exclusion devices) had been installed; Klatte said yes. Robin Harkless said she would ask Robert Stansell (COE) to update the group later this season on how the hazing program is working. 8. Operations Review A. Reservoirs. Grand Coulee is at 1,281.5 feet elevation, with releases being made to maintain a 13 foot minimum tailwater below Bonneville, also to maintain a 70 kcfs minimum flow at Priest Rapids, John Roache (BOR) said. The end of March flood control elevation based on the February forecast is 1,275.6 feet. The April 10 upper rule curve elevation based on that forecast is calculated at 1,264.4 feet, with non-shifted flood control. Hungry Horse is at 3,531.99 feet, with releases around 2,400 cfs. Libby is at 2,389.03 feet, which is below its end of February flood control elevation target of 2,396 feet, so the project is on minimum flow, Cathy Hlebechuk said. Dworshak is at 1,537.9 feet, about 13 feet below its end of February flood control elevation target, and is also on minimum flow. Ice Harbor is running about 35,000 cfs and Bonneville is at about 140 kcfs..
The group discussed flood control shifting. For planning purposes, Paul
Wagner (NOAA-F) asked, when is a shift decision best made? After the March final forecast? Roache thought that would be a good time. Cathy Hlebechuk (COE) wondered whether anything might happen in next month’s forecast to allow a shift. Right now, elevations are expected to drop, Roache said. He and Wagner agreed that the March 14 TMT meeting would be a good time to discuss flood control shifting.
B. Fish. Chum emergence is beginning, Wagner said. Other than that,
there’s nothing to report this early in the season, he and Cindy LeFleur (WDFW) agreed.
C. Power. There is nothing to report, Robyn MacKay said. D. Water Quality. Gages have been in place at Cascade Island, Camas-
Washougal, and the Bonneville forebay for about a week now, Jim Adams (COE) reported. 9. Next TMT Meeting The March 14 agenda will include the March final water supply forecast, flood control shifting, any updates on additions to the final water management plan, a chum emergence update, a Spring Creek after-action report, and the usual operations review, Harkless said. Paul Wagner (NOAA-F) requested that
11
a Grant County representative give projections on Hanford operations for fall Chinook emergence in Hanford Reach. Name Affiliation Cathy Hlebechuk COE John Roache BOR David Wills USFWS Paul Wagner NMFS Jim Adams COE Robyn MacKay BPA Kyle Dittmer CRITFC Erin Halton DSC Dan Spear BPA Rick van der Zweep NOAA-NWRFC Steve King NOAA-NWRFC Russ George WMCI Randy Wortman COE Steve Haeseker USFWS Jennifer Miller Susquehanna Tim Heizenrader Cascade Joe Polen PPM Energy Ryan Slinger PPM Energy Bill Williams PPM Energy Sean Crandall Constellation Energy John Oh Constellation Energy Don Faulkner COE Terry Weeks PNGC Tony Norris BPA Bernard Klatte COE-RCC Phone: Russ Kiefer Idaho Ruth Burris PGE John Wasach Bear Energy Cindy LeFleur WDFW Bruce MacKay Consultant John XX Snohomish PUD Dave Benner FPC Glen Trager Avista Energy XX Puget Sound Energy Erin Hunzaker Merits XX XX Oregon Associates
T E C H N I C A L M A N A G E M E N T T E A MBOR : John Roache / Mary Mellema BPA : Robyn MacKay / Scott BettinNOAA-F: Paul Wagner USFWS : David Wills / Steve HaesekerOR : Rick Kruger / Ron Boyce ID : Russ KieferWA : Cindy LeFleur MT : Jim Litchfield
COE: Cathy Hlebechuk / Jim Adams
TMT EMERGENCY CALL Friday March 09, 2007 3:00pm - 4:00pm
1125 N.W. Couch Street, Suite 4A34 Portland, Oregon 97209
Conference call line: 503-808-5191
To check into the building, take the elevator to the 5th floor and the guard will issue you an ID badge if you need one and will take you down to the 4th floor where the meeting is. If you have NOT attended a TMT meeting in
the past you will need to call ahead and let Cathy Hlebechuk (503) 808-3942 or Jim Adams (503) 808-3938 know, so you can be added to the TMT Visitor List and issued an ID badge. This badge may be used indefinitely. If you have attended TMT in the past you may re-use your ID badge indefinitely. If you are a federal employee you will
also need to have an ID badge issued to you which can be used indefinitely.
We have had disruptions on the phone because people are not hitting 'mute' after dial in.Please MUTE your Phone
All members are encouraged to call Robin Harkless with any issues or concerns they would like to see addressed.
Please e-mail her at [email protected] or call her at (503) 248-4703.
AGENDA
1. Welcome and introductions2. Bonneville Dam Operations: [SOR #2007-03 - March 09, 2007]
3. OtherSet agenda for next meeting - March 14, 2007 [Calendar 2007]
Questions about the meeting may be referred to Cathy Hlebechuk at (503) 808-3942 or Jim Adams at (503) 808-3938
1
COLUMBIA RIVER REGIONAL FORUM
TECHNICAL MANAGEMENT TEAM Conference Call March 9, 2007
FACILITATOR’S SUMMARY NOTES ON FUTURE ACTIONS
Facilitator: Robin Harkless Notes: Erin Halton
The following notes are a summary of issues that are intended to point out future actions or issues that may need further discussion at upcoming meetings. These notes are not intended to be the “record” of the meeting, only a reminder for TMT members. Spring Creek Hatchery Mortality / SOR #2007-3 An emergency TMT conference call was convened on Friday, March 9 at 3:00 to discuss SOR 2007-3. The SOR is linked to the agenda on the TMT web page. Smolt monitoring reports showed an 8% mortality rate, normally around 1.5%, in the Spring Creek smolts collected at Bonneville Dam on March 9. Susan Guttenburger, (USFWS, Lower Columbia River Fish Health Center), said that the mortalities examined showed no de-scaling or sign of virus or bacteria, and that all of the released fish had passed their detection tests before leaving the hatchery. BPA reported nothing unusual going on at Bonneville, other than the un-installed TIES cranes and some excavation work at the Rock Creek/Stevenson site. All TMT members present on the call (NOAA, BPA, COE, USFWS, ID, and BOR) expressed concern over the mortality rate. Dave Wills, USFWS, said that the salmon managers drafted SOR #2007-3 with the intent of moving the fish away from the Bonneville power house and providing a spread the risk operation to try to decrease mortalities. The request was for immediate 85 kcfs minimum spill at Bonneville dam, continuing until 95% of the hatchery releases passed (likely around Wednesday, 3/14). A poll was taken on TMT member’s position on SOR #2007-3:
• Oregon: Not present on the TMT call but signed on to the SOR • Washington: Not present on the TMT call but signed on to the SOR • Idaho: Did not sign on to the SOR, but did support the request • CRITFC: Did not support or oppose the SOR • NOAA: Signed on to and supported the SOR • USFWS: Signed on to and supported the SOR • BPA: Wanted additional information to better inform a decision • BOR: Did not oppose the request, and deferred to the COE • COE: Needed more information before making a decision
Cindy Henriksen, COE, noted the COE’s concern for the fish mortalities, and suggested that if new information was presented that indicated the bypass system at Bonneville was causing the mortalities, the COE would change course to implement a spread the risk operation. With the current information, the COE believed the best operation would be to continue operating the B2 corner collector and not to provide spill at the project.
2
Gary Fredericks, NOAA, joined the TMT call with an update: the numbers of mortalities coming through Bonneville had dropped, and the hatchery fish appeared to have been dead for more than one day. When asked, he responded that the cause of mortalities seemed to pass and that additional spill would not likely provide a benefit to the remaining passing fish. ACTION/NEXT STEPS: Fredericks said he planned to further investigate – examine the bypass facility, use float balloons, and further inspect upriver. Dave Wills, USFWS, agreed to coordinate with Jerry McCann, Fish Passage Center, to track mortalities over the weekend. TMT members agreed to be notified via email following further monitoring and to leave their schedules open for an ‘as-needed’ follow-up call on Monday, March 12th at 11 a.m. Update: Cathy Hlebechuk, COE, sent a follow-up email to TMT on 3/10: * Bonneville Dam project manager Jim Mahar and his team made some small changes at the Bonneville second powerhouse on the advice of an agency fishery biologist. * The sample size of fish collected overnight was 65 fish with 2 mortalities. * In a call with Dave Wills (USFWS) this morning he confirmed the numbers. We all agreed the passage index is diminishing, and the incidence of mortalities is down. * With this, the Corps will stay the course and continue to operate the Bonneville second powerhouse corner collector without additional spill at the spillway. * The second Spring Creek Hatchery release group of 1.16 million fish is expected to start arriving at the dam later today and continue over the next four days. * We decided not to initiate a TMT call today for further discussion, but if either of us receives any new information for the remainder of the weekend, we'll share it with each other and decide where a TMT call is warranted. The next face to face meeting is scheduled for Wednesday, March 14th at 9:00 am. Note there is a new security system at the COE, so arrive early to sign in!!
3
Columbia River Regional Forum Technical Management Team Emergency Conference Call
March 9, 2007 1. Welcome and Introductions Today’s TMT emergency conference call was requested by NOAA Fisheries in response to an increase in mortality of Spring Creek hatchery Chinook collected in the samples at the Bonneville Juvenile Monitoring Facility during March 8 and 9 sampling.. The call was chaired by Cindy Henriksen (COE) and facilitated by Robin Harkless, with representatives from COE, USFWS, BPA, NOAA-F, CRITFC, BOR, the FPC, and the Spring Creek National Fish Hatchery on the line. The following is a summary (not a verbatim transcript) of the topics discussed and decisions made during the call. Anyone with questions or comments about these notes should provide them to the TMT chair or bring them to the next regular TMT meeting on March 14. 2. Bonneville Dam Operations (SOR #2007-03-March 9, 2007) Rich Domingue (NOAA-F) introduced this request to provide a minimum 85 kcfs of spill at Bonneville Dam to provide listed Spring Creek Hatchery subyearling fall Chinook with an alternate route of passage from the juvenile bypass system, continuing the spill until the bypass system has been ruled out as the source of increased mortality. Smolt monitoring personnel at the dam reported 4.5% mortality on March 8 and 8% mortality on March 9, compared to a typical mortality rate of 1 to 1.5% for these fish. No immediate cause has been identified. Until we know what’s going on, Domingue said, it would be prudent to spread the risk and spill fish to minimize the number of fish collected. There were 30 mortalities, which looked like fresh mortalities, taken from the bypass facility, Susan Gutenberger (Fish Health Center) reported. No physical trauma, wounds or descaling were apparent. The fish had recently eaten, which makes illness highly unlikely. Whatever killed them – a toxin, suffocation – probably struck quickly, she said. The center is running tests to rule out viruses and bacteria, but Gutenberger was 95% sure the fish didn’t die of disease. Fish collected at Spring Creek Hatchery looked healthy, with no signs of disease or mortality. If they died of a virus, we’ll know within 3-4 days, but otherwise the results of testing won’t be available for another 2 weeks, Gutenberger said.
The fish went through a pre-release health inspection and were apparently healthy when they left the hatchery, Larry Marchant (Spring Creek National Fish Hatchery) said. In the March 9 sample, Jerry McCann (FPC) said, at least four fish had missing eyes, and two had severed heads, with another few fish showing possible injuries.
4
Russ Kiefer asked, is anything unusual going on at the Bonneville 2nd Powerhouse? Only the absence of TIEs due to a broken crane this year, but while having the TIEs in place might direct more fish through the powerhouse, it shouldn’t affect how they go through it, COE representatives said. A participant asked, how will the COE make its operational decision, given that all the salmon managers virtually support spill (or, in the case of CRITFC, don’t oppose it)? Onsite information from NOAA Fisheries biologist Gary Fredricks, currently on his way to the dam, is needed to make an informed decision, Cindy Henriksen (COE) said. If issues are found in the bypass system, options could be explored for closing the bypass. Until we have further information showing the bypass is a problem, the decision is to maintain current operations through the corner collector, Henriksen said. Domingue suggested thinking in terms of a lesser rate of spill if 85 kcfs isn’t feasible. Gutenberger asked whether toxic substances used somewhere around the dam or gate wells can be ruled out as a cause of mortality. That’s a possibility, particularly with construction happening in the area, Henriksen said. Gutenberger asked whether the COE had already made its decision on the SOR or wanted to discuss the information heard today. We made a decision with the previous SOR regarding the Spring Creek Hatchery, Henriksen said. The COE is highly concerned about the mortalities, but won’t change its current course of operations without further information regarding the cause.
Harkless asked the TMT members to air their views on the SOR. The purpose of the SOR was to buy time and err on the side of caution until the cause of the deaths can be identified, David Wills (USFWS) said. The 1.2 million additional subyearling Chinook released from the hatchery today will reach the dam in about 28-30 hours, or mid-day on Saturday, he said.
Power demands are usually lower on weekends, which would allow more
spill, Russ Kiefer (IDFG) said. When more information comes in over the weekend, it will be difficult for the TMT to respond quickly. He urged the COE to spill over the weekend to protect this listed stock, then reconsider on Monday in light of new information.
Robyn MacKay (BPA) agreed with Henriksen that more information is
needed before altering the dam operations. There are construction activities in the Bonneville forebay to clean up a landslide, which could have caused the mortalities, Henriksen said. Without spill, maybe fish are holding in the forebay longer than they should, Margaret Filardo (FPC) said. She emphasized that the deaths over the past two days appeared to be very recent.
MacKay asked how mortality rates in the bypass system compare with
those for fish on other passage routes. The bypass system offers the only
5
opportunity to collect and observe fish, a participant said. BOR’s biggest concerns are, how would the spill affect Grand Coulee storage and the ability to maintain a 13’ tailwater for chum redds, while meeting the April 10 upper rule curves, John Roache said. However, Reclamation does not oppose spill and defers to the COE on how they will decide to operate Bonneville Dam. Domigue asked, what process will the COE go through to garner additional information, and what might cause the COE to choose spill? If we choose a different operation than the corner collector, and found mortality reduced at the bypass, with the condition of fish returning to expected levels, COE would reduce spill again – but that decision hasn’t yet been made, Henriksen said. Harkless called for a vote of TMT members on the SOR. NOAA signed and supports it, Domingue said. IDFG didn’t sign the SOR but supports the request, Kiefer said. WDFW and ODFW representatives signed the SOR, although they didn’t participate in today’s conference call, Gutenberger noted. USFWS supports the SOR, Wills said. BPA would like to see what additional information comes to light, MacKay said. BOR doesn’t oppose spill and defers the decision to the COE, Roache said. CRITFC can’t support a spill request because of an agreement between BPA and the Tribes but doesn’t oppose it either, Kyle Dittmer said. At this point, Gary Fredricks (NOAA) joined the conversation by cell phone, reporting from the dam where he had just looked at a fish sample. All the mortalities looked old except one fish, he said. Two things were happening: the number of fish coming through the dam had dropped dramatically in the past few hours, and those coming through looked like they’d been dead for more than a day. This caused Fredricks to think that whatever trauma they encountered had ended, but he still couldn’t say why the fish died. He saw no signs of injury or any indications of a problem with the bypass system, and suggested that something in the reservoir might have killed them. The mortality rate in the sample he had just observed was 25%.
Fredricks found a few dead fish in the collection channel. He said he would pass water balloons through the bypass system to test it for anything that might cause injury, even though he doubts that’s the source. There were a few more gulls than usual scavenging half a mile upriver, but not at the dam itself. Asked whether he believed spilling would reduce mortality, Fredricks said no. The live fish coming through the bypass were unharmed, and typically the injury rate is three times the mortality rate if there’s a problem with debris or a broken screen. The most likely explanation he could offer was that the fish ran into trouble before they got to the dam. If this theory is correct, there should be a decline in sampling mortality on Saturday, Filardo said. Dave Benner (FPC) and Fredricks agreed to be in contact
6
over the weekend. David Wills (USFWS) offered to be the emergency connection between TMT and the COE if anything of note came to light from tomorrow’s sampling.
Based on available information including Fredricks’ report from the dam, Henricksen said the COE would continue to operate the dam with just the B2 corner collector as planned. If mortalities continue to be excessive, or harm to fish is found, the COE may request another TMT call or consider spilling. Liz Hamilton, a member of the public, asked, if fish are coming into contact with debris from a landslide, would they continue to be guided to the corner collector? If so, would spill solve that problem? She expressed concern that the decision to forego spill was initially based on low mortality rates, which is not the case now. 3. Schedule Next TMT Conference Call or Meeting The TMT tentatively agreed to another conference call at 10 am on Monday, based on what is learned over the weekend. Henriksen said she would send an email to all TMT members if Dave Wills reports any new findings over the weekend. Henriksen reiterated that at this point, COE didn’t plan to add a spill operation at Bonneville Dam, but that decision is subject to review over the weekend. If there is no conference call Monday, the next TMT meeting will be Wednesday, March 14. This summary prepared by BPA contractor Pat Vivian. Name Affiliation Cindy Henriksen COE Bernard Klatte COE Jim Adams COE John Kranda COE Rod Turner COE Susan Gutenberger Lower Columbia River Fish Health Center Margaret Filardo FPC Jerry McCann FPC Dave Benner FPC David Wills USFWS Rich Domingue NOAA-F Gary Fredricks NOAA-F Robyn MacKay BPA Dan Spear BPA Dan Feil BPA Scott Bettin BPA Tony Norris BPA Kyle Dittmer CRITFC John Roache BOR Larry Marchant Spring Creek National Fish Hatchery
7
Russ Kiefer IDFG Liz Hamilton Public
T E C H N I C A L M A N A G E M E N T T E A MBOR : John Roache / Mary Mellema BPA : Robyn MacKay / Scott BettinNOAA-F: Paul Wagner USFWS : David Wills / Steve HaesekerOR : Rick Kruger / Ron Boyce ID : Russ KieferWA : Cindy LeFleur MT : Jim Litchfield
COE: Cathy Hlebechuk / Jim Adams
TMT MEETING Wednesday March 14, 2007 09:00 - 12:00
1125 N.W. Couch Street, Suite 4A34 Portland, Oregon 97209
Conference call line: 503-808-5190
To check into the building, take the elevator to the 5th floor and the guard will issue you an ID badge if you need one and will take you down to the 4th floor where the meeting is. If you have NOT attended a TMT meeting in
the past you will need to call ahead and let Cathy Hlebechuk (503) 808-3942 or Jim Adams (503) 808-3938 know, so you can be added to the TMT Visitor List and issued an ID badge. This badge may be used indefinitely. If you have attended TMT in the past you may re-use your ID badge indefinitely. If you are a federal employee you will
also need to have an ID badge issued to you which can be used indefinitely.
We have had disruptions on the phone because people are not hitting 'mute' after dial in.Please MUTE your Phone
All members are encouraged to call Robin Harkless with any issues or concerns they would like to see addressed.
Please e-mail her at [email protected] or call her at (503) 248-4703.
AGENDA
1. Welcome and introductions2. Review Minutes: [Meeting Minutes] 3. Grant County Fall Chinook Emergence / Spring Protection: [2007 PRD Operations] - Russell Langshaw,
Grant Co. PUD4. Water Supply Forecasts - Cathy Hlebechuk, COE
RFC Water Supply ForecastLibby Water Supply ForecastDworshak Water Supply ForecastFlood Control SummaryRFC - Current Snow ConditionsNRCS Snotel / Snow Precipitation Update ReportNRCS Columbia River Sub-basin Snowpack Graphs
5. Flood Control Targets / Shifts [Presentation] - Ken Soderlind, COE
6. Spring Creek Hatchery After Action Report - Dave Wills, USF&WS7. Bonneville CC Outage / Staff Gage Removal 03-22-2007 - Bernard Klatte, COE8. Major outages on the Snake River - Don Faulkner, COE9. Operations Review
ReservoirsFishPower SystemWater Quality
10. OtherSet agenda for next meeting - March 28, 2007 [Calendar 2007]
Questions about the meeting may be referred to Cathy Hlebechuk at (503) 808-3942 or Jim Adams at (503) 808-3938
2007 PRD Operations post-hatch through March 12, 2007
• Minimum = 67.4 kcfs• 20 hours occurred between
February 17 and 23– Minimum = 67.4 kcfs– Maximum = 75.2 kcfs
• Temperature Units = 880
Critical elevation 70 kcfs
Hours since hatching 1944
Hours below critical elevation
22
March 31 DWR elevation with 3/13 ESP, 1.5 kcfs out 44 traces (1949-1992)
1558.0
1560.0
1562.0
1564.0
1566.0
1568.0
1570.0
0 5 10 15 20 25 30 35 40 45 50
1
COLUMBIA RIVER REGIONAL FORUM TECHNICAL MANAGEMENT TEAM
March 14, 2007 Meeting
FACILITATOR’S SUMMARY NOTES ON FUTURE ACTIONS Facilitator: Robin Harkless
The following notes are a summary of issues that are intended to point out future actions or issues that may need further discussion at upcoming meetings. These notes are not intended to be the “record” of the meeting, only a reminder for TMT members. Grant County PUD Update: Priest Rapids Operations Russell Langshaw, Grant County PUD, updated TMT on Priest Rapids operations. The information was linked to the TMT agenda. He reported that 70 kcfs is the critical elevation, and the project was below the minimum for 22 hours, mostly between February 17-23. Current temperature units were currently at 880 and expected to reach 1000 around April 1, during which protection flows for emergence will begin. Russell will continue to provide updates to TMT throughout the emergence. Water Supply Forecasts Cathy Hlebechuk shared water supply forecast information from the COE’s and National Weather Service’s data, which she noted would be posted in the next few days. The March forecast for The Dalles was up slightly, at 88.3 MAF. Lower Granite was up slightly to 17.3 MAF. Libby was slightly down at 6.5 MAF. Dworshak was up slightly to 2.2 MAF. Grand Coulee and Hungry Horse were down slightly at 63 MAF and 2.1 MAF, respectively. The NRCS snow pack for the Columbia River basin showed slightly above average snow pack in Canada, near normal March snow pack at Grand Coulee and below average snow pack (81%) in the Snake basin above Ice Harbor. Summary of Columbia River Flood Control Elevations/Shifts Ken Soderlind, COE, shared information on expected flood control shifts at Dworshak and Grand Coulee, noting that a Brownlee shift is not expected to occur. The Dworshak flood control elevations are: 1560.3’ for March, 1571.6’ for April 15, and 1555.5’ end of April. Given current conditions and forecasts from ESP and STP runs, the COE anticipates a shift in volume from Dworshak to Grand Coulee to maintain local flood control at Dworshak, the Tri-Cities area, and Vancouver. A caveat was included that if the forecasts change, adaptive management will be used to operate the projects. A comment was shared that updated ESP data would be useful – the runs include information as current as 1992. It was also clarified that a Dworshak to Grand Coulee shift would be an even, ‘one for one’ operation. Next steps include checking in on current conditions at the March 28 TMT meeting, and looking at April final forecasts at Dworshak on April 2 and Grand Coulee on April 7. All will continue to monitor conditions and if a significant deviation from the forecast is observed, adaptive management will be used. Idaho expressed support for the shift this
2
year as it meets all needs of the system. He encouraged the action agencies to use caution in drafting Grand Coulee if there is any concern that the project will not refill. Spring Creek Hatchery Release Report Dave Wills, USFWS, reported that 6.6 million fish were released from the Spring Creek hatchery on March 5, and 1.2 million were released on March 7. He reported that while the fish were healthy upon release, the mortality rate of the first release increased as high as 8%, above the normal 1.5% rate seen in past years. This information initiated a TMT call on Friday, March 9 (for discussion see notes linked to the March 9 agenda) followed by further monitoring and a check in by Dave Wills, the COE and the Fish Passage Center over the weekend. Mortality rates dropped back to normal levels by Saturday afternoon. The cause of the increase is still unknown, and the COE and others continue to investigate. FPAC members and NMFS biologist Gary Fredericks discussed the possibility that light switches from fluorescent to a dimmer LED light near the passage route, as well as more turbulent passage through the gatewell at Bonneville could have been the cause, which is at this point speculation. ACTION: The USFWS will share results of a disease analysis done on the hatchery fish with TMT when they are available. A question was asked about the disparity in numbers between the two release groups this year. Dave responded that a spill operation had been previously anticipated for one release, and due to the forecast, spill was presumed to be initiated for the first release. Discussions are continuing in the region about the potential for future re-programming and all agreed something needs to be done to address this recurring issue. B2 Corner Collector Outage/Staff Gauge Removal Bernard Klatte, COE, reported on three needs requiring special operations at Bonneville dam: removal of entrances to fishways on the Washington side prior to adult returns; corner collector ‘mattress’ work; and collection of pizometers . The COE discussed with FPOM and there were no concerns raised with the recommendation to complete all three on March 22 during a maximum four hour operation of 12’ tailwater and corner collector closure. TMT did not object to this proposal. The COE will issue a teletype on March 19 noticing the planned operation, at 1200-1600 hours on March 22. Outages on the Snake River The COE is developing a schedule for maintenance on Lower Snake projects during the spring and summer, likely requiring unit outages. This information will be more fully presented at the next TMT meeting. Operations Review Reservoirs – Grand Coulee was at elevation 1278.1’, with an end of March flood control elevation target of 1272.5’. The April 10 target is 1259.2’. Hungry Horse was at 3531.26’, inflows were up with additional snow melt, and was targeting a March 31 elevation of 3535.1’ and April 10 target of 3533.4’. Libby was at elevation 2389’ and targeting an end of March elevation of 2395.5’. Dworshak was at 1546.7’ and had 19.7
3
kcfs inflows (an increase) and operating at minimum outflow, targeting 1555.5’ end of March, with a likely shift to 1560.3’. Lower Granite inflows were 55 kcfs, and Bonneville was averaging 150 kcfs. Montana noted their interest in understanding and coordinating with the COE on setting VARQ targets, with an overall interest of meeting fisheries and refill needs. Montana stated its desire for a gradual ramp down of Libby this year and would like to coordinate with the COE ahead of the summer season. The COE reminded all that it will operate to a strict VARQ this year and will continue to coordinate with its regional partners. Fish – Paul Wagner, NOAA, noted that a small number of yearling chinook have been observed early, possibly holdover fish. Russ Kiefer, Idaho, offered that increased runoff could also be the cause of the observed yearlings, and Kyle Dittmer, CRITFC, added that above average temperatures likely contributed to the early arrival. Bernard Klatte reported that Robert Stansell, COE, develops weekly status reports on sea lion activity below Bonneville and these reports will be linked to the TMT web page. To date, 9 stellars, 10 California sea lions and 1 harbor seal were observed. Predation was 153 salmon and steelhead, 352 sturgeon, 8 lamprey, and 2 smolts since counts began. Power – Nothing to report Water quality – Jim Adams, COE, reported no TDG exceedances. Next Meeting, March 28, 9am-noon Agenda items include: • Priest Rapids Update • Flood Control Shifts • Snake River Outages • Chum Emergence Report – Rick Kruger will distribute prior to the meeting • MOP Operations • WMP: Draft Spring/Summer Update • Spring Spill/Transport Operations
4
Columbia River Regional Forum Technical Management Team Meeting
March 14, 2007 1. Welcome and Introductions Today’s TMT meeting was chaired by Cathy Hlebechuk and facilitated by Robin Harkless, with representatives from COE, USFWS, BPA, NOAA-F, CRITFC, PNGC, BOR, and the states of Idaho, Montana, Oregon and Washington in attendance, either in person or by phone. The following is a summary (not a verbatim transcript) of the topics discussed and decisions made at the meeting. Anyone with questions or comments about these notes should provide them to the TMT chair or bring them to the next meeting. 2. Review of Meeting Minutes Re: Spring Creek SOR #2007-02, Dave Wills (USFWS) requested a change to the Feb. 28 official minutes on page 8, second paragraph from the bottom of the page. Official testing began in 2004, not 2000. 3. Grant County Fall Chinook Emergence
Russell Langshaw (Grant County PUD) gave a presentation based on a slide which would be posted to the TMT website. Currently, Grant County PUD is in 2007 post-hatch operations phase, which essentially means maintaining critical elevation through March 12. Critical elevation is 70 kcfs, with 1,944 hours since hatching, 22 hours of which were below critical elevation. The minimum flow was 67.4 kcfs, 2.6 kcfs short. This translates to a few inches below critical elevation at Vernita Bar. Of the 22 hours below critical elevation, 20 occurred between Feb. 17-23, when low inflows allowed a fine margin for error.
Currently, Hanford Reach is at 880 temperature units, which means
Chinook emergence can be expected to begin around April 1 (when the cumulative temperature units reaches 1000). When this occurs, the Vernita Bar protection flows will begin, Langshaw said. 4. Water Supply Forecasts The Dalles water supply forecast is at 88.3 maf for April-August, which is 95% of normal, same as the February forecast, Cathy Hlebechuk (COE) said. The Lower Granite water supply forecast for April-July is 17.3 maf, 80% of normal, which is slightly higher than the February forecast. The Libby forecast is 56.5 maf for April-August, 103% of normal, which is slightly less than the February forecast. The Dworshak forecast is 2.2 maf for April-July, 82% of normal, up 3% from the February forecast. Grand Coulee is 63 maf for Jan-July, 100% of normal, down 2% from the February forecast. The Hungry Horse
5
forecast is 2.1 maf for January-July, 97% of normal, which is 1% less than the February forecast.
The Snake Basin snow forecast is the lowest in the region, Hlebechuk noted. Castlegar has the maximum amount of snow on record. Overall, 2007 Canadian snowpack is slightly above average, compared to 2006 which was slightly less than what we have now, Hlebechuk said. Grand Coulee is almost normal for March, but snowpack in the Snake basin above Ice Harbor is 81% of average. 5. Flood Control Targets and Shifts There will probably be a Dworshak flood control shift this spring, Ken Soderland (COE) reported. He showed the TMT a summary of Columbia River flood control, which includes flood control shift targets and dates for each project. The March 31 flood control target for Dworshak is 1,560.3’, while its April 15 target is 1,571.6’, and the April 30 target is1,555.5’. The flood control shifting operation can cause Grand Coulee elevations to be depressed by a few feet. COE can shift a volume of water to Grand Coulee while maintaining Dworshak control for downstream flood centers Lewiston, Clarkston, the Tri Cities and Vancouver.
Soderland showed the TMT a table with 44 ESP targets all showing that 1,560.3’ elevation at Dworshak can be easily achieved by March 15. The March 13 ESP inflows used in the table are based on 44 years of temperature data, which yielded 44 different inflow traces, Hlebechuk said. With the minimum flow of 1.5 kcfs out, the program calculated 44 different elevations. The full shift at Dworshak is 1,560.5’. All 44 years were within half a foot of 1,560.5’ elevation according to this calculation, Hlebechuk said. The shift operation shows 1,560.3’ for March 31 and 1,560’ for April 15.
The shift operation will be constrained from April15-30, when no more than 14 kcfs can be released from Dworshak without exceeding the gas cap, Soderland said. If there is a falling forecast in April, which happens often, the COE might need to release less than 14 kcfs or terminate the shift operation altogether in order to refill before June. Another possibility is a rising forecast. If that happens, COE could raise outflows above 14 kcfs, which would increase gas problems downstream, or it could do a deviation request, Soderland said.
One other thing could cause problems. Approximately 42% of years the
initial controlled flow occurs between April 14 and 30. It’s conceivable all reservoirs could be on minimum flows for downstream flood control, while 14 kcfs is being released at Dworshak for fish augmentation, Soderland said.
Tony Norris (BPA) asked why shift operations could affect June 30 refill. If
Dworshak shifted flood control elevations are higher, wouldn’t shifting improve
6
opportunities for refill? No, Soderland said. (WHY not? I DIDN”T UNDERSTAND HIS ANSWER)
Russ Kiefer (IDFG) asked, why stop inputting data after 1992, when more
years of data are available? That’s a question for the National Weather Service, Soderland said. Dave Benner (FPC) asked, is 73 kaf the shift operation at Dworshak only, or is Grand Coulee also down that much? Will it be an even shift? The allowable shift on March 31 is 73 kaf, and BOR accepted the full shift, John Roache (BOR) said. The allowable shift on April 15 is 244 kaf. This will be a two-step operation involving planning on March 31, then checking in on April 1 to see what’s allowable, Paul Wagner (NOAA) said. The group agreed to revisit this issue at the March 28 TMT meeting.
We won’t have April shift values until the March final forecast for
Dworshak comes out around April 2, Hlebechuk said. The other part of the equation is the Grand Coulee forecast issued by the National Weather Service around April 7, Soderland said.
IDFG favors shifting because it’s a good operation for fish in a year like
this, and it’s within the safe limits of flood control, Kiefer said. He asked the Action Agencies to consider making adjustments if conditions are significantly drier or wetter than average above Grand Coulee or Dworshak so that Grand Coulee isn’t overdrafted in anticipation of being able to refill Dworshak. Roache agreed it’s not necessary to wait for an official forecast to talk about this. Now seems an appropriate time to discuss meeting the April 10 target elevation in Grand Coulee. If there were no shift, Grand Coulee would be at 1,262’ instead of 1,259.2’, or a difference of 3’ elevation. An increase in the April water supply forecast can cause a lot of problems with trying to draft down to the April 30 flood control elevation from the April 10 target elevation, Roache said. More information will be available by the next meeting. 6. Spring Creek Hatchery After-Action Report On March 5, 6.6 million fish were released from the hatchery, and on March 9, another 1.2 million were released, David Wills (USFWS) reported. Jim Adams (COE) asked, why the discrepancy in numbers? Normally all fish are released at once, but as this year’s release time approached, BPA, COE and the Services had a discussion regarding potential spill to replicate the 2004 study, Wills said. Several forecasts ago, USFWS coded wire tagged an equal number of fish in both releases in hopes of rain and spill, based on those discussions of the potential for another study, Wills said.
The tagged fish were healthy when they left the hatchery, but mortality rates at the Bonneville juvenile facility rose to 4% on Thursday, March 8, then to over 8% on Friday, March 9, which led to an emergency TMT conference call that afternoon. By the time this unusual level of mortality was recognized, the
7
second batch of fish had already been released from the hatchery. Mortalities peaked on Saturday at just under 12%, then declined to 2-4.5% per day since then, a level much closer to normal background levels of 1-2%. It appears that a single event killed a significant number of the juveniles, as the mortalities observed over the past few days have not been recent, Wills said. SOR #2007-02, requesting 85 kcfs of spill, was the subject of the emergency TMT call. Based on discussions and additional information, COE decided to continue operating the corner collector and keep an eye on the mortality rate in the juvenile monitoring facility, Bern Klatte (COE) said. Meanwhile, fisheries biologist Gary Fredricks (NOAA) suggested a possible cause for the mortalities: the lighting at the dam had recently been changed from fluorescent bulbs to LED to save electricity. To pass through the turbines, the fish must find their way out of a gatewell through a 10-inch hole. Fredricks suspected the LED lighting was too dim for fish to find their way. The lights were changed on Saturday morning in time for the second group of fish to arrive. Another change has recently been made in the project, Paul Wagner (NOAA) said. The gap between where fish leave the gatewell and enter the turbine environment has been reduced. Because passage through turbines is believed to be a higher mortality route, the gatewell structure has been modified to create a higher flow and more turbulent environment (TO DISCOURAGE FISH FROM TAKING THAT ROUTE?). The Spring Creek juveniles are small fish, and during the larger, more crowded migration, they could have exhausted themselves trying to find their way out, Wagner and Kiefer agreed. That could explain why the mortalities appear to have happened all in one day, and the second, smaller group of fish fared better than the first. It appears the second group has passed with little impact, Wills said. Dan Spear (BPA) wondered whether the mass of smaller, weaker fish passing all at once was more of a problem than the lights. Did the mortality rates decline before the lights were changed? Perhaps, but the only significant difference between this year and last is the lighting, Wills said. Last year, all the fish were released at once, and we didn’t see this problem, Kiefer said. Kiefer asked, what would it cost to reprogram the hatchery? That’s a complicated issue being discussed by COE, BPA, the Services, and the U.S. v. Oregon parties, Wills said. No estimate is possible at this point. The group agreed to discuss the hatchery release again when all results of disease testing are available. Wills will let Harkless know when to put it on the TMT agenda. 7. Bonneville Corner Collector Outage and Staff Gage Removal Bernard Klatte (COE) gave an update on three operational requests at Bonneville Dam for 22nd of March.
8
In early March, COE received a request for a 12’ tailwater at Bonneville for 4 hours so project staff could remove old staff gages in the Washington shore entrances to fishways. Divers have been unable to remove the old gages, and they could impede adult passage, so they need to be removed before spring Chinook arrive. This request was denied in early March due to impacts to Spring Creek releases and chum salmon.
COE has also received a request to inspect the concrete mattress at the
outfall. Preliminary information shows that erosion may be causing problems. This will require the corner collector to be closed for approximately 2-3 hours while divers perform the inspection. Also, a third request for a 12’ tailwater at Bonneville for 4 hours would allow data loggers in the Ives Island area to be collected, downloaded, serviced, and redeployed prior to the initiation of spill season.
All three requests can be accommodated in one operation scheduled for
March 22, Klatte said. This will require a maximum of 4 hours of 12’ tailwater at Bonneville, with corner collector closure. FPOM has approved the request. Gas levels will not be an issue while the corner collector is closed. Representatives from ODFW, NOAA, USFWS, BPA. IDFG, and MDFG agreed to this plan. 8. Major Outages on the Snake River Installation of fire protection equipment on individual turbine units on the Snake River is being scheduled. Jim Adams (COE) said. Most of the outages will be single-unit outages in April through June. One unit will be taken out of service at a time, probably at multiple projects. Each unit outage will be about 9 days in length. During late summer, outages in blocks of 2 to 4 units will occur to install additional fire protection equipment. The exact schedule of which units will be offline on what dates is being worked out. FPOM is aware of this, Klatte added. Kiefer asked, is it possible to defer outages planned for spring migration season to summer work? That’s probably not an option, as this is critical, Adams said. The first outage is scheduled for April 30 at Little Goose. The group agreed to discuss the outages further at the next TMT meeting. 9. Sea Lion Predation
Robert Stansell (COE) will circulate regular status reports to the TMT which will be posted to the TMT website, Bernard Klatte (COE) said. Now there are 9 Stellar sea lions, 10 California sea lions, and 1 harbor seal below Bonneville Dam. Between Jan. 8 and March 7, they took 153 salmon and steelhead, 8 lampreys, and 352 sturgeons, of which 55 were more than 5’ long.
9
10. Operations Review A. Reservoirs. Grand Coulee is at 1,278.1’ with discharges to maintain a 13’ tailwater below Bonneville and to achieve the March 31 flood control elevation, Roache said. The shifted flood control elevation for Grand Coulee is 1,272.5’ for the end of March. The April 10 target elevation for Grand Coulee is 1,259.2’.
Hungry Horse is at 3,531.26’, making releases for project minimums. The mainstem has come up, and inflows were 7k yesterday. Temperatures have been warm, and most of the water is from snowmelt. Projects will probably stay on minimum flows for a while. The end of March flood control elevation for Hungry Horse is 3,535.1’, and the project is currently at 3,531.26’. Additional releases for flood control will probably not be necessary. Nevertheless, we’ll have to keep an eye on inflows, Roache said. The April 10 target elevation for Hungry Horse is 3,533.4’, and it’s close to that now.
Libby is at 2,389’ elevation, still on minimum flow, but inflows have gone up from 4 kcfs four days ago to 11 kcfs now. The end of March flood control elevation is 2,395.5’, meaning it needs to rise 6.5’. Whether it will do that depends on inflows, which may drop, Hlebechuk said.
Dworshak is at 1.546.7’, with 19.7 kcfs inflows. The end of March
elevation for strict flood control is 1,555.5’; for flood control shifting, it’s 1,560.3’ with the expectation that it will get to that level and shift to Grand Coulee.
Lower Granite is at 55k of inflows, up from 30k four days ago. Bonneville
has been discharging around 150k, but was up to 202k yesterday. Brian Marotz (MDFG) asked about the end of month elevation based on a
2003 VARQ storage diagram. Is that a linear interpolation of volume translated to elevation? His concern was that a lot of water was drafted early in the season, followed by low inflow forecasts, which could lead to not meeting fishers’ requirements in spring, or refill requirements later in the year. VARQ ends when you intersect the refill curve, and some adjustments may need to be made after refill to balance this out, he said. (EXPLAIN??) Regarding the possibility of a double peak operation with strict VARQ, Montana would prefer a gradual ramp-down after the spring freshet. If that’s not possible, keeping flows above 9 kcfs during the trough between double peaks would minimize a lot of damage downstream. The COE will coordinate with Montana on Libby VARQ operations, Hlebechuk said.
B. Fish. The Spring Creek release is reflected in the numbers of fish
passing Bonneville, Paul Wagner (NOAA) said. A few yearling Chinook have already passed which was a bit of a surprise. Dan Spear (BPA) asked, where are they coming from? Fall Chinook in general hold over, Rick Kruger (ODFW) said.
10
(MEANING THEY ARE KELTS WHO HIBERNATE WHERE THEY’VE SPAWNED?) We’re also seeing movement of fish in drafts and tributaries, even though it’s early, Wagner said. This could be an early season if the trend continues. There have been a few Chinook adults passing Bonneville, and steelhead seem to be waking up in terms of passage between projects.
C. Power. There is nothing to report, Robyn MacKay (BPA) said. D. Water Quality. TDG levels at Warrendale gage are remaining steady
at around 103%, Klatte said. Cascade Island has TDG levels of around 110%, but the levels do not appear to be cycling as they have in recent years.
9. Next TMT Meeting The next meeting is scheduled for March 28, 2007. Agenda items will include a Priest Rapids update, flood control shifting, Snake River outages, a chum emergence report, minimum pool operations, the WMP spring/summer update, a review of spring spill and transport operations, and the usual operations review. The IT wants to comment on the WMP update in draft form, Harkless said. This meeting summary prepared by BPA contractor Pat Vivian. Name Affiliation Cathy Hlebechuk COE John Roache BOR David Wills USFWS Paul Wagner NMFS Jim Adams COE Robyn MacKay BPA Kyle Dittmer CRITFC Dan Spear BPA Russ George WMCI Jennifer Miller Susquehanna Tim Heizenrader Cascade Terry Weeks PNGC Tony Norris BPA Bernard Klatte COE-RCC Russ Kiefer IDFG Rick Kruger ODFW Laura Hamilton COE Rudd Turner COE Holli Krebs Bear Stearns Mary Mellema BOR Ken Soderlind COE Shawn Martin BPA
11
Tony Klement BPA Kelly Bridges BOR Russell Langshaw Grant County PUD Phone: Brian Marotz MDFG John Wasach Bear Energy Scott Bettin BPA Dave Benner FPC Eric Hunziger Merit XX Tom May Puget Sound Energy
T E C H N I C A L M A N A G E M E N T T E A MBOR : John Roache / Mary Mellema BPA : Robyn MacKay / Scott BettinNOAA-F: Paul Wagner USFWS : David Wills / Steve HaesekerOR : Rick Kruger / Ron Boyce ID : Russ KieferWA : Cindy LeFleur MT : Jim Litchfield
COE: Cathy Hlebechuk / Jim Adams
TMT MEETING Wednesday March 28, 2007 09:00 - 12:00
1125 N.W. Couch Street, Suite 4A34 Portland, Oregon 97209
Conference call line: 503-808-5190
To check into the building, take the elevator to the 5th floor and the guard will issue you an ID badge if you need one and will take you down to the 4th floor where the meeting is. If you have NOT attended a TMT meeting in
the past you will need to call ahead and let Cathy Hlebechuk (503) 808-3942 or Jim Adams (503) 808-3938 know, so you can be added to the TMT Visitor List and issued an ID badge. This badge may be used indefinitely. If you have attended TMT in the past you may re-use your ID badge indefinitely. If you are a federal employee you will
also need to have an ID badge issued to you which can be used indefinitely.
We have had disruptions on the phone because people are not hitting 'mute' after dial in.Please MUTE your Phone
All members are encouraged to call Robin Harkless with any issues or concerns they would like to see addressed.
Please e-mail her at [email protected] or call her at (503) 248-4703.
AGENDA
1. Introductions2. Review Minutes 3. Priest Rapids Update - Russell Langshaw, Grant Co. PUD4. Snake River / McNary Outages and Issues
a. Unit Outages - Don Faulkner, COEb. Lower Monumental RSW Construction Ops - Bern Klatte, COEc. McNary Spill Outages - Bern Klatte, COEd. Little Goose Navigation Lock Outage - Don Faulkner, COE [Image 1] [Image 2] [Image 3]e. MOP Operations - Cathy Hlebechuk, COE
5. Spring Spill and Transport Operations - Rudd Turner, COE [Fish Operations Plan, 25-Mar-2007] 6. Dworshak Operations - Cathy Hlebechuk, COE [SOR 2007-04] [Dworshak ESP Whiskers Plot] [Dworshak ESP
Estimated Peak Emergence Date: April 28 March 13 March 26 Feb. 25 March 01 March 25 March 21 April 05 4-Apr
Estimated Ending Emergence Date: May 04 May 08 April 09 March 31 April 06 April 15 May 02 April 27
Catch
First JuvenileCatch Date: March 12 Feb. 22 Feb. 08 Feb. 19 Jan. 31 Feb. 17 Feb. 15 Feb. 14 12-Feb
Peak JuvenileCatch Date: April 01 March 21 April 17 April 09 April 01 April 08 March 25 April 03 26-Feb
Last JuvenileCatch Date: May 04 June 13 June 11 May 31 May 23 May 13 June 28 May 11
Chum
Comparison of beginning, peak, and ending emergence dates to first, peak, and last catch dates of recently emerged chum salmon around Ives Island, 1999-2007.
Timing of Chum Fry Emergence and Catch in the Ives Island Area, 1999 - 2007
Dworshak operation in year with volume similar to March final forecast
0
5
10
15
20
25
304/
1/20
07
4/8/
2007
4/15
/200
7
4/22
/200
7
4/29
/200
7
5/6/
2007
5/13
/200
7
5/20
/200
7
5/27
/200
7
6/3/
2007
6/10
/200
7
6/17
/200
7
6/24
/200
7
cfs
1550.0
1560.0
1570.0
1580.0
1590.0
1600.0
1610.0(2.19 kaf forecast, 2.21 kaf in 1991 ESP)
elev
atio
n, ft
.
Dworshak operation in year with volume about 15% less than March Final forecast
0.00
5.00
10.00
15.00
20.00
25.00
30.00
4/1/20
074/8
/2007
4/15/2
007
4/22/2
007
4/29/2
007
5/6/20
075/1
3/200
75/2
0/200
75/2
7/200
76/3
/2007
6/10/2
007
6/17/2
007
6/24/2
007
cfs
1550.0
1560.0
1570.0
1580.0
1590.0
1600.0
1610.0(1.86 kaf is 0.85 March forecast, 1.82 kaf is 1951 ESP shown here)
elev
atio
n, ft
.
Dworshak ESP Inflows - Daily Box-Whiskers Plot
0
10000
20000
30000
40000
50000
60000
1-Mar 1-Apr 1-May 1-Jun 1-Jul
2007
Dai
ly In
flow
in c
fs__
ESP 75th PrecentileESP 25th PercentileObserved FlowsESP Daily Mean
Whiskers: ESP Daily Max/Min
ESP Flows updated 21-Mar 2007
DRAFT CENWD-PDD March 25, 2007
2007 Fish Operations Plan BACKGROUND The 2007 Fish Operations Plan (FOP) describes actions by the U.S. Army Corps of Engineers (Corps) to implement project operations for fish passage at its Federal Columbia River Power System (FCRPS) dams during the April – August 2007 fish migration season. Consistent with the 2004 Biological Opinion adaptive management strategy, this plan incorporates the project operations contained in the “Agreement Regarding 2007 Federal Columbia River Power System Fish Operations” (Agreement)1. The Corps has agreed to provide 2007 fish passage operations in accordance with the Agreement as identified in Attachment 1 of the Agreement2. Water Management operations not addressed in the Agreement will continue to be consistent with the operations considered in the 2004 Biological Opinion and in particular, the 2007 Water Management Plan and 2007 Fish Passage Plan (FPP). The following is a detailed description of the fish passage operations for the 2007 migration season. SPRING SPILL OPERATIONS Lower Snake River - spring spill will occur from April 3, 2007 through June 20, 2007 at the Lower Granite, Little Goose, Lower Monumental, and Ice Harbor dams. Lower Columbia River - spring spill will occur from April 10, 2007 through June 30, 2007 at the McNary, John Day, The Dalles and Bonneville dams. Table 1 below, from Attachment 1 of the Agreement, summarizes spring spill operations planned for each mainstem dam. In this Plan, the term “gas cap” refers to the total dissolved gas (TDG) state criteria waiver limits of 120% in the project tailrace and 115% in the forebay of the next project downstream. The term “spill cap” is the maximum flow rate a project can spill for fish passage that does not exceed the gas caps. Spill cap rates vary daily depending on flow and other environmental conditions.
1 The Agreement signed by the Bonneville Power Administration (BPA), Confederated Tribes of the Warm Springs Reservation, Nez Perce Tribe, Confederated Tribes of the Umatilla Indian Reservation, Confederated Tribes and Bands of the Yakama Nation, and Confederated Tribes of the Colville Indian Reservation, was submitted to the Federal District Court on January 9, 2007. 2 Brigadier General Martin committed to implement the 2007 operations identified in Attachment 1 of the Agreement by letter dated December 15, 2006.
DRAFT
2
Table 1. Spring 2007 project spill levels and transport criteria in the Agreement. Spring 2007
Planned Operations for Spring 2007 (Day/Night)
Comments
Transport Initiate transport at Lower Granite Dam between April 20
– May 1 with staggered transport start dates at Little
Goose and Lower Monumental. Criteria for
start date and stagger days will be provided to TMT *1
Same as 2006 except potential later start of transport
Lower Granite
20kcfs / 20kcfs Same as 2006 with planned main turbine unit outage
Little Goose 30%/30% Allow for 14 days night Gas
Cap spill within the last week of April – second week of May (April 22 – May 15)*. Dates of
actual night time spill to be determined by salmon
managers within the window of time identified above
Same as 2006 except 14 days of gas cap night spill
Lower Monumental
27 kcfs / 27 kcfs Gas Cap Same as 2006 test program (24 hr Gas Cap spill)
Ice Harbor 30%/30% vs 45kcfs/Gas Cap Same as 2006 test program McNary 40%/40% (April 10 – June 30) Same as 2006 except
elimination of 0/150 kcfs operation to provide testing of
the prototype temporary spillway weir (PTSW)
John Day 0 / 60% Planning for PTSW test with
24 hour spill in 2008
Same as 2006
The Dalles 40%/40% Same as 2006 Bonneville 100kcfs/100kcfs Same as 2006
*1 Initiation of Transport * The timing of the 14 days of spill to nighttime gas cap levels will be determined in-season through the TMT processes and is intended to coincide with the peak of the wild spring yearling Chinook migration at Little Goose Dam within the window specified.
DRAFT
3
SUMMER SPILL OPERATIONS Lower Snake River - summer spill will occur from June 21, 2007 through August 31, 2007 at the Lower Granite, Little Goose, Lower Monumental, and Ice Harbor dams. Lower Columbia River -summer spill will occur from July 1, 2007 through August 31, 2007 at the McNary, John Day, The Dalles and Bonneville dams. Table 2 below, from Attachment 1 of the Agreement, summarizes summer spill operations planned for each mainstem dam. In this Plan, the term “gas cap” refers to the total dissolved gas (TDG) state criteria waiver limits of 120% in the project tailrace and 115% in the forebay of the next project downstream. The term “spill cap” is the maximum flow rate a project can spill for fish passage that does not exceed the gas caps. Spill cap rates vary daily depending on flow and other environmental conditions. Table 2. Summer 2007 project spill levels in the Agreement. Summer 2007
Project Planned Operations for Summer 2007 (Day/Night)
Comments
Lower Granite 18 kcfs / 18 kcfs Same as 2006
Little Goose 30% / 30% Same as 2006 Lower Monumental
17 kcfs / 17 kcfs Same as 2006
Ice Harbor 30%/30% vs 45kcfs/Gas cap Same as 2006 test program McNary 40%/40% vs 60%/60 Same as 2006 test program John Day 30% / 30% Same as 2006 The Dalles 40%/40% Same as 2006 Bonneville 75kcfs / 120kcfs Same as 2006
General Guidance for 2007 Fish Operations For planning purposes, the Corps’ 2007 FOP operations for fish passage assume “average” run-off conditions. However, actual run-off conditions may be higher or lower than average, requiring adjustments to avoid or minimize poor juvenile or adult fish passage conditions or powerhouse constraints. Therefore, actual spill levels may vary from the tables above. In addition, spill levels may require adjustments for the following reasons:
• TDG is managed daily in response to changing conditions. Adjustments will be made to manage the spill operation consistent with the Oregon and Washington state TDG waiver limits for fish passage.
DRAFT
4
• Power system and other project emergencies may necessitate temporary adjustments in accordance with established protocols.
The following sections describe the processes for spill management during high and low runoff conditions, TDG management, spillway operation, minimum generation, specific spring and summer operations for fish passage for each mainstem project, juvenile fish transportation program operations, protocols for emergencies, and reporting. Spill Management The Corps will initiate spill at 0001 hours, or shortly after midnight, at each of the projects on the start dates specified above. Spill caps will be established at the specified amounts and will continue unless conditions require changing to maintain TDG within the limits established by the States of Oregon and Washington: 120% in the tailwater of a dam and 115% in the forebay of the next project downstream (and at Camas/Washougal). Spill will terminate at 2359 hours, or shortly before midnight, at each project on the end dates specified above. The spill rates represented in Tables 1 and 2 assume average runoff conditions; however, actual conditions may require adjustments to these spill rates. Actual spill rates may increase above the specified rates for two reasons: (1) high runoff conditions where flows exceed the powerhouse hydraulic capacity with the specified spill rates; and, (2) a lack of power load resulting in an increase in the rate of spill. Spill below the specified rates could occur during low runoff conditions when meeting minimum generation levels at a project requires reducing spill rates. This would most likely occur in late July and August. Minimum generation and spill rates are included below in the project specific information. Spill also may be reduced to accommodate navigation issues or other exigencies. To make adjustments in response to changes in conditions, the Corps will utilize the existing Regional Forum committees. Changes in spill rates when flow conditions are higher or lower than anticipated will be coordinated through the regional forum Technical Management Team (TMT). This could include potential issues and adjustments to the juvenile fish transportation program. Spill patterns and biological test issues that have not been coordinated to date will be coordinated through the Corps’ Anadromous Fish Evaluation Program (AFEP) subcommittees, which include the Studies Review Work Group (SRWG), Fish Facility Design Review Work Group (FFDRWG), and Fish Passage Operations and Maintenance Coordination Team (FPOM). Total Dissolved Gas Management In order to manage gas cap spill rates consistent with the Oregon and Washington state TDG waiver limits for fish passage, the Corps’ Reservoir Control Center (RCC) establishes the spill caps for each project on the lower Columbia and Snake rivers on a daily basis throughout the fish passage season. These spill caps are set so that resultant TDG percent saturation levels are not expected to exceed the states’ 120%/115% TDG limits, as measured as an average of the highest 12 hourly readings each day. Within any given day, some hours of measured TDG levels may be higher or lower than the gas caps due to changing environmental conditions (wind, air
DRAFT
5
temperature, etc). The process of establishing daily spill caps entails reviewing existing hourly data at each dam (including flow, spill, temperature, and TDG levels) and taking into consideration a number of forecast conditions (including total flow, flow through the powerhouse, wind and temperature forecast, etc.). This information is used as input into the SYSTDG modeling tool. The SYSTDG model estimates TDG levels in the rivers several days into the future and is a tool integral to daily decision-making when establishing spill caps at individual dams. SYSTDG output is used to guide decisions to establish spill caps at each dam to avoid exceedances of the gas caps. However, during the spring freshet when flows are expected to be greater than hydraulic capacity with the specified spill rates at the dams, or if a lack of power load results in an increase in the spill rate, the Corps will attempt to minimize TDG on a system-wide basis. In this case, spill caps are also developed for 125%, 130%, or 135% saturation to minimize TDG throughout the system. Spill caps set by RCC in daily spill priority requests will be met at the projects by using the spill pattern in the appropriate FPP spill table which most closely corresponds to the requested spill, either over or under the spill request. Spill caps will be adjusted on a daily basis as needed to avoid exceeding the gas caps. Operations to manage TDG will continue to be coordinated through the TMT. Spillway Operations Actual hourly spill quantities at dams will be slightly greater or less than the tables in the Agreement (Table 3). The Action Agencies will meet the requested spill levels to the extent possible. However, actual spill levels depend on the precision of spill gate settings, flow variations in real time, varying project head (the elevation difference between a project’s forebay and tailwater), and other factors. Operations considerations are as follows: Spill discharge rates: Due to limits in the precision of spill gates and control devices, short term flow variations, and head changes, it is not possible to discharge exactly the spill rates stated in the Agreement, or as stated in RCC spill requests to projects that call for specific spill discharges. Therefore, spillway gates are opened to the settings in FPP spill pattern tables which provide discharges that are the closest to the agreed upon spill discharge rate. The spill rates in Table 3 coincide with specific gate settings in the FPP spill tables. Actual spill may be higher or lower than the identified spill rate. Spill percentages: Spill percentages are considered target spill levels. The project control room operator and BPA duty scheduler calculate spill rates to attempt to be within +/- 1% of the target percentage for the following hour (Table 3). These percentages may not be attained due to low flow conditions, periods of minimum generation, when spill caps limit spill amounts, when spill is curtailed for navigation safety, and other circumstances. Operators and schedulers will review the percentages achieved during the day and adjust spill rates in later hours, with the objective of ending the day with a day average spill that achieves the target.
DRAFT
6
Table 3. Comparison of 2007 spill levels in the Agreement with operational spill levels at mainstem dams.
Season/Project 2007 Agreement Spill Levels
2007 Operational Spill Levels Comments
Spring
Lower Granite 20 kcfs day/night 20.4 kcfs Will fluctuate due to project head changes
Little Goose 30% day/night 30% +/- 1% hourly Target* 30% as a day average
Lower Monumental 27 kcfs day/night (Gas Cap) spill cap day/night Meet spill cap daily
Ice Harbor 30% day/night vs. 45 kcfs day / Gas Cap night
30% +/- 1% hourly; 45.6 kcfs day / spill cap
night
Target 30% as a day average;
45.6 kcfs will fluctuate due to head changes;
meet nightly spill cap
McNary 40% day/night 40% +/- 1% hourly Target 40% as a day average
John Day 0 day / 60% night 60% +/- 1% hourly Target 60% as a nightly average
The Dalles 40% day/night 40% +/- 1% hourly Target 40% as a day average
Bonneville 100 kcfs day/night 100 kcfs Will fluctuate due to head changes
Summer
Lower Granite 18 kcfs day/night 18.6 kcfs Will fluctuate due to head changes
Little Goose 30% day/night 30% +/- 1% hourly Target 30% as a day average
Lower Monumental 17 kcfs day/night 17.1 kcfs Will fluctuate due to head changes
Ice Harbor 30% day/night vs. 45 kcfs day / Gas Cap night
30% +/- 1% hourly; 45.6 kcfs day / spill cap
night
Target 30% as a day average;
45.6 kcfs will fluctuate due to head changes;
meet nightly spill cap
McNary 40% day/night vs. 60% day/night
40% +/- 1% hourly; 60% +/- 1% hourly
Target 40% or 60% as a day average
John Day 30% day/night 30% +/- 1% hourly Target 30% as a day average
The Dalles 40% day/night 40% +/- 1% hourly Target 40% as a day average
Bonneville 75 kcfs day / 120 kcfs night
74.6 kcfs day / spill cap night **
74.6 kcfs will fluctuate due to head changes;
meet nightly spill cap
* Target: Make best effort to meet a specified spill level through frequent monitoring, projections, and spill adjustments within the defined range of variation. This will occur for each project through analysis and coordination between the Corps and BPA. ** The Bonneville Dam summer daytime spill discharge rate may increase from 75 kcfs to 81 – 83 kcfs, summer nighttime spill may be reduced from the spill cap to a specified level (not yet defined), and the start date of summer spill may be moved from July 1 to June 21. These changes are being regionally coordinated through FPOM, FFDRWG, and TMT.
DRAFT
7
Minimum Generation The Corps has identified minimum generation flows derived from FPP tables which specify turbine operation within the 1% of best efficiency range. These figures are approximations and do not account for varying head or other small adjustments that may result in variations in the reported minimum generation flow and spill amount. Conditions that may result in minor variations include:
1. Varying pool elevation: as reservoirs fluctuate within the MOP to MOP+1 operating range, or through the normal pool operating ranges, flow rates through the generating unit change.
2. Generating unit governor "dead band": the governor controls the number of megawatts the unit should generate and cannot precisely control a unit; variations can be +/- 1% to 2% of generation.
3. System disturbances: once the generator is online and connected to the grid, it responds to changes in system voltage and frequency. These changes may cause the unit to increase flow and generation slightly within an hour.
4. Individual units may behave slightly differently or have unit specific constraints. 5. Generation control systems regulate megawatts (MW) generation only, and not flow
through turbines.
All of the lower Snake River powerhouses may be required to keep one generating unit on line at all times for power system reliability. During low flows, one generator is run at the bottom of the 1% of best efficiency range. All of the Snake River plants have 2 “families” of turbines with slightly different capacities. In most cases one of the smaller units, with somewhat less generation and flow, will be online during these times. At the Snake River dams, the smaller units are generally numbered 1 – 3 and are the first priority for operation during the fish passage season. However, if smaller units are unavailable, one of the larger units may be used. Further, at Lower Monumental, generating unit 1, which is the first priority unit during fish passage, is damaged and cannot operate at the low end of the design range. However, because this unit is a fish passage priority TMT may recommend use of this unit, which will result in higher turbine discharge rates than shown in the Lower Monumental Summer Operation Considerations section below. Spring and Summer Operations for Fish Passage by Project The following describes the spring and summer operations by project. Included in the description is planned research as considered in the 2004 Biological Opinion. The Corps, and the regional agencies and Tribes are interested in the continuation of project research studies under the Corps’ AFEP. These studies have undergone review by the regional agencies and Tribes and are consistent with the Agreement. The studies are intended to provide further information on project survival and assist the region in making decisions on future operations and configuration actions to improve fish passage at the Lower Snake and Columbia River dams.
DRAFT
8
Lower Granite Spring Spill Operations April 3 – June 20, 2007: 20 kcfs (including approximately 6 kcfs from the RSW and 14 kcfs from the training spill) 24 hours/day with the Removable Spillway Weir (RSW) operating. See Table 3 for operational spill levels.
Changes in Operations for Research Purposes:
• Spring research operations: Normal spring spill patterns and rates as described in the FPP will be used. There will be no specific spill variations for testing.
Operation considerations:
o The Behavioral Guidance Structure (BGS) will be removed from the forebay
in March 2007, prior to the fish passage season. The trash/shear boom will be modified, repaired and repositioned when the BGS is removed.
o Unit 2 will be out of service until mid-June. The powerhouse will operate with no more than 5 units on during the spring spill season. Contracts for unit breaker replacement and fire protection installation will be completed in 2007. These activities could limit unit availability.
o With one unit out of service, powerhouse capacity is about 85 kcfs. If total river discharge is greater than approximately 105 kcfs, then spillway discharge will be forced above RSW spill + training spill levels. This involuntary spill could result in gas cap exceedances. Lack of power load also could cause involuntary spill at higher total river discharges.
Once the operations for research are completed, the spill pattern will return to RSW plus training spill for a total 20 kcfs spill as described in the FPP. This is the same as during the test. Summer Spill Operations June 21 – August 31, 2007: 18 kcfs (including approximately 6 kcfs from the RSW and 12 kcfs from the training spill) 24 hours/day with the RSW operating. See Table 3 for operational spill levels.
Changes in Operations for Research Purposes: • Spill duration for RSW testing (timing): Approximately mid-June to late July. The
dates of testing will be dependent on the size of fish, fish availability, and the number of treatments needed for testing. Final test dates will be coordinated through the SRWG.
• Summer research operations: The RSW spill pattern may be modified to conduct a
summer test of RSW performance. Final spill conditions will be coordinated through the SRWG.
DRAFT
9
• Objectives of the biological test: The purpose of the summer test will be to evaluate the performance of the RSW relative to passage and survival of subyearling fall Chinook.
• Spill pattern during biological test: Test spill patterns are being developed and
coordinated through SRWG. Operation considerations:
o Contracts for unit breaker replacement and fire protection installation will be
completed in 2007. These activities could limit unit availability. o Minimum spill: During periods of low flow before the spring freshet and
during the summer period, there may be periods where spill quantities are limited so that tailrace conditions are not advantageous to fish passage. If such low runoff conditions occur, alternative spill operations at the dam will be coordinated through the TMT.
o Minimum generation: The minimum generation amount represents the operation of one unit at the lower end of its 1% efficiency range and is needed for power system reliability. This generation will be controlled to approximately 81 – 83 MW at units 1 – 3, the priority fish units. If these units are not available, the larger units 4 – 6 will be run at 96 - 100 MW. This will result in turbine flows of approximately 11 kcfs – 12 kcfs at units 1 – 3 and 12.5 kcfs - 13.5 kcfs at units 4 - 6. There may be slight variations in the generation due to power system fluctuations. Also, the outflow will fluctuate because of changing head at the dam. This condition may occur in early spring before the freshet and during the late summer period with low flow conditions.
Once the operations for research are completed, spill patterns will return to summer spill normal operations as described in the FPP and to the levels shown in the tables above.
Little Goose
Spring Spill Operations April 3 – June 20, 2007: 30% spill 24 hours/day. In addition, allow for 14 nights of spill up to gas cap spill rates between April 22 and May 15. See Table 3 for operational spill levels.
Changes in Operations for Research Purposes: • Spill duration for testing: Approximately mid April to late May. The dates of testing
will be dependent on the size of fish and fish availability. Final dates for testing will be coordinated through the SRWG.
• Spring research operations: 30% spill 24 hour/day. A tapered bulk spill pattern will
be tested. Final test conditions will be coordinated through the SRWG.
DRAFT
10
• Objectives of the biological test: The primary objectives of the spring test will be to determine route specific survival estimates, approach paths, passage distribution, forebay residence time, and tailrace egress under a tapered bulk spill pattern.
• Spill pattern during the biological test: The test spill pattern is provided in Appendix
1. Operation considerations:
o In both spring and summer, day average flows in the lower Snake River near
30 kcfs can result in incompatible operations with Lower Monumental Dam and cause spill quantity fluctuations.
o The fire suppression system for each turbine unit will be replaced in 2007. One unit at a time will be taken out of service for 9 days per unit to complete this work. This will result in a 5 unit powerhouse operation. At this time the work is scheduled during the spring fish passage season.
o Contracts for unit breaker replacement and fire protection installation will be completed in 2007. These activities could limit unit availability.
o The powerhouse capacity with one unit out of service is approximately 108 kcfs. If total river discharge is greater than approximately 140 kcfs, then spillway discharge will be forced above the planned operation of 30% spill.
o Nighttime spill up to gas cap rates will be provided for 14 days between April 22 and May 15. The spill is intended to coincide with peak passage periods for wild yearling Chinook. The 14 spill days do not have to be consecutive. Actual dates will be determined through coordination with TMT.
Once the operations for research are completed, spill patterns will return to normal operation as described in the FPP and to the levels shown in Table 3. Summer Spill Operations June 21 – August 31, 2007: 30% spill 24 hours/day. See Table 3 for operational spill levels.
Changes in Operations for Research Purposes:
• Spill duration for testing: Approximately mid-June – end of July. The dates of testing will be dependent on the size of fish and fish availability. Final dates for testing will be coordinated through the SRWG.
• Summer research operations: 30% spill 24 hour/day. The modified bulk spill pattern
used in the spring will be continued in the summer test. Final test conditions will be coordinated through the SRWG.
• Objectives of the biological test: The summer test will determine route specific
survival estimates, approach paths, passage distribution, forebay residence time, and tailrace egress for subyearling fall Chinook.
DRAFT
11
• Spill pattern during the biological test: The test spill pattern is provided in Appendix 1.
Operation considerations:
o In the 2005 summer spill period, adult passage was blocked when daytime
spill levels were above 30%. Therefore, it is possible that as flow recedes in summer of 2007, the summer spill patterns and treatments may need to be changed through TMT adaptive management process so that good adult passage is maintained.
o Contracts for unit breaker replacement and fire protection installation will be completed in 2007. These activities could limit unit availability.
o Minimum spill: During periods of low flow before the spring freshet and during the late summer period, there may be periods where spill quantities are so low that it creates tailrace conditions not advantageous to fish passage. If such flow conditions occur, alternative operations at the dam will be coordinated through the TMT.
o Minimum generation: The minimum generation amount represents the operation of one unit at the lower end of its 1% efficiency range and is needed for power system reliability. This generation will be controlled to approximately 81 – 83 MW at units 1 – 3, the priority fish units. If these units are not available, the larger units 4 – 6 will be run at 100 - 104 MW. This should result in turbine flows of 11 kcfs – 12 kcfs at units 1 – 3 and 13 kcfs – 14 kcfs at units 4 – 6. There may be slight variations in the generation due to power system fluctuations. Also, the outflow will fluctuate because of changing head at the dam. This situation may occur in early spring before the freshet and during the late summer period with low flow conditions.
Once the operations for research are completed, the spill patterns will return to normal operation as described in the FPP and to the spill levels as shown in the tables above.
Lower Monumental
Spring Spill Operations April 3 – June 20, 2007: Spill to the spill cap 24 hours/day. The estimated spring spill cap rate is 27 kcfs. See Table 3 for operational spill levels.
Changes in Operations for Research Purposes:
• Spill duration for testing: Approximately mid-April to early June. The dates of testing will be dependent on the size of fish, fish availability, and the number of treatments needed for testing. Final dates for testing will be coordinated through the SRWG.
• Spring research operations: Two spill patterns will be used depending on total river
flow. A bulk spill pattern (high gate opening alternative) will be evaluated at river flows less than 120 kcfs simulating an RSW operation. For river flow in excess of
DRAFT
12
120 kcfs, a more uniform spill pattern will be used. Final test conditions will be coordinated through the SRWG.
• Objectives of the biological test: The primary objective is to provide a relative
survival estimate for fish using Radio Tags (RT) that travel volitionally through the project. This will provide a third year of survival and passage data for yearling Chinook and a second year of data for steelhead. This will be the second year of testing a spill pattern developed for use assuming an RSW installed in spillbay 8. A single treatment test is planned in order to provide a strong baseline estimate for future comparisons with different operations.
• Spill pattern during the biological test: Spill patterns in the FPP will be used (FPP
Tables LMN-9 and LMN-10). Operation considerations:
o In the spring and summer, day average flows near 30 kcfs results in
incompatible operations with Little Goose Dam and results in spill quantity fluctuation.
o The Lower Monumental spill cap is affected by Little Goose Dam operations. Therefore, spill discharge could be lower than 27 kcfs.
o The removable spillway weir (RSW) that was planned for installation and use beginning April 2007 will not be installed until after the 2007 fish spill season. However, pre-installation work at the spillway may result in temporary spill pattern changes in early April (about April 3 – 13). This is being coordinated through SCT and TMT. For diver safety, spill will not exceed 27 kcfs during this special operation.
o Operating units within the 1% of best efficiency range yields up to 19 kcfs per unit at each of the 6 units for a maximum hydraulic capacity of approximately 114 kcfs. The expected spill cap is 27 kcfs. Therefore, if total river discharge is greater than 149 kcfs the gas cap will be exceeded. Either lack of power load or unit outages can also cause forced spill above spill cap rates at higher total river discharges.
During non-test periods, the spill patterns will return to normal operation as described in the FPP and to the spill levels as shown in the tables above. Summer Spill Operations June 21 – August 31, 2007: Spill 17 kcfs 24 hours per day, subject to gas cap limits. See Table 3 for operational spill levels.
Changes in Operations for Research Purposes:
• Spill duration for testing: June 21 – August 31 (entire summer spill period). The dates of testing will be dependent on the size of fish, fish availability, and the number of treatments needed for testing. Final dates for testing will be coordinated through the SRWG.
DRAFT
13
• Summer research operations: Two pattern spill test will continue in the summer.
• Objectives of the biological test: Monitor fall Chinook movement with RT to
provide a relative survival estimate. Additionally, there will be an acoustic telemetry study to characterize the relationship between fish movement, mortality, and hydrodynamic conditions in the reservoir during summer months. Findings are intended as a baseline for comparison to a RSW Post Construction Survival Evaluation study in 2008.
• Spill pattern during the biological test: FPP spill patterns will be used (FPP Table
LMN-9).
Operation considerations:
o As in the spring, the summer spill caps may be affected by Little Goose operations.
o Contracts for unit breaker replacement and fire protection installation will be completed in 2007. These activities could limit the availability of generation units.
o Minimum spill: During periods of low flow before the spring freshet and during the summer period, there may be periods when spill quantities are limited so that tailrace conditions are not advantageous to fish passage. This is interpreted to be a minimum of a 4 gate stop opening in spillbay 8 (6.2 kcfs), based on general model investigations during February 2007. If such a low flow condition occurs, alternative operations at the dam will be coordinated through the TMT.
o Minimum generation: The minimum generation amount represents the operation of one unit at the lower end of its 1% of best efficiency range and is needed for power system reliability. This generation will be controlled to approximately 81 – 83 MW at units 2 – 3, the priority fish units. If these units are not available, the larger units 4 – 6 will be run at 104 - 106 MW on units 4 – 6, or 126 – 129 MW on unit 1 which has welded fixed blades. This will result in turbine flows of approximately 11 kcfs – 14 kcfs at units 2 – 6 and 17 kcfs – 19 kcfs if unit 1 is used. There may be slight variations in the generation due to power system fluctuations. Also, the outflow will fluctuate because of changing head at the dam. This limit may occur in early spring before the freshet and during the late summer period with low flow conditions.
Operations for research will continue throughout the summer spill period.
Ice Harbor Spring Spill Operations April 3 – June 20, 2007: 45 kcfs day/spill cap night with the RSW operating. See Table 3 for operational spill levels.
DRAFT
14
Changes in Operations for Research Purposes:
• Spill duration for testing (timing): Approximately April 20 – June 10. The dates of
testing will be dependent on the size of fish, fish availability, and the number of treatments needed for testing. Final dates for testing will be coordinated through the SRWG.
• Spring research operations: Randomized block schedule will be used to test the 2
conditions of 30% spill 24 hours per day and 45 kcfs day / spill cap night. Both treatments will have the RSW operating.
• Objectives of the biological test: Determine the passage rates and survival of fish
during 2 operations of 30% spill 24 hours per day and 45 kcfs day / spill cap night. • Spill pattern during the biological test: FPP spill patterns will be used (FPP Tables
IHR-9 and IHR-10). Operation considerations:
o Powerhouse capacity at Ice Harbor is approximately 94 kcfs with all 6 units operating, while spill cap rates are about 100 kcfs. If total river flows exceed about 194 kcfs, TDG levels may exceed the limits set by the states of Oregon and Washington.
o Minimum generation or higher powerhouse operation will occur at all times during both the spring and summer fish spill seasons in 2007. This is due to a transformer failure at BPA’s Sacajawea transmission facility near the project. Mobile capacitor groups will be installed at BPA’s Franklin transmission facility to partially resolve power system issues. In addition, continuous generation is required at Ice Harbor Dam for power system stability and reliability. It is possible that generation higher than minimum could be required during extremely heavy load periods.
Operations for research will continue through the entire spring period. Summer Spill Operations June 21 – August 31, 2007: 45 kcfs day/spill cap night with the RSW operating. See Table 3 for operational spill levels.
Changes in Operations for Research Purposes:
• Spill duration for testing: Approximately June 11 – July 10. The dates of testing will be dependent on the size of fish, fish availability, and the number of treatments needed for testing. Final dates for testing will be coordinated through the SRWG.
• Summer research operations: Continue 30% spill vs. 45 kcfs day / spill cap night.
Both treatments will have the RSW operating.
DRAFT
15
• Objectives of the biological test: Determine the passage rates and survival through all
passage routes for subyearling fall Chinook. • Spill pattern during the biological test: FPP spill patterns will be used (FPP Tables
IHR-9 and IHR-10, same as spring).
o Minimum spill: During periods of low flow before the spring freshet and during the summer period, there may be periods where spill quantities are limited so that tailrace conditions are not advantageous to fish passage. The minimum spill for Ice Harbor Dam is 15.2 kcfs, which includes providing spill through the RSW and training spill to ensure good tailrace egress conditions. If such a low flow condition occurs, alternative operations at the dam will be coordinated through the TMT.
o Minimum generation: The minimum generation amount represents the operation of one unit at the lower end of its 1% efficiency range and is needed for power system reliability. This generation will be controlled to approximately 61 – 63 MW at units 1 – 3, the priority fish units. If these units are not available, the larger units 4 – 6 will be run at 69 - 70 MW. This will result in turbine flows of approximately 8 kcfs – 9 kcfs at units 1 – 3 and 9 kcfs – 10 kcfs at units 4 – 6. There may be slight variations in the generation due to power system fluctuations. Also, the outflow will fluctuate because of changing head at the dam. This limit may occur in early spring before the freshet and during the late summer period with low flow conditions.
o Sacajawea transformer failure will require continuous powerhouse operation at the minimum generation level or higher.
o Contracts for unit breaker replacement and fire protection installation will be completed in 2007. These activities could limit unit availability.
Once research spill operations are completed, the 45 kcfs day / spill cap night spill pattern in the FPP with the RSW operating will be used (FPP Table IHR-10), at the levels shown in Table 3.
McNary
Spring Spill Operations April 10 – June 30, 2007: 40% spill 24 hours/day. See Table 3 for operational spill levels.
Changes in Operations for Research Purposes: • Spill duration for testing: April to early June (tentative). The dates of testing will be
dependent on the size of fish, fish availability, and the number of treatments needed for testing. Final dates for testing will be coordinated through the SRWG.
• Spring research operations: 40% spill 24 hours/day for Prototype Temporary
Spillway Weir (PTSW) testing. Two project spill configurations will be tested. Final test conditions will be coordinated through the SRWG.
DRAFT
16
• Objectives of the biological test:
o Estimate passage and survival rates of yearling Chinook salmon under two
treatments of project operations. o Estimate passage and survival rates of juvenile steelhead under two treatments
of project operations. o Characterize juvenile salmon behavior in the forebay of McNary Dam under
two treatments of project operations. • Spill pattern: As outlined in an addendum to the FPP. The Corps’ Walla Walla
District will continue coordination with regional fishery managers and will evaluate new spill patterns with general model observations in the late March/April time frame.
Operation considerations:
o During the periods when total river discharge exceeds approximately 320
kcfs, involuntary spill in excess of the states’ TDG limits for fish passage, may occur.
o In addition, low power demand may also necessitate involuntary spill during any given spill treatment at total river discharges of less than 320 kcfs.
Once research spill operations are completed, the spill patterns will return to normal operation as described in the FPP (Table MCN-6). Summer Spill Operations July 1 – August 31, 2007: 40% spill vs. 60% spill 24 hours/day. Spill conditions will be alternated every two days. See Table 3 for operational spill levels.
Changes in Operations for Research Purposes:
• Spill duration for testing: Late June until August (tentative). The dates of testing will be dependent on the size of fish, fish availability, and the number of treatments needed for testing. Final dates for testing will be coordinated through the SRWG.
• Summer research operations: 40% spill 24 hours/day vs. 60% spill 24 hours/day.
Continue to evaluate PTSW performance. The spill will be alternated in two day blocks which will be randomized during testing.
• Objectives of the biological test:
o Estimate passage and survival rates of subyearling fall Chinook salmon under
two treatments of project operations. o Characterize juvenile salmon behavior in the forebay of McNary Dam under
two treatments of project operations.
DRAFT
17
• Spill pattern during the biological test: As outlined in an addendum to the FPP. Spill pattern details will be identified using the general model at ERDC by USACE Walla Walla District staff and representatives of the regional fisheries agencies and tribes.
Operation considerations:
o Minimum generation: A minimum powerhouse discharge of 50 kcfs is
required at all times to meet minimum generation requirements. The lower Columbia River dams provide some of the required generation capacity reserves for the power system. Due to this requirement and the constant fluctuations in power demands throughout the day, the 50 kcfs flow cannot be maintained precisely on an hourly basis. The flow may increase by as much as 10 kcfs for short periods. Therefore, the minimum generation flow should meet or exceed 50 kcfs for all hours.
o If total river discharge drops below about 90 kcfs, 40% spill treatments may be reduced to maintain 50 kcfs powerhouse discharge. Similarly, if total river discharge drops below about 135 kcfs, 60% spill treatments may be reduced to maintain a 50 kcfs powerhouse discharge.
o Minimum spill: During periods of low flow before the spring freshet and during the summer period, there may be periods where spill quantities are limited so that tailrace conditions are not advantageous to fish passage. If such a low flow condition occurs, alternative operations at the dam will be coordinated through the TMT.
o Units 11 and 12 are scheduled out of service July through August for transformer replacement.
Once research spill operations are completed, the spill patterns will return to normal operation as described in the FPP (Table MCN-6).
John Day Spring Spill Operations April 10 – June 30, 2007: 0 kcfs spill day/60% spill night. See Table 3 for operational spill levels.
Changes in Operations for Research Purposes:
Spring research operations: There is no research planned for 2007 that requires specific spill operations.
Operation considerations:
o The hydraulic capacity for John Day is approximately 325 kcfs with 16 units
in operation. If total river discharge exceeds this level, involuntary spill will occur during the daytime.
o Planning for a 2008 PTSW test will occur, leading to 24-hour spring spill in 2008 at John Day.
DRAFT
18
o If total river flow exceeds approximately 400 kcfs at night, 60% night spill levels would be 160 kcfs which may exceed TDG levels.
o Units 5 – 8 are currently out of service and expected to return to service in late April. Units 1 and 4 are scheduled for overhaul August through September.
Summer Spill Operations July 1 – August 31, 2007: 30% spill 24 hours/day. See Table 3 for operational spill levels.
Changes in Operations for Research Purposes:
Spill pattern during the biological test: There is no biological test planned for John Day in 2007, therefore no special operations are required. Spill patterns described in the FPP will be used.
Operation considerations:
o Minimum spill: During periods of low flow before the spring freshet and during the summer period, there may be periods where spill quantities are limited so that tailrace conditions are not advantageous to fish passage. If such a low flow condition occurs, alternative operations at the dam will be coordinated through the TMT.
o Minimum generation: A minimum powerhouse discharge of 50 kcfs is required at all times to meet minimum generation requirements. The lower Columbia River dams provide some of the required generation capacity reserves for the power system. Due to this requirement and the constant fluctuations in power demands throughout the day, the 50 kcfs flow cannot be maintained precisely on an hourly basis. The flow may increase by as much as 10 kcfs for short periods. Therefore, the minimum generation flow should meet or exceed 50 kcfs for all hours.
o If river flows drop below about 75 kcfs then spill may need to drop below 30% spill in order to maintain station service and power system needs.
The Dalles
Spring Spill Operations April 10 – June 30, 2007: 40% spill 24 hours/day. See Table 3 for operational spill levels.
Changes in Operations for Research Purposes:
• Objectives of the biological test:
o Smolt response to hydrodynamic conditions upstream of the ice and trash sluiceway will be evaluated in 2007. The DIDSON camera and acoustic Doppler current profiler will be used to collect field data for this study. No special spill operations are required for this test.
DRAFT
19
• Spill pattern during the biological test: The FPP spill patterns will be used. Research will not change spill patterns or levels.
Operation considerations:
o Spillway wire ropes at The Dalles Dam were replaced on Bays 1-9 in 2006.
These bays are fully operational in 2007. Spill bays 10, 11, and 13 are not available for normal operation in 2007. Spill bays 12 and 14 – 22 can be operated in emergencies.
o When high river flows exceed those shown in the table below such that available bays 1 – 9 cannot maintain 40% spill, FPOM and TMT will discuss the preferred spill pattern and rate. The project may maintain 40% spill of the total river flow and depart from the spill pattern, or spill less than 40% of the total river flow using a pattern other than that shown in the FPP. At no time is spill recommend on the south side of the spillway (Bays 14-22) as this creates a poor tailrace egress condition for spillway-passed fish.
o There will be two turbine units out of service for most of the 2006 spill season. Units 2 and 15 are expected to return to service in early April. Units 17 and 18 will be out of service May through June. Units 5 – 8 will be out of service in August.
Summer Spill Operations July 1 – August 31, 2007: 40% spill 24 hours/day. See Table 3 for operational spill levels.
Changes in Operations for Research Purposes:
• Objectives of the biological test:
o Smolt response to hydrodynamic conditions upstream of the ice and trash sluiceway will be evaluated in 2007. The DIDSON camera and acoustic Doppler current profiler will be used to collect field data for this study. No special operations are required for this test.
• Spill pattern during the biological test: as outlined in the FPP. Research will not
change spill patterns or levels. Operation considerations:
o When high river flows exceed those shown in the table above such that available bays 1 – 9 cannot maintain 40% spill, FPOM and TMT will discuss the preferred spill pattern and rate. The project may maintain 40% spill of the total river flow and depart from the spill pattern, or spill less than 40% of the total river flow using a pattern other than that shown in the FPP. At no time is spill recommend on the south side of the spillway (Bays 14-22) as this creates a poor tailrace egress condition for spillway-passed fish.
DRAFT
20
o Minimum generation: A minimum powerhouse discharge of 50 kcfs is required at all times to meet minimum generation requirements. The lower Columbia River dams provide some of the required generation capacity reserves for the power system. Due to this requirement and the constant fluctuations in power demands throughout the day, the 50 kcfs flow cannot be maintained precisely on an hourly basis. The flow may increase by as much as 10 kcfs for short periods. Therefore, the minimum generation flow should meet or exceed 50 kcfs for all hours.
o If river flows drop below about 90 kcfs then spill may need to drop below 40% spill in order to maintain station service and power system needs.
Bonneville
Spring Spill Operations April 10 – June 30, 2007: 100 kcfs spill 24 hours/day. See Table 3 for operational spill levels.
Changes in Operations for Research Purposes: • Spill duration for testing: April 26 – June 7. The dates of testing will be dependent
on the size of fish and fish availability. Final dates for testing will be coordinated through the SRWG.
• Spring research operations: 100 kcfs spill 24 hours/day.
• Objectives of the biological test: Estimate total survival of yearling Chinook passing
through the dam and spillway. Focus will be on new spill patterns to improve project spill survival.
• Spill pattern during the biological test: Fish passage spill patterns are provided in
Appendix 1. For spill rates exceeding 100 kcfs, spill patterns described in the FPP will be used. Research will not change spill patterns or rates.
Operation considerations:
o Minimum spill discharge rate is 50 kcfs. This is to provide acceptable juvenile
fish egress conditions in the tailrace. o At spring flows less than 135 kcfs, spill will be less than 100 kcfs to maintain
minimum powerhouse generation of 30 kcfs plus fish ladder and facility spill (e.g. corner collector).
o Currently units 8, 10, 13, and 15 are out of service. Without these units operating, the current total hydraulic capacity for the two powerhouses is about 195 kcfs. Unit 13 is expected to return to service in late March, adding about 18 kcfs, (213 kcfs total). Unit 10 will be back in late April, adding 13 kcfs (226 kcfs total), and unit 15 is expected to be back in service by mid-May, adding 18 kcfs (244 kcfs total). Unit 8 will remain out of service through February 2008. Each of the
DRAFT
21
reported dates is subject to change. If inflows exceed the capacities stated above plus 100 kcfs spill, spill levels will exceed the levels in the Agreement.
Summer Spill Operations July 1 through August 31, 2007: 75 kcfs Day / spill cap night. The estimated summer spill cap rate is 120 kcfs. See Table 3 for operational spill levels. The summer daytime spill discharge rate may increase to 81 – 83 kcfs, nighttime spill may be reduced to a specified level (not yet defined), and the start date of summer spill may be moved to June 21. These changes are being regionally coordinated. See Operation Considerations below for explanations.
Changes in Operations for Research Purposes:
• Spill duration for testing: Late June through July. Continue tests of new spill patterns in the summer. Final dates for testing will be coordinated through the SRWG.
• Summer research operations: 75 (or 81 – 83) kcfs spill day / spill cap night.
• Objectives of the biological test: Estimate total survival of subyearling Chinook
passing through the dam and spillway. Focus will be on new spill patterns to improve project spill survival.
• Spill Patterns for summer operations: Fish passage spill patterns are provided in
Appendix 1. For spill rates exceeding 100 kcfs, spill patterns described in the FPP will be used.
Operation considerations:
o Minimum generation: A minimum powerhouse discharge of 30 kcfs is required at
all times to meet minimum generation requirements. The lower Columbia River dams provide some of the required generation capacity reserves for the power system. Due to this requirement and the constant fluctuations in power demands throughout the day, the 30 kcfs flow cannot be maintained precisely on an hourly basis. The flow may increase by as much as 10 kcfs for short periods. Therefore, the minimum generation flow should meet or exceed 30 kcfs for all hours.
o Minimum spill discharge level is 50 kcfs. This is to provide acceptable juvenile fish egress conditions in the tailrace.
o The summer daytime spill level may be 81 – 83 kcfs instead of 75 kcfs. In model studies at ERDC, higher discharges appear to provide a more effective spill pattern for juvenile fish egress than does the 75 kcfs pattern. Also, summer nighttime spill at Bonneville may be reduced from gas cap spill levels to a specified maximum spill discharge rate in kcfs (not yet defined). Because fish survival is currently less than desired at the Bonneville Dam spillway, there is a need to implement operational changes in 2007 to improve project passage conditions. This change has been coordinated through FPOM and will be coordinated through FFDRWG and TMT.
DRAFT
22
o For fish passage research, the start date for summer spill may be moved to June 21, rather than July 1. This would enable data collection through a larger portion of the subyearling Chinook salmon outmigration and thus improve the study. Fish passage and survival benefits are expected from this operational change as well. This has been coordinated through FPOM and will be coordinated through FFDRWG and TMT.
Juvenile Fish Transportation Program Operations As noted above, the Corps’ planned fish operations assume average runoff conditions. Based on collaborative discussion with the regional agencies and tribes, and as described in the Agreement, the following explains the juvenile fish transportation program under all runoff conditions. The lower Snake River projects are described first, followed by McNary project operations. Detailed descriptions of project and transport facility operations to implement the program are contained in FPP Appendix B.
Lower Snake River Dams - Operation and Timing: If the Snake River projected seasonal average (April 3 – June 20) flow is greater than 70 kcfs, the Corps will initiate transportation at Lower Granite Dam no earlier than April 20 and no later than May 1. The seasonal average flow projection will be based on the Corps’ STP model and the April final water supply forecast for Lower Granite. The actual start date in 2007 will be determined through coordination with TMT as informed by the in-season river condition (e.g. river flow and temperature) and the status of the juvenile Chinook and steelhead runs (e.g. percentage of runs having passed the project). Also if the projected flow is greater than 70 kcfs, transportation will start 8 days and 11 days after the Lower Granite Dam start date for Little Goose and Lower Monumental dams, respectively. The actual start dates at Little Goose and Lower Monumental dams will be further considered through the TMT process, depending on in-season river conditions and the status of the juvenile Chinook and steelhead runs. In exceptionally low water years, when the projected seasonal average flow is less than 70 kcfs, the Corps will begin transportation on April 20 at all three Snake collector projects. Spill for fish passage will occur under all flow conditions.
a. Lower Granite: All ESBSs will be installed by March 25 and juvenile fish bypassed via normal separator operations and routed to the mid-river release outfall. All juvenile fish collected will be interrogated for PIT tags and normal 24-hour sampling for the Smolt Monitoring Program will take place.
b. Little Goose and Lower Monumental: All ESBSs and STSs will be installed by April 1 and juvenile fish bypassed will occur via the normal separator operations and fish will be routed to normal facility bypass outfalls. All juvenile fish will be interrogated for PIT tags and limited sampling may take place every 3 to 5 days to monitor fish condition.
April 20 – June 20: The collection of fish at lower Snake River projects for transportation will commence at 0700 hours on the agreed to start dates. Barging of fish will begin the following
DRAFT
23
day and collected juvenile fish will be barged from each facility on a daily or every-other-day basis (depending on the number of fish) throughout the spring. Transport operations will be carried out concurrent with spill operations at each project and in accordance with all relevant FPP operating criteria. June 21 – August 15: Transportation of juvenile fish from all three Snake River transport projects will continue on an every-other-day basis from June 21 through August 15, via barges. August 16 – August 31: After August 15, trucks will be used for transporting juvenile fish from the Snake River collector projects on an every-other-day basis through August 31. September 1 – Completion: Transportation of juvenile fish via trucks on an every-other-day basis will continue through October 31, 2007 at Lower Granite and Little Goose dams. At Lower Monumental Dam, transportation of fish via every-other-day trucking will continue through September 30, 2007.
McNary Dam - Operation and Timing: Spring: Juvenile fish collected at McNary during the spring, April 1 through June 20, will be bypassed to the river. The normal operation will be to bypass fish through the full flow bypass pipe, which has interrogation capability to monitor for PIT tags. Every other day, however, in order to sample fish for the Smolt Monitoring Program, fish will be routed through the separator, interrogated for PIT tags, and then bypassed to the river. Summer: When river conditions are determined to no longer be “spring like” as defined in the FPP and discussed at TMT, transportation of juvenile fish will begin. Collected juvenile fish will be barged every other day through August 16 unless they have been marked for in-river passage research. From August 16 through September 30, transportation will occur via trucks. Navigation Safety Short-term (normally 30 minutes or less) adjustments in spill patterns or reductions in spill discharge rates may be required for navigation safety, mostly at the lower Snake projects but sometimes at lower Columbia projects as well. This includes both commercial tows and fish barges. These operations will be coordinated through TMT. Emergency Protocols The Corps will operate the projects in emergency situations in accordance with the Water Management Plan (WMP) Emergency Protocols (WMP Appendix 1). The Protocols define emergency conditions and situations that may arise which affect the generation and delivery of energy produced by the FCRPS, and the immediate actions that may be taken in the face of the emergency. The Corps, BPA, and the Bureau of Reclamation are revising the Emergency Protocols in coordination with TMT. The most recent version of the Emergency Protocols, dated August 22, 2006, is located at: http://www.nwd-wc.usace.army.mil/tmt/documents/wmp/2007/draft/app1.pdf
DRAFT
24
Reporting The Corps will prepare spring and summer seasonal reports on the implementation of 2007 fish passage operations. The reports will include the following information:
• the hourly flow through the powerhouse; • the hourly flow over the spillway compared to the spill target for that hour; and, • the resultant 12-hour average TDG for the tailwater at each project and for the next
project’s forebay downstream. The reports will also provide information on substantial issues that arise as a result of the spill program (e.g. Little Goose adult passage issue in 2005). The reports also will address any emergency situations that arise. The Corps will continue to provide the following data to the public regarding project flow, spill rate, TDG level, and water temperature.
• Flow and spill quantity data for the lower Snake and Columbia River dams are posted to the following website every hour: http://www.nwd-wc.usace.army.mil/report/projdata.htm
• Water Quality: TDG and water temperature data are posted to the following website
every six hours: http://www.nwd-wc.usace.army.mil/report/total.html These data are received via satellite from fixed monitoring sites in the Columbia and Snake rivers every six hours, and placed on a Corps public website upon receipt. Using the hourly TDG readings for each station in the lower Snake and Columbia rivers, the Corps calculates the highest 12-hour average TDG for each station. These averages are reported at: http://www.nwd-wc.usace.army.mil/ftppub/water_quality/12hr/html/
DRAFT
25
Appendix 1
Test Spill Patterns
Special spill patterns for 2007 tests are provided for Little Goose and Bonneville dams.
DRAFT
26
Little Goose Dam: Tapered Bulk Spill Pattern for 2007 Spill Bays -- Stops Total Total Spill Q Total PH Q Total River Q Stops (kcfs) (kcfs) (kcfs) 1 2 3 4 5 6 7 8 (see Note 1)
Notes (Little Goose): 1. The total river discharges shown in this table assume 30% spill. Actual total discharge (and thus % spill) may vary slightly for a given spill pattern to keep turbines within 1% of peak efficiency. This is true up to 25 total stops, after which powerhouse capacity is reached and higher than 30% spill will be required as in Note 4. 2. This is the spill level (18 total stops or 34.1 kcfs) where the spill pattern starts transitioning from a tapered bulk spill pattern to a uniform spill pattern, with 5 stops retained in Bay 2 to simulate an RSW. This will require 4 spillway gate setting changes between 17 and 18 total stops, rather than just 1. The intent is to transition between the tapered bulk spill pattern and the uniform spill pattern by the time the gas cap is reached. 3. This is the spill level (21 total stops or 40.0 kcfs) where the spill pattern reaches a nominal uniform spill pattern, with 5 stops retained in Bay 2 to simulate an RSW. This assumes the gas cap will be reached at about 40 kcfs spill discharge. If the actual gas cap is less than 40 kcfs spill, use the spill pattern in this table for the actual gas cap spill discharge, with a larger powerhouse discharge, rather than defaulting to a uniform spill pattern. This will result is less than 30% spill, but is deemed more desirable than disrupting the spill pattern. 4. This the approximate powerhouse discharge (110 kcfs) at which full powerhouse capacity is reached, with 6 turbine units operating within 1% peak efficiency rules. This is the maximum river discharge for which 30% spill can be maintained; above this will be a higher % spill. 5. Discharge estimates shown in this table are based on a forebay elevation of 634.0 ft. 6. Once the spill pattern starts transitioning to a uniform spill pattern for gas cap purposes, Bays 1 and 8 are not operated because there are no spillway deflectors in those bays. 7. Powerhouse unit priority should be 1 - 6. If more than one unit is operating, maximize discharge through the southernmost units, starting with Unit 1, to the extent possible without violating 1% peak efficiency rules. e.g. If powerhouse discharge is 26.0 kcfs, operate Unit 1 at 14.7 kcfs and Unit 2 at 11.3 kcfs, rather than both at 13.0 kcfs.
ESP 75th PrecentileESP 25th PercentileObserved FlowsESP Daily Mean
Whiskers: ESP Daily Max/Min
ESP Flows updated 21-Mar 2007
Summary of 21 March 2007 ESP Libby Operations 27-Mar-07
Assumptions:*
*
*
*
* No double peaking after the sturgeon pulse was allowed unless needed to avoid filling and spilling. Starting after the Sturgeon pulse a flat flow was targeted to reach elevation 2439.0 feet by the end of August.
The start of VARQ for each year is based on the unregulated flow at TDA for that year. Start date of VARQ varies for each year.
Sturgeon pulse begins on 15 May for all years. Volume of pulse is based on each years April - August volume. Sturgeon pulse runs 14 days at full powerhouse (26 kcfs) and the remaining volume, if any, is exhausted at 20 kcfs (unless VARQ flows are higher).
Project will operate to meet end of March Flood Control based on March Final Volume forecast (2395.5 feet). After that time, project will operate to the 15 April Flood Control target based on the individual years April - August Volume.
VARQ flows continue through the end of June as a minimum.
Spring / Summer Update to the 2007 Water Management Plan
Draft March 2007
i
TABLE OF CONTENTS 1. Introduction................................................................................................................. 2 2. Role of Water Supply Forecasts (WSF).......................................................................... 3 3. Flow Objectives .............................................................................................................. 3
4. Storage Project Operations ............................................................................................. 4 Libby Dam .................................................................................................................... 4 Sturgeon Pulse .............................................................................................................. 4 Hungry Horse Dam....................................................................................................... 5 Water Supply Forecast and Minimum Flows ............................................................... 5 Grand Coulee Dam ....................................................................................................... 5
5. Upper Snake River Flow Augmentation......................................................................... 6 6. Flood Control Operations ............................................................................................... 7
Dworshak/Grand Coulee flood control shift................................................................. 7 7. Minimum Operating Pool ............................................................................................... 7 8. Hanford Reach ................................................................................................................ 8 9. Spill for Juvenile Fish Passage ....................................................................................... 8 10. Operation Considerations.............................................................................................. 8 11. Water Quality - Spill Priority List ................................................................................ 8
Other Spill Operations .................................................................................................. 9 12. 2007 Fish Passage Research ........................................................................................ 9
Lower Granite ............................................................................................................. 10 Little Goose................................................................................................................. 10 Lower Monumental..................................................................................................... 10 Ice Harbor Dam........................................................................................................... 10 McNary Dam .............................................................................................................. 10 John Day Dam............................................................................................................. 11 The Dalles Dam .......................................................................................................... 11 Bonneville Dam .......................................................................................................... 11
14. Latest Flow Augmentation Graphs for ........................Error! Bookmark not defined. Libby and Hungry Horse .............................................Error! Bookmark not defined. Libby ............................................................................Error! Bookmark not defined. Hungry Horse.............................................................................................................. 13
Draft Spring / Summer Update to the 2007 Water Management Plan
1. Introduction The 2007 Spring/Summer update to the Water Management Plan (WMP) updates information on how the Action Agencies plan to operate the Federal Columbia River Power System (FCRPS) reservoirs during the spring and summer seasons. The Spring/Summer WMP Update (S/S Update) is needed because water supply forecasts for the spring and summer time period are not available at the time the water management plan is written. Planned operations in the S/S Update are based on the most current water supply forecast which is considered to be the best available forecast of the expected runoff water volume, and thus how the FCRPS will be operated in 2007. The “April Final” water supply forecast is the most current forecast available when the final version of the S/S Update is completed. The S/S Update also reports 2007 research operations planned for the FCRPS projects. Research studies are routinely conducted to test the performance of current or new fish passage operations and the effects on a wide range of conditions, including spill survival, tailrace egress, transport benefits and the performance of new passage devices like the Bonneville second powerhouse corner collector. The Studies Review Work Group establishes the research study plan in the spring just prior to the commencement of the spring migration. The S/S Update summarizes the project operations that support these research activities. The S/S Update does not repeat all of the information in the WMP but does provide additional detail and specifies operations based on the current water supply forecast or changes that need to be made in operations because of the availability of current water supply forecasts, flow projections, and other new information.
3
2. Role of Water Supply Forecasts (WSF) There are four forecast points that are used to determine BiOp operation of the FCRPS reservoirs. The latest forecasts (March Final) are given below. Forecast Point Forecast Period Forecast Date Value (MAF) Lower Granite April – July March Final 17.3 Lower Granite April – July April Final B
The Dalles April – August March Final 88.3 The Dalles April – August April Final A
Hungry Horse April _ August March Final 2.01 B Hungry Horse April – August April Final Libby April - August March Final 6.52 Libby April – August April Final Libby April - August May CD
All forecasts are from the National Weather Service unless otherwise indicated: A – Value that is used to set operations for spring flow objectives B – USBR Forecast C – COE Forecast D – Value that is used to set operations for Libby sturgeon pulse
3. Seasonal Flow Objectives Spring The spring seasonal flow objectives for Lower Granite and McNary are established by the April final water supply forecast. The Priest Rapids spring seasonal flow objective is fixed (not dependent on the water supply forecast). Based on the April final forecast the spring flow objectives are shown below.
Summer The summer seasonal flow objective for Lower Granite Dam is based on the June final water supply forecast. Based on the latest water supply forecast (April Final) the summer seasonal flow objectives are shown below. The McNary summer seasonal flow objective is always 200 kcfs and is not dependent on the water supply forecast.
Prospects for Meeting Flow Objectives An analysis of the likelihood of meeting the flow objectives was conducted by using the Northwest River Forecast Center Ensemble Streamflow Prediction (ESP) inflows in the Corps Hydro System Seasonal Regulation Program (HYSSR) model. This model uses the current basin conditions combined with 44 historical weather patterns (temperature and precipitation) to produce 44 ESP hydrographs for 2007. The likelihood of meeting the flow objectives and refilling the reservoirs by the targeted dates is a function of both the runoff volume and the time frame in which the snowmelt and stream flows occur. The likelihood of meeting the 2007 spring/summer flow objectives, based on XXXX, 2007 ESP inflows, are shown in Section XXX of this document.
4. Storage Project Operations See Section XXX, XXX and XXX for latest ESP HYSSR model runs, volume charts for Libby, Dworshak and Hungry Horse and latest Dworshak ESP graphs. Libby Dam
Sturgeon Pulse A preliminary estimate of sturgeon pulse volume based on the March final WSF of 6.516 MAF for Libby (April – August) puts Libby operations in the 3rd tier of operations for sturgeon called for in the USFWS 2007 Biological Opinion. The 3rd tier sturgeon operation calls for a sturgeon pulse volume of 1.15 MAF. An SOR with specific flow and date recommendations is expected to be submitted to TMT prior to initiating a flow operation for sturgeon.
Bull trout flows A preliminary estimate of minimum bull trout flows based on the March final WSF is 8 kcfs. The project will also initiate bull trout flows of at least 6 kcfs on May 15 per the USFWS 2007 BiOp,
5
Hungry Horse Dam
Water Supply Forecast and Minimum Flows The March final Bureau of Reclamation WSF for April – August was 2016 kaf, 97 percent of normal. Minimum flow requirements from Hungry Horse and Columbia Falls from March through December are based on the March final forecast. This year the minimum flow requirements were set at 900 cfs and 3500 cfs, respectively. Hungry Horse April 10 and June 30 Refill Objectives The Bureau of Reclamation computes Hungry Horse’s April 10 elevation objective by linear interpolation between the March 31 and April 15 forecasted flood control elevations based on the March final water supply forecast (wsf). Based on the March final (wsf), the April 10 objective was elevation XXXX feet. The project was at elevation XXXX on April 10. Hungry Horse Dam is expected to refill XXXXX Grand Coulee Dam
Grand Coulee April 10 and June 30 refill Objective The Bureau of Reclamation computes Grand Coulee’s April 10 elevation objective by linear interpolation between the March 31 and April 15 forecasted flood control elevations based on the March final water supply forecast (wsf). Based on the March final (wsf) and the corresponding shifted flood control elevations the April 10 objective was elevation XXXX feet. The project was at elevation 1XXXX feet on April 10. Grand Coulee is expected to refill to 1290 feet XXXX
Grand Coulee Summer Draft Limit The Grand Coulee summer draft limit is set by the magnitude of the July final April – August wsf at The Dalles Dam. Based on the April Final forecast at The Dalles, the summer draft limit for Grand Coulee is expected to be XXXX feet. Dworshak Dam
Summer Draft for Temperature Control and Flow Augmentation A key operation at Dworshak Dam is to draft cold water from the Dworshak reservoir in July, August, and September to cool water temperatures and provide flow augmentation in the Lower Snake River for the benefit of migrating salmon and steelhead. In-season modeling will be done to provide information to aid in the making the decisions of when and how to draft Dworshak. The summer reservoir draft limit is 1,520 feet. This limit determines the maximum draft available for summer flow augmentation from Dworshak. The Action Agencies will draft Dworshak to 1520 feet in September. The extension of the draft limit from August 31 into September reflects requirements for about 200 kaf to be held for release by the Nez Perce Tribe as defined per the Snake River Basin Adjudication.
6
5. Upper Snake River Flow Augmentation The Bureau of Reclamation currently estimates that the XXXX kaf of Upper Snake River flow augmentation will be provided in 2007.
7
6. Flood Control Operations The March and 15 and 30 April flood control elevations based on the March final forecast are shown in the following table. The 31 January – 28 February flood control elevations were based on previous forecasts. Project 31-Jan 28-Feb 15-Mar 31-Mar 15-Apr 30-Apr ARDB 1430.5 1422.9 1414.1 1414.1 1414.1 LIB 2393.7 2396.0 2395.5 2395.5 2395.5 2395.5 DCDB 1839.3 1812.5 A 1807.7 1807.7 1807.7 HGH 3543.8 3531.7 3526.2 3525.0 3521.3 GCL 1290.0 1290.0 1273.5 1256.2 1239.8 GCL-shifted -- -- 1272.5 1252.5 BRN 2077.0 2057.9 2060.3B. 2060.6 2061.6 BRN-shifted -- -- 2077.0 2077.0 DWR 1532.3 1551.3 1555.4 1555.5 1555.5 DWR-shifted -- -- 1560.3 1571.6 Dworshak/Grand Coulee flood control shift The Grand Coulee shift is based only on the Dworshak shift with no shift from Brownlee as Idaho Power Company (Brownlee owner) did not request shift.
7. Minimum Operating Pool The minimum operating pool (MOP) operation for the Lower Snake projects planning date is 3 April. It was agreed at the XX 2007 TMT meeting that lower Snake River reservoir levels would be transitioned to a MOP operation by XXXXXXXXXXX. The table below describes the reservoir elevation ranges under MOP operations in 2007. Elevation ranges will adjusted if needed to meet authorized project purposes including navigation. Below the table is a description of how the lower Snake River elevation levels were adjusted to reach MOP operational levels. Lower Range Upper Range Project Operation Elevation Operation Elevation Ice Harbor MOP 437 MOP + 1 438 Lower Monumental
MOP 537 MOP + 1 538
Little Goose MOP 633 MOP + 1 634 Lower Granite MOP 733 MOP + 1 734 IHR XX, APRIL XX – XX FEET (MOP TO MOP+1) LMN XX, APRIL XX XX-5XX FEET (MOP TO MOP+1)
8
LGS XX, APRIL 6 633-634 FEET (MOP TO MOP+1) LWG XX, APRIL XX 733-734 FEET (MOP TO MOP+1) At John Day, the forebay is being operated within a 1.5-foot range of the minimum level that provides irrigation pumping from 10 April to 30 September. The initial range is 262.5 and 264.0 feet. The minimum level will be adjusted upward if needed to facilitate irrigation pumping. Actual John Day operations 262.5’ – 264’ range started 10 April 2007.
8. Hanford Reach The Vernita Bar protection level flow was set at a level of 70 kcfs based on the 19 and 26 November 2006 redd count. This year’s Vernita Bar protection operation is scheduled to end when the water over the eggs have accumulated 1000 (C degrees) thermal units after the initiation of spawning. This is expected to occur about 1April. See Appendix C for the Hanford Reach Agreement.
9. Spill for Juvenile Fish Passage Implementation of the Spill for Juvenile Fish Passage is described in the 2007 Fish Operations Plan. This plan was finalized and submitted to the court XXXX 2007. This plan is an attachment to the Water Management Plan.
10. Operation Considerations
11. Water Quality - Spill Priority List
River operations are conducted to meet State Clean Water Act total maximum daily load (TMDL) dissolved gas standards. Also, research operations at a particular dam can be impacted by involuntary spill. Thus spill at research projects is given lower priority in the hope that involuntary spill can be eliminated during research. The initial spill priority list for the fish spill season was issued 3 April as shown below. Involuntary spill will occur in the order shown. The priorities will be modified as needed based on status of fish migration, spill/transport strategies, and studies, and other factors.
1. Lower Granite 2. Little Goose 3. Lower Monumental 4. Bonneville 5. John Day
9
6. The Dalles 7. Wanapum 8. Wells 9. Rocky Reach 10. Rock Island 11. Priest Rapids 12. McNary 13. Ice Harbor 14. Grand Coulee 15. Chief Joseph
Other Spill Operations Until construction of the spill deflectors at Chief Joseph Dam has been completed, spill swapping between Chief Joseph Dam and Grand Coulee Dam will not be implemented if the spill deflector contractor is working downstream of Chief Joseph Dam. Construction of the deflectors is expected to take three years.
12. 2007 Fish Passage Research Summaries of 2007 fish passage research studies that have the potential to change project operation are described below.
10
Lower Granite A spring RSW study is planned to examine its efficiency and effectiveness and fish behavior in the vicinity of the RSW and the Behavioral Guidance Structure (BGS) which has been relocated. Normal spring spill patterns as described in the FPP with Behavioral Guidance Structure (BGS) IN place and BGS OUT as two treatments. The RSW testing will take place between mid-April and late May. During the study, spill will consist of flow thru the RSW and some training spill for a total spill of approximately 20 kcfs. The evaluation involves periodic removal of the BGS, which would likely result in short-term (1-3 hours) outages of Units 6. A summer test of the RSW and BGS may also take place sometime between mid-June and late July and will most likely run for 3 to 4 weeks. There will be two treatments for the summer test. Both treatments will use the RSW plus two different patterns of training spill. Both treatments will spill approximately 18 kcfs. The BGS will be in the OUT (stored) position during the summer test.
Little Goose A spring study between 15 April and 30 May will examine route specific survival estimates, approach paths, passage distribution, forebay residence time, and tailrace egress. Spill during this time will be 30 percent of total outflow 24 hours/day, however, two spill patterns will be alternated. A similar study will be performed during the summer between 30 June and 31 July. The spill patterns to be used are under development with SRWG and FFDRWG.
Lower Monumental A spring bulk spill study will occur between 25 April and 30 May. Two spill patterns will be used depending on total river flow. A bulk spill pattern will be evaluated at river flows less than 120kcfs simulating an RSW operation. For river flow in excess of 120 kcfs, a uniform spill pattern will be used.
Ice Harbor Dam Spring and summer RSW testing are planned. Testing will occur between 1 May and 19 July. The testing will involve alternating between 30 percent spill for 24 hours/day and spilling 45 kcfs during the day and to the spill cap at night.
McNary Dam A spring spill study will occur between 26 April and 8 June to examine passage, survival rates, and behavior under two treatments of project operations. Spill will alternate between 40 percent spill for 24 hours/day and 0 kcfs daytime spill/spill cap nighttime spill. The specific details of the study have not yet been established.
11
A summer spill study is tentatively scheduled to occur between 20 June and 22 July to examine passage, survival rates, and behavior under two treatments of project operations. Spill will alternate between 40 percent spill for 24 hours/day and 60 percent spill for 24 hours per day. The spill will be alternated in two day blocks which will be randomized during testing.
John Day Dam None.
The Dalles Dam None.
Bonneville Dam None.
12
13
Hungry Horse Volumes at Hungry Horse1 April Through 30 June
370 kaf
107 kaf
942 kaf
1989 kaf
569 kaf
1841 kaf
422 kaf
1796 kaf
377 kaf
0
400
800
1200
1600
2000
Apr - JunWSF Vol
Inflow VolTo Date
Min Flow Vol(0.9 kcfs)
Vol To Fill to 3560 feetby Jun 30
Vol
ume
(thou
sand
acr
e-fe
et)
30 % Conf
50% Conf
70% Conf
Assumes a forecasted starting Elevation = 3516.2 ft on May 1, 2006.
Calculations based on April Final forecast by the Bureau of Reclamation.
50% fcst is 2081 kaf for Apr-July, or 104 % of average.
AugmentationVolume
14
15. Latest DWR ESP Graphs (week of April 30) ESP Inflow
15
ESP Inflow – Exceedance
16
ESP Augmentation Volumes
17
COLUMBIA RIVER REGIONAL FORUM TECHNICAL MANAGEMENT TEAM
March 28, 2007 Meeting
FACILITATOR’S SUMMARY NOTES ON FUTURE ACTIONS Facilitator: Robin Harkless
Notes: Erin Halton The following notes are a summary of issues that are intended to point out future actions or issues that may need further discussion at upcoming meetings. These notes are not intended to be the “record” of the meeting, only a reminder for TMT members. Changes to the 3.14.07 TMT Meeting Minutes Kyle Dittmer, CRITFC, noted a mis-spelling of Brian Marotz’s last name, at the bottom of the last page of the official meeting minutes. Action: Jim Adams, COE, said he would correct the spelling in the posted version of the notes. Priest Rapids Operations Update Russell Langshaw, Grant County PUD, updated TMT on Priest Rapids operations. The information was linked to the TMT agenda. He reported that there had not been a drop below the 70 kcfs critical elevation, and that the temperature units were at 955, signifying that the start of emergence and ‘rearing’ flow bands will occur sometime between April 2-4th. Snake River/McNary Unit Outages and Items Unit Outages: Don Faulkner, COE, reported on fire protection outages on Snake River projects and Faulkner clarified that there would be only one outage per project at a time during the spring season, that there would be addition al outages later in the summer and that the outage at Little Goose is scheduled for April. Faulkner said that he was working on including the outages in the Fish Passage Plan. Lower Monumental RSW: Bernard Klatte, COE, said that the Lower Monumental RSW would not be installed this year, however as discussed at the SCT March meeting, the completion of the bracket installation was a high priority. FPOM also agreed that this work should be completed as soon as possible. COE requested spill bays 5-8 and unit 6 tagged out of service from March 30th – April 13th to install brackets at the projects. Unit 5 will be tagged out of service during the daytime and available at night after work is completed for the day. Klatte noted that this is the safest operation possible. Klatte asked for concurrence from TMT members present at the meeting: NOAA, USFWS, BOR, BPA, ID, CRITFC all approved. McNary Spill Outages: Klatte said that there would be a dive in the McNary forebay and stilling basin in preparation for TSW installation at spill bay 22. This work, followed by balloon tag tests, is scheduled for before the spill season.
1
Little Goose Outages: Don also referred TMT members to a picture of damaged mounts from the upstream gate at Little Goose, posted to the TMT website. Contract work to fix the problem, requiring a unit outage, is scheduled to be completed by end of April and before transport season begins. MOP Operations: Cathy Hlebechuk, COE, said that all 4 projects would be operating under MOP/MOP+1 by April 3rd, subject to navigational issues. Tony Norris added that BPA would do its best to operate from the ‘top down’, and stagger the start of MOP while also balancing higher flows and seasonal maintenance work. The COE complimented the good job BPA has done in balancing all the various operations. Spring Spill/Transport OperationsRudd Turner, COE, presented the draft Fish Operations Plan, posted on the TMT website. Turner described the document as a ‘heads up’ on how the COE plans to implement the "Agreement Regarding 2007 FCRPS Fish Operations", signed by the four Columbia River Tribes, the Colville Tribe and BPA, to manage spill/transport. Although not court ordered this year, he said the Fish Operations Plan was similar to the COE's 2006 Fish Passage Plan in response to last year's court order, which detailed conditions and descriptions of implementation. Turner said the document would likely be finalized by the end of the week, and Bernard Klatte, COE, said that he would be folding the FOP into the spring/summer update to the Water Management Plan. Turner said that Table 3 in the document is new, showing spill way operations. The plan provides explanations of variations in minimum generation possibilities. The document also includes description of spill levels for each project and changes and impacts for research projects and transportation program operations. Turner said that transport criteria for start dates and trigger days will be provided to TMT in the next couple of weeks – Paul Ocker is the COE contact. Turner noted the included reference to emergency protocol language in the FOP, and he added that reporting will be provided similar to last year, with COE RCC in the lead. Page 24 of the document includes links to the COE’s website, where more information on spill, flow and water quality data can be found. Jim Adams, COE, suggested that graphs of spill patterns for Bonneville in the FOP could be added to the Fish Passage Plan, for better streamlining. Turner said that the ‘research driven’ sections of the document include the following possible modifications for Bonneville summer operations:
• the 75 kcfs per day spill in the Agreement may move up to 80-83 kcfs, • potentially reducing the night spill caps, • the summer start date at Bonneville might be moved to the 21st of June.
Turner added that the document includes a provision for the Salmon Managers to call on dates for nighttime spill to the cap at Little Goose, for 14 nights between April 22nd- May 15th. BPA added their preference to give at least 2 days notice for this operation. Paul Wagner, NOAA, said that transport, starting between April 20th – May 1, will likely be recommended to start closer to May 1. Russ Kiefer, ID, suggested that if flows are less than 70 kcfs and we initiate Lower Granite transportation on April 20th, we should still stagger the dates for starting transportation from Little Goose and Lower Monumental
2
dams. The studies that show earlier migrating fish do better when bypassed at Lower Granite, also show lower SARS for fish bypassed at Lower Granite dam and then transported from a lower dam. TMT members also expressed the desire to have a better predictive tool than flow/temperature for determining when it is better to start transporting the collected fish, and support looking at ocean productivity shifts as the predictive tool. Action/Next Steps:
• Spill/transport at Little Goose and criteria for spill will be on the agenda for the 4/4 TMT meeting.
• Rudd Turner, COE, will add Bonneville spill graphs from the FOP as an appendix to the FPP – this will be posted to the TMT website, for TMT reference, by the week of 4/2. Turner will also share the ideas shared today at TMT with Paul Ocker.
• Bernard Klatte, COE, will add the FOP into the spring summer update to the Water Management Plan, as an appendix.
SOR #2007-4 Paul Wagner, speaking on behalf of the Salmon Managers, presented an SOR linked to the TMT website that requests conservative operation of Dworshak flows, in the interest of achieving elevation targets later in the year. Cathy Hlebechuk, COE, presented Dworshak ESP whiskers plot, inflows, and COE scenarios, also posted to the TMT website. She clarified that the whiskers plot does not capture the extreme event (i.e. Libby 2006), and that it was the most recent information available -updated as of 3/21. Hlebechuk noted that of the two scenarios, scenario 2 presented a more gradual, ‘stair-step’ operation through the end of June, and that the COE planned to operate within ‘reasonable risk’, with lower flows for the first half of April and in the interest of avoiding TDG exceedances of 110% during the spring run. Salmon Managers present at the meeting said that they preferred saving higher flows until later in the season, to the extent possible, and BPA said it would like to avoid excessive spill. TMT members present at the meeting: BOR, USFWS, ID, BPA and CRITFC did not object to the proposed operation at this point. Action /Next Steps: COE will operate Dworshak’s big unit at or near 4.5 kcfs outflows, beginning 4/2. Salmon Managers will discuss their preferences at the 4/3 FPAC meeting, and will share their recommendations at the 4/4 TMT meeting. Chum Emergence Report Rick Kruger, OR, referred TMT to the table and graph posted on the TMT website, showing 1999-2007 chum emergence dates and observed counts near Ives Island. Paul Wagner, NOAA, observed that the chum seem to be running ahead of predictions this year. Libby Operations
3
Paul Koski, COE, presented tools the COE has developed for operating Libby during the spring/summer season, posted on the TMT website. Calculations for VARQ start dates and sturgeon flows are included, as are tables showing average Libby flows, elevations, and mean/median volumes. Cathy Hlebechuk, COE, reminded TMT that this ESP tool does not capture the case of the extreme event. (A question was raised about the start of sturgeon pulse, which will be no sooner than May 15. The temperature target was changed from 9 degrees C to 8 degrees C this year, per discussions by the group looking at this year’ pulse) Koski also showed a whiskers plot and ESP hydrograph, which showed average and forecasted flows lined up. Estimated Seasonal Average Flows Estimated seasonal average flows were also posted to the TMT website: Lower Granite’s ESP spring mean is 85-86 kcfs, and the summer mean is 34 kcfs. Lower Granite spring STP is 84 kcfs, with a 90 kcfs estimated objective. McNary’s spring STP mean is 266 kcfs, with an estimated 248 kcfs objective. Action/Next Steps: Hlebechuk encouraged TMT members to let the COE know what would be helpful to add to the new products; Koski said that he planned to create a graph that also includes outflows, and Paul Wagner, NOAA, suggested the addition of Priest Rapids data. Regarding the format of the graphs, TMT members appreciated the display of ranges and suggested label points to help clarification. Updated forecasts will be on the agenda for the 4/4 TMT meeting, with the most recent data available. Water Management Plan Spring/Summer Update Bernard Klatte, COE, said that the draft spring summer update to the WMP was posted on the TMT website. Action: Klatte asked TMT members to submit their comments by 4/16, so that an inclusive update may be provided to IT at their 5/3 meeting. Operations Review Reservoirs – Grand Coulee was at 1271.6', and releasing to meet the end of March flood control elevation target of 1272.5' and the 4/10 target of 1259.2'. Hungry Horse was at 3535.7', releasing 5.2 kcfs to meet the end of March target of 3535.1' and 4/10 target of 3533.4'. Libby was at 2395.3', close to its end of March target elevation of 2395.5'. Dworshak was at 1560.3' and holding outflows at 10 kcfs until 4/2, when there will be a shift to 4.5 kcfs. Dworshak flows will be discussed by the Salmon Managers on 4/3 and by TMT at the 4/4 meeting. Dworshak flood controls are 1571.6' for 4/15 and 1555.5' for 4/30. Albeni Falls was at 2054.2' and spilling this week; Russ Kiefer and Idaho Regional Managers confirmed that exceeding a 2053' elevation is acceptable; the end of March/April target is 2056'. Ice Harbor outflows were at 65-70 kcfs, and Bonneville flows were at 250 kcfs. Fish – Paul Wagner, NOAA, referred TMT to the Fish Passage Center website; yearling Chinook and steelhead are both running early, and Bonneville is seeing steady passage. Bernard Klatte, COE, directed TMT to the ‘other fish related docs’ link from the TMT
4
homepage for weekly status reports on sea lion activity below Bonneville: preliminary observations are showing a reduction in stellars. Power – Tony Norris, BPA, reported that a downed CA line should be repaired soon, although it has had impacted Grand Coulee operations; the capacitor on the Franklin line out of Ice Harbor is also being repaired Water quality – Jim Adams, COE, reported TDG exceedances at Lower Granite, Ice Harbor, McNary, John Day, and Bonneville. Other – Dive surveys below corner collector at Bonneville removed old gauges, stilling basin, and concrete mattress – any relevant information from the dive surveys will be shared with TMT at an upcoming meeting or via email. Next Meeting, April 4th, 9am-noon Agenda items include: • Priest Rapids Update • Water Supply Forecasts – Updated STP Models • Little Goose Outages/Criteria for Spill • MOP Operations Report • Transport Operations for Research Studies • Dworshak Operations • WMP: Spring/Summer Update – Comments due by 4/16 • Lower River Spill Start • Operations Review
5
Columbia River Regional Forum Technical Management Team Meeting
March 28, 2007 1. Welcome and Introductions Today’s TMT meeting was chaired by Cathy Hlebechuk and facilitated by Robin Harkless, with representatives from COE, USFWS, BPA, NOAA-F, BOR, and Idaho and Oregon attending in person or by phone. The following is a summary (not a verbatim transcript) of the topics discussed and decisions made at the meeting. Anyone with questions or comments about these notes should provide them to the TMT chair or bring them to the next meeting. 2. Review of Meeting Minutes
COE will correct the spelling of Brian Marotz’s name on the March 14, 2007, official minutes. 3. Priest Rapids Update
It’s been an uneventful two weeks, Russell Langshaw (Grant County PUD) said. The reservoir didn’t drop below the critical level of 955 temperature units, which means emergence can be expected to start around April 2-4. That’s when Grant County PUD will begin its “flow bands” to aid emergence. 4. Snake River/McNary Outages and Issues
A. Fire Protection Unit Outages. There will be times multiple units are out for scheduled maintenance, Don Faulkner (COE) said. The plan is to work on one unit at a time at dams along the Snake River throughout spring and summer, then take multiple units out late in the summer for replacement of carbon dioxide gas fire-suppression equipment. That could mean as many as four units out at a time for up to four weeks when flows are low.
Russ Kiefer (Idaho) asked, are you doing this type of work at Lower
Granite during the spring season because there’s already one unit out there, or will you wait until summer? There won’t be any work at Lower Granite until July, then just one unit will be out of service, Faulkner said.
B. Lower Monumental RSW Construction Operations. This contract
will be suspended on April 13 without the RSW being installed this spring, Bern Klatte said. The contractor still has some finishing work to do, and brackets to install. The work will entail taking spill bays 5-8 out of service starting March 30 and ending no later than April 13. Main units 6 will be out of service at the same time as the spillway outage. Unit 5 will also be tagged out of service during the daytime and available for operation during the night.Spill bays 1-4 will be
6
available for spill. USFWS, NOAA, BOR, BPA, CRITIFC and Idaho representatives all agreed to this timetable for the unit outages.
C. Mc Nary TSW Update. Spill bay 22, which is closest to the
powerhouse, has been selected to receive TSW 1, based on spill patterns analyzed at ERDC, Bernard Klatte (COE) said. After the TSW is installed, workers will start the next round of balloon tag testing.
D. Little Goose Navigation Lock Outage. Don Faulkner (COE) showed
the TMT photographs of damaged brackets at the Little Goose locks. The damaged equipment is being repaired under an emergency contract. Work will probably be completed by end April.
E. MOP Operations Update. All four Snake projects will be at MOP (Minimum Operating Pool) beginning April 3rd subject to navigational issues, Cathy Hlebechuk said. The navigation issue normally surfaces in the summer when the flows drop and the 1 foot operating range may need to be elevated. For now, the plan is to start out with normal MOP operations. Hlebechuk asked what BPA’s intentions are at getting down to MOP. Tony Norris (BPA) noted that BPA had to use the pools to store water to accomplish the low tailwater requirement below BON. There were also issues installing the Franklin line capacitor issue, plus having to spill a lot of water. Nevertheless, BPA will do its best to have all Snake River projects operating to within MOP by April 3, and know the Salmon managers have an interest in staggering the draft from top to bottom but it does not seem likely this year. 5. Spring Spill and Transport Operations Rudd Turner (COE) gave an overview of the Fish Operations Plan, a COE document that focuses on spill and transport operations for the eight lower river dams this year. The FOP gives implementation details for parts of an agreement signed by BPA and five Tribes which was submitted to the court in January 2007. While COE did not sign the Agreement, General Martin signed a letter saying COE would implement Attachment 1 of the Agreement.
Attachment 1 of the Agreement outlines 2007 spill levels and describes transport strategies. The Fish Operations Plan was put together because all of this information was available in COE documents but dispersed among several documents, such as the Water Management Plan and the Fish Passage Plan. The Fish Operations Plan includes sections on spring and summer operations for each project, transportation operations, spillway operations, and minimum generation. It includes a specific discharge rate for spillway operations, a new procedure this year. Turner distinguished between the gas cap (currently 115% in the forebay, 120% in the tailrace) and the spill cap (the discharge level that is set for each project each day in order to stay within the gas cap). In the
7
transportation section, there is no provision to stop spill at the Snake collector projects in low flow years. The salmon managers, using the TMT process, will be able to call for nighttime spill to the spill cap at Little Goose this spring. The draft FOP also includes information on navigational safety, emergency protocols and reporting. There is a possibility that the Regional Forum will be asked to consider a proposal to increase Bonneville summer daytime spill from 75 kcfs as stipulated in the agreement to 81 or 83 kcfs, which could produce better spill patterns. There might be a nighttime spill level as well as daytime. Also, there’s a possibility of moving the start date for summer spill at Bonneville up from July 1 to June 21. The FOP also includes a provision for spilling to the gas cap for up to 14 nights any time from April 22 to May 15 at Little Goose, with dates to be determined by the salmon managers to coincide with migration peaks for wild spring/summer Chinook. This will be a new function for TMT this year.
BPA will need a couple days’ notice to coordinate spill requests on the Snake, Norris said. Two days’ notice for 14 days of spill would work for CRITFC, Kyle Dittmer said. Russ Kiefer (Idaho) agreed that transport should begin sooner in low flow years; however, start dates should be staggered rather than starting on the same day at all 3 projects. Wagner stated that the out-migration doesn’t start before about April 20, and a start date closer to May 1 would be preferred. This would allow more yearling Chinook to stay in-river while starting in time to transport most steelhead, which have a later passage peak than Chinook. Kiefer said that NOAA research results indicate that a start date closer to May 1 is better in terms of adult returns. The agreement says the salmon managers will call for it and utilize the TMT process. The TMT agreed to revisit this issue April 4 and possibly again on April 18 if necessary.
On a broader topic, “It helps to publish a schedule showing what dates
projects will be under various study regimes”, Paul Wagner (NOAA) said. The group discussed where would be the most logical place for that information. Publish any updates in documents that are open to revisions, such as the Water Management Plan, Scott Bettin (BPA) said. 6. Dworshak Operations – SOR#2007-04 Paul Wagner (NOAA) presented this SOR on behalf of some of the salmon managers. The intent of the SOR is similar to the one on Coulee operations: not getting too far ahead of the flow. The issue is the April 10 shifted flood control elevation at Dworshak. If the discharge level that was anticipated to meet the end of March flood control target is continued, it would likely result in not meeting the April 10 flood control elevation at that project.
8
Randy Wortman (COE) presented a whiskers plot containing 45 years (1949-1993) ESP data showing expectations in the range of flows, including averages and extremes computed separately for each year. A comparison to a hydrograph showing 45 years of data revealed close agreement between the ESP daily average and the STP hydrograph.
Kiefer asked, how much would the elevation in Dworshak increase per day with 5 kcfs/day being ponded? A little over half a foot since there is 15 or 16 kaf per foot, or 8 ksdf per foot, Cathy Hlebechuk (COE) said. She shared two charts showing possible operational scenarios for Dworshak. The volume in the first scenario was about the same as the March final forecast. Beginning with a shifted flood control elevation of 1,560.3 feet on March 31, it modeled minimum flow the first half of April to try to reach the shifted flood control elevation of 1571.8 feet and then released about 17 kcfs (over 110% TDG) for the last half of April to reach the end of April flood control elevation of 1555.4 feet. The second scenario, based on a lower water year (1951) (15 percent lower than the March final forecast), started at elevation 1,563 feet at end March, reduced to minimum flow the first half of April to get as close as possible to it’s shifted mid-April flood control elevation and increased outflows to about 6 kcfs to reach the end of April flood control elevation.
CRITFC’s concern is that we not overdraft the reservoir early, then miss
the April 10 target for fish flows, Kyle Dittmer said. We can’t go above the shifted flood control elevation of 1,560.3 feet because that’s the local flood control protection level, Hlebechuk said. She asked the salmon managers, do you want to try to reach the April 10 target elevation by going to lower flows the first half of April, or would you rather see higher flows at the end of April?
NOAA, USFWS, Idaho, CRITFC, BOR and BPA preferred lower flows for
the first half of April, reaching the April 10 target if possible, then higher flows for the last half of the month. They recommended a flow of 4 to 5 kcfs between April 2 and 4 when the next TMT meeting is to occur. They recommended higher than minimum flow to reduce the possibility of exceeding the gas cap later in the month and acknowledged the higher flow might impact the ability to reach April 10 flood control elevation. The COE will move forward with its plan to begin operating the big unit at Dworshak on April 1 at around 4.5 kcfs, Hlebechuk said. On April 3, the salmon managers will meet at FPAC to consider the possibility of making recommendations for the Action Agencies to consider regarding April operations, while keeping in mind the 110% gas cap and BPA’s and the Salmon Manager’s desire to avoid exceeding the 110% gas cap. 7. Chum Emergence
Rick Kruger (Oregon) presented a table and graph, both of which are linked to today’s agenda on the TMT website, and asked for questions (there were none). It appears the observed emergence is running ahead of predictions,
9
Wagner said. It’s possible there are lots more chum around, but we can’t catch them because tailwater elevations are higher that expected, Kruger said. 8. Libby Operations
Paul Koski (COE) presented an operations summary and ESP inflow graph. The main idea was to use ESP traces for all 45 years to create a tool that will calculate VARQ flows and the sturgeon pulse for each year independently. The table assumes a starting elevation of 2,395.5 feet on March 31, the flood control elevation based on the March final forecast.
The table shows VARQ flows starting April 19 on average, with an
average maximum elevation of 2,451 feet (8 feet from full) for all 45 years. The mean volume for ESP years is 7,327 kaf and the median volume is 7,215 kaf. In 5 of the 45 years, the reservoir refilled completely. The median elevation for the end of June was 2,441.2 feet. Koski emphasized that this table is just one example of what COE can do in terms of organizing information for the Regional Forum to use in its decision making process. 9. Estimated Seasonal Average Flows Koski presented a graph summing up spring and summer flows on the Snake River for all 45 years on record. For spring flows, the median was 85-86 kcfs, with a high of 120 kcfs and a low of 65 kcfs. For summer flows, the median was around 34 kcfs. Using the March final forecast, the Lower Granite spring discharge objective would be 90 kcfs, the summer objective 51.6 kcfs.
Hlebechuk said the spring flow objective for McNary, based on the March final forecast is 248 kcfs, and the average from this week’s STP is 248 kcfs. She also said the STP showed an average spring flow at Lower Granite of 84 kcfs. COE is experimenting with products for TMT, so ask for what you need, Hlebechuk said. Include the 135 kcfs objective for Priest Rapids flow in subsequent products, Wagner said. We can create these graphs weekly when we get new ESP data, Koski said. For every TMT meeting, we will be working with the previous week’s ESP data for that presentation, Wortman said. 10. Draft Water Management Plan Spring/Summer Update The draft WMP spring/summer update is posted for review and comments, Klatte said. COE will add to it, incorporating the Fish Operations Plan and spill patterns. The IT will receive the draft at its May 3 meeting. Klatte asked for comments from IT members and/or their TMT representatives. Comments will be posted to the TMT website for other TMT members to review. 11. Operations Review
10
Operations Review A. Reservoirs. Grand Coulee is at elevation 1,271.6 feet, operating for shifted flood control elevation and the April 10 target elevation of 1,259.2 feet, John Roache (BOR) said. The April 10 target discharge volume is 59.2 kcfs.
Hungry Horse is at 3,535.7 feet elevation, discharging about 5.2 kcfs and moving toward the shifted flood control elevation of 3,535.1 feet. Inflows are coming down, and BOR is starting to draft, Roache said. The April 10 flood control elevation target is 3533.4 feet.
Libby is at elevation 2,395 feet, with an end of March flood control elevation of 2,395.5 feet. The project is releasing 15 kcfs and trying to pass inflows, Hlebechuk said.
Dworshak is at elevation 1.560.3 feet, the end of March flood control
elevation, also trying to pass inflows. COE is planning to operate only the one big unit most efficiently as requested, and will wait for the next water supply forecast on April 2 or 3 and possibly the next TMT meeting on April 4 before making any operational changes. The April 15 flood control elevation is 1,571.5 feet, and spill may be required to meet the end of April flood control elevation is 1,555.5 feet – 16 feet below current elevation.
Ice Harbor is running about 65-70 kcfs of inflows. Bonneville has been
discharging around 250 kcfs. B. Fish. Movement this year on the Salmon River is earlier than typical,
Paul Wagner (NOAA) said. The same is true of the Imnaha and Grande Ronde rivers. The migration of subyearling spring Chinook has been trailing off at Bonneville Dam following the Spring Creek release. There has been lots of steelhead activity in the Lower Granite area, which usually happens later than Chinook migrations. It’s too early for any adult action.
Bernard Klatte (COE) will post weekly sea lion hazing reports to the TMT
homepage under the “Other Fish Related Documents” link. http://www.nwd-wc.usace.army.mil/tmt/documents/fish/2007/sea_lion_hazing.html The predation count so far this year is 217 salmon and steelhead and 353 sturgeon seen taken by the observers. While sea lions are spread out through the entire estuary, their diet is more varied downstream, and it’s in the Bonneville Dam area where they’re feeding more on listed species. The hazing reports will account for only sea lions in the Bonneville tailwater and ¼ mile downstream.
C. Power. Everything is looking good, except a powerline failure in California has affected BPA’s ability to lower the elevation at Grand Coulee and move generation out of the region, Tony Norris (BPA) said. Capacitor work on
11
the Franklin line is proceeding, and there are two units running at Ice Harbor now, so Franklin is not a problem.
D. Water Quality. Because most projects are spilling, we’re seeing
elevated gas levels over 110% in a number of tailwaters, including Lower Granite, Jim Adams (COE) said. Ice Harbor is pushing 114%, McNary is ranging around 110-113%, . Bonneville is around 111-112%, and John Day is under 110%, as is The Dalles. Albeni Falls is spilling 15-22 kcfs, but the TDG levels won’t be known until a gage is installed and operating. 9. Next TMT Meeting The next meeting is scheduled for April 4, 2007. Agenda items will include a Priest Rapids update, the new water supply forecast, updated STP models, the Little Goose outage, spring spill and transport operations, a MOP operations follow-up, the Dworshak water supply forecast, the draft WMP spring/summer update, setting criteria for 14 days of spill at Little Goose and Lower Granite, and the usual operations review. This meeting summary was prepared by Pat Vivian. Name Affiliation Tony Norris BPA Jim Adams COE Paul Wagner NMFS David Wills USFWS John Roache BOR Cathy Hlebechuk COE Kyle Dittmer CRITFC Dan Spear BPA Randy Wortman COE Shane Scott NWRP Holli Krebs Bear Energy Jennifer Miller Susquehanna Rudd Turner COE Scott Bettin BPA Sean Crandall Constellation John Oh Constellation Terry Weeks PNGC Power Phone: Russ Kiefer Idaho Russ Langshaw Grant Co. PUD Gary Hagerty Amcor Mark Fisher Constellation Energy John Poppy Snohomish PUD Russ George Water Management Consultants Chris Mallory Cascade Energy
12
Tom Le Evista Richelle Beck D. Rohr and Assoc. Mike Butchko Powerex Jeff Laufle COE Rick Kruger Oregon
13
T E C H N I C A L M A N A G E M E N T T E A MBOR : John Roache / Mary Mellema BPA : Robyn MacKay / Scott BettinNOAA-F: Paul Wagner USFWS : David Wills / Steve HaesekerOR : Rick Kruger / Ron Boyce ID : Russ KieferWA : Cindy LeFleur MT : Jim Litchfield
COE: Cathy Hlebechuk / Jim Adams
TMT MEETING Wednesday April 04, 2007 09:00 - 12:00
1125 N.W. Couch Street, Suite 4A34 Portland, Oregon 97209
Conference call line: 503-808-5190
To check into the building, take the elevator to the 5th floor and the guard will issue you an ID badge if you need one and will take you down to the 4th floor where the meeting is. If you have NOT attended a TMT meeting in
the past you will need to call ahead and let Cathy Hlebechuk (503) 808-3942 or Jim Adams (503) 808-3938 know, so you can be added to the TMT Visitor List and issued an ID badge. This badge may be used indefinitely. If you have attended TMT in the past you may re-use your ID badge indefinitely. If you are a federal employee you will
also need to have an ID badge issued to you which can be used indefinitely.
We have had disruptions on the phone because people are not hitting 'mute' after dial in.Please MUTE your Phone
All members are encouraged to call Robin Harkless with any issues or concerns they would like to see addressed.
Please e-mail her at [email protected] or call her at (503) 248-4703.
AGENDA
1. Introductions2. Review [Meeting Minutes] 3. Priest Rapids Update - Russell Langshaw, Grant County PUD4. Little Goose lock Outages - Don Faulkner, COE5. MOP Operations Report - [LWG-LGS-LMN-IHR] Jim Adams, COE6. Lower Snake Spill, April 03, 2007 - Bernard Klatte, COE7. LMN Spring Spill Pattern - Bernard Klatte, COE
i. [LoMo Bulk Spill 04/29/04] ii. [Results LMN spillway survival study]
8. Transport Operations for Research Studies - Paul Wagner, NOAA9. April 03, 2007 ESP Results - Cathy Hlebechuk, COE
i. [Lib ESP] ii. [Lib Volume]
iii. [DWR ESP] iv. [DWR Volume] v. [LIB Volume Forecast] vi. [DWR Inflow, ID (1)]
10. Dworshak Operations - [DWR ESP] Cathy Hlebechuk, COE11. WMP: Spring/Summer Update - Comments due by 4/16 - [Draft March 28, 2007] Bernard Klatte, COE12. Lower River Spill Start - Jim Adams, COE13. Operations Review
a. Reservoirs - [HGH ESP] [HGH Volume] b. Fishc. Power Systemd. Water Quality
14. OtherSet agenda for next meeting - April 18, 2007 [Calendar 2007]
Questions about the meeting may be referred to Cathy Hlebechuk at (503) 808-3942 or Jim Adams at (503) 808-3938
Results from LMN spillway survival study with the spring 2004 test spill pattern. The survival estimates from the 2004 research for hatchery yearling Chinook were 0.961 for spill; 0.881 for turbine; and 0.922 for the bypass.
COLUMBIA RIVER REGIONAL FORUM TECHNICAL MANAGEMENT TEAM
April 4, 2007 Meeting
FACILITATOR’S SUMMARY NOTES ON FUTURE ACTIONS Facilitator: Robin Harkless
Notes: Erin Halton The following notes are a summary of issues that are intended to point out future actions or issues that may need further discussion at upcoming meetings. These notes are not intended to be the “record” of the meeting, only a reminder for TMT members. TMT Meeting Minutes / 2007 Meeting Schedule Jim Adams, COE, reported that the revised versions of the facilitator’s summary and official meeting minutes had been posted to the TMT website the morning of 4/4. TMT members added that the dates identified on the 2007 meeting calendar needed to be corrected/updated.
Action: Jim Adams, COE, said he would correct the dates scheduled for meetings on the TMT website.
Priest Rapids Operations Update Russell Langshaw, Grant County PUD, updated TMT on Priest Rapids operations; he reported that there had not been a drop below the 70 kcfs critical elevation, that the temperature units were around 1000, and that protective flow bands began at 0001 hours on 4/4.
Action/Next Steps: Langshaw will post a summary with graphs and updates on flow bands before the 4/18 TMT meeting and will provide information on the flow protection operation at the meeting.
Little Goose Outages Don Faulkner, COE, reported that a lock outage for repair of the upstream gate should be done by the end of April / 1st of May. Starting April 4th, night time lockages using the floating bulkhead will be available. Multiple unit line outages will occur on April 11th – 12th. MOP Operations Report Jim Adams, COE, referred to a graph linked to the TMT agenda, showing spill and MOP operations initiation Little Goose, Lower Monumental, Lower Granite and Ice Harbor. Bernard Klatte, COE reported on temporary fluctuations of forebays at those projects, and said that levels were equalized by the afternoon of 4/3. Lower Monumental Spring SpillBernard Klatte, COE, presented on recommended spill patterns to allow for bracket work and a 4-hour spillway outage on 4/14, for installation of hydrophones at Lower Monumental. A table was linked to the TMT agenda following the meeting, showing this pattern, developed by the Walla Walla district and implemented in 2004. Klatte noted that the recommended pattern would be the most beneficial for hatchery yearling Chinook. TMT members present at the meeting did not object to this pattern.
1
Transport Operations for Research Studies Paul Wagner, NOAA, informed TMT of two minor variations to the transport dates (4/20 – 5/1) scheduled in the Fish Operations Plan: research studies require barge transport out of Lower Granite on 4/12 and 4/19. Wagner clarified that these dates are for additional research and said that he would summarize the schedule for tagging/transport in a table for TMT and FPAC reference.
Action/Next Steps: Wagner will discuss the schedule with TMT at the 4/18 meeting. April 3 ESP Results Cathy Hlebechuk, COE referred TMT to several graphs linked to the TMT agenda, showing the most recent data on flows and volumes predicted for Libby and Dworshak for the April-August periods. Randy Wortman, COE, clarified that the data shown was updated with the ‘April final forecast.’ Hlebechuk noted that the COE is working on long term risk analysis that will help capture the ‘extreme event’ and acknowledged that there is work to be done on improving these prediction models. John Roache, BOR, added that he expected the April final forecast for Hungry Horse to be between 84-86% of normal. Water Management Plan Spring/Summer Update Bernard Klatte, COE, said that the draft spring summer update to the WMP was posted on the TMT website. He added that he was still working on including research information to the update. USFWS, CRITFC and NOAA said they all plan to submit comments.
Action: Klatte asked TMT members to submit their comments by no later than 4/16, so that an inclusive update may be provided to IT at their 5/3 meeting.
Lower River Spill Start Jim Adams, COE, reported that spill on the Snake River began at 0001 hours on 4/3, and that two operations: spill on the Lower Columbia and “lowest elevation+ 1.5'” at John Day, would start at 0001 hours on 4/10. Cathy Hlebechuk, COE, and Rick Kruger, OR, gave TMT a ‘head’s up’ that there may be an SOR submitted again this year by towboaters for special operations at Lower Monumental and Lower Granite for navigation safety. Dworshak Operations Cathy Hlebechuk, COE, referred TMT to graphs linked to the TMT agenda that showed Dworshak operation scenarios: 1.78 maf, 1.98 maf, and 2.24 maf. She said that given Dworshak’s current forecast of 1.85 – 2.75 maf, the shifted flood control elevation for 4/15 is 1582.1', and the unshifted flood control elevation for 4/30 is 1572.6'. Greg Haller, Nez Perce Tribe, expressed concern for a potential drop in flows in June, and Hlebechuk agreed that depending on May and June flow rates and shape, outflows in May will likely be higher than June for refill.. Salmon Managers held a caucus to discuss their preferred operation for the next week, and recommended outflows of 2.5 kcfs with a check-in on 4/11 to look at inflows and elevations.
Action/Next Steps: • The COE will operate Dworshak at 2-2.5 kcfs (one small unit), per the Salmon
Mangers’ recommendation, with the caveat that spilling may be necessary to meet end of April target flood control elevations, and potentially exceed Idaho’s water quality standards.
2
• Russ Kiefer, ID, said that FPAC’s review of the information did not indicate this operation for a week posed a significant risk of having to spill to that level, but requested that if the COE saw conditions that indicated this may be an issue, to please coordinate with FPAC as soon as possible.
• TMT will discuss the current flows and forecasts during a conference call on 4/11. Operations Review Reservoirs – Grand Coulee was at 1264.1', and drafting to meet the interpolated 4/10 upper rule curve elevation target of 1259.2' Hungry Horse was at 3535.4', releasing 5.2 kcfs and preparing to adjust outflows, if necessary, once the April final forecasts are released. Libby was at 2395.5', with inflows of 11 kcfs. To emphasize the sensitivity around forecasts, Cathy Helebechuk, COE, noted that if 6.8 maf is forecasted for Libby, the end of April target elevation will be 2381.2', and if 7.0 maf is predicted, the target will be 2370.3'. Dworshak was at 1561.85, with outflows at 4.3 kcfs. Albeni Falls was operating between 2054' – 2055' and spilling to meet the 4/30 target elevation of 2056'. Priest Rapids was averaging between 133-230 kcfs, and Bonneville flows were at 290 kcfs. Fish – Paul Wagner, NOAA, referred TMT to the Fish Passage Center website and noted that passage numbers have increased overall. Lower Granite and Rock Island passage numbers reached into the 1,000 per day range. Bonneville is continuing seeing steady passage. Bernard Klatte, COE, reminded TMT of the ‘other fish related docs’ link from the TMT homepage for weekly status reports on sea lion activity below Bonneville. Power – Tony Norris, BPA, said that the higher flows out of Grand Coulee created lower temperatures and excursions from the 1% at McNary, John Day and Bonneville, and said that BPA was working hard to ensure that this does not happen again. Water quality – Jim Adams, COE, reported no TDG exceedances and said that spill caps on the Snake River would be set for below 120%, in anticipation of higher gas levels/spill. Adams said there had been some high TDG levels coming out of the mid-Columbia. Wanapum and Priest Rapids were spilling a high percentage of the river due to instrument installation in preparation for future research studies. Next Meeting will be a Conference Call on April 11th at 9am Agenda items include: • Start of Lower Columbia Spill • Dworshak Operations • April Final Forecasts / New Flood Control Elevations • WMP: Spring/Summer Update – Comments due by 4/16 • Operations Review
3
Columbia River Regional Forum Technical Management Team Meeting
April 4, 2007 1. Welcome and Introductions Today’s TMT meeting was chaired by Cathy Hlebechuk and facilitated by Robin Harkless, with representatives from COE, BOR, USFWS, BPA, Montana, Idaho, Oregon, NOAA-F, NWRP, and PNGC attending in person or by phone. The following is a summary (not a verbatim transcript) of the topics discussed and decisions made at the meeting. Anyone with questions or comments about these notes should provide them to the TMT chair or bring them to the next meeting. 2. Review of Meeting Minutes
Review of the 3-28-07 official minutes was postponed until the next meeting. 3. Priest Rapids Update
It’s been another uneventful week since the last report, Russell Langshaw (Grant County PUD) said. The reservoir didn’t drop below critical elevation, and temperature units were around 1,000. Last year’s summary pages for updates were very useful, Kyle Dittmer (CRITFC) said. Grant County PUD is planning to use the same report format as last year, with graphs and summaries. 4. Little Goose Outages
Don Faulkner, COE, reported that a lock outage for repair of the upstream gate should be done by the end of April / 1st of May. Starting April 4th night time lockages using the floating bulkhead will be available. Multiple unit line outages will occur on April 11th – 12th. 5. MOP Operations Report Jim Adams (COE) presented two graphs (which are linked to the agenda for today’s meeting on the TMT web page) showing progress toward achieving MOP elevations at Lower Granite and Little Goose. Lower Granite reached MOP on April 2, Little Goose reached MOP on April 1, and Lower Monumental reached MOP on April 2 prior to initiating spill April 3. 6. Lower Snake Spill – April 3, 2007 On Monday morning, April 2, the control room operator at Little Goose had to manually enter forebay elevations into the computer because a technician working on calibrating the automated GDACS system, Bernard Klatte (COE) said. Because this
4
was a departure from the normal automated operation and the operator was distracted from this task, the forebay elevation dropped below MOP of 633-634 feet elevation. BPA schedulers received incorrect information (received via computer) and managed the system accordingly. This created problems at all the other projects downstream of LGS resulting in fluctuating spill volumes to maintain MOP. At present, all projects are at MOP and spilling what they should be spilling. Dropping below MOP is a navigational issue, not a power generation or a flood control issue. 7. Lower Monumental Spill Pattern Bracket work for the RSW will be ending on April 13, and the schedule is proceeding as planned, Klatte said. In the process of doing this work, a cable snapped and equipment became stuck in bay 8, a problem that will take 40 to 60 days to fix. To compensate for the loss of bay 8, the COE Walla Walla district office devised a spill pattern that, while it departs from the Fish Passage Plan, was found in 2004 to produce good survival estimates for yearling Chinook – 96% for spill, 88% for turbine passage, and 92% for the bypass system. Klatte will post information on the new spill pattern as soon as he receives it from the Walla Walla district. Due to the start of spill on April 3, the Walla Walla COE district office was unable to install equipment in the forebay at Lower Monumental and has requested a four-hour spill outage on the morning of April 14, Klatte said. The purpose is to install hydrophones for research, assuming the contractor has finished the bracket work and removed its flotilla of barges on April 13. 8. Transport Operations for Research Studies The Fish Operations Plan sets a timeframe of April 20 through the end of May for transport to begin, as determined by TMT, Paul Wagner (NOAA) said. One aspect of transportation is research. A number of the studies that have received regional approval require transport to start earlier than April 20. The first is on April 12 at Lower Granite, then another on April 19. The goal is to make the transportation operations for research as efficient as possible by consolidating the tagging, collection and transportation of fish for several studies simultaneously. TMT members expressed interest in hearing an update on this at the April 18 meeting. Wagner is assembling a table that summarizes the dates of transport and studies involved, which he will send to TMT members prior to the discussion. He is also planning to present this information to FPAC. 9. April 3, 2007 ESP Results Cathy Hlebechuk (COE) presented Libby ESP hydrographs showing this week’s information, as of yesterday. The water supply forecast traces vary a lot, from over 80 kcfs to 4 kcfs of inflows for April-July. The second graph shows actual volumes for Libby
5
and Dworshak produced by the shapes in the first graph. The spread for the second graph is 5.9 - 9.6 maf for April-August.
These graphs are simulated forecasts for 2007, showing what is most likely to happen under current conditions, Hlebechuk said. Using this tool, COE made a preliminary water supply forecast for April-August this year of 6.795 maf, a simulation based on historical weather. That represents an increase over last month’s forecast of 6.516 maf, as quoted in the WMP spring/summer update.
Last year’s ESP analysis showed nothing like what actually happened, Hlebechuk said. There was a huge runoff in June, and then flows dropped, so it turned out to be an average year. Because ESP analysis can’t capture extreme events, COE has been working on risk analysis to address that potential.
For the first 10 days of April, the model uses the RFC forecast, so all 45 years
have the same forecast for the first 9 days and have identical values, Randy Wortman (COE) said. After that, historical averages are blended. This is when the current Weather Service models have the best information.
For Dworshak reservoir inflow in April-July of this year, the ESP model
comparing RFC and COE forecasts shows the two forecasts were closer this week than last week, with ESP averages showing a bit more volume. The second Libby volume forecast linked to today’s agenda gives the updated RFC forecast. The ESP and STP forecasts were in close agreement in the graph for Hungry Horse as well. BOR hasn’t finalized its forecast yet, but the official estimate will probably be lower than ESP volumes, around 84-86%, 10. Dworshak Operations RFC does ESP forecasting for Dworshak every week, with the first 10 days of the model based on the current forecast, Greg Haller (Nez Perce) said. After that point, 44 years of temperature and precipitation data are overlaid on initial show and soil conditions to create 44 different possible volumes for each week. For this week, the ESP variation of volumes was 1.85-2.75 maf (according to the fourth table, linked to topic #9 on today’s TMT agenda). The STP volume according to the 1982 final COE April forecast was 2.138 maf, and RFC’s early bird forecast was 2.23 maf. The third table attached to agenda item #9 shows ESP hydrographs for Dworshak, overlaying temperature and precipitation on snow. COE ran three different scenarios to reach the April 15 shifted flood control elevation of 2,182.1 feet, Hlebechuk said. The project is trying to reach the end of April unshifted elevation of 1,572.6 feet. The current April forecast is 1.98 maf, Hlebechuk said. After April 30, COE doesn’t have flood control targets but goes into refill mode. In this case, flows were higher in May, and COE didn’t want the reservoir to refill too soon, as it did under the third scenario yielding 2.24 maf, which released 4,300 cfs to reach
6
the target elevation. Under the 1.98 maf scenario, flows were also higher in May than in June. Also, snowmelt could be a factor, which in the past has been controversial. The April 15 shifted flood control elevation is 1,582.1 feet, and the unshifted end of April elevation is 1,572.6 feet, given current conditions. COE doesn’t interpolate April 10 elevations, Cindy Henriksen said. The previous week, the salmon managers had voiced a preference for more water during the last half of April, while avoiding the need to spill above the gas caps to get down to flood control elevations. The salmon managers caucused during a break from today’s meeting and agreed to a Dworshak operation of 2 - 2.5 kcfs outflows, using one of the smaller units, in an effort to provide greater flow volumes during increased fish migration at the end of April. They agreed to revisit this decision no later than a week from now, and earlier if there is any indication that the risk of spilling could exceed Idaho water quality standards. Hlebechuk emphasized that the COE will spill during the last half of April if needed to get to flood control elevations, even if that exceeds the gas caps. On the flip side, if inflows are low, Dworshak might not reach its desired April 10 elevation. 11. Water Management Plan Spring/Summer Update USFWS, CRITFC and NOAA all plan to comment on the draft WMP spring/summer update (posted at http://www.nwd-wc.usace.army.mil/tmt/documents/wmp/). No one has commented on it yet, Klatte said. The IT will receive the WMP draft at its May 3 meeting, after TMT members have had an opportunity to review and comment. Hlebechuk will email it to Jim Ruff (NPCC), who co-chairs the IT. The goal is to finalize the plan by May 9. 12. Start of Lower Columbia River Spill Spill started at 12:01 on April 3 on the Snake, Adams said. At 12:01 on April 10, spill will start on the Columbia, as per the Fish Operations Plan. The 75 kcfs of daytime spill planned for summer releases may increase to 83 - 85 kcfs. This is potential summer spill vetted outside this process, which will come back to TMT for further consideration.
There is a possibility COE will need to reduce or eliminate spill for navigation purposes at John Day, Hlebechuk said. This issue has been dealt with via SORs for other projects, but John Day has consistently been a problem, so this year it was coordinated in the FPP. Rick Kruger gave TMT a heads-up that ERDC tugboats have been at The Dalles, Lower Monumental and McNary to deal with residual problems in spill patterns at navigation locks. Only the lowest level at Lower Monumental was a problem. A report or an SOR might come out of that investigation regarding the start of spill April 10 on the lower Columbia.
7
Coincidentally, irrigation operations +1.5 feet will start at John Day that same day, Hlebechuk said. The elevation is 62.5 – 64 feet, sometimes called MIP. The group agreed to check in on the start of Lower Columbia spill operations at the next TMT meeting. If we have a gusher at the end of April, all the careful planning TMT has done might not make a difference, Hlebechuk said. 13. Operations Review A. Reservoirs. Grand Coulee is at elevation 1,264.1 feet, dropping to the April 10 target elevation of 1,259.2 feet, John Roache (BOR) said. Reclamation interpolates between March 31 and April 15 elevations to get the April 10 target, based on the March final forecast. It has been difficult drafting enough from Grand Coulee to keep up with inflows.
Hungry Horse is at elevation 3,535.4 feet, discharging about 5.2 kcfs. BOR is waiting for the April final forecast and will adjust the discharge volume at that time.
Libby is at elevation 2,395.5 feet, with inflows of 11 kcfs. COE is trying to pass inflows because the March final forecast and April 30 target elevations are the same. That will change when the new forecast becomes available. If the forecast is 6.8 maf for April-August, the target elevation will be 2,381.2 feet, to be achieved as soon as possible. To demonstrate the sensitivity of forecasts to even slight variations in inflows, a forecast of 7 maf would yield a target elevation of 2,370.3 feet, or 11 feet lower, Hlebechuk said.
The TMT discussed the role of the International Joint Commission in predicting
flows from Canada. The first or second week of April is usually when a freshet is declared if it will be, Russ Kiefer (Idaho) said. TMT members expressed concern that runoff is occurring earlier than usual this year, and the Northwest could see a rapid change in flows if the April-August forecast is 6.8 maf or higher. Hlebechuk will email the IJC agreement with Canada to TMT members.
There was a typo in the sturgeon volume for Libby which was corrected in a
second email to TMT members, Haller said. COE operates to very strict rules regarding VARQ flows, bull trout flows starting May 1, and the sturgeon pulse when it is requested, Hlebechuk said. Because COE operates to General Martin’s determination and findings, there is no need for a presentation on this subject at TMT, Hlebechuk and Haller agreed.
Dworshak is at elevation 1.561.85 feet, with 8.3 kcfs inflows and 4.3 kcfs
outflows. The reservoir increased 4 feet in elevation on April 3. Lower Granite inflows are receding, currently in the 40-43 kcfs range. A
temperature change might cause an increase.
8
Ice Harbor is running about 65-70 kcfs of inflows. Bonneville has been discharging around 290 kcfs. Priest Rapids was at 133 – 230 kcfs daily average for the last five days. Albeni Falls filled above elevation 2,053 feet and has been spilling a lot of water.
Cranes at McNary and Lower Monumental. The crane at McNary is coming back
online, which means TSW#1 can be installed in bay 22 as recommended by ERDC, Bernard Klatte (COE) said. The installation will be followed by fish tests and balloon tag releases, with spill starting April 10. Hopefully, Lower Monumental will be able to spill according to the pattern outlined in the Fish Passage Plan, despite problems with bay 8.
B. Fish. Fish are still moving down through the tributaries, Paul Wagner (NOAA)
said. In the past few days, the numbers passing went from the hundreds to the thousands on the Imnaha. Lower Granite saw its first thousand-fish day of 2007. Bonneville is still in the hundreds for passage of steelhead yearlings. There is nothing yet to report regarding adult migration.
The weekly marine mammal report has been posted at http://www.nwd-
wc.usace.army.mil/tmt/documents/fish/2007/sea_lion_hazing.html, Klatte (COE) said. C404 has shown up again, a little bigger than he was last year, and the rascal has gotten into the Bonneville fishway – despite the sea lion exclusion device installed there.
C. Power. It has been difficult moving large volumes of water out of Grand Coulee, Tony Norris (BPA) said. BPA staff had a difficult weekend beginning with errors in scheduling releases on the lower river Sunday night in connection with MOP elevation problems on the lower Snake. Temperatures the following Monday and Tuesday were 6 degrees cooler than expected, which changed the BPA load forecast dramatically. As a result of all these factors, there were TDG exceedances on the lower river for about 3-5 hours on the morning of April 2.
D. Water Quality. COE has set spill caps to be below 120% in the tailwater
because TDG levels in forebays are expected to rise within a few days, Adams said. So COE is waiting for equilibrium to be established on the river. There have been no exceedances on the Snake. However, TDG levels below Wanapum peaked at 131.9% on April 1 and dropped to 123% by the next afternoon. TDG levels at Priest Rapids have been around 120% and around 116% in the Pasco area. COE is concerned about depth compensation for redds downriver. 9. Next TMT Meeting The next meeting is a conference call scheduled for April 1, 2007. Agenda items will include the start of spill on the Lower Columbia, final April forecast information, an update on transport operations for research, newly computed flood control elevations, and the usual operations review. This meeting summary was prepared by consultant Pat Vivian.
9
Name Affiliation Cathy Hlebechuk COE John Roache BOR David Wills USFWS Paul Wagner NMFS Jim Adams COE Tony Norris BPA Jim Litchfield Montana Russ George WMCI Dan Spear BPA Shane Scott NWRP Randy Wortman COE Nancy Stephan BPA Cara McCarthy BPA Julie Ammann COE Rudd Turner COE Bernard Klatte COE Don Faulkner COE Paul Wagner NOAA Rick Kruger Oregon Phone: Russ Kiefer Idaho Russell Langshaw Grant Co. PUD Ted Ibsen EWEB Kyle Dittmer CRITFC Barry Espenson Columbia Basin Bulletin Cindy Henriksen COE Rochelle Beck D. Rohr & Assoc. Tom Le Evista Mike Butchko Powerex John Wasach Bear Energy Tim Heizenrader Cascade Energy Margaret Filardo FPC Joe xxx PPM Energy Greg Haller Nez Perce Brian Marotz Montana
10
T E C H N I C A L M A N A G E M E N T T E A MBOR : John Roache / Mary Mellema BPA : Robyn MacKay / Tony NorrisNOAA-F: Paul Wagner / Richard Dominigue USFWS : David Wills / Steve HaesekerOR : Rick Kruger / Ron Boyce ID : Russ KieferWA : Cindy LeFleur MT : Jim Litchfield / Brian Marotz
COE: Cathy Hlebechuk / Jim Adams / Cindy Henriksen
TMT CONFERENCE CALL Wednesday April 11, 2007 09:00 - 12:00
1125 N.W. Couch Street, Suite 4A34 Portland, Oregon 97209
Conference call line: 503-808-5190
To check into the building, take the elevator to the 5th floor and the guard will issue you an ID badge if you need one and will take you down to the 4th floor where the meeting is. If you have NOT attended a TMT meeting in
the past you will need to call ahead and let Cathy Hlebechuk (503) 808-3942 or Jim Adams (503) 808-3938 know, so you can be added to the TMT Visitor List and issued an ID badge. This badge may be used indefinitely. If you have attended TMT in the past you may re-use your ID badge indefinitely. If you are a federal employee you will
also need to have an ID badge issued to you which can be used indefinitely.
We have had disruptions on the phone because people are not hitting 'mute' after dial in.Please MUTE your Phone
All members are encouraged to call Robin Harkless with any issues or concerns they would like to see addressed. Please e-mail her at [email protected] or call her at (503) 248-4703.
AGENDA
1. Welcome and Introductions2. Review [Meeting Minutes] 3. April Final Forecasts / New Flood Control Elevations
i. [Summary of Columbia River Flood Control Data] ii. [Water Supply Forecasts]
iii. Hungry Horse [Daily inflows] [Hydrograph] 5. Dworshak Operations [Operational Scenerios] [STP Operation] 6. WMP: Spring/Summer Update-Comments due by 4/167. Spill Operations Update8. Snake River
a. Unit outagesb. Research requests [Hydrophone placement at IHR 2007] [Hydrophone placement at LGO 2007]
c. Lower Monumental spill change for navigation safetyd. Little Goose Nav Lock outage
9. Operations Reviewa. Reservoirsb. Fishc. Power Systemd. Water Quality [Average percent TDG for 12 highest hours - April 2007]
10. OtherSet agenda for next meeting - April 18, 2007 [Calendar 2007]
Questions about the meeting may be referred to Cathy Hlebechuk at (503) 808-3942, Jim Adams at (503) 808-3938 or Cindy Henriksen at (503) 808-3945
March forecast Project Period Volume % (maf) Normal The Dalles * Apr – Aug 88.3 95 Lower Granite * Apr – Jul 17.3 77 Libby** Apr – Aug 6.5 103 Dworshak ** Apr – Jul 2.2 82 Grand Coulee * Jan – Jul 63.0 100 Hungry Horse*** Jan - Jul 2.1 97 *Prepared by National Weather Service **Prepared by Corps of Engineers *** Prepared by Bureau of Reclamation April forecast Project Period Volume % (maf) Normal The Dalles * Apr – Aug 85.2 92 Lower Granite * Apr – Jul 15.1 70 Libby** Apr – Aug 6.8 108 Dworshak ** Apr – Jul 2.0 74 Grand Coulee * Jan – Jul 63.0 100 Hungry Horse*** Jan - Jul 2.0 89 *Prepared by National Weather Service **Prepared by Corps of Engineers *** Prepared by Bureau of Reclamation
Dworshak ESP Inflows - Daily Box-Whiskers Plot
0
5000
10000
15000
20000
25000
30000
35000
40000
45000
1-Mar 1-Apr 1-May 1-Jun 1-Jul
2007
Dai
ly In
flow
in c
fs__
ESP 75th PrecentileESP 25th PercentileObserved FlowsESP Daily Mean
COLUMBIA RIVER REGIONAL FORUM TECHNICAL MANAGEMENT TEAM
April 11, 2007 CONFERENCE CALL
FACILITATOR’S SUMMARY NOTES ON FUTURE ACTIONS Facilitator: Robin Harkless
Notes: Erin Halton The following notes are a summary of issues that are intended to point out future actions or issues that may need further discussion at upcoming meetings. These notes are not intended to be the “record” of the meeting, only a reminder for TMT members. 4/4/07 TMT Meeting Minutes Jim Adams, COE, noted that the facilitator’s notes from the 4/4 TMT meeting had been posted, and that the official meeting minutes would be posted later this week. Russ Kiefer, ID, said that he planned to submit comments on the facilitator notes. April Final Forecasts Cathy Hlebechuk, COE referred TMT to several graphs linked to the TMT agenda, showing the most recent data on flows and volumes predicted for Libby and Dworshak for the April-August periods. Hlebechuk reported on forecasts and flood control elevations for the following projects: Dworshak – 1574.8', with a 4/15 shifted flood control elevation of 1572.6'; Libby – 2378.7' for both 4/15 and 4/30; Hungry Horse – 3548.4' for both 4/15 and 4/30; and Grand Coulee – 1266.7' is the shifted flood control elevation for 4/15 and 1249.4' for 4/30. Hlebechuk noted that the forecast for Libby had gone up and that Grand Coulee’s January-July forecast was listed incorrectly and should have been 65.9, or 105% of normal.
April 10 Inflow Forecasts Cathy Hlebechuk, COE, referred TMT to inflows whiskers plots and STP/ESP hydrographs for Libby, Dworshak and Hungry Horse, updated as of 4/10 and posted on the TMT website. She noted that the STP and ESP lines on the graphs were very close, indicating improved forecasting for the projects. Hlebechuk said that Dworshak inflows were between 11-13 kcfs; comparisons of COE and River Forecast Center’s Dworshak volumes showed a drop of 100 kaf from last week. Dworshak Operations Cathy Hlebechuk, COE, referred TMT to graphs linked to the TMT agenda that showed three Dworshak operation scenarios: 1.86 maf, 1.98 maf, and 2.24 maf. She said that the 1.98 maf scenario was closest to the current forecast. Paul Wagner, NOAA, said that the Salmon Managers had discussed Dworshak at their FPAC meeting and reported on their desire to operate with end of April elevation targets in mind and to refill “as smoothly as possible.” Those members present on the call: ID, NOAA, OR, MT, BOR, and BPA supported the COE operating as necessary for gradual refill while avoiding spill and potential TDG exceedances. CRITFC also supported this operation. Hlebechuk issued the following email following the call, summarizing the COE’s short-term operation plan:
1
“Current ESP, STP and short term models show needing to increase outflows to about 7.6 kcfs (the big unit and one small unit) tonight and increase to about 9 kcfs around the middle of the month. This operation would provide buffer space to protect against spill if inflows come in higher than forecasted. The RFC and the Corps continue to do short term forecast models daily and flow adjustments will be made as needed.” Next Steps: Dworshak Operations will be on the agenda for the 4/18 TMT meeting.
Water Management Plan Spring/Summer Update Robin Harkless, facilitator, reminded TMT members that the draft spring summer update to the WMP was posted on the TMT website. Bernard Klatte, COE, added that he would have research information included in the update by the end of the week.
Action: Klatte will update the plan by 4/13 and he asked TMT members to submit their comments by no later than 4/16, so that an inclusive update may be provided to IT at their 5/3 meeting.
Spring Spill Operations Update Jim Adams, COE, reported that spill on the Lower Columbia started at 0001 hours on 4/10, as scheduled. On the Snake River, Lower Granite was at 20kcfs, Little Goose was at 30+%, and Lower Monumental was spilling at the spill cap, 26.5 kcfs. Ice Harbor was at minimum generation and 45 kcfs; McNary was at 40% total flow; and John Day, with TDG levels of 119%, was spilling to the spill cap, 94.4 kcfs. The Dalles was at 40% total flow and Bonneville was spilling 100 kcfs. Snake River IssuesUnit Outages - Don Faulkner, COE, reported that Little Goose would have all units out for 6 hours, then 2 units available, then all units out again for 2-6 hours. Outages were scheduled through the afternoon of 4/12. Research Request: Little Goose – Ann Sutter, Walla Walla District COE, discussed requested shifts in spill patterns at Ice Harbor and Little Goose to allow for access to hydrophones at the projects over the next week. The COE proposed that a shift in spill occur concomitant with the outage at Little Goose on April 12. Spill would be shifted to bays 4-8 for up to four hours to allow access to two hydrophones in ‘A1’ and ‘A2’ (see graphics linked to the TMT agenda for visual detail). The COE proposed a flat spill pattern. On this matter, NOAA did not object; Oregon expressed general concern and frustration with all the structural work happening along the system but did not object to the proposed operation; Idaho echoed Oregon’s frustration and expressed appreciation for the COE’s efforts to combine the outage with the shifted spill to reduce adverse impacts to fish; Montana deferred to the other entities and did not object; BPA and the BOR did not object; CRITFC did not object to this operation; USFWS and Washington were not present on the call. In addition, the COE proposed a full spillway outage sometime between 4/13-15 for up to four hours, to access A3 and A4. CRITFC, Oregon, Idaho and NOAA all recommended,
2
as a principle, that any curtailment in spill at a project for maintenance and/or structural work (such as this proposal), be shifted if possible to a later time, to keep the fish passage system ‘whole.’ The COE responded that as a policy, the agency does not provide ‘make up’ spill but does make adjustments, particularly if a longer term spill issue occurs.
Action/Next Steps: The COE planned to discuss internally the possibility of shifting spill at Little Goose to later in the day/night for the duration that would be required to shut off the spillway for the proposed hydrophone maintenance. The COE planned to next discuss options with FPOM during a meeting on 4/12, and respond to TMT either via an email or a conference call on the morning of 4/13. TMT members present on the call agreed to this process. (NOTE: A conference call was convened at 0930 on 4/13.)
Ice Harbor – The COE also requested work on hydrophones at Ice Harbor, also requiring up to 4 hours of curtailed spill on 4/12 or 4/13. TMT members responded to this request: • NOAA: Given there are not as many fish at this project and not the same opportunity
for offsetting the curtailment of spill (given spill caps for adult passage), no objection to the proposed operation, and requested that it occur as soon as possible.
• Oregon: Agreed that the operation should occur ASAP. • Idaho: Shared recommendation to implement the operation ASAP. • MT: No objection to the operation. • BPA: No objection. • BOR: No objection. • CRITFC: Agreed with NOAA’s points and added that this is a higher research priority
for CRITFC, so supports the operation, sooner than later. Action/Next Steps: The COE will implement the proposed operation at Ice Harbor as soon as possible, sometime Thursday, April 12. A teletype will be issued for this operation.
Lower Monumental – RSW installation preparation work at the project began on 4/3 and was scheduled for completion on Friday, 4/13. Spill was limited to bays 1-4, and this caused navigation safety issues to towboaters. Safe passage of a barge required stopping spill briefly on Monday, 4/9. Barges were scheduled to be moved again on 4/11 and 4/12, requiring up to an hour of no spill on each day. Walla Walla District COE recommended that the 2004 spring spill test pattern be used to accommodate navigation safety and crane work at the project. TMT did not object to this pattern. The COE added that 2007 spill patterns would go into effect at the project on Monday, 4/16. Little Goose Outage – As follow up from the last TMT meeting, the COE reported that work at the project will be completed by the end of April. Transportation Operations A comment was made on NOAA’s planned transportation research on 4/12 and 4/19, that transportation is happening sooner than April 20, and that the fish will be held for a longer duration than the 48 hour period per criteria in the Fish Passage Plan. From
3
CRITFC’s perspective, this was not coordinated in a transparent way. Other TMT members added that for the future, research details that deviate from the Fish Passage Plan should be highlighted ahead of time and discussed by regional salmon managers.
Action/Next Steps: Paul Wagner agreed to take the concerns discussed today back to the NOAA researchers, and request that they meet the 48-hour holding criteria described in the Fish Passage Plan to the extent possible during the two research days this season, while also meeting the objectives of the research.
Operations Review Reservoirs – Grand Coulee was at 1259.6', and drafting to meet the 4/30 flood control elevation target of 1249.4' Hungry Horse was at 3534.71', releasing 5.2 kcfs, and preparing to shift outflows to 3 kcfs on 4/13 to meet the 4/30 target flood control elevation of 3548.4'. Libby was at 2395.48', with an end of April target elevation of 2378.7'; Cathy Hlebechuk noted the 17' elevation shift. Priest Rapids was at 158 kcfs, McNary was at 232 kcfs, Lower Granite was averaging between 40-50 kcfs and dropping. Fish – Paul Wagner, NOAA, said that passage numbers were fairly normal for this time of year, and that numbers should be increasing by 10,000 per day. He noted that adult passage is a little on the late side, and Bonneville had just begun seeing 100 fish per day. Power – nothing to report Water quality – Jim Adams, COE, referred to a graph linked to the TMT agenda, showing TDG exceedances at McNary and Ice Harbor. Next face-to-face TMT meeting: April 18th Agenda items will include: • Dworshak Operations • Updated ESP / STP • Transport Review • Procedure for Night Caps at Little Goose • Priest Rapids Update • Schedule for Start of Transport • Chum Emergence • Little Goose Navigation Lock Update • Ice Harbor Minimum Generation Operation • WMP Spring/Summer Update – Comments Review • Operations Review
4
Columbia River Regional Forum Technical Management Team Conference Call
April 11, 2007 1. Welcome and Introductions Today’s TMT meeting was chaired by Cathy Hlebechuk and facilitated by Robin Harkless, with representatives from COE, BOR, BPA, Idaho, Oregon, Montana, NOAA-F, and PNGC attending in person or by phone. The following is a summary (not a verbatim transcript) of the topics discussed and decisions made at the meeting. Any comments on these notes should be given to Cathy Hlebechuk or brought to the next TMT meeting. 2. Review Meeting Minutes
Review of the April 4 official meeting minutes was postponed. Russ Kiefer (Idaho) said he would provide a comment on the facilitator’s notes. 3. April Final Water Supply Forecasts and New Flood Control Elevations
Cathy Hlebechuk (COE) showed TMT a comparison of the March and April volume forecasts for Dworshak, Libby, Hungry Horse and Grand Coulee, linked to item 3 on today’s agenda. The Dworshak end of April flood control elevation is 1,574.8 feet; the April 15 flood control elevation is 1,572.6 feet. Grand Coulee end of April flood control elevation is 1,249.4 feet; the April 15 shifted flood control elevation is 1,266.7 feet. Libby April 15 and end of April flood control elevations are the same, 2,378.7 feet. Hungry Horse April 15 and end of April flood control elevations are the same, 3,548.4 feet.
Hlebechuk noted that the projected volume forecasts for all of the FCRPS projects decreased except Libby and Grand Coulee. The number posted for Grand Coulee was incorrect; it should be 65.9 kcfs, or 105% of normal. 4. April 10 Inflow Forecasts Hlebechuk referred TMT members to whiskers plots and hydrographs showing traces for the 44 years of record at Libby, Dworshak and Hungry Horse reservoirs. The STP and ESP forecasts are now closer together than they were last month, indicating that the inflow forecasts are more reliable.
The Libby whiskers plot shows that on June 1, inflows varied from 20 to 83 kcfs for the period of record. The Dworshak whiskers plot shows that on June 1, inflows varied from 6,500 to 22,000 cfs. Because May inflows are higher than June inflows, the May outflows will likely be higher than June outflows as the project refills, Hlebechuk said. Peak inflow from ESP is approximately 40 kcfs. Current inflows were 11 kcfs yesterday, with no indications of dramatic change
5
unless temperatures rise. The highest inflow was on April 9 at 13 kcfs, Hlebechuk said. The hydrograph shows that on June 1, inflows varied from 6 - 22 kcfs. Hlebechuk reminded people that the first 10 days of an ESP analysis are based on forecasted temperatures and precipitations, and the remaining days are based on historical precipitation and temperature records. Wagner noted that both graphs showed inflows dropping to 9 kcfs, whereas current data shows them as closer to 11. 5. Dworshak Operations The first link to this item on the agenda shows three operational scenarios like those presented last week, Hlebechuk said.
The first scenario, 1.98 maf, is closest to the COE water supply forecast. In this particular shape, Dworshak goes to full powerhouse around April 16, then flows increase. If COE didn’t increase flows in late April or early May, Hlebechuk said, the project would refill too soon in May and possibly need to spill. This particular shape has higher flows in early May, then flows decrease at the end of May and go higher in early June.
Under the second scenario, 2.24 maf, Dworshak goes to full powerhouse
on April 15 and spills toward the end of the month, returning to full powerhouse in late April and early May, then spilling again. This shape is driven by inflows and the need to prevent the project from filling too soon.
The third scenario, 1.86 maf, is the lowest possible Dworshak scenario
according to ESP data, Hlebechuk said. Full powerhouse happens on April 16, then spill in early May, followed by a return to full powerhouse.
At a recent FPOM meeting, the salmon managers expressed a preference
for smooth operation toward the end-of-month flood control target, allowing refill to occur as soon as possible, with slightly higher flows in late April, Wagner said. Spill was to be avoided if at all possible, and definitely avoided if it would violate Idaho’s water quality standards. Because the salmon managers are concerned that meeting the mid-April flood control target of 1,577.2 feet elevation could lead to a need for spill, the preference was for a more gradual ramp from where the reservoir is now to the end of April elevation, 1,574.8 feet. Scenario 2 showing 2.24 maf inflows probably comes closest to what the salmon managers envisioned, Wagner said. The salmon managers did not specify how to achieve their objectives, leaving that to the COE’s expertise.
Then the COE will continue operating one small unit, Hlebechuk said,
increasing to full powerhouse on April 16 and keeping an eye on daily forecasts in case outflows need to be increased to avoid spill. Idaho, Oregon, Montana, BOR and NOAA representatives agreed to that mode of operation. BPA would like to see generation increased to two small units between now and April 16 to
6
avoid the risk of needing to spill, Tony Norris (BPA) said. The reservoir is currently refilling now at the rate of about a foot per day, Wagner said. The salmon managers are recommending outflows be increased now, Kiefer said, in order to move the reservoir elevation 6 feet lower over the next 20 days. The reservoir is filling too quickly, Kiefer, Norris and Wagner agreed. The COE could operate two small units now, Hlebechuk said, increasing outflows to slow down the refill and hopefully release more water at the end of April. The decision was to increase outflows slightly now, and adjust outflows as forecasts and inflows change.
(Hlebechuk sent out an email shortly after the meeting saying that current
models show a need to increase outflows to 7.6 kcfs starting the night of April 11, and increasing to about 9 kcfs in the middle of the month. This operation should provide a buffer against spill if inflows are higher than forecasted.) 6. WMP Spring/Summer Update (comments due Monday, April 16) The TMT will follow up with a fact-to-face meeting on April 18 to discuss comments received. Within the next few days, COE will fill in the numbers associated with the April forecast so that comments can be made on actual data. 7. Spill Operations Update Spill on the lower Columbia started at 0001 hours the morning of April 10 as planned, Jim Adams (COE) said. At Lower Granite, spill has been consistently 20 kcfs, meaning full spill has been achieved there. At Little Goose, spill has been a little above or a little below 30% of total flow with a daily average of very near 30% for all of the days. The spill cap at Lower Monumental is 26.5 kcfs due to construction operations associated with the RSW installation. COE has been meeting that level most of the time, and when not meeting it, has switched to minimum generation.
Ice Harbor has been on minimum generation most of the time, although yesterday the flow target of 45 kcfs was met. While on minimum generation, flows to the powerhouse have been around 9.3-9.4 kcfs. Spill at McNary has been around 90-100 kcfs while operating at 40% of total flow. The operation at John Day is to spill 60% of total flow (as per the 2007 Fish Passage Plan and the 2007 Fish Operations Plan). However, spill has been significantly limited to less than 60% of total flow by the spill cap of 94.4 kcfs, Adams said. When the project spilled at a rate of 94.4 kcfs, TDG levels in the tailwater gage are approximately 119%, so COE will maintain the spill cap of 93.3-94.4 kcfs for another day or so. 8. Snake River a. Unit outages. All units at Little Goose will be down for a powerhouse outage lasting approximately 2-6 hours today, Don Faulkner (COE) said. Two
7
units will come back online through the afternoon of April 12, then all units will be out of service for about two hours. b. Research requests – Ice Harbor and Little Goose. Unit outages at Little Goose coincided with USGS researchers’ outage requests for hydrophone placement, Klatte said. Ann Setter (COE Walla Walla) explained that several hydrophones at Little Goose need to be adjusted because they were installed too close to the water surface, due to wrong elevation information the researchers received. Setter asked whether COE could (1) shift spill today for four hours to the northernmost bays to reach the hydrophones on the non-overflow wall and powerhouse (A3, A4, B1 and B2 on the graphic linked to today’s agenda), and (2) curtail spill for an additional four hours the following day to allow access to the remaining two hydrophones (A1 and A2).
The salmon managers supported the request to shift spill to bays 4-8 today. Russ Kiefer (Idaho) expressed appreciation for the COE’s efforts to combine this work with today’s unit outages. Regarding the full spillway outage for four hours, NOAA and Montana representatives did not object. Representatives of Oregon and Idaho did not object, but expressed frustration with the frequency of requests for spill outages and adjustments. This is not a good time to reduce spill at Little Goose, Tom Lorz (CRITFC) said. Kiefer suggested spill in the evening to compensate for spill lost to the hydrophone adjustments. When spill has to be curtailed because of human errors, we should take steps to make conditions whole for listed species, he said. Hlebechuk noted that the COE has a policy of not allowing make-up spill for small changes such as this, but would allow it if this were a long-term spill issue. COE will hold internal conversations regarding the request to shift spill, raise it at the April 12 FPOM meeting, and may refer it back to the salmon managers. Possibly TMT will elevate the issue to the IT.
At Ice Harbor, two hydrophones in the spillway are not functioning and
need replacement, Setter said. This situation is different because there is no nighttime spill limitation at Ice Harbor like there is at Little Goose, therefore no opportunity to offset lost spill, Wagner said. It’s also high-priority research for CRITFC, Lorz said, and there aren’t many fish at Ice Harbor now. NOAA, CRITFC, Oregon, Idaho, Montana, BPA and BOR representatives agreed to this operation. NOAA, Oregon, Idaho and CRITFC representatives said the sooner it happens, the better. COE will issue a teletype to schedule the work sometime on April 12. c. Lower Monumental spill change for navigation safety. Preparations for RSW installation at Lower Monumental started April 3 and will continue through midnight April 13, Hlebechuk said. Spill has been limited to bays 1-4, and the resulting spill pattern has caused problems for tow-boaters. On April 9, spill was stopped for 15 minutes to allow a fuel barge to move safely into the lock. The contractor working on the RSW needs to move barges from the forebay past
8
the spillway, which will require shutting off spill for approximately one hour today and tomorrow, April 12. Setter suggested using the 2004 spill test pattern instead of stopping spill altogether. If stopping spill for 15 minutes only happens once a day, that’s fine, but if it’s happening for every lockage, CRITFC would prefer changing the spill pattern, Lorz said. So far, spill has only needed to be stopped once on April 9, Hlebechuk said. A spill outage sounds fine, Wagner said. The crane work will probably be completed April 13, and the project is scheduled to go into 2007 spill patterns starting the following Monday, April 16. d. Little Goose navigation lock outage. This outage is still expected to be completed by the end of April, Hlebechuk said. The project is currently doing temporary lockages in the evening for commercial boats only. e. Transport operations. Fish at Lower Granite are being held for 78 hours instead of 48 as called for in the Fish Passage Plan, Lorz said. They are also being transported before April 20, the date when transport operations were supposed to begin according to the Fish Passage Plan. Wagner said he would ask the researchers, starting next week, to limit holding time to 48 hours if at all possible while meeting the study objectives. Lorz wanted to know why this was not coordinated through the Regional Forum sooner. In future, the specifics of any research proposal that deviate from Fish Passage Plan criteria should be highlighted so the salmon managers can address it ahead of time, Kiefer suggested. In this instance, TMT members agreed this week is too soon to ask the researchers to change their procedures. 9. Operations Review a. Reservoirs. Grand Coulee is at elevation 1,259.6 feet, headed toward a new flood control elevation of 1,249.4 feet for April 30, John Roache (BOR) said. Hungry Horse is at elevation 3,534.71 feet, with an end of April flood control elevation of 3,548.4. Current discharges are 5.2 kcfs and will drop to 3 kcfs starting April 13.
Dworshak was already discussed at length under agenda item 4, April 10 inflow forecasts, Hlebechuk said. Libby is at elevation 2,395.48 feet, with an end of April flood control elevation of 2,378.7 feet – 17 feet lower, Hlebechuk noted. Libby can only pass inflows at present, due to an International Joint Commission flood control issue at Kootenay Lake. Libby cannot start draft until the commencement of spring rise on Kootenay Lake is proclaimed. Lower Granite inflows are currently 40-50 kcfs and dropping. Priest Rapids discharged 158 kcfs on April 10, the first day of a 135 kcfs objective. McNary discharged 232 kcfs on April 10.
b. Fish. Juvenile passage numbers have increased at Lower Granite,
which is to be expected, Wagner said. Yearling Chinook are passing at the rate
9
of about 10,000 per day at Lower Granite. What’s happening is typical for this time of year. Passage is a bit on the late side at Bonneville.
c. Power. There is nothing new to report, Tony Norris (BPA) said. d. Water Quality. There were a few exceedances in the past week, Jim
Adams (COE) said. The McNary forebay had TDG levels of 116.1-116% as a result of gas coming down the mid-Columbia. The Ice Harbor forebay had TDG levels of 115.5% and 115.1% until wind blew the gas out of the water. 9. Next TMT Meeting The next meeting will be face-to-face on April 18, 2007. Agenda items will include Dworshak and Libby operations, new STP runs and hydrographs, comments on the WMP spring/summer update, initiation of Snake River transport operations, planning transport operations for research, an update on spill operations, development of a procedure for nighttime gas cap spill levels, a Priest Rapids update, and the usual operations review. This meeting summary was prepared by consultant Pat Vivian. Name Affiliation Cathy Hlebechuk COE John Roache BOR Paul Wagner NMFS Jim Adams COE Tony Norris BPA Russ George WMCI Dan Spear BPA Randy Wortman COE Rudd Turner COE Bernard Klatte COE Don Faulkner COE Ann Sutter COE Walla Walla Rick Kruger Oregon Russ Kiefer Idaho Kyle Dittmer CRITFC Glen Trager Evista Energy Tim Heizenrader Cascade Energy Dave Benner FPC Joe Polent PPM Energy Brian Marotz Montana Ruth Burris PGE XX Snohomish PUD Bruce McKay consultant Terry Weeks PNGC
10
Aaron Hunziker Merit
11
T E C H N I C A L M A N A G E M E N T T E A MBOR : John Roache / Mary Mellema BPA : Robyn MacKay / Tony NorrisNOAA-F: Paul Wagner / Richard Dominigue USFWS : David Wills / Steve HaesekerOR : Rick Kruger / Ron Boyce ID : Russ KieferWA : Cindy LeFleur MT : Jim Litchfield / Brian Marotz
COE: Cathy Hlebechuk / Jim Adams / Cindy Henriksen
TMT CONFERENCE CALL Friday April 13, 2007 09:30 - 10:30
1125 N.W. Couch Street, Suite 4A34 Portland, Oregon 97209
Conference call line: 503-808-5190
To check into the building, take the elevator to the 5th floor and the guard will issue you an ID badge if you need one and will take you down to the 4th floor where the meeting is. If you have NOT attended a TMT meeting in
the past you will need to call ahead and let Cathy Hlebechuk (503) 808-3942 or Jim Adams (503) 808-3938 know, so you can be added to the TMT Visitor List and issued an ID badge. This badge may be used indefinitely. If you have attended TMT in the past you may re-use your ID badge indefinitely. If you are a federal employee you will
also need to have an ID badge issued to you which can be used indefinitely.
We have had disruptions on the phone because people are not hitting 'mute' after dial in.Please MUTE your Phone
All members are encouraged to call Robin Harkless with any issues or concerns they would like to see addressed. Please e-mail her at [email protected] or call her at (503) 248-4703.
AGENDA
1. Welcome and Introductions2. Review [Meeting Minutes] 3. Little Goose Hydrophone Installation4. Lower Granite RSW outage5. End of Chum Emergence
1. [Timing of Chum Fry Emergence and Catch in the Ives Island Area, 1999 - 2007] 2. [2007 Chum Salmon Catch in the Ives Island Area]
6. Dworshak end of month flood control elevation7. Other
Set agenda for next meeting - April 18, 2007 [Calendar 2007]
Questions about the meeting may be referred to Cathy Hlebechuk at (503) 808-3942, Jim Adams at (503) 808-3938 or Cindy Henriksen at (503) 808-3945
Timing of Chum Fry Emergence and Catch in the Ives Island Area, 1999 - 2007
COLUMBIA RIVER REGIONAL FORUM TECHNICAL MANAGEMENT TEAM
April 13, 2007 CONFERENCE CALL
FACILITATOR’S SUMMARY NOTES ON FUTURE ACTIONS Facilitator: Robin Harkless
Notes: Erin Halton The following notes are a summary of issues that are intended to point out future actions or issues that may need further discussion at upcoming meetings. These notes are not intended to be the “record” of the meeting, only a reminder for TMT members. Updates Cathy Hlebechuk, COE, said that the April final water supply forecast data had been added to the posted version of the spring/summer update to the Water Management Plan. Jim Adams, COE, said that the official meeting minutes from the 4/4 meeting had been posted on the TMT website. Little Goose Hydrophone Installation Bernard Klatte, COE, updated TMT on the Walla Walla COE’s request to curtail spill at Little Goose for hydrophone work. COE policy officials and legal counsel will meet with BPA and other signatories to the 2007 FCRPS Fish Operations Agreement discuss policy around spill mitigation. Klatte reported that the USGS offered to double up their work crews and reduce the original outage from 4 to 2 hours maximum and could implement the outage sooner, on 4/13. Klatte presented this to those present at the FPOM meeting held on 4/12. Klatte asked Salmon Managers for input on this recommendation:
• NOAA: supports the request • OR: no objection • ID: no objection • CRITFC: did not object to the request • BOR: no objection • BPA: no objection • USFWS, present at the FPOM meeting on 4/12: no objection
TMT members expressed the desire to have policies in place for fish protection measures when there is ‘human error.’ From the COE’s perspective, the current 2007 Agreement requires higher level, legal and policy discussions prior to action – and the COE will continue to review requests on a case by case basis. Idaho requested an update to TMT on results of the policy discussions at the next TMT meeting.
Action: There will be a 2-hour spill curtailment at Little Goose on 4/13, to allow for hydrophone work.
Lower Granite RSW Outage Bernard Klatte, COE, relayed a request from USGS for access into the boat restricted zone for acoustic drogue testing. This work would require shutting down the RSW. This
1
request was discussed at FPOM, but since fish passage numbers at LWG are high and the lack of cost vs. benefit analysis has not been presented, the operation was not supported. Russ Kiefer, ID, noted that due to the climb in passage over the last 5 days, the benefit information gathered with an outage at this time would have to be ‘pretty significant’ for him to support it. NOAA and OR said they would not be able to consider the outage without more information/analysis.
Action/Next Steps: Bernard Klatte, COE, will inquire whether USGS plans to do a cost/benefit analysis and/or wishes to proceed with the request, and share that with TMT.
Chum Emergence Update Rick Kruger, OR, reported on two graphs linked to the TMT agenda, showing chum emergence dates extending into May. Rick said that there were 52 observed fish on 2/26, 46 fish on 3/9, and 40 were observed on 4/12, indicating a ‘second peak’ in emergence, likely due to late spawning. Kruger added that it would be premature to end the 13' tailwater restriction until mid-May.
Next Steps: Chum emergence will be on TMT meeting agendas until emergence concludes.
Dworshak Flood Control Elevations Cathy Hlebechuk, COE, said that flood control elevations are determined and adjusted by actual and forecasted inflows, and shared three scenarios based on three different average inflows. Hlebechuk sent an email out to TMT following the conference call, which gave details on the COE’s short-term plan for operations and projected options for flood control elevations through the end of April.
Next Steps: Dworshak operations will be on the agenda for the TMT meeting on 4/18.
Bonneville Outage on 4/16 Jim Adams, COE, reminded TMT of a scheduled outage at Bonneville powerhouse 1, from 0700 – 1700 on 4/16. BPA asked TMT members to indicate their preference for operating outside of 1% vs. flows of greater than 100 kcfs, should one of the two become necessary during the outage: ID, NOAA, and OR said they preferred operations outside 1%, COE and BOR deferred to the Salmon Managers, and CRITFC was neutral.
Action/Next Steps: BPA will do everything it can to minimize impacts, and will operate outside of 1% only if it becomes necessary during the outage.
Next face-to-face TMT meeting: April 18th Agenda items will include: • Dworshak Operations • Updated ESP / STP • Transport Review
2
• Procedure for Night Caps at Little Goose • Priest Rapids Update • Schedule for Start of Transport • Chum Emergence • Little Goose Navigation Lock Update • Ice Harbor Minimum Generation Operation • WMP Spring/Summer Update – Comments Review • Operations Review
3
Columbia River Regional Forum Technical Management Team Conference Call
April 13, 2007 1. Welcome and Introductions Today’s TMT meeting was chaired by Cathy Hlebechuk and facilitated by Robin Harkless, with representatives from COE, Oregon, CRITFC, BOR, Montana, BPA, NOAA, and Idaho participating in the call. The following is a summary (not a verbatim transcript) of the topics discussed and decisions made at the meeting. Any comments on these notes should be given to Cathy Hlebechuk or brought to the next TMT meeting. 2. Review Meeting Minutes
The official meeting minutes for April 4 have been posted on the TMT website for review, Hlebechuk said. 3. Little Goose Hydrophone Installation
Bernard Klatte (COE) updated TMT on the request from COE’s Walla Walla district to close the spillway at Little Goose for up to four hours. Representatives from the COE policy office and the Office of Legal Counsel will meet with BPA representatives to come up with a policy on mitigating spill requests such as this one. The USGS researchers believe they can complete the hydrophone work in two hours.
At the FPOM meeting held April 12 at McNary, participants said there is
value to listed fish in adjusting the hydrophones to complete the research, and they consented to a spillway outage at Little Goose from noon to 2 pm today. At today’s TMT meeting, representatives from NOAA, CRITFC, BOR and BPA and Oregon did not object to the outage. While Rick Kruger (Oregon) gave his consent, he expressed concern that it took three days for policy discussions to happen. Responding quickly to unforeseen circumstances that impede planned fish protection measures should be part of TMT’s job. Kruger noted that TMT emergency protocols include a section on emergency response actions to offset adverse effects.
When an executive declares an emergency, that protocol would go into
effect, Klatte said. Smaller changes to the Fish Passage Plan, such as this outage, require COE’s Office of Legal Counsel to consult with other legal signatories to the 2007 agreement. COE will continue to make decisions on a case by case basis, after discussion with TMT members, Hlebechuk said. Kruger asked to be updated on policy development regarding offset spill.
4
4. Lower Granite RSW Outage
Earlier this week, USGS researchers sent Bernard Klatte (COE) an email requesting that the RSW at Lower Granite be shut down for a few hours so they can enter the boating restricted zone near the forebay and powerhouse spillway. FPOM didn’t favor the request, and the researchers didn’t follow up. Nevertheless, Klatte wanted TMT’s opinion for the record.
Such decisions should be based on a cost/benefit analysis of whether the
cost to fish is worth getting the information, Kiefer said. Without further information, he’d have to say no. NOAA, Idaho, and Oregon representatives agreed with this response. Klatte said he would try to get more information. In the meantime the request will be put on hold, unless something new comes to light. 5. End of Chum Emergence
Chum fry are expected to emerge through mid-May, Rick Kruger (Oregon) said. The peak catch was 52 fish on Feb. 26, which is twice as many as any other day until March 9, when 46 fry were caught. It appears that the first peak on Feb. 26 may have been emergence from early spawners, Kruger said. Now that water levels are dropping, sampling is probably more effective, which may be part of the reason for the increased catches recently. Peak emergence of late spawners appears to be happening now. Kruger said chum fry are expected to be in the gravel through mid-May, so the 13-foot tailwater restriction will need to be extended well into May. Hlebechuk requested that this item be kept on TMT agendas until chum spawning ends. 6. Dworshak End of Month Flood Control Elevation
As reported at the last TMT meeting, the end of month flood control target elevation was 1,574.8 feet. Since then, Hlebechuk said the COE’s Hydrologic Engineering Branch calculated a different flood control elevation based on projected inflows, called a flood control refill curve. The end of month flood control elevation is either the flood control refill curve, which gives a 95% confidence of filling the project by end June, or the standard flood control target elevation, whichever is higher.
Hlebechuk asked the hydrologic engineers to run sensitivity analyses to
three different scenarios consisting of 7, 11, and 15 kcfs inflows during the rest of April. Resulting end of April flood control elevations were as follows:
• With an average 7 kcfs inflow for the rest of April the end of April flood
control elevation was 7 kcfs inflows = 1,572.6 feet. • With an average of 7 kcfs inflow for the rest of April, the end of April flood
control elevation was 11 kcfs inflows = 1,573.4 feet.
5
• With an average 11 kcfs inflow for the rest of April, the end of April flood control elevation was 1,582 feet. These flood control elevations are recalculated weekly based actual inflow
to the current date and STP inflows through the rest of April. Bottom line: The Corps will need to adjust flows if necessary to reach the end of month flood control elevation, whatever it is, while keeping in mind the salmon managers’ desire for a smooth refill, high outflows later in the month and an avoidance of spill, especially to the gas cap.
Kiefer liked the concept of the flood control refill curve. If more snowpack
melts earlier and there’s less above the reservoir, the risk of spilling is reduced because more water has left the river system early. If that happens, it would make sense to keep the reservoir. On the other hand, if temperatures drop,and more snowmelt is waiting to descend, more flood control will be needed. Kiefer wanted the COE to have the flexibility to adjust current outflows of 7.6 kcfs if conditions warrant. TMT will discuss this issue further on April 18.
7. Other Miscellaneous Issues Jim Adams (COE) reminded TMT that on Jan. 31 they agreed to a unit outage at Bonneville April 16, which is next Monday, 7 am to 5 pm. Hopefully the entire operation will require less than 100 kcfs of spill.
April forecast data have been posted to the Water Management Plan spring/summer update, Hlebechuk said. Commenters now have access to the most current forecast information. BPA has asked for a tailwater variance of a foot at the Bonneville Dam tailwater on Monday, April 16, to accommodate the scheduled second powerhouse outage. Staying within the daily tailwater variation may require more spill for a few hours, Scott Bettin (BPA) said. He asked TMT which they would prefer – if a choice must be made – spilling more than 100 kcfs per hour through the day on April 16, or operating the available units at the Bonneville first powerhouse outside 1% peak efficiency while meeting the Bi Op spill level. If inflows are approximately 220-240 kcfs, some 60 kcfs would need to be stored in a pool upstream of Bonneville Dam. If BPA is unable to store it, spill will exceed 100 kcfs in the very first hour of ramping down, and spilling more than 100 kcfs has been associated with TDG levels of 120% or more in the tailrace. Bettin reminded TMT that tailwater elevations aren’t allowed to drop more than 4 feet a day, or 2 feet an hour. The purpose of these restrictions is to minimize adult fallback and not exceed the gas cap. Warrendale gage has been showing TDG levels of around 116% in the tailrace, which means 4 feet of elevation above 13 feet would be needed for depth compensation if there is spill, Adams said. Because there are still chum fry in the gravel and water column needing protection, it would be preferable to go outside the 1% limit if we have to, Russ
6
Kiefer (Idaho) said. Without the chum, Kiefer would have been willing to accept TDG levels up to 125% in the tailrace. NOAA and Oregon representatives agreed with this response. Given the priorities, BPA will exceed 1% peak efficiency at the Bonneville first powerhouse first if necessary, then spill above 100 kcfs only as a last resort, Bettin said. Spill would require additional depth compensation, Adams said. 8. Next TMT Meeting The next meeting will be in person on April 18, 2007. Agenda items will include Dworshak operations; updated ESP and STP information; transportation for research; the start of routine transportation operations; a procedure for nighttime spill caps at Little Goose; a Little Goose navigation lock update; a Priest Rapids update; minimum generation at Ice Harbor; the WMP spring/summer update; Dworshak follow-up from today’s meeting; and the usual operations review. This meeting summary prepared by consultant Pat Vivian. Name Affiliation Jim Adams COE Cathy Hlebechuk COE Bernard Klatte COE Paul Wagner NOAA Kyle Dittmer CRITFC John Roache BOR Tony Norris BPA Scott Bettin BPA Robyn MacKay BPA Dan Spear BPA Russ George WMCI Margaret Filardo FPC Russ Kiefer Idaho
7
T E C H N I C A L M A N A G E M E N T T E A MBOR : John Roache / Mary Mellema BPA : Robyn MacKay / Tony NorrisNOAA-F: Paul Wagner / Richard Dominigue USFWS : David Wills / Steve HaesekerOR : Rick Kruger / Ron Boyce ID : Russ KieferWA : Cindy LeFleur MT : Jim Litchfield / Brian Marotz
COE: Cathy Hlebechuk / Jim Adams / Cindy Henriksen
TMT MEETING Wednesday April 18, 2007 09:00 - 12:00
1125 N.W. Couch Street, Suite 4A34 Portland, Oregon 97209
Conference call line: 503-808-5190
To check into the building, take the elevator to the 5th floor and the guard will issue you an ID badge if you need one and will take you down to the 4th floor where the meeting is. If you have NOT attended a TMT meeting in
the past you will need to call ahead and let Cathy Hlebechuk (503) 808-3942 or Jim Adams (503) 808-3938 know, so you can be added to the TMT Visitor List and issued an ID badge. This badge may be used indefinitely. If you have attended TMT in the past you may re-use your ID badge indefinitely. If you are a federal employee you will
also need to have an ID badge issued to you which can be used indefinitely.
We have had disruptions on the phone because people are not hitting 'mute' after dial in.Please MUTE your Phone
All members are encouraged to call Robin Harkless with any issues or concerns they would like to see addressed. Please e-mail her at [email protected] or call her at (503) 248-4703.
AGENDA
1. Welcome and Introductions2. Review [Meeting Minutes] 3. Priest Rapids Update - [Priest Rapids Operations 2007] Russell Langshaw, Grant Co. PUD4. Flow forecasts - 18 Apr 07 ESP
a. Libbyi. [Daily inflow range - Box Whiskers] ii. [Daily Inflows - Hydrograph]
b. Dworshaki. [Daily inflow range - Box Whiskers] ii. [Daily Inflows - Hydrograph]
iii. [Volume Comparisons] iv. [Augmentation Volumes]
c. Hungry Horsei. [Daily inflow range - Box Whiskers] ii. [Daily Inflows - Hydrograph]
5. ESP HYSRR model resultsa. [Summary of 13 Apr 2007 ESP HYSSR Model Runs] Hlebechuk, COE
ESP 75th PrecentileESP 25th PercentileObserved FlowsESP Daily Mean
Whiskers: ESP Daily Max/Min
ESP flows updated 18-Apr-2007
This plot displays the daily range of flows from the ESP hydrographs. Fifty percent of the ESP flows fall within the narrow shaded rectangles and the daily extremes of the ESP flows are bound by the "whiskers".
ESP 75th PrecentileESP 25th PercentileObserved FlowsESP Daily Mean
Whiskers: ESP Daily Max/Min
ESP flows updated 13-Apr-2007
This plot displays the daily range of flows from the ESP hydrographs. Fifty percent of the ESP flows fall within the narrow shaded rectangles and the daily extremes of the ESP flows are bound by the "whiskers".
Libby operates to VARQ flood control Apr - May. The project also meets minimum bull trout flows and the sturgeon pulse volume, both of which are appropropiate for each ESP year . After the sturgeon pulse, Libby releases a flat flow and targets 2439 ft by 31
McNary Meets the Following Flow Objectives:
Lower Granite Meets the Following Flow Objectives:
Priest Rapids Meets the Following Flow Objectives:
Streamflows are from the 13 Apr ESP run, which uses current basin conditions combined with 44 historical weather patterns (temperatures and precipitation) to produce 44 ESP hydrographs for 2007.
Grand Coulee operates to meet 135,000 cfs (for Priest Rapids) and 237,000 cfs (for McNary) April 16 through June 30. In June the project refills to 1289 ft in all years. Summer lake targets are 1285.0 ft in July and 1280 ft in August.
Hungry Horse operates April - May for a controlled refill by 30 June and meets minimum project outflow of 900 cfs and minimum flow of 3,500 cfs at Columbia Falls. The project drafts to 3540 ft by 31 Aug.
Dworshak operates for flood control in April, targeting full in June and drafting to 1535 ft and 1520 ft by 31 Aug and 30 Sep
Brownlee operates to flood control elevations in April refills in June (2077 ft) and drafts in July and August to provide 237 kaf Upper Snake flow augmentaiton water.
Volume Comparison Table (ESP versus Regression) - April Final:
ESP 75th PrecentileESP 25th PercentileObserved FlowsESP Daily Mean
Whiskers: ESP Daily Max/Min
ESP flows updated 13-Apr-2007
This plot displays the daily range of flows from the ESP hydrographs. Fifty percent of the ESP flows fall within the narrow shaded rectangles and the daily extremes of the ESP flows are bound by the "whiskers".
25th Percentile 75th Percentile Daily Mean Observed Outf low
This plot displays the daily range of outflows needed to meet the end of April flood control elevation and a controlled refill to the end of June. The inflows used in this analysis were the set of 44 inflows generated when current basin conditions were overlaidwith 44 historical weather patterns (temperatures and precipitation). Fifty percent of the ESP flows fall within the narrow shaded rectangles and the daily extremes of the ESP flows are bound by the "whiskers".
Daily Tagging goals by studyEach box is one replicate
Average daily collection at Lower Granite (2004 - 2006Date Extra mortality Comparative tag
Wild Chin Wild Sthd Wild Chin Wild Sthd Hat Sthd H & W Chin H & W Sthd Hat Chin Hat Chin Date Hatchery Wild Hatchery Wild4/9/2007 3,000 3,000 3,000 3,000 1,400 9-Apr 5,733 5,070 3,217 1,697
4/10/2007 over 3 over 3 over 3 over 3 over 3 10-Apr 5,792 5,015 4,755 1,4554/11/2007 days days days days days 11-Apr 6,587 4,833 3,493 2,3474/12/2007 This week is finished 12-Apr 9,545 7,125 4,615 2,5264/13/2007 13-Apr 11,400 8,883 3,633 2,1834/14/2007 14-Apr 10,308 7,122 5,067 2,3864/15/2007 15-Apr 15,833 7,917 10,100 2,5174/16/2007 16-Apr 22,150 13,050 9,483 1,8834/17/2007 3,000 over 3,000 over 4,000 over 3,100 over 1,750 over 17-Apr 19,654 10,075 17,799 2,9634/18/2007 1-2 days 1-2 days 1-2 days 1-2 days 1-2 days 18-Apr 17,780 8,913 20,334 3,8494/19/2007 19-Apr 23,197 13,138 16,888 3,4414/20/2007 20-Apr 24,376 11,477 22,792 3,4314/21/2007 21-Apr 30,905 12,274 27,596 4,4814/22/2007 10,000 10,000 22-Apr 33,012 11,090 36,731 3,8644/23/2007 4,558 400 23-Apr 25,672 11,711 52,688 6,2874/24/2007 3,000 over 3,000 over 3,750 over 3,400 over 3,500 over 7,443 24-Apr 34,384 13,929 34,664 4,1874/25/2007 1-2 days 1-2 days 1-2 days 1-2 days 1-2 days 4,558 400 25-Apr 54,753 16,275 56,123 3,5794/26/2007 7,443 26-Apr 56,028 21,988 119,498 5,5634/27/2007 4,558 400 27-Apr 105,799 37,594 150,270 8,4814/28/2007 7,443 28-Apr 130,881 38,907 85,425 5,8634/29/2007 10,000 10,000 29-Apr 191,487 35,232 94,626 12,8904/30/2007 3k to 6k 3k to 6k 3k to 6k 3,400 3,675 4,558 400 30-Apr 178,655 32,194 166,239 17,3855/1/2007 7,4435/2/2007 over 1-5 over 1-5 over 1-5 over 1-5 over 1-5 4,558 4005/3/2007 7,4435/4/2007 days days days days days 4,558 4005/5/2007 7,443
Planned tag numbersIndex marking Chinook SteelheadReach survival Alternate barge
COLUMBIA RIVER REGIONAL FORUM TECHNICAL MANAGEMENT TEAM
April 18, 2007 MEETING
FACILITATOR’S SUMMARY NOTES ON FUTURE ACTIONS Facilitator: Robin Harkless
Notes: Erin Halton The following notes are a summary of issues that are intended to point out future actions or issues that may need further discussion at upcoming meetings. These notes are not intended to be the “record” of the meeting, only a reminder for TMT members. 4/ 11 & 13 /07 TMT Meeting Minutes Jim Adams, COE, noted that the facilitator’s notes from the 4/11 and 4/13 conference calls had been posted, and that the official meeting minutes from 4/11 were posted and that the 4/13 minutes would be posted later this week. Priest Rapids Operations Update Russell Langshaw, Grant County PUD, updated TMT on Priest Rapids operations; he referred to a graph posted to the TMT agenda, showing no exceedances of the flow bands.
Action/Next Steps: Langshaw will provide another update on the flow protection operation at the 5/2 TMT meeting.
April 17 Inflow Forecasts Cathy Hlebechuk, COE, referred TMT to inflows whiskers plots and STP/ESP hydrographs for Libby, Dworshak and Hungry Horse, updated as of 4/17 and posted on the TMT website. Hlebechuk noted that the Dworshak augmentation volumes graph shows a 10-day deterministic run with a temperature/precipitation sequence overlaid on this year’s existing conditions. She added that the Dworshak April-July volume forecast shows a downward trend, with the current end of April forecast at 1982 kaf. April 13 ESP HYSSR Model Results Cathy Hlebechuk, COE, referred to an ‘as of April 13’ modeling results document linked to the TMT agenda, showing numbers of occurrences out of 44 years, average flows, and flow objectives for Priest Rapids, Lower Granite, Bonneville, and McNary. The document also shows period average flows for all projects and project refill within 1' by June 30th. Hlebechuk clarified that all of the results on the document are based on projections and said the COE was developing daily time-step models that will be used in the future. TMT members asked about the discrepancy between forecasts for the Snake and Columbia Rivers and requested actual historical data for the Upper Columbia and Snake River.
Action/Next Steps: Randy Wortman, COE, will provide TMT members with the requested data. (note: Hlebechuk sent this data out via an email on 4/20.)
1
Dworshak Operations Cathy Hlebechuk, COE, referred TMT to graphs linked to the TMT agenda that showed daily outflows and extremes of ESP flows. She said that the new end of April flood control target elevation was 1572.1'. (note: the COE later corrected the end of April target elevation to 1572.6'.) TMT members complimented the good job the COE has done in meeting the objectives put forth the by the Salmon Managers.
Next Steps: The COE will keep TMT updated as the operation progresses, and Dworshak Operations will be on the agenda for the 5/2 TMT meeting.
Little Goose Navigation Lock UpdateAs follow up from the last TMT meeting, the COE reported that work at the project was on track to be completed by the end of April. Procedure for Initiating Nighttime Spill to Cap at LGS Paul Wagner, NOAA, said that the initiation of spill to the spill caps at night at Little Goose is likely to occur during the last week of April or the first 2 weeks in May, and that it would depend on transportation operations, passage numbers at Lower Granite, temperatures, and calculated travel time for arrival at Little Goose. BPA requested advance coordination via phone/email and a minimum of 2 days notice. The salmon managers said the indicators would likely provide ample time for advance coordination of the operation with the Action Agencies.
Action/Next Steps: Salmon Managers will coordinate with the COE and the TMT will be notified as soon as indicators are observed.
Transportation Operations Paul Wagner, NOAA, referred to a graph linked to the TMT agenda, showing the schedule for four research studies at Lower Granite. He said the goals of the studies are to better understand how conditions and timing affect the success and survival of transported fish. Wagner added that FPAC approved the 4/19 barge date for the reach survival study, but that the rest of the studies will not begin until 4/29, with barges leaving 5/1. Russ Keifer, speaking on behalf of FPAC and ID, noted that the agreed upon dates for the studies were a good compromise. Start of Transport Paul Wagner, NOAA, characterized the factors that will signal the start of transport as a mix of qualitative and quantitative data. Factors will include: temperatures, flow rates, shape of runoff to date / anticipated runoff, and fish passage numbers. Wagner added that the run is below average and that flows and temperatures are low at this point. Paul Ocker, COE, said that a 3-day minimum notification will be necessary to get the barges in place for transport. He also said that the COE has a concern for steelhead, and, given the uncertainty of the transportation start date, the COE will need ESA coverage for take in writing from NOAA.
2
Action/Next Steps: Paul Wagner and Paul Ocker will coordinate offline about the coverage issue with a call on Monday, 4/23; FPAC will discuss transportation at their meeting on 4/24; and there is a placeholder for a TMT call on this issue at 10 a.m. on 4/25.
Chum Emergence No new information was presented at the meeting; there will be a check- in at the 5/2 TMT meeting. Water Management Plan Spring/Summer Update Bernard Klatte, COE, said that the comments received were posted on the TMT website, and that he would incorporate them into an update by the end of the week.
Action: Klatte will update the plan by 4/20, and TMT will finalize the draft update at the 5/2 meeting. IT will review the revised update at their 5/3 meeting.
Operations Review Reservoirs – Grand Coulee was at 1255.9', and drafting to meet the 4/30 flood control elevation target of 1249.4' Hungry Horse was at 3534.67', releasing 3 kcfs and preparing to shift to VARQ outflows on 5/1. Libby was at 2395.15', with outflows between 26-27 kcfs and inflows of 10-11 kcfs and an end of April target elevation of 2378.7'. The commencement of Kootenai Lake spring rise was officially declared at 0001 hours on 4/17. Dworshak was at 1571.35', with the COE operating as needed to meet the 4/30 target elevation of 1572.1' (note: the COE later corrected the end of April target elevation to 1572.6'). Albeni Falls was at 2054.6' and releasing 33 kcfs. The seven-day average at Priest Rapids was 162 kcfs; McNary was averaging 226 kcfs; Lower Granite was averaging 48.4 kcfs; and Bonneville was averaging between 205-267 kcfs. Fish – Paul Wagner, NOAA, said that passage numbers were seeing a climb in yearling Chinook and that passage at Grande Rhonde, Lower Granite and the Lower Columbia projects were increasing overall, but were still below the projected peaks of 200,000-400,000. He noted that a date for the May release from the Spring Creek hatchery was still being discussed. Cindy LeFleur, WA, said the cumulative adult count at Bonneville was 4,245, and well behind the 10-year average. She reported that sport fishing below Bonneville ended 4/15 and that there were indications that actual counts will be close to those forecasted. Power – nothing to report Water quality – Jim Adams, COE, referred to a graph linked to the TMT agenda, showing TDG exceedances at Ice Harbor, McNary and Lower Monumental. (Note: There is a placeholder for a TMT conference call at 10 a.m. on 4/25.) Next face-to-face TMT meeting: May 2nd Agenda items will include: • Dworshak Operations
3
• Updated ESP / STP • Snake River Transport • Procedure for Night Caps at Little Goose • Priest Rapids Update • Schedule for Start of Transport • Chum Emergence • Sturgeon Pulse • WMP Spring/Summer Update – Comments Finalized • Operations Review
4
Columbia River Regional Forum Technical Management Team Meeting
April 18, 2007 1. Welcome and Introductions Today’s TMT meeting was chaired by Cathy Hlebechuk and facilitated by Robin Harkless, with representatives from CRITFC, BPA, COE, BOR, USFWS, NOAA, Idaho and Washington attending in person or by phone. The following is a summary (not a verbatim transcript) of the topics discussed and decisions made at the meeting. Anyone with questions or comments about these notes should provide them to the TMT chair or bring them to the next meeting. 2. Review Meeting Minutes The facilitator’s notes and official minutes for April 11, and the facilitator’s notes for April 13, have been posted for review. 3. Priest Rapids Update
For the first few days of emergence, minimum flows were 150 kcfs, Russell Langshaw (Grant County PUD) said. From then on, Grand County PUD has released 60 kcfs flow bands with no TDG exceedances. Daily deltas ranged from 20.4 to 51.8 kcfs, except on April 6, which was 67.9 kcfs on a day with a 150 kcfs minimum flow. Langshaw will provide another Priest Rapids update at the next TMT meeting May 2. 4. April 18, 2007 Flow Forecasts
Hlebechuk presented links showing forecasted inflows and daily inflows similar to recent TMT presentations. Graphs depicting inflow ranges (box whiskers) and daily inflows (hydrograph) are linked to today’s agenda. These flow forecasts were updated based on April 18 ESP data. Hlebechuk reminded TMT that the first 10 days of an ESP run are based on current temperature and precipitation forecasts; beyond that, 44 years of historical temperatures and precipitation levels are overlaid on the existing soil and snow conditions, resulting in 44 different inflow traces.
What’s different from recent week TMT project modeling presentations is that a graph of augmentation volumes for the 44 ESP years has been added (see link on agenda item). Hlebechuk explained the new graph: The purple bar show the volume that has run off to date (April 1 – 16). This is approximately 250 kaf. The beige bars show the volume needed to maintain minimum flow April 17 – June 30. This is approximately 250 kaf. The blue bars show volume to fill at Dworshak. This volume is about 500 kaf. The green bars show the volume of augmentation water available. This volume varies between 686 and 1226 kaf,.
5
Cathy Hlebechuk (COE) showed TMT another new item (see link on
agenda item 4 b iii) on today’s agenda, a volume forecast comparison for April 3,10, 13, and 18 ESP volumes and Corps and RFC April final regression forecasts. The chart shows the volume forecast trending down for Dworshak, with the most recent forecast (April 18) ranging from 1,800 - 2,400 kaf. The Corps final April volume forecast is 1,982 kaf. 5. ESP HYSRR
These streamflow predictions are from the April 13 ESP run, Hlebechuk said. The HYSRR chart combines current basin conditions with 44 historical temperature and precipitation amounts to produce 44 different ESP inflow and outflow hydrographs. The end product is 44 different possible outflows, including regulated flows, for each project. Hlebechuk noted other assumptions on the first page of 5.a . For example, flood control levels are based on the April final water supply forecast at each dam.
Grand Coulee operates to meet flows of 135 kcfs at Priest Rapids and 237
kcfs at McNary from April 16 to June 30, then the project refills to 1,289 feet elevation in June for all 44 years. Late summer targets are 1,285 feet for July and 1,280 feet [Note: Based on the April final forecast at The Dalles, August 31 target should be 1278 feet] for the end of August of each of the 44 years.
Hungry Horse operates April through May for controlled refill by the end of
June, while meeting a minimum project outflow of 900 cfs and a minimum flow of 3,500 cfs at Columbia Falls, then the project drafts to elevation 3,540 feet by the end of August. Minimum flows for the rest of the calendar year are based on the March final forecast.
Brownlee operates to flood control elevations in April, refills by end June
to elevation 2,077 feet. Then it drafts in July and August to provide 237 kaf of flow augmentation in the upper Snake.
Dworshak operates for flood control in April, this particular year targeting
an elevation of 1,574.8 feet because that was the flood control rule curve last week, Hlevechuk said. That elevation has since been changed, a topic for discussion later in today’s meeting (see agenda item #8). Dworshak drafts to 1,535 by end August, which saves 200 kaf per the Snake River Basin Adjudication for September, then drafts to elevation 1,520 feet in September.
Libby operates to VARQ flood control. The project meets minimum bull
trout flows of 6 kcfs starting May 1, then the sturgeon pulse based on the April – August volume. After the sturgeon pulse, Libby releases a flat flow and targets 2439 ft by the end of August.
6
COE has been testing a ResSim model using ESP inflows which regulates on a daily time step, Hlebechuk said.
She showed TMT the ESP HYSRR monthly time step model results Priest
Rapids meets its flows objectives as shown in the middle column listing average flows in kcfs for each of the 44 years. Generally, Priest Rapids has been meeting the 135 kcfs flow objective due to McNary flow targets, except in low water years. ESP HYSRR results for Lower Granite show that, through April 15, the project met the 85 kcfs flow objective zero times out of 44 years. Through April 30, the objective was met 4 times in 44 years. For May, it was 30 times in 44 years. Then on June 20, the flow objective drops to from 85 to 50 kcfs, resulting in an average flow objective of 75 kcfs for June, Hlebechuk said. In July, the project met the 50 kcfs target (which was based on the April final forecast) twice in 44 years. Hlebechuk said 50 kcfs is the lowest objective the COE uses. These data are all projections based on ESP inflows.
ESP HYSRR results for McNary show that the spring flow objective of 237 kcfs by April 30 was met 19 times in 44 years. The summer objective for McNary is always 200 kcfs for the BiOp. Data show that Bonneville met its flow objective of 125 kcfs for April in all of the 44 years. Paul Wagner (NOAA) noted a disparity this year between the Columbia and Snake basins in terms of forecasted water supply and how often the projects have been meeting their flow targets. He asked, how frequently do the basins vary by this amount (70% for the Snake compared to nearly 100% for the upper Columbia)? In some years the Snake was well above average, and the Columbia was below average, Cindy Henriksen (COE) said. It’s common to have different parts of the basin differ from the basinwide average, Randy Wortman (COE) said. There is often extreme variability of weather patterns during winter storms, Kyle Dittmer (CRITFC) said. Earlier this year, the upper Columbia got more precipitation, now the lower Columbia is getting more precipitation, which could change.
Cindy LeFleur (WDFW) wanted more information regarding variability in water supply forecasts for the Snake and upper Columbia. The COE will share historical information regarding differences in actual conditions for the basins. The forecast period for the Snake is April through July, for Grand Coulee it’s April through September. LeFleur asked, is McNary not meeting its flow objectives because of conditions on the Snake? Probably, Hlebechuk said. The COE will update the ESP HYSRR presentation as the season progresses. 6. Dworshak Operations
Hlebechuk presented a box whiskers graph of daily outflows, which shows the daily range needed to meet end of April flood control elevation targets at
7
Dworshak. The end of April target was 1,574.8 feet at the time this graph was generated; the current target is 1,572 feet. Generally, outflows in May are higher than in June. Hlebechuk will continue to email TMT members when COE changes the target elevations for Dworshak.
Russ Kiefer (Idaho) thanked the COE on behalf of salmon managers who
remarked at a recent FPAC meeting that the COE has been doing a good job of understanding fish-related objectives and meeting them. 7. Little Goose Navigation Lock Update
This repair is on track and should be completed by April 30, Don Faulkner (COE) said.
8. Procedure for Initiating Nighttime Spill to Cap at Little Goose
It’s difficult to predict when this will happen because it’s connected to the criteria for starting transport, which are somewhat subjective, Wagner said. The need for spill at Little Goose will be driven by the number of fish arriving at Granite, allowing time for these fish to migrate. Wagner predicted nighttime spill caps would need to start any time from April 25 to May 10 and probably run for 14 days straight, allowing a lag time of approximately two days for the fish to travel from Lower Granite to Little Goose.
The Action Agencies don’t care when this spill happens, but will need lead
time to plan for it, Robyn MacKay (BPA) said. The salmon managers will need to decide when the number of fish at Lower Granite warrant this extra measure of protection, taking into account their anticipated travel time to Little Goose. When it’s time, Wagner will notify Hlebechuk, who will send out an email notifying all TMT members. 9. Snake River Transport
A number of transportation studies are scheduled to occur this year at Lower Granite, Paul Wagner (NOAA) said. He showed TMT members the research schedule and information regarding the start of normal transportation operations. There’s a lot of variation in terms of when transport benefits wild spring Chinook, he said.
A. Transportation Studies. The first link to this agenda item is a table
showing four of the planned transportation studies. Previous findings indicate that wild spring Chinook that are transported don’t do as well as in-river fish if they’re transported before a certain date, which can be anytime from April 20 to May 15, Wagner said. The link shows relative SARs for fish returning within 2-3 years.
8
Steelhead have been shown to benefit from earlier transport that wild spring Chinook, but they also vary in terms of timing, Wagner said. The long term goal of the in-river transport study is to understand what conditions are responsible for this phenomenon. Better information will result in better decisions about when to transport fish. Wagner speculated that it might have something to do with the ocean environment.
Another study scheduled is the alternate barge release which looks at
releasing fish at the Astoria Bridge vs. below Bonneville. A major concern is whether fish released nearer the estuary are more likely to be preyed upon by birds than fish released below the dam. The study asks: Do fish released closer to the estuary have a better chance of surviving to adulthood?
The extra-mortality study will examine daily tagging goals, study by study,
Wagner said. The main question is, does releasing fish below Ice Harbor, which reduces the number of projects they must pass, improve their survival over reducing them in the river to migrate? This study was scheduled to start April 23.
Though all these studies were scheduled to start in spring, this year’s fish
operations plan said that barging wouldn’t begin until TMT had agreed on a starting date, which for planning purposes was assumed to be May 1, Wagner said. This limitation has put a number of these studies in question. At the FPAC meeting yesterday, managers agreed the reach survival study could proceed as early as April 19. However, collection and tagging for the rest of the studies will not begin until April 29.
Dan Spear (BPA) asked, won’t this delay limit data collection on fish
survival in the future? The salmon managers favor continuing the index marking and reach survival portion of the study, Kiefer said. Data indicate that it is better to leave fish in the river early in the season, once they’ve gathered at Lower Granite. Idaho supports continuing this research to identify causes for the date fluctuating from late April to mid May. Salmon managers didn’t see the benefit of starting the alternative barge release strategy in mid April. FPAC reached a compromise that would keep management objectives intact and still fit the salmon managers’ view of optimal water management for spring migrants, Kiefer said and Wagner agreed.
B. Start of Transport Operations. The expected date is still May 1,
Wagner said. He made an analogy between the criteria for starting transport and those for beauty – it’s subjective, more than the sum of its parts. Major factors in the decision will be the status of the run, the percentage that has already passed, how many steelhead and Chinook are in the river, the temperature forecasts, and the shape of the runoff throughout the season.
When the decision is made to transport, the COE needs three days of lead
time to provide a tug ready for transport, said Paul Ocker, a COE fisheries
9
biologist. He recommended a Monday meeting to firm up plans for the start of transportation. Also, regarding ESA consultation, COE needs written confirmation from NOAA that COE’s incidental take is covered if transportation starts before April 20 or after May 1. He recalled that transportation used to start on April 3 until two years ago. Ocker and Wagner agreed to work together on the ESA coverage issue. Kiefer suggested that FPAC discuss the start of transportation at its next meeting on April 24.
With the numbers of steelhead in the river now, few are likely to pass
unless flows rise substantially soon, Wagner said. He estimated that 50% of these fish would pass Lower Granite by May 5-7 and will be collected for transport downstream. The parties to the remand process wanted 50% of the fish to pass in river, but steelhead are unlikely to accomplish that, Wagner said. Modeling indicates that 60-70% will need to be transported. 10. Chum Emergence
There have been no changes since the last TMT meeting, said Dave Wills (USFWS) on behalf of Rick Kruger (Oregon), who was not present today. This issue will be on the agenda for the next TMT meeting. 11. Water Management Plan Spring/Summer Update COE has received written and verbal comments, Bernard Klatte (COE) said. The written ones are posted to the TMT website, and the draft update will be revised accordingly later this week. The plan is to present to IT on May 3, then TMT will finalize it at its May 15 meeting. 12. Operations Review A. Reservoirs. Grand Coulee is at elevation 1,255.5 feet, heading for a 1,249.4 flood control elevation on April 30, Roache said.
Hungry Horse is at elevation 3,534.67 feet, releasing about 3 kcfs. VARQ outflows will start around May 1, now estimated to be about 7 kcfs.
Libby is at elevation 2,395.15 feet, and the commencement of the spring rise at Kootenay Lake was proclaimed at 0001 am April 17. With the commencement of spring rise, Kootenay Lake went from the fixed Kootenay Lake flood control elevation to the lowering formula flood control elevation. This allowed Libby to increase discharges. Inflows have been 10-11 kcfs. Discharges were increased yesterday, and the project went to full powerhouse today (April 18), with outflows of about 26 kcfs and no spill.
Dworshak is at elevation 1,571.35 feet; the end of April flood control
elevation is now 1,572.1 feet. Correction: 1572.6 ft. Hlebechuk reminded TMT
10
members that COE will be adjusting the end of April flood control elevation, and based on this, adjusting outflows and emailing Salmon Managers of the flow changes.
Albeni Falls is at elevation 2,054.6 feet, operating between 2,054-2,055
feet with 33 kcfs outflows and spilling. The Priest Rapids flow objective of 135 kcfs started April 10; the last 7-day average was 162 kcfs. McNary has ranged between 216-235 kcfs for the last 7 days with a 226 kcfs average; the spring flow objective is 237 kcfs. Lower Granite has an objective of 85 kcfs and has discharged only an average of 48.4 kcfs over the last 7 days. Bonneville has been discharging between 205-267 kcfs.
B. Fish. We’re seeing about 1,000 fish per day at White Bird trap, Paul
Wagner (NOAA) said. Imnaha was up to 13,000 for a few days. In terms of getting to Lower Granite, the trend during the first part of April was about 1,000 fish per day; now it’s up to several thousand fish a day. When we get into peak migration, the numbers will be in the 100,000 range at Lower Granite, Cindy LeFleur (Washington) and Wagner agreed. In general, the pace of migration is picking up but not going strong yet in the lower river.
Nearly 3 million fish (approximately 25% of this year’s total Spring Creek
Hatchery release) encountered up to 10% mortality when they reached Bonneville Dam on April 13. As a result, a special operation was requested, and the changes appear to have resolved the mortality problems, Wagner said. There has been debate at FPAC over whether the next group of Spring Creek fish scheduled for release the first week in May should leave the hatchery all at once or in two separate groups to spread their risk.
LeFleur agreed with Wagner that this year’s migration season is running
late – somewhat ahead of the past two years, but well below the 10 year average for this time of year, as the past three years have been. Steelhead passage at Lower Granite is still less than 10,000 per day for both wild and hatchery fish.
C. Power. There is nothing new to report, Robyn MacKay (BPA) said. D. Water Quality. Recently there have been a couple of exceedances in
the Ice Harbor forebay, so COE is backing off spill at Lower Monumental, Jim Adams (COE) said. There have also been a few exceedances in the McNary forebay. Other than that, all projects have been meeting their operational targets. Kiefer asked, what’s the plan regarding spill at Lower Monumental? COE instituted a 26.4 kcfs spill cap the morning of April 17, Adams said. The model predicts reduced gas levels in Ice Harbor forebay.
11
13. Next TMT Meeting The next meeting is scheduled for May 2, 2007. Agenda items will include a Priest Rapids update, updated flow forecasts, Dworshak operations, Snake River transportation, chum emergence, finalizing the WMP spring/summer update, and the usual operations review. This meeting summary was prepared by consultant and writer Pat Vivian. Name Affiliation Kyle Dittmer CRITFC Dan Spear BPA Tony Norris BPA Shane Scott NWRP Scott Bettin BPA Donna Silverberg DS Consulting Bernard Klatte COE Tim Heizenrader Cascade Energy Holli Krebs Bear Energy Jennifer Miller Susquehanna Cindy Henriksen COE Jim Reilly BPA Charles Ross BPA Ken Soderlind COE Don Faulkner COE Cathy Hlebechuk COE Paul Ocker COE John Roache BOR David Wills USFWS Paul Wagner NOAA Jim Adams COE Robyn MacKay BPA Russ Kiefer Idaho Cindy LeFleur WDFW Randy Wortman COE Phone: Mike Butchko Powerex Dave Trager Evista Margaret Filardo FPC Richelle Beck D. Rohr and Assoc. Ruth Burris PGE John XX Constellation Energy Russell Langshaw Grant Co. PUD
12
T E C H N I C A L M A N A G E M E N T T E A MBOR : John Roache / Mary Mellema BPA : Robyn MacKay / Tony NorrisNOAA-F: Paul Wagner / Richard Dominigue USFWS : David Wills / Steve HaesekerOR : Rick Kruger / Ron Boyce ID : Russ KieferWA : Cindy LeFleur MT : Jim Litchfield / Brian Marotz
COE: Cathy Hlebechuk / Jim Adams / Cindy Henriksen
TMT CONFERENCE CALL Wednesday April 25, 2007 10:000 - 11:00
NOTE NEW TIME, THIS WEEK ONLY 1125 N.W. Couch Street, Suite 4A34
Portland, Oregon 97209
Conference call line: 503-808-5190
To check into the building, take the elevator to the 5th floor and the guard will issue you an ID badge if you need one and will take you down to the 4th floor where the meeting is. If you have NOT attended a TMT meeting in
the past you will need to call ahead and let Cathy Hlebechuk (503) 808-3942 or Jim Adams (503) 808-3938 know, so you can be added to the TMT Visitor List and issued an ID badge. This badge may be used indefinitely. If you have attended TMT in the past you may re-use your ID badge indefinitely. If you are a federal employee you will
also need to have an ID badge issued to you which can be used indefinitely.
We have had disruptions on the phone because people are not hitting 'mute' after dial in.Please MUTE your Phone
All members are encouraged to call Robin Harkless with any issues or concerns they would like to see addressed. Please e-mail her at [email protected] or call her at (503) 248-4703.
AGENDA
1. Welcome and Introductions2. Spring Creek Hatchery Release - Dave Wills, USFWS3. Start Transportation - Paul Wagner, NOAA-F4. Start Night Spill at LGS - Paul Wagner, NOAA-F5. Lower Monumental Mooring installation - Bernard Klatte, COE
i. [Figure LMN-1 Lower Monumental Lock and Dam General Site Plan] 6. Dworshak Operations - Cathy Hlebechuk, COE7. Other
Set agenda for next meeting - May 02, 2007 [Calendar 2007]
Questions about the meeting may be referred to Cathy Hlebechuk at (503) 808-3942, Jim Adams at (503) 808-3938 or Cindy Henriksen at (503) 808-3945
LMN–2
COLUMBIA RIVER REGIONAL FORUM TECHNICAL MANAGEMENT TEAM
April 25, 2007 Conference Calls
FACILITATOR’S SUMMARY NOTES ON FUTURE ACTIONS Facilitator: Robin Harkless
Notes: Erin Halton The following notes are a summary of issues that are intended to point out future actions or issues that may need further discussion at upcoming meetings. These notes are not intended to be the “record” of the meeting, only a reminder for TMT members.
4/25/07 CONFERENCE CALL
Paul Wagner, NOAA, said that more information was needed before Spring Creek Hatchery and Nighttime Spill at Little Goose could be discussed.
ACTION: A TMT conference call to discuss these two items was set for Friday, April 27th at 1:00 p.m.
Initiation of Transportation Operations Paul Wagner, NOAA, reported that temperatures, passage counts, and flow indicators were below the levels to initiate the start of transportation operations and that they would likely begin on Tuesday, May 1st. Paul Ocker, COE, said that the COE received take assurances from NOAA, and planned to initiate transportation on May 1. Everyone said they would continue to monitor conditions on a daily basis and make adjustments as necessary. Mooring in Lower Monumental Bernard Klatte, COE, shared a report from the Chief of Operations at Lower Monumental that high swells on Tuesday, April 24 prevented installation of a loading dock mooring bit, prompting a request for a 1 hour spill outage for installation at a time to be determined by the TMT. Given the short amount of time needed for the operation, a spill shift was considered but not pursued by the COE. Bernard noted that this was a safety issue, and that there was a lesson learned to do installations like this before April 1 in future years. Klatte asked TMT members present on the call for input on the request:
• NOAA did not object to the request. • OR did not object to the request, and noted they did not support it either. • ID did not object to the request. • CRITFC did not object or support the request. • BOR did not object to the request. • BPA did not object to the request.
The salmon managers present on the call said they preferred the outage to occur as soon as possible.
1
Action/Next Steps: Bern said he would talk with the operators at Lower Monumental and a teletype would be issued on the operation, which would be initiated by 1:00 or 2:00 pm today (April 25).
Dworshak Operations Cathy Hlebechuk, COE, reported that the end of April flood control elevation target for Dworshak was 1572.6'. The project’s elevation was 1572.46' at midnight on 4/24, and flows planned to increase to 9.1 kcfs on 4/25. Cathy said that Avista Energy requested not going to full powerhouse (10 kcfs) until Thursday night, when line work would be completed. NOTE: Hlebechuk sent out the following email later on 4/25: The Avista line work has been completed early and Dworshak outflows will increase tonight to about 10 kcfs, full load on the units. Next face-to-face TMT meeting: May 2nd Agenda items will include: • Spring Creek Hatchery Release • Dworshak Operations • Updated ESP / STP Model Runs • Snake River Transportation Briefing • Priest Rapids Update • Chum Emergence (?) • Sturgeon Pulse Operations • WMP Spring/Summer Update – Comments Finalized • Operations Review
2
Columbia River Regional Forum Technical Management Team Meeting
April 25, 2007 1. Welcome and Introductions Today’s TMT conference call was chaired by Cathy Hlebechuk and facilitated by Robin Harkless, with representatives from BOR, BPA, COE, NOAA, Idaho and Oregon on the line. The following is a summary (not a verbatim transcript) of the topics discussed and decisions made on the call. Anyone with questions or comments about these notes should provide them to the TMT chair or bring them to the next meeting. 2. Spring Creek Hatchery Release
Discussion of this issue was postponed until April 27, when the needed information will be available. The group scheduled a conference call for this coming Friday, April 27, at 1 pm to address this issue and agenda items 3 and 4. 3. Start Transportation
The low numbers of fish at Lower Granite indicate that it’s too early for transportation, Paul Wagner (NOAA) said. A peak of 90 kcfs is projected for May. The plan is to start transportation on May 1. If it needs to occur sooner than that, TMT members will be notified by email. If there’s any new information by this Friday, it will be included on the TMT conference call. 4. Start of Night Spill to the gas cap at Little Goose
Discussion of this issue will be included in Friday’s conference call. 5. Lower Monumental Mooring Bracket Installation
COE workers attempted to lower a mooring bit for fish transportation barges, Bernard Klatte (COE) said, but they were unable due to wave action they’d previously underestimated. They considered the possibility of doing the work with spill shifted to other bays but decided the safest procedure would be a one-hour spill outage as soon as possible, either today or tomorrow. NOAA, BPA, BOR and Idaho representatives agreed to the spill outage request; CRITFC said that they were not pleased but would not object and the sooner the better. Oregon also were not pleased but wouldn't object because the work had to be done. Next year, Lower Monumental operations workers now know this installation needs to be done before April 1, Klatte said. COE will issue a teletype for a one-hour outage at 1 or 2 pm today after discussing this with the project.
3
6. Dworshak Operations
The target end of April flood control elevation is 1,572.6 feet; last night the reservoir elevation was 1,572.46 feet, so it’s getting close, Hlebechuk said. Current discharges are 7.6 kcfs. Yesterday, COE planned to go to full load, approximately 10 kcfs. However, Avista is doing line work which puts Dworshak equipment at risk if flows ar increased to full powerhouse. The project will increase to 9.1 kcfs later today, then to full powerhouse the evening of April 26th, Hlebechuk said. The project might have to spill to meet it’s end of month flood control elevation. [Added information from Cathy Hlebechuk: the project will NOT increase discharges until after the line work is done. A new estimated time of completion is tonight.]
7. Next TMT Meeting A conference call was scheduled for 1 pm, April 27, to discuss the May Spring Creek Hatchery release, the start of night spill up to the gas cap at Little Goose, and possibly the start of transportation. The next face-to face meeting will be May 2, 2007. Agenda items for that meeting will include a Priest Rapids update, updated flow forecasts, Dworshak operations, Snake River transportation, chum emergence, finalizing the WMP spring/summer update, and the usual operations review. This meeting summary was prepared by consultant and writer Pat Vivian. Name Affiliation Paul Wagner NOAA Rick Kruger Oregon Russ George WMCI Scott Bettin BPA Cathy Hlebechuk COE Paul Ocker COE Bernard Klatte COE John Roache BOR Russ Kiefer Idaho Tom Lorz CRITFC Mike Butchko Powerex Dave Trager Evista Margaret Filardo FPC Ruth Burris PGE Shane Scott NW River partners Ian Bird Citigroup
4
T E C H N I C A L M A N A G E M E N T T E A MBOR : John Roache / Mary Mellema BPA : Robyn MacKay / Tony Norris / Scott BettinNOAA-F: Paul Wagner / Richard Dominigue USFWS : David Wills / Steve HaesekerOR : Rick Kruger / Ron Boyce ID : Russ KieferWA : Cindy LeFleur MT : Jim Litchfield / Brian Marotz
COE: Cathy Hlebechuk / Jim Adams / Cindy Henriksen
TMT CONFERENCE CALL Friday April 27, 2007 13:00 - 14:00
NOTE: Time & Phone Number 1125 N.W. Couch Street, Suite 4A34
Portland, Oregon 97209
Conference call line: 503-326-7672
To check into the building, take the elevator to the 5th floor and the guard will issue you an ID badge if you need one and will take you down to the 4th floor where the meeting is. If you have NOT attended a TMT meeting in the past you will need to call ahead and let Cathy Hlebechuk (503) 808-3942, Jim Adams (503) 808-3938 or Cindy Henriksen (503) 808-3945 know, so you can be added to the TMT Visitor List and issued an ID badge. This badge may be used indefinitely. If you have attended TMT in the past you may re-use your ID badge
indefinitely. If you are a federal employee you will also need to have an ID badge issued to you which can be used indefinitely.
We have had disruptions on the phone because people are not hitting 'mute' after dial in.Please MUTE your Phone
All members are encouraged to call Robin Harkless with any issues or concerns they would like to see addressed. Please e-mail her at [email protected] or call her at (503) 248-4703.
AGENDA
1. Welcome and Introductions2. Spring Creek Hatchery Release - [SOR #2007-05] Dave Wills, USFWS3. Start Transportation - Paul Wagner, NOAA-F4. Start Night Spill at LGS - Paul Wagner, NOAA-F5. Dworshak Operations - Cathy Hlebechuk, COE6. Other
Set agenda for next meeting - May 02, 2007 [Calendar 2007]
Questions about the meeting may be referred to Cathy Hlebechuk at (503) 808-3942, Jim Adams at (503) 808-3938 or Cindy Henriksen at (503) 808-3945
COLUMBIA RIVER REGIONAL FORUM TECHNICAL MANAGEMENT TEAM
April 27, 2007 Conference Call
FACILITATOR’S SUMMARY NOTES ON FUTURE ACTIONS Facilitator: Robin Harkless
Notes: Erin Halton The following notes are a summary of issues that are intended to point out future actions or issues that may need further discussion at upcoming meetings. These notes are not intended to be the “record” of the meeting, only a reminder for TMT members.
4/27/07 CONFERENCE CALL
Spring Creek Hatchery Release Dave Wills, USFWS, presented SOR 2007-05 on behalf of the salmon managers, noting that this was an attempt to get ahead with an operation to best support the May 1 Spring Creek hatchery release. Mortality rates during the March and April releases were much higher than seen in previous years. The request was based on an operational change made at Bonneville resulting in improvement in survival during the April release: Operating the Powerhouse 2 units with gap closure devices at the low end of 1% efficiency range starting at midnight on May 2 (Tuesday PM/Wednesday AM) and continuing for at least 72 hours or until 95% of the fish have passed the project. In addition, if mortalities reach or exceed 2%, initiate spill to the gas cap. Paul Wagner, NOAA, added that TMT coordination would continue at the May 2 TMT meeting. Dave also reported that coordination had occurred with folks at the juvenile sampling facility, who planned to begin sampling at 4 am on Wednesday, May 2. Questions were raised about numbers of fish: How many expected to reach Bonneville? What is a minimum sample size for 2% mortalities to initiate spill? How do you know when 95% have passed? ACTION: The salmon managers will discuss more specific criteria for minimum sample sizes, per request from the COE and BPA. Additional information about fish numbers will be known next week, and the salmon managers planned to coordinate on passage numbers as they have in past years, with coordination at FPAC and feedback through TMT. There was discussion around the causes of the mortalities, and while nothing is conclusive, the salmon managers did not believe fish density was a factor, and also believed that operating the project as requested would reduce mortalities. It was suggested that a more focused, controlled study should be done to gain more definitive insight as to the cause of the mortalities – the salmon managers agreed that a study should be designed for the future. For this year, the desire was to pass the fish as quickly and safely as possible.
1
ACTION: The COE responded that they planned to implement specification #1 to the request and operate the unit two gap closure devices to the lower end of 1% for 72 hours beginning May 2. For specification #2, the COE would spill up to 100 kcfs per the 2007 spill operations Agreement. If the salmon managers requested anything outside the scope of the Agreement, the COE would need written consent from all the signatories. The salmon managers clarified that the intent of presenting the SOR today was primarily to implement the 72-hour operation request and plan to revisit the issue with TMT next week, and if necessary, request further action. Start of Transportation Operations Paul Wagner, NOAA, reported that fish numbers at Lower Granite were still low, around 20%, and transportation was still on track to begin May 1. It was clarified that collection for research would start April 30, with transportation on May 1. All other transportation operations would start with collection on May 1, and transportation on May 2. Start of Nighttime Spill at Little Goose Paul also reported that nighttime spill to the gas cap at Little Goose was slated to begin at 1800 hours on April 29. The current thinking from the salmon managers was that the operation would go for 14 days, but that conditions would continue to be monitored and changes recommended as necessary and available. The gas cap was expected to be around 30 kcfs, as per the current cap, and again, all would continue to monitor conditions as the operation progresses. Jim Adams, COE, added that the gas cap at Lower Monumental would be lowered later today to about 18.7 kcfs, and may need to be dropped further when gas from the additional nighttime spill at Little Goose arrived at the Lower Monumental and Ice Harbor forebays. Dworshak Operations Cathy Hlebechuk, COE, shared an update that Dworshak began operating to full load on Wednesday evening and would likely continue until next week’s TMT meeting, at which time discussion of the operation will be revisited. Other Paul Wagner inquired about John Day spilling less than 60%. Jim Adams responded that the operation was being driven by elevated TDG levels at The Dalles forebay. Adams also said that he anticipated elevated TDG at The Dalles forebay due to warmer climatic conditions resulting in increased temperatures in the river. Don Faulkner stated that the underwater video camera at John Day was not functioning and that the inspections of the fish screens would have to be delayed until the camera was repaired. He asked TMT members whether it would be O.K. to continue operation of the units until the camera was fixed and the screen inspection could be completed. None of the TMT members objected to this request. Next face-to-face TMT meeting: May 2nd Agenda items will include:
Columbia River Regional Forum Technical Management Team Conference Call
April 27, 2007 1. Welcome and Introductions Today’s TMT conference call was chaired by Cathy Hlebechuk and facilitated by Robin Harkless, with representatives from USFWS, NOAA, BPA, COE, BOR, Idaho and Oregon on the line. The following is a summary (not a verbatim transcript) of the topics discussed and decisions made on the call. Anyone with questions or comments about these notes should provide them to the TMT chair or bring them to the next meeting. 2. Spring Creek Hatchery Release (SOR #2007-05)
David Wills (USFWS) introduced this SOR on behalf of the Salmon Managers. Based on mortality rates observed for the first two Spring Creek Hatchery releases this year, the SOR attempts to be proactive with the hatchery’s last release of the season by asking the Action Agencies to:
1. Operate the units with gap closure devices at the Bonneville Second
Powerhouse at the low end of the 1% efficiency range, beginning at one minute past midnight on May 2 and continuing either for 72 hours or until the majority (95%) of the hatchery fish have passed the project.
2. Increase spill from 100 kcfs to the level of the gas cap spill if mortality rates at
any time meet or exceed 2% of the release. Wills noted that 2% mortality is an order of magnitude above what would
be considered average for this release. Paul Wagner (NOAA) suggested checking in on conditions Wednesday at the next TMT meeting, when the first part of the operation would be in progress. The crew at the juvenile sampling facility planned to be at their station by 4 a.m. Wednesday, May 2, to begin gathering information. Robyn MacKay (BPA) asked, how many fish will be at the project by 4 a.m.? Normal sampling runs from 7 a.m. one day to the next, so the first few hours will be in addition to the normal run, Wills said. Fish could arrive at the project as early as 7 a.m. on May 2.
Bern Klatte (COE) asked, is there a minimum sample size for making the
call that the run is experiencing 2% mortality? What will be the mechanism for determining that 95% of the fish have passed the project? He asked whether that would be coordinated with the COE’s Reservoir Control Center; Wills said yes. Since previous releases have had problems, he asked, why are 3.5 million fish being released all at once? There is no perceived benefit to splitting the release, Wills said. Robyn MacKay asked, can we learn anything from previous releases at Bonneville to solve this problem or learn more about it? It would be good to
4
know whether it’s the gap closures or the powerhouse loading that’s causing the mortalities. A more controlled study would be in order, but there isn’t time for that this year, Wills said. The Salmon Managers’ intention with this SOR is to get the fish out to the ocean as soon as possible with the best survival rates that can be achieved. He emphasized that the conditions called for in the SOR are not intended for testing purposes, they are preventive operations based on lessons learned from the previous April release. Mortality rates declined when the turbine flows were reduced.
The COE will adhere to the 2007 agreement, Bernard Klatte said. If 2%
mortality triggers a request to spill to the spill cap, and it’s over 100 kcfs (the current gas cap at Bonneville), the COE won’t spill to that level unless approved in writing by the signatories to the agreement. Klatte cautioned that the gas cap could go lower by the first few days in May. He asked for specifics regarding the sample size that could trigger such a spill request. BPA would not oppose an increase in spill if mortalities are found to be significant, MacKay said. However, BPA views the 2007 agreement as a contract requiring follow-up with the signatories before the COE can act on a spill request over 100 kcfs. Checking in at the next TMT meeting would give us a better idea of the gas cap at the time of the fish passage, Paul Wagner (NOAA) said.
The COE will implement specification #1 in the SOR, Hlebechuk said. This
operation will continue for 72 hours, unless the Salmon Managers request that it be extended to allow the majority (95%) of the Spring Creek Hatchery fish to continue to pass the project. As for specification #2, the COE will plan on spilling up to 100 kcfs or the spill cap, whichever is lower. If the request to spill is over 100 kcfs, it will require consent in writing from the signatories to the 2007 agreement. Hlebechuk requested more information on sample size; Wills said he would ask for specifics from the workers at the juvenile facility who will be doing the sampling. Klatte said he would write a draft teletype for USFWS and NOAA to review, depending on the outcome of coordinating the signatories to the 2007 agreement. TMT will address this issue again on May 2. 3. Start of Transportation
May 1 still appears to be the appropriate day to begin transporting fish, Wagner said. Approximately 20% of the Spring Chinook run are gathered at Lower Granite now; the percentage for steelhead is lower than that. These fish will be collected beginning May 1 and transported beginning May 2. There will also be fish collected for research purposes on April 29 and transported May 1. 4. Start of Night Spill to the Gas Cap at Little Goose
At a recent FPAC meeting, the salmon managers agreed to request the start of night spill to the gas cap at Little Goose at 1800 hours beginning the evening of April 29, Wagner said. The operation will continue for 14 days and
5
must be finished by May 15, so there’s not much room to adjust the schedule. The current spill cap at Lower Monumental is 21.4 kcfs, Jim Adams (COE) said. Due to exceedances at Ice Harbor forebay over the past 5 days, the COE has reduced the spill cap at Lower Monumental to 18.7 kcfs. When Little Goose starts spilling to the spill cap during nighttime hours, and the gas reaches the Ice Harbor forebay, the COE will no doubt lower the spill cap at Lower Monumental even further, Adams said. This risk is compounded by the fact that temperatures are getting warmer. The current spill cap at Little Goose is 30.6 kcfs, and spill has been in the 40-60 kcfs range, so there should be a sustained 30 kcfs flow rate all night long, Adams said. Flow rates might stay the same or increase, but are unlikely to decrease. 5. Dworshak Operations
Dworshak went to full load April 26 at 9,800 cfs, Hlebechuk said. This is expected to pass inflows through the end of April. She will email TMT members if there is a change in the current operations. 6. Other – John Day Issues
Wagner asked about the spill cap at John Day. It was 130 cfs on April 20-
21, and there were TDG exceedances, Adams said. Therefore the spill cap was reduced to 120, and TDG levels dropped to 119.7% on April 23, then to 118.9% on April 26. The problem with the spill cap at John Day isn’t in the tailwater but the forebay at The Dalles, he explained. TDG levels there reached 114.3% on April 26 and have been increasing. The COE has learned there’s a range of spill rates at John Day (from around 95 -115 cfs, and especially around 105 -110 cfs) which will almost certainly result in TDG exceedances at The Dalles, despite what the gage downstream shows. So the COE might need to lower the gas cap to 90 cfs or even 85 cfs at John Day.
The video inspection camera at John Day broke in the middle of an
inspection, Don Faulkner (COE) said. Workers at the project have requested that inspection of the video camera be delayed for a few weeks until it can be repaired. Wagner said that would probably be fine, and that he would find out for sure on Monday, April 30. 7. Next TMT Meeting The next meeting will be face to face on May 2, 2007. Agenda items will include Dworshak operations, updated ESP and STP runs, a Snake River transportation update, the Spring Creek Hatchery release, a Priest Rapids update, chum emergence, the sturgeon pulse, the WMP spring/summer update, and the usual operations review. This meeting summary prepared by consultant and writer Pat Vivian.
6
Name Affiliation Rick Kruger Oregon David Wills USFWS Paul Wagner NOAA Robyn MacKay BPA Cathy Hlebechuk COE Mary XXX BOR Bernard Klatte COE Don Faulkner COE Jim Adams COE Cindy Henriksen COE Russ Kiefer Idaho
7
T E C H N I C A L M A N A G E M E N T T E A MBOR : John Roache / Mary Mellema BPA : Robyn MacKay / Tony Norris / Scott BettinNOAA-F: Paul Wagner / Richard Dominigue USFWS : David Wills / Steve HaesekerOR : Rick Kruger / Ron Boyce ID : Russ KieferWA : Cindy LeFleur MT : Jim Litchfield / Brian Marotz
COE: Cathy Hlebechuk / Jim Adams / Cindy Henriksen
TMT MEETING Wednesday May 02, 2007 09:00 - 12:00
1125 N.W. Couch Street, Suite 4A34 Portland, Oregon 97209
Conference call line: 503-808-5190
To check into the building, take the elevator to the 5th floor and the guard will issue you an ID badge if you need one and will take you down to the 4th floor where the meeting is. If you have NOT attended a TMT meeting in the past you will need to call
ahead and let Cathy Hlebechuk (503) 808-3942, Jim Adams (503) 808-3938 or Cindy Henriksen (503) 808-3945 know, so you can be added to the TMT Visitor List and issued an ID badge. This badge may be used indefinitely. If you have attended TMT in the
past you may re-use your ID badge indefinitely. If you are a federal employee you will also need to have an ID badge issued to you which can be used indefinitely.
We have had disruptions on the phone because people are not hitting 'mute' after dial in.Please MUTE your Phone
All members are encouraged to call Robin Harkless with any issues or concerns they would like to see addressed. Please e-mail her at [email protected] or call her at (503) 248-4703.
AGENDA
1. Welcome and Introductions2. Review [Meeting Minutes] 3. Priest Rapids Update - [Priest Rapids Operations 2007] Russell Langshaw, Grant Co. PUD4. Spring Creek Release - Dave Wills, USF&WS5. Updated Flow Forecasts - Cathy Hlebechuk, COE
a. Libbyi. [Libby ESP Hydrographs] ii. [Libby ESP Inflows - Daily Box-Whiskers Plot]
b. Dworshaki. [Dworshak ESP Hydrographs] ii. [Dworshak ESP Inflows - Daily Box-Whiskers Plot]
iii. [DWR Apr-Jul Volume Forecast Comparison] iv. [Dworshak Augmentation Volumes]
c. Hungry Horsei. [Hungry Horse ESP Hydrographs] ii. [Hungry Horse ESP Inflows - Daily Box-Whiskers Plot]
6. Sturgeon Pulse - Cathy Hlebechuk, COEi. [Summary of 01 May 2007 ESP Libby Operations - Proposed Pulse]
ii. [Summary of 01 May 2007 ESP Libby Operations - Standard Pulse]
7. Dworshak Operations - Cathy Hlebechuk, COE
i. [Dworshak Outflows ]
ii. [DWORSHAK END OF MONTH ELEVATIONS]
iii. [DWORSHAK ESP VOLUMES]
8. Snake River Transport - Paul Wagner, NOAAF9. Little Goose Nighttime spill - Paul Wagner, NOAAF
10. Chum Emergence - Rick Kruger, ODF&Wi. [2007 Chum Salmon Catch in the Ives Island Area]
ii. [Timing of Chum Fry Emergence and Catch in the Ives Island Area, 1999 - 2007]
After sturgeon volume is exhausted in July, project operates to a flat flow to reach elevation 2439.0 feet on 31 August.
VARQ outflow calculations were based on starting VARQ flows on 28 April.
Sturgeon pulse begins on 01 June for all years. Outflow is increased to full load through 05 June and then decreased to 15 kcfs (unless VARQ flow is higher). On 01 July outflow is increased to 20 kcfs and held until volume is exhausted.
Project will operate at 14.4 kcfs (first VARQ flow) through 08 May. After that, VARQ outflow is based on each ESP years volume.
VARQ flows continue through the end of June as a minimum.
LIBBY ESP VOLUMES
6939
4000
5000
6000
7000
8000
9000
10000
13579111315171921232527293133353739414345
No. EXCEEDANCES OUT OF 45
APR
- A
UG
VO
L (k
af)
LIBBY MAX ELEVATION (MAY - AUGUST)
2,454.2
2,435.0
2,440.0
2,445.0
2,450.0
2,455.0
2,460.0
13579111315171921232527293133353739414345
No. EXCEEDANCES OUT OF 45
ELEV
ATI
ON
(ft)
START OF VARQ OPERATIONS
28-Apr
18-Apr
20-Apr
22-Apr
24-Apr
26-Apr
28-Apr
30-Apr
2-May
4-May
6-May
8-May
13579111315171921232527293133353739414345
No. EXCEEDANCES OUT OF 45
VAR
Q S
TAR
T D
ATE
LIBBY END OF MONTH ELEVATIONS
2,386.1
2,408.8
2,448.2
2,360.0
2,380.0
2,400.0
2,420.0
2,440.0
2,460.0
13579111315171921232527293133353739414345
No. EXCEEDANCES OUT OF 45
ELEV
ATI
ON
(ft)
30 APR Elev 31 MAY Elev 30 JUNE Elev
LIBBY END OF JUNE ELEVATION
2,448.2
2,410.0
2,420.0
2,430.0
2,440.0
2,450.0
2,460.0
13579111315171921232527293133353739414345
No. EXCEEDANCES OUT OF 45
ELEV
ATI
ON
(ft)
LIBBY END OF JULY ELEVATION
2,451.6
2,430.0
2,435.0
2,440.0
2,445.0
2,450.0
2,455.0
2,460.0
13579111315171921232527293133353739414345
No. EXCEEDANCES OUT OF 45
ELEV
ATI
ON
(ft)
LIBBY PERIOD AVERAGE OUTFLOWS
1437014020
0
10000
20000
30000
40000
13579111315171921232527293133353739414345
No. EXCEEDANCES OUT OF 45
FLO
W (c
fs)
May 1-15 May 16-31
LIBBY PERIOD AVERAGE OUTFLOWS
18903
15000
0
10000
20000
30000
40000
50000
13579111315171921232527293133353739414345
No. EXCEEDANCES OUT OF 45
FLO
W (c
fs)
Jun 1-15 Jun 16-30
LIBBY PERIOD AVERAGE OUTFLOWS
20216
19644
0
10000
20000
30000
40000
50000
13579111315171921232527293133353739414345
No. EXCEEDANCES OUT OF 45
FLO
W (c
fs)
Jul 1-15 Jul 16-30
Libby Outflows
0
10000
20000
30000
40000
50000
1-Apr 1-May 1-Jun 1-Jul 1-Aug2007
Out
flow
(cfs
)
25th Percentile 75th Percentile Daily Mean Observed Outf low
LIBBY OUTFLOW ANALYSIS
20000
22000
24000
26000
28000
30000
32000
34000
36000
38000
40000
13579111315171921232527293133353739414345
No. EXCEEDANCES OUT OF 45
PEA
K D
AIL
Y O
UTF
LOW
(CFS
0
5
10
15
20
25
30
35
40
45
DA
YS O
F SP
ILL
Peak Outf low Days of Spill
BONNERS FERRY STAGESMaximum Simulated Stage
1759.5
1758.41757.3
1756
1758
1760
1762
1764
1766
1768
13579111315171921232527293133353739414345
No. EXCEEDANCES OUT OF 45
BO
NN
ERS
FER
RY
STA
GE
(FT
Summary of 01 May 2007 ESP Libby Operations - Standard Pulse 1-May-07
No double peaking after the sturgeon pulse was allowed unless needed to avoid filling and spilling. Starting after the Sturgeon pulse a flat flow was targeted to reach elevation 2439.0 feet by the end of August.
VARQ outflow calculations were based on starting VARQ flows on 28 April.
Sturgeon pulse begins on 25 May for all years. Volume of pulse is based on each years Apr - Aug volume. Pulse starts at 26 kcfs and holds until the volume is exhausted.
Project will operate at 14.4 kcfs (first VARQ flow) through 08 May. After that, VARQ outflow is based on each ESP years volume.
VARQ flows continue through the end of June as a minimum.
LIBBY ESP VOLUMES
6939
4000
5000
6000
7000
8000
9000
10000
13579111315171921232527293133353739414345
No. EXCEEDANCES OUT OF 45
APR
- A
UG
VO
L (k
af)
LIBBY MAX ELEVATION (MAY - AUGUST)
2,447.4
2,435.0
2,440.0
2,445.0
2,450.0
2,455.0
2,460.0
13579111315171921232527293133353739414345
No. EXCEEDANCES OUT OF 45
ELEV
ATI
ON
(ft)
START OF VARQ OPERATIONS
28-Apr
18-Apr
20-Apr
22-Apr
24-Apr
26-Apr
28-Apr
30-Apr
2-May
4-May
6-May
8-May
13579111315171921232527293133353739414345
No. EXCEEDANCES OUT OF 45
VAR
Q S
TAR
T D
ATE
LIBBY END OF MONTH ELEVATIONS
2,386.1
2,405.2
2,437.6
2,360.0
2,380.0
2,400.0
2,420.0
2,440.0
2,460.0
13579111315171921232527293133353739414345
No. EXCEEDANCES OUT OF 45
ELEV
ATI
ON
(ft)
30 APR Elev 31 MAY Elev 30 JUNE Elev
LIBBY END OF JUNE ELEVATION
2,437.6
2,410.0
2,420.0
2,430.0
2,440.0
2,450.0
2,460.0
13579111315171921232527293133353739414345
No. EXCEEDANCES OUT OF 45
ELEV
ATI
ON
(ft)
LIBBY END OF JULY ELEVATION
2,446.9
2,430.0
2,435.0
2,440.0
2,445.0
2,450.0
2,455.0
2,460.0
13579111315171921232527293133353739414345
No. EXCEEDANCES OUT OF 45
ELEV
ATI
ON
(ft)
LIBBY PERIOD AVERAGE OUTFLOWS
14370
18014
0
10000
20000
30000
40000
13579111315171921232527293133353739414345
No. EXCEEDANCES OUT OF 45
FLO
W (c
fs)
May 1-15 May 16-31
LIBBY PERIOD AVERAGE OUTFLOWS
26000
20109
0
10000
20000
30000
40000
50000
13579111315171921232527293133353739414345
No. EXCEEDANCES OUT OF 45
FLO
W (c
fs)
Jun 1-15 Jun 16-30
LIBBY PERIOD AVERAGE OUTFLOWS
16118
16115
0
10000
20000
30000
40000
50000
13579111315171921232527293133353739414345
No. EXCEEDANCES OUT OF 45
FLO
W (c
fs)
Jul 1-15 Jul 16-30
Libby Outflows
0
10000
20000
30000
40000
50000
1-Apr 1-May 1-Jun 1-Jul 1-Aug2007
Out
flow
(cfs
)
25th Percentile 75th Percentile Daily Mean Observed Outf low
LIBBY OUTFLOW ANALYSIS
20000
22000
24000
26000
28000
30000
32000
34000
36000
38000
40000
13579111315171921232527293133353739414345
No. EXCEEDANCES OUT OF 45
PEA
K D
AIL
Y O
UTF
LOW
(CFS
0
5
10
15
20
25
30
35
40
45
DA
YS O
F SP
ILL
Peak Outf low Days of Spill
BONNERS FERRY STAGESMaximum Simulated Stage
1758.9
1760.6
1759.6
1756
1758
1760
1762
1764
1766
1768
13579111315171921232527293133353739414345
No. EXCEEDANCES OUT OF 45
BO
NN
ERS
FER
RY
STA
GE
(FT
Timing of Chum Fry Emergence and Catch in the Ives Island Area, 1999 - 2007
1998
1999
2000
2001
2002
2003
2004
2005
2006
2007
2008
21-Jan
28-Jan
4-Feb
11-Feb
18-Feb
25-Feb
4-Mar
11-Mar
18-Mar
25-Mar
1-Apr
8-Apr
15-Apr
22-Apr
29-Apr
6-May
13-May
20-May
27-May
3-Jun
10-Jun
17-Jun
24-Jun
1-Jul
Date
Yea
r
Predicted EmergenceCatchPeak OccuranceProjected
52 142
Priest Rapids Operations 2007
90
120
150
180
210
240
16-Apr
17-Apr
18-Apr
19-Apr
20-Apr
21-Apr
22-Apr
23-Apr
24-Apr
25-Apr
26-Apr
27-Apr
28-Apr
29-Apr
Dis
char
ge in
kcf
s
90
120
150
180
210
240Flow Band
Daily delta
Number of exceedances: 0
5/2/2007
Dworshak Augmentation VolumesESP inflows and 01-May Water Supply Forecast
0
500
1000
1500
2000
2500
3000
3500
1979
1975
1983
1949
1973
1962
1963
1986
1965
1966
1976
1982
1972
1955
1974
1978
1951
1961
1988
1950
1992
1967
1987
1959
1956
1969
1968
1964
1977
1984
1989
1985
1991
1960
1970
1954
1953
1958
1993
1952
1990
1981
1971
1980
1957
30%
50%
70%
ESP Years and 1 April Water Supply Forecasts
Apr
il-Ju
ne R
unof
f in
KA
F..
AugmentationVolume
Volume to Fill
MinFlow (1.5 kcfs)Volume:Date to 30-JuneRunoff Volume toDate
ESP 75th PrecentileESP 25th PercentileObserved FlowsESP Daily Mean
Whiskers: ESP Daily Max/Min
ESP flows updated 01-May-2007
This plot displays the daily range of flows from the ESP hydrographs. Fifty percent of the ESP flows fall within the narrow shaded rectangles and the daily extremes of the ESP flows are bound by the "whiskers".
Libby ESP Inflows - Daily Box-Whiskers Plot
0
20000
40000
60000
80000
100000
120000
140000
1-Mar 1-Apr 1-May 1-Jun 1-Jul
2007
Dai
ly In
flow
in c
fs__
ESP 75th PrecentileESP 25th PercentileObserved FlowsESP Daily Mean
Whiskers: ESP Daily Max/Min
ESP flows updated 01-May-2007
This plot displays the daily range of flows from the ESP hydrographs. Fifty percent of the ESP flows fall within the narrow shaded rectangles and the daily extremes of the ESP flows are bound by the "whiskers".
COLUMBIA RIVER REGIONAL FORUM TECHNICAL MANAGEMENT TEAM
May 2, 2007 Meeting
FACILITATOR’S SUMMARY NOTES ON FUTURE ACTIONS Facilitator: Robin Harkless
Notes: Erin Halton The following notes are a summary of issues that are intended to point out future actions or issues that may need further discussion at upcoming meetings. These notes are not intended to be the “record” of the meeting, only a reminder for TMT members. Nighttime Spill at Little Goose Jim Adams, COE, said that night spill of 29.3 kcfs at Little Goose began at 1600 hours on 4/29, and that gas levels of 115.6-118.6% at the Lower Monumental forebay were reported on 5/1. Adams said the rise in gas levels would likely prompt a drop in spill rates, likely down to 26.5 kcfs. He added that there had been some TDG exceedances at Ice Harbor, and that spill rates would likely be lowered there as well. Questions were raised as to whether there may be any errors in the Fixed Monitoring Station (FMS) readings at Ice Harbor or Lower Monumental; TMT Cathy Hlebechuk sent out the following email after the meeting:
“Due to the concerns of higher percent TDG readings at the Ice Harbor forebay gage (IHRA) compared to the Lower Monumental tailwater gage (LMNW), the USGS contractor went out to both sites and checked the TDG probes. The contractor reported today that both TDG probes are performing within specifications and did not require recalibration.”
Spring Creek Release Dave Wills, USFWS, reported that the final release from the Spring Creek Hatchery went out on 5/1; Margaret Filardo, Fish Passage Center, said 1536 fish had arrived at the project by 0250 hours on 5/2, and that samples showed mortality rates of 0.13%. Cathy Hlebechuk, COE, said that the COE planned to implement SOR # 2007-5 as submitted, with the caveat of further TMT discussion of the operation if there is a need to operate outside the 2007 spill operations Agreement.
Action/Next Steps: TMT will discuss the operation at the meeting on 5/9, with offline coordination between the COE, Dave Wills and Paul Wagner, NOAA, in the interim if necessary.
Priest Rapids Operations Update Russell Langshaw, Grant County PUD, updated TMT on Priest Rapids operations; he referred to a graph posted to the TMT agenda, showing no exceedances of the flow bands. He noted that the installation of the new program had helped the success of the operation and that weekend provisions would begin on 5/5.
Action/Next Steps: Langshaw will provide another update on the flow protection operation at the 5/9 TMT meeting.
1
May 1 Inflow Forecasts Cathy Hlebechuk, COE, referred TMT to inflows/whiskers plots and STP/ESP hydrographs for Libby, Dworshak and Hungry Horse, updated as of 5/1 and posted on the TMT website. She added that the Dworshak April-July volume forecast shows a downward trend, with the 5/1 forecast of 1868 kaf, and augmentation volume range of 364 kaf minimum and 942 kaf maximum.
Action/Next Steps: Flow forecasts will be on the agenda for the 5/9 TMT meeting.
Sturgeon Pulse Operations Jason Flory, USFWS, shared information from a Libby BiOp policy team that has been discussing a Libby operations flow implementation plan for sturgeon. The group includes representatives from the Kootenai and Kootenai-Salish Tribes, Idaho, Montana, COE, USFWS, and BPA. The policy team put together a technical group to develop recommendations for sturgeon operations for 2007, and was scheduled to review those recommendations on 5/3. Jason reported that rather than develop a specific operation, the technical team developed criteria and triggers to guide decisions to start and shape the pulse based on river temperature, presence of fish and lower elevation runoff. In addition, the policy group has been looking at restoration of the river reach above Bonners Ferry to increase the depth in the area for sturgeon. This year’s plan was drafted and involves sampling of the area to determine the substrate of the riverbed. Unfortunately, the barge that would be needed to do the sampling work may not be available until July (it is currently in the Gulf of Mexico.) The policy group is exploring alternative options for doing this work. One option is to shape Libby volumes for sturgeon differently, and a scenario was developed by the COE and shared with TMT. Essentially it would shift the pulse to later in the summer. Several graphs were posted to the TMT web page modeling the scenario compared to the standard pulse operation. It was noted that the scenario is just one option and that other options were still being explored by the technical and policy groups. Montana expressed concern that the option presented would initiate a ‘double peak’ with flows dropping dramatically in September. Montana stated its preference for a stable operation after the summer peak, similar to what was implemented in 2006.
Action/Next Steps: This item will be revisited at the 5/9 TMT meeting, after additional discussions occur amongst the Libby BiOp Policy Team and more information is gathered.
Dworshak Operations Cathy Hlebechuk, COE, referred TMT to graphs linked to the TMT agenda that showed daily outflows and extremes of ESP flows. She said that the new end of May flood control target elevation was 1595.1', and that the project would be at full load through the following week. Average ESP volumes were 1952 kaf.
Next Steps: The COE will keep TMT updated as the operation progresses, and Dworshak Operations will be on the agenda for the 5/9 TMT meeting.
Snake River Transportation Operations
2
Paul Wagner, NOAA, referred to the DART page linked to the TMT agenda, showing in-season fish forecasts based on pit tag detections through 5/1. He said that Lower Granite collection began on 5/1, and that transport at Little Goose planned to start eight days after Lower Granite, with collection on 5/8 and transport on 5/9.
Action/Next Steps: Snake River Transport will be on the agenda for the 5/9 TMT meeting.
Chum Emergence Two graphs were linked to the TMT agenda, with one showing the spike indicating continued chum emergence and need for continued elevation protection, and the other showing 1999-2007 compared timing of chum emergence.
Action/Next Steps: Chum emergence will be on the agenda for the 5/9 TMT meeting.
Water Management Plan Spring/Summer Update Bernard Klatte, COE, said that the comments received were posted on the TMT website, and that IT would discuss the draft at its meeting on 5/3.
Action/Next Steps: Following IT review, TMT will finalize the draft at the 5/9 meeting.
Operations Review Reservoirs – Grand Coulee was at 1249.5'; Hungry Horse was at 3538.24', releasing 7.8 kcfs and planning to hold outflows until the final end of May forecasts become available. Libby was at 2386.15', with outflows of 19.3 kcfs and inflows of 20 kcfs. Dworshak was at 1574.2', with inflows of 14 kcfs. Albeni Falls was at 2056' and releasing 33 kcfs. The seven-day average at Priest Rapids was 163.6 kcfs, McNary was averaging 226.4 kcfs, and Lower Granite was averaging 48.7 kcfs. Fish – Paul Wagner, NOAA, referred to the Fish Passage Center website and said that passage numbers were seeing a climb in steelhead, and that numbers were generally up at Lewiston, John Day and Bonneville. Cindy LeFleur, WA, said that adult counts for Spring Chinook were discussed at TAC, and were still forecasted for about 86,000. She noted that jack counts were looking good, with a count of 1,649.
Action: Cindy LeFleur will provide a graph of adult counts for the 5/9 TMT meeting.
Power – nothing to report Water quality – Laura Hamilton, COE, referred to a graph linked to the TMT agenda, showing TDG exceedances at Ice Harbor. Next face-to-face TMT meeting: May 9th NOTE: location change: NOAA Fisheries, Willamette Conference Room Agenda items will include: • Spill Operations • Spring Creek Hatchery Release
3
• Dworshak Operations • Updated ESP / STP Model Runs • Snake River Transportation • Priest Rapids Update • Chum Emergence • Sturgeon Pulse / Libby Operations • WMP Spring/Summer Update – Comments Finalized • Night Spill at Little Goose • Operations Review
4
Columbia River Regional Forum Technical Management Team Meeting
May 2, 2007 1. Welcome and Introductions Today’s TMT meeting was chaired by Cathy Hlebechuk and facilitated by Robin Harkless, with representatives from CRITFC, BPA, COE, BOR, USFWS, NOAA, Idaho and Washington attending in person or by phone. The following is a summary (not a verbatim transcript) of the topics discussed and decisions made at the meeting. Anyone with questions or comments about these notes should provide them to the TMT chair or bring them to the next meeting. 2. Review Meeting Minutes TMT minutes for meetings through April 27, 2007, have been posted for review. Robin Harkless (DS Consulting) suggested that all meeting minutes to date be reviewed and finalized at the next TMT meeting. She also proposed that comments on either the facilitator’s notes or official minutes be aired in subsequent meetings so the comments can become part of the official record of that meeting. 3. Little Goose Nighttime Spill This operation has been initiated by the salmon managers, Wagner said. Nighttime spill began at 6 pm Sunday, April 29, with a 30.4 kcfs spill cap, Jim Adams (COE) reported. The project was spilling 29.3, close to 30 kcfs, and the gas levels at Lower Monumental were below the 115% criteria until 4 pm, May 1, when they rose to 115.6% in the Lower Monumental forebay. Since then, gas levels at night have gone as high as 118.6%, so it’s highly likely the COE will drop the spill cap at Little Goose by 2 or 3 stops (26.5 kcfs is 2 stops lower). At 30% spill, flows were about 20-22 kcfs with no exceedances, Adams said.
Meanwhile, there has been trouble in Ice Harbor forebay. On May 1, gas levels were 115.6%, meaning the COE will probably lower the spill cap at Lower Monumental, currently 15.4 kcfs. With higher gas levels coming from Little Goose, it’s possible the COE will need to lower the spill cap even further. When flows are up at Little Goose, the default operation is to spill 30%, so when flows increase there, spill does too, and gas levels rise as a result. Adams speculated that higher flows at Lower Monumental would mean more generation, which would provide some diluting impact on gas levels in the Ice Harbor forebay. Paul Wagner (NOAA) asked whether the SYSTDG model has been helpful in dealing with this problem. It works well as a predictor in some locations, but not others, Adams said. For difficult sites like Ice Harbor, COE looks at weather conditions and calculates predictions manually instead of relying on
5
SYSTDG modeling. Laura Hamilton (COE) explained that SYSTDG sometimes predicts conditions well at Lower Monumental, and sometimes not. For example, in summer 2005, what actually happened at Lower Monumental was very different from the modeled predictions. The same phenomenon appears to be happening now. Hamilton ran SYSTDG for several days to see whether lowering the spill cap at Lower Monumental would do some good. She ran it down to zero, and the model was still showing exceedances at Ice Harbor.
Margaret Filardo (FPC) asked, does SYSTDG predict lower TDG levels at Ice Harbor than in the Lower Monumental tailwater? The probability of gas generation being higher at Ice Harbor as a result of decreased spill at Lower Monumental is worth looking into, she said. TDG levels at Ice Harbor are a function not only of spill at Lower Monumental, but also what’s passing through the powerhouse, Adams said. However, TDG levels in the Lower Monumental forebay were lower than at Ice Harbor several days ago. Nevertheless, Adams said, Filardo’s point is a valid one, and if values at ICH continue to be higher than at LMN, the gage should be checked to ensure that it’s working properly.
(That afternoon, Hlebechuk sent an email to TMT members: “Due to the
concerns of higher percent TDG readings at the Ice Harbor forebay gage compared to the Lower Monumental tailwater gage, the USGS contractor went to both sites and checked the TDG probes. The contractor reported today that both TDG probes are performing within specifications and did not require recalibration.”). 4. Spring Creek Release
The final 2007 release left Spring Creek Hatchery at 9:45 am on May 1, David Wills (USFWS) said. The fish began arriving at Bonneville at 2:50 am today, Filardo said. As of this meeting, researchers had observed a 0.13% mortality rate, with a scaling rate of 0.07%, and 0.2% for other injuries, based on sub-samples. These are good results, and sub-sampling will continue at intervals of approximately 3-4 hours, depending on the numbers of fish coming in.
Since last Friday’s conference call, the COE held internal discussions and
decided to implement both provisions of SOR 2007-05, including provision #2 which calls for spill above 100 kcfs if mortality goes above 2% and the spill cap is above 100 kcfs, Hlebechuk said. The minimum sample size to be used for determining mortality rates is 500 fish. Adams noted that the current spill cap at Bonneville is 94 kcfs, therefore provision #2 might not come into play. Wills expressed appreciation for the COE’s willingness to take that extra step if it conforms to state water quality standards.
6
5. Priest Rapids Update
Russell Langshaw (Grant County PUD) presented a chart attached to today’s agenda on the TMT calendar. During the previous two weeks, project inflows set Priest Rapids Dam discharge delta constraints (flow bands) at 60 kcfs and mean daily discharge was in range of 153-180 kcfs. Daily outflow deltas have ranged from 9.8 to 52.3 kcfs.
The weekend provision requiring weekend minimums based on average daily minimums of the previous Monday through Thursday will start May 5th. Accumulated Temperature Units (TU’s) are now at 820 since the end of the spawning period. The weekend provision is initiated at 800 TU’s and will continue for four consecutive weekends. The rearing period protections will continue until 400 TU’s have accumulated after the end of the emergence period.
This program is looking good this year, Wagner noted. Langshaw will provide another update at the May 9 TMT meeting. 6. Updated Flow Forecasts
Cathy Hlebechuk (COE) presented the current hydrographs and box whiskers plots for Libby, Dworshak and Hungry Horse that are linked to today’s agenda. She reminded TMT that the first 10 days of the run are a deterministic run with forecasted temperatures and precipitation rates, so they’re identical for each year. Beyond that, historical temperatures and precipitation for each year yield 45 individual traces. At Dworshak, inflows in May are generally higher than in June. Litchfield noted that these graphics have helped him understand the level of uncertainty involved in predicting inflows Hlebechuk presented four graphics depicting water supply forecasts for Dworshak: ESP hydrographs, inflows (daily box whiskers), the Dworshak April-July volume forecast comparison, and Dworshak augmentation volumes. Randy Wortman (COE) noted that the ESP volume forecast for April-July has been going down, and the COE’s regression forecast has also been declining, so they’re not far apart at this point. Things will change when the RFC forecast for May becomes available next week. Based on this ESP’s Dworshak augmentation volumes range from a minimum of 364 kaf and a maximum of 942 kaf, Hlebechuk said. Yesterday was the last warm day for awhile in the Hungry Horse area, John Roache (BOR) said. There were record highs close to 80 degrees, with peak outflows today around 12 kcfs, expected to drop. According to the ESP plots, it looks like peak flows will occur earlier this year. Historically, the peak occurs around the end of May or early June.
7
7. Sturgeon Pulse
Jason Flory (USWFS Spokane) presented charts depicting two scenarios for shaping sturgeon flows. Background: in 2006, the USFWS BiOp on Libby operations asked the COE to provide a flow implementation plan to achieve habitat the USFWS thought sturgeon needed. The USFWS formed a sturgeon policy group that discussed various powerhouse and stack flow operations with the COE, exchanging letters on this in early May of 2006. This year, the sturgeon policy group formed a technical team to provide advice on how to best use the available 2007 volume for sturgeon. USFWS has provided its recommendations to the policy team, which is in the process of reviewing and decision making. The technical team found it difficult to recommend a specific starting date for the sturgeon operation, Flory said. Instead of a firm date, the team developed criteria to help guide the start of sturgeon operations and shaping of the flows. River temperatures, the presence of fish in staging areas, and low elevation runoff are the three major criteria USFWS thinks should trigger the sturgeon pulse.
USFWS also recommended that the Action Agencies begin restoration of
the braided reach on the Kootenai River above Bonners Ferry, where conditions might be compatible for sturgeon if the channel were deepened. Core samples of the substrate under the river are needed for the study, and USGS will need a barge with coring equipment there in June to take advantage of the high flows associated with the sturgeon pulse. Higher flows are needed in the river to float the barge to its sampling sites. However, the contractor that owns the barge says it’s now in the Gulf of Mexico and can’t get to Bonner’s Ferry until July, when the sturgeon flows will have ended. Because of that USFWS is exploring other options for getting the coring done. One of them is to use the sturgeon volume coming out of Libby a little differently, Flory said.
USGS estimates that 20 kcfs will be needed to provide the proper depth
for the barge to float. This water would be needed for the first two and a half weeks in July – if that is the chosen option. USFWS and USGS are still exploring other options in terms of getting the work done. They’ve submitted a request for use of sturgeon flows to the COE’s Reservoir Control Center, which responded with updated models of what flows would be in the Kootenai River and (WHICH) reservoir, based on USGS’s estimate of 20 kcfs needed to float the barge.
Another possible option is finding a different contractor, Flory said.
However, contractors with the right equipment for that kind of work are rare. Yet another option is coring along the shoreline instead of in the river. Flory emphasized that alternatives are still being explored.
Comparing the two scenarios: The proposed sturgeon pulse will start on
June 1, when Libby ramps up to full load and releases a small pulse for 5 days, Paul Koski (COE) said. Under the proposed sturgeon pulse, on June 5 outflows would be reduced to 15 kcfs, unless VARQ flows are higher than that. Then on
8
July 1, to accommodate the coring operation, outflows would increase to 20 kcfs and stay at that rate until the sturgeon volume is exhausted. Modeling the proposed pulse with the 45 different ESP inflows results in Libby reservoir reaching 45 different peak elevations. In the proposed pulse, VARQ flows serve as minimum flows through June, until the sturgeon pulse starts.
Under the standard pulse scenario, the pulse was modeled to start on May 25 all of the sturgeon volume would be exhausted in mid-June, and the system would go to flat flows to reach 2439’ by the end of August. Based on this week’s ESP the mean maximum elevation at Libby Reservoir would be 2,447.4 feet, as opposed to 2,454.2 feet under the scenario proposed to accommodate the river coring. Under the proposed scenario, Libby Reservoir refilled to within 5 feet of full in approximately half of the years studied. Under the standard pulse scenario, Libby Reservoir reached within 5 feet of full in only 6 or 7 years of the 45 years studied. In general, monthly pool elevations will be higher if the volume is pushed to later in the season than if it is exhausted by mid- June.
The model analysis also addressed the likelihood of spill under both
scenarios. Under the standard scenario, the sturgeon volume is released earlier and there is spill in 3 years out of 45 (one of these was required spill under VARQ rules). By contrast, if the water is pushed to later in the summer to accommodate the coring, there was spill in 7 years out of 45. This resulted in a peak elevation of 1759 feet or higher at Bonner’s Ferry in half of the years. Elevations were approximately a foot higher under the standard pulse scenario as this scenario involves more overlap with low elevation runoff than the proposed scenario. Hlebechuk summed up the comparison by saying that the analysis showed a chance of spilling 3 times greater with a delayed sturgeon pulse.
Scheduling the pulse for late May and the first few days of June appears
to be optimal from Montana’s standpoint, Brian Marotz (Montana) said. He favored shifting the pulse from the first week of June to the last week in May.
The plan for the barge appears to create a significant peak in July, but
maintaining flows of 20 kcfs for the barge through July and then dropping them through Sept is not the stable operation Montana prefers, Jim Litchfield (Montana) said. Montana prefers a gradual decline after the spring freshet, which should be allocated where it can provide maximum benefit for sturgeon, then stable or declining flows through the end of September, Marotz said. Litchfield asked, what is the difference between coring in the channel and on shore? Bedrock is critical, Scott Bettin (BPA) said. The project involves digging 65 feet down and moving approximately 75 million cubic yards of material from the bottom of the river, so it’s imperative to find out whether that material is sand, clay or gravel. The dredging operation is planned for the fall and winter of 2010-11. Marotz said the BiOp calls for project implementation to begin in 2009, and dredging to begin in the spring of 2010. The group agreed to check in on this agenda item at the next TMT meeting.
9
10
8. Dworshak Operations
Dworshak has been at full load and is now in refill mode, Hlebechuk said. She asked the salmon managers how they wanted the refill shaped from now until the end of June. She presented graphs showing Dworshak outflows, end of month elevations, and ESP volumes. Under a scenario of full outflows for another week (per Salmon Manager request), then dropping to outflows of 5 kcfs for the rest of May, the outflow needed to refill by the end of June in the driest ESP year was minimum flow of 1500 cfs. In the model, the target elevation for May was 1,595 feet; for June, 1,600 feet. Hlebechuk presented a graph showing the range of ESP volumes (1,600-2,300 kaf) with an average of 1,952 kaf. The May final forecast is 1,868 kaf, approximately 110 kaf lower than the April final forecast.
Hlebechuk asked the salmon managers to keep in touch with the COE
regarding how they want this water shaped. TMT will check in on Dworshak operations at its next meeting May 9. In the meantime, the project will continue to operate at full load at the request of the Salmon Managers in an attempt to get the fish moving down the river. In general, she asked, do you want the flows to stay high once fish start moving? This year could be different because the flows will probably be low for the rest of the year, which places more emphasis on transportation at the end of the season anyway, Wagner said. He favored releasing more water in late May, when fish are in the river and it’s most likely to do them some good. 9. Snake River Transport Based on current and historical movements of PIT-tagged fish, yearling Chinook passage is 43% complete at Lower Granite, plus or minus 20%, Wagner said. Steelhead passage at Lower Granite is 23% complete, plus or minus 77%. The data suggest steelhead do better being barged this time of year, while spring Chinook do better in the river – that’s why transport was delayed this year. The next project where transportation is scheduled to start is Little Goose, where default mode is to start transportation 8 days after it begins at Lower Granite. The current plan, Wagner said, is to follow the default schedule but keep watching passage patterns and change the transportation plan if large numbers of steelhead appear. The first barge of yearling Chinook is leaving today from Lower Granite, with a prediction that 43% of the run has already passed. Wagner emphasized that these percentages have wide confidence intervals and provided an example of why this is so: at Lower Granite, 95 fish have been detected, with an assumption that 245 fish had already passed the project. Even if survival was 60% for the fish that have been detected, that’s not saying much in terms of survival. The projection for steelhead is that 50% of them will have passed Lower Granite by May 9, again with a wide confidence interval, Wagner said. For past years, May 9 or even May 7 would have been a reasonable expectation for peak passage. This year, fish travel is slow because flows are lower than normal.
11
10. Chum Emergence
David Wills (USFWS) and Wagner presented the chum catch graphs (Rick Kruger, Oregon, was not at the meeting). In the Ives Island area, where numbers of fish collected via seining were only 10 to 40 daily, suddenly 142 fish were caught in one day. This is a strong indication that chum are still emerging, Wagner said. Chum redd protections should be kept in place, i.e. maintain a minimum 13 foot tailwater below Bonneville Dam, and increase the tailwater to15 feet in the event of spill to compensate for higher gas levels. 11. Water Management Plan Spring/Summer Update All comments have been incorporated and the draft is ready for IT review, Bernard Klatte (COE) said. The plan is to finalize it at the next TMT meeting, after IT members have had an opportunity to comment. Hlebechuk recalled that several weeks ago, she emailed a previous iteration of the Water Management Plan to IT members. The WMP will need updating when the new water supply forecast comes out. Monday, May 7, is the deadline for comments from the IT. The plan is to present the final WMP with all comments incorporated to the TMT at its next meeting on May 7. 12. Operations Review A. Reservoirs. Grand Coulee is at elevation 1,249.5 feet, Roache said. Flood control elevation was 1,249.4 on April 3, so the project is passing inflows now. Next week, updated flood control modeling from the COE may provide additional guidance for future flood control operations at Grand Coulee through May and possibly June.
Hungry Horse is at elevation 3,538.24 feet. Discharges are 7.8 kcfs after ramping up April 30. That level of flows will be maintained until the May forecast is finalized next week. Roache said he’s expecting a 2-3% drop in the water supply forecast then, meaning discharges could go down to around 6.5 kcfs.
Libby is at elevation 2,386.15 feet, with outflows of 19.3 kcfs yesterday, Hlebechuk said. The project went to VARQ flows of 14.4 kcfs on May 1. Inflows were 20 kcfs yesterday, so the project is filling slightly.
Dworshak is at elevation 1,574.2 feet, running a full load of about 9,800
cfs, Hlebechuk said. Inflows are 14 kcfs. Albeni Falls is at elevation 2,056 feet, with 33 kcfs outflows. Priest Rapids
outflows have averaged 153.6 kcfs outflows from April 3 until May 1, when outflows were 158 kcfs. Little Goose has averaged 48.7 kcfs from April 10 to May 1, with outflows of 83 kcfs on May 1.
12
McNary has averaged 226.4 kcfs from April 10 to May 1, with a daily
average of 256 kcfs outflows, as of May 1 Wagner asked, is it common for there to be such a difference between Libby Basin and Hungry Horse, given that they’re not far from each other? Roache said it’s not unusual, particularly when winter storm tracks bypass Hungry Horse.
B. Fish. Recently a number of fish were caught at the Lewiston trap,
which indicates the fish are starting to migrate, Paul Wagner (NOAA) said. Research indicates that flows of 85-90 kcfs provide a directional cue orienting them toward the ocean. RSWs also help in this regard by providing a surface passage route. Wagner noted that 66,000 fish is the highest passage index yet for this year – fish counts of 200-300,000 by this time of year are not uncommon. We’re approaching peak passage time, and numbers should pick up substantially, he said. Further down the river, numbers are picking up for yearling Chinook. There aren’t a lot of steelhead in the lower river yet.
Cindy LeFleur (WDFW) reported on adult migrations. The pre-season
forecast for spring Chinook in 2007 is 78,500 at the river mouth. It’s hard to predict whether the run will be on time or late this year. In another week, it might be easier to determine that. It appears to be past the peak, which is usually around April 23-27, Wagner and LeFleur agreed. Last year – the latest on record – the peak migration was from May 15-18.
Someone asked whether counting jacks (3-year-old spring Chinook) would
be a good indicator of 4-year-olds to come the next year. LeFleur said yes, that’s what WDFW uses to predict future runs. She offered to put together a graph of WDFW’s findings for the TMT.
C. Power. There is nothing new to report, Robyn MacKay (BPA) said. D. Water Quality. The TMT web page includes information on spill and
TDG exceedances (under “spill” and “water quality data” links), Hamilton said. She pointed out that of 28 TDG exceedances this month, 14 were in the Ice Harbor forebay and the rest were scattered elsewhere throughout the system. 13. Next TMT Meeting The next meeting is scheduled for May 9, 2007, at NOAA Fisheries offices in Portland, in the Willamette Room on the 11th floor. Agenda items will include spill operations, current inflows and forecasts, a Spring Creek Hatchery update, a Priest Rapids update, Little Goose nighttime spill, the sturgeon pulse, Dworshak operations, Libby operations, Snake River transportation, chum emergence, finalizing the WMP spring/summer update, and the usual operations review. This meeting summary was prepared by consultant and writer Pat Vivian.
13
Name Affiliation Cathy Hlebechuk COE John Roache BOR David Wills USFWS Paul Wagner NOAA Laura Hamilton COE Robyn MacKay BPA Jim Litchfield Montana Kyle Dittmer CRITFC Dan Spear BPA Ruth Burris PGE Tony Norris BPA Shane Scott NWRP Scott Bettin BPA Ann McManamon BPA Roger Pimentel BPA Jim Adams COE Bernard Klatte COE Rudd Turner COE Tim Heizenrader Cascade Energy Jennifer Miller Susquehanna Cindy Henriksen COE Don Faulkner COE Randy Wortman COE Russ George WMCI Ken Soderlind COE Phone: Clyde Baker Krager Energy Jason Flory USFWS – Spokane Barry Espensen Columbia Basin Bulletin Margaret Filardo FPC Brian Marotz Montan Dave Hoffman COE – Libby Dam XXX COE – Seattle District Joe XX PPM Energy Russ Fisher Constellation Energy Bruce McKay Consultant Cindy LeFleur WDFW Russ Kiefer Idaho Russell Langshaw Grant Co. PUD Richelle Beck D. Rohr & Assoc.
14
T E C H N I C A L M A N A G E M E N T T E A MBOR : John Roache / Mary Mellema BPA : Robyn MacKay / Tony Norris / Scott BettinNOAA-F: Paul Wagner / Richard Dominigue USFWS : David Wills / Steve HaesekerOR : Rick Kruger / Ron Boyce ID : Russ KieferWDFW : Cindy LeFleur MT : Jim Litchfield / Brian Marotz
COE: Cathy Hlebechuk / Jim Adams / Cindy Henriksen
Before going to the Meeting you must check in with the receptionist on the 11th floor
We have had disruptions on the phone because people are not hitting 'mute' after dial in.Please MUTE your Phone
All members are encouraged to call Robin Harkless with any issues or concerns they would like to see addressed. Please e-mail her at [email protected] or call her at (503) 248-4703.
AGENDA
1. Welcome and Introductions2. Review [Meeting Minutes] 3. Priest Rapids Update - Russell Langshaw, Grant Co. PUD
i. [Priest Rapids Operations 2007] 4. Sturgeon Pulse/Libby Operations - Jason Flory, USF&WS5. Spring Creek Hatchery Release Report - Dave Wills, USF&WS
i. [Smolt Data at Bonneville Dam Power House 2 for species: Combined Chinook Subyearling] 6. Updated Flow Forecasts - Cindy Henriksen, COE
a. Libbyi. [Libby ESP Hydrographs] ii. [Libby ESP Inflows - Daily Box-Whiskers Plot]
b. Dworshaki. [Dworshak ESP Hydrographs] ii. [Dworshak ESP Inflows - Daily Box-Whiskers Plot]
iii. [DWR Apr-Jul Volume Forecast Comparison] iv. [Dworshak Augmentation Volumes]
c. Hungry Horsei. [Hungry Horse ESP Hydrographs] ii. [Hungry Horse ESP Inflows - Daily Box-Whiskers Plot]
7. Snake River Transportation Update - Paul Wagner, NOAA Fisheries8. Spill Operations/Night Spill at Little Goose - Jim Adams, COE9. Spill for Fish Passage - Paul Wagner, NOAA-F
i. [SOR #2007-06]
10. McNary June Spill Shift - Bernard Klatte, COE11. April 30 ESP HYSRR MODEL RUNS - Cindy Henriksen, COE
i. [Summary of 07 May 2007 ESP HYSSR Model Runs] 12. Dworshak Operations - Cindy Henriksen, COE
i. [Dworshak Outflows ]
ii. [DWORSHAK END OF MONTH ELEVATIONS]
iii. [DWORSHAK ESP VOLUMES]
13. Chum Emergence - Rick Kruger, ODF&Wi. [2007 Chum Salmon Catch in the Ives Island Area]
ii. [Timing of Chum Fry Emergence and Catch in the Ives Island Area, 1999 - 2007]
Lower Granite Meets the Following Flow Objectives:
Priest Rapids Meets the Following Flow Objectives:
Streamflows are from the 30 Apr ESP run, which uses current basin conditions combined with 44 historical weather patterns (temperatures and precipitation) to produce 44 ESP hydrographs for 2007.
Grand Coulee operates for a controlled refill while attempting to meet 135,000 cfs at Priest Rapids in May and targeting elevation 1289 ft by June 30. Summer lake targets are 1285.0 ft in July and 1280 ft in August.
Brownlee refills in June (2077 ft) and drafts in July and August to provide 237 kaf Upper Snake flow augmentation water.
Libby operates to VARQ flows in May. The project also meets minimum bull trout flows and the sturgeon pulse volume, both of which are appropropiate for each ESP year . After the sturgeon pulse, Libby releases a flat flow and targets 2439 ft by 31 Aug.
Hungry Horse operates in May for a controlled refill by 30 June and meets minimum project outflow of 900 cfs and minimum flow of 3,500 cfs at Columbia Falls. The project drafts to 3540 ft by 31 Aug.
Dworshak targets 1595 in May, targeting full in June and drafting to 1535 ft and 1520 ft by 31 Aug and 30 Sep respectively.
30 Apr ESP HYSSR
Volume Comparison Table (ESP versus Regression) - May Final:
Notes:The first of the Spring Creek NFH subyearling chinook tules arrived at the facility at 1315 on 6 March07-Mar-07Facility Morts Dead on Arrival 08-Mar-07Facility Morts Dead on Arrival 09-Mar-07Facility Morts Dead on Arrival 10-Mar-07Facility Morts Dead on Arrival 11-Mar-07Facility Morts dead on arrival. 12-Mar-07Facility morts dead on arrival. Most morts appeared to have been dead several days. 13-Mar-07
Smolt Data at Bonneville Dam Power House 2 for species: Combined Chinook SubyearlingDuring the passage of fish released from Spring Creek NFH
April 2007 Release% MortalityFacMortsSampMortsNumDescNumExamDeSampcountCollcountPassIndexRiverflowSampleDate
Notes:Subyearling fall chinook tules from spring creek NFH began arriving at the facility at 0645 on 13 April 13-Apr-07approximately 21 hours after release. Most of the subyearling Chinook morts were dead on arrival. Others were moribund expring a short 14-Apr-07time after arrival. High Sample rate to assist with research collections 30-Apr-07
Smolt Data at Bonneville Dam Power House 2 for species: Combined Chinook SubyearlingDuring the passage of fish released from Spring Creek NFH
May 2007 Release% MortalityFacMortsSampMortsNumDescNumExamDeSampcountCollcountPassIndexRiverflowSampleDate
Notes:Fish released from Spring Creek NFH by 0945 hrs.01-May-07Spring Creek NFH subyearling tule fall Chinook began arriving at the facility at 0250 on 2 May, 02-May-07approximately 17 hours after release.Special operations to monitor Spring Creek NFH tule fall chinook passage were implemented. 03-May-07Samples were collected and processed bi-hourly from 0700-2300 on 2 May. One sample was taken overnight from 2300 on 2 May - 0700 on 3 May. High Sample rate to assist with research collections 06-May-07High Sample rate to assist with research collections 07-May-07
Dworshak Outflows
0
5000
10000
15000
20000
25000
1-Apr 1-May 1-Jun 1-Jul
Out
flow
(cfs
)
25th Percentile 75th Percentile Daily Mean Observed Outflow
8 May 07, RCC, G. Bowers
DWORSHAK END OF MONTH ELEVATIONS
1,573.7
1,594.9
1,600.0
1,570
1,575
1,580
1,585
1,590
1,595
1,600
13579111315171921232527293133353739414345
No. EXCEEDANCES OUT OF 45
ELEV
ATI
ON
(ft
30 APR Elev 31 MAY Elev 30 JUNE Elev
DWORSHAK ESP VOLUMES
1904
1500
2000
2500
3000
13579111315171921232527293133353739414345
No. EXCEEDANCES OUT OF 45
APR
- JU
L VO
L (k
af
30 Apr ESP HYSSR
Summary of 07 May 2007 ESP HYSSR Model Runs 8-May-07
Assumptions:*
*
*
*
*
*
Results:
Month Occurrences out of 44 Years
Average Flow for 44 Years
(kcfs)
Flow Objective
(kcfs)May 44 151 135Jun 44 186 135
Month Occurrences out of 44 Years
Average Flow for 44 Years
(kcfs)
Flow Objective
(kcfs)May 13 82 85Jun 10 66 73Jul 0 38 50
Aug 15 0 26 50Aug 31 0 30 50
Projects Refill to within 1 foot of full by 30 June:
Month Occurrences out of 44 Years
Average Flow for 44 Years
(kcfs)
Flow Objective
(kcfs)Month Occurrences
out of 44 Years
Average Elevation on 30 Jun for 44
Years May 17 235 237 Libby 0 2437Jun 33 259 237 Hungry Horse 44 3560Jul 42 240 200 Grand Coulee 44 1289
Aug 15 7 176 200 Dworshak 44 1600Aug 31 1 158 200
Period Average Flows (kcfs):OBS OBS OBS FCST FCST FCST FCST FCST FCST
Streamflows are from the 30 Apr ESP run, which uses current basin conditions combined with 44 historical weather patterns (temperatures and precipitation) to produce 44 ESP hydrographs for 2007.
Grand Coulee operates for a controlled refill while attempting to meet 135,000 cfs at Priest Rapids in May and targeting elevation 1289 ft by June 30. Summer lake targets are 1285.0 ft in July and 1280 ft in August.
Brownlee refills in June (2077 ft) and drafts in July and August to provide 237 kaf Upper Snake flow augmentation water.
Libby operates to VARQ flows in May. The project also meets minimum bull trout flows and the sturgeon pulse volume, both of which are appropropiate for each ESP year . After the sturgeon pulse, Libby releases a flat flow and targets 2439 ft by 31 Aug.
Hungry Horse operates in May for a controlled refill by 30 June and meets minimum project outflow of 900 cfs and minimum flow of 3,500 cfs at Columbia Falls. The project drafts to 3540 ft by 31 Aug.
Dworshak targets 1595 in May, targeting full in June and drafting to 1535 ft and 1520 ft by 31 Aug and 30 Sep respectively.
McNary Meets the Following Flow Objectives:
Lower Granite Meets the Following Flow Objectives:
Priest Rapids Meets the Following Flow Objectives:
30 Apr ESP HYSSR
Volume Comparison Table (ESP versus Regression) - May Final:
ESP 75th PrecentileESP 25th PercentileObserved FlowsESP Daily Mean
Whiskers: ESP Daily Max/Min
ESP flows updated 08-May-2007
This plot displays the daily range of flows from the ESP hydrographs. Fifty percent of the ESP flows fall within the narrow shaded rectangles and the daily extremes of the ESP flows are bound by the "whiskers".
Libby ESP Inflows - Daily Box-Whiskers Plot
0
20000
40000
60000
80000
100000
120000
140000
1-May 1-Jun 1-Jul 1-Aug
2007
Dai
ly In
flow
in c
fs__
ESP 75th PrecentileESP 25th PercentileObserved FlowsESP Daily Mean
Whiskers: ESP Daily Max/Min
ESP flows updated 08-May-2007
This plot displays the daily range of flows from the ESP hydrographs. Fifty percent of the ESP flows fall within the narrow shaded rectangles and the daily extremes of the ESP flows are bound by the "whiskers".
COLUMBIA RIVER REGIONAL FORUM TECHNICAL MANAGEMENT TEAM
May 9, 2007 Meeting
FACILITATOR’S SUMMARY NOTES ON FUTURE ACTIONS Facilitator: Robin Harkless
Notes: Erin Halton The following notes are a summary of issues that are intended to point out future actions or issues that may need further discussion at upcoming meetings. These notes are not intended to be the “record” of the meeting, only a reminder for TMT members. Meeting Minutes With no additional comments, the facilitator’s notes and official meeting minutes from the 4/25 and 4/27 conference calls were finalized. Additional changes were made to the 5/2 facilitator’s notes: • During discussions of the sturgeon pulse operation, it was clarified that the request to
the COE to model two scenarios (standard and alternative) was requested by Jason Flory of USFWS.
• Under Dworshak operations discussions, the salmon managers requested the project continue at full load for another week. Also, the target elevation was about 1590’, and the average April-July volume forecast was based on the May 1 ESP forecast, 1952 kaf.
• Under Operations Review, Priest Rapids, McNary and Lower Granite were monthly average flows. Also, Hungry Horse was operating as such until May final (not end of May) forecasts were made available.
The 5/2 facilitator notes were finalized with incorporation of these comments. The official meeting minutes from the 5/2 meeting will be finalized at the next TMT face to ace meeting. f
Priest Rapids Operations Update Russell Langshaw, Grant County PUD, updated TMT on Priest Rapids operations; he referred to a graph posted to the TMT agenda, showing one excursion (.04 kcfs) of the flow band over the last week. Russell noted there are three weekends left of the current protection operation.
Action/Next Steps: Langshaw will provide another update on the flow protection operation at the 5/23 TMT meeting.
Sturgeon Pulse / Libby Operations Jason Flory, USFWS, said that alternative options for the implementation of a sturgeon pulse operation continued to be considered by the Sturgeon Recovery Team but that shifting the pulse was off the table and that a draft SOR was being developed that would include criteria for triggering the start date for the pulse, rather than a firm start date. The pulse itself would follow a pattern of 20 kcfs for the first four days, 25 kcfs for 14 days, 20 kcfs for 3 days, and 15 kcfs until the volume was exhausted. He added that one goal is to avoid a double peak.
1
Action/Next Steps: After some discussion it was determined that TMT will revisit the issue after having a chance to review the SOR. Jason committed to sending a draft to TMT through the COE by Friday, 5/11 (*The SOR was sent on 5/11 and posted to the TMT web page) after the Libby BiOp policy team had a chance to review it. TMT scheduled a conference call on Monday, to discuss and give feedback to the Kootenai Sturgeon Recovery Team, who will make the final decision about the operation. (It was noted they meet every Tuesday). Greg Hoffman, COE, will be included in discussions with the TMT.
Spring Creek Hatchery Release Report Dave Wills, USFWS, referred TMT to three graphs linked to the TMT agenda, showing data for hatchery releases in March, April and May 2007. He noted that the numbers for the May releases looked good and that continued studies and discussion would take place about what happened with the high mortality rates in March and April. One theory is that fish size and condition of the gate wells were factors. Updated Flow Forecasts Cindy Henriksen, COE, referred TMT to inflow whiskers plots and STP/ESP hydrographs for Libby, Dworshak and Hungry Horse, updated as of 5/8 and posted on the TMT website. The COE requested feedback on the usefulness of the two formats of the information. TMT members commented that while both types of graphs are useful and reveal unique aspects of the information, the whiskers plot graph was easier to read. Henriksen noted that the Dworshak April-July volume forecast continued to show a downward trend. Forecasts show that about 4-8 kcfs/day would be available until the end of June refill at Dworshak, less than what is being put out currently. John Roache, BOR, said that inflows were increasing earlier than expected at Hungry Horse, with a peak expected in the next two weeks, followed by a decline. He said that based on the current ESP inflows, the estimated Hungry Horse elevation would be within 15' from full by the end of May.
Action/Next Steps: TMT requested outflows forecasts for Dworshak to be included along with all the other graphs as the season continues, to show available volume until end of June refill at the project. Flow forecasts will be on the agenda at upcoming TMT meetings.
Snake River Transportation Operations Paul Wagner, NOAA, said that transport at Lower Granite started today (5/9), and that Lower Monumental transport would begin on May 11. Russ Kiefer, ID, shared concern that with low flows in the Snake system expecting to continue, conditions for fish would continue to deteriorate through May, and that this might require reconsideration of the planned spill operations in late May. An SOR proposing maximizing transport in late May might be put forth, depending on conditions and if there was agreement from the salmon managers at FPAC. Russ requested that, given the ongoing court process, the COE share this potential request with their policy folks and legal counsel, and work to getting approval in place to implement an operation that deviates from the 2007 Spill Operations Agreement. The COE noted their
2
appreciation for the heads up and said it would be helpful if parties to the Agreement signed on to any request that gets submitted.
Action/Next Steps: Conditions in the Snake River will be monitored closely, and discussions will continue amongst the salmon managers. Snake River spill/transportation will also continue to be discussed at TMT.
Spill Operations / Night Spill at Little Goose / SOR 2007-06 Paul Wagner, NOAA, presented an SOR on behalf of the Salmon Managers, which requested more timely response from the COE with regard to spill once TDG levels drop below the exceedance criteria, and to spill as close to the gas cap as possible particularly where there are fish passing a project. Wagner acknowledged the many factors and obligations, both court-ordered and for water quality, that the COE is required to meet. The COE agreed that they should (and try to) push to the limit with respect to all their requirements.
Action/Next Steps: The COE will spill as close to the gas caps as possible and will speed up response time whenever possible. The COE will be sensitive to the migration of the fish, and will focus on these projects and monitor progress of fish movement. It was noted that the next sensitive project is John Day.
McNary June Spill Shift Bernard Klatte, COE, informed TMT members of a Walla Walla District recommendation for transducers installment at McNary spillbay 22, which will be used for a vertical distribution study, and the need to shift spill for 6-8 hours to bays 1-11. The recommendation was to do this installment in the interim between spring and summer research at the project, between June 19th and 21st.
Action/Next Steps: Bernard will join the next FPOM meeting and they will discuss the recommendation and respond to the COE. The results of that discussion and the planned operation will be shared with TMT during their 5/16 conference call.
April 13 ESP HYSSR Model Results Cindy Henriksen, COE, referred to the ‘as of May 7’ ESP HYSSR modeling results document linked to the TMT agenda, showing flow objectives for the Columbia River system. John Roache noted that the Grand Coulee elevation target based on the latest The Dalles forecast for August 31 should be 1278' instead of 1280'. Henriksen added that the forecasted start of the sturgeon pulse flows for Libby will likely shift as conditions progress. Priest Rapids met its monthly flow objectives for May and June. Lower Granite met its objective 13 of 44 times for May, 10 of 44 times for June, and did not meet its objectives for July and August. McNary met its objectives 17 of 44 times in May, 33 of 44 in June, and 42 of 44 in July. The take home message was that flows are expected to be limited in the summer, and will require close monitoring and decision-making about how to best shape the flows.
Action/Next Steps: Per requests, the COE will confirm Lower Granite forecasted flows shown in this model run, compared to the April 19 model run and share them with Paul Wagner, NOAA, and look into generating a Lower Granite whiskers plot for future TMT meetings.
3
Dworshak Operations Cindy Henriksen, COE, referred TMT to graphs linked to the TMT agenda that showed additional technical information/modeling for Dworshak including daily outflows, end of month elevations, and ESP volumes. She said that the end of May flood control target elevation was 1595', and that the project was operating at full load and at the request of the salmon managers would continue until the next week.
Next Steps: The COE will keep TMT updated as the operation progresses, and Dworshak Operations will be on the agenda for the 5/16 TMT meeting.
Chum Emergence Two graphs were linked to the TMT agenda, with one showing a dramatic drop in chum emergence and the other showing 1999-2007 compared timing of chum emergence. Paul Wagner, NOAA, said that chum emergence was expected to end around 5/20.
Action/Next Steps: Chum emergence will be on the 5/23 TMT meeting agenda.
Water Management Plan Spring/Summer Update Bernard Klatte, COE, said that the update was shared at the 5/3 IT meeting, and that no additional comments were submitted. After including the latest forecasts, the spring/summer update would be finalized and posted to the TMT web page. Operations Review Reservoirs – Hungry Horse was at 3540.56', with outflows of 7.6 kcfs and inflows increasing. Grand Coulee was at 1247.8' and preparing to fill; the COE was working on an Initial Control Flow guidance based on The Dalles regulated flow. Libby was at 2388' and filling, with VARQ outflows of 14 kcfs. Dworshak was at 1577' and filling. Weekly averages for Priest Rapids were 171.6 kcfs, McNary 268 kcfs, and Lower Granite 82.5 kcfs. Fish – Cindy LeFleur, WA, referred TMT to a graph of 2007 expected Spring Chinook daily counts at Bonneville, linked to the agenda. She noted that adult jack numbers looked very strong for this year. Paul Wagner, NOAA, referred to the Fish Passage Center website and noted that juvenile counts at Lower Granite were up on 5/6, and that another peak was expected before the end of the week. He added that passage numbers were also up at McNary and John Day. Russ Kiefer, ID, said that his comments on the Fish Passage Plan and the Water Management Plan included a recommendation to have improved passage estimates (rather than fish passage indices) at Lower Granite and additional monitoring at Little Goose, both to better inform management. Power – Nothing to report Water quality – Jim Adams, COE, referred to a graph linked to the TMT agenda, showing TDG exceedances at Lower Monumental, Camas/Washougal and Ice Harbor. Next face-to-face TMT meeting: May 16th
4
Agenda items will include: • McNary Spill Shift • Dworshak Operations • Sturgeon Pulse / Libby Operations • Grand Coulee Flood Control Operations • Operations Review
5
Columbia River Regional Forum Technical Management Team Meeting
May 9, 2007 1. Welcome and Introductions Today’s TMT meeting was chaired by Cindy Henriksen and facilitated by Robin Harkless, with representatives from NOAA, BPA, COE, BOR, USFWS, Montana, Idaho and Washington attending in person or by phone. The following is a summary (not a verbatim transcript) of the topics discussed and decisions made at the meeting. Anyone with questions or comments about these notes should provide them to the TMT chair or bring them to the next meeting. 2. Review Meeting Minutes There were no comments on either the facilitator’s notes or the official minutes for the April 25 and 27 conference calls.
The official minutes for the May 2 meeting were not yet posted as of this meeting. The facilitator’s notes for May 2 had just been posted. Cathy Hlebechuk (COE) commented: (1) Under sturgeon pulse operation, clarify that modeling for the Libby pulse was at the request of Jason Flory (USFWS), who asked the COE to model two different scenarios, a standard pulse starting May 25 and an alternate pulse starting June 1. (2) For Dworshak operations, note that the salmon managers requested the project stay at full load for another week. (3) Clarify that 1,952 kaf was the average April-July volume for Dworshak based on the ESP forecast for May 1. John Roache (BOR) commented: Under operations review, the final end of May forecast should be changed to the May final forecast. 3. Priest Rapids Update
The parties to the Hanford Reach Fall Chinook Protection Program Agreement are required to provide a minimum Priest Rapids Outflow of 70 kcfs (USGS gauge) through the end of the Emergence Period. After the Emergence period has ended, Rearing Period protections must be maintained until 400 Temperature Units have accumulated. Historically, Rearing Period flow constraints have ended by mid-June and current projections are for them to end during the week of June 18, 2007.
Priest Rapids Dam had its first exceedance last week, Russell Langshaw (Grant County PUD) said. It was relatively small, 0.4 kcfs. Daily flow bands ranged from 8.8 kcfs to a high of 60.4 kcfs on the weekend. Last weekend was the first of four consecutive weekends where the PUD began using mean minimum flows Monday through Thursday to calculate the weekend flow bands. Last weekend’s minimum flows were 156.7 kcfs. Flow bands were all 60 kcfs last
6
weekend. Langshaw will give another update on the May 23 TMT conference call. 4. Sturgeon Pulse/Libby Operations
As TMT discussed last week, alternatives were being considered to float a coring barge into the upper Kootenai River in July, Jason Flory (USFWS) said. Since then, a number of new options have arisen, including changing the timing and the ordering of the coring and sample sites. None of the options involve using additional flows out of the sturgeon volume to float the barge in July.
Meanwhile, Flory and others are putting together a draft SOR for using the
2007 sturgeon pulse. The approach taken in the 2006 USFWS BiOp for sturgeon and bull trout at Libby was to aim for attributes in the river that are compatible with sturgeon survival and recruitment, rather than prescribing specific operations for the Action Agencies to implement.
Instead of a firm start date, the SOR asks for sturgeon operations to begin
when the river reaches 8 degrees Celsius at Bonners Ferry and the reservoir is warm enough to release 20-25 kcfs without decreasing water temperatures more than 1.5 degrees Celsius. For the first 4 days after these conditions take effect, the SOR asks that 20 kcfs to be released, ramping up to 25 kcfs (full powerhouse) for the next 14 days, followed by 3 days of 20 kcfs flows, and finally down to 15 kcfs flows until the sturgeon volume, 1.17 maf this year, is exhausted.
Flory said the SOR is being sent to the Libby BiOp policy group and will be
submitted to the TMT soon. He emphasized that it appears we’re quickly approaching the conditions outlined in the SOR for beginning the sturgeon pulse. Henriksen asked, will temperatures in the Kootenai River be the primary trigger, and what’s the temperature now? Yesterday it was 45.7 degrees Fahrenheit at Bonner’s Ferry, Flory said. The reservoir needs to warm up a bit more so when water is released, the river temperatures don’t drop. The reason: telemetry data show that spawning females who are beginning to migrate will turn around and swim downstream if the temperature drops by more than 1.5 degrees Celsius (actually 0.8 C). Cindy LeFleur (WDFW) asked, what reservoir temperature are you looking for? Approximately 8 degrees Celsius in the upper layers of the reservoir, Flory said. When flow volumes are approaching 20-25 kcfs, water from below the level of the outlet gate can cause temperature reductions, Brian Marotz (Montana) said. The temperature of the reservoir is currently 43-45 degrees Fahrenheit, or about 7 degrees Celsius.
Hlebechuk asked, is there a drop-dead date, or is it better to wait for it to
reach 8 degrees C until an unknown date? We’re hoping we can get those conditions in place soon, Flory said. Jim Adams (COE) asked, how do you know at what temperature to pull water out of Libby Reservoir to get to the right temperature at Bonner’s Ferry? What would the temperature of outflows at Libby
7
need to be? That’s something Greg Hoffman (COE) at Libby Dam has a good handle on, Flory said. Temperatures at the tailwater gage downstream of Libby Dam have averaged about 40 degrees F, Adams said.
The group discussed the process for initiating the sturgeon pulse this year
using the new attribute-based approach. Litchfield favored sticking with the formal protocol of having TMT review an SOR and make recommendations to the Action Agencies, which then decide what to do. The consensus was to follow that process in this case.
Litchfield asked which presents the greatest risk, starting the operation too
early and cooling the river too much, or waiting too long for the right temperature. The former, Flory said. Data in recent years show that when the hydrograph dips by even small amounts, sturgeon tend to spawn and migrate immediately back to Kootenay Lake. Conversely, the risk of waiting too long is that lack of flows could cause fish to spawn in unproductive habitat before the sturgeon pulse even begins.
We should be looking at two phases in the sturgeon life cycle, adult
migration and incubation/early life survival, Marotz said. Stacked flows should be directed at the migration phase. Data indicate that sturgeon move into position sometime after May 15, which is when stacked flows would be most beneficial. After that, he said, it’s important to have a gradual decline from the spring freshet, which will be associated with even higher water temperatures. Thermistors at the dam could be used to monitor temperatures.
Anticipating the SOR submittal, the TMT decided to revisit the sturgeon
pulse in a conference call at 11:30 am on Monday, May 14. 5. Spring Creek Hatchery Release
David Wills (USFWS) presented smolt data on the March, April and May releases from Spring Creek Hatchery. Survival for the May release looks very good, unlike the earlier two releases this year. The March release had high mortality, but no signs of physical trauma. The April release showed both high mortality and signs of physical trauma, which implicated the new gatewell modifications and vertical barrier screens as a possible cause. The gatewell flows are much higher than normal, and when these flows were backed down in April, mortality dropped immediately. We think it’s something to do with the size of the fish, Wills said. The March fish were around 60 millimeters, the April fish around 80 millimeters, and the May fish around 90 millimeters – all much smaller than typical summer subyearlings, and probably the smallest fish passing the project. Tony Norris (BPA) asked, what about other hatchery fish released in the Bonneville forebay? Wills doubted any other subyearling fish are released that close to the forebay but said he would look into it.
8
6. Updated Flow Forecasts
Cindy Henriksen (COE) presented hydrograph and ESP inflow forecasts for Libby, Dworshak and Hungry Horse, updated as of May 8. The first 10 days of both represent a single deterministic inflow forecast, followed by 44 historical weather sequences of temperature and precipitation overlaid on the existing snowpack and soil conditions. She asked TMT whether they wished to continue having these graphs available. Litchfield, Wagner and Wills agreed both the whiskers and spaghetti plots are helpful. Wagner and Wills preferred the whiskers plots. Litchfield said the spaghetti plots show how suddenly some sequences can change from low flows to massive flooding. Henriksen agreed with him that the drawback of whiskers plots is that you can see extremes, but they’re not continuous.
At Dworshak, flows are generally in recession, where the water supply is
only 70% of average and significantly less than in the Libby basin, Henriksen said. The water supply forecast at Dworshak has been generally going down across the season. The COE water supply forecast has generally been less than the National Weather Service’s forecast. Henriksen presented a graph depicting flow augmentation volumes available at Dworshak for the remainder of the season (through June 30). ESP volumes (the 44 traces from the spaghetti plots) show a little more volume available for flow augmentation than the regression equation volume forecast.
Wagner asked, why is less augmentation volume available if the COE
water supply forecast is greater than the ESP forecast? The final COE water supply forecast for May is 1.868 maf, which is less than the Weather Service forecast of 2.06 maf, Henriksen said. ESP runoff is almost 2 maf as well, which is why the flow augmentation volume on the ESP graph is a little greater than what’s shown on the regression graph. The regression forecast was based on COE, not the Weather Service forecast. The flow augmentation volume at Dworshak is 450 kcfs plus or minus 200 kcfs.
The minimum and maximum ESP augmentation volumes are 255 kaf and
677 kaf through the end of June, or approximately 2,000 kcfs above the minimum flow available for augmentation, based on minimum volume, Hlebechuk said. Based on maximum volume, the flow augmentation volume available from now through June 30 is about 6 kcfs above the minimum flow of 1 kcfs needed for flow augmentation. At present, the system is releasing full powerhouse, 10 kcfs, so the water volume is being used faster than it’s being replenished. There was consensus that this rate of use is not sustainable. The issue was discussed at FPAC on May 8, and the expectation was to maintain 10 kcfs discharge for the next week, Wagner said. By the end of the week, fish in the Snake River should finish their journey and be in place at all the projects. The plan then is to look at water volumes available going forward, and probably reduce Dworshak outflows at the May 16 TMT meeting.
9
If all the flow augmentation available is released in a flat outflow from now
until the end of June, that flat outflow would be 4 - 8 kcfs, based on ESP volumes, Henriksen said. Russ Kiefer (Idaho) expressed appreciation for this estimate of the outflows Dworshak could provide on a daily basis and still refill by the end of June. He requested that similar information be provided at future TMT meetings.
Inflows are rising at Hungry Horse, Roache said. Yesterday, flows were approximately 10 kcfs, but BOR is waiting to see how high they go before making new decisions about discharges. Normally, the peak would occur around June 1, but Roache said he wouldn’t be surprised if this year the peak occurs within the next few weeks. Based on the latest ESP information, the reservoir will be within 15 feet from full by the end of May. Discharges might need to be reduced next week, he said, especially if the hydrograph indicates a decline in the water supply. He and Wagner agreed the peak this year will probably come a couple of weeks early, especially with temperatures in the 70s and 80s expected in the next few weeks.
The May final forecast for Hungry Horse was 78% of normal, Roache said.
7. Snake River Transportation Update
Transportation was scheduled to start at Little Goose no later than 8 days after the initiation of transportation at Lower Granite, Wagner said. That meant collection started yesterday and transportation today. Lower Monumental will be next. The greatest effort in the early season is to keep as many fish in the river as possible.
This year, conditions aren’t great, and flow is low, which prior years have
shown not to be a problem if it happens early in the season. Temperatures were cool, a rise in flows was projected, and a number of fish moved past the projects. However, it’s fading fast, Wagner said. The peak of 95 KCFS dropped to yesterday’s lull of 66 KCFS. There’s quite a difference between the top and the bottom of the Snake River system that is giving the salmon managers concern, Wagner said. Weather forecasts and the current status of snowpack in the basin raise concerns that sometime in late May, conditions in the Snake River will deteriorate significantly, Kiefer said. In past years, he has seen temperatures climb and flows decline rapidly. He proposed that TMT begin working now to establish flexibility so that, if FPAC unanimously recommends, legal approvals are already in place to shut off voluntary spill at Lower Granite and Little Goose and maximize transportation at those sites. A delay of several days seeking legal approval to deviate from the planned 2007 operations could harm listed fish, Kiefer said. Such an operational change would require unanimous FPAC approval; if the parties disagree, FPAC would not be able to recommend a change of operations. Margaret Filardo (FPC) and Tom Lorz (CRITFC) noted that
10
FPAC has made no specific recommendations yet regarding transportation. The issue discussed was the ability to change operations quickly if conditions warrant.
Henriksen asked whether FPAC includes representation by the same sovereigns and agencies represented at TMT. Kiefer said yes, including tribal representation. Robyn MacKay asked, does that include the same Tribes that singed the 2007 agreement, and have they been notified? All four Tribes would have to sign the SOR for it move forward, Lorz said.
Lead time is the best way to make the process work better for those
changes that we perceive as different from expected operations, Henriksen said. There was consensus that legal consultation would be necessary to change operations. The COE will inform their legal staff of this development. 8. Spill Operations/Nighttime Spill to Cap at Little Goose (SOR #2007-06)
Wagner presented this SOR, which says spill amounts for fish passage are sometimes below criteria and asks the COE to respond more quickly to spill criteria in ways that benefit fish passage. He cited as example the situation last week at Lower Monumental, where spill had been reduced from 27 to 13 kcfs because of forebay issues at Ice Harbor, and fish were stacking up in the Lower Monumental forebay. The same thing happened at Little Goose the prior week, he said. Nighttime spill has not reached the gas cap since the 14 days of night spill to the cap began on April 29, as called for in the 2007 operations agreement.
COE set the spill cap at 30.4 kcfs at Little Goose, Adams said, but is
actually getting 29.4 kcfs or a little less because of the gate openings on the spillway. He asked, is the concern over the way gas caps are being set or the way they’re being implemented? Wagner and Lorz advocated pushing the limit of 120% in the tailrace harder when there are large numbers of fish moving in a low-flow year. Lorz asked whether the spill caps are determined by SYSTDG modeling. Partly; it’s one of the tools the COE uses, Henriksen said. Lorz said his understanding of the operations agreement was that COE would spill to the gas caps set at monitoring sites, not spill cap estimates set by modeling. Wagner agreed a discussion of this would be timely.
Adams described the process he and Laura Hamilton (COE) go through
each morning to set spill caps for the day. He invited any interested TMT members to schedule a visit to observe the process. The discussion turned to spill cap problems at John Day and Camas Washougal, where TDG levels from higher spill at night to the spill cap arrive at the downstream dam during the warmest part of the following afternoon, tending to cause exceedances. Adams pointed out that this is not a problem in the Snake, where projects are spaced farther apart, allowing 2-3 days’ travel time for the peak to flatten out.
11
Wagner asked, what the COE’s response was when fish were stacking up in the Little Goose forebay? We agreed to increase spill for 4 hours on Wednesday night, which caused TDG levels at the Little Goose tailrace to exceed 120%, but the 12-hour average didn’t exceed 120%, Henriksen said. The continuing concern is that these higher TDG amounts move downstream and cause an exceedance of 115% TDG in the Lower Monumental forebay. As an example of the COE’s commitment to the goal of passing as many fish as possible, the next day the COE increased the spill cap at Little Goose from 13 kcfs to 21 kcfs.
Adams and Henriksen expressed appreciation for the feedback from the
salmon managers on which projects they believe are functioning well in terms of spill volumes and caps (Lower Granite, Ice Harbor, McNary and The Dalles) as well as projects at which spill is an issue (Little Goose, Lower Monumental, John Day). There was general consensus that spilling as close to the gas cap as possible is highly desirable, particularly during fish passage season, while recognizing the multiple obligations the Action Agencies have to fulfill. Robin Harkless advised the TMT representatives to keep in close communication with each other regarding this issue. 9. McNary June Spill Shift The COE has received a request from the Walla Walla district biologist Ann Setter to replace the hydroacoustic split beam transducers on spill bay 22, where TSW #1 is installed at McNary, Bernard Klatte (COE) said. The transducers are needed to collect data for a vertical distribution study, so the COE is requesting that 40% of spill be shifted to bays 1 through11 for 6-8 hours sometime between June 19 and June 21. Kiefer asked, is that a period of low fish movement? Klatte said he thought so. Try to pick a low migration period because that spill pattern is not so good for fish, Kiefer said. Lorz and Wills both expressed a desire to study the smolt data before offering an opinion of the date. Those TMT members present requested that Klatte run this operation past FPOM on Thursday and report back to TMT at the May 14 conference call. 10. Updated ESP HYSSR Model Runs
Henriksen presented some overall Columbia River system scenarios based on ESP HYSSR analysis of April 30 inflows. The purpose of ESP HYSSR modeling is to capture the big picture in potential scenarios of operations and results for a particular water year in a monthly time step. The overall goal is to meet BiOp operations at projects all over the basin in a monthly time step and use this output as a filter to examine some years more closely if desired.
Henriksen presented input assumptions for Dworshak, Hungry Horse,
Brownlee, Libby and Grand Coulee. At Libby, for example, in each case, the sturgeon pulse was assumed to begin May 25 and the project was assumed to
12
operate at full powerhouse until the sturgeon volume for the water year was depleted. The results provide a sense of how well the sturgeon flow and reservoir refill might be met in 2007, Henriksen said. The message is, we need to figure out as we move through time how best to shape the augmentation volumes available.
The 135 kcfs flow objective at Priest Rapids was met in all 44 scenarios
modeled for May and June. The outlook for Lower Granite was not so good – only 13 years of the 44 that were modeled met the flow objective of 85 kcfs in May. Wagner asked, given that the April 19 data showed May average flow of 91 kcfs at Lower Granite; the April 30 data showed May average of 82 kcfs. He asked, did the volume forecast really decrease as much as the HYSSR graph implies? That could be another reason to set the stage for a flexible process if conditions in the river deteriorate to the point where in-river migration is undesirable, Litchfield and Wagner agreed.
Kiefer said he would appreciate a presentation on inflows at Lower
Granite, like the box whiskers and spaghetti plots the COE has been preparing for Libby, Dworshak and Hungry Horse. Henriksen said she would find out what the COE technical staff could provide. 11. Dworshak Operations Henriksen presented graphs of Dworshak outflows, end of month elevations and ESP volumes. The message is that 10 kcfs can continue to be released for a few more days, then outflows would be reduced throughout May and June, she said. This information indicates that outflows would drop to the minimum flow of 1.5 kcfs by the end of June. Henriksen asked did the salmon managers want to continue operating at full powerhouse? Through Tuesday, Wills said. TMT will revisit this issue next week. 12. Chum Emergence
It appears Hamilton Springs may be contributing to an increase of 142 fish caught last week, Wagner said. The numbers dropped to 6 the following week. Chum emergence will probably continue for another week or two, he said. TMT agreed to check back on this issue biweekly until chum emergence ends. 13. Water Management Plan Spring/Summer Update The COE addressed all comments received, and on May 3 submitted the spring/summer update to the IT for review. No further comments have been received. NOAA, USFWS, BOR, BPA, Montana, Idaho, and Washington representatives agreed that – once Hlebechuk has revised the WMP spring/summer update to incorporate the latest forecast information – it will be considered finished, and this item can be dropped from future TMT agendas.
13
14. Operations Review A. Reservoirs. Grand Coulee is at elevation 1,247.8 feet and will probably start filling over the next week or two, Roache said.
Hungry Horse is at elevation 3,540 feet, releasing 7.6 kcfs. The reservoir is filling, with inflows averaging around 10-11 kcfs and forecasted to be 13-14 kcfs or more over the next few days.
Libby is at elevation 2,388.89 feet and filling. VARQ flows have been adjusted to 14 kcfs while the COE awaits input from the sturgeon recovery team, Henriksen said.
Dworshak is at elevation 1,577 feet, releasing full powerhouse. Priest
Rapids flows were 171.6 kcfs last week. McNary has a seasonal average of 271 kcfs. Lower Granite has been
discharging 54 kcfs; average flows have been almost 60 kcfs since April 13. B. Fish. Yesterday’s adult count was 2,900 Cindy LeFleur (WDFW) said.
WDFW reviews its run forecasts daily. There are already almost 6,000 spring Chinook jacks (3 year old fish) at Bonneville Dam, which is more than the final jack counts for 20 out of the past 30 years, she said.
A participant asked, what percentage of Bonneville spring Chinook pass
Lower Granite? Probably 50-60% of the run, LeFleur said. This year’s forecast for spring Chinook is 78,500, with 38,500 just in the Snake, or about 49% of the run. Formerly, 50-60% of the run was in the Snake.
Juvenile passage numbers for yearling Chinook at Lower Granite are
following a disturbing trend, dropping suddenly from 220,000 to 94,000, Wagner said. This trend reflects the flows in the river. Another peak flow is expected this Sunday, which is badly needed for fish passage, he said. Juvenile passage has picked up in the lower river. Passage numbers of 224,000 at McNary and 155,000 at John Day indicate that migration is fully under way.
Steelhead have been following a similar trend to spring Chinook yearlings
at Lower Granite. The passage numbers are higher at Little Goose for juvenile steelhead than for yearling Chinook. Numbers are picking up at McNary and John Day, but not to the extent observed for yearling Chinook. We’re approaching the 50% typical passage point in the migration season, Wagner said. Given the sharp drop in juvenile passage numbers, he wondered whether this year will be reasonably reflective of that.
14
For the sake of more informed management, a method is needed to estimate actual fish passage at Lower Granite instead of relying on index counts, Kiefer said. From the late ‘70s to the early ‘90s, index counts gave a good indication of actual runs, but RSWs, which pass proportionately more fish for the water spilled, have made index counts potentially inaccurate.
C. Power. There is nothing new to report, Robyn MacKay (BPA) said. D. Water Quality. Yesterday there were a number of exceedances at
Lower Monumental forebay and tailwater, as well as at Ice Harbor, Camas Washougal, and The Dalles forebays, Jim Adams (COE) said. Spill caps might need to be adjusted because of high TDG levels in the lower Snake River. 15. Next TMT Meeting Conference calls were scheduled for Monday, May 14, at 11:30 am, to discuss the sturgeon pulse SOR, and for the two following Wednesdays, May 16 and 23. The next face-to-face meeting will be on May 30, 2007.
Agenda items for the Wednesday, May 16, conference call will include, McNary spill shift, the sturgeon pulse, Libby operations, Dworshak operations, Grand Coulee flood control operations, and the usual operations review. This meeting summary was prepared by consultant and writer Pat Vivian. Name Affiliation John Roache BOR Cathy Hlebechuk COE Jim Adams COE Cindy Henriksen COE Paul Wagner NOAA Robyn MacKay BPA Tony Norris BPA Jim Litchfield Montana Richelle Beck D. Rohr & Assoc. Tim Heizenrader Cascade Energy Dan Spear BPA Scott Bettin BPA Holli Krebs Bear Energy Jennifer Miller Susquehanna Tom Lorz CRITFC David Wills USFWS Phone: Shane Scott NWRP Brian Marotz Montana Cindy LeFleur WDFW
15
Bernard Klatte COE Laura Hamilton COE Barry Espensen CBB Jason Flory USFWS Bruce McKay Consultant Glen Trager Evista Energy Russell Langshaw Grant Co. PUD Russ Kiefer Idaho Dave Benner FPC
16
T E C H N I C A L M A N A G E M E N T T E A MBOR : John Roache / Mary Mellema BPA : Robyn MacKay / Tony Norris / Scott BettinNOAA-F: Paul Wagner / Richard Dominigue USFWS : David Wills / Steve HaesekerOR : Rick Kruger / Ron Boyce ID : Russ KieferWA : Cindy LeFleur MT : Jim Litchfield / Brian Marotz
COE: Cathy Hlebechuk / Jim Adams / Cindy Henriksen
TMT CONFERENCE CALL Monday May 14, 2007 11:30 - 13:00
1125 N.W. Couch Street, Suite 4A34 Portland, Oregon 97209
Conference call line: 503-808-5191
To check into the building, take the elevator to the 5th floor and the guard will issue you an ID badge if you need one and will take you down to the 4th floor where the meeting is. If you have NOT attended a TMT meeting in the past you will need to call
ahead and let Cathy Hlebechuk (503) 808-3942, Jim Adams (503) 808-3938 or Cindy Henriksen (503) 808-3945 know, so you can be added to the TMT Visitor List and issued an ID badge. This badge may be used indefinitely. If you have attended TMT in the
past you may re-use your ID badge indefinitely. If you are a federal employee you will also need to have an ID badge issued to you which can be used indefinitely.
We have had disruptions on the phone because people are not hitting 'mute' after dial in.Please MUTE your Phone
All members are encouraged to call Robin Harkless with any issues or concerns they would like to see addressed. Please e-mail her at [email protected] or call her at (503) 248-4703.
a. Reservoirsb. Fishc. Power Systemd. Water Quality - James Adams,COE
i. [Spill Information 2007]6. Other
Set agenda for next meeting - May 16, 2007 [Calendar 2007]
Questions about the meeting may be referred to Cathy Hlebechuk at (503) 808-3942, Jim Adams at (503) 808-3938 or Cindy Henriksen at (503) 808-3945
COLUMBIA RIVER REGIONAL FORUM TECHNICAL MANAGEMENT TEAM
May 14, 2007 Conference Call
FACILITATOR’S SUMMARY NOTES ON FUTURE ACTIONS Facilitator: Robin Harkless
Notes: Erin Halton The following notes are a summary of issues that are intended to point out future actions or issues that may need further discussion at upcoming meetings. These notes are not intended to be the “record” of the meeting, only a reminder for TMT members. SOR 2007-FWS1 Jason Flory, USFWS, reported that the SOR submitted to TMT on 5/11 included what was shared and discussed during the 5/9 TMT meeting. He clarified that start times for the operations within the SOR were “to the extent possible.” He also said the operation would likely be requested to begin either late this week or early the week of 5/21, and that he would continue to be in close coordination with the Sturgeon Recovery Team and COE Reservoir Control Center. BPA requested 2 days lead time to implement the operation. Those present on the call: OR, ID, MT, BOR, BPA, USFWS, NOAA, and CRITFC, supported the proposed process for moving forward: USFWS coordinate the operation with the Sturgeon Recovery Team and the COE, with notification coming to TMT via email.
Action/Next Steps: Coordination on this SOR will be between Jason Flory, the Sturgeon Recovery Team, Libby Dam Operators, BPA, and the COE Reservoir Control Center. TMT will be notified via email when the decision is made to implement the operation.
Operations Update Jim Adams, COE, said that the COE had raised the spill caps at Bonneville to 100 kcfs and that the spill caps at Little Goose and Lower Granite had been lowered over the weekend, due to TDG exceedances. Paul Wagner, NOAA, and Russ Kiefer, ID, commented that the fluctuation in spill cap levels was not good fish protection and that the restricted spill had potentially impacted listed fish. The COE responded that they are doing their best to operate as close to the caps as possible. All will need to continue closely monitoring and communicating about river conditions and fish passage to assure best possible operations throughout the migrating season. McNary June Spill Shift Bernard Klatte, COE, followed up with TMT members on the Walla Walla District recommendation for transducers installment at McNary spillbay 22. The original recommendation for timing of this work was for June 19-21; Klatte reported that members of FPOM shared the desire to minimize effects on fish and that the work could be scheduled earlier, for June 12th, following the last group of acoustic tagged fish passage at McNary on the 11th. Those present on the call: OR, ID, MT, BOR, BPA, USFWS, NOAA, and CRITFC, did not object to the June 12 date.
1
Action/Next Steps: Bernard will coordinate with the Walla Walla district and FPOM. Next face-to-face TMT meeting: Wednesday, May 16th
Agenda items will include: • Dworshak Operations • Sturgeon Pulse / Libby Operations • Grand Coulee Flood Control Operations • Operations Review
2
Columbia River Regional Forum Technical Management Team Conference Call
May 14, 2007 1. Welcome and Introductions Today’s TMT conference call was chaired by Cindy Henriksen and facilitated by Robin Harkless, with representatives from CRITFC, BOR, FPC, USFWS, COE, BPA, NOAA, Idaho, Montana and Oregon participating. The following is a summary (not a verbatim transcript) of the topics discussed and decisions made on the call. Anyone with questions or comments about these notes should provide them to the TMT chair or bring them to the next meeting. 2. Review Meeting Minutes The official minutes for May 2 have not yet been posted, Cindy Henriksen (COE) said. TMT will check in on this at the next meeting. 3. Sturgeon Pulse/Libby Operations (SOR #2007-FWS1)
Jason Flory (USFWS) introduced this SOR, which has not changed substantially since last week’s discussion. Once the reservoir is ready to release 20-25 kcfs from Libby Dam without dropping temperatures in the Kootenai River more than 1.5 degrees Celsius (and preferably no more than 0.8 C), the sturgeon operation can begin. The operation calls for 4 days of 20 kcfs flows, 14 days of full powerhouse, 3 days of 20 kcfs, then 15 kcfs until the sturgeon volume is exhausted.
The current temperature at Bonner’s Ferry is approximately 45 degrees
Fahrenheit, or 7.5 degrees Centigrade. Henriksen asked Flory when the sturgeon pulse might begin; Flory said late this week or early next week, possibly this Friday, May 18. He will be in touch with COE staff at Libby Dam, who will keep him informed when the reservoir conditions have been reached. At that point, Flory will confer with the sturgeon recovery team and, if they approve, contact COE staff at the Reservoir Control Center to request commencement of the sturgeon operation. Henriksen asked how much lead time BPA would need to manage the approximately 100 extra megawatts the increased flows would produce. BPA prefers 2 days’ notice before commencement of the sturgeon operation, Dan Spear (BPA) said.
The COE will email TMT when the sturgeon operation begins.
Representatives from NOAA, BPA, BOR, CRITFC, Oregon, Idaho, and Montana agreed to this process. Henriksen asked whether it’s imperative to begin releasing sturgeon flows at 6 am on the first day of the operation. There could be a public safety issue if higher flows begin on the weekend, given that large numbers of people could be boating on the river. Starting at 6 am is not
3
necessary, Flory said. TMT will check in on this operation at upcoming meetings on May 16 and 23 as needed. 4. Operations Review - Spill Caps
The spill cap at Bonneville is up to 100 kcfs, Jim Adams (COE) said. The COE lowered the spill cap at Little Goose and Lower Monumental to 15.3 kcfs (today it’s 21.5 kcfs) and saw TDG levels rise as high as 117% at Ice Harbor. Yesterday, TDG was 114.4% at Ice Harbor, so COE intends to increase the spill caps soon.
Paul Wagner (NOAA) commented that flows were expected to rise over
the weekend, which would help clear the gas from the river. The opportunity to increase spill without violating water quality standards was early in the week; increasing the spill caps now that flows are decreasing could result in exceedances. Wagner and Russ Kiefer (Idaho) expressed regret at the lost opportunity to help listed fish pass through the Lower Monumental powerhouse this past weekend. Margaret Filardo (FPC) questioned whether the gages in the Lower Monumental forebay are wholly representative of upstream tailraces.
When Little Goose is spilling and generating tailwaters TDG of 116-118%,
there are often exceedances at Lower Monumental forebay, Adams said. There isn’t a perfect correlation between TDG levels in the spillway and downstream water quality. Levels of gas coming through the powerhouse are an important factor in water quality issues. The COE is trying to keep spill caps as high as possible, Henriksen said, but there have been exceedances at downstream forebays which take a few days to show up after the spill cap has been raised. Part of the problem might be the spill pattern being used at Little Goose this year, Adams said. Because of that, the tailrace monitor might be underreporting net TDG production due to spill patterns at the project.
Robin Harkless advised TMT members to monitor the spill situation
closely and stay in communication with each other. 5. McNary Spill Shift
In response to TMT’s request, Bern Klatte (COE) presented to FPOM the Walla Walla District’s request to shift 40% of spill for 6-8 hours at McNary to replace two dead transducers in spill bay 22, where TSW #1 is located. Initially, the Walla Walla COE office requested the shift take place from 19-21 June, but recently said the work could be done on June 12. FPOM has agreed to the shift and advocated getting the work done as soon as possible. Klatte asked TMT members to weigh in on it. Representatives of NOAA and Oregon agreed to the operation with no more discussion needed; USFWS also agreed and request that the operation take place on a low flow day if possible. Klatte said that spill for that day will be at the 30% spill, the lower of the two volumes currently being tested.
4
USFWS said that was good and go ahead and schedule the operation for June12. 6. Next TMT Meeting The next meeting will be on May 16, 2007. Agenda items will include the sturgeon pulse, Libby operations, Dworshak operations, Grand Coulee flood control, and the usual operations review. This meeting summary prepared by consultant and writer Pat Vivian. Name Affiliation Rick Kruger Oregon Kyle Dittmer CRITFC John Roache BOR Margaret Filardo FPC David Wills USFWS Shane Scott NWRP Jim Adams COE Bernard Klatte COE Paul Koski COE Cindy Henriksen COE Dan Spear BPA Paul Wagner NOAA Jason Flory USFWS-Spokane Russ Kiefer Idaho Brian Marotz Montana Rick Kruger Oregon Barry Espensen CBB Tom Le Puget
5
T E C H N I C A L M A N A G E M E N T T E A MBOR : John Roache / Mary Mellema BPA : Robyn MacKay / Tony Norris / Scott BettinNOAA-F: Paul Wagner / Richard Dominigue USFWS : David Wills / Steve HaesekerOR : Rick Kruger / Ron Boyce ID : Russ KieferWDFW : Cindy LeFleur MT : Jim Litchfield / Brian Marotz
COE: Cathy Hlebechuk / Jim Adams / Cindy Henriksen
TMT MEETING Wednesday May 16, 2007 09:00 - 12:00
1125 N.W. Couch Street, Suite 4A34 Portland, Oregon
Conference call line: 503-808-5190
To check into the building, take the elevator to the 5th floor and the guard will issue you an ID badge if you need one and will take you down to the 4th floor where the meeting is. If you have NOT attended a TMT meeting in the past you will need to call
ahead and let Cathy Hlebechuk (503) 808-3942, Jim Adams (503) 808-3938 or Cindy Henriksen (503) 808-3945 know, so you can be added to the TMT Visitor List and issued an ID badge. This badge may be used indefinitely. If you have attended TMT in the
past you may re-use your ID badge indefinitely. If you are a federal employee you will also need to have an ID badge issued to you which can be used indefinitely.
We have had disruptions on the phone because people are not hitting 'mute' after dial in.Please MUTE your Phone
All members are encouraged to call Robin Harkless with any issues or concerns they would like to see addressed. Please e-mail her at [email protected] or call her at (503) 248-4703.
AGENDA
1. Welcome and Introductions2. Review [Meeting Minutes] 3. Priest Rapids Update - Russell Langshaw, Grant Co. PUD
i. [Koocanusa Reservoir Temperatures] 5. Grand Coulee Flood Control - Cindy Henriksen, COE / John Roache, BOR6. Snake River Transportation Operations - Paul Wagner, NOAA Fisheries
i. [NMFS' recommended transportation operations for late May] 7. Updated Flow Forecasts - Cindy Henriksen, COE
a. Libbyi. [Libby ESP Hydrographs] ii. [Libby ESP Inflows - Daily Box-Whiskers Plot]
iii. [Libby Augmentation Volumes] b. Dworshak
i. [Dworshak ESP Hydrographs] ii. [Dworshak ESP Inflows - Daily Box-Whiskers Plot]
iii. [Dworshak Augmentation Volumes] c. Hungry Horse
i. [Hungry Horse ESP Hydrographs] ii. [Hungry Horse ESP Inflows - Daily Box-Whiskers Plot]
ESP 75th PrecentileESP 25th PercentileObserved FlowsESP Daily Mean
Whiskers: ESP Daily Max/Min
ESP flows updated 15-May-2007
This plot displays the daily range of flows from the ESP hydrographs. Fifty percent of the ESP flows fall within the narrow shaded rectangles and the daily extremes of the ESP flows are bound by the "whiskers".
Libby Augmentation VolumesESP inflows and 1-May Water Supply Forecast
0
1000
2000
3000
4000
5000
6000
7000
1962
1950
1975
1976
1977
1979
1955
1960
1974
1951
1949
1989
1982
1984
1992
1978
1987
1964
1968
1991
1971
1983
1954
1973
1965
1956
1970
1953
1959
1985
1963
1961
1972
1986
1967
1966
1957
1958
1952
1981
1988
1980
1993
1969
1990
30%
50%
70%
ESP Year with and 1 May Water Supply Forecasts
Apr
il-Ju
ne R
unof
f in
KA
F..
AugmentationVolume
Volume to Fill Deficit
Volume to Fill
Sturgeon Pulse Deficit
Sturgeon PulseResidual Volume
MinFlow Deficit
MinFlow ResidualVolume
Runoff Volume toDate
Observed data through 14-May and ESP flows updated 15-May
WSF
Sturgeon Pulse Volume = 1170 KAF
Sturgeon Pulse Used to Date = 0 KAFMinimum Flow Residual Vol = 373 KAF
Observed Runoff Volume through 14-May = 1466 KAF
Sturgeon Pulse Residual Vol = 1170 KAFPercentage of ESP Years Unable to Fill = 93%
Libby ESP Inflows - Daily Box-Whiskers Plot
0
20000
40000
60000
80000
100000
120000
1-May 1-Jun 1-Jul 1-Aug
2007
Dai
ly In
flow
in c
fs__
ESP 75th PrecentileESP 25th PercentileObserved FlowsESP Daily Mean
Whiskers: ESP Daily Max/Min
ESP flows updated 15-May-2007
This plot displays the daily range of flows from the ESP hydrographs. Fifty percent of the ESP flows fall within the narrow shaded rectangles and the daily extremes of the ESP flows are bound by the "whiskers".
LOWER GRANITE PERIOD AVERAGE FLOWS
64115
30279
20000
30000
40000
50000
60000
70000
80000
90000
100000
110000
13579111315171921232527293133353739414345
No. EXCEEDANCES OUT OF 45
FLO
W (c
fs)
Spring Flow s Summer Flow sSpring Objective Sumer Objective
ESP Flow Data Updated 15-May 2007
Lower Granite Flows
20000
40000
60000
80000
100000
120000
140000
1-Apr 1-May 1-Jun 1-Jul
Out
flow
(cfs
)
25th Percentile 75th Percentile Daily Mean Observed Outf low
This plot displays the daily range of regulated flows at Lower Granite. Fifty percent of the flows fall within the narrow shaded rectangles and the daily extremes of the flows are bound by the “whiskers”. Dworshak is regulated to reach elevation 1595.0 feet on 31 May and 1600 on 30 June. Brownlee is regulated to reach elevation 2077 on 31 May.
ESP Flow Data Updated 15-May 2007
LOWER GRANITE PERIOD AVERAGE FLOWS
64115
30279
20000
30000
40000
50000
60000
70000
80000
90000
100000
110000
13579111315171921232527293133353739414345
No. EXCEEDANCES OUT OF 45
FLO
W (c
fs)
Spring Flow s Summer Flow sSpring Objective Sumer Objective
ESP Flow Data Updated 15-May 2007
LOWER GRANITE FLOWS1May - 30 Jun 07
0
20000
40000
60000
80000
100000
120000
140000
160000
5/1 5/8 5/15 5/22 5/29 6/5 6/12 6/19 6/26
ESP Flow Data Updated 15-May 2007
Lower Granite Flows
20000
40000
60000
80000
100000
120000
140000
1-Apr 1-May 1-Jun 1-Jul
Out
flow
(cfs
)
25th Percentile 75th Percentile Daily Mean Observed Outf low
This plot displays the daily range of regulated flows at Lower Granite. Fifty percent of the flows fall within the narrow shaded rectangles and the daily extremes of the flows are bound by the “whiskers”. Dworshak is regulated to reach elevation 1595.0 feet on 31 May and 1600 on 30 June. Brownlee is regulated to reach elevation 2077 on 31 May.
ESP Flow Data Updated 15-May 2007
Rationale for considering adopting a maximum transportation program on the Snake River for the later half of May 2007.
• The main reason for considering a maximum transportation program for the balance of the spring season is that research data collected to date indicates that fish arriving late in the season at Lower Granite and Little Goose Dams have a much larger SAR when transported than if they migrate through the hydropower system. Poor late year migration conditions are exacerbated when flows are low. This year, poor in-river migration conditions are anticipated. The seasonal average flow forecast for this spring migration season (April 3 – June 20) is currently projected to be approximately 72 kcfs. The current average flow forecast for this May is an average flow 82 kcfs. Survival data from the year 2002 (Figures 1-3) , which had a seasonal average flow of 83 kcfs indicated that the SARs of both transported wild steelhead and wild spring Chinook were substantially higher than in-river migrants during the late May period.
• The NMFS 2005 Effects memo provided data indicating thresholds for both flow and temperature exist at which juvenile survival decreases at a rapid rate. For steelhead flows below 115 kcfs negatively affected steelhead, spring Chinook were negatively affected below flows of 72 kcfs. Both species showed a rapid decline in survival when temperature exceeded 12.50C (54.5F) at Lower Monumental Dam (Williams et al. 2005).
• The peak daily flow forecasted for the Snake River is currently forecasted to be in the range of 100 kcfs and will be short in duration. The current temperature at Lower Monumental Dam tailrace is 12.20C, (53.7F).
• Using 2002 as a comparable year (even though average volume was higher) the SAR of wild steelhead marked at Lower Granite Dam (LGR) and migrated in-river during the May 15 –June 1 period were <.4%, while transported fish had SARs in the 1.5 – 3% range; comparative SARs of steelhead migrating in-river vs transported from Little Goose Dam (LGS) were ~.5% vs 1 to 2.5%, respectively (Figure 3)(Marsh et al. 2005).
• Data for wild tagged spring Chinook showed a similar trend in terms of transport performance (Marsh et al. 2006). The SARs at LGR for in-river vs. transported fish for the late May period were ~.6% vs 1 – 2.5% respectively (Figure 1). The SARs from LGS in-river vs. transport were in the range of .5 – 1% vs .75 – 1.5% during the late May period (Figure 2).
• Muir (2006) concluded the poorer performance of late season [in-river] migrants is probably due to ocean entry beyond the optimum migration window and declining physiological condition. Thus, transporting a higher percentage of Chinook salmon smolts later in the season would optimize their ocean entry timing and should lead to improved survival.
Summary It is anticipated that substantially fewer adults will return from fish left to migrate in-river versus those transported during the low flow and high temperatures anticipated to occur this year in the later part of May. Transitioning to a maximum transportation program is recommended by NMFS at this time.
-
0.50
1.00
1.50
2.00
2.50
3.00
4/8 4/16 4/24 5/2 5/10 5/18 5/26 6/3 6/11
SAR
LGR Transports
Migrating
-
0.50
1.00
1.50
2.00
2.50
3.00
4/8 4/16 4/24 5/2 5/10 5/18 5/26 6/3 6/11
SAR
LGS Transports
Migrating
Figure 1. Smolt-to-adult return rates by release date for yearling Chinook smolts tagged
in 2002 and either transported from Lower Granite Dam or released to migrate in the river. Data are 5-day running averages of daily juvenile releases, and numbers are adjusted proportional to daily collection numbers at LGR in 2002. The overall transport/inriver migrant ratio was 1.64.
Figure 2. Smolt-to-adult return rates by release date for yearling Chinook smolts tagged
in 2002 and either transported from Little Goose Dam or released to migrate in the river. Data are 5-day running averages of daily juvenile releases, and numbers are adjusted proportional to daily collection numbers at LGS in 2002. The overall transport/inriver migrant ratio was 1.34.
Figure 3. Smolt-to-adult return rates by juvenile tagging date for steelhead smolts transported from Lower Granite (LGR transport, above) and Little Goose Dam (LGS transport, below) compared with SARs of their inriver migrant cohorts in 2002. Also shown is the distribution of juvenile fish collected at these dams in 2002.
SAR
SAR
Figure 4. Flow during the spring migration period at Lower Granite for the
years 2002 and 2007. The magnitude of flow in 2007 is projected to be less than that observed in 2002 due to a substantially lower runoff volume in 2007. The April to July runoff volume in 2002 was 19.2 Maf vs 14.2 Maf for 2007.
References Cited: Marsh, D. M., and coauthors. 2006. Research related to transportation of juvenile
salmonids on the Snake River 2005: Final report for 2002 spring/summer Chinook salmon juvenile migration. Report of Research by Fish Ecology Division, Northwest Fisheries Science Center, National Marine Fisheries Service, National Oceanic and Atmospheric Administration to the U.S. Army Corps of Engineers, Walla Walla District, 43 p. .
Marsh, D. M., and coauthors. 2005. Transportation of juvenile salmonids on the
Columbia and Snake Rivers, 2004: Final report for 2002 steelhead juveniles with updates on other transport studies. Report of Research by Fish Ecology Division, Northwest Fisheries Science Center, National Marine Fisheries Service, National Oceanic and Atmospheric Administration to the U.S. Army Corps of Engineers, Walla Walla District, 46 p. .
Muir, W.D., D.M. March, B. P. Sandford, S. G. Smith, and J. G. Williams. 2006. Post-
Hydropower System Delayed Mortality of Transported Snake River Stream-Type
Chinook Salmon: Unraveling the Mystery. Transactions of the American Fisheries Society 135:1523–1534.
Williams, J. G., and coauthors. 2005. Effects of the Federal Columbia River Power
System on salmon populations. U.S. Dept. Commer., NOAA Tech. Memo. NMFS-NWFSC-63, 150 p. (Available online at http://www.nwfsc.noaa.gov/publications).
Fork length distribution of juvenile chum sampled below Bonneville Dam, 2007
Bonneville DamNumber of chum in millimeters Mean length % chm tailwater discharge water
Timing of Chum Fry Emergence and Catch in the Ives Island Area, 1999 - 2007
1998
1999
2000
2001
2002
2003
2004
2005
2006
2007
2008
21-Jan
28-Jan
4-Feb
11-Feb
18-Feb
25-Feb
4-Mar
11-Mar
18-Mar
25-Mar
1-Apr
8-Apr
15-Apr
22-Apr
29-Apr
6-May
13-May
20-May
27-May
3-Jun
10-Jun
17-Jun
24-Jun
1-Jul
Date
Year
Predicted EmergenceCatchPeak OccuranceProjected
52 142
Priest Rapids Operations 2007
90
120
150
180
210
240
270
7-May 8-May 9-May 10-May 11-May 12-May 13-May
Dis
char
ge in
kcf
s
90
120
150
180
210
240
270
Flow Band
Daily delta
Number of exceedances: 0
COLUMBIA RIVER REGIONAL FORUM TECHNICAL MANAGEMENT TEAM
May 16, 2007 Meeting
FACILITATOR’S SUMMARY NOTES ON FUTURE ACTIONS Facilitator: Robin Harkless
Review Meeting Minutes May 2 Official Meeting Minutes: • A question was raised about the Priest Rapids update, and whether the four weekend
operations discussed were accurately reflected. Russell Langshaw, Grant County PUD, confirmed that he sent in revisions and with those changes, the May 2 Meeting Minutes were finalized.
May 9 Facilitator’s Notes: • Under “Snake River Transportation Operations”, first paragraph: Little Goose started
today (5/9), Lower Monumental would begin on 5/11. • Second paragraph: Russ Kiefer shared concerns that with low snow pack in the Snake
system, migration conditions for fish could deteriorate dramatically in late May . • With the changes shared, the May 9 facilitator notes were finalized. The May 9 Official Meeting Minutes and May 16 Facilitator’s Notes will be finalized during the May 23 conference call. Priest Rapids Update Russell Langshaw, Grant County PUD, reported on operations from May 7-13, noting it was another good week with no exceedances. Weekend minimum protection flows were 150 kcfs during the weekend of May 4-5, with 60 kcfs bands the rest of the week. During the weekend of May 12-13, minimums were 170 kcfs. Russell will provide another update at the May 30 TMT meeting. Sturgeon Pulse/Libby Operations Cindy Henriksen, COE, recapped the USFWS SOR for sturgeon pulse operations submitted on 5/11 and discussed during the 5/14 TMT conference call. The SOR included input from the Kootenai Tribe, Montana, Idaho Fish and Game, and others. The recommendation was to begin the operation using water temperature as a trigger – a graphic was linked to the TMT agenda showing temperature data at varying levels in the Libby reservoir. Greg Hoffman, COE, added that the “sturgeon operation” was to not cool temperatures greater than 1.5º C at Bonners Ferry from releases at Libby. He reported that 8 females were in the hatchery at this point, and 6 were ready to spawn. Given current and near-term expected conditions, the operation was expected to start some time in the next few days, perhaps Monday, 5/21. Process – As many of the parties would be meeting at Libby dam on Friday, it was agreed that the parties would discuss current conditions and decide when to start the operation, and a notice would be sent to TMT from the COE notifying them of the conditions and parties involved in coordination. UPDATE: An email was sent out from Cindy Henriksen
1
following today’s meeting with a message from Jason Flory, USFWS, that the operation would begin at 0600 hours on Friday, 5/18, and that this had been agreed to by members of the Sturgeon Recovery Team. Grand Coulee Flood Control John Roache, BOR, reported on this week’s flood control upper limit for Grand Coulee, a 1263’ maximum (not target) for May 20. The COE added that the upper limit will be updated weekly with new information on current and expected runoff. Currently, the project was at elevation 1253.1’ and filling. Snake River Transportation Operations Paul Wagner, NOAA, reported that per discussions last week, the tribes that signed on to the 2007 Agreement for spill through the spring season did not agree to a suggested alternative operation of maximizing transportation during the second half of May. Because there was no consensus to change course, NOAA shared instead an analysis of the issues to flag for future consideration and hopes of revisiting as lessons learned during the TMT year end review. A handout was linked to the agenda that summarized NOAA’s analysis leading to a recommendation to maximize transportation in late May this year, based on a 2002 study of in-river and transported yearling chinook and steelhead with flow and temperature conditions similar to what is happening this year. (For more details on the analysis, see the handout). Suggestions and requests were made for next steps forward on this issue: • Share lessons learned at the TMT year end review. • Add temperature charts to the NOAA analysis, as temperature is a contributing factor
for survival of fish. Track this through the year and develop flow and temperature triggers for implementing transportation in future years.
• Consider using the COMPASS model to look at overall survival with or without transportation with this year’s conditions.
• Develop a more formal SOR with technical justification to maximize transportation in late May, and allow each regional party to make a decision as to the most appropriate operation for this year. Share the outcome with the Court regardless of the decision.
• For the future, suggest also looking at subyearling chinook impacts during this late May timeframe.
• Request for more technical information and input from other salmon managers on this issue. What is the technical rationale for supporting/not supporting NOAA’s proposed operation?
It was noted that the process for moving NOAA’s recommendation forward this year would require agreement from the Court, through a court filing. Given the limited time frame this year, it was suggested that without consensus from signatories to the 2007 Agreement, implementing this alternative this year was unlikely. Updated Flow Forecasts The COE shared updated hydrographs and whiskers plots depicting flow forecasts for Libby, Dworshak, Hungry Horse and Lower Granite.
2
Dworshak Augmentation Volumes: This graph showed average Lower Granite flows for May 14-June 30 given minimum, average and maximum ESP volume forecasts. It was noted that the average flows included the 1.5 kcfs minimum required out of Lower Granite. This will be more clearly labeled on future graphs. Given the current forecast, outflows from Lower Granite could be maintained at 4.5 kcfs. Libby Augmentation Volumes: This graph showed that June 30 refill will be a big question – deficits were shown in all years. A request was made to the COE to develop scenarios or “bookends” graphs, as in the past, for Libby operations. (The COE planned to develop the scenarios once the sturgeon pulse operation began – and will share them at a near-future TMT meeting.) Lower Granite Whiskers Plot: The Lower Granite flow forecasts show a drop, then a spike up to 105 kcfs, followed by a drop off again and no more increases for the rest of the season. Actual flows were at 92 kcfs. Period average flows were 64 kcfs for spring and 30 kcfs for summer. Dworshak Operations The salmon managers discussed at FPAC and, given current conditions and diminishing water supply forecasts, recommended reducing outflows at Dworshak to around 5 kcfs for a week, and checking back in next week to reassess current conditions and forecasts. Action: The COE planned to operate the big unit at Dworshak to best efficiency, at 5.4 kcfs. It was anticipated the request will be to further reduce outflows at the project in the next week or two. Chum Emergence Rick Kruger, Oregon, shared the latest information on chum counts, and officially declared that chum emergence had ended. With this declaration, the Bonneville tailwater restriction will be lifted and the COE will pull the Warrendale monitoring gauge. Sampling of chinook will continue in the area. Operations Review Reservoirs – Cindy Henriksen and John Roache reported on reservoirs. Libby inflows had increased to 38 kcfs and the project was at elevation 2400’, releasing 14 kcfs until the start of the sturgeon operation. Grand Coulee was at elevation 1253.1’ and slowly filling. Hungry Horse was at 3545.14’, with 6.3 kcfs outflows and about 13 kcfs inflows. Flows at the project were increasing but expected to drop off. Lake Pend Oreille was continuing to fill to 2060’ by the end of May, currently at elevation 2057.8’. Average flows April 20-May 15 were 171 kcfs at Priest Rapids, 70 kcfs at Lower Granite, and 253 kcfs at McNary. Dworshak was at elevation 1581’, with about 14 kcfs inflows. Fish – Paul Wagner reported on juvenile and adult fish. Yearling chinook and steelhead peaked at Lower Granite around May 4 and at Little Goose around May 15. Good passage was being observed in the lower river. A question was asked about subyearling
3
passage at Lower Granite, to which Paul and Margaret Filardo, FPP, responded that work is being done to improve accuracy of counts with RSW installation. It was noted that as future decisions about spill and transportation are made, it will be important to understand the proportion of subyearling chinook taking advantage of spill through the system. Adult spring chinook at Bonneville were on a downward trend, with 55,000 counted to date. Jack counts, at 11,345, remain very high. A suggestion was made that ocean conditions play a large role – ocean conditions are expected to be at least neutral if not favorable this year. Power system – Nothing to report. Water quality – Jim Adams, COE, reported on TDG exceedances at the Lower Monumental and Ice Harbor forebays. The spill caps went up to 28.5 kcfs at Little Goose and 22.6 kcfs at Lower Monumental after last weekend. With TDG exceedances expected at John Day and The Dalles, spill caps will drop at the projects. Jim noted that spill cap information is updated every two weeks on the TMT web page. TMT Schedule May 23 Conference Call Agenda • Review Meeting Minutes: Finalize May 9 Official Minutes, May 16 Facilitator’s
Notes • Grand Coulee Flood Control • Dworshak Operations • Report on Sturgeon Pulse/Libby Operations May 30 Face to Face Meeting Agenda Items Include: • Review Meeting Minutes • Priest Rapids Update • Grand Coulee Flood Control • Updated Flow Forecasts • Dworshak Operations • Libby Operations Scenarios • Follow up on Snake River Transportation • Operations Review
4
Columbia River Regional Forum Technical Management Team Meeting
May 16, 2007 1. Welcome and Introductions Today’s TMT meeting was chaired by Cindy Henriksen and facilitated by Robin Harkless, with representatives from COE, NOAA, BPA, BOR, USFWS, CRITFC, FPC, Montana, Oregon, Idaho and Washington participating. The following is a summary (not a verbatim transcript) of the topics discussed and decisions made at the meeting. Anyone with questions or comments about these notes should provide them to the TMT chair or bring them to the next meeting. 2. Review Meeting Minutes
Regarding the May 9 facilitator’s notes, Russ Kiefer offered a few edits to clarify the discussion of his request to consider maximum transportation if flow conditions deteriorate in late May. Under Snake River Transportation Operations, first page: transportation at Little Goose started on May 9, not at Lower Granite, and at Lower Monumental on May 11, rather than 11 days from today, Kiefer said. In the second paragraph regarding the Snake River system, he deleted “expecting to continue” and replaced it with “migration conditions for fish could deteriorate dramatically in late May.”
Regarding the May 2 official meeting minutes, section 5, Priest Rapids
Update, Cindy Henriksen (COE) asked whether the description of the four weekend conditions is correct in the current version posted on the website. Yes, Russell Langshaw (Grant County PUD) said. There were no other comments on the May 2 official minutes, so they can be considered final.
The May 9 and May 14 official meeting minutes will be posted on the web
as soon as additional comments have been received, Jim Adams (COE) said. The May 9 minutes should be posted by the end of this week. 3. Priest Rapids Update
This has been another good week, Russell Langshaw (Grant County PUD) said. Starting May 7, there were 150 kcfs flow minimums. For the rest of the week, there were 60 kcfs flow bands. This past weekend, there were minimum flows of 170 kcfs, based on weekend protection measures discussed at the last TMT meeting. The mean minimum flows from Monday through Thursday that week presented a constraint the following weekend. There have been no exceedances downstream as a result of this operation. Discharges ranged from 1.8 to 24 kcfs, and daily deltas ranged from 1.3 kcfs to a maximum of 78.5 kcfs. Langshaw will give another update at the next face to face TMT meeting May 30.
5
4. Sturgeon Pulse/Libby Operations
Greg Hoffman (COE – Libby Dam) and Henriksen gave an update on operations since Monday’s TMT conference call, when TMT discussed the SOR submitted by USFWS and local stakeholders including the state of Montana. That’s when the COE learned that the request to initiate the sturgeon pulse would be triggered by water temperatures in Libby Reservoir and at Bonner’s Ferry. In response to that focus, Hoffman presented TMT with a graph of temperature data at varying levels within Libby Reservoir. The current reservoir elevation is 2,400 feet.
The graph indicates that the temperature in the Libby forebay is
increasing, particularly at lower elevations, Hoffman said. In the past, when reservoir surface temperatures increased, the COE responded by increasing the volume of the reservoir, which entrained the cooler water below and caused a double peak in the thermograph. We’re trying to avoid that this time, Hoffman said. Temperatures in the upper layers of the reservoir were around 47 degrees Fahrenheit at the end of last week, and today they’re around 53-54 degrees F, so the reservoir is warming rapidly. The temperature at Bonner’s Ferry is 48.8 degrees Fahrenheit; typically, 50 degrees is a critical number for the sturgeon operation. It could start as early as Monday, May 21. The sturgeon pulse SOR will probably ask that the reservoir temperature be allowed to increase no more than 1.5 degrees Centigrade as a result of higher flows. Identifying the trigger will not be a black-and-white process, but rather an approximation of the time when flows from the dam are unlikely to cause water temperatures at Bonner’s Ferry to drop.
The group reviewed the process for initiating the sturgeon operation.
Several key TMT members on the sturgeon recovery team, including USFWS representative Jason Flory, will meet this Friday, May 18, at Libby Dam. It appears likely the sturgeon operation will begin Monday, based on information they gather at the dam Friday. Written commencement of the operation will most likely come from the COE rather than USFWS, as agreed upon at an earlier TMT meeting. Henriksen asked whether any TMT members objected to this process; no one did. There were requests to identify who was involved in the decision to start the operation and the conditions that were met. 5. Grand Coulee Flood Control
The maximum flood control elevation at present is 1,263 feet on May 20, John Roache (BOR) said. There will be a new flood control elevation calculated weekly, based on the current status of runoff and residual runoff to come. The purpose of the weekly elevation maximums is to keep the reservoir filling, but not too quickly, and the flow moving in the lower river, Henriksen said.
6
6. Snake River Transportation Operations
FPAC recently had a discussion with the Tribes who have an agreement for this year’s spill operation, Paul Wagner (NOAA) said. The agreement clearly calls for spill throughout the migration season, regardless of flows. NOAA made a recommendation to rely more heavily than planned on transportation this year because of the way flows are shaping up. However, FPAC could not reach consensus on that recommendation, so no SOR was presented to TMT. Wagner said there was no point in submitting an SOR with partial representation – which has been done on other occasions – because Judge Redden has ordered that no changes may be made to the operations plan unless there is consensus among the signatories to the agreement.
Wagner expressed a sense of urgency about responding quickly when
conditions warrant because river conditions will probably continue to deteriorate, making the pathway more perilous for fish. This year, in light of flow conditions, NOAA recommended transporting all spring migrants from Lower Granite to below Bonneville Dam. The main reason Wagner gave for requesting maximum transport is that SARs are higher for fish transported than those left to migrate in the river when flows are as low as they have been this year (average 72 kcfs).
Wagner quoted a NMFS memo that summarized several studies and
thoughts on the effects of the hydro system: (1) A flow of 115 kcfs is the model threshold for steelhead, below which survival decreases; (2) the model threshold for spring Chinook is 72 kcfs, below which survival decreases. Another study indicated that 85 kcfs is the threshold at which steelhead are able to find their way past the dams. Installation of RSWs could change that, Wagner noted.
He presented several DART graphs based on studies of migration in
2002, a low-flow year similar to this one. A study of yearling Chinook smolts at Lower Granite found that they did not benefit from transport until May 15, when benefits suddenly increased. There were similar but less dramatic findings for yearling Chinook at Little Goose. The Science Center’s current theory, Wagner said, is that ocean conditions drive sudden changes in SARs of fish transported. Studies show that steelhead benefit more consistently from transportation then spring Chinook, wild spring Chinook in particular. In 2002, there was a fourfold benefit for steelhead transported in season. Steelhead have shown the most consistent benefit, and they’re also the most at risk.
The temperature at which survival decreases is 12.5 degrees Centigrade, or 54 degrees Fahrenheit, Wagner said. The temperature at Lower Monumental is now 55.3 degrees F in the forebay and 55.9 degrees F in the tailrace. Wagner emphasized that conditions in the river could continue to worsen, based on past trends. He explained that collecting approximately 80% of fish at some point in the river (according to the current operations plan) is not the same as collecting them at Lower Granite and transporting them downstream below Bonneville
7
Dam. Though the fish will be transported for short distances under this year’s operations plan, they will still be subjected to risk as they move downstream. Wagner also pointed out that the transportation recommendation applied only to the remainder of spring migration season, not the entire summer. Though there will be no SOR to advocate NOAA’s transportation recommendation, Wagner advised TMT to keep this issue on the agenda when it’s time for the end-of-year review, particularly in light of SARs findings. Studies indicate that when ocean conditions are good, transported fish do better in terms of SARs. The studies for 2002-03 showed that steelhead that migrated in river had SARs of 0.5, while those transported had SARs of nearly 2.0. Litchfield suggested adding temperature data and tracking this issue in search of parameters to define when one tool is clearly more appropriate than another. The time to focus R&D on this issue is after the RSWs have all been installed and we’ve done what we can to make river passage less hazardous, Wagner said. Litchfield felt it was important for TMT to make operational recommendations on the record, even if the recommendations can’t be implemented due to lack of consensus or a court order. He concurred with Wagner’s view that river conditions for fish are generally deteriorating.
Dave Statler (Nez Perce) requested that subyearlings be included in the analysis of transport vs. in-river migration. Litchfield requested that the data charts be updated and that TMT revisit the maximum transport issue at its next meeting. Shane Scott (NWRP) wanted more biological justification of transportation vs. in river migration; he also wanted to hear the salmon managers’ individual views. There was some discussion of court filing dates and how long the process might take if consensus could be reached tomorrow. 7. Updated Flow Forecasts
Henriksen presented updated hydrographs and whiskers plots for Libby, Dworshak, Hungry Horse and Lower Granite; there were no questions on these. She presented a graph of Dworshak augmentation volumes, which shows the augmentation volumes available in the same formats COE has been using to present inflow data to TMT.
The water supply forecast shows about 4.5 kcfs of average flow available
if the salmon managers request flat flows for the duration of spring migration season, Henriksen said. That’s outflow in excess of the 1.5 kcfs minimum flows, for a total of 6 kcfs. Scott Bettin (BPA) pointed out that the 1.5 kcfs is always released, meaning the chart shows volumes actually available for augmentation, excluding minimum flows. Other TMT members said this was a good clarification. The graph should say outflow volumes, not augmentation volumes, Henriksen agreed.
8
Regarding Libby augmentation volumes, refill is questionable by June 30, depending on how operations shape up in June, Henriksen said. The chart shows that in only 4 years does Libby fill and have excess volume under current flow conditions. Jim Litchfield asked COE to prepare the bookend scenarios of recent years, which use TESS scenarios to calculate reservoir elevations, given forecasted inflows and the sturgeon pulse. The COE is planning to produce those for 2007 once the sturgeon pulse starts, Henriksen said.
The Lower Granite data indicate that, on average, the reservoir will be 10
feet short of refill by June 30, or 500 kaf short of the refill goal, Wagner said. Though the graph shows an increase in flows to 104-5 kaf this weekend due to warmer temperatures, these forecasts should be taken with a grain of salt because they change daily, Henriksen cautioned. 8. Dworshak Operations
The quantity available for augmentation at Dworshak is diminishing, Henriksen reported. Recently the salmon managers settled on 5 kcfs as the appropriate outflow level, down from full powerhouse at 9,800 cfs. Wagner asked whether people are still comfortable with 5 kcfs outflow. It’s better to err on the side of refill this year, he said.
According to the data, an average ESP of 5.1 kcfs has a 50% probability
of allowing Dworshak to refill, while 3.4 offers a 75% probability of refill, Henriksen said. Litchfield agreed with Wagner that 5 kcfs remains a good choice for outflows now, with the expectation that outflows will probably need to be further cut back depending on inflows and other variables. Representatives of the Nez Perce Tribe, COE, Idaho and Montana also agreed to that operation for this week. A flat outflow of 4.5 to 5 kcfs from now through the end of June would have a 50% probability of achieving refill, Henriksen reminded TMT.
Scott Bettin asked about the unit loading. Running two small units would
produce about 4.2 kcfs of outflow, Adams said. Wagner and Litchfield favored using the one big unit for now. This week the COE will operate the big unit with best efficiency, Henriksen said. The TMT agreed to discuss this issue on their conference call next Wednesday, with the expectation that unit loading will need to change to the smaller units next week. 9. Chum Emergence
Chum emergence appears to be over this season, Rick Kruger (Oregon) said. The 13 foot tailwater restriction, which is moot anyway, can be lifted. With that announcement, COE will remove the Warrandale gage until Sept. 1, Adams said; no one objected. This item will be deleted from future TMT agendas.
9
10. Operations Review
A. Reservoirs. Inflows at Libby have increased over the past week or so, with the reservoir spilling over 1.5 feet per day, Henriksen said. Inflows yesterday were 38 kcfs, and current elevation is 2,400 feet. Outflows will remain at 14 kcfs until the sturgeon pulse begins.
Grand Coulee is at elevation 1,253.1 feet and slowly filling, John Roache (BOR) said. The maximum flood control elevation is 1,263 feet on May 20.
Hungry Horse is at elevation 3,545.14 feet, within 15 feet of full (3,560 feet), Roache said. Discharges are 6.3 kcfs; inflows are 13-14 kcfs, forecasted to rise to around 17 kcfs in the next few days. With discharges at the current rate of 6.3 kcfs and inflows at around 15 kcfs, the reservoir fills at the rate of about ¾ foot per day. How quickly flows drop will drive decisions about discharges, Roache said. Because the reservoir is within 15 feet of refilling, decisions about operations need to be more reactive to changing inflows.
Dworshak is at elevation 1,581 feet, 19 feet from full. Inflows are 14-15 kcfs. Priest Rapids flows were 171 kcfs, meeting the flow objective.
McNary has had a seasonal average of 250-300 cfs (INFLOWS?) since
April 20. Average flows at Lower Granite have been 70 kcfs since April 20. Lake Pend Oreille is continuing to fill, with a target elevation of 2,060 feet
at Albeni Falls by the end of May. B. Fish. Peak Chinook passage at Lower Granite was May 4, with an
index count of 220,000 fish, Wagner said. Yesterday’s index count was down to 20,000. The passage index for spring Chinook at Lower Granite shows a similar trend, with a peak of 140,000 fish on May 4. Steelhead passage counts at Lower Granite are presently 91,000.
Dave Statler (Nez Perce) asked whether the index counts at Lower
Granite will be revised to reflect actual passage efficiency with the RSW in place. That work is in progress and will be completed soon, Wagner and Margaret Filardo (FPC) agreed. Accurate information on passage efficiency will become increasingly important as TMT is faced with spill decisions throughout the season, Statler said.
Little Goose passed a peak of 370,000 steelhead on May 15, which indicates that steelhead are still migrating. Full sampling started on May 7 at Little Goose as part of collection for transport. The initial steelhead sample count was 36,000, with a peak count of 104,000 on May 15. This indicates that travel time is extended during low flow periods, Wagner said.
10
We have not seen the peak yet for steelhead on the lower Snake River, Wagner said. Overall numbers suggest that passage is somewhat slower this year than in 2002, with an expectation of 10-12 days for most fish to move through the lower Snake.
Meanwhile, it’s prime passage time on the lower Columbia River. There
was a peak index passage of 300,000 Chinook at John Day on May 12, and 145,000 fish at Bonneville on May 15, Wagner said. The subyearling Chinook counts at Bonneville reflect mainly Spring Creek Hatchery releases.
The good news this year is spring Chinook jacks, Wagner said. The tally
of 11,345 so far – with 15 more days still to go – makes this year one of the top 2 or 3 on record for jack counts. The peak of 21,000 was in 2000. The Science Center believes that ocean conditions play an enormous role in such large returns, and this is believed to be a good year for ocean conditions, Wagner said. The hydro system sets the stage for anadromous fish, but the real drama happens in the ocean. He emphasized the importance of building fish populations during years of good ocean conditions because it’s so difficult to maintain population levels during years of poor conditions.
Kyle Dittmer (CRITFC) said PDOs (WHAT’S THIS?) indicate that ocean
conditions might be neutral this year. Wagner and Dittmer agreed that it would make sense to monitor ocean conditions when making decisions about the lower Columbia estuary.
C. Power. There is nothing new to report, Scott Bettin (BPA) said. D. Water Quality. Jim Adams (COE) presented a chart showing water
quality information which is linked to today’s agenda. In May so far, there have been exceedances at Lower Monumental forebay 9 out of 16 days. There have been 7 exceedances in 16 days at Ice Harbor forebay. Therefore, the spill caps were raised on Monday to 26.8 kcfs at Little Goose and 21.5 at Lower Monumental. Wind and other conditions look favorable now, so the COE intends to raise the spill caps at Little Goose and Lower Monumental one stop apiece – 28.5 kcfs and 22.6 kcfs, respectively, Adams said.
There have been exceedances in The Dalles forebay, as well as the
Bonneville forebay (115.9% TDG for both), he said. However, conditions for diffusing gas do not look good there, so the COE will drop the spill caps from 153.6 to 145 kcfs at John Day, and from 132 to 110 kcfs at The Dalles. Adams pointed out that 40% spill at The Dalles is just barely peaking over 110 kcfs, so by lowering the spill cap to that level, there should be 4 to 6 hours per day of actually spilling less than 40% of total outflow due to being constrained by the spill cap.
11
When the spill cap was raised recently to 30 kcfs at Little Goose, the graph shows TDG levels spiked at the Lower Monumental tailwater gage, Adams said, citing that as an example of the way small amounts of spill can cause a big spike in TDG levels. 15. Next TMT Meeting There will be a conference call on May 23, 2007, to check in on Grand Coulee flood control operations, Dworshak operations, and the sturgeon pulse/Libby operations. The next face-to-face meeting will be May 30. Agenda items for that meeting will include a Priest Rapids update, and other issues to be determined, as well as the usual operations review. This meeting summary was prepared by consultant and writer Pat Vivian. Name Affiliation Jim Litchfield Montana Cindy Henriksen COE Paul Wagner NOAA Jim Adams COE Laura Hamilton COE Scott Bettin BPA Dave Wills USFWS Rick Kruger Oregon Kyle Dittmer CRITFC Jennifer Miller Susquehanna Rudd Turner COE Bern Klatte COE Shane Scott NWRP Ruth Burris PGE Phone: Greg Haller Nez Perce Dan Spear BPA Russ Kiefer Idaho John Roache BOR Tim Heizenrader Cascade Energy Margaret Filardo FPC Greg Hoffman COE – Libby Dam Russ George WMC Bruce McKay Consultant Glen Trager Avista Energy Cindy LeFleur WDFW Russell Langshaw Grant Co. PUD
12
T E C H N I C A L M A N A G E M E N T T E A MBOR : John Roache/Mary Mellema BPA : Robyn MacKay/Tony Norris/Scott BettinNOAA-F: Paul Wagner/Richard Dominigue USFWS : David Wills/Steve HaesekerOR : Rick Kruger/Ron Boyce ID : Russ KieferWDFW : Cindy LeFleur MT : Jim Litchfield/Brian Marotz
COE: Cindy Henriksen/Jim Adams/Cathy Hlebechuk
TMT CONFERENCE CALL Wednesday May 23, 2007 09:00 - 11:00
1125 N.W. Couch Street, Suite 4A34 Portland, Oregon
Conference call line: 503-808-5190
To check into the building, take the elevator to the 5th floor and the guard will issue you an ID badge if you need one and will take you down to the 4th floor where the meeting is. If you have NOT attended a TMT meeting in the past you will need to call ahead and let Cathy Hlebechuk (503) 808-3942, Jim Adams (503) 808-3938 or Cindy Henriksen (503)
808-3945 know, so you can be added to the TMT Visitor List and issued an ID badge. This badge may be used indefinitely. If you have attended TMT in the past you may re-use your ID badge indefinitely. If you are a federal
employee you will also need to have an ID badge issued to you which can be used indefinitely.
We have had disruptions on the phone because people are not hitting 'mute' after dial in.Please MUTE your Phone
All members are encouraged to call Robin Harkless with any issues or concerns they would like to see addressed. Please e-mail her at [email protected] or call her at (503) 248-4703.
AGENDA
1. Welcome and Introductions2. Review [Meeting Minutes] 3. Priest Rapids Update - Russell Langshaw, Grant Co. PUD
a. [Priest Rapids Operations 2007]
4. Grand Coulee Flood Control - Cindy Henriksen, COE / John Roache, BOR5. Dworshak Operations - Cindy Henriksen, COE
ESP 75th PrecentileESP 25th PercentileObserved FlowsESP Daily Mean
Whiskers: ESP Daily Max/Min
ESP flows updated 22-May-2007
This plot displays the daily range of flows from the ESP hydrographs. Fifty percent of the ESP flows fall within the narrow shaded rectangles and the daily extremes of the ESP flows are bound by the "whiskers".
LibbyDouble Peak Operation
0
10
20
30
40
50
60
70
80
1-May 1-Jun 1-Jul 1-Aug
2007
Flow
(kcf
s)
2380
2390
2400
2410
2420
2430
2440
2450
2460
Elev
atio
n (ft
)
Inflow Outflow Elevation
22 MAY STP INFLOW USED STARTING 5/22/07
APR-AUG VOLUME= MAF6.627
9.0 kcfs
22.6 kcfs
Summary of 21 May 2007 ESP Libby Operations 22-May-07
Starting after the Sturgeon pulse a flat flow was targeted to reach elevation 2439.0 feet by the end of August.
The start of VARQ for all flow calculations is 25 April.
Project operated to VARQ flows in April and May based on the official water supply forecasts.
VARQ flows continue through the end of June as a minimum.
Sturgeon pulse began on 18 May for all years. Volume of pulse is 1.17 MAF and was calculated using the May final forecast. Pulse starts at 20 kcfs and held for 4 days. Outflow is increased to full load (25.5 kcfs) and held for 14 days. Outflow is then decreased to 20 kcfs for 3 days and then to 15 kcfs to exhaust the remaining volume.
LIBBY ESP VOLUMES
6626
4000
5000
6000
7000
8000
9000
10000
13579111315171921232527293133353739414345
No. EXCEEDANCES OUT OF 45
APR
- A
UG
VO
L (k
af)
LIBBY MAX ELEVATION (MAY - AUGUST)
2,447.9
2,435.0
2,440.0
2,445.0
2,450.0
2,455.0
2,460.0
13579111315171921232527293133353739414345
No. EXCEEDANCES OUT OF 45
ELEV
ATO
IN (f
t)
START OF VARQ OPERATIONS
25-Apr
18-Apr
20-Apr
22-Apr
24-Apr
26-Apr
28-Apr
30-Apr
2-May
4-May
6-May
8-May
13579111315171921232527293133353739414345
No. EXCEEDANCES OUT OF 45
VAR
Q S
TAR
T D
ATE
LIBBY END OF MONTH ELEVATIONS
2,386.1
2,416.9
2,441.5
2,360.0
2,380.0
2,400.0
2,420.0
2,440.0
2,460.0
13579111315171921232527293133353739414345
No. EXCEEDANCES OUT OF 45
ELEV
ATI
ON
(ft)
30 APR Elev 31 MAY Elev 30 JUNE Elev
LIBBY END OF JUNE ELEVATION
2,441.5
2,410.0
2,420.0
2,430.0
2,440.0
2,450.0
2,460.0
13579111315171921232527293133353739414345
No. EXCEEDANCES OUT OF 45
ELEV
ATI
ON
(ft)
LIBBY END OF JULY ELEVATION
2,446.2
2,430.0
2,435.0
2,440.0
2,445.0
2,450.0
2,455.0
2,460.0
13579111315171921232527293133353739414345
No. EXCEEDANCES OUT OF 45
ELEV
ATI
ON
(ft)
LIBBY PERIOD AVERAGE OUTFLOWS
14860
22072
0
10000
20000
30000
40000
13579111315171921232527293133353739414345
No. EXCEEDANCES OUT OF 45
FLO
W (c
fs)
May 1-15 May 16-31
LIBBY PERIOD AVERAGE OUTFLOWS
19883
14955
0
10000
20000
30000
40000
13579111315171921232527293133353739414345
No. EXCEEDANCES OUT OF 45
FLO
W (c
fs)
Jun 1-15 Jun 16-30
LIBBY PERIOD AVERAGE OUTFLOWS
14897
14897
0
10000
20000
30000
40000
13579111315171921232527293133353739414345
No. EXCEEDANCES OUT OF 45
FLO
W (c
fs)
Jul 1-15 Jul 16-30
Libby Outflows
0
10000
20000
30000
40000
50000
1-May 1-Jun 1-Jul 1-Aug 1-Sep2007
Out
flow
(cfs
)
25th Percentile 75th Percentile Daily Mean Observed Outf low
ESP 75th PrecentileESP 25th PercentileObserved FlowsESP Daily Mean
Whiskers: ESP Daily Max/Min
ESP flows updated 22-May-2007
This plot displays the daily range of flows from the ESP hydrographs. Fifty percent of the ESP flows fall within the narrow shaded rectangles and the daily extremes of the ESP flows are bound by the "whiskers".
COLUMBIA RIVER REGIONAL FORUM TECHNICAL MANAGEMENT TEAM
May 23, 2007 Conference Call
FACILITATOR’S SUMMARY NOTES ON FUTURE ACTIONS Facilitator: Robin Harkless
The following notes are a summary of issues that are intended to point out future actions or issues that may need further discussion at upcoming meetings. These notes are not intended to be the “record” of the meeting, only a reminder for TMT members. Priest Rapids Update Russell Langshaw, Grant County PUD, provided an update on Priest Rapids operations. The project was operated for four days at 60 kcfs flow bands, with 40 kcfs flow bands over the weekend and a minimum 150 kcfs on Thursday, May 17. One exceedance occurred over this time period, .2 kcfs on Saturday May 19.
Action/Next Steps: The fourth and final weekend of protection flows will occur over the weekend of May 26. Beginning Sunday, May 27, the 70 kcfs flow minimum restriction will be removed and the project will operate with standard flow bands to 400 temperature units, for rearing protection. Russell will provide an update at the May 30 face to face TMT meeting.
Grand Coulee Flood Control John Roache, USBR, reported that, given current and forecasted conditions, Grand Coulee would operate this week to a May 31 maximum flood control elevation of 1273.9’. The project was expected to fill some between now and then. The next step will be to discuss and determine how to shape flows in June to fill the project. Cindy Henriksen, COE, shared that the April-August residual runoff for Grand Coulee is estimated at 71%. The COE is working with the other action agencies to strategize about the best controlled refill operation for the month of June, and will come to TMT with more discussion at the next TMT meeting. Dworshak Operations The latest graphs developed by the COE with information on Dworshak were posted and discussed. The April-July residual runoff for Dworshak was estimated at 38%. The project was currently above 1587’ and continuing to fill with inflows above 10 kcfs. A graph of Dworshak augmentation volumes showed potential outflows through June being at 4 kcfs with the current water supply forecast, and 5.1 kcfs with ESP volumes. Current outflows were 5.4 kcfs. The COE recommended continuing this operation through Memorial Day weekend, looking at updated flow forecasts on Tuesday and revisiting the operation with TMT on Wednesday, May 30. The salmon managers discussed this operation at FPAC and had no overriding objections. ID and the Nez Perce tribe said they did not object to the operation. The salmon managers would like to stay apprised of changing conditions, particularly as they relate to achieving the target pool elevation of 1595 by May 31.
1
Action/Next Steps: The COE will operate Dworshak at 5.4 kcfs, and stay “on call” over the weekend to run models and make adjustments as needed if conditions change, otherwise will run models on Tuesday and revisit the operation at the 5/30 TMT meeting.
Sturgeon Pulse/Libby Operation Jason Flory, USFWS, and Cindy Henriksen, COE, updated TMT on the start of the sturgeon pulse operation, which began Friday, May 18. Jason noted that over the weekend a bout of cold water passed through the system, dropping temperatures significantly. Thanks to the efforts of the Libby operators, outflows remained constant out of the project and minimized the effects of the unexpected cold water. Libby was approaching elevation 2410’ and will continue to operate at full powerhouse (around 24 kcfs) for 12 more days. The Sturgeon Recovery Team will continue to monitor and discuss the operation at their weekly Tuesday meetings. The COE also ran scenarios to show how operations might be shaped after the sturgeon pulse – Cindy emphasized that these were not recommendations but rather developed to show bookends of different approaches. One was a ‘double peak’ operation which would operate Libby at 9 kcfs (the bull trout minimum), then increase to 22.6 kcfs in August to get close to end of August refill. The other bookend showed flat flows through August, also approaching August refill. The COE will provide additional Libby operations scenarios at the next TMT meeting. Updated Flow Forecasts Several updated flow forecasts were posted to the TMT web page, including a new whiskers plot graph for Lower Granite, per request. This graph showed a recession across this week followed by varying flows after June 1. Actual flows at Lower Granite were 85 kcfs, and dropping. The April-July residual runoff for Lower Granite was estimated at 52%. Next face-to-face TMT meeting: Wednesday, May 30th
Agenda items will include: • Review Facilitator’s Notes/Meeting Minutes from 6/14, 5/16, 5/23 conference calls • Priest Rapids Update • Grand Coulee Flood Control Operations • Updated Flow Forecasts • Libby Operations Scenarios • Dworshak Operations • Snake River Transportation Follow-Up • Operations Review
2
Columbia River Regional Forum Technical Management Team Conference Call
May 23, 2007 1. Welcome and Introductions Today’s TMT conference call was chaired by Cindy Henriksen and facilitated by Robin Harkless, with representatives from COE, BPA, BOR, NOAA, CRITFC, USFWS, FPC and Idaho participating. The following is a summary (not a verbatim transcript) of the topics discussed and decisions made on the call. Anyone with questions or comments about these notes should provide them to the TMT chair or bring them to the next meeting. 2. Review Meeting Minutes The TMT will check in on various facilitator notes and official minutes for May at its next meeting May 30. 3. Priest Rapids Update
This week brought 4 days of 60 kcfs flow bands and a weekend of 40 kcfs flow bands, followed by a 150 kcfs minimum last Thursday, May 17, Russell Langshaw (Grant Co. PUD) said. The third weekend of protective measures brought a 146.2 kcfs minimum flow. All criteria were met except on Saturday, May 12, when there was an exceedance of 0.2 kcfs. Daily deltas for the week ranged from 20.2 to 43.8 kcfs, with discharges of 152.9 to 176.1 kcfs.
This weekend is the last of four weekends with emergent period protection
measures triggered by 800 temperature units from the end of spawning, Langshaw said. Once initiated, the operation continues for four consecutive weekends. The emergence period formally ended on Sunday, May 20, when the criterion of 1,000 temperature units was met. Ramping rate restrictions will continue from the end of emergence another 400 temperature units when the Chinook rearing period protection program ends for the year. This amounts to about another month of flow band protections, Langshaw said. The PUD no longer is operating under the 70 kcfs elevation minimum, which hasn’t been a problem because of flows recently. Langshaw will give another update at the next TMT meeting.
4. Grand Coulee Flood Control
As of May 22, the maximum elevation at Grand Coulee is 1,273.9 feet on May 31, John Roache (BOR) said. That’s about 10 feet higher than the current elevation, so some fill can be expected. The remaining inflow for April-August as of May 21 is still almost 71% of residual runoff, so every week the COE examines how much residual runoff is yet to come, Henriksen said. The Action Agencies
3
have been working together on a controlled, gradual refill of the reservoirs, particularly at Grand Coulee. Next week, the Action Agencies will work on strategies for the month of June, she said. There will be an update on this issue at the next TMT meeting.
5. Dworshak Operations
Unlike Grand Coulee, the residual runoff for Dworshak as of May 21 was only 38% of remaining runoff for the April-July period, Henriksen said. The May 31 flood control elevation for Dworshak is 1,595 feet, or 5 feet from full. The reservoir is currently at elevation 1,587 feet and continuing to fill. Inflows continue to exceed the powerhouse capacity of 10 kcfs.
Like Grand Coulee, Dworshak is being managed to refill gradually, with
controlled outflows. Henriksen presented a graph of Dworshak augmentation volumes (agenda item 7Bii) showing potential outflows from May 21-June 30. The graph includes runoff volume to date, minimum flows for the project, the volume to fill, and remaining volume available for augmentation. The total outflow volume remaining for May 21-June 30 is about 4 kcfs, which includes augmentation volume plus 1.5 kcfs minimum flows, Henriksen said. By contrast, the remaining augmentation volume is about 5.1 kcfs according to ESP volume traces.
With current outflows at 5.4 to 5.5 kcfs, inflows of more than 10 kcfs, and
the reservoir filling close to its end of May flood control target, the COE recommends maintaining the current outflow using one large unit over the Memorial Day weekend, Henriksen said. Paul Wagner (NOAA) said FPAC had recently discussed options at Dworshak and would find that level of operation acceptable. Russ Kiefer (Idaho) agreed.
COE staff will be available over the Memorial Day weekend to monitor the
situation and reduce outflows early Tuesday morning if needed. Then TMT will assess Dworshak operations at its Wednesday, May 30, meeting. 6. Sturgeon Pulse/Libby Operations
The sturgeon recovery team, via an email to Cindy from USFWS Jason Flory on Wednesday 16 May, recommended the operation begin Friday, May 18, Henriksen said. Libby is currently at full powerhouse and will be for the next 13 days. Last week the reservoir warmed rapidly, Jason Flory (USFWS Spokane) reported. The river was warm enough, there were spawning females upriver, and the initial release of water caused no significant drop in water temperatures.
Since then, colder water moving through the reservoir caused forebay
temperatures to drop from 56 degrees Fahrenheit to 45-49 degrees F. Thanks to careful management by Greg Hoffman (COE) of the temperature control
4
structure at Libby Dam the impacts of the chill on sturgeon spawning have been minimized, Flory said.
Libby is currently releasing full powerhouse flows of around 25 kcfs which
will continue for another 12 days. The reservoir continues to fill slowly toward elevation 2,410 feet. The 25 kcfs releases will be followed by 3 days of 20 kcfs flows, then 15 kcfs flat flows until the 1.17 maf of flow augmentation volume is depleted.
Henriksen presented the bookend scenarios requested at last week’s TMT
meeting. The first scenario (linked to agenda item 6i) shows a double peak operation at Libby for the remainder of the sturgeon pulse after the 15 kcfs outflow is exhausted in late June. The COE modeled an outflow reduced to 9 kcfs and the project didn’t refill. When outflows were increased to 22.6 kcfs in August, the model shows the project came close to refilling by the end of August.
The second scenario (agenda item 6ii) shows an operation of 15 kcfs
steady outflows for the remainder of the sturgeon pulse, the last week of June through August. Under that scenario, the reservoir elevation would be 2,442 feet on June 30, or about 17 feet from full, and 2,439 feet on August 31, or 20 feet from full. 7. Updated Flow Forecasts
Henriksen presented links to updated flow forecasts for Libby, Dworshak, Hungry Horse and Lower Granite. There were no questions. She focused on agenda item 7Ei, a whiskers plot for Lower Granite. The graph according to the May 21 forecast shows good recession of flows over the next week. After the single deterministic 10-day forecast, the graph shows the average flow at Lower Granite continues to recede from its current level of 85 kcfs. The residual runoff above Lower Granite is about 52% of remaining runoff for the April-July period. 6. Next TMT Meeting The next meeting will be in person on May 30, 2007. Agenda items will include a Priest Rapids update, Grand Coulee flood control, Dworshak operations, Snake River transportation follow-up, comments on meeting minutes, possible Libby operation scenarios, and the usual operations review. This meeting summary prepared by consultant and writer Pat Vivian. Name Affiliation Cindy Henriksen COE John Roache BOR Paul Wagner NOAA Kyle Dittmer CRITFC Jason Flory USFWS-Spokane
5
David Wills USFWS Tim Heizenrader Cascade Energy Margaret Filardo FPC Dan Spear BPA Russ Kiefer Idaho Jim Adams COE Bernard Klatte COE Rudd Turner COE Russ George WMC Russell Langshaw Grant Co. PUD Holli Krebs Bear Stearns
6
T E C H N I C A L M A N A G E M E N T T E A MBOR : John Roache/Mary Mellema BPA : Robyn MacKay/Tony Norris/Scott BettinNOAA-F: Paul Wagner/Richard Dominigue USFWS : David Wills/Steve HaesekerOR : Rick Kruger/Ron Boyce ID : Russ KieferWDFW : Cindy LeFleur MT : Jim Litchfield/Brian Marotz
COE: Cathy Hlebechuk/Jim Adams/Cindy Henriksen
TMT MEETING Wednesday May 30, 2007 09:00 - 12:00
1125 N.W. Couch Street, Suite 4A34 Portland, Oregon 97209-4142
Map Quest [Directions]
Conference call line: 503-808-5190
To check into the building, take the elevator to the 5th floor and the guard will issue you an ID badge if you need one and will take you down to the 4th floor where the meeting is. If you have NOT attended a TMT meeting in the past you will need to call ahead and let Cathy Hlebechuk (503) 808-3942, Jim Adams (503) 808-3938 or Cindy Henriksen (503)
808-3945 know, so you can be added to the TMT Visitor List and issued an ID badge. This badge may be used indefinitely. If you have attended TMT in the past you may re-use your ID badge indefinitely. If you are a federal
employee you will also need to have an ID badge issued to you which can be used indefinitely.
We have had disruptions on the phone because people are not hitting 'mute' after dial in.Please MUTE your Phone
All members are encouraged to call Robin Harkless with any issues or concerns they would like to see addressed. Please e-mail her at [email protected] or call her at (503) 248-4703.
AGENDA
1. Welcome and Introductions2. Review [Meeting Minutes] 3. Priest Rapids Update - Russell Langshaw, Grant Co. PUD
a. [Priest Rapids Operations 2007] 4. Grand Coulee Flood Control - Cindy Henriksen, COE / John Roache, BOR5. Updated Flow Forecasts - Cindy Henriksen, COE
a. Libby [LIB Whiskers Plot] b. Dworshak [DWR Augmentation Flows] [DWR Whiskers Plot] c. Hungry Horse [HGH Whiskers Plot] d. Lower Granite [LWG Regulated Flows]
6. Libby Operations Scenarios - Cindy Henriksen, COEa. [Libby Flat Flow Operation - 29 MAY STP INFLOW USED STARTING 5/29/07] b. [Libby Double Peak Operation - 29 MAY STP INFLOW USED STARTING 5/29/07] c. [Libby and Kootenai Temperatures]
ESP 75th PrecentileESP 25th PercentileObserved FlowsESP Daily Mean
Whiskers: ESP Daily Max/Min
ESP flows updated 30-May-2007
This plot displays the daily range of flows from the ESP hydrographs. Fifty percent of the ESP flows fall within the narrow shaded rectangles and the daily extremes of the ESP flows are bound by the "whiskers".
Kootenai River and Koocanusa Reservoir Temperatures2007 Sturgeon Operations (1 May - 30 June)
2320
2340
2360
2380
2400
2420
2440
2460
5/1 5/8 5/15
5/22
5/29 6/5 6/12
6/19
6/26
Res
ervo
ir / G
ate
Elev
atio
n (M
SL)
0
10
20
30
40
50
60
70
80
F, Q
and
MSL
(+17
00)
Koocanusa Elevation
Gate Elevation
LD Temperature ( F )
BF Temperature ( F )
Libby Dam Flow (kcfs)
Bonners Ferry Flow (kcfs)
Koocanusa Inflow (kcfs)
Bonners Ferry Stage
Libby ESP Inflows - Daily Box-Whiskers Plot
0
20000
40000
60000
80000
100000
120000
1-May 1-Jun 1-Jul 1-Aug
2007
Dai
ly In
flow
in c
fs__
ESP 75th PrecentileESP 25th PercentileObserved FlowsESP Daily Mean
Whiskers: ESP Daily Max/Min
ESP flows updated 30-May-2007
This plot displays the daily range of flows from the ESP hydrographs. Fifty percent of the ESP flows fall within the narrow shaded rectangles and the daily extremes of the ESP flows are bound by the "whiskers".
Lower Granite Flows
20000
40000
60000
80000
100000
120000
140000
1-Apr 1-May 1-Jun 1-Jul
Out
flow
(cfs
)
25th Percentile 75th Percentile Daily Mean Observed Outf low
This plot displays t he daily range of regulat ed f lows at Lower Granit e. Fif t y percent of t he f lows f all wit hin t he narrow shaded rect angles and t he daily ext remes of t he f lows are bound by t he “whiskers”. Dworshak is regulat ed t oreach elevat ion 1598.0 f eet on 16 June and 1600 on 30 June.
Brownlee is regulat ed t o reach elevat ion 2077 on 05 June.
LibbyDouble Peak Operation
0
10
20
30
40
50
60
70
80
1-May 1-Jun 1-Jul 1-Aug
2007
Flow
(kcf
s)
2380
2390
2400
2410
2420
2430
2440
2450
2460
Elev
atio
n (ft
)
Inflow Outflow Elevation
29 MAY STP INFLOW USED STARTING 5/29/07
APR-AUG VOLUME= MAF6.306
9.0 kcfs
17.0 kcfs
LibbyFlat Flow Operation
0
10
20
30
40
50
60
70
80
1-May 1-Jun 1-Jul 1-Aug
2007
Flow
(kcf
s)
2380
2390
2400
2410
2420
2430
2440
2450
2460
Elev
atio
n (ft
)
Inflow Outflow Elevation
29 MAY STP INFLOW USED STARTING 5/29/07
APR-AUG VOLUME= MAF6.306
12.6 kcfs
Rationale for considering adopting a maximum transportation program on the Snake River for the later half of May 2007.
• The main reason for considering a maximum transportation program for the balance of the spring season is that research data collected to date indicates that fish arriving late in the season at Lower Granite and Little Goose Dams have a much larger SAR when transported than if they migrate through the hydropower system. Poor late year migration conditions are exacerbated when flows are low. This year, poor in-river migration conditions are anticipated. The seasonal average flow forecast for this spring migration season (April 3 – June 20) is currently projected to be approximately 72 kcfs. The current average flow forecast for this May is an average flow 82 kcfs. Survival data from the year 2002 (Figures 1-3) , which had a seasonal average flow of 83 kcfs indicated that the SARs of both transported wild steelhead and wild spring Chinook were substantially higher than in-river migrants during the late May period.
• The NMFS 2005 Effects memo provided data indicating thresholds for both flow and temperature exist at which juvenile survival decreases at a rapid rate. For steelhead flows below 115 kcfs negatively affected steelhead, spring Chinook were negatively affected below flows of 72 kcfs. Both species showed a rapid decline in survival when temperature exceeded 12.50C (54.5F) at Lower Monumental Dam (Williams et al. 2005).
• The peak daily flow forecasted for the Snake River is currently forecasted to be in the range of 100 kcfs and will be short in duration. The current temperature at Lower Monumental Dam tailrace is 12.20C, (53.7F).
• Using 2002 as a comparable year (even though average volume was higher) the SAR of wild steelhead marked at Lower Granite Dam (LGR) and migrated in-river during the May 15 –June 1 period were <.4%, while transported fish had SARs in the 1.5 – 3% range; comparative SARs of steelhead migrating in-river vs transported from Little Goose Dam (LGS) were ~.5% vs 1 to 2.5%, respectively (Figure 3)(Marsh et al. 2005).
• Data for wild tagged spring Chinook showed a similar trend in terms of transport performance (Marsh et al. 2006). The SARs at LGR for in-river vs. transported fish for the late May period were ~.6% vs 1 – 2.5% respectively (Figure 1). The SARs from LGS in-river vs. transport were in the range of .5 – 1% vs .75 – 1.5% during the late May period (Figure 2).
• Muir (2006) concluded the poorer performance of late season [in-river] migrants is probably due to ocean entry beyond the optimum migration window and declining physiological condition. Thus, transporting a higher percentage of Chinook salmon smolts later in the season would optimize their ocean entry timing and should lead to improved survival.
Summary It is anticipated that substantially fewer adults will return from fish left to migrate in-river versus those transported during the low flow and high temperatures anticipated to occur this year in the later part of May. Transitioning to a maximum transportation program is recommended by NMFS at this time.
-
0.50
1.00
1.50
2.00
2.50
3.00
4/8 4/16 4/24 5/2 5/10 5/18 5/26 6/3 6/11
SAR
LGR Transports
Migrating
-
0.50
1.00
1.50
2.00
2.50
3.00
4/8 4/16 4/24 5/2 5/10 5/18 5/26 6/3 6/11
SAR
LGS Transports
Migrating
Figure 1. Smolt-to-adult return rates by release date for yearling Chinook smolts tagged
in 2002 and either transported from Lower Granite Dam or released to migrate in the river. Data are 5-day running averages of daily juvenile releases, and numbers are adjusted proportional to daily collection numbers at LGR in 2002. The overall transport/inriver migrant ratio was 1.64.
Figure 2. Smolt-to-adult return rates by release date for yearling Chinook smolts tagged
in 2002 and either transported from Little Goose Dam or released to migrate in the river. Data are 5-day running averages of daily juvenile releases, and numbers are adjusted proportional to daily collection numbers at LGS in 2002. The overall transport/inriver migrant ratio was 1.34.
Figure 3. Smolt-to-adult return rates by juvenile tagging date for steelhead smolts transported from Lower Granite (LGR transport, above) and Little Goose Dam (LGS transport, below) compared with SARs of their inriver migrant cohorts in 2002. Also shown is the distribution of juvenile fish collected at these dams in 2002.
SAR
SAR
Figure 4. Flow during the spring migration period at Lower Granite for the
years 2002 and 2007. The magnitude of flow in 2007 is projected to be less than that observed in 2002 due to a substantially lower runoff volume in 2007. The April to July runoff volume in 2002 was 19.2 Maf vs 14.2 Maf for 2007.
References Cited: Marsh, D. M., and coauthors. 2006. Research related to transportation of juvenile
salmonids on the Snake River 2005: Final report for 2002 spring/summer Chinook salmon juvenile migration. Report of Research by Fish Ecology Division, Northwest Fisheries Science Center, National Marine Fisheries Service, National Oceanic and Atmospheric Administration to the U.S. Army Corps of Engineers, Walla Walla District, 43 p. .
Marsh, D. M., and coauthors. 2005. Transportation of juvenile salmonids on the
Columbia and Snake Rivers, 2004: Final report for 2002 steelhead juveniles with updates on other transport studies. Report of Research by Fish Ecology Division, Northwest Fisheries Science Center, National Marine Fisheries Service, National Oceanic and Atmospheric Administration to the U.S. Army Corps of Engineers, Walla Walla District, 46 p. .
Muir, W.D., D.M. March, B. P. Sandford, S. G. Smith, and J. G. Williams. 2006. Post-
Hydropower System Delayed Mortality of Transported Snake River Stream-Type
Chinook Salmon: Unraveling the Mystery. Transactions of the American Fisheries Society 135:1523–1534.
Williams, J. G., and coauthors. 2005. Effects of the Federal Columbia River Power
System on salmon populations. U.S. Dept. Commer., NOAA Tech. Memo. NMFS-NWFSC-63, 150 p. (Available online at http://www.nwfsc.noaa.gov/publications).
The following notes are a summary of issues that are intended to point out future actions or issues that may need further discussion at upcoming meetings. These notes are not intended to be the “record” of the meeting, only a reminder for TMT members. Priest Rapids Update TMT members reviewed the graph linked to the TMT agenda, showing no exceedances through the fourth and final weekend of flow protection.
Action/Next Steps: The project will continue to operate with standard flow bands up to 400 temperature units, for rearing protection. An update on Priest Rapids will be on the agenda for the 6/13 TMT meeting.
Grand Coulee Flood Control The project was at 1267.3' on 5/30. John Roache, USBR, reported that the maximum flood control elevation of 1273.9' was still in effect until May 31. There is also a maximum flood control elevation of 1275' by 6/3.
Action/Next Steps: Cindy Henriksen, COE, said that more technical information, including year-to-year comparisons, as requested, will be available and shared at the 6/13 TMT meeting.
Updated Flow Forecasts / Dworshak Operations Cindy Henriksen, COE, referred TMT to several flow forecasts posted to the TMT web page, updated as of 5/29. She noted that inflows to headwater projects were generally in recession. Paul Wagner, NOAA, reported that FPAC discussed a recommendation for Dworshak: dropping outflows to 2.5 kcfs (one small unit), given the projected high temperatures and low inflows. ID and the Nez Perce Tribe said they recommended stepping outflows down as soon as possible, and CRITFC said that given the forecast for June, they concurred. Henriksen acknowledged the desires of the Salmon Managers to operate the project conservatively, and noted the COE desire for a step down in outflows through the month of June while maintaining a 2' reserve in case of a rain event, thereby avoiding any potential ‘fill and spill.’ Federal Agency representatives held a caucus and made a Dworshak recommendation to operate Dworshak with outflows of 4.4-4.5 kcfs (2 units) from 5/30 and holding until 6/2, when the project will shift to 2.3 kcfs (one small unit.)
Action/Next Steps: This item will be on the agenda for the TMT meeting on 6/13. Cindy Henriksen said she would work with Dave Statler, Nez Perce Tribe, to develop scenarios for review at the next meeting. UPDATE: Henriksen sent the following email out at 5:11 p.m. on 5/30:
1
“At 2200 hours, outflow will be reduced from approximately 5400 cfs to 4500 cfs. A second reduction will occur on Friday evening, 01 June at 2200. At that time, outflow will be reduced from approximately 4500 cfs to 2300 cfs. The Friday night reduction is slightly sooner than what had been described during the TMT meeting today. The Friday night reduction still meets the multiple purpose uses of the dam, and based on what I heard at the TMT meeting today is consistent with the desires of the salmon managers”
Libby Operations Scenarios Cindy Henriksen, COE, referred TMT to two scenarios linked to the TMT agenda that were based on the newly forecasted inflows of 6.3 MAF, showing how operations might be shaped after the sturgeon pulse. The first scenario showed a flat 12.6 kcfs flow beginning 6/23, when the sturgeon flow is expect to be exhausted and continuing through August refill. The second scenario was a ‘double peak’ operation which would reduce outflows to 9 kcfs on 6/23 (the bull trout minimum), then increase to 17.0 kcfs on 8/1, and continuing through to refill. MT commented that the first scenario was their preference and suggested that further information on the status of sturgeon spawning and updated June forecasts will help them determine whether dropping flows earlier than 6/23 and/or dropping to a rate between 12.6 and 9 kcfs would be feasible.
Action/Next Steps: MT will likely draft an SOR that addresses the desire for flatter flows through August and potentially into September. MT will look to gather input/feedback from IT representatives at their 6/7 meeting, and Libby Operations will be discussed by Salmon Managers and TMT members at the 6/13 meeting.
Temperatures at Libby/Kootenai River Cindy Henriksen, COE, referred TMT to temperature graphs linked to the TMT agenda that were developed by the Sturgeon Recovery Team. The graphs showed reservoir temperatures warming as the season progresses; outflows have yet to reflect that warming. Reservoir temperatures were approaching the 10°C that is best for sturgeon spawning. TMT members commended the job the COE does in managing the complex river system.
Action/Next Steps: The COE will provide updates to TMT at the 6/13 meeting and will ask FPAC members which particular information would be most useful in making an operational recommendation.
Operations Review Reservoirs – Cindy Henriksen and John Roache reported on reservoirs. Grand Coulee was at elevation 1267.3' and will have elevations of no greater than 1275' effective 6/3. Hungry Horse was about 9' from full, at 3551.06’, with 6.2 kcfs outflows. Libby was at 2411', with outflows at full powerhouse. It was noted that the Libby unit discussed during the 5/23 conference call was indeed only offline for a few hours. Dworshak was at elevation 1591', about 9' from full. Average flows through 5/29 were 81 kcfs at Lower Granite, 175 kcfs at Priest Rapids and 268 kcfs at McNary.
2
Fish – Paul Wagner, NOAA, reported on juvenile and adult fish. Updated passage numbers on the Fish Passage Center website indicated that yearling migration was ending. Lower river passage seemed to have reached its peak as well. Subyearling counts were picking up at Lower Granite, with counts of 3,000 and expected to climb during the coming weeks. Steelhead at Lower Granite were decreasing into the 10,000 range and were decreasing at Little Goose and Lower Monumental as well. Wagner noted that Little Goose data was expected to be updated with RSW information, to better reflect actual counts. Sockeye passage at Lower Granite peaked between May 15-21st. Wagner added that the tailrace at Lower Monumental was at a temperature of 14°C and was expected to continue to rise. Total Chinook counts at Bonneville were at 65,354 and close to predicted; Jack counts continued to be strong. NOTE: Russ Kiefer, ID, referred TMT to a recent shift in the pacing of fish passage at Little Goose and Lower Monumental. He noted that ID was very concerned and that he wanted TMT members to be aware of the as yet unexplained difference in passage timing compared to that of previous years. He said that he would be working with local project biologists and FPOM to try to understand the problem and would contact TMT members ASAP if there was any identifiable need for a substantial change in operations. Power system – Nothing to report. Water quality – Laura Hamilton, COE, referred to the TMT homepage and reported on TDG exceedances: there were 10 exceedances in the last two weeks and 37 total exceedances for the month of May. Spill cap information is updated every two weeks on the TMT web page. Spring-Summer Non-Treaty Storage Agreement Tony Norris, BPA, reported the following: Arrow has been up against flood control since the end of April and is expected to be at flood control through June. The consequences are that some of the 1 maf summer flow augmentation water will likely be forced out in June. It also means that the potential for moving water from spring to summer is very unlikely. Given these facts BPA had some questions for the Salmon Managers.
1. Do you want BPA to continue to pursue spring for summer non treaty storage in the chance that some storage space might be available?
2. If so, how much storage is an acceptable amount? Salmon Managers present at the meeting said that more information, including June forecasts, HYSSR runs, and June-August flows and volumes would need to be reviewed prior to providing feedback on the questions.
Action/Next Steps: Tony Norris will discuss the questions with the Salmon Managers offline and this will be an item on the agenda for the 6/13 TMT meeting.
Next face-to-face TMT meeting: Wednesday, June 13th
Agenda items will include: • Review Facilitator’s Notes/Meeting Minutes from 6/14, 5/16, 5/23 and 5/30. • Priest Rapids Update
3
• Grand Coulee Flood Control Update • Updated Flow Forecasts • Libby Operations Scenarios • Dworshak Operations • Snake River Transportation Follow-Up • MT SOR for Libby/Hungry Horse • Nez Perce Summer Operations • Spring-Summer Non-Treaty Storage Agreement • Operations Review
4
Columbia River Regional Forum Technical Management Team Meeting
May 30, 2007 1. Welcome and Introductions Today’s TMT meeting was chaired by Cindy Henriksen and facilitated by Robin Harkless, with representatives from BOR, CRITFC, COE, BPA USFWS, NOAA, Montana, Idaho, and the Nez Perce Tribe attending. The following is a summary (not a verbatim transcript) of the topics discussed and decisions made at the meeting. Anyone with questions or comments about these notes should provide them to the TMT chair or bring them to the next meeting. 2. Review Meeting Minutes
The COE is reviewing the notes and comments for TMT meetings held on May 14, 16 and 23, Henriksen said. These notes can be finalized at the June 13 meeting. Notes for the meetings on May 2 and 9 have been finalized and are attached to the TMT webpage. 3. Priest Rapids Update
The need for this operation usually lasts until mid-June, said Paul Wagner (NOAA) on behalf of Russell Langshaw (Grant County PUD). The four special weekends of controlled flows are done. Grant County PUD will continue to monitor the number of temperature units accumulated to determine the end of the Chinook protection operation. As of the last TMT meeting on May 23, 800 temperature units had been accumulated, with 400 more to go. The updated report on the Priest Rapids operation is attached to today’s TMT agenda. 4. Grand Coulee Flood Control
As of last week’s TMT meeting, the maximum Grand Coulee flood control elevation was 1,273.9 feet on May 31;the current guidance is elevation 1,275 feet on Sunday, June 3, John Roache (BOR) said. Grand Coulee is at 1,267.3 feet now and filling. The COE will have more information available for the next TMT meeting on June 13, Henriksen said. Paul Wagner (NOAA) asked how things stand relative to prior years. That question was raised before, Harkless noted. 5. Updated Flow Forecasts
Henriksen presented updated inflow forecast graphs for Libby, Dworshak, Hungry Horse, and Lower Granite. The first 10 days represent a single deterministic inflow forecast, followed by 44 historical sequences of temperature and precipitation overlaid on snowpack. Inflows at most projects generally are in recession. Remaining inflows this season will come from whatever snowpack is
5
still available, plus unforeseen rain events. Jim Litchfield (Montana) asked whether Libby would peak in the next week or so at around 60 kcfs; Henriksen said yes, but that Libby inflow has been a “dribbler” thus far this year.
Hungry Horse inflows were 10 kcfs yesterday, and Roache thought they
would go higher than that as a result of snowmelt. Lower Granite regulated flows show a general recession from now through the end of June, Henriksen said. Beginning around the first of July, flow increases can be expected as a result of Dworshak flow augmentation.
Regarding Dworshak augmentation volumes, the average outflow
available from May 29 through June 30 is 5 kcfs, with a maximum outflow of 6.9 kcfs, according to the ESP graph. The regression equation forecast using the expected volume from the May final water supply forecast shows an average outflow of 3.7 kcfs from now through the end of June. Henriksen noted the difference between the two methodologies is that the ESP inflow is updated weekly, and the regression forecast was prepared May 1. Dave Statler (Nez Perce) asked for more information regarding flow augmentation assumptions for Dworshak this summer and fall; Henriksen said she would get back to him on that before the next meeting. Dworshak flow augmentation scenarios will be on the June 13 agenda.
Discussion moved to Dworshak operations, including a brief federal
caucus, summarized under #7 below.
6. Libby Operations Scenarios
Henriksen presented two “bookend” scenarios for Libby operations in response to a request made at last week’s TMT meeting. The flat flow operation involves another week of full powerhouse outflows through next Tuesday, then 20 kcfs for 3 days and 15 kcfs flat flows after that, until the 1.1 maf sturgeon volume is exhausted June 23. Following that, outflows would be dropped to 12.6 kcfs and the reservoir managed to meet elevation 2,439 feet by mid August. She noted that the regression water forecast is 6.99 maf, whereas the STP forecast, on which this scenario is based, was only 6.3 maf. This forecast shows a refill failure of around 11-12 feet. Modeling of the 6.9 maf forecast resulted in a flat flow of about 15 kcfs following the end of the sturgeon volume ending June 23, with a similar failure to fill the reservoir.
The other bookend is a double peak operation which is identical
throughout the remainder of the sturgeon pulse ending June 23. Then outflows drop to 9 cfs, the bull trout minimum flows, in order to fill the reservoir as full as possible. On Aug. 1, outflows increase to 17 kcfs, based on the same inflow forecast of 6.3 maf. While emphasizing that the double peak operation creates havoc in the upper river, Litchfield said the exercise helped him understand the substantial uncertainty involved in forecasting inflows. TMT members made two
6
suggestions: (1) check sturgeon data for the possibility of dropping flows at Libby sooner than June 23, and (2) look at the possibility of releasing flat outflows of from 9 to 12.6 cfs, thus extending available volume further into September.
Litchfield volunteered to prepare a Montana SOR regarding Libby
operations for the June 13 TMT meeting, seeking consensus in the meantime regarding flat flow targets throughout the summer. NOAA, Idaho and Montana representatives agreed to that process. Roache asked if a Hungry Horse proposed operation would be included in the SOR and Litchfield said yes, that a proposed Hungry Horse operation would be included. The Montana representatives will try to prepare the SOR in time for the IT meeting on June 7.
7. Dworshak Operations
At their last meeting, FPAC members expressed a desire to reduce flows to approximately 2.5 kcfs now, refill the project in early June, and pass inflows for the rest of the spring season, Wagner said. This is going to be a low flow summer and the Snake River is already heating up.
Because the reservoir is at elevation 1,591 feet now and filling, the
concern is that if it fills in early June, a “fill and spill” situation could result, Henriksen said. Russ Kiefer (Idaho) favored going to efficient operation of one small unit now, stepping down the to FPAC recommendation of 2.4-2.6 kcfs at this time, adjusting operations later as needed. He agreed with Statler that filling the reservoir now would allow for more flexibility later, and that the risk of “fill and spill” is low. Most of June will probably be dry, so CRITFC favored a conservative approach, making sure that Dworshak reaches refill elevation by the end of June, Kyle Dittmer said.
The Action Agencies caucused to discuss Dworshak operations. As a
result, the Action Agencies and the Salmon Managers agreed on a Dworshak strategy for June: allow the reservoir to fill (it’s presently 9 feet from full) and reserve flows for use as needed later for temperature control of the river. The COE will change to two units and 4.6 kcfs outflows at Dworshak this evening, with a later reduction to one unit and 2.3 kcfs outflows on Saturday morning, June 2, Henriksen said. The COE will reserve 2 feet of space in the reservoir below full pool of 1,600 feet as a buffer against “fill and spill.” That is equivalent to approximately 39 kaf of water storage, Henriksen said. USFWS, NOAA, BPA, Idaho, and Montana representatives agreed to this operation. TMT will revisit the issue at its June 13 meeting. 8. Operations Review A. Reservoirs. Grand Coulee is at elevation 1,267.3 feet and slowly filling, Roache said. Its maximum elevation is 1,275 feet as of Sunday, June 3.
7
Hungry Horse is at elevation 3,551.06 feet, releasing 6.2 kcfs, 9 feet from full, Roache said.
Libby is at elevation 2,411 feet, 48 feet from full, Henriksen said. Outflow continues at full powerhouse for the sturgeon pulse. For about 2:30 to 3:00 hours on the afternoon of May 23, there was a brief ramp down to repair one of the units, which accounts for the small reduction in hourly outflows that day, Henriksen said.
Dworshak is at elevation 1,591 feet, about 9 feet from full. There will be
reductions in outflow beginning this evening as discussed under “Dworshak Operations” above. Priest Rapids average flows were 175 kcfs for May; McNary average flows were 268 kcfs for May; and Lower Granite average flows for the month were 81 cfs.
B. Fish. Combined yearling Chinook counts have fallen to around 100,000
at Lower Granite and Little Goose, Wagner said. Even fewer fish have passed Lower Monumental, which indicates that the end of yearling Chinook migration is in sight. Counts are also trending down at John Day and Bonneville dams.
Index counts for subyearling Chinook – the coming attraction in terms of
river management – have increased from a couple hundred per day to around 3,000 a day, Wagner said. Hatchery releases will begin in the next week, if they haven’t begun already. Counts will include wild and hatchery fish.
Steelhead counts at Lower Granite are higher than for yearling Chinook,
but in general also appear to be decreasing, Wagner said. Lower Monumental counts reflect the effects of transportation at upper river projects. Wagner noted that the RSW at Lower Granite passes fish more efficiently than a typical spillway, and the passage index will be revised soon to reflect that.
Sockeye yearling migration at Lower Granite peaked at around 50,000 on
May 15-20 and is now decreasing, Wagner said. Adult Chinook passage at Bonneville is at 65,352, which is within the
range of the pre-season forecast of 80,000 fish at the Columbia River mouth. Jack counts are still going strong, headed for a record year. In general, conditions in the estuary look good this year, Wagner said, which could lead the way to a string of good years for fish, though conditions right now are not good in the Snake River.
Russ Kiefer pointed out that adult passage data from April 1 through May
31 in the Snake indicate that something between Lower Monumental and Little Goose is causing problems for the run, with counts of 21,852 and 14,536 respectively. Something appears to have stalled around 5,000 adults moving up the river, which is of concern to Idaho. Kiefer noted that the counts tracked much
8
more closely last year, despite higher levels of spill last year. He asked TMT to start thinking about a cause and a solution for whatever has stalled such a large portion of this year’s returning adults.
Regarding sturgeon spawning, a tagged ripe female and a tagged ripe
male have been detected upstream of Bonner’s Ferry, Marotz reported. As soon as the water temperature passes 8 degrees centigrade, conditions are considered good for spawning. Eggs have been taken to stock the Kootenai Tribal hatchery. The TMT will check back in on the sturgeon operation June 13.
C. Power. There is nothing new to report regarding the power system, Tony Norris (BPA) said.
Regarding the Spring/Summer non treaty storage agreement, Arrow has
been up against flood control since the end of April and is expected to be at flood control through June, he said. The consequences are that some of the 1 maf summer flow augmentation water will likely be forced out in June. It also means that the potential for moving water from spring to summer is very unlikely. Given these facts, Norris presented some questions for the Salmon Managers to consider:
1. Do you want BPA to continue to pursue spring for summer non treaty
storage in the chance that some storage space might be available?
2. If so, how much storage is an acceptable amount?
D. Water Quality. Laura Hamilton (COE) showed TMT how to access 2007 spill information from the TMT webpage (it’s under water quality data). There have been 10 TDG exceedances in the past two weeks and 37 for this month. Generally, the number of exceedances is going down, due to lower flows and the fact that most projects are operating either to a percentage of spill or a fixed spill quantity. 9. Next TMT Meeting Agenda
The next TMT meeting on June 13 will include a Priest Rapids update, Dwoshak current operations and scenarios for summer, Libby operations, an update on the sturgeon pulse, the Montana SOR on Libby and Hungry Horse reservoir management, a Grand Coulee flood control update, review of various meeting minutes and facilitator’s notes, and the usual operations review. This meeting summary was prepared by consultant and writer Pat Vivian. Name Affiliation John Roache BOR Cindy Henriksen COE Paul Wagner NOAA
9
Tony Norris BPA Jim Litchfield Montana Tim Heizenrader Cascade Energy Scott Bettin BPA Holli Krebs Bear Stearns Jennifer Miller Susquehanna Kyle Dittmer CRITFC Laura Hamilton COE Randy Wortman COE Don Faulker COE Paul Kosky COE Ruth Burris PGE Phone: Brian Marotz Montana Dave Wills USFWS Dan Spear BPA Barry Espensen CBB Shane Scott NWRP Rudd Turner COE Glen Trager Avista Energy Russ Kiefer Idaho Margaret Filardo FPC Dave Statler Nez Perce Irene Netik Puget Sound Energy
10
T E C H N I C A L M A N A G E M E N T T E A MBOR : John Roache/Mary Mellema BPA : Robyn MacKay/Tony Norris/Scott BettinNOAA-F: Paul Wagner/Richard Dominigue USFWS : David Wills/Steve HaesekerOR : Rick Kruger/Ron Boyce ID : Russ KieferWDFW : Cindy LeFleur MT : Jim Litchfield/Brian Marotz
COE: Cathy Hlebechuk/Jim Adams/Cindy Henriksen
TMT MEETING Wednesday June 13, 2007 09:00 - 12:00
NOAA Fisheries Mt.St.Helens Room, 10th floor
1201 N.E. Lloyd Blvd Portland, Oregon 97232-1202
Map Quest [Directions]
Conference call line: 503-808-5190
Before going to the 10th floor you must check in on the 11th floor.
We have had disruptions on the phone because people are not hitting 'mute' after dial in.Please MUTE your Phone
All members are encouraged to call Robin Harkless with any issues or concerns they would like to see addressed. Please e-mail her at [email protected] or call her at (503) 248-4703.
AGENDA
1. Welcome and Introductions2. Review Facilitator's Notes/Meeting Minutes from 5/14, 5/16, 5/23 and 5/30 [Meeting Minutes] 3. Priest Rapids Update - Russell Langshaw, Grant Co. PUD
a. [Priest Rapids Operations 2007] 4. Grand Coulee Flood Control and Refill - John Roache, BOR / Cathy Hlebechuk, COE5. Updated Flow Forecasts - Cathy Hlebechuk, COE
a. [Libby - ESP Inflow Flat Flow Operation] b. [Libby Max Elevation - ESP Inflows] c. [Libby - STP Inflow Flat Flow Operation] d. [Kootenai River and Koocanusa Reservoir Temperatures2007 Sturgeon Operations (1 May - 30 June)]
8. MT SOR for Libby/Hungry Horse - Jim Litchfield, MTa. [2007-MT-1_Final]
9. Spring-Summer Non-Treaty Storage Agreement - Tony Norris , BPA10. Little Goose Spill for Adult Fish Passage - COE11. Lower Monumental and McNary Summer Spill Schedules - Walla Wall, COE [Walla Walla will call in at 11:00]12. Operations Review
a. Reservoirsb. Fish
1. [Gas Bubble Trauma in Juvenile Snake River Steelhead]c. Power Systemd. Water Quality - Jim Adams,COE
1. [Spill Information 2007]2. Lower Monumental Spill
13. OtherSet agenda for next meeting - June 20, 2007 [Calendar 2007]
Questions about the meeting may be referred to Cathy Hlebechuk at (503) 808-3942 or Jim Adams at (503) 808-3938 or Cindy Henriksen at (503) 808-3945.
MEMORANDUM TO: Agnes Lut, OR-DEQ Chris Maynard, WA DOE Technical Management Team Members FROM: Paul Wagner
FPAC Chairperson DATE: June 8, 2007 RE: Incidence of GBT in Juvenile Snake River Steelhead It has been brought to the attention of the Salmon Mangers that there has been a recent increasing trend in the observation of steelhead exhibiting signs of gas bubble trauma at the Little Goose and Lower Monumental sampling sites. The attached memo contains the technical information explaining the observations. The information was discussed today by the Fish Passage Advisory Committee. The FPAC recommendation was to maintain the spill levels at these two projects and to continue to closely monitor the juvenile steelhead and fall Chinook. The basis of this recommendation was the decreasing numbers of steelhead, the increasing numbers of subyearling migrants, and the fact that the severity of GBT signs is still below that which would warrant a change in spill operations. The passage season for steelhead is almost over. We will advise you if any additional action needs to take place based on the monitoring information.
FROM: Margaret Filardo and Jerry McCann DATE: June 8, 2007 RE: Steelhead and GBT at Little Goose and Lower Monumental dams Data from GBT exams has shown a high incidence of GBT in late migrating steelhead at both Little Goose and Lower Monumental dams. Sample sizes at Little Goose Dam have met the sample protocol while at Lower Monumental Dam they have been below sample size criteria. Although only 66 fish were examined on June 4, there were 12 steelhead with fin signs; a total of 18% fin signs. No severe signs were observed, but several fish had bubbles in more than one fin. There was also a relatively high incidence of signs recorded the following day, June 5 at Little Goose Dam. Table 1. Summary of GBT signs at Little Goose and Lower Monumental in the past two days sampling. Site and Date
All the signs were in steelhead, and with only a few Chinook examined. It should be noted that we typically see an increase in signs in steelhead as the season progresses, typically increasing to 10% incidence or less by this time of the season. And also, steelhead numbers are declining while subyearling Chinook indices are increasing. Because of our concern for the steelhead migrants, and for the subyearling migrants, who are beginning to increase in their numbers, SMP crews were requested to conduct additional GBT monitoring this week at both sites. The result of that monitoring is incorporated into the table above. The high number of Lyons Ferry fish and the dwindling numbers of steelhead at the Lower Monumental site resulted in a sample of only 22 fish. The levels of GBT have increased in the observed fish. Few subyearling migrants were sampled; however, those that were observed showed no signs of GBT. TDG has not exceeded waiver criteria, and for the most part has been well below criteria at these projects. It is unlikely that under normal migration conditions we would be observing these levels of GBT at these levels of TDG.
Maule et al. (1997) observed that incidence and severity is a function of TDG level and exposure time. It seems likely that what we are observing is the result of the longer travel times observed for the late migrating steelhead. The present flows are in the mid 50s at these projects and the travel time estimates observed between Lower Granite to Little Goose Dam are about 4.9 days, which is a longer travel time than was observed in 2001 during the same time period. The average travel time between Little Goose and Lower Monumental is 6.5 to 7.5 days. It is likely that the long travel time is causing an increased exposure time and causing the fish to show the signs of GBT. There are also other factors that may be contributing to these long travel times. In addition to flow, there could be a delay in the forebays of the projects that might be a function of the present spill patterns, or spill amounts that are being provided at both Little Goose and Lower Monumental dams. Neither of these projects have RSWs in place. There is a dilemma as to what to do regarding spill at these two Snake River projects. The late migrating steelhead are the last to arrive and represent a small portion of the run. The criteria established in the COE’s waiver have not been exceeded. Decreasing spill would decrease the TDG in-river. However, if spill is decreased it would increase the residence time and take even more time for the steelhead to get through the river. In addition, the subyearling
migration is picking up and given that there is little data regarding the effects of transportation on these fish, it would not be appropriate to increase collection of these fish for transportation and to a have a migration corridor with decreased spill for those fish that remain in-river. Based on 10-year average 98% of steelhead have passed Lower Granite by June 5. In contrast, 10% of subyearling Chinook have passed by June 8, and an additional 20% will have passed in the next two weeks; consistent with historic peak passage timing for subyearlings in the Snake River occurring over the next 6 to 8 weeks. The potential for project passage delay in the forebay may be exacerbated by the existing spill volumes and the remedy for the long travel times may be to actually increase spill to promote project passage.
Lower Granite Tailwater Temperatures 2000-2007
40
44
48
52
56
60
64
68
72
76
80
6/1
6/4
6/7
6/10
6/13
6/16
6/19
6/22
6/25
6/28 7/1
Date
Tailw
ater
Tem
pera
ture
(o F)
2000 2001 2002 2003 2004 2005 2006 2007
Libby Outflows
0
10000
20000
30000
40000
1-May 1-Jun 1-Jul 1-Aug2007
Out
flow
(cfs
)
25th Percentile 75th Percentile Daily Mean Observed Outflow
This plot displays the daily range of regulated flows at Libby using all 45 ESP inflow hydrographs. Fifty percent of the flows fall within the narrow shaded rectangles and the daily extremes of the flows are bound by the “whiskers”. After the sturgeon volume is exhausted (23 June), Libby is regulated to a flat flow to reach elevation 2439 feet on 31 August.
12 kcfs
16 kcfs
Libby - STP InflowFlat Flow Operation
2449.2
0
10
20
30
40
50
60
70
80
1-May 1-Jun 1-Jul 1-Aug
2007
Flow
(kcf
s)
2380
2390
2400
2410
2420
2430
2440
2450
2460
Elev
atio
n (ft
)
Inflow Outflow Elevation
12 JUNE STP INFLOW USED STARTING 6/12/07
APR-AUG VOLUME= MAF
14.0 kcfs
6.484
Kootenai River and Koocanusa Reservoir Temperatures2007 Sturgeon Operations (1 May - 30 June)
2320
2340
2360
2380
2400
2420
2440
2460
5/1 5/8
5/15 5/22
5/29 6/5
6/12
6/19
6/26
Res
ervo
ir / G
ate
Elev
atio
n (M
S
0
10
20
30
40
50
60
70
80
90
100
F, Q
and
MSL
(+17
00
Koocanusa Elevation
Gate Elevation
LD Temperature ( F )
BF Temperature ( F )
Libby Dam Flow (kcfs)
Bonners Ferry Flow (kcfs)
Koocanusa Inflow (kcfs)
Bonners Ferry Stage
Libby Dam Air Temp (MaxF)
LD Optimal (F)
Lower Granite Regulated Flows
20000
40000
60000
80000
100000
120000
140000
1-Apr 1-May 1-Jun 1-Jul
Out
flow
(cfs
)
25th Percentile 75th Percentile Daily Mean Observed Outflow
This plot displays the daily range of regulated flow s at Low er Granite. Fifty percent of the flow s fall w ithin the narrow shaded rectangles and the daily extremes of the flow s are bound by the “w hiskers”. Dw orshak is regulated to reach elevation 1600 feet on 30 June. Brow nlee is regulated to reach elevation 2077 on 20 June.
6/12/2007
Dworshak Augmentation VolumesESP inflows and 01-Jun Water Supply Forecast
0
500
1000
1500
2000
2500
3000
1962
1985
1961
1977
1956
1960
1953
1989
1972
1957
1986
1987
1974
1965
1981
1976
1979
1973
1990
1949
1951
1959
1963
1983
1967
1954
1975
1980
1982
1978
1966
1991
1964
1970
1993
1968
1984
1992
1952
1988
1969
1971
1958
1950
1955
30%
50%
70%
ESP Years and 1 April Water Supply Forecasts
Apr
il-Ju
ne R
unof
f in
KA
F..
AugmentationVolume
Volume to Fill
MinFlow (1.5 kcfs)Volume:Date to 30-JuneRunoff Volume toDate
ESP 75th PrecentileESP 25th PercentileObserved FlowsESP Daily Mean
Whiskers: ESP Daily Max/Min
ESP flows updated 12-Jun-2007
This plot displays the daily range of flows from the ESP hydrographs. Fifty percent of the ESP flows fall within the narrow shaded rectangles and the daily extremes of the ESP flows are bound by the "whiskers".
The following notes are a summary of issues that are intended to point out future actions or issues that may need further discussion at upcoming meetings. These notes are not intended to be the “record” of the meeting, only a reminder for TMT members. Review of Facilitator Notes / Meeting Minutes Facilitator notes and meeting minutes for the May 14, 16, 23 and 30th TMT meetings were posted as links to the TMT website. Paul Wagner noted an edit to the May 30th facilitator notes: page 3, in the fish operations section, Lower Granite, not “Little Goose” passage data was expected to be updated. TMT members said they needed more time to review the 5/30 meeting minutes; they will be finalized at the 6/20 meeting. Priest Rapids Update TMT members reviewed a Priest Rapids operation graph linked to the TMT agenda, showing no exceedances between 5/28 -6/10. Russell Langshaw, Grant County PUD, clarified that dates without flow bands displayed on the graph were those with inflows exceeding 170 kcfs.
Action/Next Steps: The project will operate for one more week with standard flow bands until 400 temperature units are reached, for rearing protection. An update on Priest Rapids will be on the agenda for the 6/20 TMT meeting.
Grand Coulee Flood Control John Roache, BOR, reported that the project was at 1282.1' on 6/13 and will operate with a maximum elevation of 1285', effective 6/17. Cathy Hlebechuk, COE, reported on expected residual runoff from June 11 to the end of the forecast period for the following projects. She emphasized the residual runoff is based on the June final forecasts:
• Dworshak, through end of July: 17.7% • Libby, through end of August: 44% • Hungry Horse, through end of August: 30% • Albeni Falls, through end of July: 31% • Grand Coulee, through end of August: 48% • The Dalles, through end of August: 42% • Lower Granite, through end of July: 24.5% • Arrow, through end of August: 60%
Roache shared the BOR preference to refill Grand Coulee to its full elevation of 1290' on 7/8 or 7/9, for recreation purposes and being aware of the spring flow targets at Priest Rapids and the spring and summer flow targets at McNary. The following
2
representatives provided feedback on the proposal: NOAA: support; MT: support; OR: support; ID: no comment; COE: support; BPA: support; Nez Perce: no comment; CRITFC: neither oppose nor support.
Action/Next Steps: The BOR will operate Grand Coulee as proposed and will work with the COE to analyze project volumes on a weekly basis. This will be on the agenda for the 6/20 TMT meeting.
Updated Flow Forecasts / Dworshak Operations Cathy Hlebechuk, COE, referred TMT to several flow forecasts posted to the TMT web page, updated as of 6/12. John Roache, BOR, noted that Hungry Horse inflows had receded to 7 kcfs, which had been taken into account in the proposed operations. Libby inflows were at 42 kcfs and were forecasted to continue to recede. Lower Granite outflows were expected to drop to near 30 kcfs by the end of July. Jim Adams, COE, noted the recent moderate weather and said that Lower Granite tailwater temperatures were average as compared to 2000-2007 data. Hlebechuk reported on Dworshak operations: inflows were 7.3 kcfs, outflows were 4.3 kcfs, elevation was 1598.8', and augmentation volumes per this week’s ESP ranged between a minimum 76 kaf and a maximum 160 kaf. Hlebechuk said that Dworshak elevation was expected to reach its full elevation of 1600' by the end of June. Dave Statler, Nez Perce Tribe, and Kyle Dittmer, CRITFC, said that they support Dworshak fill before the end of June. Hlebechuk acknowledged the desires of the Nez Perce and CRITFC, and TMT members suggested that reviewing summer flow scenarios produced by the EPA and COE, as in the past, would help inform Dworshak discussions at the next meeting.
Action/Next Steps: • The COE will continue its Dworshak operations and this item will be on
the agenda for the TMT meeting on 6/20. Dworshak scenario comparisons, temperature targets, operating in under vs. over-shot mode and the pilot fertilization program are anticipated discussion points.
• Greg Haller, Nez Perce Tribe, gave a heads up that he will share the SRBA plan for the use of 200 kaf for flow augmentation with the Salmon Managers and TMT, in the future.
Libby Operations Scenarios Cathy Helebchuk, COE, referred TMT to graphs linked to the TMT agenda that were based on updated ESP/STP forecasts, showing how operations might be shaped after the sturgeon pulse. A flat flow operation ranged between 12-16 kcfs, given the average ESP volumes. The May-August average maximum elevation average given the ESP data was 2448.2', and the STP data runs showed a peak elevation of 2449.2'. Hlebechuk noted that the graph on Kootenai River and Koocanusa Reservoir temperature graph shows that the project has been very successful in moving selector gates to achieve the desired outflow temperatures.
3
Libby/Hungry Horse SOR 2007-MT-1 Jim Litchfield, Montana, presented a final draft SOR for summer 2007 Libby and Hungry Horse operations. An earlier draft SOR shared with IT at their June 7 meeting was updated, and the new version (dated June 12, 2007) was posted as a link to the TMT agenda. In the development of the latest draft, Montana discussed proposed operations with the Kootenai Tribe relative to habitat improvement projects being planned for this year, and the Tribe signed on to the final draft SOR submitted today. The main goals for the Hungry Horse operation were to meet refill by June 30, but not too quickly. The proposed flow given current forecasts was a 4 kcfs flat flow for July, August and September. Given current forecasts, it was expected that this flat flow would have the project drafting approximately 20' to elevation 3540' by the end of September. The proposed Libby operations were to continue at 15 kcfs flows through July 21 (until core sampling for the habitat improvement project is complete); then reduce to 12 kcfs for July and August, followed by a gradual ramp down in September. Given the uncertainty of flow conditions through the summer, Jim suggested the operation be further discussed in mid-July, with the specifics of the operation refined as needed at that time. The goal is to avoid a mid-summer double peak, maintain flat flows, and save some flow for the month of September. Jim noted that the operation being proposed, from Montana’s perspective, is a middle ground between the action agencies’ proposed action and the NPCC’s Mainstem Amendment recommendations. Montana requested feedback from TMT members today on the general direction and objectives of the proposed operations. Questions were raised about the research aspect of the SOR, and TMT agreed it would be good to have a quick refresher on the study information available regarding productivity etc.
ACTION: Jim will invite Brian Marotz, MT, to share a brief review of his research at the next TMT.
NOAA offered support for the objectives of the proposed operations, and stated the proposed operation is consistent with the 2004 BiOp. Oregon was not prepared to provide comment at this time. The COE asked whether maintaining as flat a flow as possible and targeting an end of August elevation of 2439' at Libby would meet Montana’s needs, to which Jim responded that this was not Montana’s objective – rather to maintain flat flows through the summer. CRITFC offered their preference for reaching 20' drafts at both projects, with an overall desire to provide flows in August in the lower Columbia. CRITFC did not oppose targeting flat flows in Montana. The Nez Perce said they would need more time to consider the proposal and emphasized that this operation had a flow shaping objective where as the Dworshak summer operation is driven by temperature.
Next Steps: TMT will revisit Libby and Hungry Horse operations at the 6/20 meeting. It was suggested that determining next steps for Hungry Horse operations will need to happen in the nearer term, so folks should come prepared
4
to offer input on that aspect of the proposal. Also, the sturgeon operation will end on 6/23, after which a decision about how to operate Libby will need to be made.
Lower Monumental/McNary Spring/Summer Spill Schedules Marvin Shutters, Walla Walla COE District, reported on a proposal to shift the dates specified in the 2007 Fish Operations Plan Agreement for spill volumes to coordinate with fish studies at Lower Monumental and McNary. The proposed shifted dates are as soon as possible at Lower Monumental and June 21st at McNary.
Action/Next Steps: The proposed dates were under review by the parties to the Agreement as well as the SRWG, and Shutters will provide an update to TMT at the 6/20 meeting.
Spring-Summer Non-Treaty Storage Agreement Tony Norris, BPA, reported the following: Arrow reservoir continues to operate near maximum levels permitted for flood control, allowing no space for U.S. flow shaping. Projections are for Arrow to remain near flood control levels or near full into July. Given current circumstances, BC Hydro has declined to pursue an agreement at the present time; however, as hydrologic conditions change, BPA and BC Hydro will continue discussion on potential operations to use non-Treaty space for mutually beneficial flow shaping. The US and Canadian sections of the Operating Committee continue to use the Nonpower Uses Agreement to shape Treaty flows, including one Maf of flow augmentation storage for U.S. fisheries, to provide mutual nonpower benefits. The U.S. Section of the Operating Committee is maintaining the maximum flow augmentation volume possible for release in July, pursuant to the Nonpower Uses Agreement.
Action/Next Steps: Norris said that the agreement would not likely be discussed again until mid-July, but that BPA would continue to follow the issue and keep TMT members in the loop.
Little Goose Spill for Adult Fish Passage Bernard Klatte, COE, reported that Little Goose was operating with a flat spill pattern 24 hours/day, as the passage counts at the project had clearly benefited from the shift in spill pattern. Operations Review Reservoirs – Cathy Hlebechuk and John Roache reported on reservoirs. Grand Coulee was at elevation 1282.1' and will have elevations of no greater than 1285' effective 6/17. Hungry Horse was at 3558', with outflows at 3.2 kcfs and inflows of 6.5 kcfs. Libby was at 2434.5', with inflows receding, at 42 kcfs and outflows of 15 kcfs. Dworshak was at elevation 1598.8', with inflows of 7.3 kcfs and outflows reducing to 4.3 kcfs. Average flows through 6/12 were 63 kcfs at Lower Granite, 175 kcfs at Priest Rapids, 280 kcfs at Bonneville, and the April 10-June 11 average was 249 kcfs at McNary. Fish – Paul Wagner, NOAA, reported on juvenile and adult fish. Updated passage numbers on the Fish Passage Center website indicated that yearling migration was over. Subyearling Chinook counts were up at Little Goose, Lower Monumental and McNary. Lower Granite, likely due to hatchery releases. Steelhead at Lower Granite were
5
decreasing into the 1,500 per day range and were in the 5,000 per day range at Little Goose. Margaret Filardo, Fish Passage Center, reported on a June 8th memo regarding elevated evidence of gas bubble trauma in fish sampled at Little Goose and Lower Monumental. She said that passage center crews would continue surveying at the two projects and that those results would be posted on the Fish Passage Center website under gas bubble trauma. Power system – Nothing to report. Water quality – Jim Adams, COE, reported on the effects of alternating spill caps at Lower Monumenta: 23.6 kcfs led to TDG exceedances at the Ice Harbor forebay (IHRA), but 22.6 kcfs kept TDG levels well under exceedances levels. This operational strategy is intended to maximize spill while keeping TDG levels at IHRA below state criteria.
Next Steps: The COE will operate Lower Monumental with spill caps of 23.6 kcfs during the day and 22.6 kcfs at night, and will report TDG results at the 6/20 TMT meeting.
Other • Kyle Dittmer, CRITFC, reported than an SOR for summer treaty fishing would be
submitted to the COE the week of 6/20 and requested that this item be on the agenda for the 6/20 TMT meeting.
• Dennis Schwartz, COE, reported that erosion issues in bay 9 at Bonneville have prompted a recommendation to provide an outage to conduct a survey of the area. A technical memo was expected to be submitted by June 14, which will be shared with TMT. TMT members are asked to provide feedback at the 6/20 meeting on when the best date to do the repair work would be.
Next face-to-face TMT meeting: Wednesday, June 20th Agenda items will include: • Review/Finalize Facilitator’s Notes and Meeting Minutes • Priest Rapids Update • Grand Coulee Flood Control Update • Updated Flow Forecasts • Libby Operations Scenarios • Dworshak Operations/Scenarios • MT SOR for Libby/Hungry Horse • Lower Monumental/McNary Spill Dates Update • Operations Review – including an update on Lower Monumental Spill Caps
6
Columbia River Regional Forum Technical Management Team Meeting
June 13, 2007 1. Welcome and Introductions Today’s TMT meeting was chaired by Cathy Hlebechuk and facilitated by Robin Harkless, with representatives from BOR, CRITFC, COE, BPA, USFWS, NOAA, Montana, Idaho, Oregon, and the Nez Perce Tribe attending. The following is a summary (not a verbatim transcript) of the topics discussed and decisions made at the meeting. Anyone with questions or comments about these notes should provide them to the TMT chair or bring them to the next meeting. 2. Review Facilitator’s Notes/Meeting Minutes
Regarding the 5-30-07 facilitator’s notes, page 3 under Fish Operations, the passage indices data quoted are for Lower Granite, not Little Goose, Paul Wagner (NOAA) said.
There were no other comments at this time. TMT will revisit meeting note
reviews on June 20 for the sake of those who have not yet had a chance to review the various facilitator’s notes and official minutes that have been recently posted. 3. Priest Rapids Update
It’s been another good couple of weeks with no exceedances, Russell Langshaw (Grant County PUD) reported. Mean daily discharges were 153 to 203.5 kcfs, with 148.5 to 164 kcfs minimum flows. Maximums ranged from 162.4 to 228.7 kcfs. Daily deltas were 14.1 to 77.1 kcfs. There was one weekend protection flow of 40 kcfs, as well as several 60 kcfs and several 150 kcfs minimum protection flows.
On days when inflows are greater than 170 kcfs, the only protections are
150 kcfs minimums, which are imposed in place of flow bands, Langshaw said. Emergence is expected to end June 20, with about another week of spawning operations to go. TMT will check in on this at its next meeting June 20. 4. Grand Coulee Flood Control and Refill
The current guidance is maximum elevation 1,285 feet on June 17, John Roache (BOR) said. COE is still analyzing this weekly, based on residual volumes, so there will be a revised target next week. Hlebechuk gave a report on residual runoff, which is calculated by subtracting the actual volume through June 10 from the most recent volume
7
forecast. Residual runoff percentages mean how much water is left to run off during this forecast season; a low percentage means there’s not much water left to come for this forecast season.
Residual runoff percentages as of June 10 are:
• Dworshak – 17.7% for June 11 to end July • Libby – 44% for June 11 to end August • Hungry Horse – 30% for June 11 to end August • Albeni Falls – 31%for June 11 to July 31 • Grand Coulee – 48% for June 11 to end August • The Dalles – 42% for June 11 to end August • Lower Granite – 24.5% through end July • Arrow (in Canada where snow is at higher elevations) – 60% for June 11
to end August
Grand Coulee refill probably won’t be a problem this year, Roache said, especially with lots of water coming from Canada. The primary objective of refilling is to help meet summer flow objectives at McNary. To accommodate recreational needs at the reservoir over July 4 which occurs mid-week this year, Roache proposed reshaping the water by refilling to elevation 1,290 feet on July 8 or 9 instead of June 30 and based on the latest The Dalles forecast, drafting to elevation 1,278 feet by August 31.
NOAA and Idaho representatives endorsed this proposal to move the water later into summer. BPA is working to support that operation, Tony Norris said. CRITFC neither opposes nor supports it, Kyle Dittmer said. There were no other comments today. 5. Updated Flow Forecasts – Hungry Horse, Libby, Dworshak, and Lower Granite
Hlebechuk presented the week’s ESP forecasts. Hungry Horse is definitely in recession, with inflows around 7 kcfs and dropping quickly, Roache said. The 10-day forecast does not predict rain. Like Hungry Horse, Libby is in gradual decline, with inflows at 42 kcfs on June 12. Inflows at Dworshak the same day were 7.3 kcfs. Based on this week’s ESP forecast, the augmentation volume remaining at Dworshak is between 76 and 160 kaf. Hlebechuk and Wagner agreed the message here is that the peak of the runoff has passed.
Litchfield asked, are there any plans for this summer if temperatures get
hot? In low flow summers, temperatures tend to be moderate because Dworshak’s cooler water becomes a high percentage of flows in the river, Wagner said. Jim Adams (COE) observed that the weather this year has been helping to keep river temperatures down, putting them at an average for this date over the past 8 years.
8
The conversation turned to surface water temperatures at Dworshak,
which are lower now than at this time last year. Dave Statler informed TMT that the Nez Perce will be doing a pilot fertilization program in Dworshak this year. The intention is to increase plankton growth. A side effect of this is that increased plankton growth will help stratify the reservoir by absorbing heat at the surface and preventing light from penetrating deep into the reservoir.
Jim Adams asked about outflows at Dworshak. It would be good to keep them under 45-50 oF, Wagner said. Since river temperatures are moderate now, we could save the cold water for later, Adams said. TMT will revisit the issue of reservoir water temperatures next week and throughout the season.
6. Dworshak Operations
Based on the lack of water in the North Fork of the Clearwater basin, we should fill Dworshak as full as possible, Statler said. He advocated passing inflows as soon as possible to stay ahead of the demand for cooler water later this summer.
At elevation 1,598.8 feet, Dworshak is 1.2 feet from full now, Adams said.
Current discharges are 4.3 kcfs. The reservoir will be full by the end of the month, Hlebechuk said. The COE will continue to operate as is until the Salmon Managers call for water to cool temperatures at Lower Granite.
CRITFC supports the Nez Perce position and would like to see Dworshak
full before June 30, Kyle Dittmer said. CRITFC has submitted two flow scenarios to EPA for water temperature modeling. One is the Nez Perce plan, which calls for drafting Dworshak to elevation 1,535 feet by end August. The other is the TMT 2006 plan, used for a baseline comparison. Dittmer will give a full presentation on this at the June 20 TMT meeting. Greg Haller said the Nez Perce Tribe is beginning to develop the Snake River Basin Adjudication plan for using 200,000 acre feet of water in September.
7. Libby Operations Scenarios
Hlebechuk showed TMT a whiskers plot depicting flat flows at Libby starting June 24 after the sturgeon pulse is completed. The graph indicates that 50% of the flows would fall in the 12-16 kcfs range in order to draft Libby Reservoir to elevation 2,439 feet by end of August. Flat flows could go as low as 11 kcfs and as high as 25 kcfs depending on the inflow to Libby Reservoir.
Litchfield asked whether the model was set up to try to calculate a flat flow
for the period from June 24 through August 31. Hlebechuk said she would check on that, as well as on the ESP volumes for the June final forecast, then email the information to TMT members.
9
Under the flat flow scenario, the average Libby maximum elevation would be 2,448 feet, with a range of 2,445 to 2,458 feet, and 2,459 feet being full. The Libby flat flow STP scenario showed a volume of 6.5 maf and a maximum elevation of 2,449.2 feet. The resulting flat flows will be low, Hlebechuk said. Temperatures at Libby tailwater and at Bonner’s Ferry are very close to optimal for sturgeon, Wagner noted. Hlebechuk, Bettin and Wagner agreed that project staff have been doing an excellent job of gate placement to contain thermal layers in the reservoir and control river temperatures for sturgeon and trout. 8. Montana SOR for Libby/Hungry Horse Jim Litchfield presented the final SOR dated June 12, noting that the draft presented at last week’s IT meeting is obsolete. A footnote on page 2 of the final SOR was omitted, which said that the SOR signatories understand the Action Agencies will need to select a turbine loading that allows things to run smoothly at the project. The purpose of the SOR is to maintain steady flows and productive river conditions throughout the summer season in Montana. The SOR requests refill of Hungry Horse (which will likely happen) by June 30, and flat flows of 4.0 kcfs for the remainder of July, August and September.
For Libby, which is still operating at 15 kcfs outflows for the tail end of the sturgeon operation, the SOR recommends extending that flow level through July 21 or until the core drilling is finished at Bonner’s Ferry, then reducing flows to 12 kcfs and maintaining 12 kcfs through the end of August. For the month of September, the SOR recommends flows be to ramped down gradually, providing at least the minimum bull trout flows as defined in the USFWS Bi Op.
The SOR requests that the situation be reevaluated in July, when the river coring at Bonner’s Ferry has been completed and in light of existing conditions and weather forecasts for Hungry Horse and Libby available then. Refill of Libby is a lower priority in Montana than providing steady flows throughout the summer months of June through September, Litchfield said. A drop from 15 to 9 kcfs in July, as called for in the USFWS Bi Op, would disrupt the aquatic environment because dewatering a given area for even a few hours renders it biologically unproductive, Litchfield said. No target elevation, flow level, or river temperature is associated with this SOR because the main concern is shaping of the river flows so there is enough water to last through September. Essentially, Montana proposed to shift outflows of 3 kcfs from the last week of July and all of August into September to achieve that goal.
NOAA supports the operations specified in this SOR and has for the past
several years, Wagner said. Rick Kruger (Oregon) had no comments today. CRITFC would like Hungry Horse drafted to elevation 3,540 feet and Libby to near elevation 2439 feet by end August to protect ESA-listed stocks in the lower
10
Columbia River, Dittmer said. The Nez Perce will need more time to look at the conditions proposed in the SOR before commenting, Statler said.
TMT will discuss the SOR further at its June 20 meeting, focusing on
Hungry Horse first. Libby operations are set through June 23, when flat flows for sturgeon end. 9. Lower Monumental and McNary Summer Spill Schedules Regarding subyearling Chinook passage studies at Lower Monumental and McNary, the fish are of sufficient size and numbers now that a representational sample of the run can be captured, Marvin Shutters (COE) said. These studies will begin within passage of the first 10% of the run and will continue until either there aren’t enough fish remaining, or water temperatures are too high. The Fish Operations Plan calls for different operations of those projects in summer than in spring. This year the COE is proposing to move those operational start dates back approximately 10 days to dovetail with fish research needs, Shutters said. The goal is to release most of the fish during the summer operation, rather than splitting the releases between two operations, which would make the study results difficult to interpret.
The COE intends to initiate the spill date change first at McNary. The SRWG and TMT will be consulted first, then the COE will work with the parties to the 2007 Agreement and report to the court.
Moving the summer spill treatment start date up from July 1 to June 20 in order to accommodate the study will have the effect of lowering spill volume, Bernard Klatte (COE) explained. Klatte will report on coordination of this effort at the next TMT meeting. 10. Spring-Summer Non-Treaty Storage Agreement
Arrow reservoir continues to operate near maximum levels permitted for flood control, allowing no space for U.S. flow shaping, Tony Norris (BPA) said. Projections are for Arrow to remain near flood control levels or near full into July. Given current circumstances, BC Hydro has declined to pursue an agreement at present. However, as hydrologic conditions change, BPA and BC Hydro will continue discussion on potential operations to use non-Treaty space for mutually beneficial flow shaping.
The U.S. and Canadian sections of the Operating Committee continue to use the Nonpower Uses Agreement to shape Treaty flows, including one Maf of flow augmentation storage for U.S. fisheries to provide mutual nonpower benefits, Norris said. The U.S. Section of the Operating Committee is maintaining the maximum flow augmentation volume possible for release in July, according to the Nonpower Uses Agreement.
11
11. Little Goose Spill and Adult Fish Passage Adult spring Chinook at Little Goose were noticeably low which raised concerns, so the COE proposed changing to a flat spill pattern during daytime and a tapered bulk pattern at night. The pattern change was coordinated by NWW and a teletype was issued Tuesday June 5th. Fish passage immediately increased at Little Goose Dam.
On Friday, June 8, the COE changed the nighttime tapered bulk spill pattern to a flat spill 24 hours per day because the tapered bulk pattern – which simulates the flow produced by an RSW – created poor attraction flows and egress issues. This means that there is work to be done with the physical model at ERDC to figure out what the best spill pattern is for adult spring Chinook as well as juveniles. Modeling results indicate that passage numbers decreased at around 55 kcfs flows, apparently because the adult fish couldn’t find the ladder entrances under those conditions, Wagner noted. 12. Operations Review
A. Reservoirs. Grand Coulee is at elevation 1,282.1 feet, Roache said. Its maximum elevation is 1,285 feet on June 17. Hungry Horse is at elevation 3,558 feet, releasing 3.2 kcfs, with inflows around 6.5 kcfs, so the reservoir is slowly filling, Roache said. Libby is at elevation 2,434 feet, with inflows of 42 kcfs and outflows of 15 kcfs. Inflows are receding, Hlebechuk said. Dworshak is at elevation 1.598.8 feet, with inflows of 7.3 kcfs which are receding and 5.6 kcfs outflows.
Lower Granite outflows were 63 kcfs June 12. For April 3-June 11, the average outflows were 63 kcfs. McNary average outflows were 249 kcfs for April 10-June 11. Priest Rapids average outflows were 175 kcfs for May 17-June 12. Bonneville flows have ranged from 248 to 280 kcfs.
B. Fish. The numbers for combined yearling Chinook passage are dropping, Wagner said. They were 100 per day at Little Goose, less than 100 per day at Lower Monumental, and around 5,000 per day at John Day and in the Lower Columbia River. There were 500 at Bonneville, so the yearling Chinook migration appears to be largely over.
What’s picking up is subyearling Chinook, whose numbers rose from
10,000 to around 20,000 at Lower Granite beginning June 10, then falling to around 5,000 per day over the past few days, Wagner said. These numbers largely represent hatchery releases. The reason for higher passage numbers at Little Goose rather than Lower Granite is probably due to the efficiency of the RSW passing more fish. Subyearling Chinook passage at Lower Monumental
12
has been around 9,000 the past couple days, and around 25-30,000 at McNary. These are wild subyearlings.
Steelhead passage numbers are dropping to 1500 per day at Lower
Granite, but steelhead counts are surpassing yearling Chinook, Wagner said. The same is true at Little Goose, with 5,000 steelhead per day. Steelhead numbers are dropping in the lower river – 1,500 at John Day, 1,000 at Bonneville. Basically, steelhead are hanging around in the lower Snake because they’re sensitive to flow and can’t find their way past the projects at current flow levels, Wagner said. The fish are showing elevated signs of gas bubble trauma – not that gas levels are high at 105 to110%, but due to prolonged exposure. TDG levels are in the 105% range at Lower Granite, and around 113-114% at Little Goose. Margaret Filardo (FPC) said the effects of the trauma are not severe, but are significant enough to report to TMT. Monitoring efforts will continue, with data posted weekly to the FPC web page (http://www.fpc.org/) under “smolts” (left side of screen). The discussion turned to ideas on how to balance the needs of steelhead vs. the needs of subyearling Chinook.
C. Power. There is nothing new to report, Tony Norris (BPA) said. D. Water Quality. Despite finding fish with bubbles in them, gas levels
have been low recently, partially due to low flow which prevents spill caps from being reached, Jim Adams (COE) said. The only problem has been Ice Harbor forebay. When spill caps were set at 23.6 kcfs for a number of days, there were exceedances close to 118%. When the spill cap was lowered one stop to 22.6 kcfs, TDG levels were significantly under the limit, at around 112-113%. Half-stops are not available, and one stop has been making a big difference in TDG levels downriver. The COE considered toggling between 22.6 and 23.6 kcfs, but that would mean spilling in 24-hour blocks, and since TDG levels are measured daily as the average of the 12 highest values, it made more sense to split spill segments into 12 hours. So spill levels are at 23.6 in the daytime, 22.6 at night.
TMT discussed whether that spill pattern should be reversed. Adams
pointed out that night spill at Bonneville reaches the Camas Washougal gage at the warmest/worst time of the day, and that also happens at specific flow rates between John Day and The Dalles. Studies have shown that fish tend to move whenever spill is provided, whether at night or during the daytime, Wagner said. 13. Other A. Summer Treaty. CRITFC will submit a SOR to the COE on June 14 and plans to go fishing Monday through Wednesday of the following week, Dittmer said. This will be on the agenda at next week’s TMT meeting. B. Bonneville Spillway Issue. The COE is requesting a 2-3 hour outage in the next few weeks at Bonneville to survey the area around Bay 9, where
13
erosion appears to have worn the spillway to about 5 feet of thickness above an inspection gallery. This outage would probably be best scheduled on the weekend, Dennis Schwartz (COE) said. It will be on next week’s TMT agenda.
C. Next Meeting Agenda. The next TMT meeting on June 20 will include a Priest Rapids update, Grand Coulee flood control operations, updated flow forecasts, Dworshak operations, the Montana SOR, follow up on the Lower Monumental/Mcnary summer spill schedule, and the usual operations review. This meeting summary was prepared by consultant and writer Pat Vivian. Name Affiliation Cathy Hlebechuk COE Jim Adams COE John Roache BOR Paul Wagner NOAA Tony Norris BPA Jim Litchfield Montana Rick Kruger Oregon Tim Heizenrader Cascade Energy Scott Bettin BPA John XX BPA Terry XX BPA Holli Krebs Bear Stearns Jennifer Miller Susquehanna Kyle Dittmer CRITFC Ruth Burris PGE Dan Spear BPA Shane Scott NWRP Rudd Turner COE Bernard Klatte COE Russ George WMC Phone: XX EWEB Steve Hasaeker USFWS Dave Statler Nez Perce Greg Haller Nez Perce Laura Hamilton COE Margaret Filardo FPC Robyn MacKay BPA XXX for Russ Kiefer Idaho Richelle Beck D. Rohr & Assoc. Russell Langshaw Grant PUD Tina Lundell COE Marvin Shutters COE
14
Glen Trager Avista Energy
T E C H N I C A L M A N A G E M E N T T E A MBOR : John Roache/Mary Mellema BPA : Robyn MacKay/Tony Norris/Scott BettinNOAA-F: Paul Wagner/Richard Dominigue USFWS : David Wills/Steve HaesekerOR : Rick Kruger/Ron Boyce ID : Russ KieferWDFW : Cindy LeFleur MT : Jim Litchfield/Brian Marotz
COE: Cathy Hlebechuk/Jim Adams/Cindy Henriksen
TMT MEETING Wednesday June 20, 2007 09:00 - 12:00
1125 N.W. Couch Street, Suite 4A34 Portland, Oregon 97209-4142
Map Quest [Directions]
Conference call line: 503-808-5190
To check into the building, take the elevator to the 5th floor and the guard will issue you an ID badge if you need one and will take you down to the 4th floor where the meeting is. If you have NOT attended a TMT meeting in the past you will need to call ahead and let Cathy Hlebechuk (503) 808-3942, Jim Adams (503) 808-3938 or Cindy Henriksen (503)
808-3945 know, so you can be added to the TMT Visitor List and issued an ID badge. This badge may be used indefinitely. If you have attended TMT in the past you may re-use your ID badge indefinitely. If you are a federal
employee you will also need to have an ID badge issued to you which can be used indefinitely.
We have had disruptions on the phone because people are not hitting 'mute' after dial in.Please MUTE your Phone
All members are encouraged to call Robin Harkless with any issues or concerns they would like to see addressed. Please e-mail her at [email protected] or call her at (503) 248-4703.
AGENDA
1. Welcome and Introductions2. Review [Meeting Minutes] 3. Priest Rapids Update - Russell Langshaw, Grant Co. PUD
a. [Priest Rapids Operations 2007] 4. Grand Coulee Flood Control - John Roache, BOR5. Updated Flow Forecasts - Cathy Hlebechuk, COE
d. Lower Granite1. [Lower Granite Regulated Flows]
6. Dworshak Operations - All
a. [Dworshak Outflows and Lower Snake River Tailwater Temperatures in 2007] b. [Dworshak Water Temperatures Data] c. [Lower Snake RBM10 Modeling - Kyle Dittmer, CRITFC]
7. Libby Operations - Cathy Hlebechuk, COEa. [Libby - ESP VOLUMES] b. [Libby - ESP Inflow Flat Flow Operation] c. [Libby Max Elevation - ESP Inflows] d. [Libby - STP Inflow Flat Flow Operation] e. [Kootenai River and Koocanusa Reservoir Temperatures2007 Sturgeon Operations (1 May - 30 June)]
8. Montana Proposal for Libby and Hungry Horse - Alla. [2007-MT-1_Final]
9. Lower Monumental / Bonneville / McNary / Spill Date Update - Bernard Klatte, COE10. Bonneville survey for stilling basin erosion - Bernard Klatte, COE
/11. Operation of the Lower Columbia Pools for the Summer 2007 Treaty Fishery - Kyle Dittmer, CRITFC
a. [2007-C1] b. [Summer Commercial Gillnet Fishing Period]
12. Operations Reviewa. Reservoirsb. Fishc. Power Systemd. Water Quality - Jim Adams,COE
1. [Spill Information 2007]13. Other
Set agenda for next meeting - June 27, 2007 [Calendar 2007]
Questions about the meeting may be referred to Cathy Hlebechuk at (503) 808-3942 or Jim Adams at (503) 808-3938 or Cindy Henriksen at (503) 808-3945.
ESP 75th PrecentileESP 25th PercentileObserved FlowsESP Daily Mean
Whiskers: ESP Daily Max/Min
ESP flows updated 19-Jun-2007
This plot displays the daily range of flows from the ESP hydrographs. Fifty percent of the ESP flows fall within the narrow shaded rectangles and the daily extremes of the ESP flows are bound by the "whiskers".
Change in Spill Operation at Bonneville Dam 2007 Fish Operations Plan (FOP) The spring spill operation at Bonneville Dam in the FOP is 100 kcfs spill 24 hours/day from April 10 through June 30, 2007. Summer spill operations call for a set daytime spill cap of 75 Kcfs and spill to the TDG spill cap at night from July 1 through August 31, 2007. The Action Agencies have coordinated a change to move the start date for summer spill operations from July 1 to June 21, and to change the daytime summer spill levels. The planned spill during daytime hours will be 85 Kcfs from June 21 through July 15, then go back to 75 Kcfs from July 16 through August 31. Summer spill at night will be to the total dissolved gas (TDG) spill cap. Change to the FOP The Action Agencies intend to schedule a one-time spill outage for 4 hours, either in late June or after mid-July, to conduct a hydro survey of the spillway stilling basin. The earlier time frame is preferred - prior to the peak period for subyearling Chinook salmon migration to reduce impacts on fish passage. The Corps is currently working on getting a contractor to conduct the survey. It is expected that the spill outage will occur prior by June 26, 2007. Rationale for Change A hydro survey conducted at the Bonneville Dam stilling basin in October 2006 showed approximately 4 to 5 feet of concrete missing from the ogee floor at Bay 9, directly above the downstream drainage gallery. Spill bays 12 and 14 showed similar amounts of missing concrete. This erosion means that there is only about 6 feet of concrete coverage remaining above the gallery. This is a significant engineering concern because of the potential for a sudden, catastrophic failure of the structure and flooding of the gallery. It is believed the damage to the concrete floor of the ogee is caused by a combination of erosion and cavitation due to plunging flow. There are no methods to accurately compute, estimate or predict rate of concrete loss due to erosion and cavitation. The rate of concrete loss due to cavitation and erosion is unknown, but it is probable that it will accelerate. There is an urgent need to conduct a follow up survey to determine the rate of erosion since the start of spill for fish passage on April 10. Failure of one or more spill bays would result in closing spill bays while emergency repairs are underway. Therefore, the Corps proposes to conduct a multi-beam hydro survey during a shut down of spill for an estimated period of 4 hours on or about June 24, 2007. Coordination The Corps coordinated this operation through the Regional Forum Fish Facilities Design Review Working Group (FFDRWG) on June 7, 2007. Representatives from NOAA Fisheries, CRITFC, ODFW, USFWS, and IDFG, and BPA agreed with conducting the survey, which includes the 4 hour spillway outage. Their joint recommendation was to move forward with the survey work but minimize the outage to the extent possible to
reduce impacts to migrating fish. The Corps has coordinated the survey and spill outage with the signatories to the 2007 Agreement and no objections have been raised.
Proposed Change in 2007 Summer Spill Operation at Bonneville Dam Background The Action Agencies, along with the Regional Forum Fish Facility Design Review Work Group (FFDRWG) and Studies Review Work Group (SRWG), have been working since fall 2005 to improve the survival of juvenile salmon and steelhead that pass through the Bonneville Dam spillway. In 2006, new spill operations were implemented and tested for both the spring and summer juvenile fish migration periods. The tested spring spill operation was 100 Kcfs for 24 hours/day. The summer spill operation was 75 Kcfs during the day and spill to the total dissolved gas (TDG) spill cap at night (approximately 120 Kcfs). Results for the summer test did not indicate a survival improvement compared to previous years. A new summer spill operation intended to improve TDG performance and juvenile fish egress was developed during the spring of 2007. To obtain a juvenile fish egress improvement, it was necessary to increase the daytime spill discharge from 75 Kcfs to 85 Kcfs. The SRWG has developed a plan to evaluate this new operation. 2007 Fish Operations Plan (FOP) The Bonneville Dam spring spill operation as described in the FOP is 100 Kcfs spill 24 hours/day from April 10 through June 30, 2007. Summer spill operations call for a set daytime spill cap of 75 Kcfs and spill to the TDG spill cap at night from July 1 through August 31, 2007. This is the same operation that was implemented in 2006. Proposed Change to the FOP The Action Agencies intend to implement the new summer spill operation for the period of the planned evaluation, which runs from June 21 through July 15, 2007. Therefore, the planned operation is to spill 85 Kcfs during daytime hours and spill to the TDG spill cap at night, from June 21 through July 15. From July 16 through August 31, the Action Agencies intend to revert back to the agreed upon FOP summer spill levels, which is 75 Kcfs during daytime hours and spill to the TDG spill cap at night. The actual change in spill amount is not quantifiable because the volume of spill is determined in part by the TDG spill cap; however, it is probable that there will be no net difference or a small net increase in spill. Rationale for Change The justification for these spill changes is twofold: 1. Advancing the date to June 21 from July 1 provides a better match between the study period and actual 2007 subyearling Chinook salmon migration timing at Bonneville Dam. This will result in a biological evaluation that is more representative of the fish run. 2. Based on hydraulic model observations, the new operation is expected to increase subyearling Chinook salmon survival. Coordination The modified summer spill operation at Bonneville Dam was developed and coordinated through the Regional Forum Fish Facility Design Review Working Group (FFDRWG) and Studies Review Working Group (SRWG). Implementation of the proposed change in daytime operation for biological testing was agreed upon by FFDRWG members from the Corps, BPA, NOAA Fisheries, ODFW, USFWS, IDFG and CRITFC. The evaluation of the new operation was
developed and coordinated through SRWG. The Corps has coordinated the spill changes described above with the signatories to the 2007 Agreement and no objections have been raised.
Proposed Change in 2007 Summer Spill Operation at McNary Dam 2007 Fish Operations Plan (FOP) The FOP states that the spring spill operation at McNary is a 40% spill level for 24 hours/day from April 10 through June 30, 2007. The summer spill operation extends from July 1 through August 31, 2007, alternating between 40% spill and 60% spill, also for 24 hours/day. This is to accommodate a summer spill study at the project. Spill conditions will alternate between 40% and 60% in two day blocks. The operational details are contained in Table 3 of the FOP and in the McNary Dam section on pages 16 & 17. The FOP also states that the spill duration for testing will be from late June until August (tentative). The dates of testing will be dependent on the size of fish, fish availability, and the number of treatments needed for testing with final dates coordinated through the Studies Review Work Group (SRWG). Summer research operations: 40% spill 24 hours/day vs. 60% spill 24 hours/day.
Continue to evaluate Prototype Temporary Spillway Weir (PTSW) performance. The spill will be alternated in two day blocks, which will be randomized through the test period. Objectives of the biological test are twofold:
1. Estimate passage and survival rates of subyearling fall Chinook salmon under two treatments of project operations.
2. Characterize juvenile salmon behavior in the forebay of McNary Dam under two treatments of project operations. Spill pattern during the biological test: Spill pattern details were identified using the general
model by Corps staff and representatives of the regional fisheries agencies and tribes. Test spill patterns are provided in Appendix 1 of the FOP. A single spill pattern will be tested at the 40% and 60% spill levels.
Change to the FOP The Action Agencies plan to implement summer spill operations at McNary Dam starting on June 20 rather than July 1, 2007. This will result in starting the 40% vs.60% spill comparison earlier than stated in the FOP. This change will result in an additional 5 days of the higher 60% spill level than under the FOP. This test operation applies only to summer. Rationale for Change The actual 2007 subyearling Chinook salmon migration timing is earlier than was anticipated when the FOP was prepared in early spring. Therefore, this change in dates is necessary so that the subyearling Chinook passage and survival study results will be representative of the experience of the population at large and to allow a more rigorous evaluation of the effects of the two spill levels on passage and survival. The potential need to adjust test dates due to run timing was described in the FOP. Coordination Changes to the research plan were coordinated with the Regional Forum Studies Review Working Group (SRWG). This change is supported by the SRWG representatives from the Corps, ODFW, CRITFC, NOAA Fisheries, USFWS, and BPA in order to conduct the summer study during the main portion of the subyearling Chinook salmon outmigration. IDFG and WDFW representatives stated that they were not available to study the issue carefully, but both indicated they would not object if the other agencies were in agreement. The proposal also was
presented to the Regional Forum Technical Management Team (TMT). TMT members did not raise any objections to the change. The Corps has coordinated the spill change described above with the signatories to the 2007 Agreement and no objections have been raised.
ESP 75th PrecentileESP 25th PercentileObserved FlowsESP Daily Mean
Whiskers: ESP Daily Max/Min
ESP flows updated 19-Jun-2007
This plot displays the daily range of flows from the ESP hydrographs. Fifty percent of the ESP flows fall within the narrow shaded rectangles and the daily extremes of the ESP flows are bound by the "whiskers".
Ann061407fullsize.doc
Scaffold Fishery Sales Begin June 16 Summer Commercial Gillnet Fishing Period Adopted June 18-20
Thursday, June 14, 2007
Today, the Compact states of Oregon and Washington concurred with the tribal regulations for the following Zone 6 spring commercial fishery openings:
PLATFORM/SCAFFOLD/HOOK AND LINE SALES AREA: All of Zone 6
DATES: 6:00 AM Saturday, June 16 until further notice.
GEAR: Hoop Net, Dip Net, and Hook and Line.
ALLOWABLE SALES: Chinook, steelhead, coho, walleye, shad, and carp may be sold or retained for subsistence. Sockeye may not be sold but may be retained for subsistence. Sturgeon may not be sold, but sturgeon between four and five feet total length in The Dalles and John Day Pools and between 45”-60” in the Bonneville Pool may be kept for subsistence purposes.
SANCTUARIES: All standard river mouth and dam sanctuaries for these gear types shall remain in effect, with the exception of the Spring Creek Hatchery sanctuary, which is not necessary this time of year.
Subsistence Fishing:
The scaffold fishery remains open for subsistence use all year.
COMMERCIAL GILLNET SEASON AREA: All of Zone 6
DATES: 6:00 AM Monday, June 18 through 6:00 PM, Wednesday, June 20.
GEAR: There will be a 7 inch minimum mesh size restriction.
ALLOWABLE SALES: Chinook, steelhead, coho, walleye, shad, and carp may be sold or retained for subsistence. Sockeye may not be sold but may be retained for subsistence. Sturgeon may not be sold, but sturgeon between four and five feet total length in The Dalles and John Day Pools and between 45”-60” in the Bonneville Pool may be kept for subsistence.
SANCTUARIES: All standard river mouth and dam sanctuaries shall remain in effect, with the exception of the Spring Creek Hatchery sanctuary, which is not necessary this time of year.
Additional gillnet fisheries will likely be scheduled at a later date.
* * * * * * * * * * * * * * * * * * * * * * Sales are also allowed for fish caught in overlapping portions regularly scheduled Yakama Nation subsistence fisheries in the Wind River, Big White Salmon River, and the Klickitat River. Please contact the Yakama Fisheries Office (509-865-6262) for exact times and dates.
* * * * * * * * * * * * * * * * * * * * * * If you have any fishing enforcement problems or need assistance or information, day or night, contact the Columbia River Inter-Tribal Fisheries Enforcement Office, 4270 Westcliff Drive, Hood River, Oregon. Phone: (541)-386-6363 or toll-free (800)-487-FISH (3474). Please consult your tribal Fish and Wildlife Committee for additional details on tribal regulations. PLEASE WEAR YOUR LIFE JACKETS FOR SAFETY.
25th Percentile 75th Percentile Daily Mean Observed Outf low
17.1 kcfs
19.8 kcfs
Libby - STP InflowFlat Flow Operation
2455.3
0
10
20
30
40
50
60
70
80
1-May 1-Jun 1-Jul 1-Aug
2007
Flow
(kcf
s)
2380
2390
2400
2410
2420
2430
2440
2450
2460
Elev
atio
n (ft
)
Inflow Outflow Elevation
19 JUNE STP INFLOW USED STARTING 6/19/07
APR-AUG VOLUME= MAF
18.5 kcfs
7.101
Kootenai River and Koocanusa Reservoir Temperatures2007 Sturgeon Operations (1 May - 30 June)
2320
2340
2360
2380
2400
2420
2440
2460
5/1 5/8 5/15
5/22
5/29 6/5 6/12
6/19
6/26
Res
ervo
ir / G
ate
Elev
atio
n (M
S
0
10
20
30
40
50
60
70
80
90
100
F, Q
and
MSL
(+17
00
Koocanusa Elevation
Gate Elevation
LD Temperature ( F )
BF Temperature ( F )
Libby Dam Flow (kcfs)
Bonners Ferry Flow (kcfs)
Koocanusa Inflow (kcfs)
Bonners Ferry Stage
Libby Dam Air Temp (MaxF)
LD Optimal (F)
Koocanusa Reservoir Temperatures2007 Sturgeon Operations (1 May - 31 July)
35
40
45
50
55
60
65
70
5/1/20
07
5/8/20
07
5/15/2
007
5/22/2
007
5/29/2
007
6/5/20
07
6/12/2
007
6/19/2
007
6/26/2
007
Deg
rees
F
2450 2440
2430 2420
2410 2400
2390 2380
2370 2360
2350 2340
2330 2320
2310 2300
Libby ESP Inflows - Daily Box-Whiskers Plot
0
20000
40000
60000
80000
100000
120000
1-May 1-Jun 1-Jul 1-Aug
2007
Dai
ly In
flow
in c
fs__
ESP 75th PrecentileESP 25th PercentileObserved FlowsESP Daily Mean
Whiskers: ESP Daily Max/Min
ESP flows updated 19-Jun-2007
This plot displays the daily range of flows from the ESP hydrographs. Fifty percent of the ESP flows fall within the narrow shaded rectangles and the daily extremes of the ESP flows are bound by the "whiskers".
Modeling of Dworshak Modeling of Dworshak Summer 2007 OperationsSummer 2007 Operations
Kyle DittmerHydrologist - Meteorologist
Columbia River Inter-Tribal Fish Commission
Portland, Oregon
June 20, 2007
TMT PresentationTMT Presentation
IntroductionIntroduction
• Goals: (1) Model Dworshak flows and elevations for summer operation scenarios. (2) Evaluate impacts on Dworshak pool elevation and lower Snake water temperature and flow.
• CRITFC’s Hydro spreadsheet: modeled outflows and elevations. Inflows provided by NOAA-NWRFC.
• EPA’s RBM-10 model: water temperature. Assumes (1) 1970, 1973, 1978, and 1988 weather years, (2) 1986 tributary inflows, (3) 2000 Dworshak and Brownlee water temperatures, and (3) Dworshak release temperatures are 43 to 45 degF.
• Nez Perce Tribe 2007: draft to 1535 feet by Aug. 31, then 1520 feet by Sept. 30. Shape the July-August outflow to balance NPT concerns with lower Snake needs. Outflows 3 - 14 kcfs.
• TMT-2006: draft to 1535 ft by Aug. 31, then 1520 feet by Sept. 30. More water is shaped in July. Outflows 7.7 –12.5 kcfs.
Modeled Water TemperatureModeled Water Temperature(Model data courtesy of Ben Cope, EPA(Model data courtesy of Ben Cope, EPA--Seattle)Seattle)
Figure 1A: Clearwater River at Mouth (RM1)1970
8
9
10
11
12
13
14
15
166/
10
6/15
6/20
6/25
6/30 7/5
7/10
7/15
7/20
7/25
7/30 8/4
8/9
8/14
8/19
8/24
8/29 9/3
9/8
9/13
9/18
9/23
9/28
Tem
pera
ture
(Deg
C)
NPT 2007 TMT-2006
Modeled Water TemperatureModeled Water Temperature(Model data courtesy of Ben Cope, EPA(Model data courtesy of Ben Cope, EPA--Seattle)Seattle)
Figure 1B: Clearwater River at Mouth (RM1)1973
8
9
10
11
12
13
14
15
16
6/10
6/15
6/20
6/25
6/30 7/5
7/10
7/15
7/20
7/25
7/30 8/4
8/9
8/14
8/19
8/24
8/29 9/3
9/8
9/13
9/18
9/23
9/28
Tem
pera
ture
(Deg
C)
NPT 2007 TMT-2006
Modeled Water TemperatureModeled Water Temperature(Model data courtesy of Ben Cope, EPA(Model data courtesy of Ben Cope, EPA--Seattle)Seattle)
Figure 1C: Clearwater River at Mouth (RM1)1978
8
9
10
11
12
13
14
15
16
6/10
6/15
6/20
6/25
6/30 7/5
7/10
7/15
7/20
7/25
7/30 8/4
8/9
8/14
8/19
8/24
8/29 9/3
9/8
9/13
9/18
9/23
9/28
Tem
pera
ture
(Deg
C)
NPT 2007 TMT-2006
Modeled Water TemperatureModeled Water Temperature(Model data courtesy of Ben Cope, EPA(Model data courtesy of Ben Cope, EPA--Seattle)Seattle)
Figure 1D: Clearwater River at Mouth (RM1)1988
8
9
10
11
12
13
14
15
166/
10
6/15
6/20
6/25
6/30 7/5
7/10
7/15
7/20
7/25
7/30 8/4
8/9
8/14
8/19
8/24
8/29 9/3
9/8
9/13
9/18
9/23
9/28
Tem
pera
ture
(Deg
C)
NPT 2007 TMT-2006 Observed 2007
Modeled Water TemperatureModeled Water Temperature(Model data courtesy of Ben Cope, EPA(Model data courtesy of Ben Cope, EPA--Seattle)Seattle)
Clearwater River at Peck (1970, 1973, 1978, 1988 weather)
8
9
10
11
12
13
14
156/
10
6/15
6/20
6/25
6/30 7/5
7/10
7/15
7/20
7/25
7/30 8/4
8/9
8/14
8/19
8/24
8/29 9/3
9/8
9/13
9/18
9/23
9/28
Tem
pera
ture
(Deg
C)
NPT 2007 TMT-2006 Observed 2007
Modeled Water TemperatureModeled Water Temperature(Model data courtesy of Ben Cope, EPA(Model data courtesy of Ben Cope, EPA--Seattle)Seattle)
Figure 2A: Lower Granite Dam (RM107)1970
13
14
15
16
17
18
19
20
216/
10
6/15
6/20
6/25
6/30 7/5
7/10
7/15
7/20
7/25
7/30 8/4
8/9
8/14
8/19
8/24
8/29 9/3
9/8
9/13
9/18
9/23
9/28
Tem
pera
ture
(Deg
C)
NPT 2007 TMT-2006
Modeled Water TemperatureModeled Water Temperature(Model data courtesy of Ben Cope, EPA(Model data courtesy of Ben Cope, EPA--Seattle)Seattle)
Figure 2B: Lower Granite Dam (RM107)1973
13
14
15
16
17
18
19
20
216/
10
6/15
6/20
6/25
6/30 7/5
7/10
7/15
7/20
7/25
7/30 8/4
8/9
8/14
8/19
8/24
8/29 9/3
9/8
9/13
9/18
9/23
9/28
Tem
pera
ture
(Deg
C)
NPT 2007 TMT-2006
Modeled Water TemperatureModeled Water Temperature(Model data courtesy of Ben Cope, EPA(Model data courtesy of Ben Cope, EPA--Seattle)Seattle)
Figure 2C: Lower Granite Dam (RM107)1978
13
14
15
16
17
18
19
20
216/
10
6/15
6/20
6/25
6/30 7/5
7/10
7/15
7/20
7/25
7/30 8/4
8/9
8/14
8/19
8/24
8/29 9/3
9/8
9/13
9/18
9/23
9/28
Tem
pera
ture
(Deg
C)
NPT 2007 TMT-2006
Modeled Water TemperatureModeled Water Temperature(Model data courtesy of Ben Cope, EPA(Model data courtesy of Ben Cope, EPA--Seattle)Seattle)
Figure 2D: Lower Granite Dam (RM107)1988
13
14
15
16
17
18
19
20
216/
10
6/15
6/20
6/25
6/30 7/5
7/10
7/15
7/20
7/25
7/30 8/4
8/9
8/14
8/19
8/24
8/29 9/3
9/8
9/13
9/18
9/23
9/28
Tem
pera
ture
(Deg
C)
NPT 2007 TMT-2006 Observed 2007
Modeled Water TemperatureModeled Water Temperature(Model data courtesy of Ben Cope, EPA(Model data courtesy of Ben Cope, EPA--Seattle)Seattle)
Snake at Lower Granite Dam (1970, 1973, 1978, 1988 weather)
13
14
15
16
17
18
19
206/
10
6/15
6/20
6/25
6/30 7/
5
7/10
7/15
7/20
7/25
7/30 8/
4
8/9
8/14
8/19
8/24
8/29 9/
3
9/8
9/13
9/18
9/23
9/28
Tem
pera
ture
(Deg
C)
NPT 2007 TMT-2006 Observed 2007
ConclusionsConclusions
•• Nez Perce TribeNez Perce Tribe--2007: Draft 1233 KaF (July2007: Draft 1233 KaF (July--Sept). Sept). Outflows 3 Outflows 3 -- 14 kcfs. Balance and temperature 14 kcfs. Balance and temperature control is achieved in early July and September. control is achieved in early July and September. September carryover: ~236 KaF.September carryover: ~236 KaF.
•• Water temperature modeling shows that NPT 2007 Water temperature modeling shows that NPT 2007 gives a good balance for temperature control (20 gives a good balance for temperature control (20 degC) in early July and September (very important degC) in early July and September (very important for returning adults and their spawning conditions).for returning adults and their spawning conditions).
•• What are your questions? What are your questions? ☺☺
Dworshak Outflows and Lower Snake River Tailwater Temperatures in 2007(April 1 - September 30)
25th Percentile 75th Percentile Daily Mean Observed Outf low
This plot displays t he daily range of regulat ed f lows at Lower Granit e. Fif t y percent of t he f lows f all wit hin t he narrow shaded rect angles and t he daily ext remes of t he f lows are bound by t he “whiskers”. Dworshak is regulat ed t o reach elevat ion 1600 on 30 June. Brownlee is regulat ed
t o reach elevat ion 2077 on 25 June.
Priest Rapids Operations 2007
110
140
170
200
230
11-Jun 12-Jun 13-Jun 14-Jun 15-Jun 16-Jun 17-Jun
Dis
char
ge in
kcf
s
110
140
170
200
230Flow Band
Daily delta
Number of exceedances: 2
COLUMBIA RIVER REGIONAL FORUM
TECHNICAL MANAGEMENT TEAM June 20, 2007 Meeting
FACILITATOR’S SUMMARY NOTES ON FUTURE ACTIONS
Facilitator: Robin Harkless Notes: Erin Halton
The following notes are a summary of issues that are intended to point out future actions or issues that may need further discussion at upcoming meetings. These notes are not intended to be the “record” of the meeting, only a reminder for TMT members. Review of Facilitator Notes / Meeting Minutes Facilitator notes and meeting minutes for the May 30th TMT meetings had no further changes and were finalized. June 13th TMT facilitator notes had additional edits submitted in a redline version by the COE, which were reviewed by TMT members during the meeting. CRITFC submitted an edit to page 3 of the facilitator notes: they support a flat flow in “Montana”, not the system. Dave Wills made an edit to the official minutes’ to clarify that the sturgeon pulse was not necessarily going to end on June 23rd. Paul Wagner made an edit to the official minutes’ updated forecast section: Dworshak “temperatures”, not flows were between 45-50°. Priest Rapids Update Russell Langshaw, Grant County PUD, reported on Priest Rapids operations; a graph linked to the TMT agenda showed 2 exceedances between 6/11-6/17, with mean flows of 165.9-189.4 kcfs. Langshaw noted that 6/20 was the last day for protected flow bands, as 400 temperature units were expected to be reached. TMT members commended the good job done on Priest Operations this year.
Action/Next Steps: A final Priest Rapid update will be on the agenda for the 7/11 TMT meeting and the full report at the TMT year end review in November.
Libby/Hungry Horse Operations: SOR 2007-MT-1Brian Marotz, Montana, presented a “brief sketch” of information on research ongoing at the Flathead and the Kootenai River per mainstem amendments calling for a study of dam operations effects on fish population levels. Marotz said that although funding issues caused some delays, a baseline comparison of relative abundance in the Kootenai River will be pulled together by biologist Ryan Sylvester, and computer modeling will be used to augment the physical monitoring until more empirical data becomes available.
Action/Next Steps: Sylvester’s 2006 work is available online on BPA’s website, and Montana State University will be working on modeling. Marotz said that Instream Flow Incremental monitoring will be ongoing and offered to answer additional inquiries/questions about details of the research via email.
Updated Flow Forecasts
1
Cindy Henriksen, COE, referred TMT to several flow forecasts posted to the TMT web page, updated as of 6/19. She noted that Libby inflows had increased due to warm weather, with inflows expected to reach 45 kcfs by the end of the week. Henriksen said the Libby ESP graphs showed a general recession through August. Dworshak ESP graphs showed inflows just under 6 kcfs, with general recession expected through August. John Roache, BOR, noted that Hungry Horse was at elevation 3559.37', and that the inflow spike that appears on the ESP graph is due to adjustment/calibration of the forebay gage and not a rise in inflows. Although inflows into Hungry Horse are generally in recession, the project will be closely monitored while full in order to react to any changes in inflows. Regulated outflows at Lower Granite were expected to be fairly flat through the remainder of June and were in the range of 35-40 kcfs. (NOTE: It was noted that the hydrographs read “discharge”, but were actually depicting inflows.) Grand Coulee Flood Control John Roache, BOR, reported that the project no longer had any maximum elevation constraints and would operate based on refilling to elevation 1290 feet and maintaining flows in the lower Columbia River as smooth as possible. Dworshak Operations Cindy Henriksen reported that Dworshak was at a full elevation of 1599.8' and operating with outflow through the units in overshot mode, with outflows increasing slightly and outflow temperatures of 44°. Jim Adams, COE, referred TMT to thermocline graphs and noted that temperature trends in the lower Snake River have fluctuated since 4/1, but were expected to reach 68° by 7/1 and were typical overall when compared to prior years. TMT members noted the need to use temperature criteria to manage the system and Russ Kiefer, ID, suggested looking at prior years’ trends on the DART page and data from Anatone and Orofino. In addition, Kyle Dittmer, CRITFC, gave a power point presentation on a CRITFC hydro spreadsheet and EPA’s RBM10 Dworshak modeling provided by Ben Cope, EPA, that blended four comparable to 2007 years: 1970, ’73, ’78 and 1988. Included in the presentation was a Nez Perce Dworshak operations scenario for 2007 that showed the project drafting to 1535' on 8/31 and 1520' by 9/20, with temperature control and outflows shaped to support adult and juvenile fish. He also showed a scenario of 2006 operations. Dittmer noted that the 1988 data tracked well with 2007 observed data to date, and that there are concerns for potentially high temperatures in mid-late July.
Action/Next Steps: Ben Cope will be available to discuss the RBM10 modeling at the 6/27 TMT meeting.
Dave Statler, Nez Perce Tribe, acknowledged the challenge in managing summer conditions and said he was hopeful for a good balance of meeting multiple needs. Statler added that the mild weather conditions this year may help support Dworshak operations. TMT members discussed whether releasing warmer water from Dworshak earlier in the spring would promote fish growth; Dave Wills, USFWS, noted that the Dworshak Hatchery would prefer temperatures of 46-47° to support the hatchery fish.
2
Greg Haller, Nez Perce Tribe, said that the Dworshak Board was awaiting the appointment of an ID representative and hoped to convene late this week or early the week of 6/25 to develop a draft plan for the use of 200 kaf for flow augmentation. Haller clarified that the “plan” will be used as a framework and will include operational flexibility, as use of the water will be driven by actual conditions.
Action/Next Steps: • The COE will operate Dworshak within the top .5' of the reservoir and
expect temperatures to stay in the 44-45° range. Daily flows will be shaped to mimic natural conditions and follow load, with consideration of ramp rate limitations.
• Given the above objectives, the COE and BPA will develop operation specifics that will be shared with TMT.
• Sampling data used to determine the growth rates of Fall Chinook will be on the agenda as part of Dworshak operations for the 6/26 and 7/11 TMT meetings.
• Salmon managers will discuss the draft framework for the 200 kaf developed by the Dworshak Board at FPAC on 6/26.
• TMT members will discuss Dworshak operations at the 6/27 TMT meeting.
Libby Operations Scenarios Cindy Henriksen, COE, referred TMT to graphs linked to the TMT agenda that were based on updated ESP/STP forecasts, showing scenarios that follow the flat flow objectives of the MT SOR and drafting Libby to 2439' by the end of August. She added that, given the inflow rise from 6.5 MAF last week to 7.1 MAF this week, there may be a need for fluctuation of flows between +/- 3 kcfs relative to the recommended 15 kcfs flat flows. Jim Litchfield, MT, clarified the objective of the flattest flows possible given the new forecasts, and acknowledged the past efforts to avoid double peak. Russ Kiefer, ID, said ID supports MT desire for flat flows to support resident fish and added that they would not want to see flows go above 18 kcfs. TMT members discussed the potential need for higher than 15kcfs flows to support barges traveling through the area; Sue Ireland, Kootenai Tribe, clarified that a steady, stable flow was most important to the tribe at this point, and that any potential issues with barge passage over lower areas would not likely arise until July 6. Henriksen clarified that the sturgeon volume was expected to be exhausted sometime between 6/23-24. TMT members shared the following feedback on Libby operations of 15kcfs from 6/20 – 6/26:
• ID: support • OR: generally support, with some concern for potential flow reduction on the
lower Columbia. Interest is in a flow-neutral system and look to the Action Agencies to determine how to best mange flows.
• MT: support, as it meets the objectives laid out in the SOR • USFWS: does not oppose to the 15 kcfs, and looks to revisit next week
3
• NOAA: supports a stable flow operation. Requested that if there are desired end of month targets that they be discussed at TMT as soon as possible
• Nez Perce: no comment • CRITFC: no comment
Action/Next Steps: The COE will continue to operate Libby at 15 kcfs for another week. TMT will discuss updated forecasts and revisit Libby operations at the 6/27 meeting.
Hungry Horse John Roache, BOR, reported that Hungry Horse was near full, at elevation 3559.37', with outflows of 4.1 kcfs and inflows ranging between 5-5.5 kcfs. He added that the project is estimated to draft around 20' by the end of September if a flat flow of 4.0 kcfs is released through September. ID and NOAA said they generally supported the flat flows; ID acknowledged the need for flexibility and NOAA said they supported a holistic approach to managing the system. MT clarified the desire to see any excess water stored for re-shaping later in the season, if needed to stabilize flows.
Action: The project will continue to operate around 4.1 kcfs outflows unless required to increase in order to manage refill and TMT will revisit Hungry Horse at the next meeting on 6/27.
McNary/Lower Monumental/Bonneville Spill Update Bernard Klatte, COE, reported on a stilling basin erosion survey and proposed spill schedules linked to the TMT agenda:
• Bonneville summer spill operations (85 kcfs day/spill cap at night starting on 6/21)
• McNary summer spill (randomized 2-day blocks of 40/60% spill starting 6/19.) The proposal process was coordinated through FFDRWG, SRWG, FPOM and agreed to by signatories to the 2007 Spill Agreement. A ‘package’ was submitted to the court on 6/19, with a plan to implement actions on 6/21. As of the 6/20 TMT meeting, the judge had not responded.
Action/Next Steps: A status conference was scheduled for later in the day on 6/20, at which these items may have been discussed. The COE planned to implement the proposed actions, barring any objections from the court.
2007 Summer Treaty Fishing Kyle Dittmer, CRITFC, referred to an SOR linked to the TMT agenda, requesting 1’ hard constraints for the pools at John Day, Bonneville and The Dalles. The COE clarified that it operates Bonneville with a 1.5’ fluctuation band and said they would coordinate with CRITFC on summer fishing operations.
Action/Next Steps: This will be on the agenda for the 6/27 TMT meeting Operations Review Reservoirs – Cathy Hlebechuk and John Roache reported on reservoirs. Grand Coulee was at elevation 1282.5'. Libby was at 2440'. Flows in the Lower Snake were receding and spring season averages will be presented at the TMT meeting on 6/26.
4
Fish – Paul Wagner, NOAA, reported on juvenile and adult fish. Updated passage numbers on the Fish Passage Center website showed a continued downward trend, with less than 1,000 Chinook passage per day at all project but McNary. Subyearling Chinook counts were decreasing and Steelhead counts were ‘trickling through.’ Wagner noted that 18,000 adults had passed Bonneville thus far, and said that jack counts continued to be strong. Gas Bubble Trauma data will be discussed once data from ongoing sampling is posted. Power system – Nothing to report. Water quality – Jim Adams, COE, had no exceedances to report.
Next face-to-face TMT meeting: Wednesday, June 27th
Agenda items will include: • Review/Finalize Facilitator’s Notes and Meeting Minutes • Updated Flow Forecasts • Libby Operations • Dworshak Operations • Summer 2007 Treaty Fishing • Operations Review – including an update on Ice Harbor Spill Caps
5
Columbia River Regional Forum Technical Management Team Meeting
June 20, 2007 1. Welcome and Introductions Today’s TMT meeting was chaired by Cindy Henriksen and facilitated by Robin Harkless, with representatives from COE, BOR, Idaho, Montana, Oregon, CRITFC, BPA, NOAA, USFWS and the Nez Perce Tribe attending. The following is a summary (not a verbatim transcript) of the topics discussed and decisions made at the meeting. Anyone with questions or comments about these notes should provide them to the TMT chair or bring them to the next meeting. 2. Review Facilitator’s Notes/Meeting Minutes
There were no changes to the May 30 facilitator’s notes or official minutes. Cathy Hlebechuk scrolled through changes to the June 13 facilitator’s
summary. In the section on Grand Coulee flood control, she clarified that the expected residual runoff at all projects was based on the June final forecasts. In the section on Flows, she added Paul Wagner’s (NOAA) statement that the proposed Montana operation is consistent with the 2004 BiOp. Spill caps were changed at Lower Monumental, not Ice Harbor, to control TDG levels in the Ice Harbor forebay, Jim Adams (COE) said. At the bottom of page 3, it should say “CRITFC did not oppose targeting flat flows in Montana,” not “in the system,” Kyle Dittmer said. In the last paragraph of the Grand Coulee Flood Control section, John Roache added “summer” so it now says “spring and summer flow targets.”
Regarding the June 13 official minutes, in the last paragraph of section 5
on page 8, Paul Wagner changed outflows at Dworshak to “under 45-50 degrees Fahrenheit,” not “kcfs.” With the above changes, the June 13 facilitator notes and official minutes were finalized. 3. Priest Rapids Update
Last week, there were a couple of minor exceedances (2 kcfs and 2.9 kcfs) which occurred on Friday and over the weekend, Russell Langshaw (Grant County PUD) said. Mean discharges ranged between 165.9 and189.4 kcfs. Minimums were 153.1 to 179.5 kcfs; maximums were 180.1 to 216.0 kcfs. Daily deltas over the weekend were 18.1 to 62.9 kcfs. Today will be the last day of flat protection flows because 400 temperature units have been reached.
On July 11, Langshaw will give TMT a final update and seasonal summary
of the Priest Rapids operation. He will also participate in the November TMT review.
6
4. Libby/Hungry Horse Research
There has been demand for information on the Libby project, and ongoing research in the Flathead basin covers most of the efforts people were interested in, Brian Marotz (Montana) said. He gave a brief sketch of the research on the Northwest Power and Conservation Council’s Mainstem Amendments. The state of Montana has hired a biologist, and the state of Montana is looking at using annual population estimates to evaluate fish abundance in the Kootenai River. PIT tag detection weirs are being installed on specific tributaries to monitor populations. Gaps in research are slowly being filled with models until researchers can get empirical data, Marotz said.
The state is also working with Montana State University to study the bull
trout population. An official report by Ryan Sylvester, posted on the BPA website, gives further details on this research. Another Montana project is examining IFIM (instrumental flow incremental methodology) in the Flathead River. Marotz offered to provide further research details to interested TMT members if they don’t find what they want online. 5. Updated Flow Forecasts for Hungry Horse, Libby, Dworshak and Lower Granite
Cindy Henriksen (COE) presented inflow and outflow hydrographs based on this week’s ESP traces for Libby, Dworshak, Hungry Horse and Lower Granite. Inflows at Libby were 36 kcfs on June 13, dropped to 30 kcfs on June 15, and rose to 36 kcfs again on June 19. The rise in inflows is due to warmer weather in Canada and the upper tier of the Columbia basin. Forecasted inflows could go as high as 45 kcfs later this week. Daily box whiskers plots show Libby inflows generally in recession through the end of the forecast period, Aug. 31.
Forecasts show inflows at Dworshak at less than 6 kcfs and receding
through August. Any rises in inflows would be the result of unpredictable precipitation or thunderstorms. Some of the graphs refer to inflows as discharges; Henriksen apologized for the confusion. All the graphs attached to today’s agenda depict inflows, regardless of naming convention.
What appears as a bump in inflows actually was a calibration change in
the forebay gage at Hungry Horse, which was 0.17 feet off, John Roache (BOR) said. Horse is at elevation 3,559.37 feet and almost full, with inflows in recession. Warmer temperatures can be expected, but there’s probably not enough snow left for that to make a measurable difference in the water supply.
Inflows at Lower Granite are in recession through the rest of June.
Outflows – about 57 kcfs at this time last week – are currently in the low 40s trending toward 35 kcfs.
7
6. Grand Coulee Flood Control
There is no longer a need for a flood control maximum elevation, Roache reported. For the remainder of the season, BOR will allow the reservoir to fill based on chosen elevation targets while attempting to provide as smooth an operation as possible in the lower river. Full refill is expected about July 8 or 9.
7. Dworshak Operations
Dworshak is full, and decisions need to be made regarding the rest of the season, Henriksen said. The COE has temperature information for TMT to use in the decision process.
The Nez Perce Tribe has a goal of using its 200 kaf of releases primarily
in September, Greg Haller said. He will give an update on the plans at the next TMT meeting June 27. The 200 kaf operation kicks in when the reservoir reaches elevation 1,535 feet. The SRBA board tries to predict when that will happen and makes flexible plans around that date, Haller said.
Adams showed TMT graphics depicting outflow trends since April 1 at Dworshak and tailwater temperatures in the lower Snake River. Tailwater temperatures at Lower Granite have been on a roller coaster this year. Current conditions at Lower Granite tailwater are a daily average temperature of 61.3 degrees F, with an upward trend. Regression analysis shows 68 degrees F occurring around July 1 if the current trend continues. So, based on current trends and the near-term weather outlook it looks like we may be able to hold off increasing cold water releases from Dworshak until early July, Adams said. He reminded TMT that last year, action was specifically called for if the Lower Granite tailwater temperature hit 67 degrees F. Hells Canyon operations are significant in terms of daily flow and temperature fluctuations at Lower Granite, Dave Statler said.
Adams presented a graph of inflow rates and water temperatures entering Lower Granite pool. The graph shows Dworshak flows and tailwater temperatures, and it includes Orofino and Anatone. Using the data from Anatone and Orofino can provide advance notice of a day or two to avoid temperatures exceeding 68 degrees F at the Lower Granite tailwater.
The most recent thermocline data was taken on June 18. The graph
shows a very steep thermocline, with the temperature dropping from 19.7 degrees C to 11.8 degrees C. That is expected to flatten out as summer progresses, Adams said. Fertilization efforts at Dworshak this summer could affect the thermocline. At present, it appears that plenty of cool water is available.
8
Kyle Dittmer (CRITFC) presented EPA-RBM10 modeling results for the lower Snake. The graphs are the fruit of a seven-year cooperative effort between CRITFC, the Nez Perce Tribe and EPA to model summer flow scenarios for Dworshak. The investigation started with 27 scenarios and was narrowed down to a few at a time. Dittmer chose the summers of 1970, ‘73, ‘78 and ‘88 as good years for simulating this year’s weather, mainly because they were all El Nino years that translated into La Nina the following year. A characteristic of such years is extremely variable weather.
The first graph Dittmer shared shows release temperatures out of
Dworshak and Brownlee at 43 to 46 degrees F, respectively. So far, the analysis shows that the four surrogate years match well with the current year’s forecast. The graphs indicate there could be temperature concerns by mid to late July.
Dittmer, Haller and Statler had agreed prior to this meeting that their
preferred Dworshak operation this year is a general draft downward from full pool, arriving at elevation 1,535 feet by end August, then 1,520 feet by Sept. 30, while limiting outflows to no more than 7 kcfs during the first half of July to avoid stunting the growth of smolts in the Clearwater. Flows should be increased during the last half of July to satisfy temperature concerns, followed by shaping of the 200 kaf for the Nez Perce Tribe in September. This recommendation represents an attempt to balance the needs of juvenile and adult migrants, Dittmer said.
The data labeled TMT-2006 shows what was done last year, which can
serve as a frame of reference. The recommended Nez Perce plan calls for passing inflows of 3 kcfs the first week of July, followed by 7 kcfs the second week, then 12 kcfs the third week and 14 kcfs the last week of July. The plan calls for stepping up to 12 kcfs or down to 10 kcfs for the rest of August, followed by a receding hydrograph of 7 kcfs the first week of September, and 4 kcfs the second week of September. Under this plan, Dworshak would reach elevation 1,520 feet by mid-September. This year will have carry over of approximately 200 kaf in September, Dittmer said. Water temperature modeling suggests there won’t be major temperature problems this year. Releases out of Brownlee and Hells Canyon might be more limited this year due to the steep decline in the water forecast. Therefore, Dworshak will have a bigger impact on water temperatures in relation to the amount of hot water coming from the upper Snake. This could help keep temperatures down in the lower Snake.
Maintaining adequate cooling capability could be a challenge this summer, Dave Statler said. It can be difficult to balance the Nez Perce Tribe’s desire for limited releases of cold water in early July with the salmon managers’ desire for more flows in early July, Dittmer said. Wagner asked Statler, is there a target you’d like to see in the Clearwater River in July? A temperature of 60 degrees F
9
would be good, Statler said. Dittmer requested an update on the fork length of fish in the Clearwater relative to historical norms, which Statler will provide at the next TMT meeting. Scott Bettin asked whether the models assumed undershot or overshot conditions at each generating unit at Dworshak last year? Dittmer said he would find out. All gates are currently in overshot mode this year, Adams said.
The current outflow temperature at Dworshak is 44 degrees F, Henriksen said. Temperatures are stratified at the bottom, but some units are operating in overshot mode now. Outflows were increased June 19 because Dworshak was full, so now the COE is operating both the big and the smaller unit to create space in the reservoir. The expected inflow for the remainder of June is 4 kcfs. Space is needed for diurnal effects that cause reservoir elevation to rise during the day and fall at night. TMT will need to discuss plans. The COE will stay the course as long as the current outflow temperature remains at 44 degrees F, Henriksen said. She asked whether there would be an SOR next week on July operations. FPAC will discuss this issue on Tuesday, with the possibility of presenting an SOR next week. Russ Kiefer asked whether a range of 60-62 degrees F is optimal for fish growth, and if so, would releasing warmer water from Dworshak at this time of year help boost fish growth? Conversely, if 68 degrees is optimal on June 30, and warmer water is being released now, Robyn MacKay (BPA) asked, should the Clearwater River be cooled now by beginning to release 40 degrees F water from Dworshak in undershot mode to extend the date when the Clearwater River gets to warm, without having to use additional cold water volume from within the reservoir now? That operation could be a useful tool if there are problems in the lower Snake, Statler said. Temperatures of 46-47 degrees F are preferred at the federal hatchery for the sake of steelhead and Chinook growth, David Wills (USFWS) said. Cooling the Clearwater River to 40 degrees F this early in the season would probably have an adverse impact on the hatchery. At present, the COE is looking for an operating range of 0.5 to 1 foot in the reservoir. Generating unit number one needs to be kept running for the rest of June because of transmission work in the area, Henriksen said. The COE will operate either units 1 and 2 or units 1 and 3, while trying to select flows that keep the reservoir within a foot of full, and outflows in the current range of 44-45 degrees F. Diurnal inflow may mean that daytime inflows will be larger than those at night. These daytime and nighttime inflow amounts will change somewhat in July and August. The group discussed management of outflows through June. The small amount of remaining volume at Dworshak can be used either to (1) hold a flat discharge with the reservoir elevation moving up and down, or (2) use the reservoir to shape daily outflows which will fluctuate while reservoir elevation
10
remains steady, MacKay said. She asked whether there was any objection to that operation. Average outflows would fluctuate from 4 to 4.5 kcfs during the daytime to as low as 1.3 kcfs at night, Henriksen said. If outflows are kept in that range during the daytime, diurnal fluctuations could be limited to 2-6 kcfs of outflows within a given day. There was general support for an operation that limits fluctuations to those that mimic the natural river hydrograph.
The COE will operate Dworshak to within the top 0.5 foot of full, managing outflows to mimic the diurnal effects of reservoir inflows, Hlebechuk said. There will be some load shaping for generation, with the reservoir operated to ramp rate limits. The COE and BPA will work on specifics, then present the results to TMT. In the interim, current reservoir operations will continue. 8. Montana Proposal for Libby/Hungry Horse
Henriksen presented scenarios that imitate the Montana SOR through July 21. The strategy currently being shown for Libby outflow is a default operation from the BiOp that shows Libby drafting to elevation 2,439 by end August. The SOR recommended that Libby outflows be kept at the current level of 15 kcfs through July 21. Henriksen informed TMT that last week’s prediction of 6.5 maf average inflows to Libby for April-August has risen to 7.1 maf this week, a large jump in the predicted volume, based on temperature and precipitation data. Based on the new forecast, the elevation of Libby reservoir could rise to within 5 feet of full in July, and there may be a need to go to plus/minus 3 kcfs flows after July 21, if the Montana recommendation of flat 15 kcfs outflows is followed.
Litchfield favored maintaining 15 kcfs outflows in light of the new forecast,
while making every attempt to avoid big fluctuations in Montana’s river levels. Idaho supports Montana’s desire for flat or slightly declining flows, Kiefer said. The river appears to be most productive for fish when flows are between 9-18 kcfs; beyond that, the force of the flows disturbs gravel and reproduction. NOAA supports maintaining outflows of 15 kcfs, but clarification is needed ASAP as to when the target elevation of 2,439 feet will be reached, Wagner said. He noted that Montana’s proposed operation, which is equivalent to drafting 10 feet into September, is more likely based on this larger water supply volume than the 20 foot draft allowed in the mainstem amendments. Oregon is generally supportive of Montana’s request but is concerned about flow reductions that could occur in the lower river in August, Rick Kruger said. Kruger asked if a swap or other water could be used to make up the flow in August. US Fish and Wildlife would prefer going up to 17 kcfs to avoid complications with the river barge but won’t oppose the 15 kcfs request, Dave Wills said.
Bettin asked, if flows need to be increased to 17-18 kcfs for a few hours to
move the coring barge, can that change be made without consulting TMT? A few hours of fluctuation would not be a problem in Montana as long as the ramp rates are followed, Litchfield said. Sue Ireland of the Kootenai Tribe provided
11
information on the barge operations. Shallowness could be a problem, but not until after July 6. The Kootenai Tribe supports Montana’s request for a steady, stable flow and agrees with keeping flows at 15 kcfs, she said.
The COE will maintain outflows of 15 kcfs with the possibility of continuing
at that level until July 21. This issue will be revisited next week when more is known about the impact of flow forecasts on Libby reservoir.
Regarding the Hungry Horse aspect of the Montana SOR, currently the
reservoir is at elevation 3,559.37 feet, within the top foot of full, Roache said. Outflows are 4.1 kcfs, and inflows are receding to around 5 kcfs, with the reservoir slowly filling at the rate of about a tenth of a foot per day. Outflows might have to be increased if warmer temperatures cause the reservoir to get closer to full. Outflows will remain at 4.1 kcfs unless inflows pick up. Based on residual volumes and the expectation that the reservoir will fill by the end of June, a flat flow of around 4 kcfs would put the reservoir at 20 feet below full by the end of September, Roache said. Idaho and NOAA approved this operation for the time being. It will be revisited next week in light of new information. 9. Lower Monumental, Bonneville & McNary Spill Update and Bonneville Survey for Spillway Erosion
Three spill operations were requested which were outside the 2007 Operations Agreement so they had to be coordinated with signatories to the agreement, Bernard Klatte (COE) said.
(1) There has been a request to start summer spill at Bonneville dam on
June 21st instead of July 1. Reason: the Chinook run is early this year, and researchers need to tag fish for evaluation. Also, the request asked for 85 kcfs spill during the day instead of 75 kcfs that was prescribed in the 2007 FOP. This increase in daytime spill is to evaluate a new spill pattern developed at ERDC.
(2) There has been a request to move the start of McNary summer spill
from July 1 to June 19. This will result in a spill increase of 60% of flow for five days.
(3) A contract has been awarded to investigate erosion in the Bonneville spillway, most notably in bays 9, 12 and 14. As a result, there has been a request for a partial spill outage on Sunday, June 24, from 12 to 4 pm. It appears that the concrete apron in bay 9 has eroded to only 6 inches thickness above an observation gallery. Attraction spill in bays 1 and 18 for adult migrants will continue throughout the survey.
There was also a request to change summer spill at Lower Monumental,
but that was opposed by NOAA and Oregon, so it was dropped from further consideration. The change in operations from the 2007 Spill Agreement were submitted to the court in one package. All signatories to the agreement have
12
participated in these deliberations, so, barring disagreement from the court, COE will begin these operations tonight. 11. 2007 Treaty Fishery (CRITFC SOR C-1)
The summer treaty fishery SOR this year calls for a hard system constraint to hold the Bonneville, The Dalles and John Day pools within 1-foot elevation bands for two and a half days of fishing. The purpose of the 1-foot fluctuation bands is to prevent tribal nets that cost around $500 apiece from getting lost or damaged. This has been an issue in previous years, Dittmer said.
As part of this year’s tribal fishing operation, CRITFC did a net flight
survey June 19. There were 288 tribal nets in zone 6. Bonneville pool held 110 of the nets (39%), The Dalles held 58 nets (20%), and John Day held 120 nets (41%). In previous years, there have been more nets at John Day and The Dalles, but this year the tribes shifted to Bonneville, Dittmer said. There will be an updated SOR on the tribal fishery next week.
The Corps will hold Bonneville pool between elevations 75.0 and 76.5 feet
as a hard constraint, said Henriksen, and a one foot range within that as a soft constraint. The Dalles pool is very small and usually only fluctuates about one foot. Similarly the John Day pool is already operating in a one and a half foot operating range per the BiOp. 12. Operations Review
A. Reservoirs. Grand Coulee is at elevation 1,282.5 feet, Roache said. Hungry Horse is
at elevation 3,559.37 feet, releasing 4.1 kcfs. Libby is at elevation 2,440 feet, filling about half a foot per day. Dworshak is full, with flows in the lower Snake receding to 35 kcfs. McNary flows have also receded to around 200 kcfs.
Regarding flow augmentation on the upper Snake, the BOR has estimated
427 kaf will be available this year, and flows began today from the upper Snake projects. Flow augmentation from the Boise started June 13. Payette flow augmentation started May 31. Brownlee is close to full, meaning inflows will no doubt be passed down the river, Roache said.
B. Fish. Russ Kiefer expressed appreciation for the teamwork that resolved the recent problem with adult fish delay between Little Goose and Lower Monumental.
The numbers for combined yearling Chinook are trending down, with
fewer than 1,000 fish passing daily at all projects except McNary, Wagner said.
13
The subyearling Chinook migration is active, with around 5,000 hatchery fish passing per day. The numbers at Little Goose (5,000-10,000 per day) are lower than those at Lower Granite, thanks to the RSW’s efficiency. Subyearling Chinook passage at McNary is up to 50,000 per day.
Steelhead passage is down to a few hundred per day at Lower Granite,
and less than that at Lower Monumental, Wagner said. There are less than 1,000 fish passing in the lower river.
Regarding adult passage, 18,000 summer Chinook have passed at
Bonneville so far. Jack counts continue to be strong.
C. Power. There is nothing new to report, Robyn MacKay (BPA) said. D. Water Quality. There have been no exceedances in the past week,
Adams reported. 13. Next TMT Meeting The next TMT meeting on June 27 will include updated flow forecasts, Dworshak and Libby operations, updates on the Montana and CRITFC SORs, and the usual operations review. This meeting summary was prepared by consultant and writer Pat Vivian. Name Affiliation Cindy Henriksen COE Russ Kiefer Idaho Jim Litchfield Montana Rick Kruger Oregon John Roache BOR Kyle Dittmer CRITFC Dave Statler Nez Perce Tony Norris BPA Bernard Klatte COE Rudd Turner COE Cathy Hlebechuk COE Jennifer Miller Susquehanna Paul Wagner NOAA Robyn MacKay BPA Phone: David Wills USFWS Russell Langshaw Grant Co. PUD Brian Marotz Montana Greg Hoffman COE Laura Hamilton COE
14
Barry Espensen CBB Margaret Filardo FPC Dan Spear BPA Scott Bettin BPA Tim Heizenrader Cascade Richelle Beck DRA Shane Scott NWRP Dave Benner FPC Russ George WMC Bruce McKay Consultant Sue Ireland Kootenai Tribe
15
COLUMBIA RIVER REGIONAL FORUM
TECHNICAL MANAGEMENT TEAM June 27, 2007 Meeting
FACILITATOR’S SUMMARY NOTES ON FUTURE ACTIONS
Facilitator: Robin Harkless Notes: Erin Halton
The following notes are a summary of issues that are intended to point out future actions or issues that may need further discussion at upcoming meetings. These notes are not intended to be the “record” of the meeting, only a reminder for TMT members. Review of Facilitator Notes / Meeting Minutes June 20th TMT facilitator notes had one clarifying edit to the McNary/Bonneville spill section and were finalized. The Meeting Minutes from June 20th were not yet posted and will be finalized at the July 11th TMT meeting.
Action: The COE will post the final version of the 6/20 facilitator notes and the draft Meeting Minutes as soon as possible.
Updated Flow Forecasts Cindy Henriksen, COE, referred TMT to several flow forecasts posted to the TMT web page, updated as of 6/26. She noted that Libby inflows had receded, with the ESP forecast now showing 6.8 MAF. Henriksen clarified that the ESP hydrographs read “discharge”, but were actually depicting inflows. Paul Wagner, NOAA, noted that the River Forecast Center’s inflow forecast for Libby was showing 7.5 MAF. Dworshak, Lower Granite and Hungry Horse forecasts were also reviewed, with all projects expected to generally recede. Lower Granite modeling showed a slight increase in July based on augmented flows out of Dworshak. Henriksen characterized the July-August period as one with not a lot of variation in flows expected for Libby, Dworshak of Hungry Horse. Dworshak Operations Cindy Henriksen, COE, reported that Dworshak continued to operate within the top .5' of the reservoir, and said that outflows were at 4.3 kcfs where some hours at night the outflow was reduced to 2.2 kcfs, yesterday’s average outflow was 3.6 kcfs. The project is operating with units releasing water in overshot mode, with a selector gate elevation of 1465'. Jim Adams, COE, referred TMT to one of several graphs linked to the TMT agenda that showed Dworshak outflows and lower Snake River temperature trends. Lower Granite temperatures were at 65-65.5°F, expected to taper for a few days, then continue trending upward; Anatone flows were at 20 kcfs, Dworshak inflows were ranging between 2-4 kcfs, and Orofino flows were in the range of 6.5-7 kcfs and receding. The COE’s model showed temperatures at Lower Granite potentially reaching 68º F (20º C) some time over the next week.
1
Mike Schneider, COE, gave a power point presentation linked to the TMT agenda on CEQUAL modeling for the lower Snake. In his presentation, Schneider noted that lower flows result in a longer travel time (5.5 days) and water warming of 1°C as it moves through the Lower Granite pool. He clarified that he used NOAA’s seven-day forecast, flows of 4.3 kcfs (unsteady state flow), and that temperatures are measured as water leaves the Lower Granite Dam. Schneider recommended continued updates on short-term forecasts and tracking average inflow temperatures to Lower Granite as triggers for management actions. In addition, Kyle Dittmer, CRITFC, gave a power point presentation linked to the TMT agenda that used EPA’s RBM10 modeling with updated observed conditions. Kyle noted that 2007 Dworshak temperature data were tracking well with data from 1970, ’73, ’78 and 1988. The Salmon Managers caucused and discussed a recommendation for Dworshak operations: continue outflows of 4.2-4.3 kcfs until Monday, 7/2, when the Salmon Managers will hold an 11 a.m. conference call to review updated temperature and flow forecasts. Paul Wagner said that the Salmon Managers anticipated a recommendation to shift to 7.5 kcfs on 7/2. Robyn MacKay, BPA, requested at least 1-2 days lead time to implement the operation. A suggestion was made to implement cooler water temperatures out of Dworshak as an interim operation, to allow BPA time to increase flows. Dave Wills responded that from the Hatchery perspective, temperatures below 44°F would not support the hatchery fish.
Action/Next Steps: • The COE will operate Dworshak flows in the range of 4.2-4.3 kcfs. • The Dworshak Board has appointed an ID representative and will hold a
conference call on Friday, 6/29 to discuss the plan for utilizing 200 kaf for flow augmentation. Greg Haller, Nez Perce Tribe, will be in touch with NOAA, BPA and the COE to schedule a meeting of the Board.
• The Salmon Managers will hold a conference call on Monday, 7/2 at 11 a.m. and will make a Dworshak recommendation to the Action Agencies immediately following the call.
• The COE will email TMT members to inform them of the Salmon Managers’ recommendation for Dworshak operations on 7/2. If there is a recommendation to increase outflows, BPA will do its best to implement the change by Tuesday morning.
• Sampling data used to determine the growth rates of Fall Chinook will be on the agenda as part of Dworshak operations discussions at the 7/11 TMT meeting.
Libby Operations Cindy Henriksen, COE, shared the RFC’s updated ESP forecasts and operation scenarios for Libby dam. The COE’s June final water supply forecast (6.95 MAF) and that of the June 26 RFC ESP (6.88 MAF) were fairly similar . The COE shared a ‘default’ operation scenario based on language from the 2004 BiOp, which has the project reaching elevation
2
2439’ by August 31 with flat flows ranging from 15.8-18.3 kcfs. ESP inflows showed 2453.5’ as the maximum elevation that could be reached by the end of August, which is about 5.5’ from full. Cindy noted that the project did not fill with any of the flat flow scenarios. Cindy referred to two ‘bookend’ scenarios, one with flat flows of 17 kcfs to reach elevation 2439’ by August 31, and the other, based on Montana’s SOR, showing 15 kcfs flat flows until July 21, then dropping flows to 12 kcfs through September. This modeled operation resulted in elevation 2450’ by the end of August and 2442’ by the end of September. Jim Litchfield, Montana, noted that Montana had proposed to revisit operations on July 21 with updated conditions, and given current forecasts, said Montana would not object to maintaining flat 15 kcfs outflows through August followed by a gradual ramp down in September. Montana remained concerned with increasing outflows too high (Jim suggested anything in excess of 16 kcfs might be too high) that could adversely impact Montana’s resident fish. Libby/Hungry Horse SOR 2007-07: Bob Heinith, CRITFC, presented SOR 2007-07 on behalf of CRITFC, ODFW, USFWS and the Nez Perce Tribe. (It was clarified that CRITFC signed on as representative of the four Lower Columbia River Tribes, and that Nez Perce signed on separately as an active participant in the discussions leading up to development of the SOR.) The specifics of the proposal were to use flat flows to get Libby and Hungry Horse pools to 20’ from full by August 31. Based on the COE’s forecasts, the proposal suggested implementing 17.4 kcfs out of Libby and 4.4 kcfs out of Hungry Horse as soon as possible to meet these objectives. The rationale behind the proposal was to support resident fish in Montana and to meet flow targets at McNary. The signatories to the SOR also supported pursuing non-treaty storage in order to provide additional relief for Montana’s resident fish. Bob clarified that this proposal did not recommend going above 17.4 kcfs if Libby did not reach 20’ from full by the end of August. It was further clarified that, if the operation were to be implemented by July 1, flat outflows at Libby would be around 17 kcfs. While there was no specific recommendation for September operations, during TMT they deferred to the COE and Montana to determine how to operate Libby and Hungry Horse in September. Regarding Libby operations – Folks discussed the two proposed Libby operations and were not able to reach consensus. Paul Wagner, NOAA, proposed a third option, which was to implement the 2006 operation by going to 17 kcfs now through July and ramping down to 15 kcfs (last year this occurred on July 26) through August 31. Idaho also offered support for all the proposed operations and suggested that the best compromise might be to implement the 2006 operation proposed by NOAA. Regarding Hungry Horse operations – John Roache, BOR, said the current STP/ESP modeling showed that implementing a flat flow between 4.4-4.8 kcfs would get the project to 20’ from full by the end of August. The BOR offered that either proposed operation was feasible to implement (4.4 kcfs flat or 4 kcfs flat through August), and that the BOR was willing to implement either operation. Given the latest forecast, NOAA
3
offered support for operating the project to 4 kcfs. USFWS offered potential support for operating Hungry Horse to 4 kcfs if the two projects could be discussed separately and a compromise could be reached on how to operate Libby. The CRITFC representative needed to check with policy representatives to determine whether this operation would be acceptable. Given the lack of consensus, several TMT members required policy decision on this issue. The issue was elevated to the IT for resolution. ACTION: The COE and the BOR planned to continue operating Libby and Hungry Horse per current operations – 14.8 kcfs outflows at Libby and 4.1 kcfs outflows at Hungry Horse – through Sunday, July 1. An IT conference call was convened on Friday, June 29 at 1:00 pm to discuss Libby and Hungry Horse operations for July 2 through September. UPDATE: Further discussions during the IT conference call resulted in the COE and BOR planning to implement the BiOp default operation, to reach 20’ from full by August 31 at both Libby and Hungry Horse dams. ACTION: Given up to date forecasts (as of the IT call), the COE planned to operate Libby at 17.3 kcfs outflows starting Monday morning, July 2, and the BOR planned to operate Hungry Horse at 4.4 kcfs outflows starting Monday morning, July 2. Montana objected to this operation and requested the issue be elevated to the Regional Executives level for decision as soon as possible. NOAA offered to begin coordinating this call for next week. Summer Transport at McNary Bernard Klatte, COE, reported that the passage conditions at McNary were no longer ‘spring-like’ indicating transportation operations should begin. On behalf of the salmon managers, NOAA proposed that a decision to implement transportation at McNary be delayed until information was gathered from the NMFS Science Center on a 2002 study of transported fish at McNary, to inform the best operation given this year’s spill operation conditions. The salmon managers planned to have a call on Friday, 6/29, to review the information. The COE did not object, and agreed to a check in on Friday. The COE also noted frustration with the delay in receiving the 2001-’02 data and shared that altering the planned transport operation would affect arrangements with the COE contractor. NOAA and the COE suggested that this item be added to the IT agenda. Action/Next Steps: Salmon Managers will share transport information with the COE as soon as they receive it. The issue will be revisited during the FPAC call Friday morning and at IT during their 1:00 pm call. UPDATE: The salmon managers needed more time to look at the study information and continue technical discussions about transportation at McNary. NOAA proposed delaying start of transportation operations until a follow-up discussion could occur at TMT as soon as July 5. No objection was raised. 2007 Summer Treaty Fishing
4
Kyle Dittmer, CRITFC, referred TMT to an SOR linked to the TMT agenda, requesting 1' hard constraints for the pools at John Day, Bonneville and The Dalles. A gillnet fishing document was also linked to the TMT agenda. Dittmer noted that the Bonneville pool dropped to nearly 72.5’ over the past weekend, causing problems for platform fishers. The COE clarified that the drop did not occur during the requested Treaty fishing period and was necessary for clearing debris for human safety and said that, as in the past, the COE would do its best to hold the Bonneville pool in a 1-½ foot range during the Treaty fishing period.
Action/Next Steps: This item will be on the agenda for the 7/11 TMT meeting. Operations Review Reservoirs –Cindy Henriksen and John Roache reported on reservoirs. Grand Coulee was at elevation 1284.3' and targeting refill after 7/4. Hungry Horse was at elevation 3559.7' with outflows of 4.1 kcfs. Spring season averages were 62 kcfs at Lower Granite, 172 kcfs at Priest Rapids, and 246 kcfs at McNary. Fish – Paul Wagner, NOAA, reported on juvenile and adult fish. Updated passage numbers on the Fish Passage Center website showed McNary numbers increasing due to hatchery releases. Steelhead counts were continuing a downward trend and Wagner noted that Little Goose was the most abundant passage location, with gas bubble trauma levels down to 2.9% at the project. Wagner added that jack counts continued to be strong. Power system – Robyn MacKay, BPA, reported ‘non-spring-like’ conditions on the Snake River and said that there would be a shift to minimum generation at the 4 projects on the Lower Snake. Water quality – Jim Adams, COE, had no exceedances to report.
Next face-to-face TMT meeting: Wednesday, July 11th
Columbia River Regional Forum Technical Management Team Meeting
June 27, 2007 1. Welcome and Introductions Today’s TMT meeting was chaired by Cindy Henriksen and facilitated by Robin Harkless, with representatives from BOR, USFWS, COE, BPA, Montana, NOAA, CRITFC, Idaho, the Nez Perce Tribe and FPC attending. The following is
5
a summary (not a verbatim transcript) of the topics discussed and decisions made at the meeting. Anyone with questions or comments about these notes should provide them to the TMT chair or bring them to the next meeting. 2. Review Facilitator’s Notes and Meeting Minutes
A change has already been made to page 3 of the facilitator’s notes for the June 20 meeting, Bernard Klatte (COE) said. The change involved clarifying actions to be taken regarding spill at Bonneville and McNary. The official minutes from that meeting will be posted within the next day or so. 3. Updated Flow Forecasts
Last week the COE’s forecast of Libby water supply for April-August was 7.1 maf, Cindy Henriksen said. That inflow forecast has been revised down to 6.8 maf, which is commensurate with the National Weather Service’s ESP water supply forecast for the same period.
The Libby ESP hydrograph shows that inflows are in recession. Not much
flexibility can be expected at Libby in July and August. Dworshak hydrographs demonstrate a general recession in July and August with some historic rainfall. The outlook for Hungry Horse is very similar. A historic rain even could cause some rises in inflows, but not in excess of powerhouse capacity.
Lower Granite flows are showing recession for the remainder of June. An
increase in early July outflows was based on modeling assumptions that outflows would increase July 5 to provide flow augmentation to Dworshak. The water supply forecasts show that flows at Lower Granite this year will be 69% of average. 4. Dworshak Operations
Dworshak continues to be full, operating within the top ½ foot and releasing outflows of about 43 kcfs, Henriksen said. Inflows are receding rapidly.
Jim Adams showed TMT a graph of tailwater temperatures at the four
lower Snake projects. Temperatures at Lower Granite have taken a strong upturn in response to a hot spell several days ago, then tapered off. As of June 26, the water temperature at Lower Granite was around 65 degrees F and trending upward.
Inflow temperatures are generally on the rise, with a small dip at the
Anatone and Orofino gages reflecting cooler weather in the past 3 to 4 days, Adams said. Inflows passing the Anatone gage are around 20 kcfs; Dworshak outflows are 2 to 4 kcfs; Orofino flow is 6.5 to 7 kcfs and receding. Dworshak temperature data indicate there’s plenty of cool water available for flow
6
augmentation during temperature control operations, Adams said. Dworshak is presently in overshot mode with the top of the gate at elevation 1,465 feet.
Mike Schneider gave a presentation on CEQUAL modeling of Dworshak
temperatures, which assumes Dworshak is at full pool and passing inflows through the July 4 weekend. Currently, releases from Lower Granite are 18.5 degrees C, while temperatures in the forebay range from 16 to 19.5 degrees C. There’s a tendency for warmer temperatures to arrive earlier each year, looking at the last 10 years of data. Because flows are so low this year, travel time through the reservoirs is about 5 ½ days. Schneider emphasized the importance of looking upstream at thermal loadings and making informed decisions before temperatures exceed 20 degrees C.
On the other hand, lower flows will help maintain cooler temperatures due
to the larger proportion of cold water from Dworshak in the water supply. The model simulation predicted that temperatures would level off in several days, then begin to increase slowly over the 4th of July weekend, approaching 20 degrees C on July 5.
These model runs will continue to be updated based on short term
weather forecasts, Schneider said. The COE will continue to track inflow temperatures as a way to identify when the water temperature is in the cautionary zone of 18.5 degrees C, or 65 degrees F, which implies warmer temperatures will be arriving soon downriver. Based on this model and forecast, with Dworshak outflows between 2 and 4 kcfs, the lower Snake will stay under the 68 degree criteria until July 5 or 6, Adams said. Dworshak reservoir is currently at 18 degrees C.
Kyle Dittmer presented the updated results of RBM-10 modeling from 4
surrogate years to predict flows this year on the lower Snake. The approach appears to be tracking well, in fact, the best of all years this effort has been made. According to the modeling, Dworshak will soon be passing inflows, with temperatures approaching 20 degrees C. It looks like things will start heating up next week.
The Salmon Managers who were available caucused to discuss next
steps in light of the new information. Idaho, Nez Perce, USFWS, Montana, CRITFC and NOAA representatives participated in the decision to recommend an increase to 4.4 kcfs outflows as soon as possible, using the big unit or two small units. The Salmon Managers foresaw a possibility of requesting an increase to 7.5 kcfs outflows using the big and small unit after Monday, July 2, when there’s an FPAC conference call at 11 a.m.
Robyn MacKay (BPA) requested lead time on any requests for flow
increases so BPA will be able to market the megawatts effectively. Jim Adams (COE) suggested the Salmon Managers consider that any action they take on
7
Monday include first lowering temperature outflows from 45 degrees F to 42 or 43 degrees F for two days, which would allow BPA adequate lead time to deal with the increased generation.
Sooner would be better, Wagner said. We think there’s more than a 50%
chance we’ll need to start increasing cooler outflows on Monday to avoid exceeding the temperature criteria for listed fish, Kiefer said. Henriksen asked, are you thinking of asking for an increase on Monday? The Salmon Managers haven’t reached consensus on that, Greg Haller said. Henriksen said she would arrange for communication to happen between COE and BPA over the weekend if any criteria are met that would trigger a request for a sudden increase in flows. If the Salmon Managers ask for an increase on Monday, BPA will make its best efforts to increase flows and generation on Tuesday morning, MacKay said. 5. Libby Operations
Cindy Henriksen (COE) presented background information on Libby: ESP volumes, the inflow forecast, and “bookend” scenarios. The early bird forecast was 7.5 maf for April-August; the River Forecast Center’s water supply forecast for the same period is 6.8 maf, which is very similar to the COE’s forecast. Modeling of ESP forecasting inflows shows that if outflows are increased on July 1 with steady outflows to meet elevation 2,439 feet by end August, outflows would have to be 15.8 to 18.3 kcfs. Modeling based on 44 historic weather years showed that generally the average Libby maximum elevation was 2,453.5 feet, or 5 ½ feet from full with flat outflows that reach 2439 feet the end of August. None of the 44 water years would have reached full pool elevation of 2,459 feet at end August with a flat outflow operation.
The first “bookend” scenario for Libby attached to today’s agenda shows
flat outflows beginning July 1 through Aug. 31, reaching elevation 2439 feet at end August. The other bookend, the Montana proposal, shows that if 14.8 kcfs outflows were continued through July 21, then reduced to 12 kcfs for the remainder of July and August into September, the reservoir would fill to elevation 2,435 feet or about 4 feet from full, then draft to elevation 2,450 feet by end August and elevation 2,442 feet by Sept. 30. Montana would like to see steady 15 kcfs outflows through July and August with a gradual ramp down in September, based on the latest information available, Litchfield said.
6. Libby and Hungry Horse Operations: Montana Proposal (SOR 2007-MT-1) and Alternate Proposal (SOR 2007-07)
TMT considered two SORs, the Montana proposal that Jim Litchfield had previously presented to TMT in draft form, now finalized, and a new proposal jointly signed by CRITFC, ODFW, the Nez Perce Tribe and USFWS.
8
At an FPAC meeting yesterday, the signatories to SOR #2007-7 felt it was important to get the full 20 feet of flows out of Libby and Hungry Horse this year, Bob Heineth (CRITFC) reported. So they created SOR #2007-7 in response to the Montana proposal (see above “bookend” scenarios). Because it appears there will be no additional water supply available from non-treaty storage in Canada this year, the signatories have requested outflows be increased to 17 kcfs at Libby in order to get the full 20 feet out by end August. Under this SOR, any additional water from Canada or another source would be retained in Libby reservoir for Montana’s benefit. The tradeoff is, if operations at 17 to 17.4 kcfs outflows end up not drafting the full 20 feet out of the reservoir, outflows would nevertheless remain at 17 to 17.4 kcfs in response to Montana’s request for guaranteed flat flows through summer.
Cindy Henriksen explained that the STP run used in the calculations
showed that steady outflows starting July 1 would be 17 kcfs, and steady outflows starting July 5 would be 17.4 kcfs, in order to reach target elevation by end August. The preference would be for starting the higher outflows sooner rather than later, Heineth said.
Litchfield questioned the pursuit of reservoir elevation targets established
in the mid-90s in light of the Council’s recent recommendations. He noted that there’s only 2 kcfs difference in the preferred July and August operations. However, SOR 2007-7 apparently makes no provisions for September flows that are critical to resident fish in Montana. Therefore, Montana can’t agree to SOR 2007-7.
Henriksen asked what the signatories of SOR-2007 envisioned for
September. Ramp down provisions for September were not included because the signatories assumed those details would be worked out between the COE and Montana, Statler said.
The conversation turned to the likelihood of actually getting the 7.5 maf
predicted in the early bird forecast of water supplies this summer. The RFC has acknowledged that early bird forecasts are made with only preliminary sets of data, Henriksen said. BPA could explore the possibility of a July for August water swap with Canada if that would be helpful, MacKay said. That would not be additional water, but the same amount of water shifted in time. Other than such a swap, Canadian water is not going to be an option this year.
Paul Wagner suggested following last year’s operations as a compromise
between the two SORs. Last year’s outflows were 17 kcfs until Aug. 1, then 15 kcfs for most of August. The decision becomes a policy call when it comes to small differences like 2 kcfs in outflows, Wagner said, because the impacts of such a small difference on life stage effects of listed fish are extremely difficult to measure.
9
Henriksen asked for feedback from other TMT members. Idaho would be comfortable with either operation described in the SORs, Russ Kiefer said. BOR estimates that flat flows of 4.4 to 4.8 kcfs would draft 20 feed out of Hungry Horse by the end of August, John Roache said. He noted that the difference between those levels and the 4 kcfs in the Montana proposal is minimal. Flat flows of 4 kcfs through the end of September would put Hungry Horse at elevation 3,535 feet by end September; flat flows of 4.4 kcfs from July 1 through Sept. 30 would put the reservoir at elevation 3,531 feet by end September, an elevation difference of 4 feet.
USFWS could accept the Hungry Horse provisions in the Montana
proposal if compromise can be reached on Libby operations, David Wills said. However, the other signatories to SOR 2007-7 were not comfortable with that. COE and BOR representatives both said they could not move to a new operation at either dam until a clear consensus was achieved. There was general agreement that deciding among the three proposed levels of operations is a matter of policy, so TMT referred this decision to an IT conference call at 1 p.m. on Friday, June 29.
7. Start Summer Transport
In operating documents the COE submitted to the court, it states that transportation will begin when conditions are no longer spring like, meaning flows are less than 220 cfs and temperatures are around 62 degrees F, Bernard Klatte (COE) said. These conditions have been meet, so transportation should begin. With regard to the effects of transport on ESA-listed and non listed juvenile fall Chinook, the 2004 BiOp says that “activities will be adaptively managed with consideration to in season migration and research results,” Wagner said. The latest available data on this are ocean returns since 2002, when 454 adults returned, their mode of travel unknown. Wagner has asked the Science Center for the latest data by Friday, which FPAC wishes to review before making any recommendations regarding transportation this year. TMT added this item to the agenda for the IT conference call at 1 p.m. Friday. 8. Operation of the Lower Columbia Pools for the Summer 2007 Treaty Fishery (SOR 2007-C2)
Platform fishers at Bonneville pool have had trouble placing their nets because water levels are so low, Kyle Dittmer (CRITFC) said. It appears that pool elevations dropped to about 72.5 feet at Bonneville over the weekend of June 23 -24, which was lower than the tribes were expecting. Henriksen explained that debris had built up near a sailboarding area, so the COE lowered water levels so the area could be cleared for recreation and human safety.
For the next week, the tribes are requesting that the three lower pools
operate within a 1-foot band as a hard system constraint, according to the latest
10
SOR submitted on June 24, Dittmer said. The COE recognizes the need for a steady pool for the tribal fishery, Henriksen said. Bonneville pool is operating between elevation 75 and 76.5 feet as a hard system constraint. The Dalles typically operates within a 3-foot range, and John Day already has a 1.5-foot limit ranging from elevation 262.5 to 264 feet. Dittmer asked whether these specifications are based on the COE’s interpretation of the 1998 Ted Strong agreement; Henriksen said yes. 9. Operations Review
A. Reservoirs. Grand Coulee is at elevation 1,284.3 feet with a goal of refilling after July
4, Roache said. Hungry Horse is at elevation 3,559 feet, releasing 4.1 kcfs. Lower Granite seasonal average flows were 62 kcfs during the spring season; the flow objective was 85 kcfs, Henriksen said. Priest Rapids flows were 172 kcfs from April 10 to June 30. McNary flows have been about 246 kcfs with a spring flow objective of 247 kcfs.
B. Fish. The yearling Chinook migration is basically over, Wagner said. The
subyearling Chinook migration is still underway, but passage indices are low, and collection with spill appears fairly low. The current numbers are far below anything seen previously on the Snake. Migration is going strong at McNary, which reflects large numbers of Hanford hatchery fish passing.
Steelhead passage is trending downward, with Little Goose as the most
abundant location. Jack Chinook returns continue to be strong at about 1,000 fish per day.
Tony Norris asked whether problems with GBT had abated. The latest
data found only 3% incidence, so the wave of GBT trauma has passed, Wagner said.
C. Power. Flows are dropping rapidly on the Snake, and BPA will be going into low-flow operation, which means there will be times when the projects there must operate to minimum generation requirements, Robyn MacKay (BPA) said. In terms of the 2007 operations agreement, that means we’re moving earlier this year than last year into using one unit for generation on the four lower Snake projects and spilling the rest, Henriksen said.
D. Water Quality. This is a low flow period with not much spill, and there
have been no exceedances, Henriksen said. 13. Next TMT Meeting
11
The next regularly scheduled TMT meeting will be on Wednesday, July 11 and will include a final report on the Priest Rapids operation. In the meantime, there will be conference calls on July 5 and 9 regarding Libby/Hungry Horse operations and transportation. This meeting summary was prepared by consultant and writer Pat Vivian. Name Affiliation Cindy Henriksen COE John Roache BOR David Wills USFWS Jim Adams COE Robyn MacKay BPA Jim Litchfield Montana Paul Wagner NOAA Kyle Dittmer CRITFC Dan Spear BPA Tony Norris BPA Jennifer Miller Susquehanna Tim Heizenrader Cascade Bernard Klatte COE Rudd Turner COE Russ George WMC Don Faulkner COE Phone: Scott Bettin BPA Russ Kiefer Idaho Dave Statler Nez Perce Tribe Barry Espensen CBB Mark Bagdovitz USFWS Margaret Filardo FPC Glen Trager Avista Ruth Burris PGE Tina Lundell COE Mike Busko Powerex Steve Jewell COE Walla Walla Greg Hoffman COE Bruce McKary Consultant John XX Constellation Energy
12
T E C H N I C A L M A N A G E M E N T T E A MBOR : John Roache/Mary Mellema BPA : Robyn MacKay/Tony Norris/Scott BettinNOAA-F: Paul Wagner/Richard Dominigue USFWS : David Wills/Steve HaesekerOR : Rick Kruger/Ron Boyce ID : Russ KieferWDFW : Cindy LeFleur MT : Jim Litchfield/Brian Marotz
COE: Cathy Hlebechuk/Jim Adams/Cindy Henriksen
TMT MEETING Wednesday June 27, 2007 09:00 - 12:00
1125 N.W. Couch Street, Suite 4A34 Portland, Oregon 97209-4142
Map Quest [Directions]
Conference call line: 503-808-5190
To check into the building, take the elevator to the 5th floor and the guard will issue you an ID badge if you need one and will take you down to the 4th floor where the meeting is. If you have NOT attended a TMT meeting in the past you will need to call ahead and let Cathy Hlebechuk (503) 808-3942, Jim Adams (503) 808-3938 or Cindy Henriksen (503)
808-3945 know, so you can be added to the TMT Visitor List and issued an ID badge. This badge may be used indefinitely. If you have attended TMT in the past you may re-use your ID badge indefinitely. If you are a federal
employee you will also need to have an ID badge issued to you which can be used indefinitely.
We have had disruptions on the phone because people are not hitting 'mute' after dial in.Please MUTE your Phone
All members are encouraged to call Robin Harkless with any issues or concerns they would like to see addressed. Please e-mail her at [email protected] or call her at (503) 248-4703.
d. Lower Granite1. [Lower Granite Regulated Flows]
4. Dworshak Operations - Alla. [Dworshak Outflows and Lower Snake River Tailwater Temperatures in 2007] b. [Dworshak Water Temperatures Data]
c. [Daily Water Temperature Reports] d. [CEQUAL Temp Modeling - Michael L. Schneider, COE] e. [Lower Snake RBM10 Modeling - Kyle Dittmer, CRITFC]
5. Libby Operations - Cathy Hlebechuk, COEa. [Libby - ESP VOLUMES] b. [Libby - ESP Inflow Flat Flow Operation] c. [Libby Max Elevation - ESP Inflows] d. [Libby - STP Inflow Flat Flow Operation] e. [Libby - STP Inflow Montana Proposal] f. [Kootenai River and Koocanusa Reservoir Temperatures 2007 Sturgeon Operations]
6. Start Summer Transport - Bernard Klatte, COE7. Montana Proposal for Libby and Hungry Horse - All
a. [SOR #2007-MT-1_Final] b. [SOR #2007-07]
8. Operation of the Lower Columbia Pools for the Summer 2007 Treaty Fishery - Kyle Dittmer, CRITFCa. [SOR #2007-C2] b. [Summer Commercial Gillnet Fishing Periods]
9. Operations Reviewa. Reservoirsb. Fishc. Power Systemd. Water Quality - Jim Adams,COE
1. [Spill Information 2007]10. Other
Set agenda for next meeting - July 11, 2007 [Calendar 2007]
Questions about the meeting may be referred to Cathy Hlebechuk at (503) 808-3942 or Jim Adams at (503) 808-3938 or Cindy Henriksen at (503) 808-3945.
Lower Snake Temperature ManagementJune 26, 2007
• General Observations– Temperature in Snake River at Lower Granite 18.5oC
• During June it is common to experience rapid heating events(0.4 oC/day gain)• 2006 earliest arrival of 19 oC water on June 28 to Lower Granite (1995-2006)• Critical period to avoid warm water on Lower Snake River is early July as flows from
warm water sources are receding– Low flows in the Snake River at Anatone and Clearwater River at Orofino
• Low flows result in long travel times through Lower Granite Pool (5.5 days)• Important to look at upstream temperature loading to consider temperature
management alternatives• Temperature management metric
– TInflow>18.5 oC consider DWR flow augmentation alternatives– where Tinflow=(QSPDI*TLEWI+QSPDI*Tanaw)/(QSPDI+QANAW)– One degree C gain during passage LWG pool– June 26 Tinflow=18.0 oC
– Larger percent flow contributed by cold water source DWR during low flow year• Stronger influence of DWR releases on SR temperatures
Lower Snake Temperature ManagementJune 26, 2007
• Forecasts– Weather
• Seven day forecast for Lewiston used to generate hourly Meteorologic input
• Long term weather from SILW for 2004– Flows (STP)
• Clearwater River at Orofino falling from 4 kcfs by July 5• Snake River at Anatone falling from 20 kcfs by July 5• Dworshak full pool passing inflow through July 4
– Temperatures Boundary Conditions at Anatone and Orofino• 2004 average year
Lower Snake Temperature ManagementJune 26, 2007
• Results of CEQUAL-W2 simulation (April 1-July 30)– SR Temps at LWG levels off in several days
• Approaches 20 oC on July 5 • Recommendations –
– Continue to update short term forecasts– Track average inflow temperatures Tinflow as trigger for
ESP 75th PrecentileESP 25th PercentileObserved FlowsESP Daily Mean
Whiskers: ESP Daily Max/Min
ESP flows updated 19-Jun-2007
This plot displays the daily range of flows from the ESP hydrographs. Fifty percent of the ESP flows fall within the narrow shaded rectangles and the daily extremes of the ESP flows are bound by the "whiskers".
Ann062207fullsize.doc
Summer Commercial Gillnet Fishing Periods Adopted June 26-29 and July 3-6 Scaffold Fishery Sales Continue
Friday, June 22, 2007
Today, the Compact states of Oregon and Washington concurred with the tribal regulations for the following Zone 6 spring commercial fishery openings:
COMMERCIAL GILLNET SEASONS AREA: All of Zone 6
DATES: 6:00 AM Tuesday, June 26 through 6:00 PM, Friday, June 29 and
6:00 AM Tuesday, July 3 through 6:00 PM Friday, July 6.
GEAR: There will be a 7 inch minimum mesh size restriction.
ALLOWABLE SALES: Chinook, steelhead, coho, walleye, shad, and carp may be sold or retained for subsistence. Sockeye may not be sold but may be retained for subsistence. Sturgeon may not be sold, but sturgeon between four and five feet total length in The Dalles and John Day Pools and between 45”-60” in the Bonneville Pool may be kept for subsistence.
SANCTUARIES: All standard river mouth and dam sanctuaries shall remain in effect, with the exception of the Spring Creek Hatchery sanctuary, which is not necessary this time of year.
Additional gillnet fisheries will likely be scheduled at a later date.
Scaffold Fishery: The scaffold fishery remains open for subsistence use all year. Sales of fish caught in the scaffold/hook and line fishery continue until further notice. Allowable gears include hoopnet, dipnet, and hook and line. Allowable species are Chinook, steelhead, coho, walleye, shad, and carp. Sockeye may not be sold but may be retained for subsistence. Sturgeon may not be sold. Sturgeon between four and five feet total length in The Dalles and John Day Pools and between 45”-60” in the Bonneville Pool may be kept for subsistence purposes.
* * * * * * * * * * * * * * * * * * * * * * Sales are also allowed for fish caught in overlapping portions regularly scheduled Yakama Nation subsistence fisheries in the Big White Salmon River and the Klickitat River. Please contact the Yakama Fisheries Office (509-865-6262) for exact times and dates.
* * * * * * * * * * * * * * * * * * * * * * If you have any fishing enforcement problems or need assistance or information, day or night, contact the Columbia River Inter-Tribal Fisheries Enforcement Office, 4270 Westcliff Drive, Hood River, Oregon. Phone: (541)-386-6363 or toll-free (800)-487-FISH (3474). Please consult your tribal Fish and Wildlife Committee for additional details on tribal regulations. PLEASE WEAR YOUR LIFE JACKETS FOR SAFETY.
25th Percentile 75th Percentile Daily Mean Observed Outflow
Based on 26 June ESP
18.3 kcfs
15.8 kcfs
Libby - STP InflowFlat Flow Operation - 2439 End of August
2437.8
2453.5
0
10
20
30
40
50
60
70
80
1-May 1-Jun 1-Jul 1-Aug 1-Sep
2007
Flow
(kcf
s)
2380
2390
2400
2410
2420
2430
2440
2450
2460
Elev
atio
n (ft
)
Inflow Outflow Elevation
26 JUNE STP INFLOW USED STARTING 6/26/07
APR-AUG VOLUME= MAF
17.0 kcfs
6.874
Kootenai River and Koocanusa Reservoir Temperatures2007 Sturgeon Operations (1 May - 30 June)
2320
2340
2360
2380
2400
2420
2440
2460
5/1 5/8 5/15
5/22
5/29 6/5 6/12
6/19
6/26Reservoir /
Gate Elevation
(MSL)
0
10
20
30
40
50
60
70
80
90
100
F, kcfs and Stage
(MSL +1700)
Koocanusa Elevation
Gate Elevation
LD Temperature ( F )
BF Temperature ( F )
Libby Dam Flow (kcfs)
Bonners Ferry Flow (kcfs)
Koocanusa Inflow (kcfs)
Bonners Ferry Stage
Libby Dam Air Temp (MaxF)
LD Optimal (F)
Libby - STP InflowMontana Proposal
2450.5
2442.2
2455.3
0
10
20
30
40
50
60
70
80
1-May 1-Jun 1-Jul 1-Aug 1-Sep
2007
Flow
(kcf
s)
2380
2390
2400
2410
2420
2430
2440
2450
2460
Elev
atio
n (ft
)
Inflow Outflow Elevation
26 JUNE STP INFLOW USED STARTING 6/26/07
APR-AUG VOLUME= MAF6.874
12.0 kcfs
Libby ESP Inflows - Daily Box-Whiskers Plot
0
20000
40000
60000
80000
100000
120000
1-May 1-Jun 1-Jul 1-Aug
2007
Dai
ly In
flow
in c
fs__
ESP 75th PrecentileESP 25th PercentileObserved FlowsESP Daily Mean
Whiskers: ESP Daily Max/Min
ESP flows updated 26-Jun-2007
This plot displays the daily range of flows from the ESP hydrographs. Fifty percent of the ESP flows fall within the narrow shaded rectangles and the daily extremes of the ESP flows are bound by the "whiskers".
Clearwater River at Peck (1970, 1973, 1978, 1988 weather)
8
9
10
11
12
13
14
156/
10
6/15
6/20
6/25
6/30 7/
5
7/10
7/15
7/20
7/25
7/30 8/
4
8/9
8/14
8/19
8/24
8/29 9/
3
9/8
9/13
9/18
9/23
9/28
Tem
pera
ture
(Deg
C)
NPT 2007 TMT-2006 Observed 2007
Snake at Lower Granite Dam (1970, 1973, 1978, 1988 weather)
13
14
15
16
17
18
19
206/
10
6/15
6/20
6/25
6/30 7/
5
7/10
7/15
7/20
7/25
7/30 8/
4
8/9
8/14
8/19
8/24
8/29 9/
3
9/8
9/13
9/18
9/23
9/28
Tem
pera
ture
(Deg
C)
NPT 2007 TMT-2006 Observed 2007
Dworshak Outflows and Lower Snake River Tailwater Temperatures in 2007(April 1 - September 30)
25th Percentile 75th Percentile Daily Mean Observed Outf low
This plo t displays the daily range o f regulated flows at Lower Granite. Fifty percent o f the flows fall within the narrow shaded rectangles and the daily extremes o f the flows are bound by the “ whiskers” . Dworshak is regulated to reach elevation 1600 on 30
June. Brownlee is regulated to reach elevation 2077 on 05 June.
1
COLUMBIA RIVER REGIONAL FORUM
TECHNICAL MANAGEMENT TEAM June 27, 2007 Meeting
FACILITATOR’S SUMMARY NOTES ON FUTURE ACTIONS
Facilitator: Robin Harkless Notes: Erin Halton
The following notes are a summary of issues that are intended to point out future actions or issues that may need further discussion at upcoming meetings. These notes are not intended to be the “record” of the meeting, only a reminder for TMT members. Review of Facilitator Notes / Meeting Minutes June 20th TMT facilitator notes had one clarifying edit to the McNary/Bonneville spill section and were finalized. The Meeting Minutes from June 20th were not yet posted and will be finalized at the July 11th TMT meeting.
Action: The COE will post the final version of the 6/20 facilitator notes and the draft Meeting Minutes as soon as possible.
Updated Flow Forecasts Cindy Henriksen, COE, referred TMT to several flow forecasts posted to the TMT web page, updated as of 6/26. She noted that Libby inflows had receded, with the ESP forecast now showing 6.8 MAF. Henriksen clarified that the ESP hydrographs read “discharge”, but were actually depicting inflows. Paul Wagner, NOAA, noted that the River Forecast Center’s inflow forecast for Libby was showing 7.5 MAF. Dworshak, Lower Granite and Hungry Horse forecasts were also reviewed, with all projects expected to generally recede. Lower Granite modeling showed a slight increase in July based on augmented flows out of Dworshak. Henriksen characterized the July-August period as one with not a lot of variation in flows expected for Libby, Dworshak of Hungry Horse. Dworshak Operations Cindy Henriksen, COE, reported that Dworshak continued to operate within the top .5' of the reservoir, and said that outflows were at 4.3 kcfs where some hours at night the outflow was reduced to 2.2 kcfs, yesterday’s average outflow was 3.6 kcfs. The project is operating with units releasing water in overshot mode, with a selector gate elevation of 1465'. Jim Adams, COE, referred TMT to one of several graphs linked to the TMT agenda that showed Dworshak outflows and lower Snake River temperature trends. Lower Granite temperatures were at 65-65.5°F, expected to taper for a few days, then continue trending upward; Anatone flows were at 20 kcfs, Dworshak inflows were ranging between 2-4 kcfs, and Orofino flows were in the range of 6.5-7 kcfs and receding. The COE’s model showed temperatures at Lower Granite potentially reaching 68º F (20º C) some time over the next week.
2
Mike Schneider, COE, gave a power point presentation linked to the TMT agenda on CEQUAL modeling for the lower Snake. In his presentation, Schneider noted that lower flows result in a longer travel time (5.5 days) and water warming of 1°C as it moves through the Lower Granite pool. He clarified that he used NOAA’s seven-day forecast, flows of 4.3 kcfs (unsteady state flow), and that temperatures are measured as water leaves the Lower Granite Dam. Schneider recommended continued updates on short-term forecasts and tracking average inflow temperatures to Lower Granite as triggers for management actions. In addition, Kyle Dittmer, CRITFC, gave a power point presentation linked to the TMT agenda that used EPA’s RBM10 modeling with updated observed conditions. Kyle noted that 2007 Dworshak temperature data were tracking well with data from 1970, ’73, ’78 and 1988. The Salmon Managers caucused and discussed a recommendation for Dworshak operations: continue outflows of 4.2-4.3 kcfs until Monday, 7/2, when the Salmon Managers will hold an 11 a.m. conference call to review updated temperature and flow forecasts. Paul Wagner said that the Salmon Managers anticipated a recommendation to shift to 7.5 kcfs on 7/2. Robyn MacKay, BPA, requested at least 1-2 days lead time to implement the operation. A suggestion was made to implement cooler water temperatures out of Dworshak as an interim operation, to allow BPA time to increase flows. Dave Wills responded that from the Hatchery perspective, temperatures below 44°F would not support the hatchery fish.
Action/Next Steps: • The COE will operate Dworshak flows in the range of 4.2-4.3 kcfs. • The Dworshak Board has appointed an ID representative and will hold a
conference call on Friday, 6/29 to discuss the plan for utilizing 200 kaf for flow augmentation. Greg Haller, Nez Perce Tribe, will be in touch with NOAA, BPA and the COE to schedule a meeting of the Board.
• The Salmon Managers will hold a conference call on Monday, 7/2 at 11 a.m. and will make a Dworshak recommendation to the Action Agencies immediately following the call.
• The COE will email TMT members to inform them of the Salmon Managers’ recommendation for Dworshak operations on 7/2. If there is a recommendation to increase outflows, BPA will do its best to implement the change by Tuesday morning.
• Sampling data used to determine the growth rates of Fall Chinook will be on the agenda as part of Dworshak operations discussions at the 7/11 TMT meeting.
Libby Operations Cindy Henriksen, COE, shared the RFC’s updated ESP forecasts and operation scenarios for Libby dam. The COE’s June final water supply forecast (6.95 MAF) and that of the June 26 RFC ESP (6.88 MAF) were fairly similar . The COE shared a ‘default’ operation scenario based on language from the 2004 BiOp, which has the project reaching elevation
3
2439’ by August 31 with flat flows ranging from 15.8-18.3 kcfs. ESP inflows showed 2453.5’ as the maximum elevation that could be reached by the end of August, which is about 5.5’ from full. Cindy noted that the project did not fill with any of the flat flow scenarios. Cindy referred to two ‘bookend’ scenarios, one with flat flows of 17 kcfs to reach elevation 2439’ by August 31, and the other, based on Montana’s SOR, showing 15 kcfs flat flows until July 21, then dropping flows to 12 kcfs through September. This modeled operation resulted in elevation 2450’ by the end of August and 2442’ by the end of September. Jim Litchfield, Montana, noted that Montana had proposed to revisit operations on July 21 with updated conditions, and given current forecasts, said Montana would not object to maintaining flat 15 kcfs outflows through August followed by a gradual ramp down in September. Montana remained concerned with increasing outflows too high (Jim suggested anything in excess of 16 kcfs might be too high) that could adversely impact Montana’s resident fish. Libby/Hungry Horse SOR 2007-07: Bob Heinith, CRITFC, presented SOR 2007-07 on behalf of CRITFC, ODFW, USFWS and the Nez Perce Tribe. (It was clarified that CRITFC signed on as representative of the four Lower Columbia River Tribes, and that Nez Perce signed on separately as an active participant in the discussions leading up to development of the SOR.) The specifics of the proposal were to use flat flows to get Libby and Hungry Horse pools to 20’ from full by August 31. Based on the COE’s forecasts, the proposal suggested implementing 17.4 kcfs out of Libby and 4.4 kcfs out of Hungry Horse as soon as possible to meet these objectives. The rationale behind the proposal was to support resident fish in Montana and to meet flow targets at McNary. The signatories to the SOR also supported pursuing non-treaty storage in order to provide additional relief for Montana’s resident fish. Bob clarified that this proposal did not recommend going above 17.4 kcfs if Libby did not reach 20’ from full by the end of August. It was further clarified that, if the operation were to be implemented by July 1, flat outflows at Libby would be around 17 kcfs. While there was no specific recommendation for September operations, during TMT they deferred to the COE and Montana to determine how to operate Libby and Hungry Horse in September. Regarding Libby operations – Folks discussed the two proposed Libby operations and were not able to reach consensus. Paul Wagner, NOAA, proposed a third option, which was to implement the 2006 operation by going to 17 kcfs now through July and ramping down to 15 kcfs (last year this occurred on July 26) through August 31. Idaho also offered support for all the proposed operations and suggested that the best compromise might be to implement the 2006 operation proposed by NOAA. Regarding Hungry Horse operations – John Roache, BOR, said the current STP/ESP modeling showed that implementing a flat flow between 4.4-4.8 kcfs would get the project to 20’ from full by the end of August. The BOR offered that either proposed operation was feasible to implement (4.4 kcfs flat or 4 kcfs flat through August), and that the BOR was willing to implement either operation. Given the latest forecast, NOAA
4
offered support for operating the project to 4 kcfs. USFWS offered potential support for operating Hungry Horse to 4 kcfs if the two projects could be discussed separately and a compromise could be reached on how to operate Libby. The CRITFC representative needed to check with policy representatives to determine whether this operation would be acceptable. Given the lack of consensus, several TMT members required policy decision on this issue. The issue was elevated to the IT for resolution. ACTION: The COE and the BOR planned to continue operating Libby and Hungry Horse per current operations – 14.8 kcfs outflows at Libby and 4.1 kcfs outflows at Hungry Horse – through Sunday, July 1. An IT conference call was convened on Friday, June 29 at 1:00 pm to discuss Libby and Hungry Horse operations for July 2 through September. UPDATE: Further discussions during the IT conference call resulted in the COE and BOR planning to implement the BiOp default operation, to reach 20’ from full by August 31 at both Libby and Hungry Horse dams. ACTION: Given up to date forecasts (as of the IT call), the COE planned to operate Libby at 17.3 kcfs outflows starting Monday morning, July 2, and the BOR planned to operate Hungry Horse at 4.4 kcfs outflows starting Monday morning, July 2. Montana objected to this operation and requested the issue be elevated to the Regional Executives level for decision as soon as possible. NOAA offered to begin coordinating this call for next week. Summer Transport at McNary Bernard Klatte, COE, reported that the passage conditions at McNary were no longer ‘spring-like’ indicating transportation operations should begin. On behalf of the salmon managers, NOAA proposed that a decision to implement transportation at McNary be delayed until information was gathered from the NMFS Science Center on a 2002 study of transported fish at McNary, to inform the best operation given this year’s spill operation conditions. The salmon managers planned to have a call on Friday, 6/29, to review the information. The COE did not object, and agreed to a check in on Friday. The COE also noted frustration with the delay in receiving the 2001-’02 data and shared that altering the planned transport operation would affect arrangements with the COE contractor. NOAA and the COE suggested that this item be added to the IT agenda. Action/Next Steps: Salmon Managers will share transport information with the COE as soon as they receive it. The issue will be revisited during the FPAC call Friday morning and at IT during their 1:00 pm call. UPDATE: The salmon managers needed more time to look at the study information and continue technical discussions about transportation at McNary. NOAA proposed delaying start of transportation operations until a follow-up discussion could occur at TMT as soon as July 5. No objection was raised. 2007 Summer Treaty Fishing
5
Kyle Dittmer, CRITFC, referred TMT to an SOR linked to the TMT agenda, requesting 1' hard constraints for the pools at John Day, Bonneville and The Dalles. A gillnet fishing document was also linked to the TMT agenda. Dittmer noted that the Bonneville pool dropped to nearly 72.5’ over the past weekend, causing problems for platform fishers. The COE clarified that the drop did not occur during the requested Treaty fishing period and was necessary for clearing debris for human safety and said that, as in the past, the COE would do its best to hold the Bonneville pool in a 1-½ foot range during the Treaty fishing period.
Action/Next Steps: This item will be on the agenda for the 7/11 TMT meeting. Operations Review Reservoirs –Cindy Henriksen and John Roache reported on reservoirs. Grand Coulee was at elevation 1284.3' and targeting refill after 7/4. Hungry Horse was at elevation 3559.7' with outflows of 4.1 kcfs. Spring season averages were 62 kcfs at Lower Granite, 172 kcfs at Priest Rapids, and 246 kcfs at McNary. Fish – Paul Wagner, NOAA, reported on juvenile and adult fish. Updated passage numbers on the Fish Passage Center website showed McNary numbers increasing due to hatchery releases. Steelhead counts were continuing a downward trend and Wagner noted that Little Goose was the most abundant passage location, with gas bubble trauma levels down to 2.9% at the project. Wagner added that jack counts continued to be strong. Power system – Robyn MacKay, BPA, reported ‘non-spring-like’ conditions on the Snake River and said that there would be a shift to minimum generation at the 4 projects on the Lower Snake. Water quality – Jim Adams, COE, had no exceedances to report.
Next face-to-face TMT meeting: Wednesday, July 11th Agenda items will include: • Review/Finalize Facilitator’s Notes and Meeting Minutes • Updated Flow Forecasts • Dworshak Operations • Libby Operations • Summer 2007 Treaty Fishing • Operations Review
Columbia River Regional Forum Technical Management Team Meeting
June 27, 2007 1. Welcome and Introductions Today’s TMT meeting was chaired by Cindy Henriksen and facilitated by Robin Harkless, with representatives from BOR, USFWS, COE, BPA, Montana,
6
NOAA, CRITFC, Idaho, the Nez Perce Tribe and FPC attending. The following is a summary (not a verbatim transcript) of the topics discussed and decisions made at the meeting. Anyone with questions or comments about these notes should provide them to the TMT chair or bring them to the next meeting. 2. Review Facilitator’s Notes and Meeting Minutes
A change has already been made to page 3 of the facilitator’s notes for the June 20 meeting, Bernard Klatte (COE) said. The change involved clarifying actions to be taken regarding spill at Bonneville and McNary. The official minutes from that meeting will be posted within the next day or so. 3. Updated Flow Forecasts
Last week the COE’s forecast of Libby water supply for April-August was 7.1 maf, Cindy Henriksen said. That inflow forecast has been revised down to 6.8 maf, which is commensurate with the National Weather Service’s ESP water supply forecast for the same period.
The Libby ESP hydrograph shows that inflows are in recession. Not much
flexibility can be expected at Libby in July and August. Dworshak hydrographs demonstrate a general recession in July and August with some historic rainfall. The outlook for Hungry Horse is very similar. A historic rain even could cause some rises in inflows, but not in excess of powerhouse capacity.
Lower Granite flows are showing recession for the remainder of June. An
increase in early July outflows was based on modeling assumptions that outflows would increase July 5 to provide flow augmentation to Dworshak. The water supply forecasts show that flows at Lower Granite this year will be 69% of average. 4. Dworshak Operations
Dworshak continues to be full, operating within the top ½ foot and releasing outflows of about 43 kcfs, Henriksen said. Inflows are receding rapidly.
Jim Adams showed TMT a graph of tailwater temperatures at the four
lower Snake projects. Temperatures at Lower Granite have taken a strong upturn in response to a hot spell several days ago, then tapered off. As of June 26, the water temperature at Lower Granite was around 65 degrees F and trending upward.
Inflow temperatures are generally on the rise, with a small dip at the
Anatone and Orofino gages reflecting cooler weather in the past 3 to 4 days, Adams said. Inflows passing the Anatone gage are around 20 kcfs; Dworshak outflows are 2 to 4 kcfs; Orofino flow is 6.5 to 7 kcfs and receding. Dworshak
7
temperature data indicate there’s plenty of cool water available for flow augmentation during temperature control operations, Adams said. Dworshak is presently in overshot mode with the top of the gate at elevation 1,465 feet.
Mike Schneider gave a presentation on CEQUAL modeling of Dworshak
temperatures, which assumes Dworshak is at full pool and passing inflows through the July 4 weekend. Currently, releases from Lower Granite are 18.5 degrees C, while temperatures in the forebay range from 16 to 19.5 degrees C. There’s a tendency for warmer temperatures to arrive earlier each year, looking at the last 10 years of data. Because flows are so low this year, travel time through the reservoirs is about 5 ½ days. Schneider emphasized the importance of looking upstream at thermal loadings and making informed decisions before temperatures exceed 20 degrees C.
On the other hand, lower flows will help maintain cooler temperatures due
to the larger proportion of cold water from Dworshak in the water supply. The model simulation predicted that temperatures would level off in several days, then begin to increase slowly over the 4th of July weekend, approaching 20 degrees C on July 5.
These model runs will continue to be updated based on short term
weather forecasts, Schneider said. The COE will continue to track inflow temperatures as a way to identify when the water temperature is in the cautionary zone of 18.5 degrees C, or 65 degrees F, which implies warmer temperatures will be arriving soon downriver. Based on this model and forecast, with Dworshak outflows between 2 and 4 kcfs, the lower Snake will stay under the 68 degree criteria until July 5 or 6, Adams said. Dworshak reservoir is currently at 18 degrees C.
Kyle Dittmer presented the updated results of RBM-10 modeling from 4
surrogate years to predict flows this year on the lower Snake. The approach appears to be tracking well, in fact, the best of all years this effort has been made. According to the modeling, Dworshak will soon be passing inflows, with temperatures approaching 20 degrees C. It looks like things will start heating up next week.
The Salmon Managers who were available caucused to discuss next
steps in light of the new information. Idaho, Nez Perce, USFWS, Montana, CRITFC and NOAA representatives participated in the decision to recommend an increase to 4.4 kcfs outflows as soon as possible, using the big unit or two small units. The Salmon Managers foresaw a possibility of requesting an increase to 7.5 kcfs outflows using the big and small unit after Monday, July 2, when there’s an FPAC conference call at 11 a.m.
Robyn MacKay (BPA) requested lead time on any requests for flow
increases so BPA will be able to market the megawatts effectively. Jim Adams
8
(COE) suggested the Salmon Managers consider that any action they take on Monday include first lowering temperature outflows from 45 degrees F to 42 or 43 degrees F for two days, which would allow BPA adequate lead time to deal with the increased generation.
Sooner would be better, Wagner said. We think there’s more than a 50%
chance we’ll need to start increasing cooler outflows on Monday to avoid exceeding the temperature criteria for listed fish, Kiefer said. Henriksen asked, are you thinking of asking for an increase on Monday? The Salmon Managers haven’t reached consensus on that, Greg Haller said. Henriksen said she would arrange for communication to happen between COE and BPA over the weekend if any criteria are met that would trigger a request for a sudden increase in flows. If the Salmon Managers ask for an increase on Monday, BPA will make its best efforts to increase flows and generation on Tuesday morning, MacKay said. 5. Libby Operations
Cindy Henriksen (COE) presented background information on Libby: ESP volumes, the inflow forecast, and “bookend” scenarios. The early bird forecast was 7.5 maf for April-August; the River Forecast Center’s water supply forecast for the same period is 6.8 maf, which is very similar to the COE’s forecast. Modeling of ESP forecasting inflows shows that if outflows are increased on July 1 with steady outflows to meet elevation 2,439 feet by end August, outflows would have to be 15.8 to 18.3 kcfs. Modeling based on 44 historic weather years showed that generally the average Libby maximum elevation was 2,453.5 feet, or 5 ½ feet from full with flat outflows that reach 2439 feet the end of August. None of the 44 water years would have reached full pool elevation of 2,459 feet at end August with a flat outflow operation.
The first “bookend” scenario for Libby attached to today’s agenda shows
flat outflows beginning July 1 through Aug. 31, reaching elevation 2439 feet at end August. The other bookend, the Montana proposal, shows that if 14.8 kcfs outflows were continued through July 21, then reduced to 12 kcfs for the remainder of July and August into September, the reservoir would fill to elevation 2,435 feet or about 4 feet from full, then draft to elevation 2,450 feet by end August and elevation 2,442 feet by Sept. 30. Montana would like to see steady 15 kcfs outflows through July and August with a gradual ramp down in September, based on the latest information available, Litchfield said.
6. Libby and Hungry Horse Operations: Montana Proposal (SOR 2007-MT-1) and Alternate Proposal (SOR 2007-07)
TMT considered two SORs, the Montana proposal that Jim Litchfield had previously presented to TMT in draft form, now finalized, and a new proposal jointly signed by CRITFC, ODFW, the Nez Perce Tribe and USFWS.
9
At an FPAC meeting yesterday, the signatories to SOR #2007-7 felt it was important to get the full 20 feet of flows out of Libby and Hungry Horse this year, Bob Heineth (CRITFC) reported. So they created SOR #2007-7 in response to the Montana proposal (see above “bookend” scenarios). Because it appears there will be no additional water supply available from non-treaty storage in Canada this year, the signatories have requested outflows be increased to 17 kcfs at Libby in order to get the full 20 feet out by end August. Under this SOR, any additional water from Canada or another source would be retained in Libby reservoir for Montana’s benefit. The tradeoff is, if operations at 17 to 17.4 kcfs outflows end up not drafting the full 20 feet out of the reservoir, outflows would nevertheless remain at 17 to 17.4 kcfs in response to Montana’s request for guaranteed flat flows through summer.
Cindy Henriksen explained that the STP run used in the calculations
showed that steady outflows starting July 1 would be 17 kcfs, and steady outflows starting July 5 would be 17.4 kcfs, in order to reach target elevation by end August. The preference would be for starting the higher outflows sooner rather than later, Heineth said.
Litchfield questioned the pursuit of reservoir elevation targets established
in the mid-90s in light of the Council’s recent recommendations. He noted that there’s only 2 kcfs difference in the preferred July and August operations. However, SOR 2007-7 apparently makes no provisions for September flows that are critical to resident fish in Montana. Therefore, Montana can’t agree to SOR 2007-7.
Henriksen asked what the signatories of SOR-2007 envisioned for
September. Ramp down provisions for September were not included because the signatories assumed those details would be worked out between the COE and Montana, Statler said.
The conversation turned to the likelihood of actually getting the 7.5 maf
predicted in the early bird forecast of water supplies this summer. The RFC has acknowledged that early bird forecasts are made with only preliminary sets of data, Henriksen said. BPA could explore the possibility of a July for August water swap with Canada if that would be helpful, MacKay said. That would not be additional water, but the same amount of water shifted in time. Other than such a swap, Canadian water is not going to be an option this year.
Paul Wagner suggested following last year’s operations as a compromise
between the two SORs. Last year’s outflows were 17 kcfs until Aug. 1, then 15 kcfs for most of August. The decision becomes a policy call when it comes to small differences like 2 kcfs in outflows, Wagner said, because the impacts of such a small difference on life stage effects of listed fish are extremely difficult to measure.
10
Henriksen asked for feedback from other TMT members. Idaho would be comfortable with either operation described in the SORs, Russ Kiefer said. BOR estimates that flat flows of 4.4 to 4.8 kcfs would draft 20 feed out of Hungry Horse by the end of August, John Roache said. He noted that the difference between those levels and the 4 kcfs in the Montana proposal is minimal. Flat flows of 4 kcfs through the end of September would put Hungry Horse at elevation 3,535 feet by end September; flat flows of 4.4 kcfs from July 1 through Sept. 30 would put the reservoir at elevation 3,531 feet by end September, an elevation difference of 4 feet.
USFWS could accept the Hungry Horse provisions in the Montana
proposal if compromise can be reached on Libby operations, David Wills said. However, the other signatories to SOR 2007-7 were not comfortable with that. COE and BOR representatives both said they could not move to a new operation at either dam until a clear consensus was achieved. There was general agreement that deciding among the three proposed levels of operations is a matter of policy, so TMT referred this decision to an IT conference call at 1 p.m. on Friday, June 29.
7. Start Summer Transport
In operating documents the COE submitted to the court, it states that transportation will begin when conditions are no longer spring like, meaning flows are less than 220 cfs and temperatures are around 62 degrees F, Bernard Klatte (COE) said. These conditions have been meet, so transportation should begin. With regard to the effects of transport on ESA-listed and non listed juvenile fall Chinook, the 2004 BiOp says that “activities will be adaptively managed with consideration to in season migration and research results,” Wagner said. The latest available data on this are ocean returns since 2002, when 454 adults returned, their mode of travel unknown. Wagner has asked the Science Center for the latest data by Friday, which FPAC wishes to review before making any recommendations regarding transportation this year. TMT added this item to the agenda for the IT conference call at 1 p.m. Friday. 8. Operation of the Lower Columbia Pools for the Summer 2007 Treaty Fishery (SOR 2007-C2)
Platform fishers at Bonneville pool have had trouble placing their nets because water levels are so low, Kyle Dittmer (CRITFC) said. It appears that pool elevations dropped to about 72.5 feet at Bonneville over the weekend of June 23 -24, which was lower than the tribes were expecting. Henriksen explained that debris had built up near a sailboarding area, so the COE lowered water levels so the area could be cleared for recreation and human safety.
For the next week, the tribes are requesting that the three lower pools
operate within a 1-foot band as a hard system constraint, according to the latest
11
SOR submitted on June 24, Dittmer said. The COE recognizes the need for a steady pool for the tribal fishery, Henriksen said. Bonneville pool is operating between elevation 75 and 76.5 feet as a hard system constraint. The Dalles typically operates within a 43-foot range, and John Day already has a 1.5-foot limit ranging from elevation 262.5 to 264 feet. Dittmer asked whether these specifications are based on the COE’s interpretation of the 1998 Ted Strong agreement; Henriksen said yes. 9. Operations Review
A. Reservoirs. Grand Coulee is at elevation 1,284.3 feet with a goal of refilling after July
4, Roache said. Hungry Horse is at elevation 3,559 feet, releasing 4.1 kcfs. Lower Granite seasonal average flows were 62 kcfs during the spring season; the flow objective was 85 kcfs, Henriksen said. Priest Rapids flows were 172 kcfs from April 10 to June 30. McNary flows have been about 246 kcfs with a spring flow objective of 247 kcfs.
B. Fish. The yearling Chinook migration is basically over, Wagner said. The
subyearling Chinook migration is still underway, but passage indices are low, and collection with spill appears fairly low. The current numbers are far below anything seen previously on the Snake. Migration is going strong at McNary, which reflects large numbers of Hanford hatchery fish passing.
Steelhead passage is trending downward, with Little Goose as the most
abundant location. Jack Chinook returns continue to be strong at about 1,000 fish per day.
Tony Norris asked whether problems with GBT had abated. The latest
data found only 3% incidence, so the wave of GBT trauma has passed, Wagner said.
C. Power. Flows are dropping rapidly on the Snake, and BPA will be going into low-flow operation, which means there will be times when the projects there must operate to minimum generation requirements, Robyn MacKay (BPA) said. In terms of the 2007 operations agreement, that means we’re moving earlier this year than last year into using one unit for generation on the four lower Snake projects and spilling the rest, Henriksen said.
D. Water Quality. This is a low flow period with not much spill, and there
have been no exceedances, Henriksen said. 13. Next TMT Meeting
12
The next regularly scheduled TMT meeting will be on Wednesday, July 11 and will include a final report on the Priest Rapids operation. In the meantime, there will be conference calls on July 5 and 9 regarding Libby/Hungry Horse operations and transportation. This meeting summary was prepared by consultant and writer Pat Vivian. Name Affiliation Cindy Henriksen COE John Roache BOR David Wills USFWS Jim Adams COE Robyn MacKay BPA Jim Litchfield Montana Paul Wagner NOAA Kyle Dittmer CRITFC Dan Spear BPA Tony Norris BPA Jennifer Miller Susquehanna Tim Heizenrader Cascade Bernard Klatte COE Rudd Turner COE Russ George WMC Don Faulkner COE Phone: Scott Bettin BPA Russ Kiefer Idaho Dave Statler Nez Perce Tribe Barry Espensen CBB Mark Bagdovitz USFWS Margaret Filardo FPC Glen Trager Avista Ruth Burris PGE Tina Lundell COE Mike Busko Powerex Steve Jewell COE Walla Walla Greg Hoffman COE Bruce McKary Consultant John XX Constellation Energy