Page 1
1
To appear in S. Luck & E. Kappenman (Eds.), Oxford Handbook of Event-related PotentialComponents. New York, Oxford University Press.
What ERPs can tell us about Visual Working Memory
Veronica B. Perez & Edward K. Vogel
University of Oregon
Eugene, Oregon, USA
Page 2
2
What is Working Memory?
Our ability to perform a broad range of everyday cognitive tasks is thought to depend
heavily upon the operation of the Working Memory system, which allows us to temporarily store
information “in mind” so that it may be manipulated or acted upon (e.g., Baddeley & Hitch,
1974; Cowan, 2001). Many cognitive processes that require information to be held in an “online”
state are thought to utilize this memory system as a form of “mental workspace” to perform their
requisite operations. A fundamental characteristic of working memory is that it is severely
limited in its capacity to maintain information. In the visual working memory (VWM) domain,
this capacity limit is thought to be approximately 3-4 objects simultaneously (Cowan, 2001;
Luck & Vogel, 1997; Sperling, 1960; Vogel, Woodman, & Luck, 2001). Although, this capacity
estimate actually varies substantially across individuals, ranging from as low as 1.5 objects up to
about 6 objects (Vogel & Awh, in press; Vogel & Machizawa, 2004). This inter-subject
variability in memory capacity appears to reflect an important and stable cognitive trait of the
individual because it is strongly predictive of his or her performance on a host of high level
aptitude measures. Individuals with high memory capacity tend to perform better on measures of
fluid intelligence, abstract reasoning, reading comprehension, and tend to have higher grade
point averages in school than individuals with low memory capacity (Cowan, Fristoe, Elliott,
Brunner, & Saults, 2006; Daneman & Carpenter, 1980; Engle, Kane, & Tuholski, 1999; Kane,
2001; Kyllonen & Christal, 1990). Moreover, given the centrality of this memory system, it is
not surprising that disruptions in working memory are often associated with pathological
cognitive states, such as attention disorders, dementia, psychosis, and depression (Gold, Wilk,
Page 3
3
McMahon, & Luck, 2003; Goldman-Rakic, 1999; Morris & Baddeley, 1988; Rinck & Becker,
2005; Sonuga-Barke, Dalen, Daley, & Remington, 2002).
Measuring Visual Working Memory
Over the years, researchers have developed a variety of tasks to measure working
memory function. Many of these tasks are variations of the match-to-sample task, in which the
subject is initially shown a sample item and must later decide whether a later item matched the
original sample. One such task that we have used over the years to measure VWM capacity is the
change detection task (Phillips, 1974). In this task, subjects are briefly shown an array of objects
(e.g., colored squares) that they must attempt to remember. These objects disappear for about a
second, after which they reappear and are either all identical to the original objects, or one of the
objects was different. The subject’s task is to report with a button press whether the items were
the same or different. The real beauty of this task is that it is extremely flexible and simple
manipulations of the task can be used to test a bevy of cognitive questions related to VWM and
other related systems. For example, by varying the number of items in the memory array one can
measure VWM storage capacity (it’s about 4 items; Luck & Vogel, 1997); by varying the type of
objects that need to be remembered, one can measure how information is represented in VWM
(Alvarez & Cavanagh, 2004; Luck & Vogel, 1997); by varying the magnitude of the changed
item, one can measure the resolution of the information that is held in VWM (Awh, Barton, &
Vogel, 2007). Thus, because of the elegance and flexibility of this task, change detection has
become a staple measure of VWM.
Neurophysiological Measures of Visual Working Memory
Page 4
4
One important neural signature of VWM from single-unit studies in monkeys is referred
to as delay activity, which is the increased and sustained firing rate of a neuron during the
memory delay of a match-to-sample task (Fuster, 1973; Fuster & Alexander, 1971; Kubota &
Niki, 1971). This delay activity appears to be necessary for accurate working memory
performance because it is often reduced or absent on trials in which the incorrect response is
made (Funahashi, Bruce, & Goldman-Rakic, 1989; Sakai, Rowe, & Passingham, 2002).
Although many cortical regions have cells that show delay activity, there are three primary areas
that have a large proportion of cells that show this property: the inferotemporal cortex, which
often shows delay activity that is sensitive to the identity of the remembered stimulus (Chelazzi,
Duncan, Miller, & Desimone, 1998; Miller, Li, & Desimone, 1993); the lateral intra-parietal
(LIP) cortex, which often shows location-specific delay activity (Chafee & Goldman-Rakic,
1998; Colby & Goldberg, 1999); and the prefrontal cortex, which often shows delay activity that
is sensitive to the rules of the current task (Miller & Cohen, 2001; Wallis & Miller, 2003). The
fact that the delay activity from a given area is often differentially sensitive to the attributes of
the remembered material indicates that this activity is contributing to the specific representations
held in memory rather than being the result of task-general processes such as task difficulty or
fluctuations within the individual such as arousal or expectation.
Functional magnetic resonance imaging (FMRI) in humans has also been used to observe
delay activity during working memory tasks, and the same three cortical areas appear to play
substantial roles during online maintenance. Moreover, the sustained BOLD responses in the
inferior temporal cortex have been shown to be sensitive to the identity of the stimuli in memory
(Druzgal & D'Esposito, 2001). Location-specific activity in the posterior parietal cortex has been
shown to code for memory-driven maps of remembered locations (Sereno, Pitzalis, & Martinez,
Page 5
5
2001). Additionally, Pessoa et al. (2002) demonstrated that sustained BOLD activity in fronto-
parietal regions during a delayed response task was necessary for successful performance on a
working memory task. In sum, this evidence demonstrates the crucial involvement of delay
activity during the retention interval of VWM tasks.
Event-Related Potential Studies of Working Memory
Like single-unit recordings and FMRI, studies using event-related potentials (ERPs) have
also provided useful measures of delay activity in VWM tasks. Importantly, the high temporal
resolution of ERPs allows for the isolation of activity during the retention period of memory
tasks, and can provide information about the timing of brain processes recruited in working
memory. One ERP component that has been observed across many studies of working memory
is the Negative Slow Wave (NSW), which is a broadly distributed sustained negative wave that
persists during the memory retention period of a VWM task (Ruchkin, Johnson, Canoune, &
Ritter, 1990). In at least one study, the amplitude of this component has been shown to increase
as the memory load increased from one to two faces (Ruchkin, Johnson, Grafman, Canoune, &
Ritter, 1992). Moreover, the scalp topography of the component has been shown to be different
depending upon the type of information that is being held in VWM; with a more posterior
distribution for spatial memory tasks and a more frontal distribution for object memory tasks
(Mecklinger & Muller, 1996). Further, Rosler et al. (1997) found that in trials where a larger
NSW amplitude was observed during the retention period, there was a stronger probability of
successfully remembering the information at test, which suggests that this activity is important
for performance on the task.
Page 6
6
Although it seems quite plausible that the NSW reflects the operation of VWM
maintenance processes, a significant challenge for the validation of any neurophysiological
measure of a cognitive process is to demonstrate that it is specific to that particular process. That
is, performing any complex task enlists the engagement of a wide variety of processes, some of
which are specifically relevant to memory (e.g., VWM maintenance), some only partially
relevant to memory (e.g., perceptual processing of stimuli), and some are task-general non-
mnemonic processes such as arousal, effort, or the preparation of an upcoming response.
Consequently, it is critical for any valid ERP measure of VWM maintenance to demonstrate that
it is specifically related to VWM maintenance and not also to this set of non-mnemonic
processes that are active during any task.
One useful approach to controlling for these types of task-general activity is referred to as
the Contralateral Control method (Gratton, 1998). Essentially, the idea here is to exploit the fact
that visual system is primarily organized in a contralateral fashion. In these task designs, the
subject fixates centrally and is presented with a bilateral display with equal amounts of stimuli in
each hemifield. The subject is asked to remember or attend or make a decision about the stimuli
in only one of these hemifields, and the activity of the process of interest can be isolated by
examining the contralaterally-specific activity with respect to the attended side of the display.
The logic here is that most of the task-general activity (e.g., perceptual response, arousal,
response preparation) will be equivalent for each hemisphere, and that the primary differences
between the hemispheres will be the result of the process of interest. Klaver et al. (1999) used
this approach in a VWM task by presenting a bilateral array of two polygons (one in each
hemifield), and cued subjects to remember one or both items. Beginning at about 250ms after the
onset of the memory array, they observed a sustained negative wave at posterior electrodes that
Page 7
7
were contralateral to the attended hemifield. This memory item-specific activity was isolated by
subtracting the ipsilateral activity (which contained mostly task general processes) from the
contralateral activity. Thus, because the activity was contralaterally-specific to the remembered
information, this sustained component appears to be a good candidate for a highly-specific
measure of VWM maintenance.
Contralateral Delay Activity (CDA)
Using a similar contralateral control approach, we presented subjects with a bilateral
display of colored squares and asked them to remember the items in a single hemifield over a 1
second retention interval (Vogel & Machizawa, 2004). After this interval, subjects were
presented a test array that was either identical to the original array or one color had changed, and
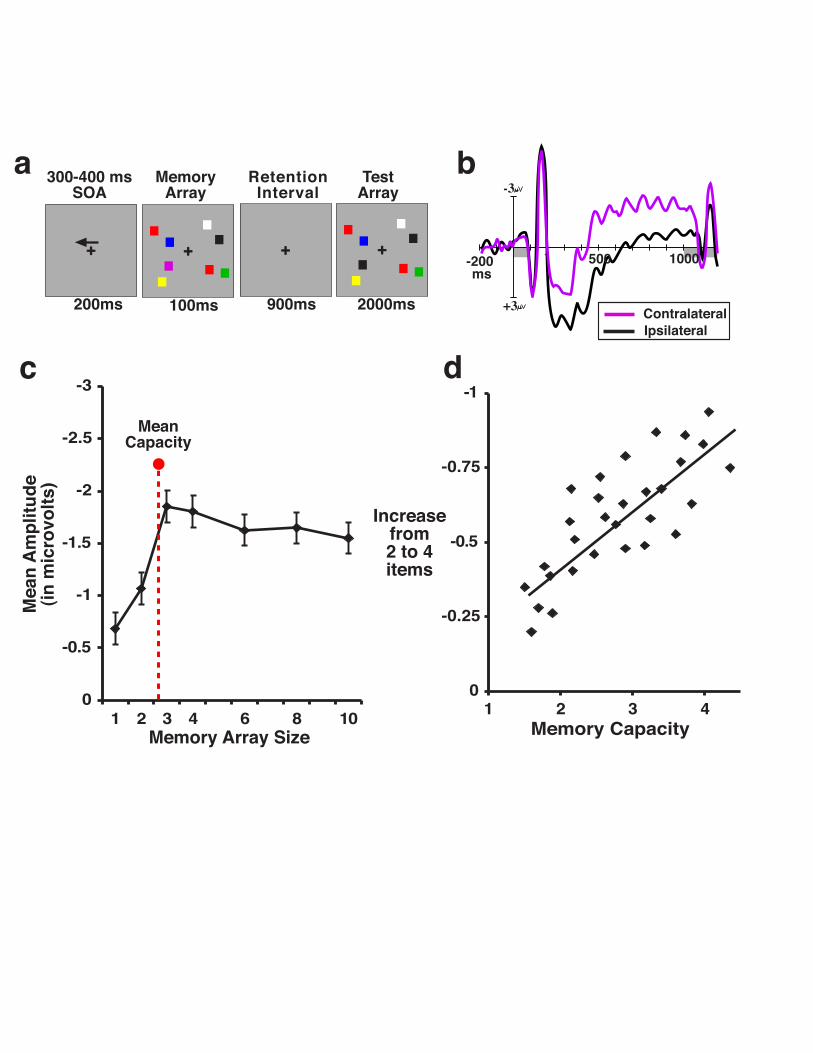
subjects reported whether the two arrays were the same or different (see Fig 13.1). Similar to
Klaver et al (1999), we observed a large, sustained negative wave at posterior electrodes that
were contralateral with respect to the side of the display that the subject was asked to remember
on a given trial. This contralateral activity began approximately 275 ms following the onset of
the memory array and persisted throughout the retention period until the test array appeared.
Importantly, we found that the amplitude of this activity was significantly reduced when subjects
performed the task incorrectly, which suggests that the wave reflects a process that is necessary
for correct VWM performance. We refer to this wave as the contralateral delay activity (CDA),
because of its apparent similarity to delay activity observed in monkey single-unit studies using
delayed match-to-sample tasks.
Page 8
8
CDA amplitude: memory load or other task factors?
The most exciting attribute of this component is that we found it to be acutely sensitive to
the number of items that the subject was remembering on a particular trial. Specifically, CDA
amplitude was smallest for memory loads of one item, and rose monotonically as the memory
load increased to two, three, and four items (see Figure 13.1). The fact that this component is
sensitive to the present memory load suggests that it is a good candidate for an ERP-based
measure of VWM, and could possibly be used as an online measure of how much information is
currently “in mind”. However, because several cognitive mechanisms in addition to VWM
maintenance are likely involved in a task such as change detection, we see at least two potential
alternative accounts of this amplitude increase. The first alternative is that as the number of
memory items increases, the spatial scope of the memory array necessarily increases. Thus, the
increase in amplitude may actually be the result of a broader spotlight of attention for larger
arrays. We tested this in a later study by manipulating the spatial distance (close vs far) between
the memory items and found that while CDA amplitude was not modulated by the distance
between the items, it was again strongly modulated by the number of memory items
(McCollough, Machizawa, & Vogel, 2007).
A second alternative for the CDA amplitude increase is that as the memory load
increases, the task becomes more difficult, and it is this general increase in effort or arousal that
is actually modulating the amplitude of the component. To test this, we also examined memory
arrays that exceeded the known limits of VWM capacity (i.e., arrays of 6, 8, or 10 items; Vogel
& Machizawa, 2004; McCollough et al, 2007). Our logic was that if the CDA was sensitive to
the number of items that can be held in VWM, it should be constrained by the capacity limits of
this system and reach a limit at approximately 4 items. Alternatively, if CDA amplitude was
Page 9
9
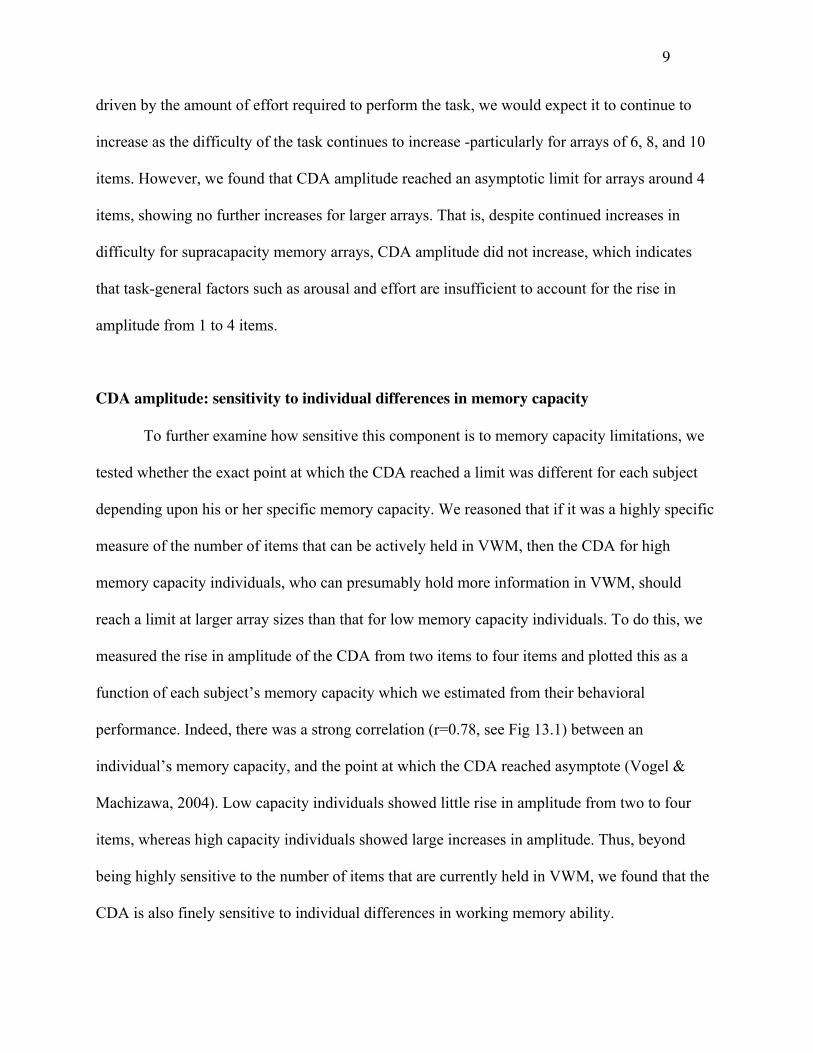
driven by the amount of effort required to perform the task, we would expect it to continue to
increase as the difficulty of the task continues to increase -particularly for arrays of 6, 8, and 10
items. However, we found that CDA amplitude reached an asymptotic limit for arrays around 4
items, showing no further increases for larger arrays. That is, despite continued increases in
difficulty for supracapacity memory arrays, CDA amplitude did not increase, which indicates
that task-general factors such as arousal and effort are insufficient to account for the rise in
amplitude from 1 to 4 items.
CDA amplitude: sensitivity to individual differences in memory capacity
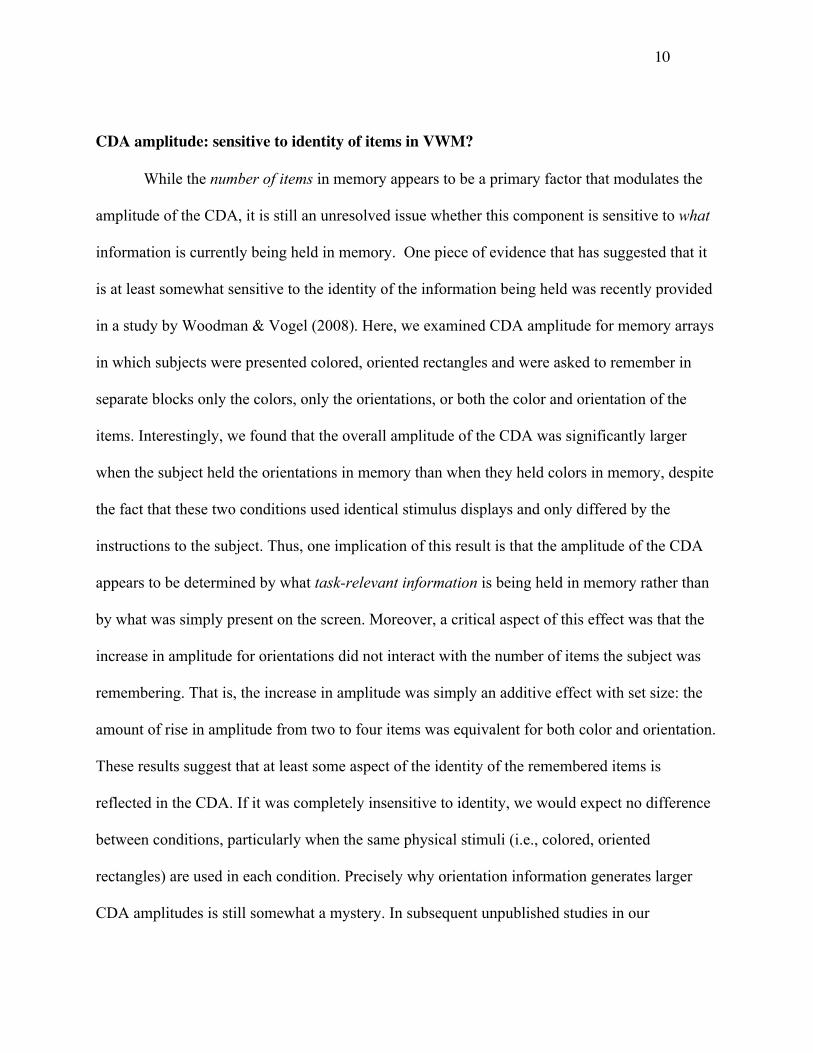
To further examine how sensitive this component is to memory capacity limitations, we
tested whether the exact point at which the CDA reached a limit was different for each subject
depending upon his or her specific memory capacity. We reasoned that if it was a highly specific
measure of the number of items that can be actively held in VWM, then the CDA for high
memory capacity individuals, who can presumably hold more information in VWM, should
reach a limit at larger array sizes than that for low memory capacity individuals. To do this, we
measured the rise in amplitude of the CDA from two items to four items and plotted this as a
function of each subject’s memory capacity which we estimated from their behavioral
performance. Indeed, there was a strong correlation (r=0.78, see Fig 13.1) between an
individual’s memory capacity, and the point at which the CDA reached asymptote (Vogel &
Machizawa, 2004). Low capacity individuals showed little rise in amplitude from two to four
items, whereas high capacity individuals showed large increases in amplitude. Thus, beyond
being highly sensitive to the number of items that are currently held in VWM, we found that the
CDA is also finely sensitive to individual differences in working memory ability.
Page 10
10
CDA amplitude: sensitive to identity of items in VWM?
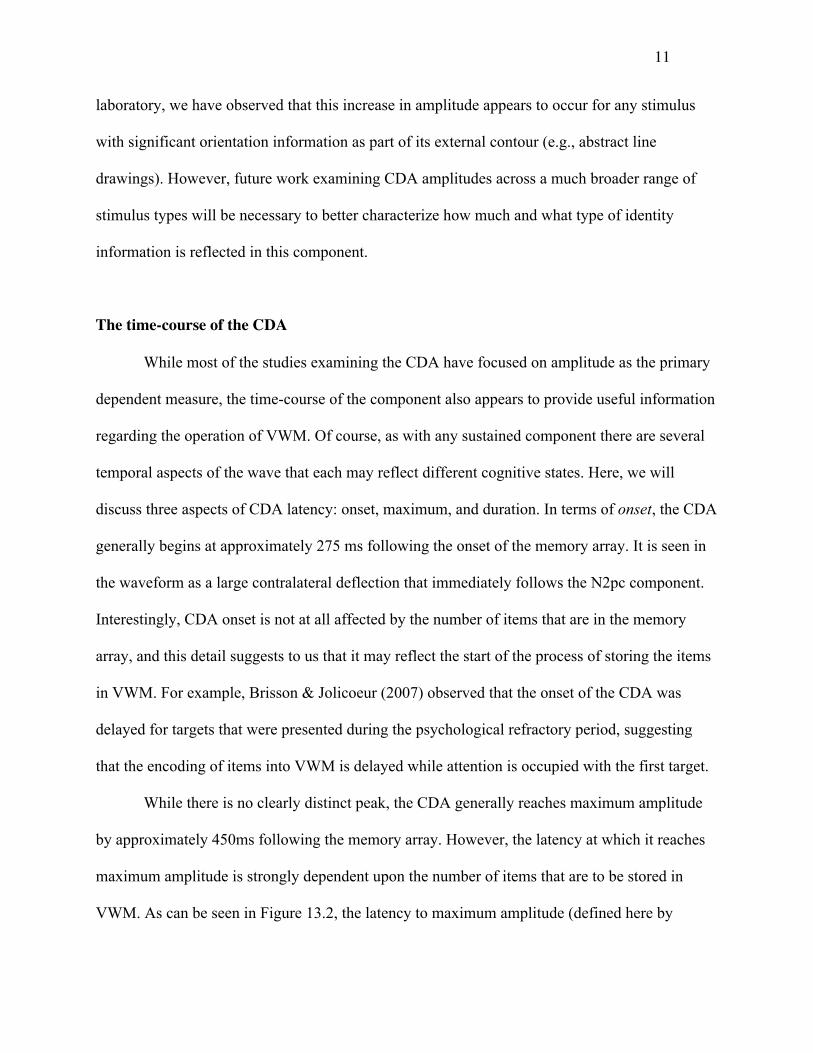
While the number of items in memory appears to be a primary factor that modulates the
amplitude of the CDA, it is still an unresolved issue whether this component is sensitive to what
information is currently being held in memory. One piece of evidence that has suggested that it
is at least somewhat sensitive to the identity of the information being held was recently provided
in a study by Woodman & Vogel (2008). Here, we examined CDA amplitude for memory arrays
in which subjects were presented colored, oriented rectangles and were asked to remember in
separate blocks only the colors, only the orientations, or both the color and orientation of the
items. Interestingly, we found that the overall amplitude of the CDA was significantly larger
when the subject held the orientations in memory than when they held colors in memory, despite
the fact that these two conditions used identical stimulus displays and only differed by the
instructions to the subject. Thus, one implication of this result is that the amplitude of the CDA
appears to be determined by what task-relevant information is being held in memory rather than
by what was simply present on the screen. Moreover, a critical aspect of this effect was that the
increase in amplitude for orientations did not interact with the number of items the subject was
remembering. That is, the increase in amplitude was simply an additive effect with set size: the
amount of rise in amplitude from two to four items was equivalent for both color and orientation.
These results suggest that at least some aspect of the identity of the remembered items is
reflected in the CDA. If it was completely insensitive to identity, we would expect no difference
between conditions, particularly when the same physical stimuli (i.e., colored, oriented
rectangles) are used in each condition. Precisely why orientation information generates larger
CDA amplitudes is still somewhat a mystery. In subsequent unpublished studies in our
Page 11
11
laboratory, we have observed that this increase in amplitude appears to occur for any stimulus
with significant orientation information as part of its external contour (e.g., abstract line
drawings). However, future work examining CDA amplitudes across a much broader range of
stimulus types will be necessary to better characterize how much and what type of identity
information is reflected in this component.
The time-course of the CDA
While most of the studies examining the CDA have focused on amplitude as the primary
dependent measure, the time-course of the component also appears to provide useful information
regarding the operation of VWM. Of course, as with any sustained component there are several
temporal aspects of the wave that each may reflect different cognitive states. Here, we will
discuss three aspects of CDA latency: onset, maximum, and duration. In terms of onset, the CDA
generally begins at approximately 275 ms following the onset of the memory array. It is seen in
the waveform as a large contralateral deflection that immediately follows the N2pc component.
Interestingly, CDA onset is not at all affected by the number of items that are in the memory
array, and this detail suggests to us that it may reflect the start of the process of storing the items
in VWM. For example, Brisson & Jolicoeur (2007) observed that the onset of the CDA was
delayed for targets that were presented during the psychological refractory period, suggesting
that the encoding of items into VWM is delayed while attention is occupied with the first target.
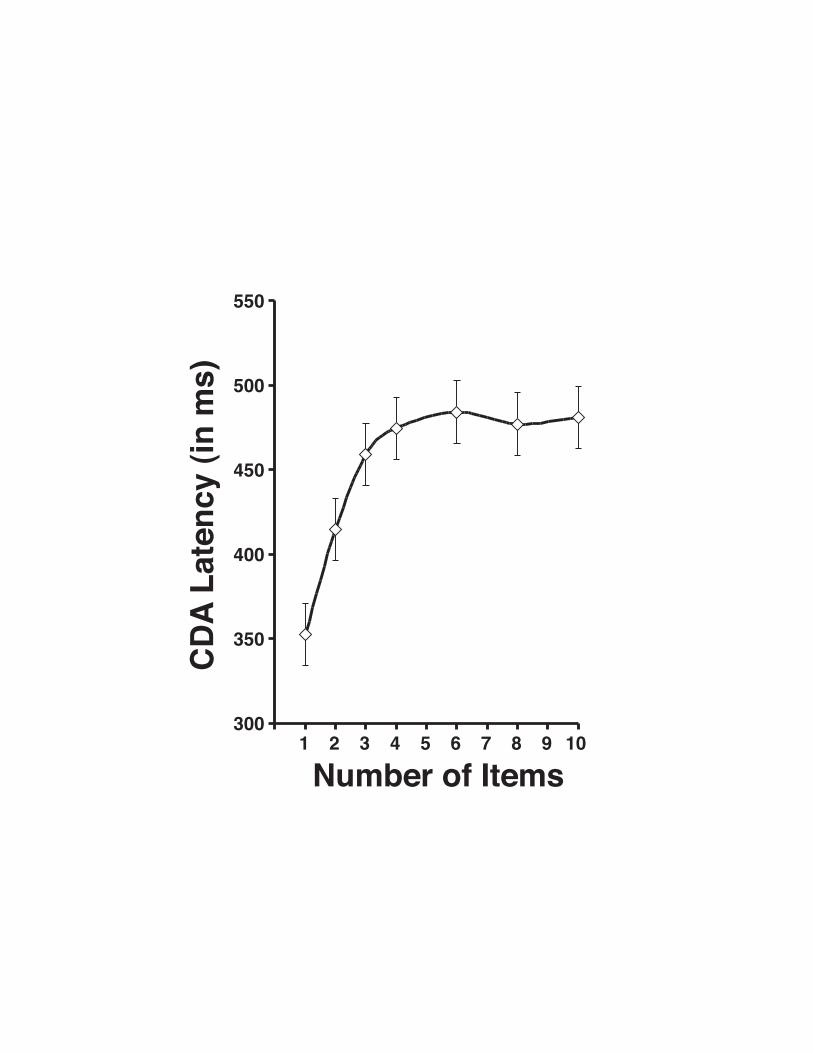
While there is no clearly distinct peak, the CDA generally reaches maximum amplitude
by approximately 450ms following the memory array. However, the latency at which it reaches
maximum amplitude is strongly dependent upon the number of items that are to be stored in
VWM. As can be seen in Figure 13.2, the latency to maximum amplitude (defined here by
Page 12
12
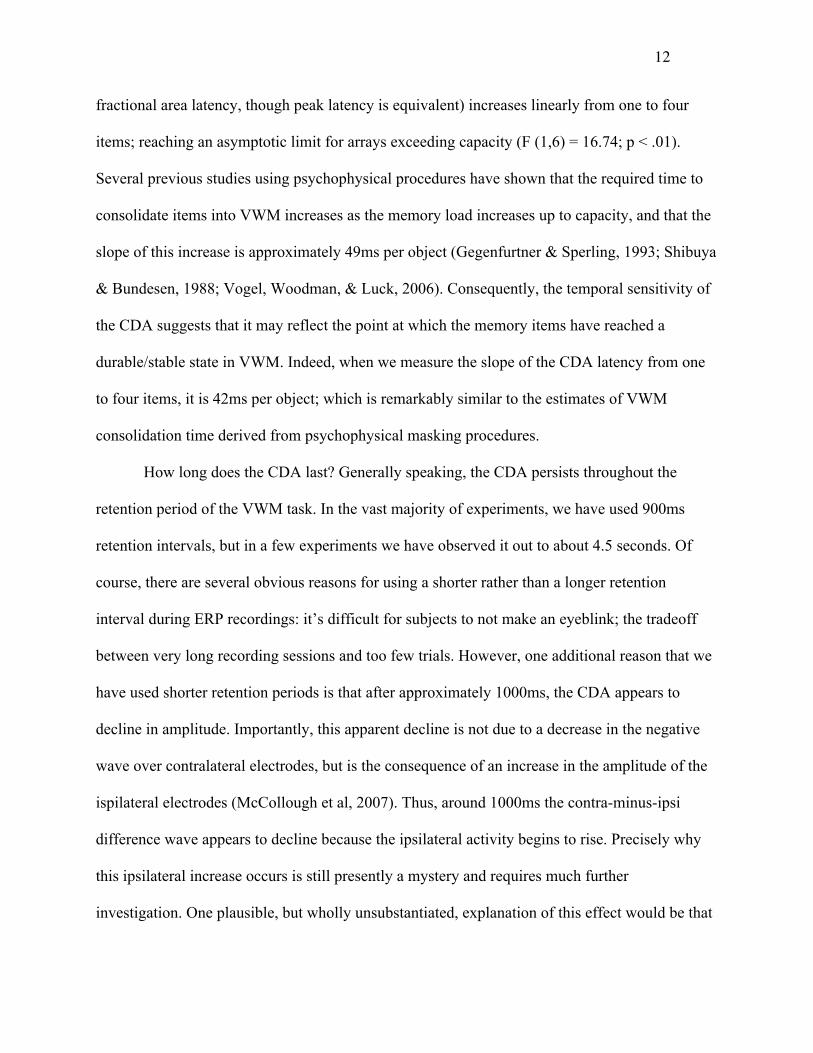
fractional area latency, though peak latency is equivalent) increases linearly from one to four
items; reaching an asymptotic limit for arrays exceeding capacity (F (1,6) = 16.74; p < .01).
Several previous studies using psychophysical procedures have shown that the required time to
consolidate items into VWM increases as the memory load increases up to capacity, and that the
slope of this increase is approximately 49ms per object (Gegenfurtner & Sperling, 1993; Shibuya
& Bundesen, 1988; Vogel, Woodman, & Luck, 2006). Consequently, the temporal sensitivity of
the CDA suggests that it may reflect the point at which the memory items have reached a
durable/stable state in VWM. Indeed, when we measure the slope of the CDA latency from one
to four items, it is 42ms per object; which is remarkably similar to the estimates of VWM
consolidation time derived from psychophysical masking procedures.
How long does the CDA last? Generally speaking, the CDA persists throughout the
retention period of the VWM task. In the vast majority of experiments, we have used 900ms
retention intervals, but in a few experiments we have observed it out to about 4.5 seconds. Of
course, there are several obvious reasons for using a shorter rather than a longer retention
interval during ERP recordings: it’s difficult for subjects to not make an eyeblink; the tradeoff
between very long recording sessions and too few trials. However, one additional reason that we
have used shorter retention periods is that after approximately 1000ms, the CDA appears to
decline in amplitude. Importantly, this apparent decline is not due to a decrease in the negative
wave over contralateral electrodes, but is the consequence of an increase in the amplitude of the
ispilateral electrodes (McCollough et al, 2007). Thus, around 1000ms the contra-minus-ipsi
difference wave appears to decline because the ipsilateral activity begins to rise. Precisely why
this ipsilateral increase occurs is still presently a mystery and requires much further
investigation. One plausible, but wholly unsubstantiated, explanation of this effect would be that
Page 13
13
the memory representations initially begin as predominantly hemispheric-specific
representations, but that after a period of time they become represented equally in each
hemisphere. Perhaps, this could explain why many FMRI studies of WM, which generally use
retention intervals of several seconds, often do not find lateralized BOLD activations even when
subjects are remembering items from a single hemifield (Ikkai & Curtis, in press).
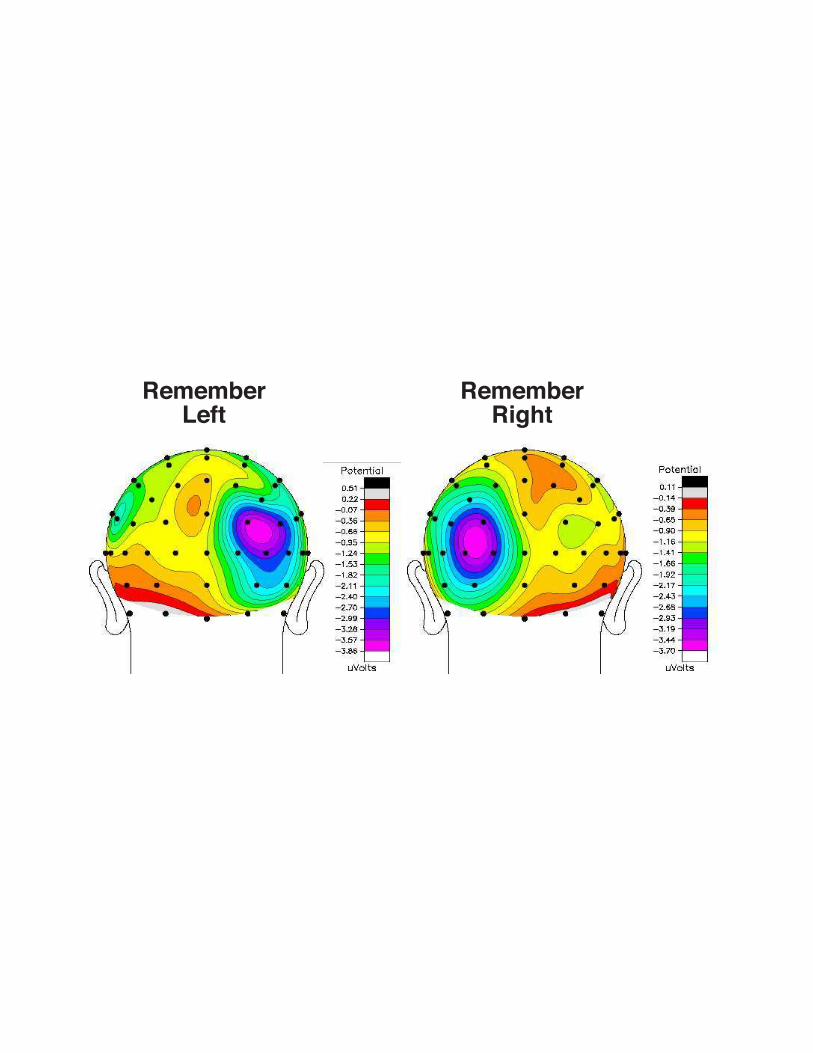
Scalp topography and possible neural sources of the CDA
The CDA is a broadly-distributed wave that is primarily centered over the posterior
electrodes (see Fig 13.3). The maximum amplitude of the component is often observed over the
posterior parietal electrodes. While the component is typically measured by collapsing the left
and right hemispheric responses, in previous work we measured the negative wave separately for
each hemisphere and found that there was no significant difference in amplitude between the left
and right hemispheres (McCollough et al 2007). Moreover, in that study we found that the scalp
distribution of the CDA was significantly more dorsal than the N2pc component (see Chapter
11), which is an earlier contralateral component with a more ventral focus.
Although a formal source localization of the CDA has not yet been attempted, one
cortical region appears to be a potential candidate source of this wave: the intra-parietal sulcus
(IPS). While the dorsal, posterior scalp topography of the CDA is generally consistent with such
a locus, the strongest evidence in favor of an IPS source comes from neuroimaging experiments
of VWM. In particular, several recent FMRI studies examining the BOLD response during
VWM tasks have found that the IPS is strongly modulated by the number of items that are
currently being held in memory, but reaches an asymptotic limit at approximately 4 items (Todd
& Marois, 2004; Xu & Chun, 2006). Moreover, Todd & Marois (2005) found that this IPS
Page 14
14
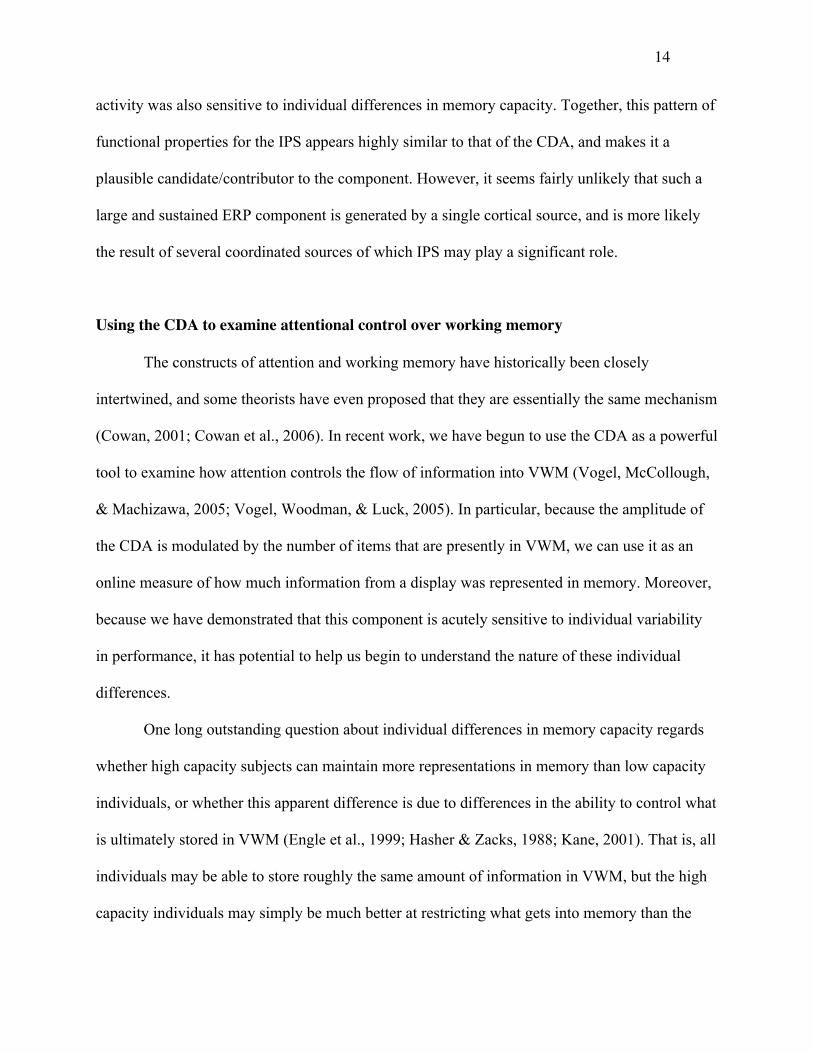
activity was also sensitive to individual differences in memory capacity. Together, this pattern of
functional properties for the IPS appears highly similar to that of the CDA, and makes it a
plausible candidate/contributor to the component. However, it seems fairly unlikely that such a
large and sustained ERP component is generated by a single cortical source, and is more likely
the result of several coordinated sources of which IPS may play a significant role.
Using the CDA to examine attentional control over working memory
The constructs of attention and working memory have historically been closely
intertwined, and some theorists have even proposed that they are essentially the same mechanism
(Cowan, 2001; Cowan et al., 2006). In recent work, we have begun to use the CDA as a powerful
tool to examine how attention controls the flow of information into VWM (Vogel, McCollough,
& Machizawa, 2005; Vogel, Woodman, & Luck, 2005). In particular, because the amplitude of
the CDA is modulated by the number of items that are presently in VWM, we can use it as an
online measure of how much information from a display was represented in memory. Moreover,
because we have demonstrated that this component is acutely sensitive to individual variability
in performance, it has potential to help us begin to understand the nature of these individual
differences.
One long outstanding question about individual differences in memory capacity regards
whether high capacity subjects can maintain more representations in memory than low capacity
individuals, or whether this apparent difference is due to differences in the ability to control what
is ultimately stored in VWM (Engle et al., 1999; Hasher & Zacks, 1988; Kane, 2001). That is, all
individuals may be able to store roughly the same amount of information in VWM, but the high
capacity individuals may simply be much better at restricting what gets into memory than the
Page 15
15
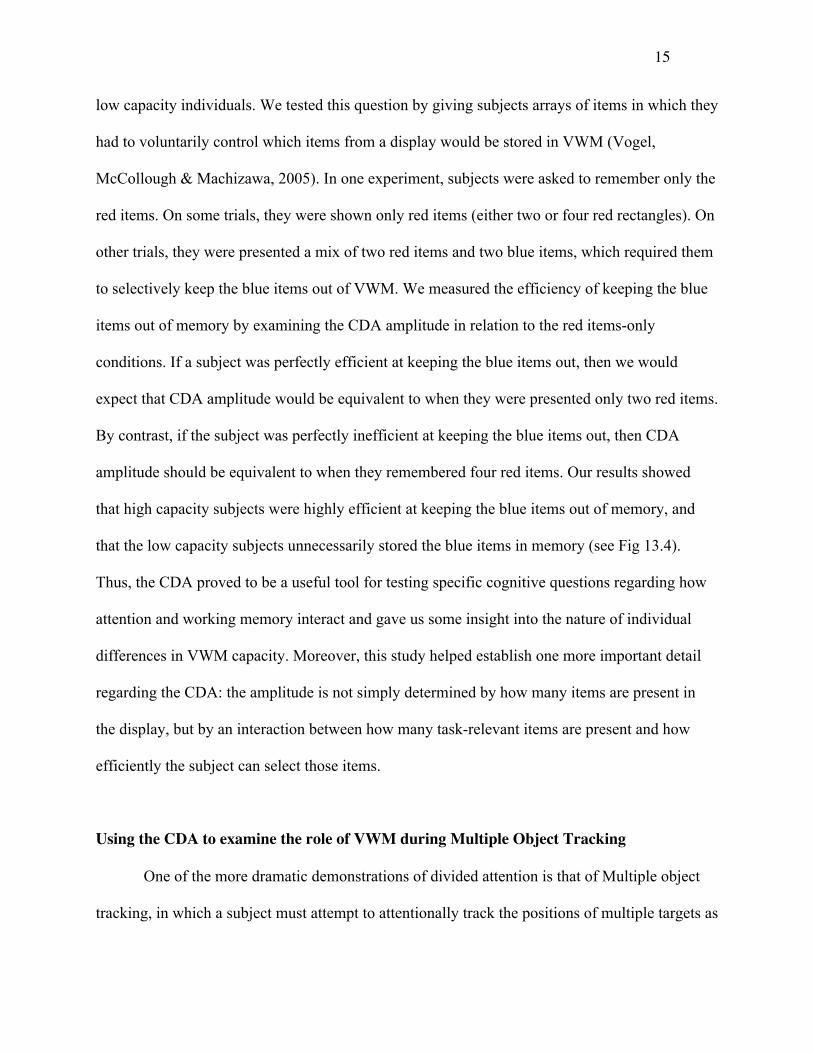
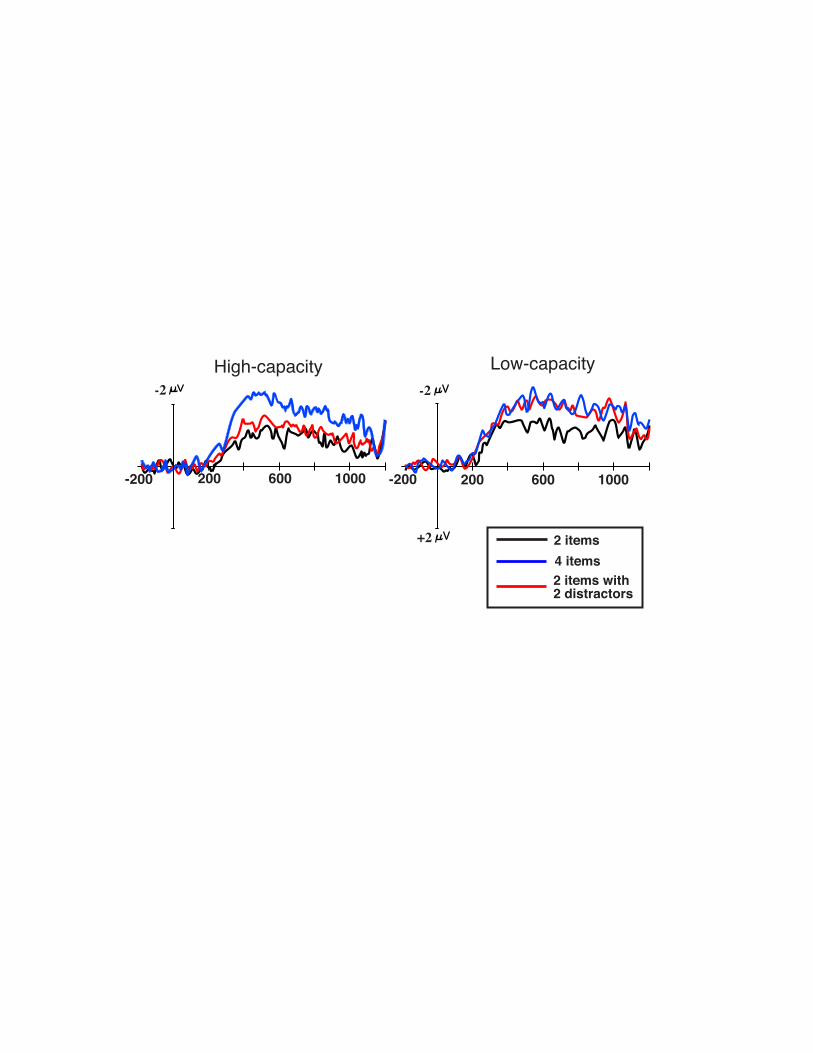
low capacity individuals. We tested this question by giving subjects arrays of items in which they
had to voluntarily control which items from a display would be stored in VWM (Vogel,
McCollough & Machizawa, 2005). In one experiment, subjects were asked to remember only the
red items. On some trials, they were shown only red items (either two or four red rectangles). On
other trials, they were presented a mix of two red items and two blue items, which required them
to selectively keep the blue items out of VWM. We measured the efficiency of keeping the blue
items out of memory by examining the CDA amplitude in relation to the red items-only
conditions. If a subject was perfectly efficient at keeping the blue items out, then we would
expect that CDA amplitude would be equivalent to when they were presented only two red items.
By contrast, if the subject was perfectly inefficient at keeping the blue items out, then CDA
amplitude should be equivalent to when they remembered four red items. Our results showed
that high capacity subjects were highly efficient at keeping the blue items out of memory, and
that the low capacity subjects unnecessarily stored the blue items in memory (see Fig 13.4).
Thus, the CDA proved to be a useful tool for testing specific cognitive questions regarding how
attention and working memory interact and gave us some insight into the nature of individual
differences in VWM capacity. Moreover, this study helped establish one more important detail
regarding the CDA: the amplitude is not simply determined by how many items are present in
the display, but by an interaction between how many task-relevant items are present and how
efficiently the subject can select those items.
Using the CDA to examine the role of VWM during Multiple Object Tracking
One of the more dramatic demonstrations of divided attention is that of Multiple object
tracking, in which a subject must attempt to attentionally track the positions of multiple targets as
Page 16
16
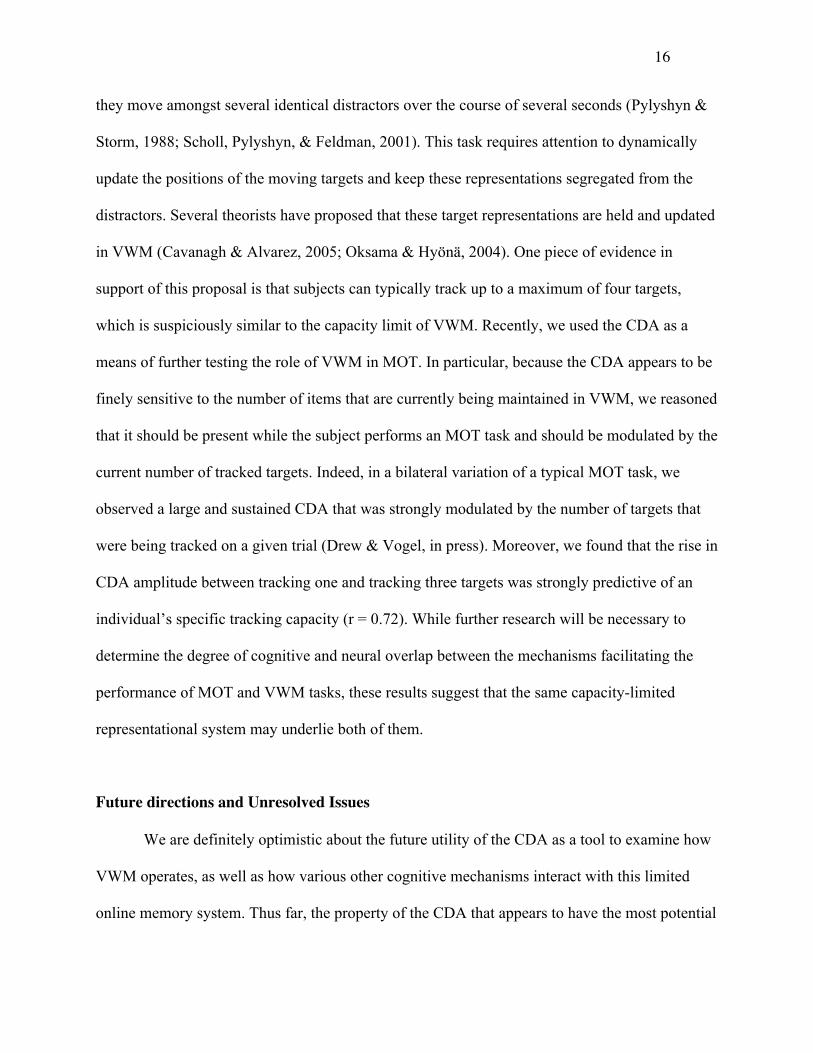
they move amongst several identical distractors over the course of several seconds (Pylyshyn &
Storm, 1988; Scholl, Pylyshyn, & Feldman, 2001). This task requires attention to dynamically
update the positions of the moving targets and keep these representations segregated from the
distractors. Several theorists have proposed that these target representations are held and updated
in VWM (Cavanagh & Alvarez, 2005; Oksama & Hyönä, 2004). One piece of evidence in
support of this proposal is that subjects can typically track up to a maximum of four targets,
which is suspiciously similar to the capacity limit of VWM. Recently, we used the CDA as a
means of further testing the role of VWM in MOT. In particular, because the CDA appears to be
finely sensitive to the number of items that are currently being maintained in VWM, we reasoned
that it should be present while the subject performs an MOT task and should be modulated by the
current number of tracked targets. Indeed, in a bilateral variation of a typical MOT task, we
observed a large and sustained CDA that was strongly modulated by the number of targets that
were being tracked on a given trial (Drew & Vogel, in press). Moreover, we found that the rise in
CDA amplitude between tracking one and tracking three targets was strongly predictive of an
individual’s specific tracking capacity (r = 0.72). While further research will be necessary to
determine the degree of cognitive and neural overlap between the mechanisms facilitating the
performance of MOT and VWM tasks, these results suggest that the same capacity-limited
representational system may underlie both of them.
Future directions and Unresolved Issues
We are definitely optimistic about the future utility of the CDA as a tool to examine how
VWM operates, as well as how various other cognitive mechanisms interact with this limited
online memory system. Thus far, the property of the CDA that appears to have the most potential
Page 17
17
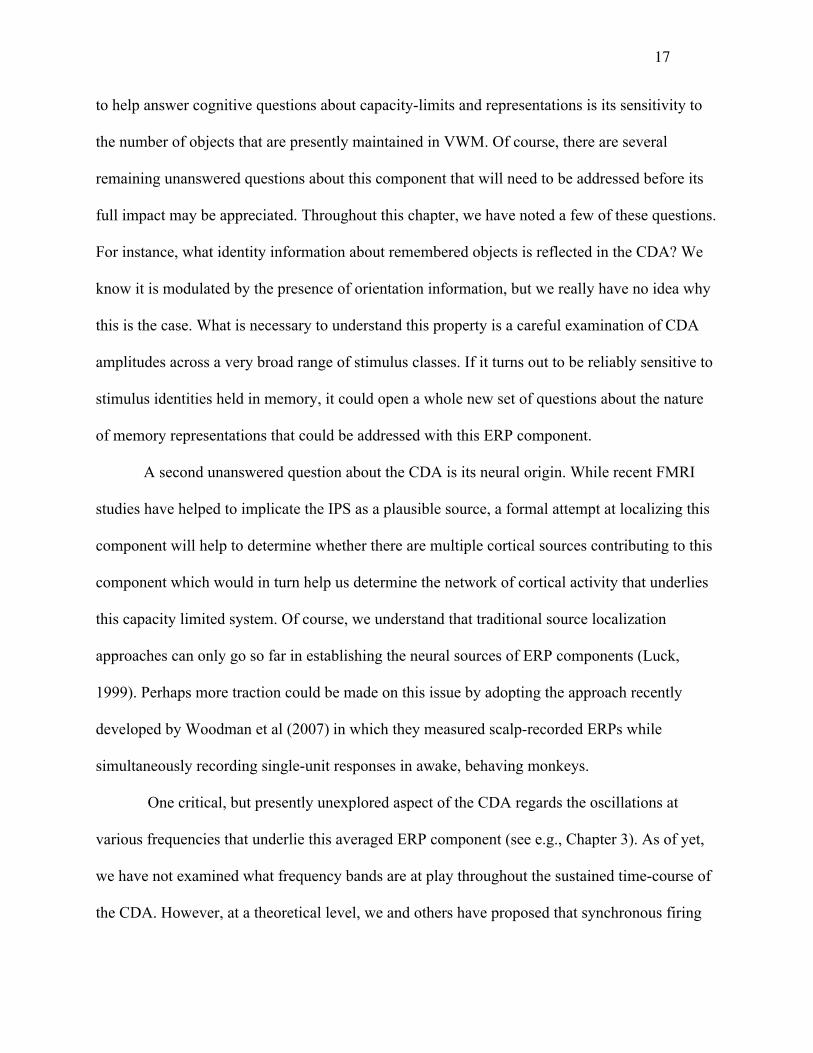
to help answer cognitive questions about capacity-limits and representations is its sensitivity to
the number of objects that are presently maintained in VWM. Of course, there are several
remaining unanswered questions about this component that will need to be addressed before its
full impact may be appreciated. Throughout this chapter, we have noted a few of these questions.
For instance, what identity information about remembered objects is reflected in the CDA? We
know it is modulated by the presence of orientation information, but we really have no idea why
this is the case. What is necessary to understand this property is a careful examination of CDA
amplitudes across a very broad range of stimulus classes. If it turns out to be reliably sensitive to
stimulus identities held in memory, it could open a whole new set of questions about the nature
of memory representations that could be addressed with this ERP component.
A second unanswered question about the CDA is its neural origin. While recent FMRI
studies have helped to implicate the IPS as a plausible source, a formal attempt at localizing this
component will help to determine whether there are multiple cortical sources contributing to this
component which would in turn help us determine the network of cortical activity that underlies
this capacity limited system. Of course, we understand that traditional source localization
approaches can only go so far in establishing the neural sources of ERP components (Luck,
1999). Perhaps more traction could be made on this issue by adopting the approach recently
developed by Woodman et al (2007) in which they measured scalp-recorded ERPs while
simultaneously recording single-unit responses in awake, behaving monkeys.
One critical, but presently unexplored aspect of the CDA regards the oscillations at
various frequencies that underlie this averaged ERP component (see e.g., Chapter 3). As of yet,
we have not examined what frequency bands are at play throughout the sustained time-course of
the CDA. However, at a theoretical level, we and others have proposed that synchronous firing
Page 18
18
across populations of cells may be the mechanism for maintaining object representations in
VWM (Lisman & Idiart, 1995; Tallon-Baudry, Bertrand, & Fischer, 2001; Vogel et al., 2001).
Indeed, it is even possible that VWM capacity limits are the consequence of a limited ability to
keep the oscillations for a given object separate and asynchronous from the oscillations
representing other objects in memory (Raffone & Wolters, 2001). Consequently, understanding
the oscillations that give rise to the CDA will likely be critical to answering one of the most
fundamental questions about working memory: why is it capacity limited in the first place?
Page 19
19
References
Alvarez, G. A., & Cavanagh, P. (2004). The capacity of visual short-term memory is set both by
visual information load and by number of objects. Psychological Science, 15(2), 106-111.
Awh, E., Barton, B., & Vogel, E. K. (2007). Visual working memory represents a fixed number
of items regardless of complexity. Psychological Science, 18(7), 622-628.
Baddeley, A. D., & Hitch, G. J. (1974). Working Memory. In G. H. Bower (Ed.), The
Psychology of Learning and Motivation, Vol. VIII (pp. 47-90). New York: Academic
Press.
Brisson, B., & Jolicoeur, P. (2007). A psychological refractory period in access to visual short-
term memory and the deployment of visual-spatial attention: Multitasking processing
deficits revealed by event-related potentials. Psychophysiology, 44(2), 323-333.
Cavanagh, P., & Alvarez, G. A. (2005). Tracking multiple targets with multifocal attention.
Trends in Cognitive Sciences Vol 9(7) Jul 2005, 349-354.
Chafee, M., & Goldman-Rakic, P. (1998). Matching patterns of activity in primate prefrontal
area 8a and parietal area 7ip neurons during a spatial working memory task. Journal of
Neurophysiology, 79, 2919-2940.
Chelazzi, L., Duncan, J., Miller, E. K., & Desimone, R. (1998). Responses of neurons in inferior
temporal cortex during memory-guided visual search. Journal of Neurophysiology, 80,
2918-2940.
Colby, C. L., & Goldberg, M. E. (1999). Space and attention in parietal cortex. Annual Review of
Neuroscience, 22, 319-349.
Cowan, N. (2001). The magical number 4 in short-term memory: A reconsideration of mental
storage capacity. Behavioral and Brain Sciences, 24, 87-185.
Page 20
20
Cowan, N., Fristoe, N. M., Elliott, E. M., Brunner, R. P., & Saults, J. S. (2006). Scope of
attention, control of attention, and intelligence in children and adults. Memory &
Cognition, 34(8), 1754-1768.
Daneman, M., & Carpenter, P. A. (1980). Individual differences in working memory and
reading. Journal of Verbal Learning and Verbal Behavior, 19, 450-466.
Drew, T., & Vogel, E. K. (in press). Neural measures of individual differences in selecting and
tracking multiple moving objects. Journal of Neuroscience.
Druzgal, T. J., & D'Esposito, M. D. (2001). Activity in fusiform face area modulated as a
function of working memory load. Cognitive Brain Research, 10, 355-364.
Engle, R. W., Kane, M. J., & Tuholski, S. W. (1999). Individual differences in working memory
capacity and what they tell us about controlled attention, general fluid intelligence, and
functions of the prefrontal cortex. In A. Miyake & P. Shah (Eds.), Models of working
memory: Mechanisms of active maintenance and executive control (pp. 102-134). New
York: Cambridge University Press.
Funahashi, S., Bruce, C. J., & Goldman-Rakic, P. S. (1989). Mnemonic coding of visual space in
the monkey's dorsolateral prefrontal cortex. Journal of Neurophysiology, 61, 331-349.
Fuster, J. M. (1973). Unit activity in prefrontal cortex during delayed-response performance:
Neuronal correlates of transient memory. Journal of Neurophysiology, 36, 61-78.
Fuster, J. M., & Alexander, G. E. (1971). Neuron activity related to short-term memory. Science,
173, 652-654.
Gegenfurtner, K. R., & Sperling, G. (1993). Information transfer in iconic memory experiments.
Journal of Experimental Psychology: Human Perception & Performance, 19(4), 845-
866.
Page 21
21
Gold, J. M., Wilk, C., McMahon, R., & Luck, S. J. (2003). Working memory for visual features
and conjunctions in schizophrenia. Journal of abnormal psychology, 112(1), 61-71.
Goldman-Rakic, P. S. (1999). The physiological approach: functional architecture of working
memory and disordered cognition in schizophrenia. Biological Psychiatry, 46(5), 650-
661.
Gratton, G. (1998). The contralateral organization of visual memory: A theoretical concept and a
research tool. Psychophysiology, 35, 638-647.
Hasher, L., & Zacks, R. (1988). In G. H. Bower (Ed.), Psychology of Learning and Motivation.
San Diego, CA: Academic Press.
Ikkai, A., & Curtis, C. (in press). Cortical activity time locked to the shift and maintenance of
spatial attention. Cerebral Cortex.
Kane, M. J., Bleckly, M. K., Conway, A. R. A., Engle, R. W. (2001). A controlled-attention view
of working memory capacity. Journal of Experimental Psychology: General, 130(2),
169-183.
Klaver, P., Talsma, D., Wijers, A. A., Heinze, H. J., & Mulder, G. (1999). An event-related brain
potential correlate of visual short-term memory. Neuroreport, 10, 2001-2005.
Kubota, K., & Niki, H. (1971). Prefrontal cortical unit activity and delayed alternation
performance in monkeys. Journal of neurophysiology, 34, 337-347.
Kyllonen, P. C., & Christal, R. E. (1990). Reasoning ability is (little more than) working memory
capacity. Intelligence, 14, 398-433.
Lisman, J. E., & Idiart, M. A. P. (1995). Storage of 7+/-2 short-term memories in oscillatory
subcycles. Science, 267, 1512-1515.
Page 22
22
Luck, S. J. (1999). Direct and indirect integration of event-related potentials, functional magnetic
resonance images, and single-unit recordings. Human Brain Mapping, 8, 15-20.
Luck, S. J., & Vogel, E. K. (1997). The capacity of visual working memory for features and
conjunctions. Nature, 390, 279-281.
McCollough, A. W., Machizawa, M. G., & Vogel, E. K. (2007). Electrophysiological measures
of maintaining representations in visual working memory. Cortex, 43(1), 77-94.
Mecklinger, A., & Muller, N. (1996). Dissociations in the processing of "What" and "Where"
information in working memory: An event-related potential analysis. Journal of
Cognitive Neuroscience, 8(5), 453-473.
Miller, E. K., & Cohen, J. D. (2001). An integrative theory of prefrontal cortex function. Annual
review of neuroscience, 24, 167-202.
Miller, E. K., Li, L., & Desimone, R. (1993). Activity of neurons in anterior inferior temporal
cortex during a short-term memory task. Journal of Neuroscience, 13, 1460-1478.
Morris, R. G., & Baddeley, A. D. (1988). Primary and working memory functioning in
alzheimer-type dementia. Journal of clinical and experimental neuropsychology, 10(2),
279-296.
Oksama, L., & Hyönä, J. (2004). Is multiple object tracking carried out automatically by an early
vision mechanism independent of higher-order cognition? An individual difference
approach. Visual Cognition, 11(5), 631-671.
Pessoa, L., Gutierrez, E., Bandettini, P., & Ungerleider, L. G. (2002). Neural correlates of visual
working memory: FMRI amplitude predicts task performance. Neuron, 35, 975-987.
Phillips, W. A. (1974). On the distinction between sensory storage and short-term visual
memory. Perception & Psychophysics, 16, 283-290.
Page 23
23
Pylyshyn, Z. W., & Storm, R. W. (1988). Tracking multiple independent targets: Evidence for a
parallel tracking mechanism. Spatial Vision Vol 3(3) 1988, 179-197.
Raffone, A., & Wolters, G. (2001). A cortical mechanism for binding in visual working memory.
Journal of Cognitive Neuroscience, 13, 766-785.
Rinck, M., & Becker, E. S. (2005). A comparison of attentional biases and memory biases in
women with social phobia and major depression. Journal of abnormal psychology,
114(1), 62-74.
Rosler, F., Heil, M., & Roder, B. (1997). Slow negative brain potentials as reflections of specific
modular resources of cognition. Biological Psychology, 45, 109-141.
Ruchkin, D., Johnson, R., Canoune, H., & Ritter, W. (1990). Short-term memory storage and
retention: An event-related brain potential study. Electroencephalography & Clinical
Neurophysiology, 76, 419-439.
Ruchkin, D., Johnson, R., Grafman, J., Canoune, H., & Ritter, W. (1992). Distinctions and
similarities among working memory processes: An event-related potential study.
Cognitive Brain Research, 1, 53-66.
Sakai, K., Rowe, J. B., & Passingham, R. E. (2002). Active maintenance in prefrontal area 46
creates distractor-resistant memory. Nature Neuroscience, 5, 479-484.
Scholl, B. J., Pylyshyn, Z. W., & Feldman, J. (2001). What is a visual object? Evidence from
target merging in multiple object tracking. Cognition Vol 80(1-2) Jun 2001, 159-177.
Sereno, M. I., Pitzalis, S., & Martinez, A. (2001). Mapping of contralateral space in retinotopic
coordinates by a parietal cortical area in humans. Science, 294, 1350-1354.
Page 24
24
Shibuya, H., & Bundesen, C. (1988). Visual selection from multielement displays: Measuring
and modeling effects of exposure duration. Journal of Experimental Psychology: Human
Perception & Performance, 14(4), 591-600.
Sonuga-Barke, E. J., Dalen, L., Daley, D., & Remington, B. (2002). Are planning, working
memory, and inhibition associated with individual differences in preschool ADHD
symptoms? Developmental Neuropsychology, 21(3), 255-272.
Sperling, G. (1960). The information available in brief visual presentations. Psychological
Monographs, 74, (Whole No. 498).
Tallon-Baudry, C., Bertrand, O., & Fischer, C. (2001). Oscillatory synchrony between human
extrastriate areas during visual short-term memory maintenance. Journal of
Neuroscience, 21, RC177.
Todd, J. J., & Marois, R. (2004). Capacity limit of visual short-term memory in human posterior
parietal cortex. Nature, 428, 751-754.
Todd, J. J., & Marois, R. (2005). Posterior parietal cortex activity predicts individual differences
in visual short-term memory capacity. Cognitive Affective & Behavioral Neuroscience,
5(2), 144-155.
Vogel, E. K., & Awh, E. (in press). How to exploit diversity for scienctific gain: using individual
differences to constrain cognitive theory. Current Directions in Psychological Science.
Vogel, E. K., & Machizawa, M. G. (2004). Neural activity predicts individual differences in
visual working memory capacity. Nature, 428, 748-751.
Vogel, E. K., McCollough, A. W., & Machizawa, M. G. (2005). Neural measures reveal
individual differences in controlling access to working memory. Nature, 438(7067), 500-
503.
Page 25
25
Vogel, E. K., Woodman, G. F., & Luck, S. J. (2001). Storage of features, conjunctions, and
objects in visual working memory. Journal of Experimental Psychology: Human
Perception and Performance, 27, 92-114.
Vogel, E. K., Woodman, G. F., & Luck, S. J. (2005). Pushing around the locus of selection:
Evidence for the flexible-selection hypothesis. Journal of Cognitive Neuroscience,
17(12), 1907-1922.
Vogel, E. K., Woodman, G. F., & Luck, S. J. (2006). The time course of consolidation in visual
working memory. Journal of Experimental Psychology-Human Perception and
Performance, 32(6), 1436-1451.
Wallis, J. D., & Miller, E. K. (2003). From rule to response: Neuronal processes in the premotor
and prefrontal cortex. Journal of Neurophysiology, 90, 1790-1806.
Woodman, G., Min-Suk, K., Rossi, A. F., & Schall, J. D. (2007). Nonhuman primate event-
related potentials indexing covert shirts of attention. Proc Natl Acad Sci U S A, 104(38),
15111-15116.
Woodman, G. F., & Vogel, E. K. (2008). Selective storage and maintenance of an object's
features in visual working memory. Psychonomic Bulletin & Review, 15(1), 223-229.
Xu, Y. D., & Chun, M. M. (2006). Dissociable neural mechanisms supporting visual short-term
memory for objects. Nature, 440(7080), 91-95.
Page 26
26
Figure Captions
Figure 13.1. a. Example of the bilateral change detection paradigm, for a “remember-left”
trial. b. Grand-averaged contralateral and ipsilateral waveforms time-locked to the memory array
and averaged over posterior parietal, inferotemporal, and lateral occipital electrode sites. By
convention, negative voltage is plotted upwards. c. Mean amplitude of CDA (300-900ms) as a
function of the number of items in the memory array. Dotted line represents the mean behavioral
visual memory capacity for the sample. d, Scatterplot of the rise in amplitude between 2-item
arrays and 4-item arrays as a function of an individual’s memory capacity (r = 0.78).
Figure 13.2. CDA latency as a function the number of items in the memory array.
Fractional area latency was measured as the time-point at which 75% of the CDA amplitude had
been reached.
Figure 13.3. Isocontour voltage maps fit to the spherical spline method of Perrin et al.
(1989). Blue and purple regions represent increased delay activity in posterior scalp distributions
responsive to remember-left and remember-right trials. Mean amplitude voltage is measured
300-900ms after the onset of the sample array.
Figure 13.4. Grand averaged difference waveforms (ipsilateral delay activity subtracted
from contralateral delay activity) divided across high and low memory capacity subjects from
Vogel et al (2005). While high capacity individuals showed a distractor-present amplitude that
was equivalent to 2-items only, the low capacity individuals showed a distractor-present
amplitude that was equivalent to the 4-items only condition.
Page 27
++
200ms 100ms 2000ms
300-400 msSOA
900ms
MemoryArray
RetentionInterval
TestArray
+ +
a b
c d-3
-2.5
-2
-1.5
-1
-0.5
0
1 2 3 4 6 8 10
Memory Array Size
Mean
Am
pli
tud
e(i
n m
icro
vo
lts)
MeanCapacity
Memory Capacity
-1
-0.75
-0.5
-0.25
01 2 3 4
Increasefrom2 to 4items
Contralateral
Ipsilateral
-3
+3
-200 ms
500 1000
Page 28
300
350
400
450
500
550
1 2 3 4 5 6 7 8 9 10
CD
A L
ate
ncy (
in m
s)
Number of Items
Page 29
RememberLeft
RememberRight
Page 30
2 items
4 items
2 items with
2 distractors
High-capacity
200 600 1000
-2
-200
Low-capacity
+2
200 600 1000-200
-2