Today’s Agenda 1. YTD performance and year-end 2. Capital structure, and how we will fund growth 3. Stakeholder relations 4. Hellaby interaction with subsidiaries 5. Inter-company opportunities, leveraging off the Hellaby value- chain 6. Growth opportunities – subsidiaries changing gear 7. Strategic/business planning timeline/process for subsidiaries 8. Hellaby strategy 9. Other things you would like to raise
Transcript
Today’s Agenda
1. YTD performance and year-end
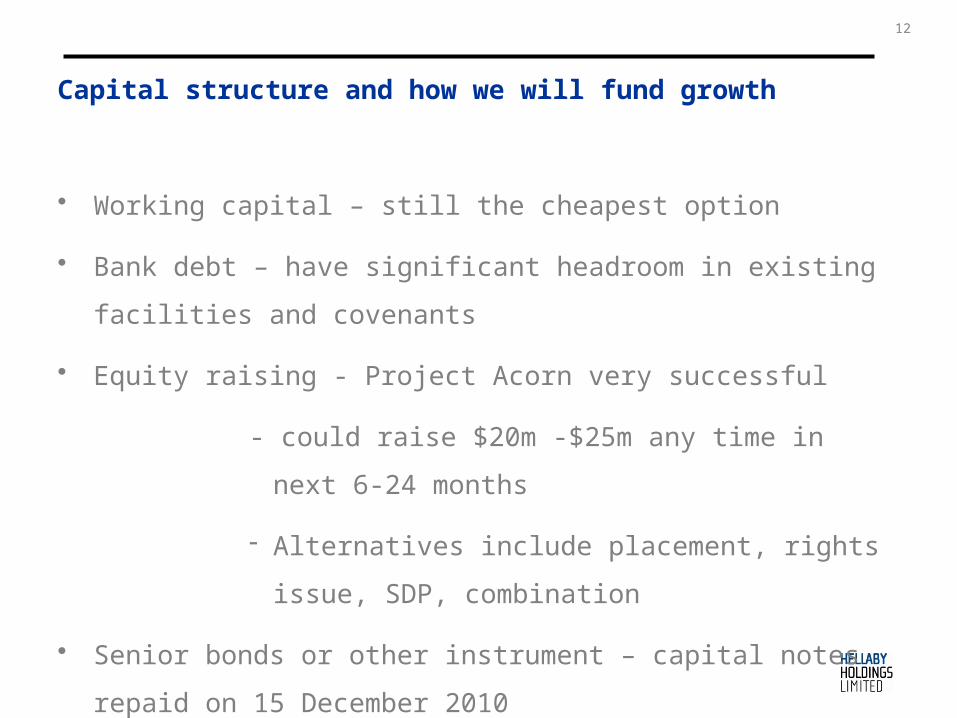
2. Capital structure, and how we will fund growth
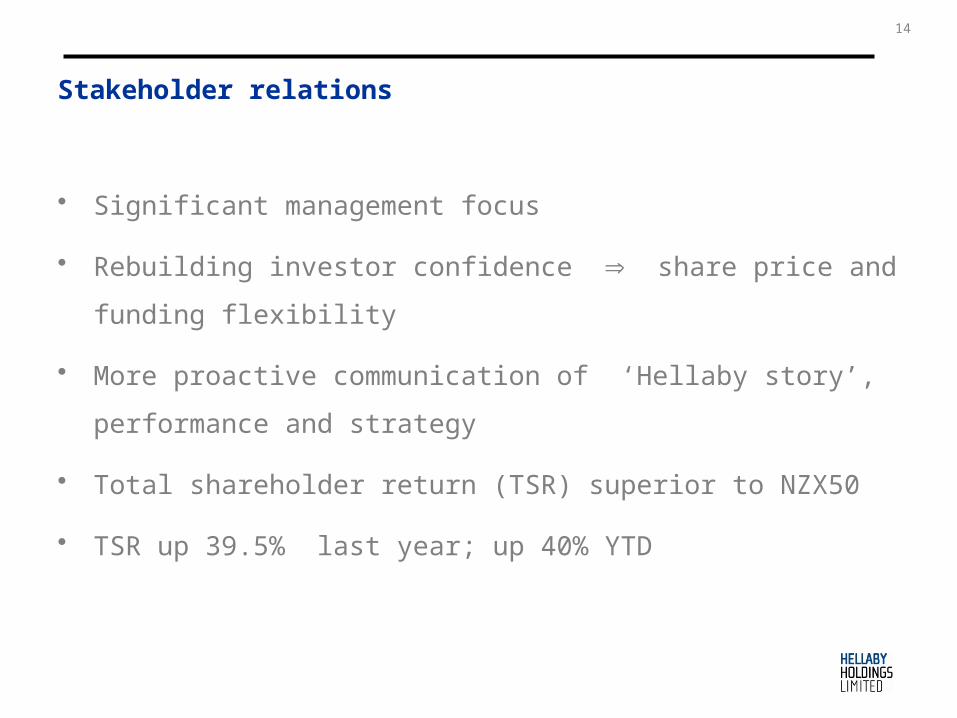
3. Stakeholder relations
4. Hellaby interaction with subsidiaries
5. Inter-company opportunities, leveraging off the Hellaby value- chain
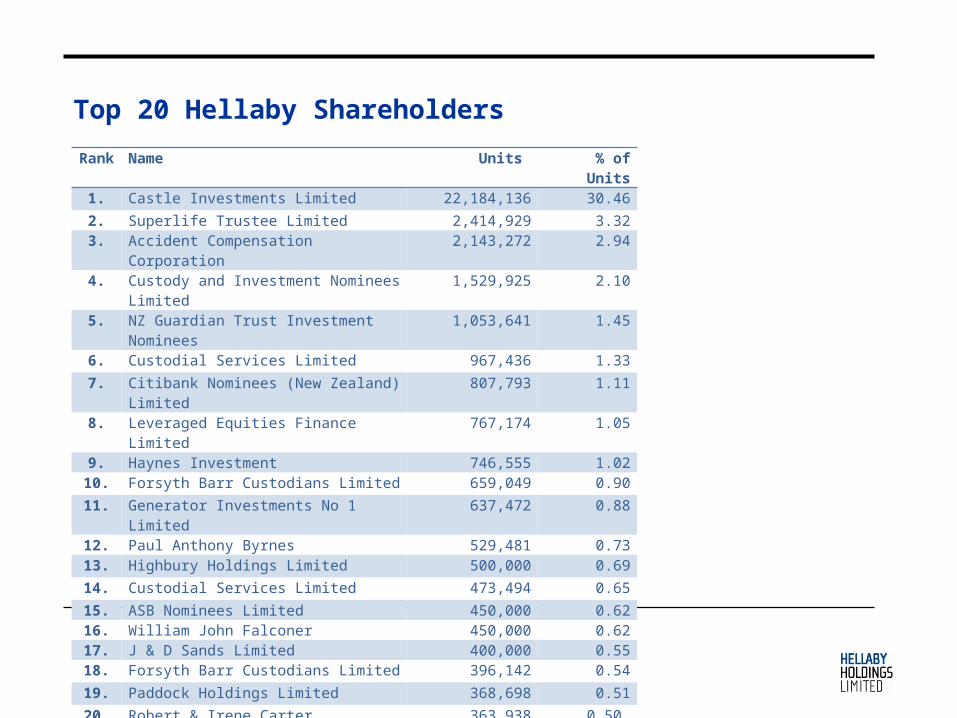
11. Generator Investments No 1 Limited 637,472 0.88
12. Paul Anthony Byrnes 529,481 0.7313. Highbury Holdings Limited 500,000 0.69
14. Custodial Services Limited 473,494 0.65
15. ASB Nominees Limited 450,000 0.6216. William John Falconer 450,000 0.6217. J & D Sands Limited 400,000 0.5518. Forsyth Barr Custodians Limited 396,142 0.54
19. Paddock Holdings Limited 368,698 0.51
20. Robert & Irene Carter 363,938 0.50
Dividends• Previous approach to paying dividends
• Current policy to pay 50% of NPAT, imputed where able
• 5 cps dividend payable 12 November 2010
• Interim dividends
Dividend History
Year Interim Final Total
2010 3 5 8
2009 - - -
2008 5 6 11
2007 10 - 10
2006 15 16 31
2005 19 20 39
2004 16 19 35
2003 11 15 26
2002 8 10 18
2001 7 8 15
2000 7 7 14
18
Dividend Reinvestment Plan
• Introduced March 2006
• Strike price = VWAP – dividend – 5% discount
• 30 – 35% uptake
• Castle pro-rata participation
19
Hellaby interaction with subsidiaries
20
Hellaby interaction with subsidiaries
• Statement of Intent good reference point
• Respective Hellaby roles
• Effectiveness of monthly reviews
• Growth now a key agenda item
• What can Hellaby do better or differently with subsidiaries?
• Talent development programme
21
Intercompany opportunities, leveraging off the Hellaby value-chain
22
Intercompany opportunities
• How do I organically grow my business? - Customer clusters
• How do I grow Hellaby business ? - Opportunities identified
• Think services as well as customers !
23
24
Growth opportunities – subsidiaries changing gear
Executing profitable growth – ‘changing gear’
• Hellaby very serious about profitable growth
• Arguably bigger challenge for CEOs than turnaround
• Subsidiaries must compete for capital, justify projects and expenditures,
obtain buy-in for strategy and direction
• Is your business committed to driving profitable growth?
will revenues therefore exceed budget?
• Do you each have a clear plan?
25
Strategic / business planning timeline / process for subsidiaries
26
Business Planning Review
• New process in Hellaby – moving from “panel beating” to “growth”– Part of strategic framework agreed with Board
• Timing– Info request / topics for discussion to CEO’s by mid December– Workshop with each CEO and relevant senior team members first half of
February
– Market assessment in put into early budgeting process
– Strategic options (as relevant) into budgeting process by late April
• Resourcing– Lead by Greg – Support from John, Neil and Richard
• Looking for growth Subsidiary EBITDA $50m in FY2012
27
Business Planning Review
• Overview of process
– Start with assessment of market environment– Build assessment of each subsidiary’s:
• Environment• Competitive forces• Industry structure • Opportunities and threats• Capability
Strategic position– Identify and evaluate options – Implementation– Review and repeat update 12 monthly
• Deliberate strategy and superb execution = superior returns
28
Hellaby strategy
29
Hellaby strategy – ‘buy build harvest’
• Strategic framework development – two distinct investment portfolios
• Core investment portfolio
specialised ‘core’ sectors / divisions
sectors may migrate over time
ultimately trans-Tasman
• Generator Fund
Expansion capital portfolio
Co-investor partnerships in strong SMEs
Agnostic about investment sectors
• Portfolio will change over next 3-5 years
30
Other things you would like to raise
31
Risk Framework
Stage 1 D Lucas Exercise (Complete 2009/10)– Identify risks – Assess the risk value– Matrix
Stage 2 Quantate (Start Oct 10)– Set up Quantate from the D Lucas exercise– Handover with basic definitions and training given (Nov & Dec 10)– Subsidiaries to complete their set up and to review risks uploaded into Quantate– Board report limited to matrix and a description of the top risks (with the first report due 14th
February 2011 & the second on the 13th May 2011)
Stage 3 Expand Risk Management (Start at the Finance Workshop)– Add mitigating controls– New Board report developed (due with July 10th day reporting, and quarterly thereafter)