1 savills.co.jp/insight-and-opinion/ MARKET IN MINUTES Savills Research Residential Leasing Tokyo – Q2/2021 Rents correct again amid market headwinds The peak moving season brought fewer new residents to the 23W than previous years. Savills plc Savills is a leading global real estate service provider listed on the London Stock Exchange. The company established in 1855, has a rich heritage with unrivalled growth. It is a company that leads rather than follows, and now has over 600 offices and associates throughout the Americas, Europe, Asia Pacific, Africa and the Middle East. This report is for general informative purposes only. It may not be published, reproduced or quoted in part or in whole, nor may it be used as a basis for any contract, prospectus, agreement or other document without prior consent. Whilst every effort has been made to ensure its accuracy, Savills accepts no liability whatsoever for any direct or consequential loss arising from its use. The content is strictly copyright and reproduction of the whole or part of it in any form is prohibited without written permission from Savills Research. Yoshihiro Kanno Manager, Research & Consultancy, Japan +81 3 6777 5275 [email protected]Tetsuya Kaneko Managing Director, Research & Consultancy, Japan +81 3 6777 5192 [email protected]Christian Mancini CEO, Asia Pacific (Ex Greater China) +81 3 6777 5150 [email protected]RESEARCH JAPAN Please contact us for further information Savills team • Rents in the Tokyo 23 wards (23W) saw a mild decline of 2.0% quarter-on-quarter (QoQ) and 4.0% year-on-year (YoY) to JPY3,964 per sq m in Q2/2021. • Average mid-market rents in the central five wards (C5W) have continued their descent and are currently at JPY4,670 per sq m – a fall of 1.6% QoQ and 5.8% YoY. • The C5W premium has marginally increased to 17.6%, up 0.2 percentage points (ppts) from the last quarter. • At the ward level, only a few areas posted positive growth on a quarterly basis. Here, Toshima in the Inner North marked the strongest growth this quarter with a modest gain of 0.9%. On an annual basis, Katsushika took the crown, with rents rising by 5.7%. • In the C5W, average rents for units in the 15-30 sq m size band have seen a correction this quarter and currently remain the least expensive size band in a complete reversal of the historic trend. • The average occupancy rate in the 23W decreased by 0.7ppts to 95.4%. The C5W, meanwhile, also saw a decline with the rate contracting by 0.9ppts to 94.2%. • Notable demographic changes have taken place in Tokyo since the pandemic began, with the 23W population seeing a material decline. In contrast, western regions have seen a rise in their populations. Simon Smith Regional Head of Research & Consultancy, Asia Pacific +852 2842 4573 [email protected]“After a temporary rise in the previous quarter, rents have again declined across the 23W. Unsurprisingly, the demographic changes seen in Tokyo since the onset of the pandemic have dented the capital’s appeal, with areas on the outskirts being the prime beneficiaries of this change. With the end of the pandemic in sight, however, it remains to be seen if this will be long- lasting.” SAVILLS RESEARCH & CONSULTANCY
Transcript
1savills.co.jp/insight-and-opinion/
MARKETIN
MINUTES
Savills Research
Residential LeasingTokyo – Q2/2021
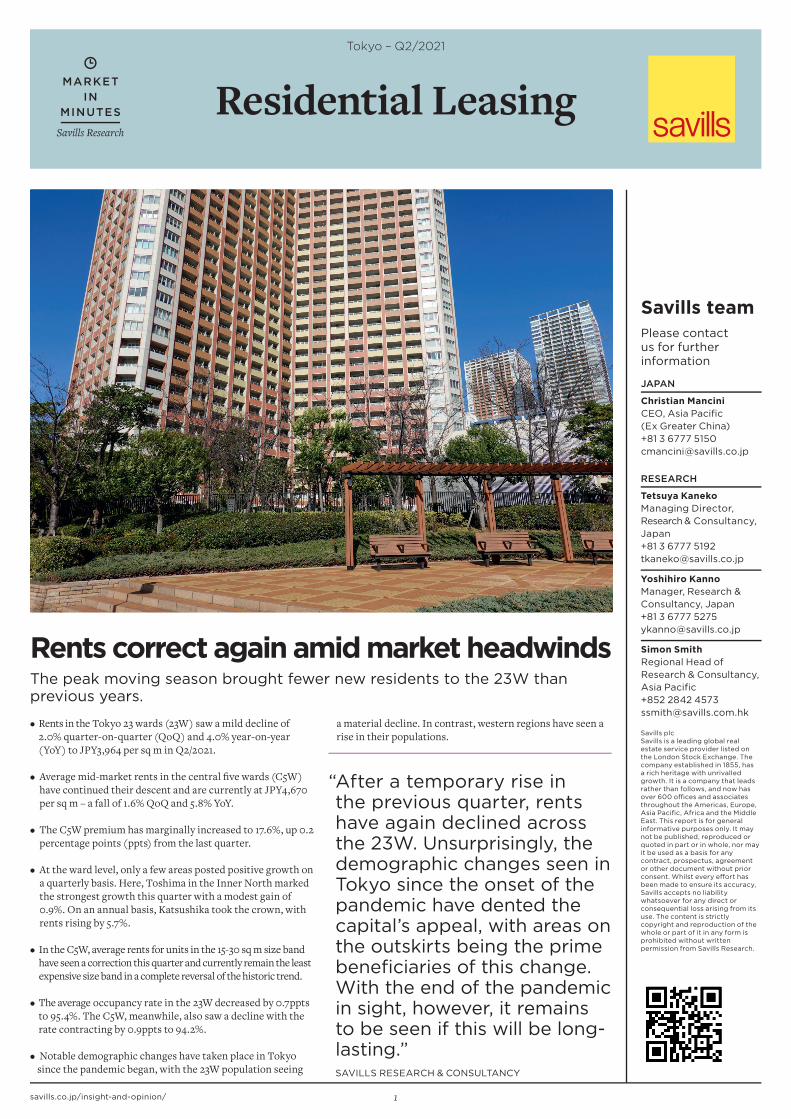
Rents correct again amid market headwindsThe peak moving season brought fewer new residents to the 23W than previous years.
Savills plcSavills is a leading global real estate service provider listed on the London Stock Exchange. The company established in 1855, has a rich heritage with unrivalled growth. It is a company that leads rather than follows, and now has over 600 offi ces and associates throughout the Americas, Europe, Asia Pacifi c, Africa and the Middle East. This report is for general informative purposes only. It may not be published, reproduced or quoted in part or in whole, nor may it be used as a basis for any contract, prospectus, agreement or other document without prior consent. Whilst every eff ort has been made to ensure its accuracy, Savills accepts no liability whatsoever for any direct or consequential loss arising from its use. The content is strictly copyright and reproduction of the whole or part of it in any form is prohibited without written permission from Savills Research.
Yoshihiro KannoManager, Research & Consultancy, Japan+81 3 6777 [email protected]
Christian ManciniCEO, Asia Pacifi c(Ex Greater China)+81 3 6777 [email protected]
RESEARCH
JAPAN
Please contact us for further information
Savills team
• Rents in the Tokyo 23 wards (23W) saw a mild decline of 2.0% quarter-on-quarter (QoQ) and 4.0% year-on-year (YoY) to JPY3,964 per sq m in Q2/2021.
• Average mid-market rents in the central fi ve wards (C5W) have continued their descent and are currently at JPY4,670 per sq m – a fall of 1.6% QoQ and 5.8% YoY.
• The C5W premium has marginally increased to 17.6%, up 0.2 percentage points (ppts) from the last quarter.
• At the ward level, only a few areas posted positive growth on a quarterly basis. Here, Toshima in the Inner North marked the strongest growth this quarter with a modest gain of 0.9%. On an annual basis, Katsushika took the crown, with rents rising by 5.7%.
• In the C5W, average rents for units in the 15-30 sq m size band have seen a correction this quarter and currently remain the least expensive size band in a complete reversal of the historic trend.
• The average occupancy rate in the 23W decreased by 0.7ppts to 95.4%. The C5W, meanwhile, also saw a decline with the rate contracting by 0.9ppts to 94.2%.
• Notable demographic changes have taken place in Tokyo since the pandemic began, with the 23W population seeing
a material decline. In contrast, western regions have seen a rise in their populations.
Simon SmithRegional Head of Research & Consultancy, Asia Pacifi c +852 2842 [email protected]
“ After a temporary rise in the previous quarter, rents have again declined across the 23W. Unsurprisingly, the demographic changes seen in Tokyo since the onset of the pandemic have dented the capital’s appeal, with areas on the outskirts being the prime benefi ciaries of this change. With the end of the pandemic in sight, however, it remains to be seen if this will be long-lasting.”SAVILLS RESEARCH & CONSULTANCY
2savills.co.jp/insight-and-opinion/
MAP 1: Tokyo’s 23 Wards by Survey Area
AdachiItabashi
Nerima Katsushika
Arakawa
Kita
Suginami
Nakano
Edogawa
TaitoSumida
Shinjuku
Koto
Setagaya
Meguro
Chuo
Shinagawa
Chiyoda
Minato
Shibuya
Ota
Toshima
Bunkyo
Source Savills Research & Consultancy
Central (C5W)
South
West
North (Inner)
North (Outer)
East (Inner)
East (Outer)
Tokyo 23 Wards
SURVEY GEOGRAPHYIn order to illustrate trends in the central Tokyo residential market, Savills has segmented Tokyo’s 23 wards (23W) into seven distinct geographical areas: Central (or “central fi ve wards”), South, West, North (Inner and Outer) and East (Inner and Outer).
RENTAL INDEX DATA CHARACTERISTICSSavills collates thousands of leasing comparables each quarter in order to analyse trends aff ecting “mid-market” rental apartment units in Tokyo. Our benchmark rental data is based on average advertised monthly rents for units which fi t the following criteria:
1) studio and one- or two-bedroom rental apartments of up to 100 sq m in size,
2) reinforced concrete structures built within the last ten years, and
3) properties located in Tokyo’s 23 wards and situated within a ten-minute walk of the nearest station.
May 2021. Even so, it should be noted that this population increment is less than half of what was observed over the same period in 2019 and 2020 (Graph 6), and the prefecture’s population now stands marginally higher than the levels seen at the end of last year. Somewhat paradoxically, despite the population increment seen in the 23W this quarter, occupancy rates have declined, further corroborated by a substantial increase in the number of residential listings seen when compared with the last quarter. A potential explanation here could be the prolonged state of emergency, which slowed the momentum of the economy, pushing the unemployment rate in Tokyo 0.5ppts above the lowest levels seen in Q3/2019. The Japanese economy has been experiencing a K-shaped recovery, and with certain industries like IT and semiconductors doing considerably better than other industries, this may have disproportionately weakened the spending power of some in the capital, consequently increasing the vacancy rates in some areas. At the same time, this stifl ed demand is coupled with a larger number of rental condo housing starts in 2019 and 2020, intensifying the competition for tenants between landlords once these units came online, putting further stress on the market.
Owing to a less pronounced drop in rents in the C5W this quarter, its premium over the 23W has increased by 0.2ppts to 17.6% (Graph 2). Within the submarket, rents in previously more aff ordable areas have become somewhat more expensive in comparison, perhaps as the increase in fl exible work arrangements has made location somewhat less important when looking for a new home. Overall, nearly all submarkets have witnessed a drop in rents, with the Outer North and Outer East submarket standing out for their notable QoQ declines. Meanwhile, the West, Outer North and Outer East submarkets have all seen their spreads versus the 23W narrow, showing that these markets are indeed catching up with the broader 23W.
MID-MARKET RENTAL TRENDS BY SURVEY AREAAverage multifamily asking rents for the 23W have fallen by 2.0% QoQ and 4.2% YoY, landing at JPY3,964 per sq m in Q2/2021. Moreover, YoY rents have seen their third consecutive contraction, and as a result the growth accumulated over the past two years has been erased. When looking at the various submarkets, rents have seen a decline across the board, with many parring the overall gains seen in the last quarter. On a YoY basis, the decline was the most prominent within
In contrast to the luxury residential market, advertised or “asking” rents for mid-market units fi tting the above criteria are typically non-negotiable and are not subject to incentives such as rent-free periods. Savills mid-market rental indices are therefore considered to closely refl ect movements in contract rents for the Tokyo market.
OVERALL RESULTSOne full year has elapsed since rents fi rst began to decline in Q2/2020. Despite the 23W seeing a slight uptick in Q1/2021, along with the C5W, it has experienced another correction this quarter. Rents stand at the lowest level since early 2019 as a result. In fact, rents in both the 23W and C5W have remained below their four-period moving averages since Q3/2020, adding to the market’s already downbeat sentiment.
The peak spring moving season has passed, bringing with it the usual relocation to the capital for work and education. Specifi cally, following eight consecutive months of population decline, Tokyo prefecture fi nally welcomed around 10,000 residents per month in April and
Residential Leasing
3savills.co.jp/insight-and-opinion/
GRAPH 2: Rental Premiums/Discounts* vs 23W Average, 2016 to Q2/2021
Source Savills Research & Consultancy* The above represents the average premium/discount over the respective year.
-30%
-25%
-20%
-15%
-10%
-5%
0%
5%
10%
15%
20%
25%
C5W South North(Inner)
East(Inner)
West North(Outer)
East(Outer)
PR
EM
IUM
/ D
ISC
OU
NT
TO
23W
AV
ER
AG
E
2016 2017 2018 2019 2020 2021
more expensive submarkets like the C5W and the Inner North, whereas some less expensive regions such as the Outer East actually saw an increase in rents YoY.
As with the majority of submarkets in the 23W, the C5W saw a contraction in rents this quarter. All constituents of the submarket also saw annual declines in rent. Specifi cally, rents fell 1.7% QoQ and 3.9% YoY to JPY4,670. Looking closely at each individual ward, Shibuya saw the largest quarterly and annual contractions of 1.6% and 5.8% respectively. Understandably, the comparatively quicker uptake of remote work by offi ce tenants in the ward may have lessened the appeal of paying a premium to also reside there, impacting rents as a result. In contrast, Chiyoda saw a small increase in rent over the quarter, despite a moderate annual decline. To an extent, this trend can be attributed to the combination of the ward being the least populated in the 23W and the profi le of its residents, namely high earners working in the vicinity. Therefore, these people are likely to have more fi nancial protection from the pandemic and are subsequently less incentivised to move. Indeed, the C5W residential market seems to be moving in sync with its offi ce market: Shibuya has seen a signifi cant decline in offi ce rents, whereas offi ces in Chiyoda have been much less impacted.
The South submarket saw a small correction in rents this quarter to JPY4,093 per sq m – translating to a decrease of 1.2% QoQ and 1.9% YoY. However, as in the previous quarter, the performance observed in the submarket was split unevenly. For instance, Ota and Setagaya both saw positive YoY growth of 1.5% and 0.4% respectively. Shinagawa, meanwhile, with its reputation as the sixth central ward due to the large number of offi ces in the area, was home to the greatest decline in rents this quarter of 2.5%. A large proportion of the ward’s offi ce tenants are those of middle or back-offi ce functions who are likely to have also implemented remote work. Similar to Shibuya, therefore, many residents of Shinagawa that had previously stayed there for the convenience of a short commute may have been incentivised to move, thus causing rents to weaken. Lastly, despite seeing its fourth consecutive quarterly decline of 1.9% QoQ, Meguro still maintains its status as the fourth most expensive ward in Tokyo.
Rental growth in the Inner North submarket was fl at over the quarter, yet rents fell 4.3% YoY to JPY4,112 per sq m – the largest decrease amongst all submarkets. It is worth noting, however, that despite this recent hiccup, rents in both wards remain comfortably higher than two years ago. Here,
GRAPH 3: Mid-market Apartment Rents, Q1/2014 to Q2/2021
Source Savills Research & Consultancy
2,500
2,750
3,000
3,250
3,500
3,750
4,000
4,250
4,500
4,750
5,000
Q1
Q3 Q1
Q3 Q1
Q3 Q1
Q3 Q1
Q3 Q1
Q3 Q1
Q3 Q1
2014 2015 2016 2017 2018 2019 2020 2021
JPY
/ S
Q M
/ M
ON
TH
Tokyo 23 Ward Central 5 Wards SouthWest North (Inner) North (Outer)East (Inner) East (Outer)
Bunkyo stands out with its large annual decline in rents of 7.0% YoY. Notably, despite this contraction, the ward saw its overall population increase during the pandemic thanks to its reputation for being family-friendly owing to its history as a residential and educational centre. Elsewhere, Toshima saw a moderate decline of 1.2% YoY. Unlike its counterpart, Toshima’s population declined in 2020, fuelling a large increase in the number of listings – suggesting a further correction may be on the horizon if the impact of the pandemic lingers.
While the Inner East submarket has outperformed the 23W average, it still experienced a moderate decline of 2.4% YoY, as well as a quarterly decline of 1.2%. However, the annual decline was from the all-time highs seen in Q2/2020, and it should be noted that current rents of JPY3,915 per sq m are still clearly above levels seen two years ago. Within the submarket, Sumida saw the largest annual decline of 4.0% YoY, whereas Koto saw the smallest – falling only 1.0% YoY.
Known for its convenient access to central locations via the JR Chuo line and the availability of greenery, the West submarket saw its rents peak in the previous quarter. It has since decreased by 2.5% QoQ to JPY3,720 per sq m, though it was one of the only submarkets that had positive annual growth (0.5%). At the ward level, Nakano – the most expensive ward – accounted for most of the submarket’s annual growth as rents jumped by 3.2% YoY. In contrast, rents in both Nerima and Suginami dropped over the quarter and the year.
Average rents in the Outer North submarket saw a correction over the quarter, falling 1.2% to JPY 3,529 per sq m. Over the year, however, rents maintained growth of 2.2%. Whilst the submarket remains the second least expensive in the 23W, its mild growth in concert with the declines seen in the broader market has brought it closer to the 23W average. Growth in one of its constituents, Itabashi, was partially marked, with rents 4.2% higher compared to the previous year.
Rents in the Outer East experienced the largest annual growth in the entire 23W of 4.4% to JPY 3,266 per sq m in Q2/2021. Moreover, it is the only submarket where every constituent saw positive annual growth, with Katsushika and Adachi posting an impressive rental surge of 5.7% and 5.0% respectively. Even after this, however, the submarket continues to be the least expensive submarket. Over the quarter, although rents declined across the board, it is worth noting that the 1.8% contraction in rents comes from the all-time highs set in Q1/2021.
Source Savills Research & Consultancy
GRAPH 1: Mid-market Apartment Rental Index, Q3/2008 to Q2/2021
85
90
95
100
105
110
115
Q3 Q1
Q3 Q1
Q3 Q1
Q3 Q1
Q3 Q1
Q3 Q1
Q3 Q1
Q3 Q1
Q3 Q1
Q3 Q1
Q3 Q1
Q3 Q1
Q3 Q1
08 09 10 11 12 13 14 15 16 17 18 19 20 21
RE
NTA
L IN
DE
X, Q
3/20
08
= 1
00
Tokyo 23 ward averageCentral five wards4 period Mov. Avg. (Tokyo 23 wards)4 period Mov. Avg. (Central five wards)
Q2
Q2
Residential Leasing
4savills.co.jp/insight-and-opinion/
in the C5W as a whole. Historically, these units are the most popular amongst single offi ce workers and university students, with interest particularly high during the spring season where many of this demographic move to Tokyo, although there were admittedly fewer people moving to the capital this year compared to previous years.
The two larger bands of 30-45 sq m and 45-60 sq m saw a decline of 2.9% and 1.8% respectively. Despite the downturn seen this quarter, average rents for these two bands are still higher than the levels seen two years ago. Indeed, the landscape has noticeably changed since then with the pandemic boosting demand for larger units that are better able to accommodate remote work, and more time at home in general. This transition in preference is particularly evident when looking at the average size of available units on the market – the average size of rentable units has decreased from around 32 sq m in Q2/2020 to below 30 sq m this quarter, with the total number of available listings signifi cantly increasing. These observations suggest that smaller units are less in demand and have seen their popularity dwindle. Going forward, larger units are likely to remain in vogue as fl exible work policies become entrenched in working culture, at least for some people.
DEMOGRAPHIC ANALYSIS OF TOKYOMuch has been observed in Tokyo since the onset of the pandemic one year ago. From the escalation of COVID-19 cases resulting in multiple state of emergencies and the increased adoption of remote work measures, right through to the K-shaped recovery of the economy, these changes have infl uenced the movement of people in Tokyo and have played a large part in shaping the demographics of the prefecture. The landscape of the residential market has markedly changed as a result.
From its peak of 14 million seen in May 2020, Tokyo’s population has decreased by around 40,000 residents. Initially, the root of this decline was the decrease in the foreign resident population. However, this was then followed by a similar outfl ow of the Japanese population between September 2020 and March 2021. While the population did see an increase during April and May 2021, the peak moving season in Japan, the number of people moving into the prefecture was less than half of the levels seen in 2019 and 2020. As such, the 23W is unlikely to see any further large increases in its population this year, and this may have an impact on the overall demand in the residential sector. All that said, this decline was not evenly spread throughout the prefecture (Map 2). Specifi cally, while a majority of the 23W saw its population decline, many cities to
GRAPH 6: Movement of Japanese Population vs Foreign Resident Population in Tokyo Prefecture, January 2019 to May 2021
-20,000
-10,000
0
10,000
20,000
30,000
40,000
50,000
Jan
Feb Mar
Ap
r
May Jun
Jul
Aug Sep Oct
No
v
Dec
CH
AN
GE
IN N
UM
BE
R O
F P
EO
PLE
2019 Japanese 2019 Foreign Residents2020 Japanese 2020 Foreign Residents2021 Japanese 2021 Foreign Residents
Source : Tokyo Metropolitan Government, Savills Research & Consultancy* These population changes do not include natural attrition (new
births and deaths).
OCCUPANCY RATESNaturally, since the onset of the pandemic, average occupancy rates in the 23W have declined from the all-time highs seen in Q1/2020. Looking back, having reached the lowest point since 2014 in Q4/2020, average occupancy rates in the 23W showed signs of recovery in Q1/2021, driven by net positive migration into the region. This optimism appears to have been short-lived, however, with rates in Q2/2021 decreasing by 0.8ppts to a new low of 95.4% – a level not seen since 2010. A similar dynamic has also played out in the C5W. To wit, occupancy levels in central areas, having perked up somewhat in Q1/2021, fell to new lows this quarter, contracting 1.3ppts to 94.3%.
Occupancy levels also fell in every other submarket in the rest of the 23W over the quarter with a similarly temporal tightening in March followed by a deterioration in April and May. The number of people moving into Tokyo during this period has halved compared to previous years, and the infl ow of new residents was not enough to counterbalance the outfl ow, hence reducing the demand for housing in the region. Furthermore, the prolonged state of emergency has likely caused residents to forego the renewal of their leases or take the opportunity to move somewhere else. Considering the current situation, it is clear that the 23W has lost some of its shine, partly as a result of the higher prevalence of remote work policies in Tokyo. In truth, the occupancy rate in the 23W may take time to recover if the pandemic, and the subsequent uptake in remote work policies, linger. That said, the accelerated pace of vaccinations in Japan should further fuel the optimism that a post-pandemic era should be swiftly approaching.
RENTS BY UNIT SIZETokyo’s rental market is principally made up of compact single-occupier units, typically less than 45 sq m (13.6 tsubo) in size. Such units can often make up as much as 75% or more of the 23W area’s rental listings. Unlike other major global cities such as London and New York, house or apartment sharing does not form a major segment of the rental market. As a result, there is a large, stable market for small- to mid-sized units.
Condos and apartments measuring 15-30 sq m account for the vast majority of available units in the C5W. Having previously warranted a clear premium over their larger counterparts when looking at rents per sq m, since 2020, things have reversed. Nonetheless, no size band was immune from the downtrend in rents this quarter. Looking closely at each size band, the smallest group saw a decline of 2.0% QoQ which was slightly higher than the average change seen
GRAPH 5: Rents by Unit Size, C5W,Q1/2014 to Q2/2021
Source Savills Research & Consultancy
3,800
4,000
4,200
4,400
4,600
4,800
5,000
5,200
Q1
Q3 Q1
Q3 Q1
Q3 Q1
Q3 Q1
Q3 Q1
Q3 Q1
Q3 Q1
2014 2015 2016 2017 2018 2019 2020 2021
JPY
/ S
Q M
/ M
ON
TH
15-30 sq m 30-45 sq m 45-60 sq m
GRAPH 4: Average Occupancy for J-REIT Residential Assets, Q1/2016 to Q2/2021*
92%
94%
96%
98%
100%
Q1
Q2
Q3
Q4 Q1
Q2
Q3
Q4 Q1
Q2
Q3
Q4 Q1
Q2
Q3
Q4 Q1
Q2
Q3
Q4 Q1
Q2
2016 2017 2018 2019 2020 2021
23-ward average Central 5 wardsSouth North & WestEast
Source Savills Research & Consultancy based on publicly disclosed J-REIT property data (Advance Residence, Nippon Accommodation
Fund, and Comforia Residential REIT)*Q2/2021 is as of May 2021
Q2
Residential Leasing
5savills.co.jp/insight-and-opinion/
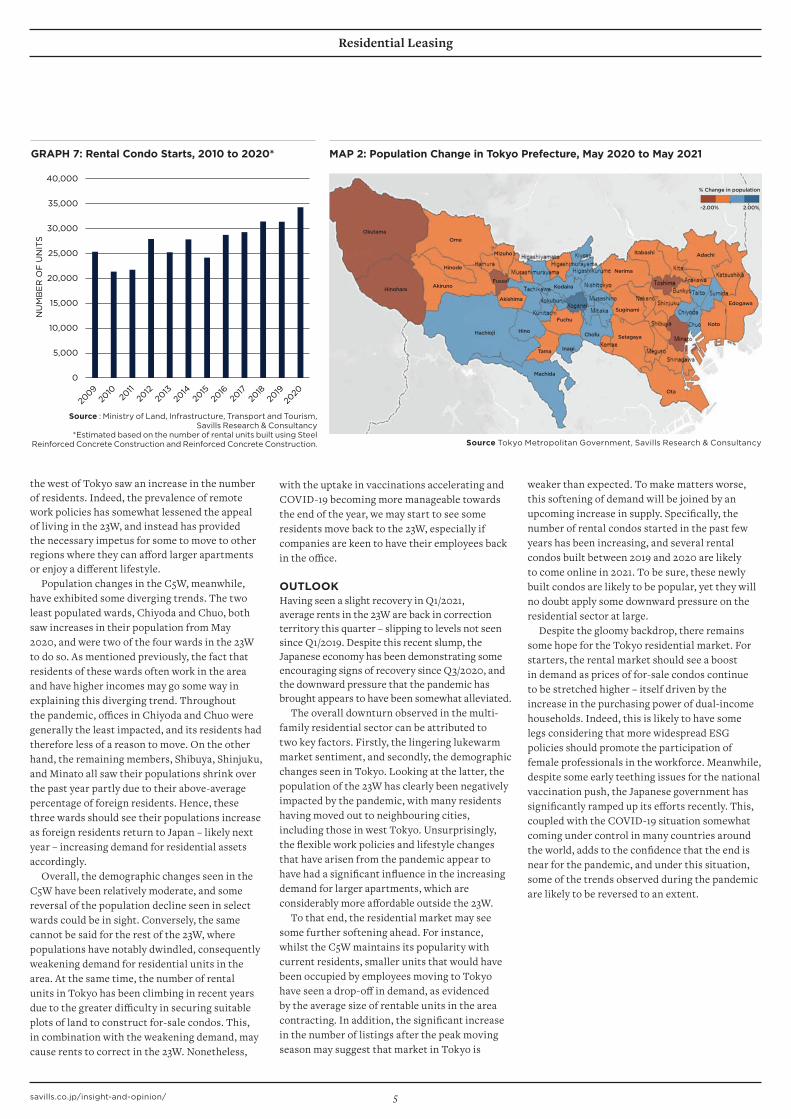
the west of Tokyo saw an increase in the number of residents. Indeed, the prevalence of remote work policies has somewhat lessened the appeal of living in the 23W, and instead has provided the necessary impetus for some to move to other regions where they can aff ord larger apartments or enjoy a diff erent lifestyle.
Population changes in the C5W, meanwhile, have exhibited some diverging trends. The two least populated wards, Chiyoda and Chuo, both saw increases in their population from May 2020, and were two of the four wards in the 23W to do so. As mentioned previously, the fact that residents of these wards often work in the area and have higher incomes may go some way in explaining this diverging trend. Throughout the pandemic, offi ces in Chiyoda and Chuo were generally the least impacted, and its residents had therefore less of a reason to move. On the other hand, the remaining members, Shibuya, Shinjuku, and Minato all saw their populations shrink over the past year partly due to their above-average percentage of foreign residents. Hence, these three wards should see their populations increase as foreign residents return to Japan – likely next year – increasing demand for residential assets accordingly.
Overall, the demographic changes seen in the C5W have been relatively moderate, and some reversal of the population decline seen in select wards could be in sight. Conversely, the same cannot be said for the rest of the 23W, where populations have notably dwindled, consequently weakening demand for residential units in the area. At the same time, the number of rental units in Tokyo has been climbing in recent years due to the greater diffi culty in securing suitable plots of land to construct for-sale condos. This, in combination with the weakening demand, may cause rents to correct in the 23W. Nonetheless,
weaker than expected. To make matters worse, this softening of demand will be joined by an upcoming increase in supply. Specifi cally, the number of rental condos started in the past few years has been increasing, and several rental condos built between 2019 and 2020 are likely to come online in 2021. To be sure, these newly built condos are likely to be popular, yet they will no doubt apply some downward pressure on the residential sector at large.
Despite the gloomy backdrop, there remains some hope for the Tokyo residential market. For starters, the rental market should see a boost in demand as prices of for-sale condos continue to be stretched higher – itself driven by the increase in the purchasing power of dual-income households. Indeed, this is likely to have some legs considering that more widespread ESG policies should promote the participation of female professionals in the workforce. Meanwhile, despite some early teething issues for the national vaccination push, the Japanese government has signifi cantly ramped up its eff orts recently. This, coupled with the COVID-19 situation somewhat coming under control in many countries around the world, adds to the confi dence that the end is near for the pandemic, and under this situation, some of the trends observed during the pandemic are likely to be reversed to an extent.
MAP 2: Population Change in Tokyo Prefecture, May 2020 to May 2021
Source Tokyo Metropolitan Government, Savills Research & Consultancy
2.00%
% Change in population
-2.00%
GRAPH 7: Rental Condo Starts, 2010 to 2020*
0
5,000
10,000
15,000
20,000
25,000
30,000
35,000
40,000
NU
MB
ER
OF
UN
ITS
Source : Ministry of Land, Infrastructure, Transport and Tourism, Savills Research & Consultancy
*Estimated based on the number of rental units built using Steel Reinforced Concrete Construction and Reinforced Concrete Construction.
with the uptake in vaccinations accelerating and COVID-19 becoming more manageable towards the end of the year, we may start to see some residents move back to the 23W, especially if companies are keen to have their employees back in the offi ce.
OUTLOOKHaving seen a slight recovery in Q1/2021, average rents in the 23W are back in correction territory this quarter – slipping to levels not seen since Q1/2019. Despite this recent slump, the Japanese economy has been demonstrating some encouraging signs of recovery since Q3/2020, and the downward pressure that the pandemic has brought appears to have been somewhat alleviated.
The overall downturn observed in the multi-family residential sector can be attributed to two key factors. Firstly, the lingering lukewarm market sentiment, and secondly, the demographic changes seen in Tokyo. Looking at the latter, the population of the 23W has clearly been negatively impacted by the pandemic, with many residents having moved out to neighbouring cities, including those in west Tokyo. Unsurprisingly, the fl exible work policies and lifestyle changes that have arisen from the pandemic appear to have had a signifi cant infl uence in the increasing demand for larger apartments, which are considerably more aff ordable outside the 23W.
To that end, the residential market may see some further softening ahead. For instance, whilst the C5W maintains its popularity with current residents, smaller units that would have been occupied by employees moving to Tokyo have seen a drop-off in demand, as evidenced by the average size of rentable units in the area contracting. In addition, the signifi cant increase in the number of listings after the peak moving season may suggest that market in Tokyo is


![SMD MPI29-JUL-2019 · 2019. 7. 29. · s m b leasing [x] palm garden hotl s m b leasing lighthouse hotel tokyo cement pegasus hotels tokyo cement [x] beruwala resorts slt eastern](https://static.documents.pub/doc/80x56/60db05f7732f6f1565374296/smd-mpi29-jul-2019-2019-7-29-s-m-b-leasing-x-palm-garden-hotl-s-m-b-leasing.jpg)


