1 1 Tools for Evaluating and Tools for Evaluating and Optimizing Ground Water Optimizing Ground Water Monitoring Networks Monitoring Networks U.S. Environmental Protection Agency U.S. Army Corps of Engineers September 24, 2008 Purpose of presentation Introduce concept of long-term monitoring optimization (LTMO) approaches, benefits, & pitfalls Provide case study example Provide technical resources information Discuss regulatory role Consolidated from 1 day course
Transcript
1
1
Tools for Evaluating and Tools for Evaluating and Optimizing Ground Water Optimizing Ground Water
Monitoring NetworksMonitoring Networks
U.S. Environmental Protection AgencyU.S. Army Corps of Engineers
– press *6 to mute #6 to unmute your lines at anytime
• Do NOT put this call on hold
• Questions can be submitted throughout the presentation using the ? icon on the top of the screen. Oral questions will be taken during the 2 question and answer sessions.
• Also use the ? Icon to report technical problems
• You can move forward/backward in the slides by using the arrow buttons
3
3
Meet the Presenters• Kathy Yager, Environmental Engineer
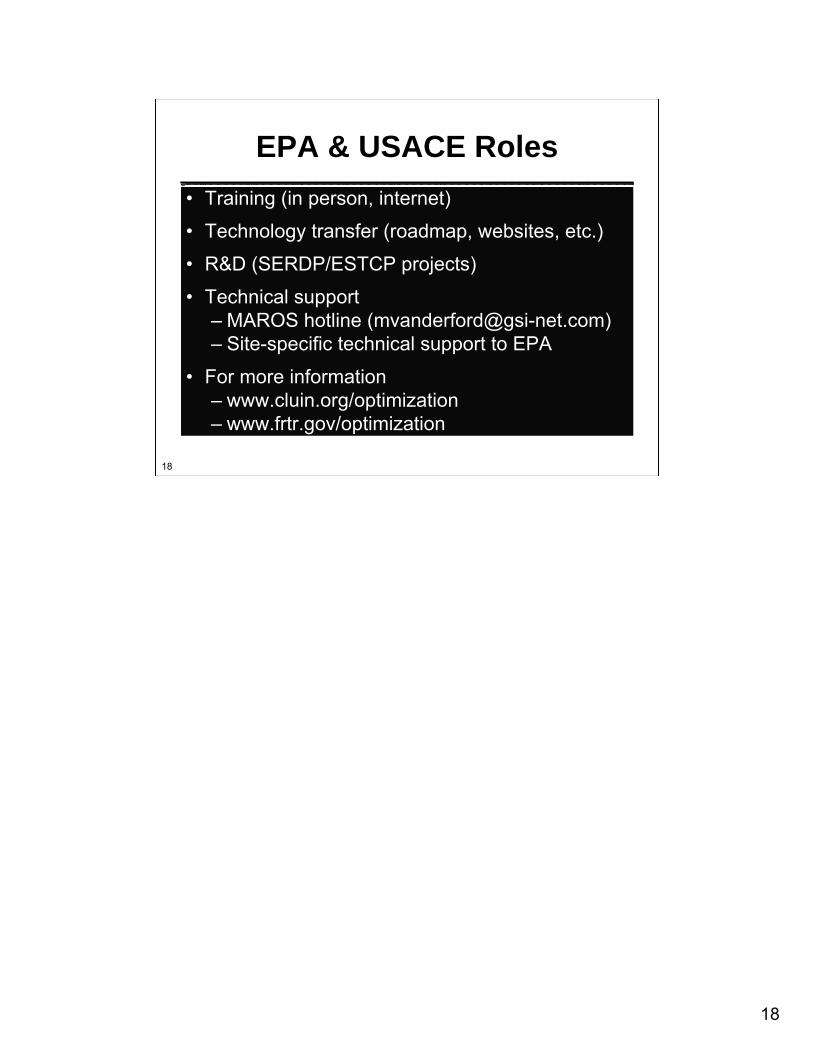
• Mindy Vanderford, Ph.D. GSI Environmental, Inc. [email protected] (713)522-6300
• Dave Becker, Geologist US Army Corps of Engineers (USACE) Environmental and Munitions Center of Expertise [email protected] (402)697-2655
4
4
Seminar Topics
• Definition and description of Long-Term Monitoring Optimization (LTMO)
• EPA’s and USACE’s roles in LTMO training
• Appropriate timing for LTMO
• Data needs and available methods
• Regulatory and technical reviews
• Case study example (Frontier Hard Chrome)
• Major obstacles to LTMO
• Links to additional resources
5
5
Motivation for LTMO• Long-term monitoring is a growing,
persistent, and costly obligation for government agencies and private parties
– Feds spend over $100 million each year on monitoring -typically $10Ks - $100Ks/site
– Private parties likely spend more
6
6
Motivation for LTMO, cont.
• Many LTM networks not evaluated carefully since remedy implemented
• Conditions evolve over time (for better or worse)
• Periodic evaluations necessary and beneficial
7
7
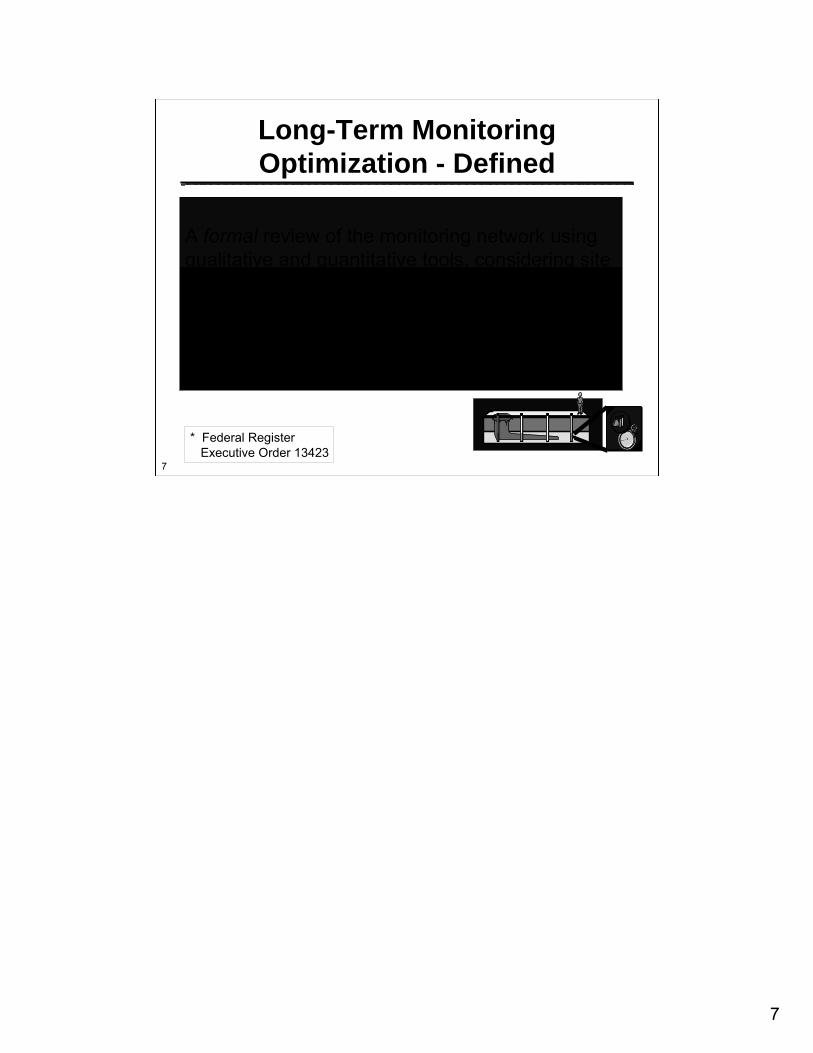
Long-Term Monitoring Optimization - Defined
A formal review of the monitoring network using qualitative and quantitative tools, considering site management goals, in order to achieve an “environmentally, economically and fiscally sound, integrated, continuously improving, efficient and sustainable”* monitoring program.
* Federal RegisterExecutive Order 13423
8
8
LTMO Overview
• Confirms monitoring program matches monitoring needs
• Includes evaluation of– Sampling locations, sampling frequencies– Sampling and analytical methods– Data management
• Two primary approaches– Qualitative– Quantitative
9
9
LTMO analysis can identify:
• Reduction in effort:• Spatially (number of wells) • Temporally (sampling frequency)
• Need for more wells – to reduce spatial uncertainty
• Potential changes to sampling & analytical methods
• Areas where the plume is moving or changing
Benefits of LTMO
Amazing
Claims!
10
10
LTMO analysis can:
• Clarify monitoring objectives by facilitating discussion among stakeholders
• Provide important data to support remedy evaluation
• Provide a monitoring program that:• Is better focused on supporting decisions• Reduces data gaps• Is less costly, conserves resources (labor, fuel, supplies)
Benefits of LTMO
Spectacular Results!
11
11
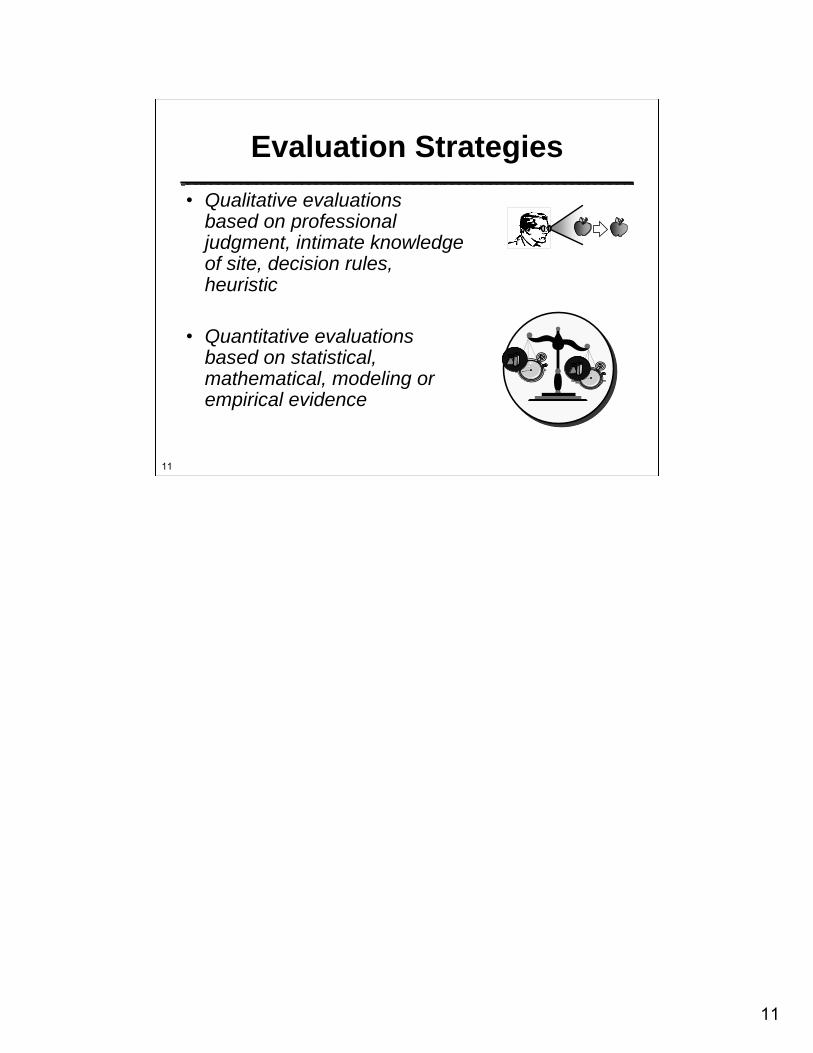
Evaluation Strategies• Qualitative evaluations
based on professional judgment, intimate knowledge of site, decision rules, heuristic
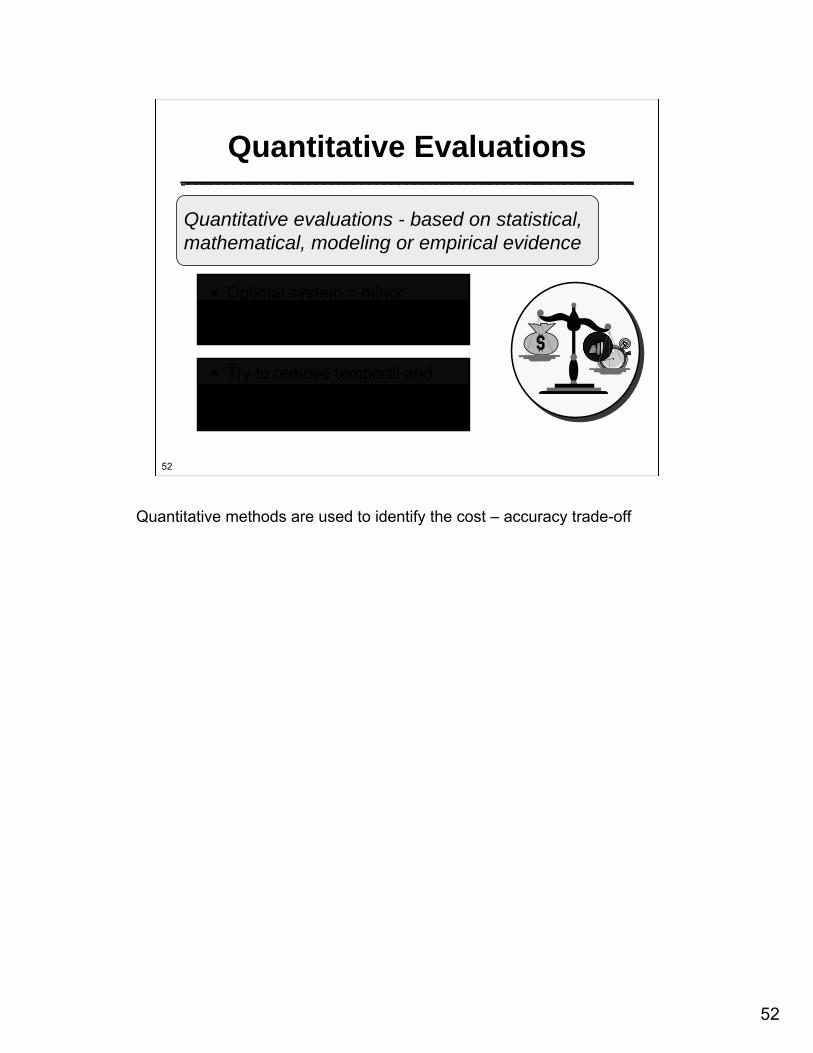
• Quantitative evaluations based on statistical, mathematical, modeling or empirical evidence
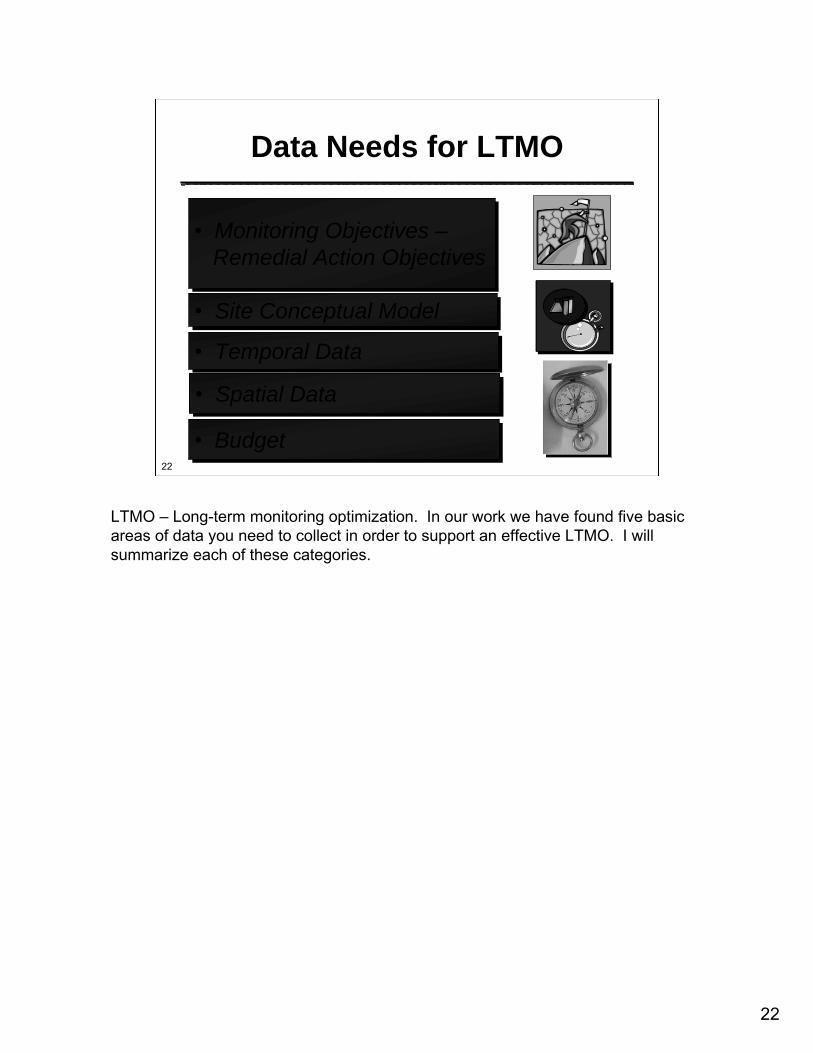
LTMO – Long-term monitoring optimization. In our work we have found five basic areas of data you need to collect in order to support an effective LTMO. I will summarize each of these categories.
23
23
LTMO ChallengesLTMO Challenges
Quantity and diversity of data high, stored in multiple locations and formatsLTMO more dependent on statistics and geostatistics
C
Time
LTMO is more dependent on time-series and spatial analysis rather than single point data. The main challenges are diversity of data, storage and management of historic data, diverse sources and formats and lack of comparability across data sets.
24
24
Sample Decision
ActionResult
Hypothesis
Why ?Why ?
Why do we take samples? Generally it follows the scientific method. Sampling is fueled by our uncertainty about the site and the need to make regulatory decisions. As uncertainty decreases and the rate of decision making is reduced, we should reduce the sampling frequency or extent.
25
25
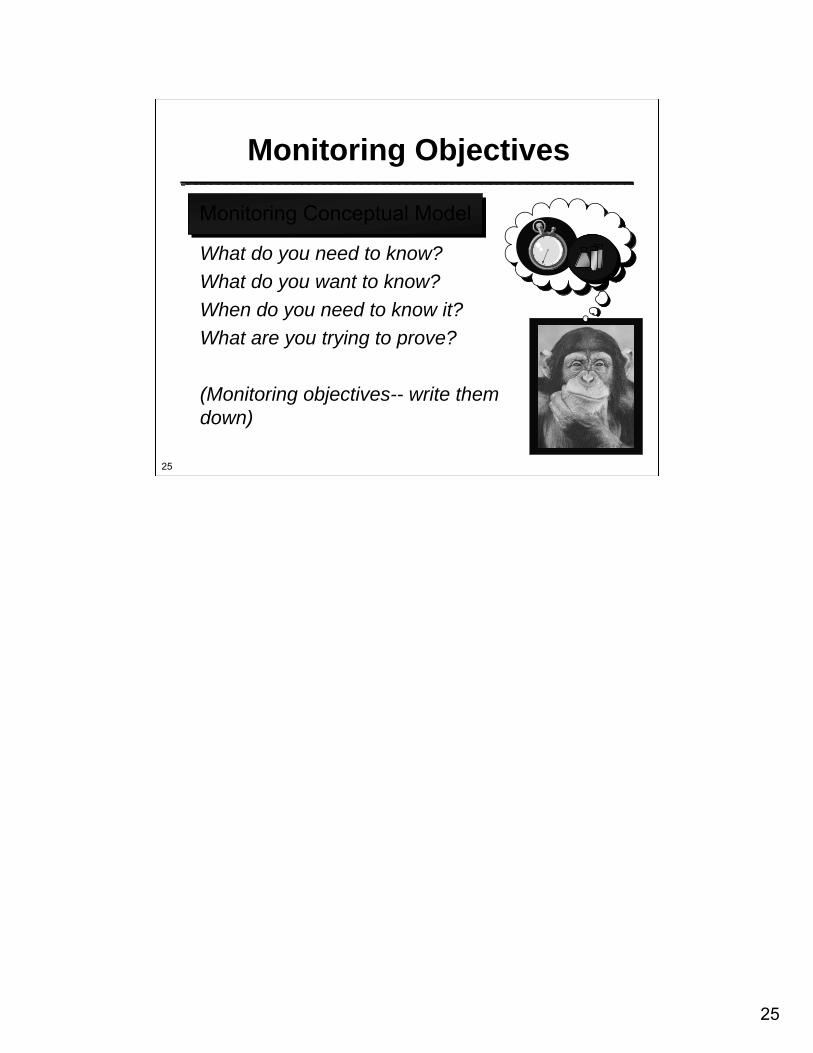
What do you need to know?What do you want to know?When do you need to know it?What are you trying to prove?
(Monitoring objectives-- write them down)
Monitoring ObjectivesMonitoring Objectives
Monitoring Conceptual Model
26
26
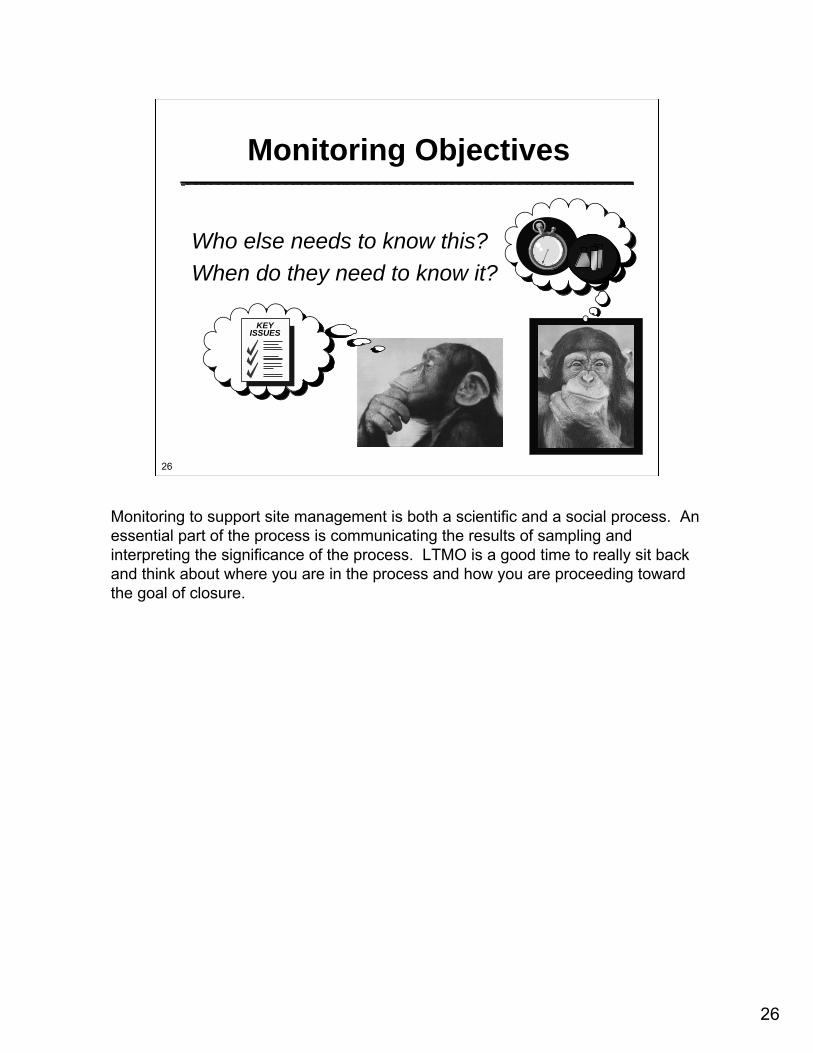
Who else needs to know this?When do they need to know it?
Monitoring ObjectivesMonitoring Objectives
KEY ISSUES
Monitoring to support site management is both a scientific and a social process. An essential part of the process is communicating the results of sampling and interpreting the significance of the process. LTMO is a good time to really sit back and think about where you are in the process and how you are proceeding toward the goal of closure.
27
27
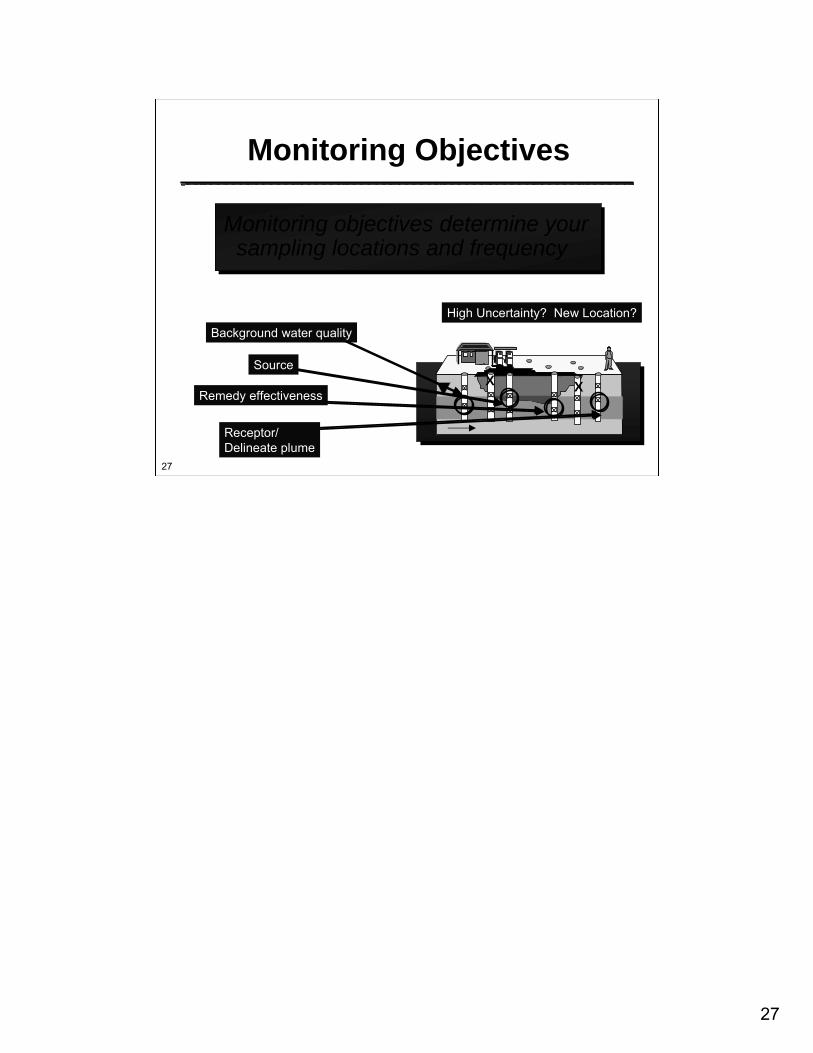
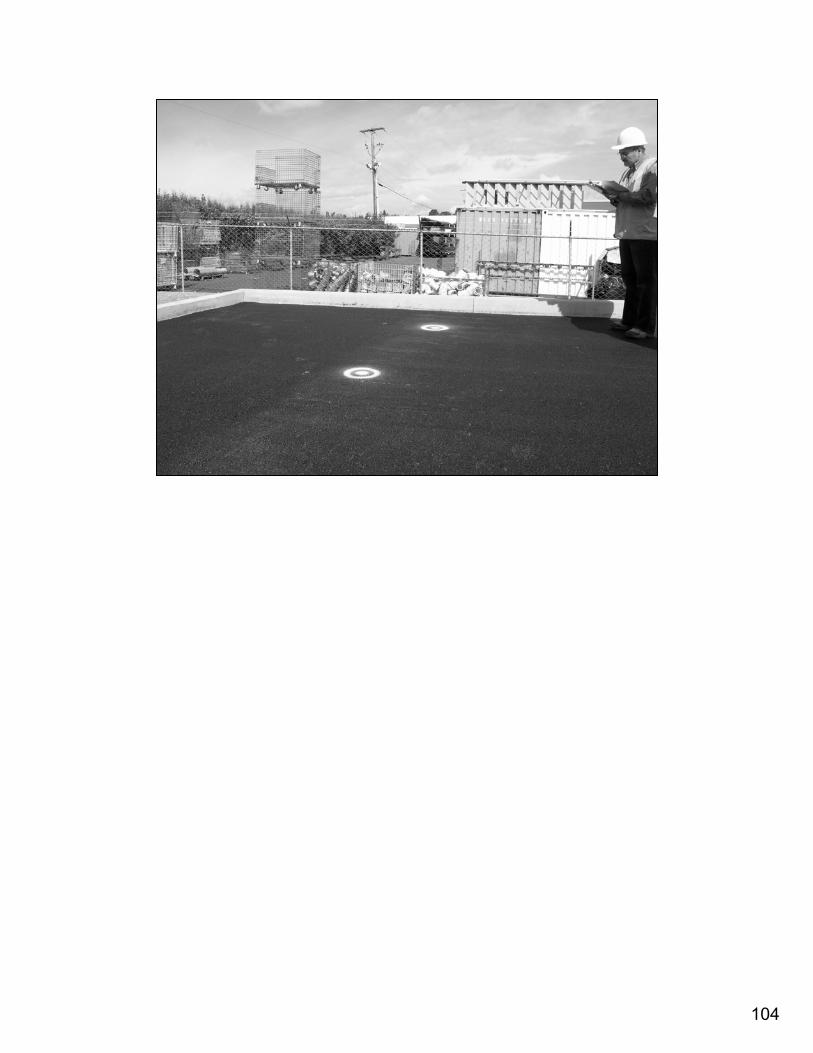
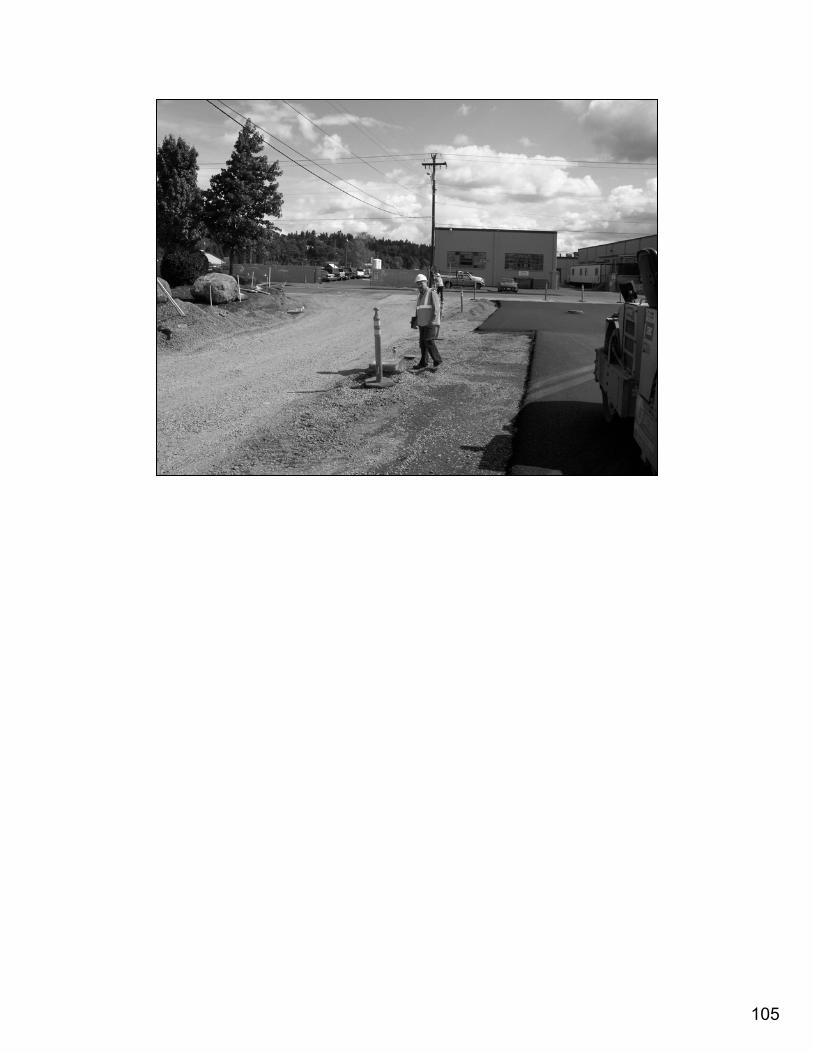
Monitoring objectives determine your sampling locations and frequency
Other meta-objectives may include Build trust between stakeholders, Collect data to support model, Support statistical analysis, Pending property redevelopment, Pending litigation?, Extreme weather events?
29
29
Scientific Management
Decision Points
500 ft plume growth:Active Remedy
Plume growthbeyond GMZ:Expand Inst. Control
ACTIVE REMEDY
Active Remedy
MonitoredNaturalAttenuation
Ground WaterManagementZone
Decision Points
Plume shrinking:Reduce pumping
Current Program
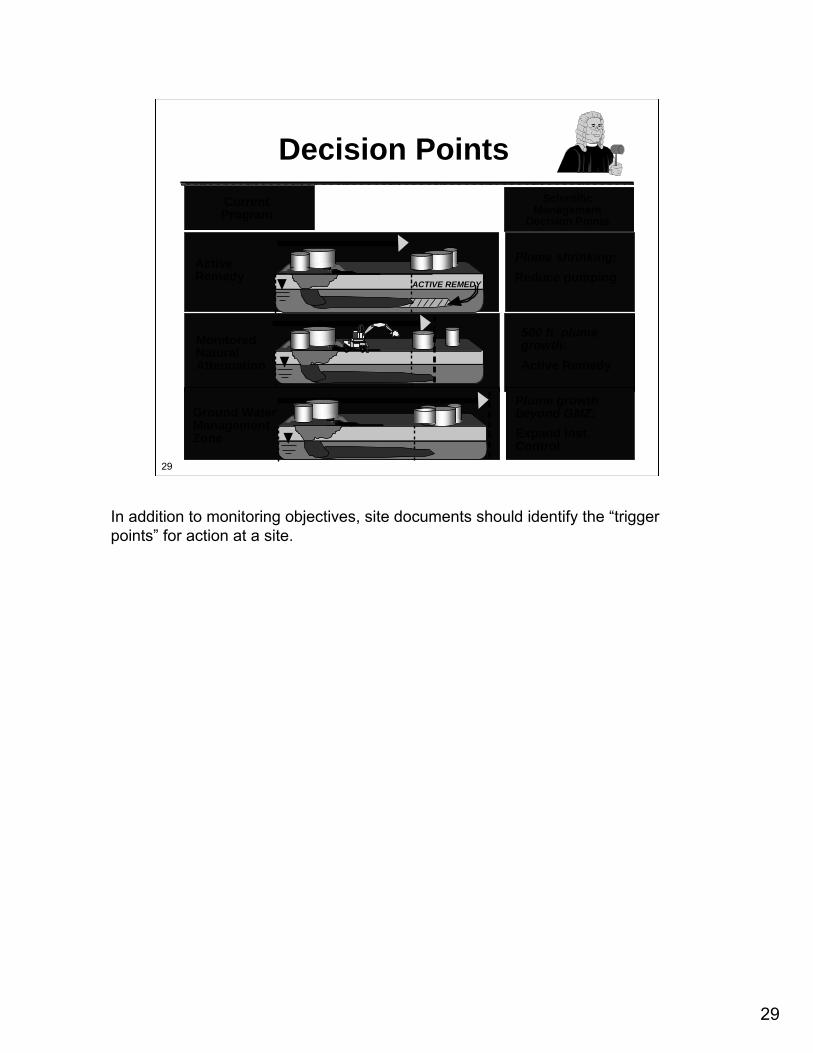
In addition to monitoring objectives, site documents should identify the “trigger points” for action at a site.
30
30
Metrics of Success
What type of data do you need to demonstrate?
Reduction in total or dissolved mass
Delineation or Low spatial uncertainty
Plume stability
Cost Distributions
0 300 400100 200
Option BOption A
Protective or Cost-effective remedy?
[C]
[Y]
[C]
[Y]
CenterEdge I
Center
Edge
t
C
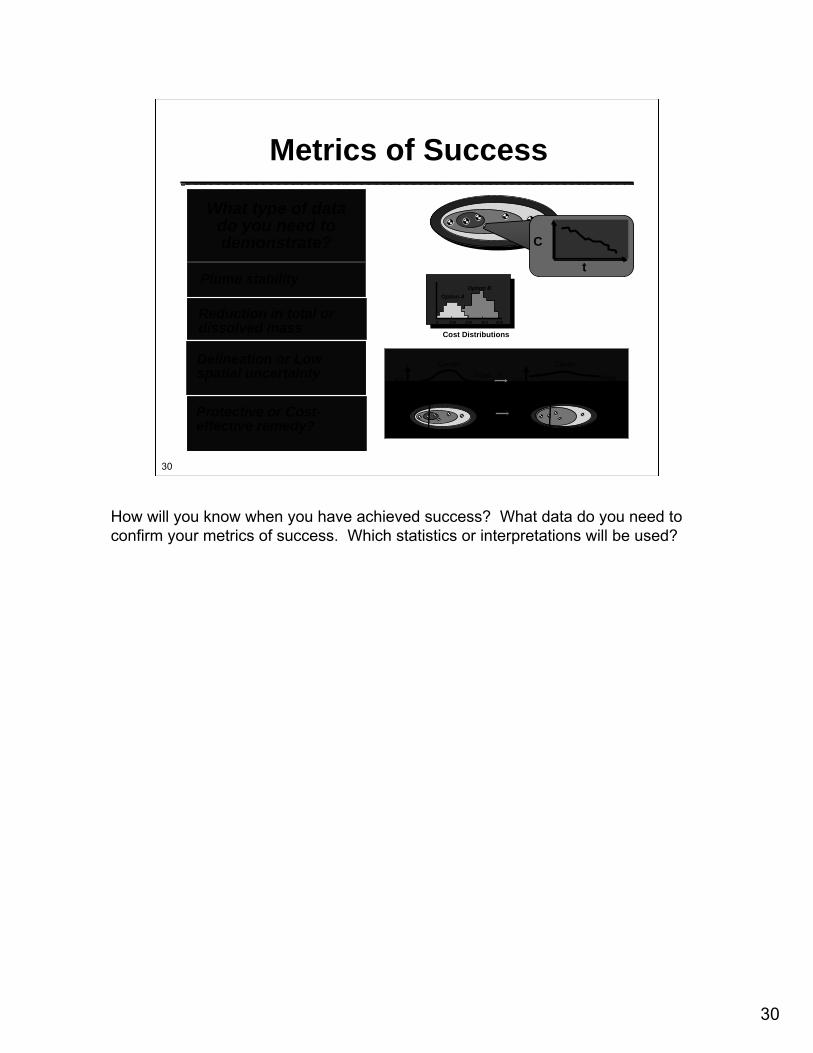
How will you know when you have achieved success? What data do you need to confirm your metrics of success. Which statistics or interpretations will be used?
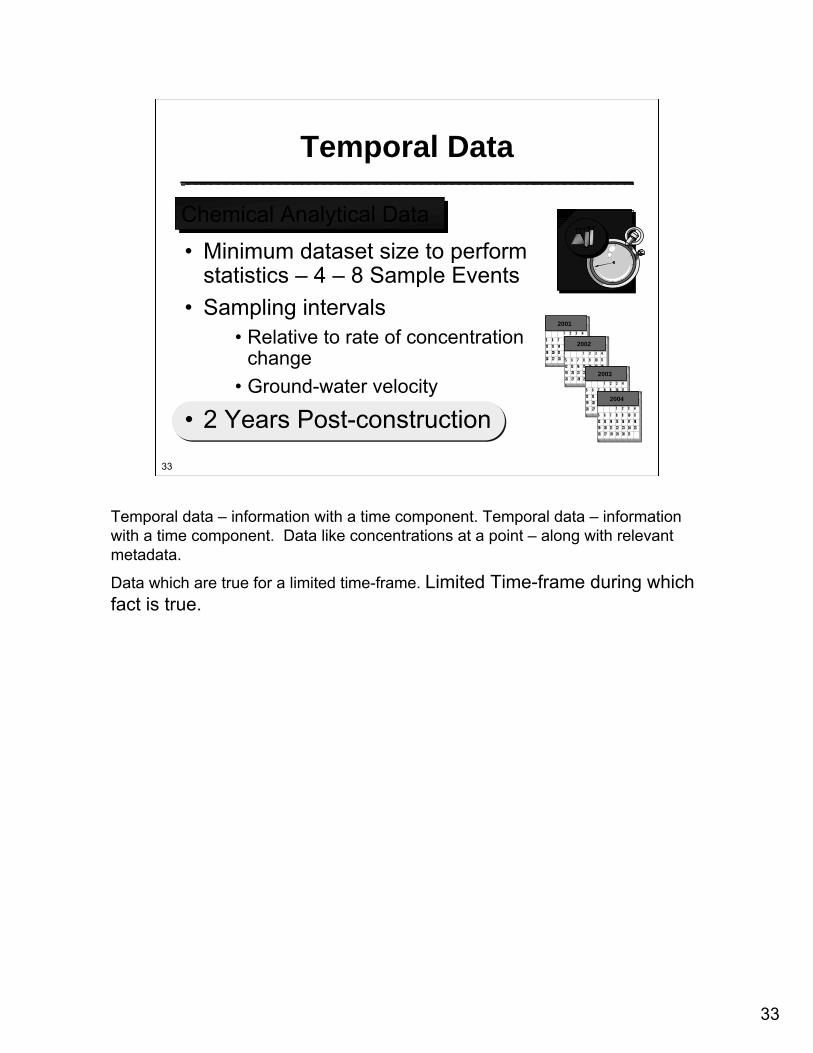
• Sampling intervals• Relative to rate of concentration
change• Ground-water velocity
• 2 Years Post-construction
2001
2002
2003
2004
Chemical Analytical Data
Temporal data – information with a time component. Temporal data – information with a time component. Data like concentrations at a point – along with relevant metadata.
Data which are true for a limited time-frame. Limited Time-frame during which fact is true.
34
34
• Consistent COC names and CAS No’s;• Full COC list;• Analytical results;• Detection Limits;• Consistent well names;• Data flags;• Sample dates;• Analytical method;
Analytical DatabaseAnalytical Database
Quality data is everyone’s responsibility
Essential Database Features
35
35
Data Look Like This
Database format is distinguished from cross-tab format. It is not pretty from a human eye perspective, but easier to manipulate in machine language.
36
36
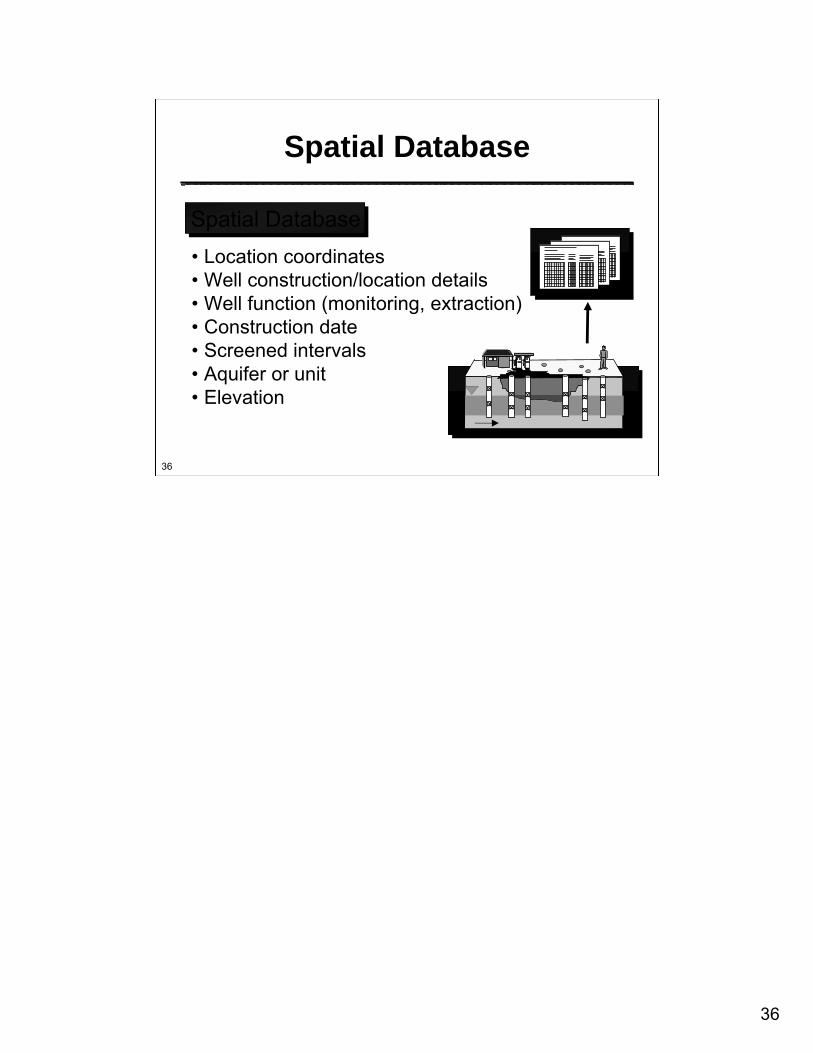
Spatial DatabaseSpatial Database
Spatial Database• Location coordinates• Well construction/location details• Well function (monitoring, extraction)• Construction date• Screened intervals• Aquifer or unit• Elevation
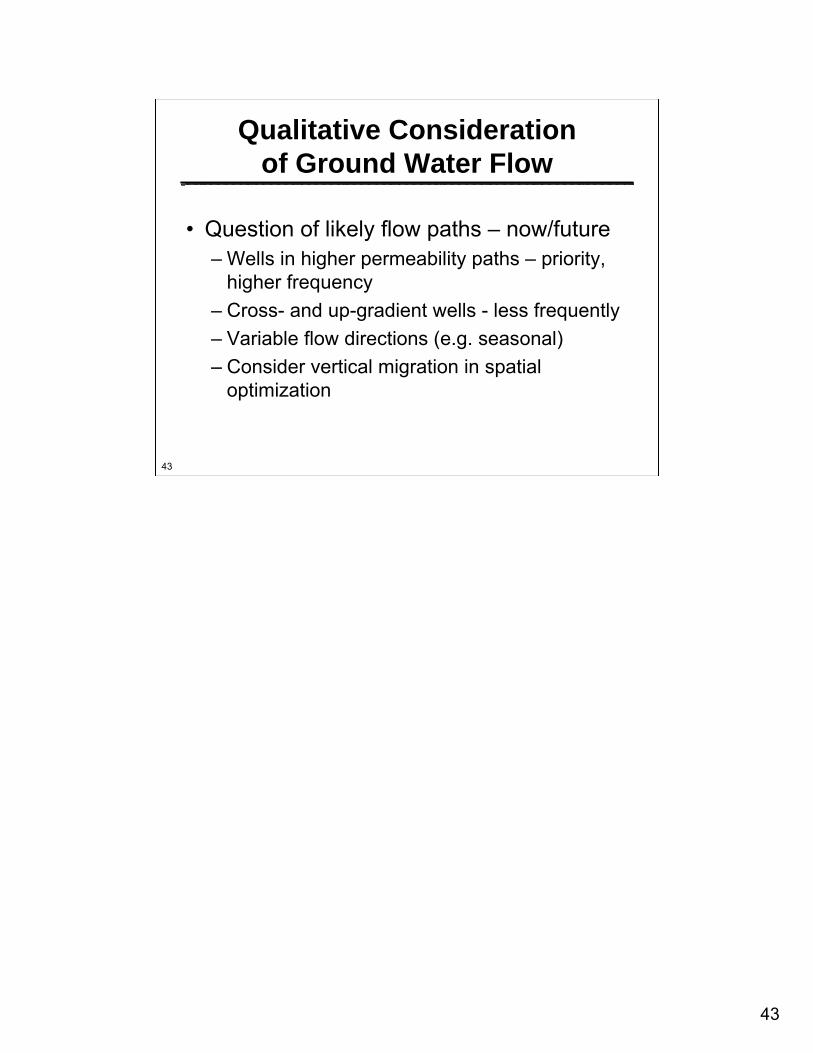
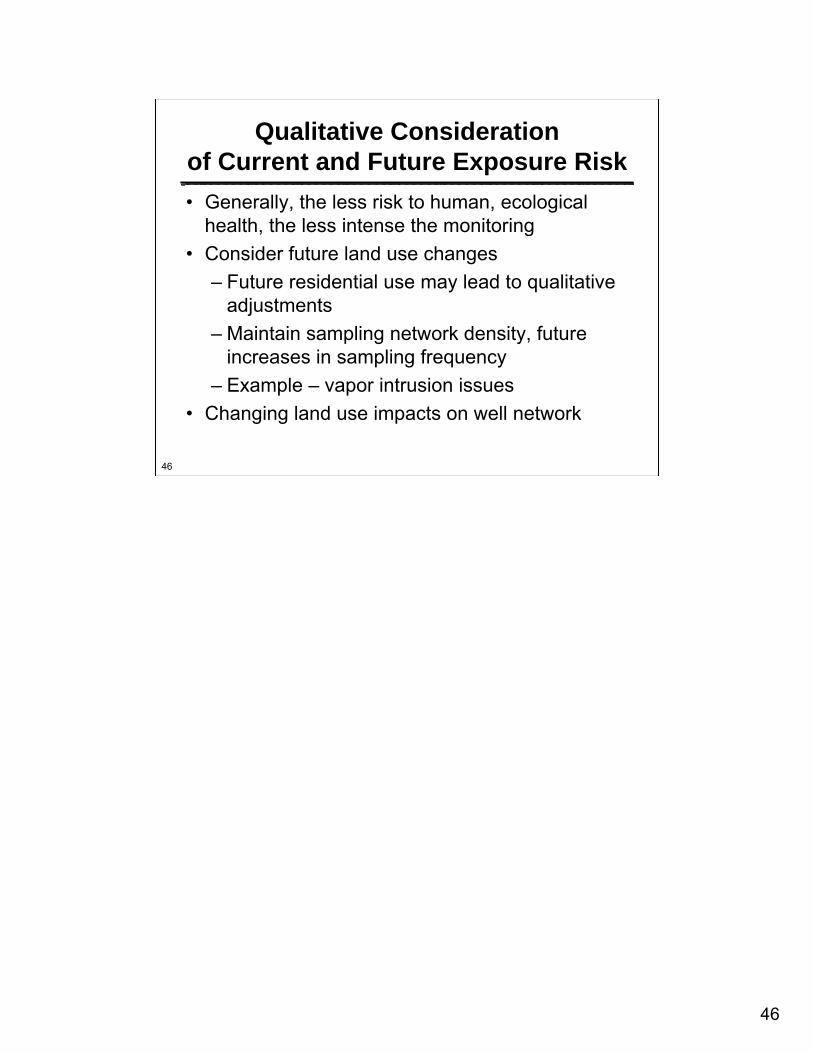
Qualitative ConsiderationQualitative Considerationof Current and Future Exposure Riskof Current and Future Exposure Risk• Generally, the less risk to human, ecological
health, the less intense the monitoring• Consider future land use changes
– Future residential use may lead to qualitative adjustments
– Maintain sampling network density, future increases in sampling frequency
– Example – vapor intrusion issues• Changing land use impacts on well network
• Related to ground water flow, risk posed by site
• Generally, the more time available to start actions, the less frequent the sampling
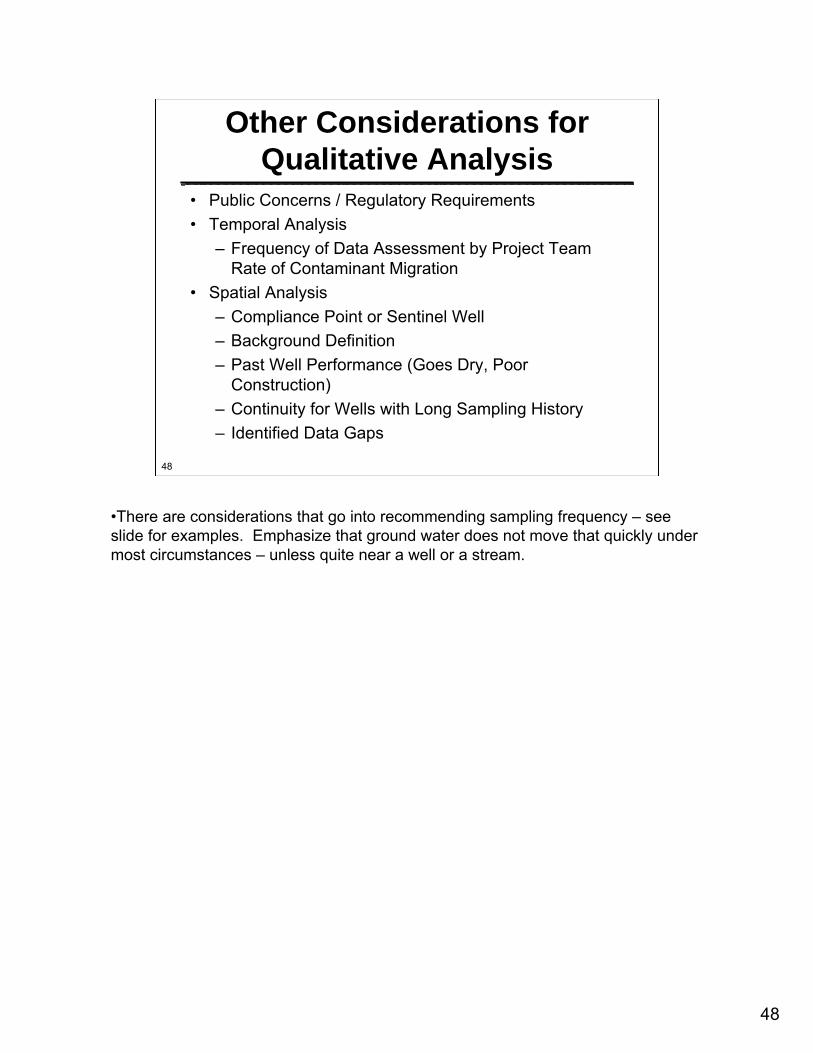
48
48
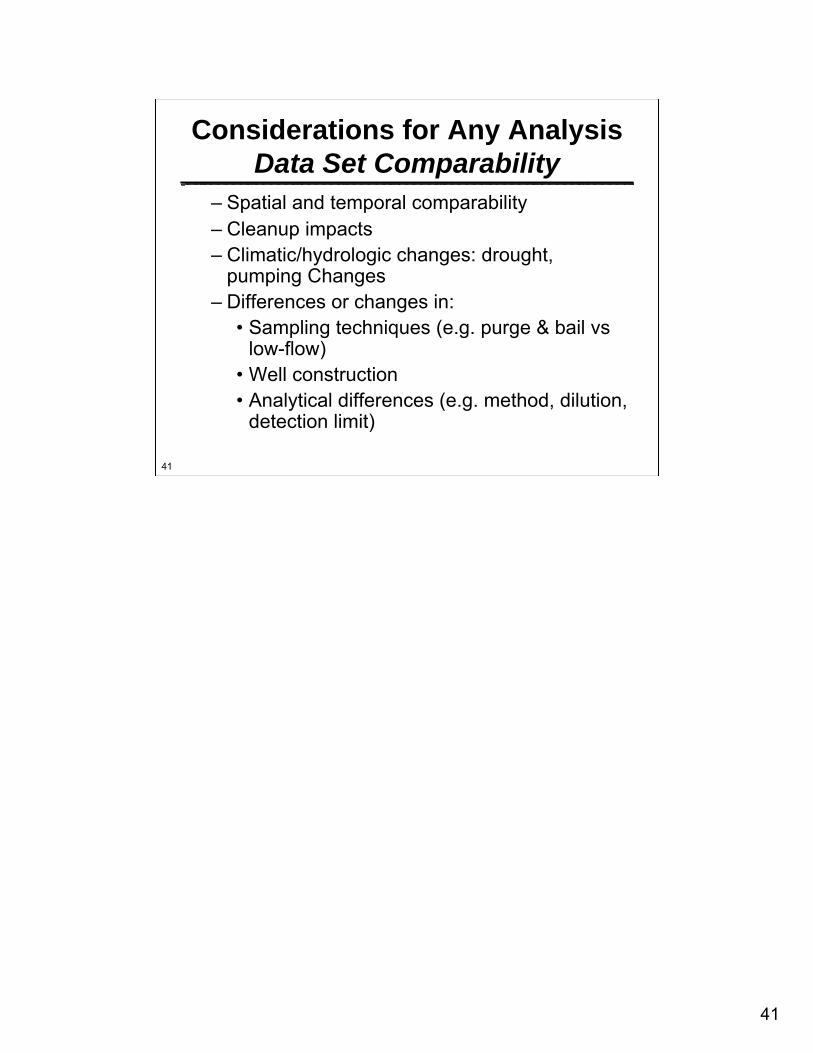
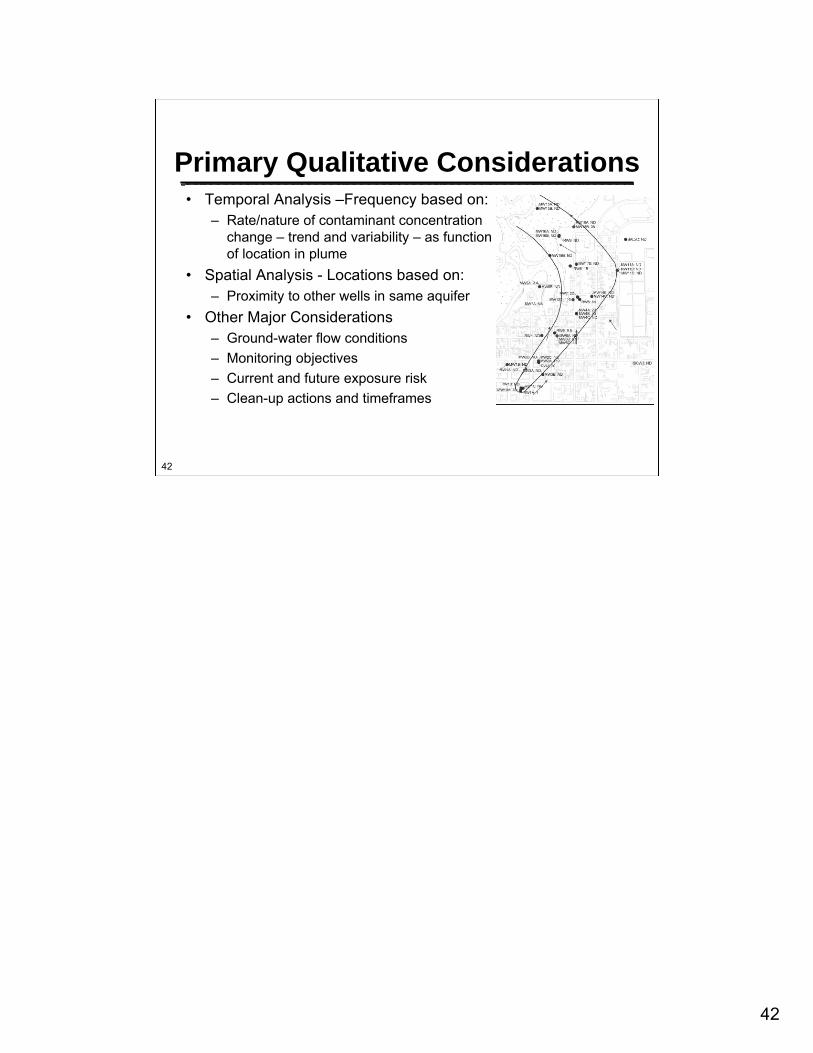
Other Considerations for Other Considerations for Qualitative AnalysisQualitative Analysis
• Public Concerns / Regulatory Requirements • Temporal Analysis
– Frequency of Data Assessment by Project Team Rate of Contaminant Migration
• Spatial Analysis– Compliance Point or Sentinel Well– Background Definition – Past Well Performance (Goes Dry, Poor
Construction)– Continuity for Wells with Long Sampling History– Identified Data Gaps
•There are considerations that go into recommending sampling frequency – see slide for examples. Emphasize that ground water does not move that quickly under most circumstances – unless quite near a well or a stream.
49
49
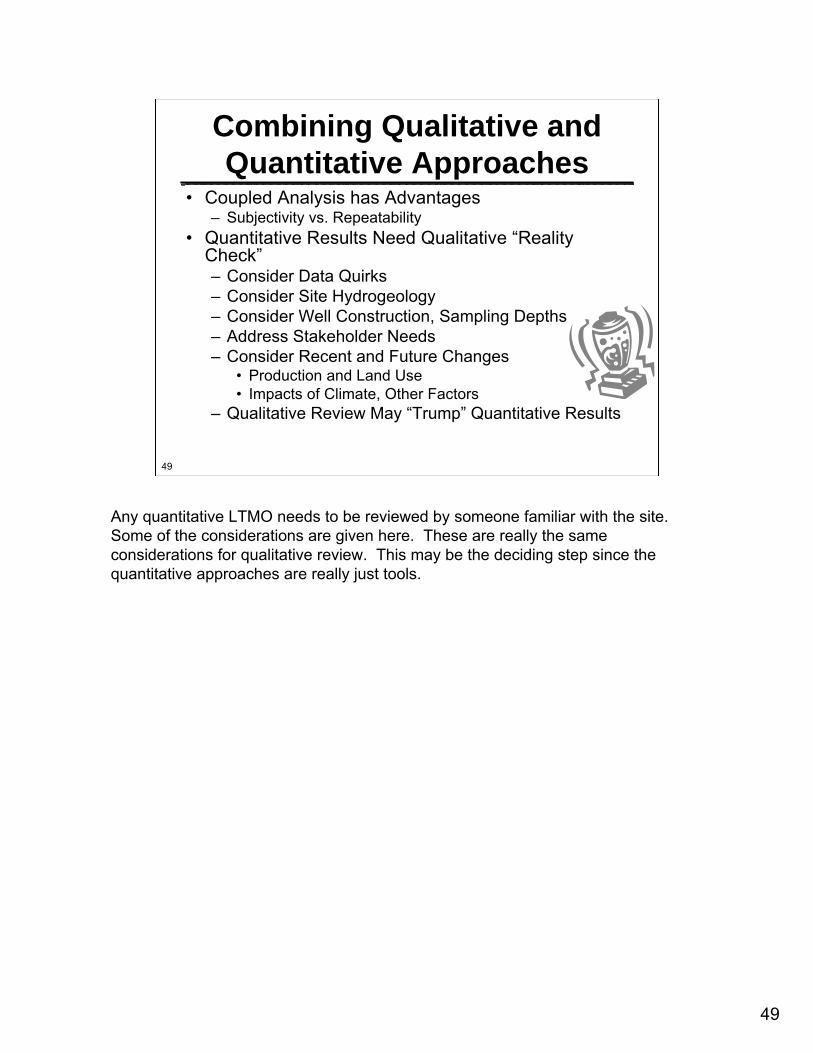
Combining Qualitative and Combining Qualitative and Quantitative ApproachesQuantitative Approaches
• Coupled Analysis has Advantages– Subjectivity vs. Repeatability
• Quantitative Results Need Qualitative “Reality Check”– Consider Data Quirks– Consider Site Hydrogeology– Consider Well Construction, Sampling Depths– Address Stakeholder Needs– Consider Recent and Future Changes
• Production and Land Use• Impacts of Climate, Other Factors
– Qualitative Review May “Trump” Quantitative Results
Any quantitative LTMO needs to be reviewed by someone familiar with the site. Some of the considerations are given here. These are really the same considerations for qualitative review. This may be the deciding step since the quantitative approaches are really just tools.
50
50
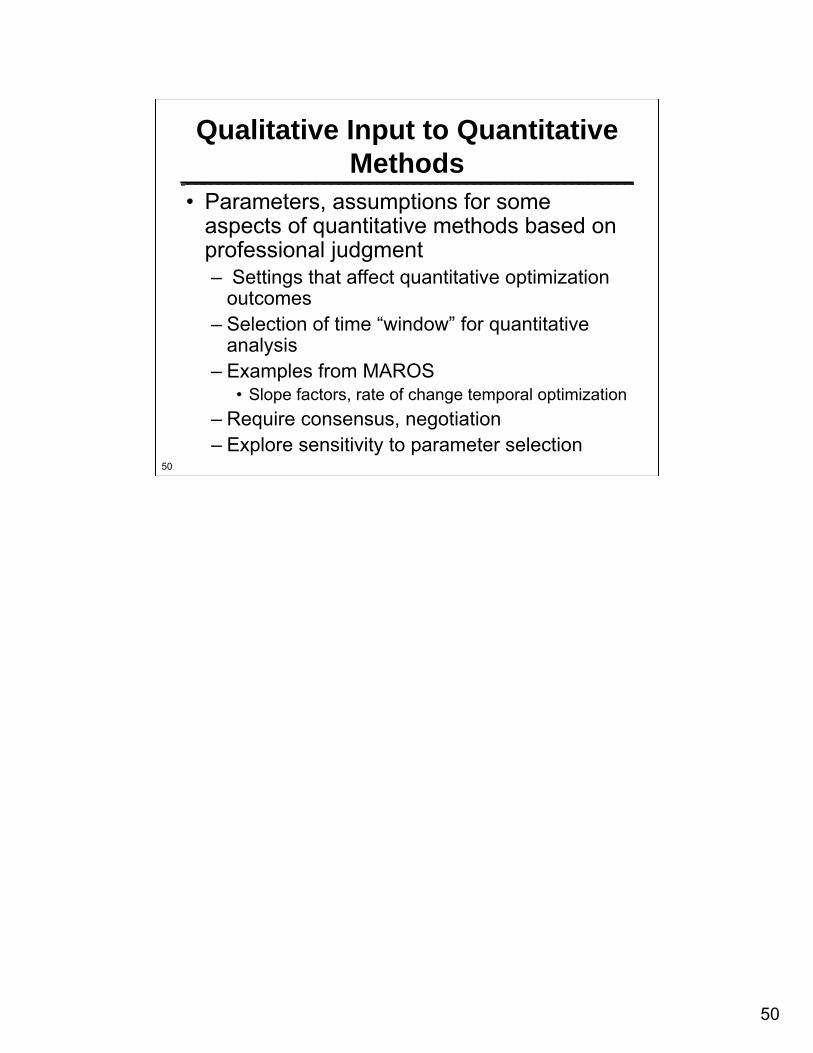
Qualitative Input to Quantitative Qualitative Input to Quantitative MethodsMethods
• Parameters, assumptions for some aspects of quantitative methods based on professional judgment– Settings that affect quantitative optimization
outcomes– Selection of time “window” for quantitative
analysis– Examples from MAROS
• Slope factors, rate of change temporal optimization– Require consensus, negotiation– Explore sensitivity to parameter selection
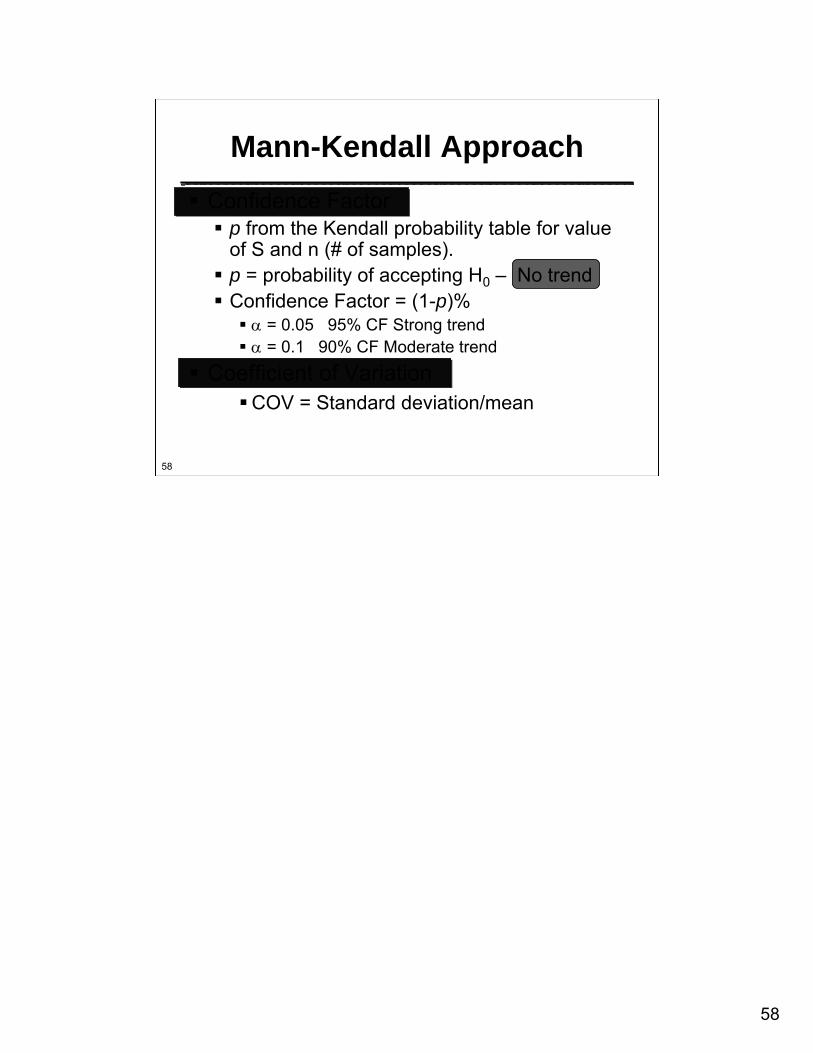
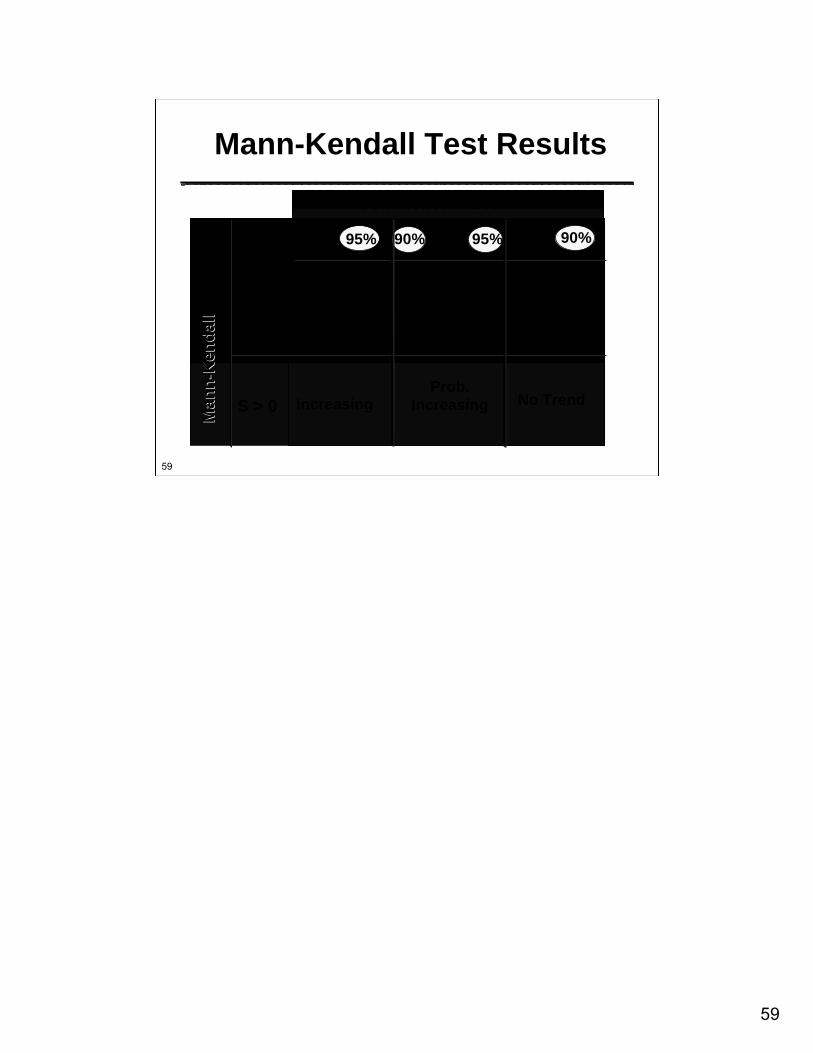
Coefficient of VariationCOV = Standard deviation/mean
59
59
90% <CF< 95%
Confidence Factor
Prob. Increasing
If COV < 1,
If COV > 1,
Man
nM
ann --
Ken
dall
Ken
dall
Stat
istic
S < 0
S > 0 Increasing
Prob. DecreasingDecreasing
No Trend
No Trend
Stable
Mann-Kendall Test Results
CF > 95% CF < 90%
60
60
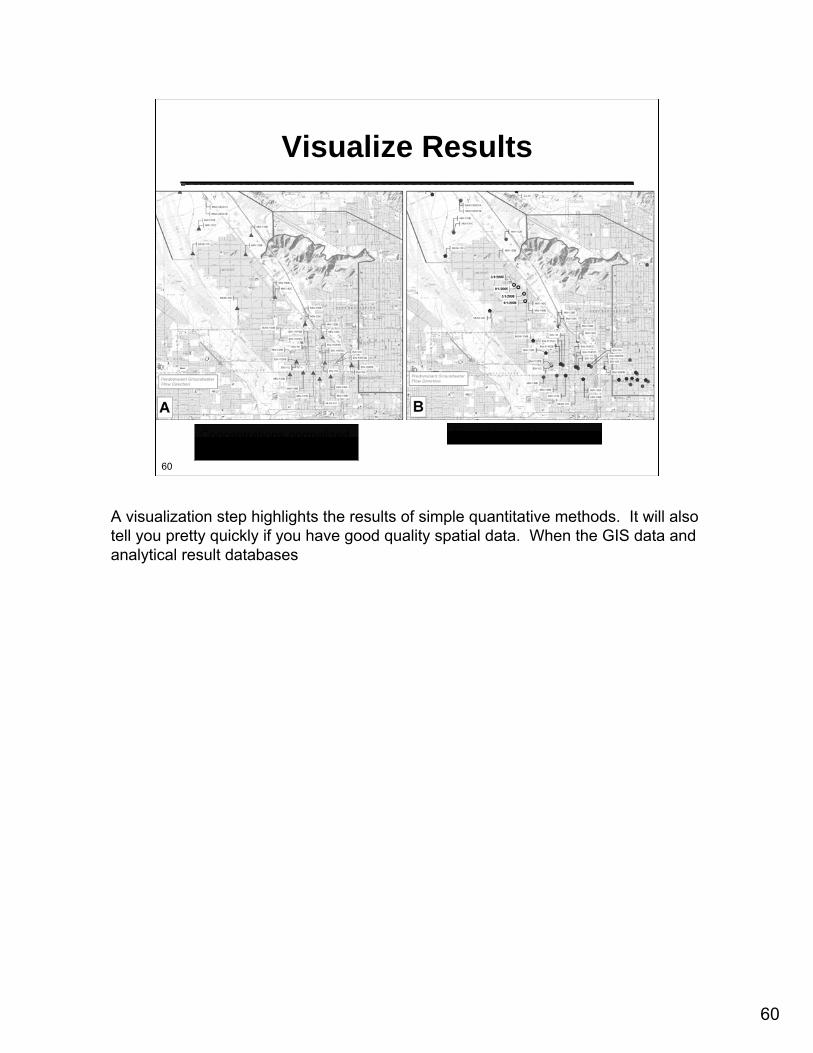
Visualize Results
Concentrations normalized by screening level
Mann-Kendall trend result
A visualization step highlights the results of simple quantitative methods. It will also tell you pretty quickly if you have good quality spatial data. When the GIS data and analytical result databases
61
61
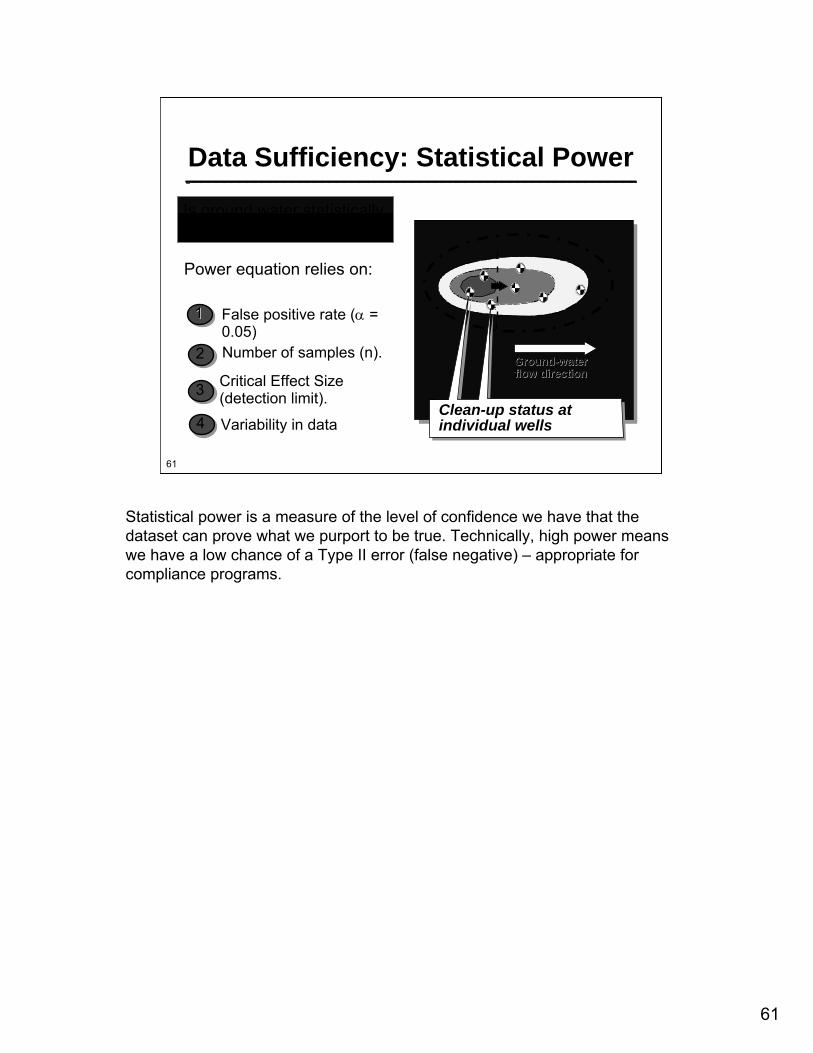
Data Sufficiency: Statistical Power
GroundGround--water water flow directionflow direction
Clean-up status at individual wells
False positive rate (α = 0.05)Number of samples (n).
Critical Effect Size (detection limit).
Variability in data4
Power equation relies on:
2
11
3
Is ground water statistically below clean-up level?
Statistical power is a measure of the level of confidence we have that the dataset can prove what we purport to be true. Technically, high power means we have a low chance of a Type II error (false negative) – appropriate for compliance programs.
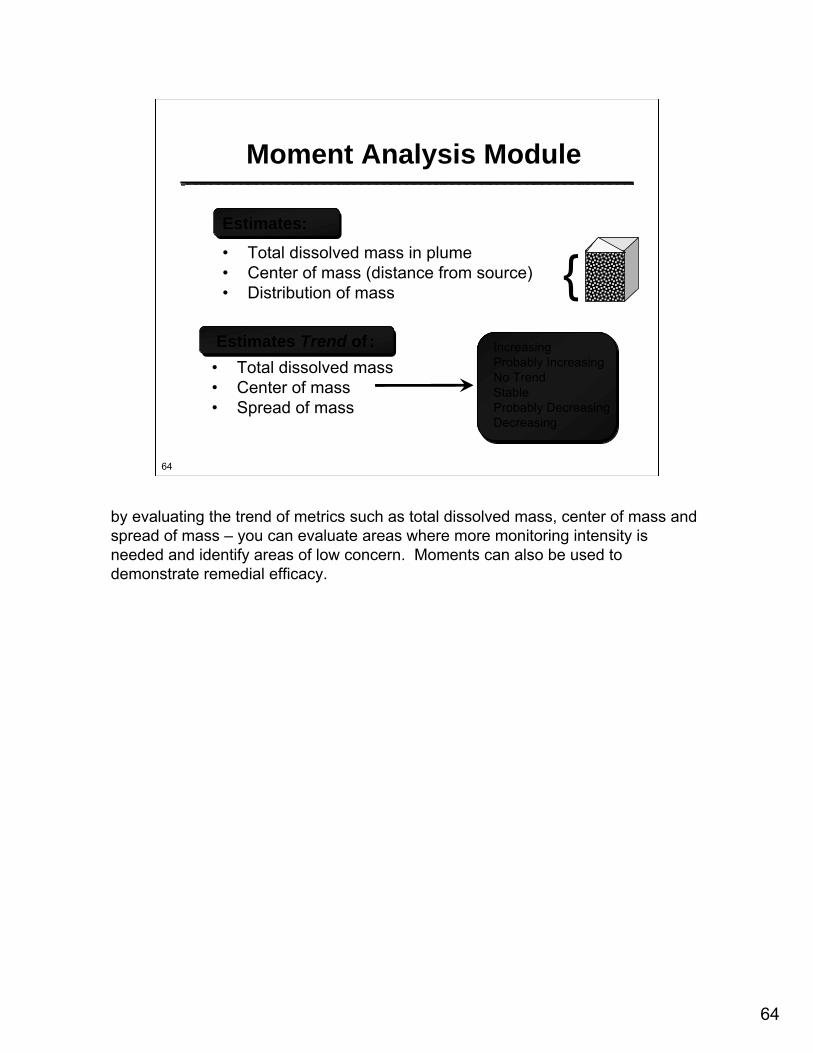
by evaluating the trend of metrics such as total dissolved mass, center of mass and spread of mass – you can evaluate areas where more monitoring intensity is needed and identify areas of low concern. Moments can also be used to demonstrate remedial efficacy.
65
65
Plume DelineationPlume Delineation
Plume Stability Evaluation
Zero Moment EstimatesZero Moment Estimates
First Moment Estimates
Second Moment EstimatesSecond Moment Estimates
Plume LengthPlume Length
Total Dissolved MassTotal Dissolved Mass
Center of MassCenter of Mass
Spread of MassSpread of Mass
Trend AnalysisTrend Analysis Well ConcentrationsWell Concentrations
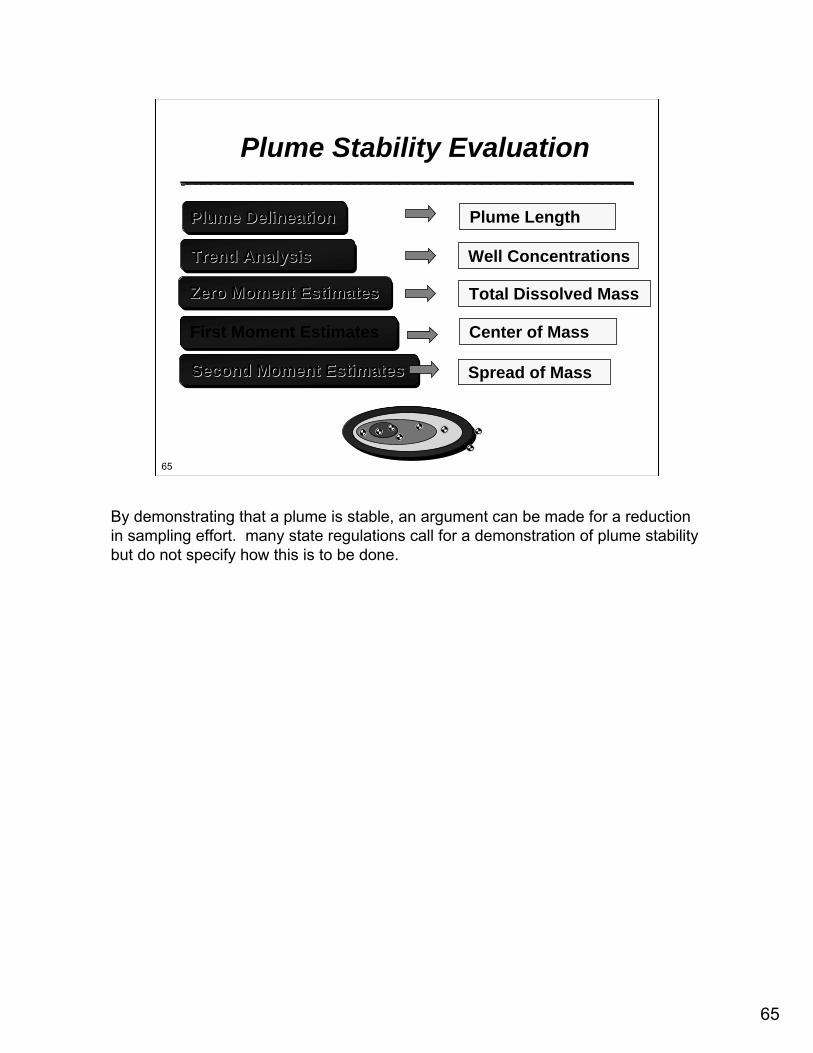
By demonstrating that a plume is stable, an argument can be made for a reduction in sampling effort. many state regulations call for a demonstration of plume stability but do not specify how this is to be done.
66
66
Calculate Slope Factor (SF) asCalculate Slope Factor (SF) as
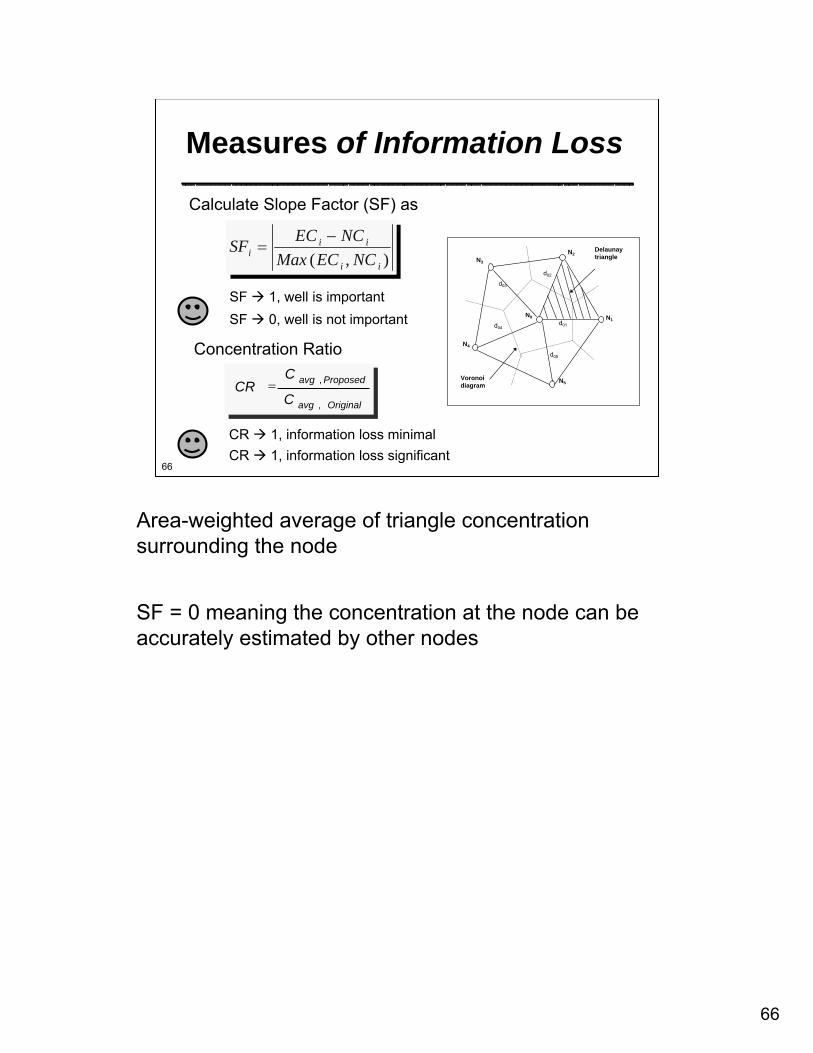
Measures of Information Loss
SF 1, well is importantwell is importantSF 0, well is not importantwell is not important
),( ii
iii NCECMax
NCECSF −=
d02
d05
d04
d03
d01
Delaunay triangle
Voronoidiagram
N1
N2N3
N5
N4
N0
Concentration RatioConcentration Ratio
Originalavg
Proposedavg
C
CCR =
,
,
CR 1, information loss minimalCR 1, information loss significant
Area-weighted average of triangle concentration surrounding the node
SF = 0 meaning the concentration at the node can be accurately estimated by other nodes
67
67
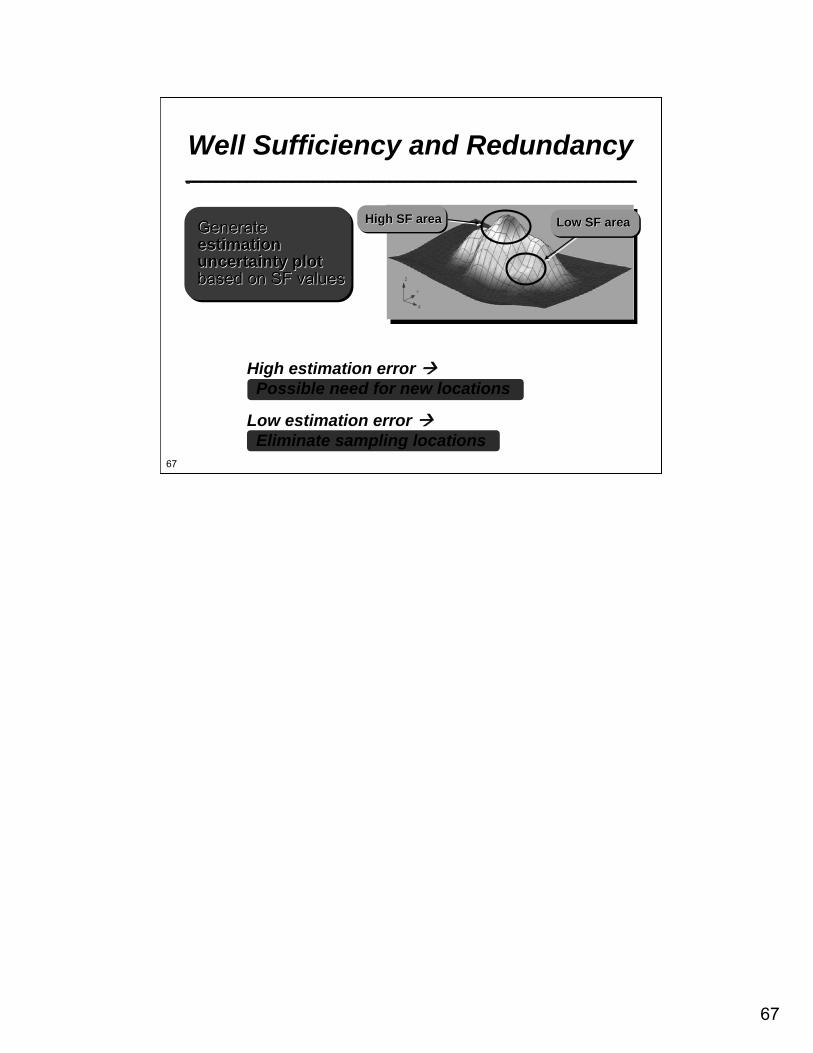
High estimation error Possible need for new locations
Low estimation error Eliminate sampling locations
Well Sufficiency and Redundancy
GenerateGenerateestimation estimation uncertainty plotuncertainty plotbased on SF valuesbased on SF values
High SF areaHigh SF area Low SF areaLow SF area
68
68
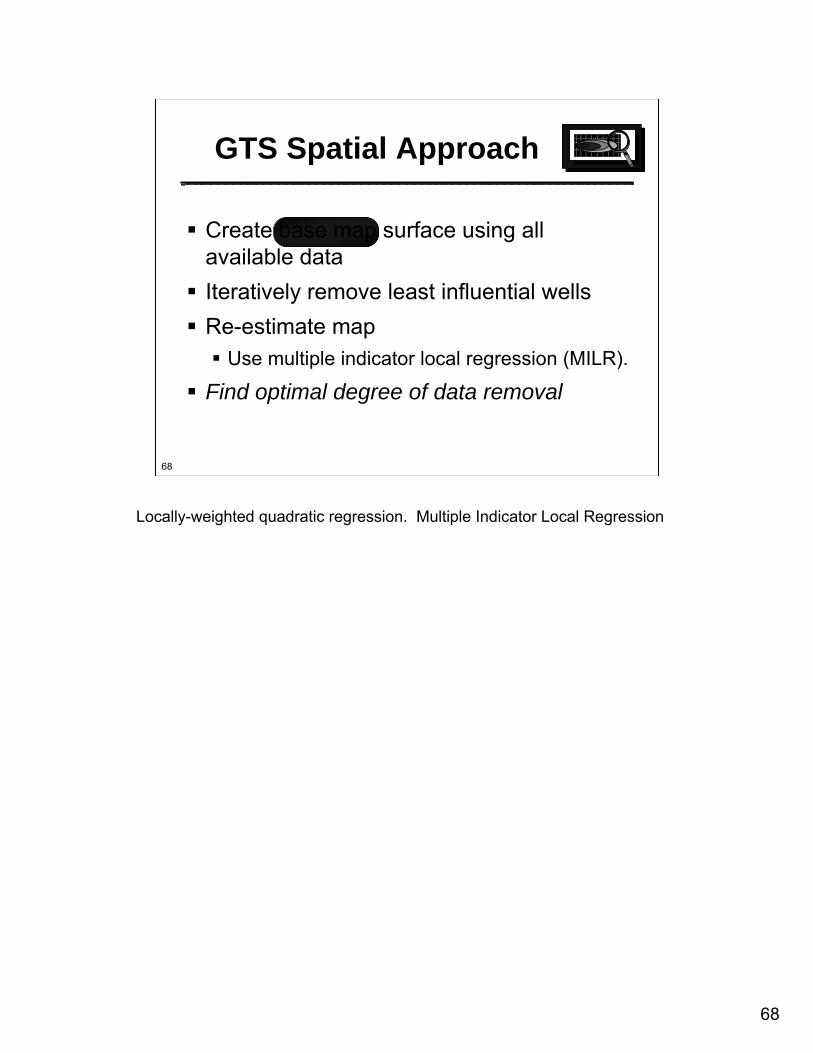
Create base map surface using all available dataIteratively remove least influential wellsRe-estimate map
Use multiple indicator local regression (MILR).
Find optimal degree of data removal
GTS Spatial Approach
Locally-weighted quadratic regression. Multiple Indicator Local Regression
69
69
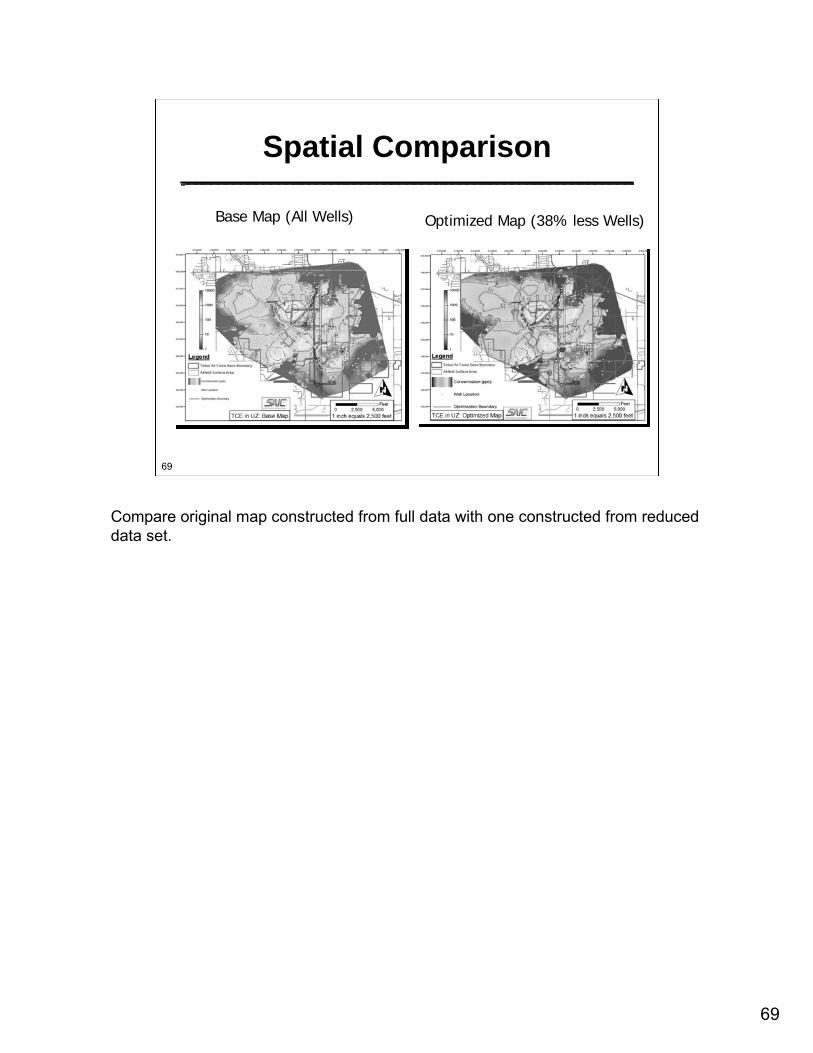
Base Map (All Wells) Optimized Map (38% less Wells)
Spatial Comparison
Compare original map constructed from full data with one constructed from reduced data set.
70
70
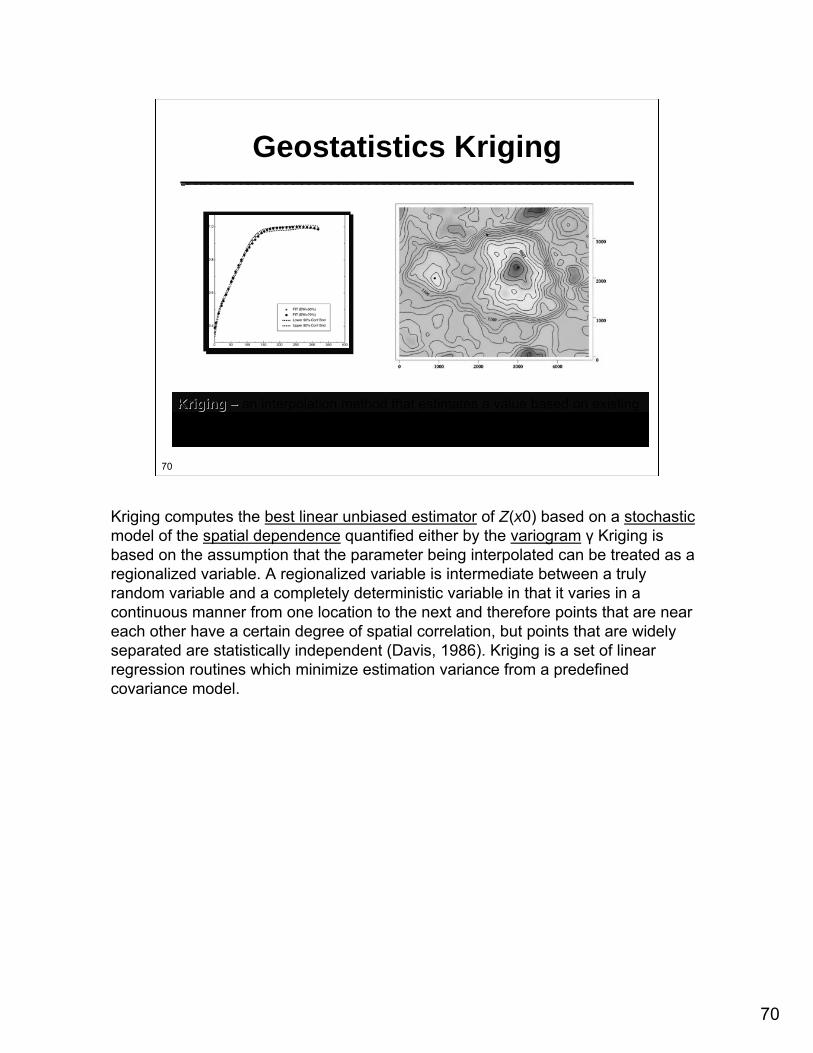
KrigingKriging –– an interpolation method that estimates a value based on existing data locations and on a stochastic model of the spatial dependence –‘before and after’ optimization
Geostatistics Kriging
Kriging computes the best linear unbiased estimator of Z(x0) based on a stochasticmodel of the spatial dependence quantified either by the variogram γ Kriging is based on the assumption that the parameter being interpolated can be treated as a regionalized variable. A regionalized variable is intermediate between a truly random variable and a completely deterministic variable in that it varies in a continuous manner from one location to the next and therefore points that are near each other have a certain degree of spatial correlation, but points that are widely separated are statistically independent (Davis, 1986). Kriging is a set of linear regression routines which minimize estimation variance from a predefined covariance model.
71
71
Evolving Methods
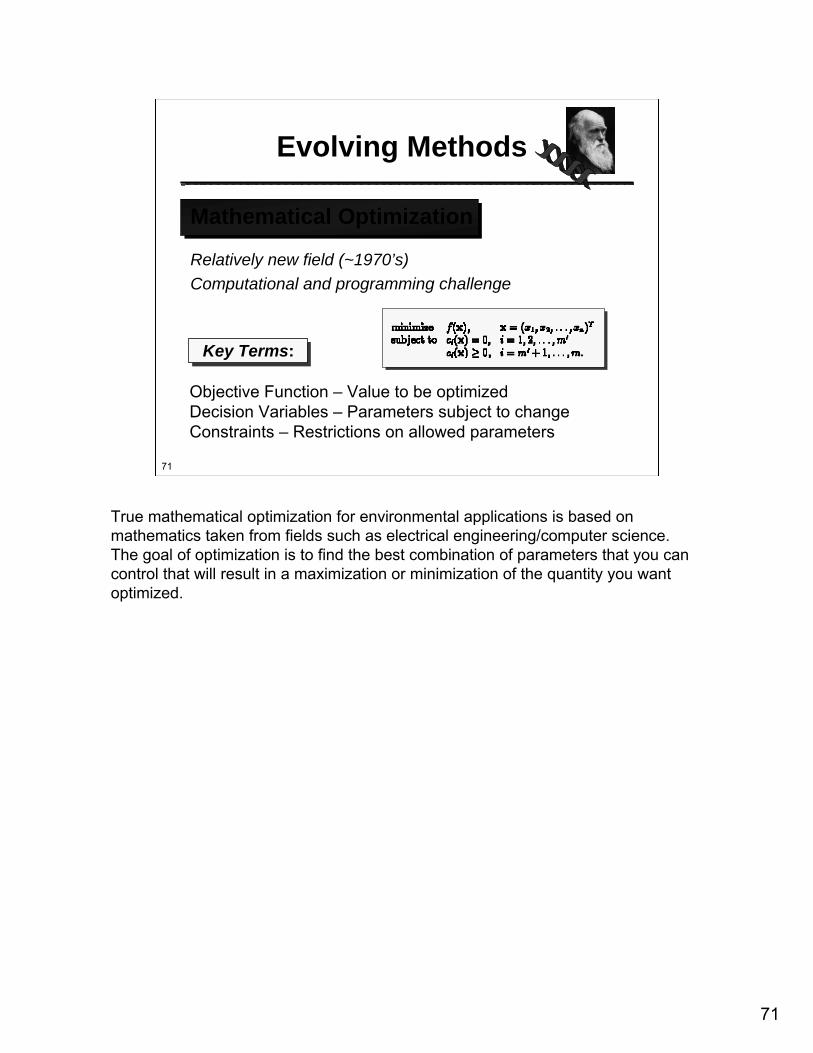
Mathematical Optimization
Relatively new field (~1970’s)Computational and programming challenge
Key Terms:
Objective Function – Value to be optimizedDecision Variables – Parameters subject to changeConstraints – Restrictions on allowed parameters
True mathematical optimization for environmental applications is based on mathematics taken from fields such as electrical engineering/computer science. The goal of optimization is to find the best combination of parameters that you can control that will result in a maximization or minimization of the quantity you want optimized.
72
72
0
1
2
3
4
5
6
7
8
9
10
24 26 28 30 32 34 36
Number of Wells
Max
imum
Err
or (p
pb)
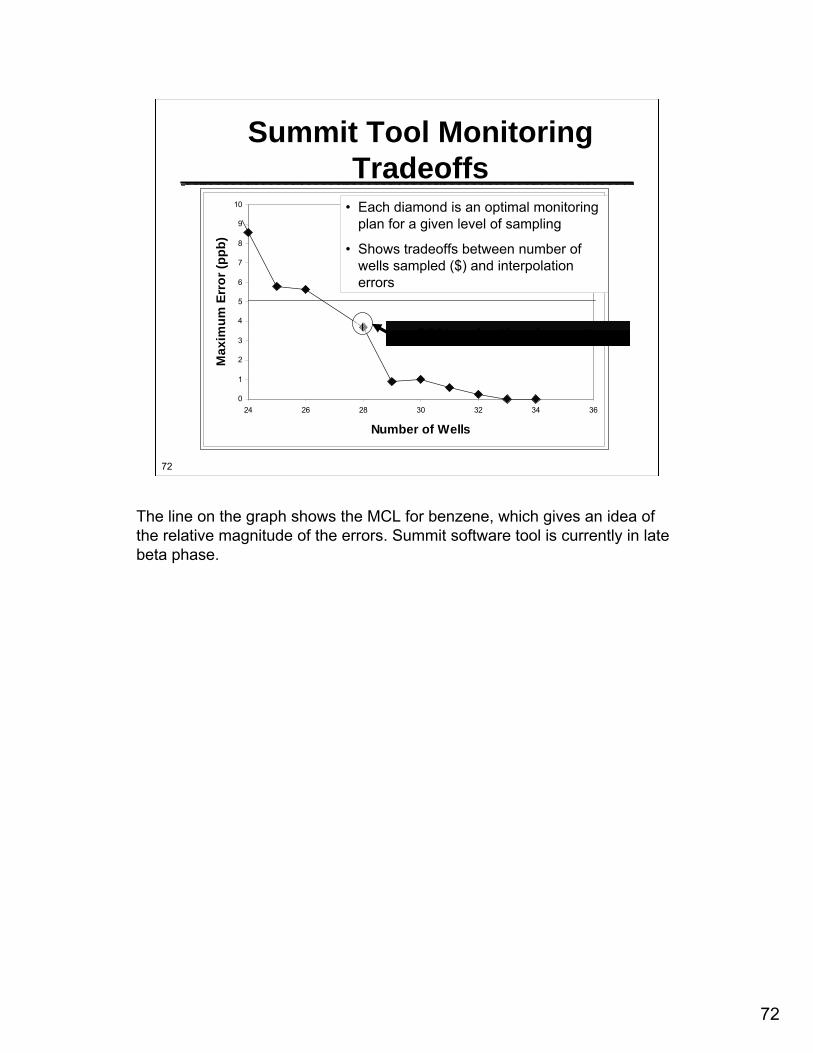
Summit Tool Monitoring Tradeoffs
• Each diamond is an optimal monitoring plan for a given level of sampling
• Shows tradeoffs between number of wells sampled ($) and interpolation errors
22% reduction in costs
The line on the graph shows the MCL for benzene, which gives an idea of the relative magnitude of the errors. Summit software tool is currently in late beta phase.
73
73
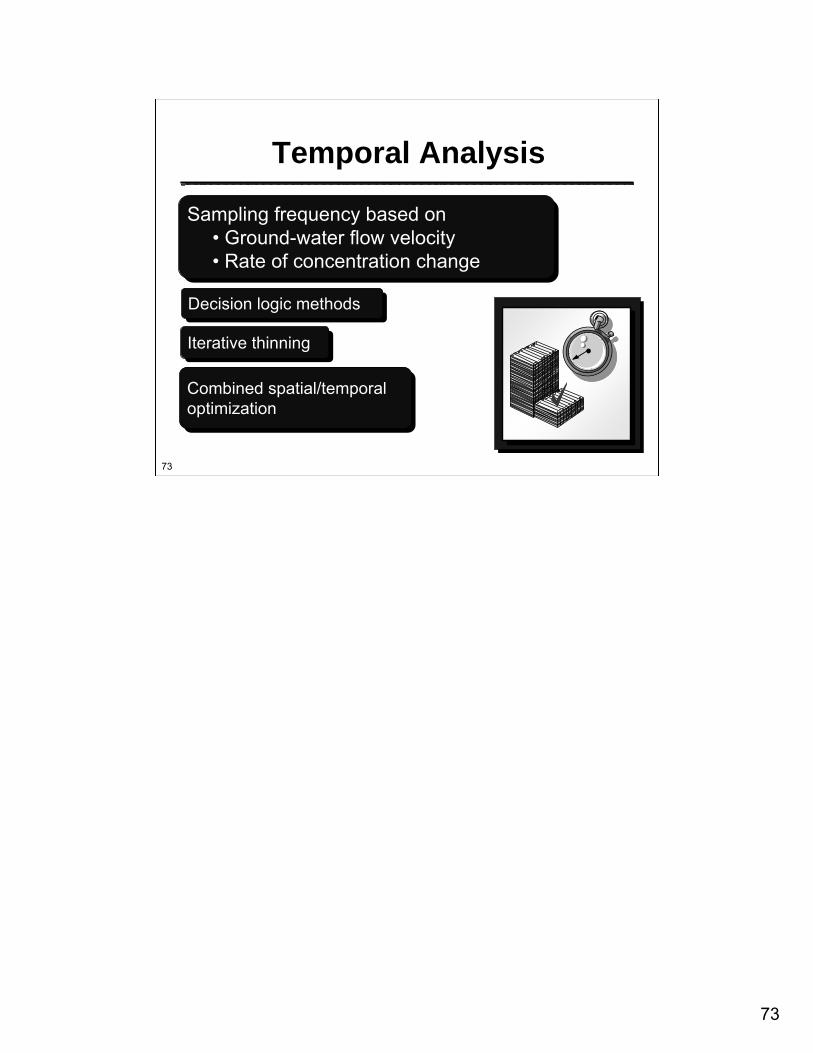
Temporal Analysis
Sampling frequency based on • Ground-water flow velocity• Rate of concentration change
Iterative thinning
Decision logic methods
Combined spatial/temporal optimization
74
74
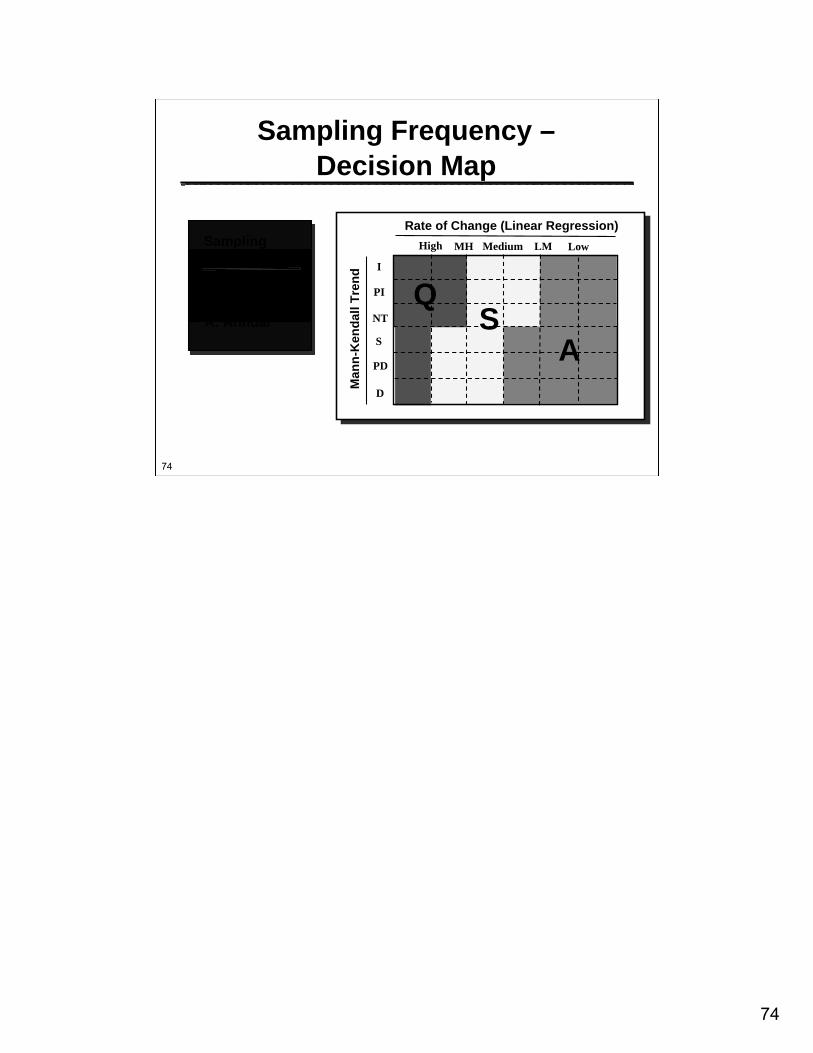
Q: QuarterlyS: SemiannualA: Annual
Sampling Frequency
Rate of Change (Linear Regression)
Man
n-K
enda
ll Tr
end
Q
AS
High Medium LM LowMH
I
PI
S
PD
D
NT
Sampling Frequency –Decision Map
75
75
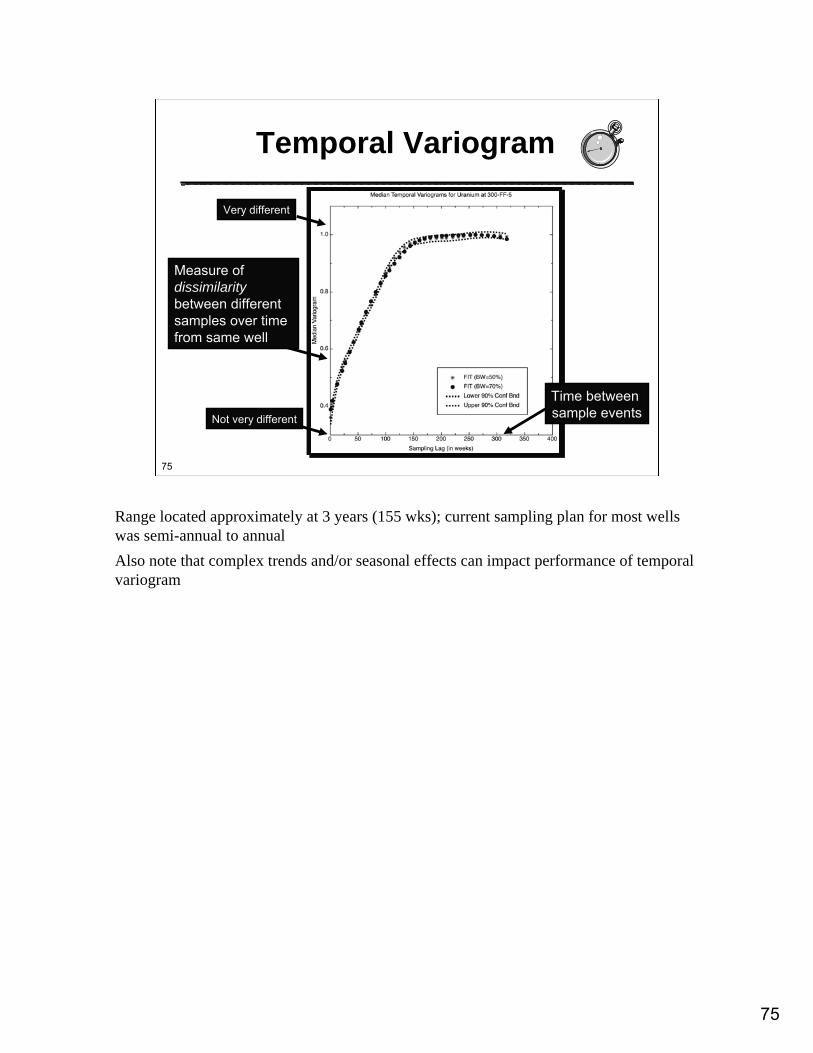
Temporal Variogram
Time between sample eventsNot very different
Very different
Measure of dissimilaritybetween different samples over time from same well
Range located approximately at 3 years (155 wks); current sampling plan for most wells was semi-annual to annualAlso note that complex trends and/or seasonal effects can impact performance of temporal variogram
76
76
Iterative Thinning
7/23/90 11/23/96 3/26/030
50
100
150
200
250
Sampling Date
Con
cent
ratio
n (p
pb)
MN: Well 399-1-10AUpper 90% Conf. Bnd.Lower 90% Conf. Bnd.Initial FitMed. Fit (0.45)Med. Fit (0.50)UQ Fit (0.50)LQ Fit (0.50)Sample Conc.
Recreate trends seen in full data set by iteratively eliminating sample points. What is the minimum sample frequency to recreate the trend.
77
77
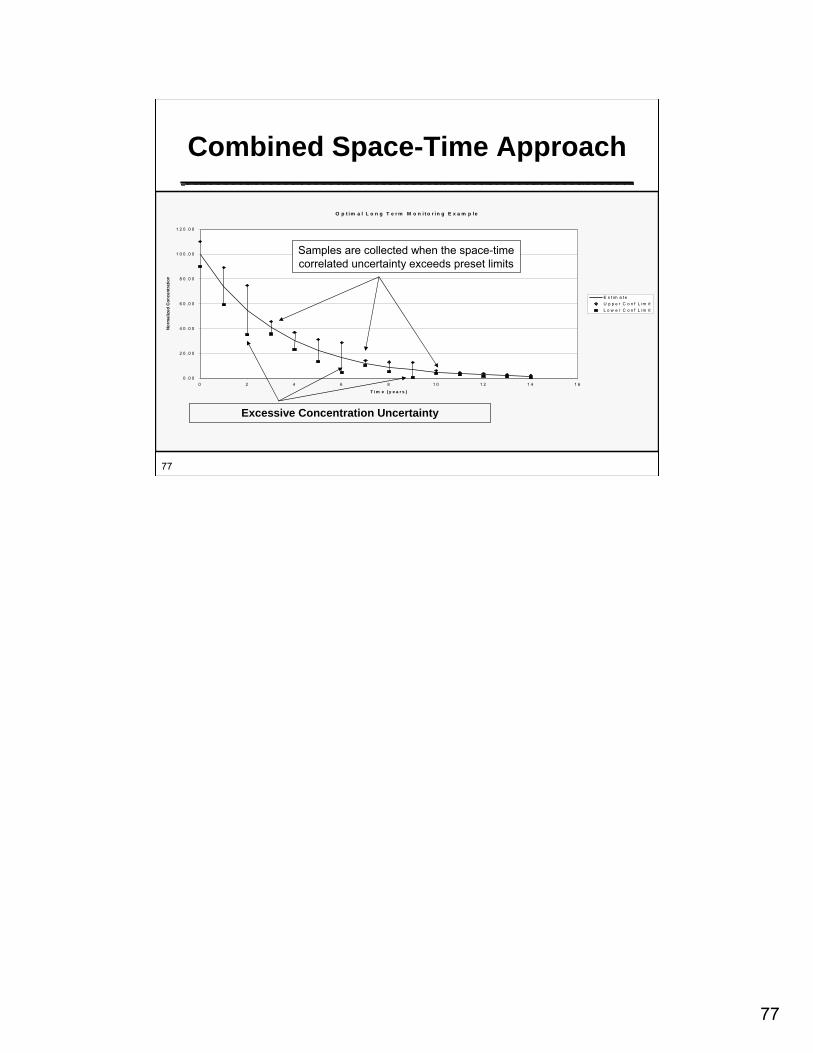
Combined Space-Time Approach
O p t im a l L o n g T e r m M o n i t o r in g E x a m p le
0 .0 0
2 0 .0 0
4 0 .0 0
6 0 .0 0
8 0 .0 0
1 0 0 .0 0
1 2 0 .0 0
0 2 4 6 8 1 0 1 2 1 4 1 6
T im e ( y e a r s )
Nor
mal
ized
Con
cent
ratio
n
E s t im a teU p p e r C o n f L im itL o w e r C o n f L im it
Samples are collected when the space-time correlated uncertainty exceeds preset limits
Excessive Concentration Uncertainty
78
78
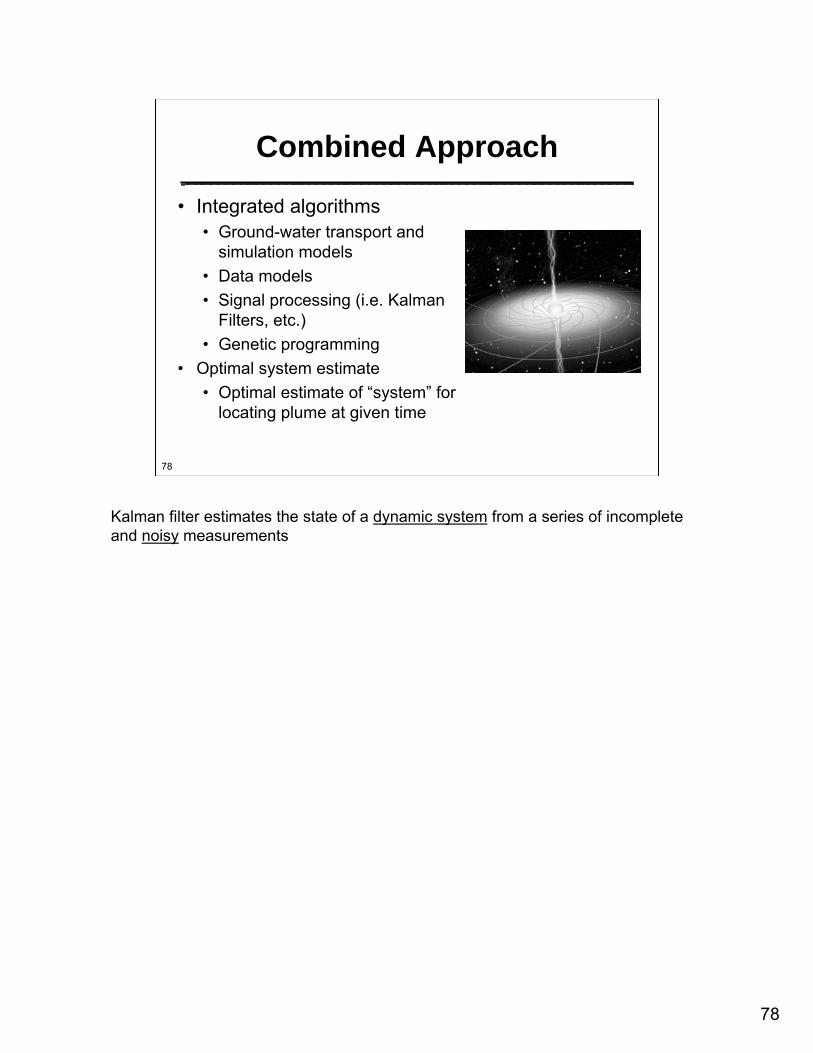
Combined Approach
• Integrated algorithms • Ground-water transport and
simulation models• Data models• Signal processing (i.e. Kalman
Filters, etc.)• Genetic programming
• Optimal system estimate• Optimal estimate of “system” for
locating plume at given time
Kalman filter estimates the state of a dynamic system from a series of incomplete and noisy measurements
79
79
Evidence
Evaluation Strategies
• Develop lines of evidence• Evaluate quality of information from each location
and how it meets monitoring goals;• Detection frequency, trends, plume stability;• Spatial redundancy/uncertainty;• Sampling frequency consistent with rate of
change.
80
80
Result
Recommendations
• Monitoring locations that serve monitoring objectives and decision needs;
• Remove redundant locations;• Add wells where uncertainty is high;• Optimal sampling frequency
Qualitative Review!
81
81
Questions?Questions?
82
82
55--Minute BreakMinute Break
83
83
Reviewing and Implementing Reviewing and Implementing LTMO ResultsLTMO Results
Dave Becker, P.G.US Army Corps of Engineers
Environmental and Munitions Center of Expertise
DJB1
84
84
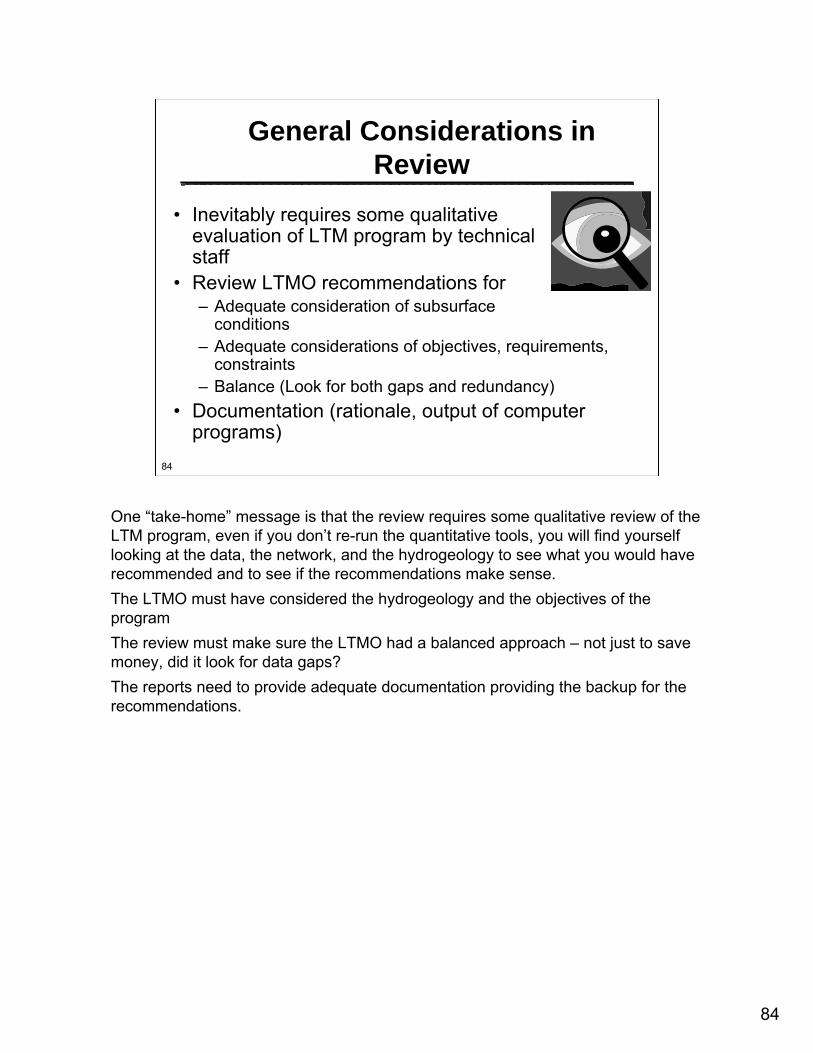
General Considerations in Review
• Inevitably requires some qualitative evaluation of LTM program by technical staff
• Review LTMO recommendations for– Adequate consideration of subsurface
conditions– Adequate considerations of objectives, requirements,
constraints– Balance (Look for both gaps and redundancy)
• Documentation (rationale, output of computer programs)
One “take-home” message is that the review requires some qualitative review of the LTM program, even if you don’t re-run the quantitative tools, you will find yourself looking at the data, the network, and the hydrogeology to see what you would have recommended and to see if the recommendations make sense. The LTMO must have considered the hydrogeology and the objectives of the programThe review must make sure the LTMO had a balanced approach – not just to save money, did it look for data gaps?The reports need to provide adequate documentation providing the backup for the recommendations.
85
85
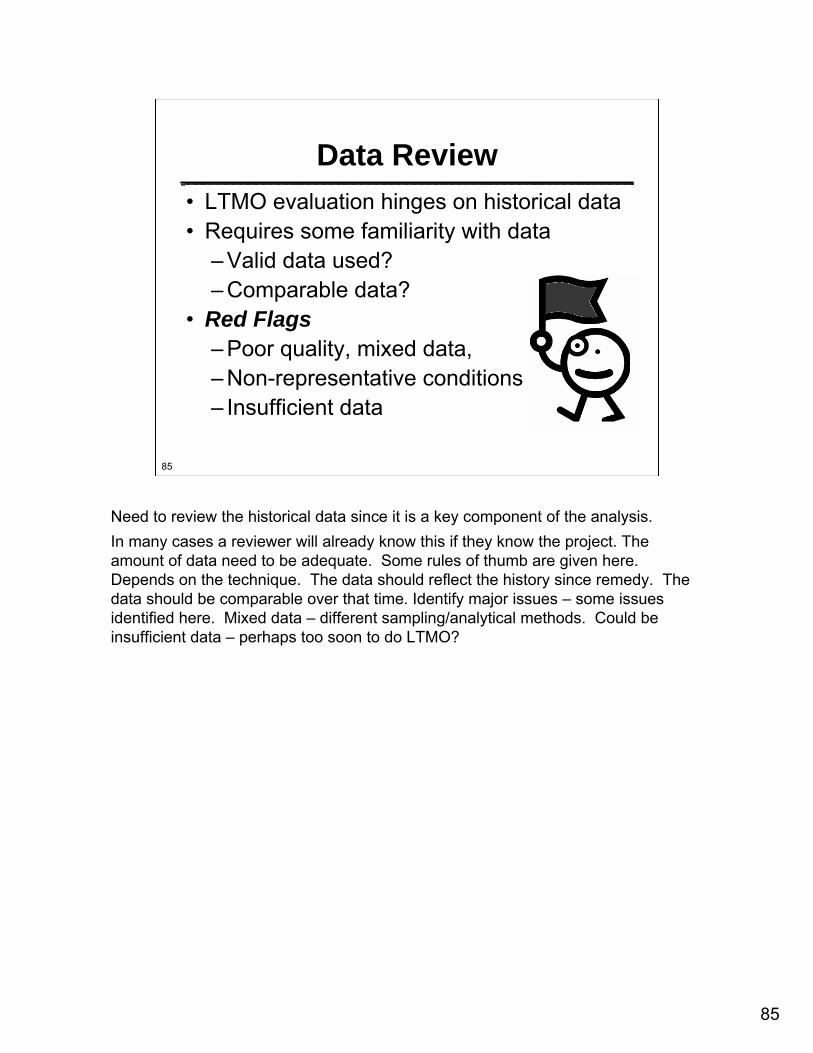
Data Review• LTMO evaluation hinges on historical data• Requires some familiarity with data
– Valid data used?– Comparable data?
• Red Flags– Poor quality, mixed data, – Non-representative conditions – Insufficient data
Need to review the historical data since it is a key component of the analysis.In many cases a reviewer will already know this if they know the project. The amount of data need to be adequate. Some rules of thumb are given here. Depends on the technique. The data should reflect the history since remedy. The data should be comparable over that time. Identify major issues – some issues identified here. Mixed data – different sampling/analytical methods. Could be insufficient data – perhaps too soon to do LTMO?
86
86
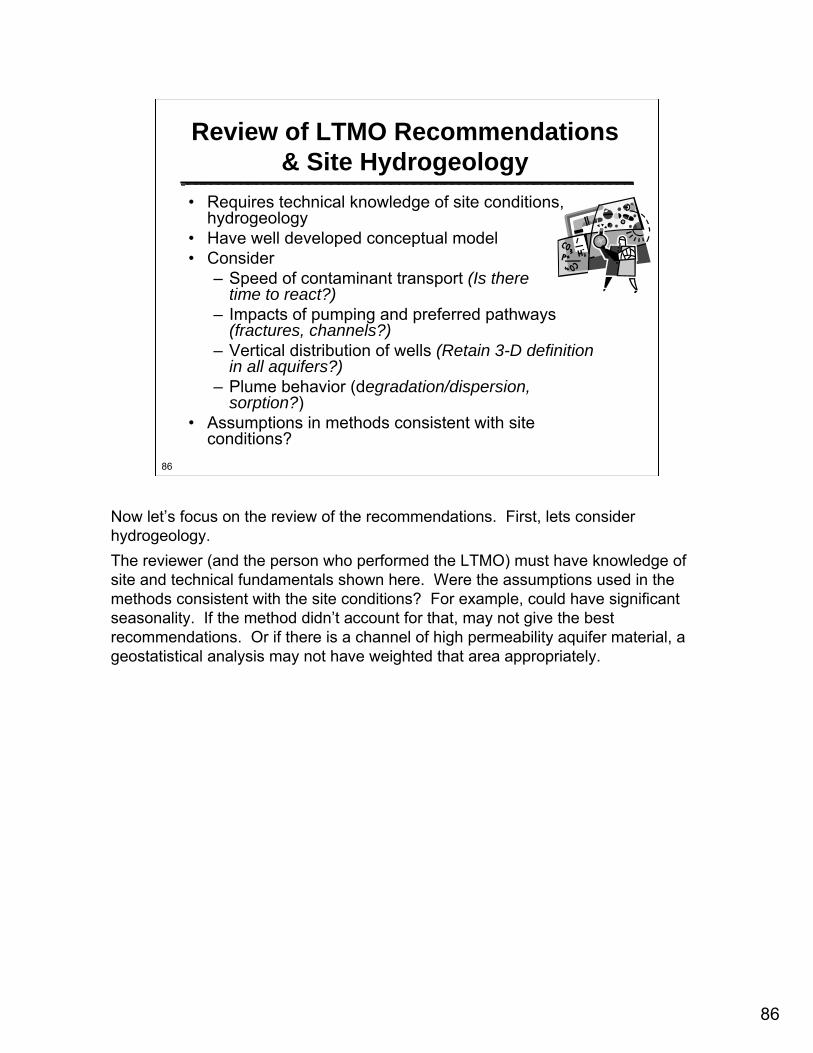
Review of LTMO Recommendations & Site Hydrogeology
• Requires technical knowledge of site conditions, hydrogeology
• Have well developed conceptual model• Consider
– Speed of contaminant transport (Is there time to react?)
– Impacts of pumping and preferred pathways (fractures, channels?)
– Vertical distribution of wells (Retain 3-D definition in all aquifers?)
• Assumptions in methods consistent with site conditions?
Now let’s focus on the review of the recommendations. First, lets consider hydrogeology.The reviewer (and the person who performed the LTMO) must have knowledge of site and technical fundamentals shown here. Were the assumptions used in the methods consistent with the site conditions? For example, could have significant seasonality. If the method didn’t account for that, may not give the best recommendations. Or if there is a channel of high permeability aquifer material, a geostatistical analysis may not have weighted that area appropriately.
87
87
Recommendations Relative to Monitoring Objectives
• Verify current LTM objectives are stated • Compare recommended frequency,
network (and analytical changes) to objectives – Are these adequate to:– Assess migration?– Assess progress toward remediation?– Assess unexpected behavior (e.g.
rebound, outside contaminants)?– Provide early warning to exposure
point?– Meet stakeholder concerns?
Now lets consider recommendations relative to the LTM objectives. The LTMO report must indicate they knew the objectives. Some of the review considerations are listed here.
88
88
Review for Regulatory Compliance
• Do recommendations meet minimum State and Federal regulatory requirements?– Permit requirements (or propose changes
consistent with regulatory program)– Minimum sampling
• Upgradient and downgradient• Spacing of perimeter wells• Point of compliance wells• Within plume• Number of rounds
– Analytical parameters
Do the recommendations meet regulatory requirements or permit requirements?Again, California requires a minimum sampling program. The analytical list is less flexible, but can recommend changes in frequency. Again, some questions for reviewers in comparing the recommendations against regulatory requirements.
89
89
Other Review Considerations• Personnel Qualifications
– Look for qualifications in workplan– Adequate technical competence – If not qualified, what next?
• Logistical Considerations– Sample timing (weather conditions)– Avoid multiple mobilization– Availability of wells for sampling
• Verify Cost Impacts– Include related costs, data management,
reporting
A more difficult review task is to assess if the personnel performing the LTMO were qualified to perform the analysis. Best to look for qualification in a work plan. For some methods, need expertise in the statistics/geostatistics. If not qualified, need to review recommendations in much more detail (or throw it back).
90
90
Implementation• Consensus Building
– Involve stakeholders in LTMO planning
– Make process transparent– Present all results, good and
bad– Changes to sampling locations,
frequency, methods to be discussed
• Focus on technical merits• Support site decision-making
91
91
Implementation, Continued• Changes to Sampling Plans
– Flexible decision documents– Acknowledge LTMO process in plans, exit
strategy– Account for cost to change plans
• Disposition of Excluded Wells– Abandon/decommission– Use for piezometric measurements– Future plume changes– Verification
• Future LTMO: Periodic Re-Evaluations
92
92
Frontier Hard Chrome Frontier Hard Chrome Case StudyCase Study
Mindy Vanderford, Ph.D.Mindy Vanderford, Ph.D.GSI Environmental, Inc.GSI Environmental, Inc.
information loss; – Add new wells where uncertainty is high;– Sampling frequency recommendations;– Reality check.
MAROS
94
94
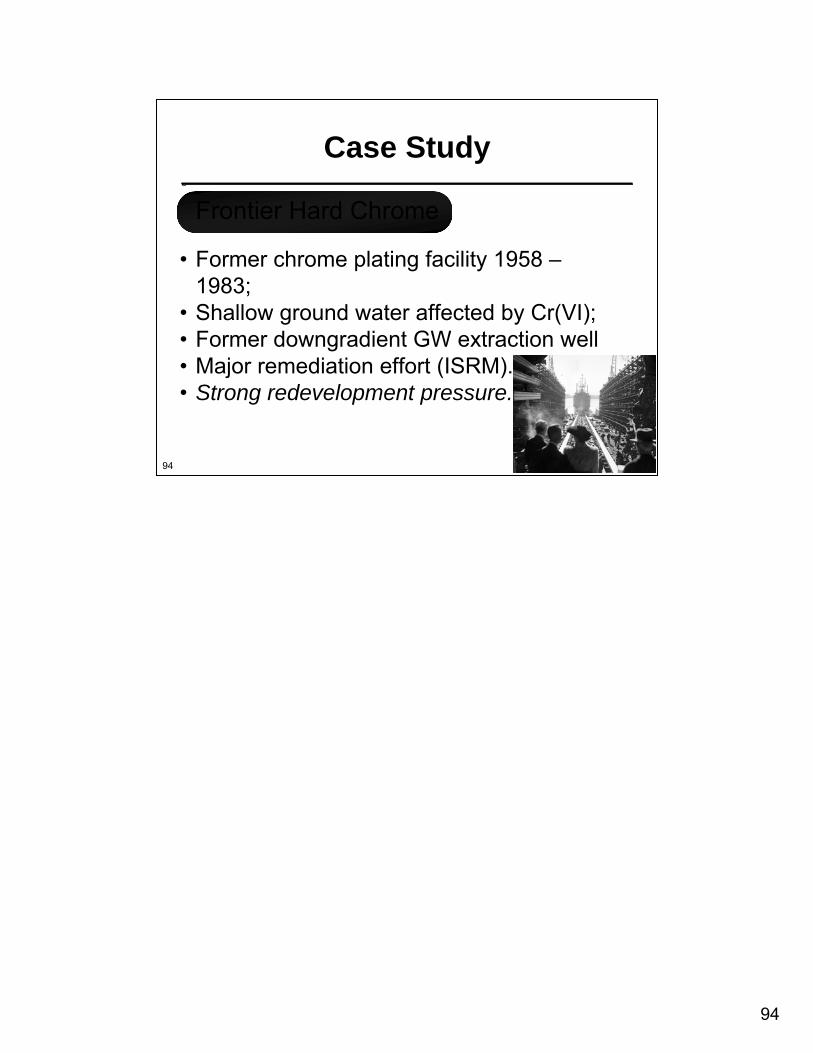
Frontier Hard Chrome
Case Study
• Former chrome plating facility 1958 –1983;
• Shallow ground water affected by Cr(VI);• Former downgradient GW extraction well• Major remediation effort (ISRM).• Strong redevelopment pressure.
95
95
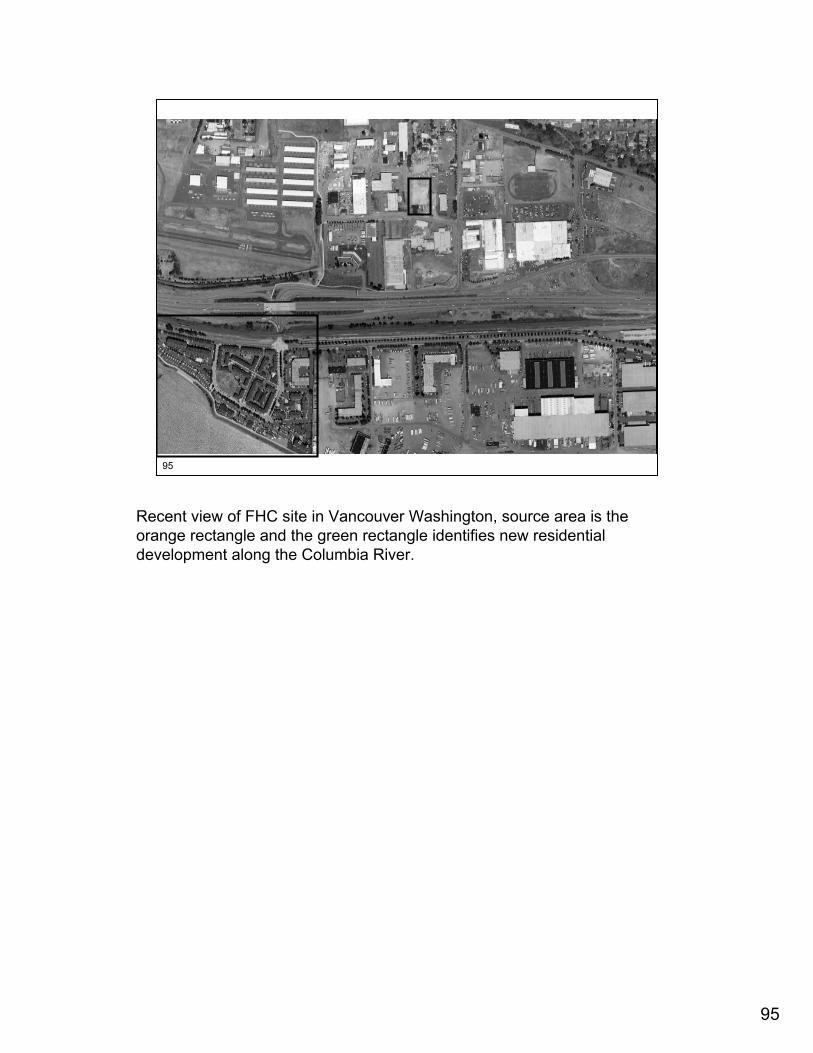
Recent view of FHC site in Vancouver Washington, source area is the orange rectangle and the green rectangle identifies new residential development along the Columbia River.
96
96
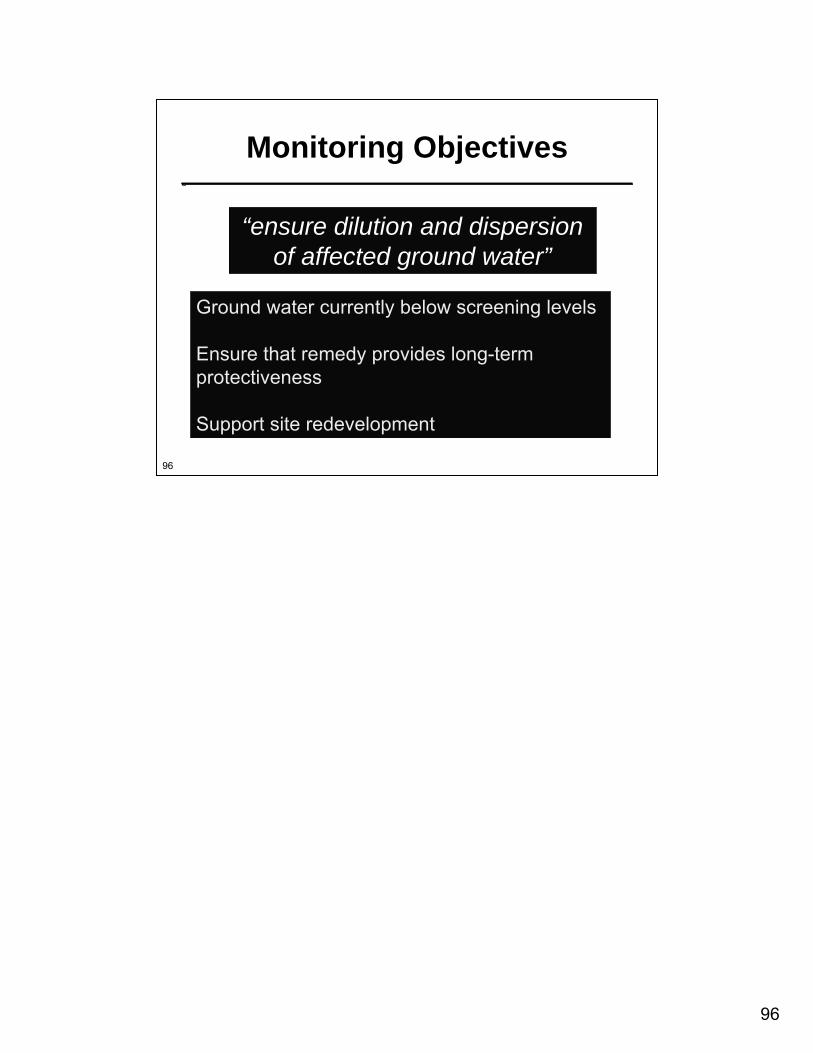
Monitoring Objectives
“ensure dilution and dispersion of affected ground water”
Ground water currently below screening levels
Ensure that remedy provides long-term protectiveness
Support site redevelopment
97
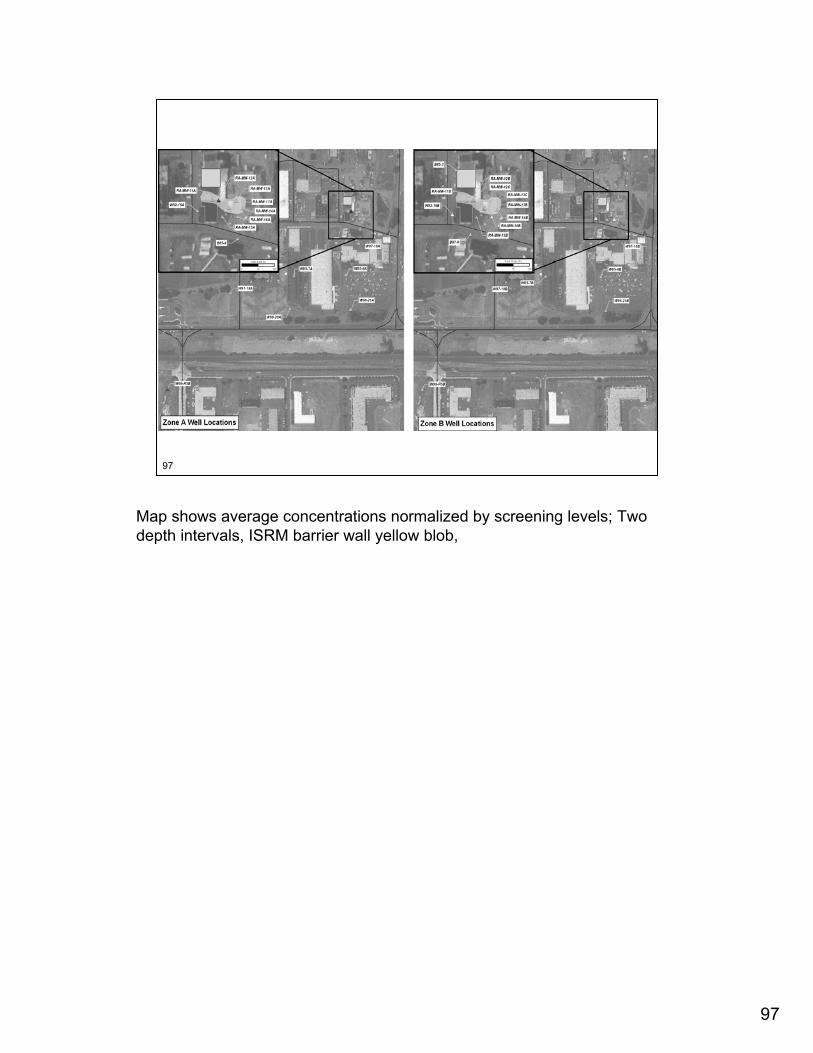
97
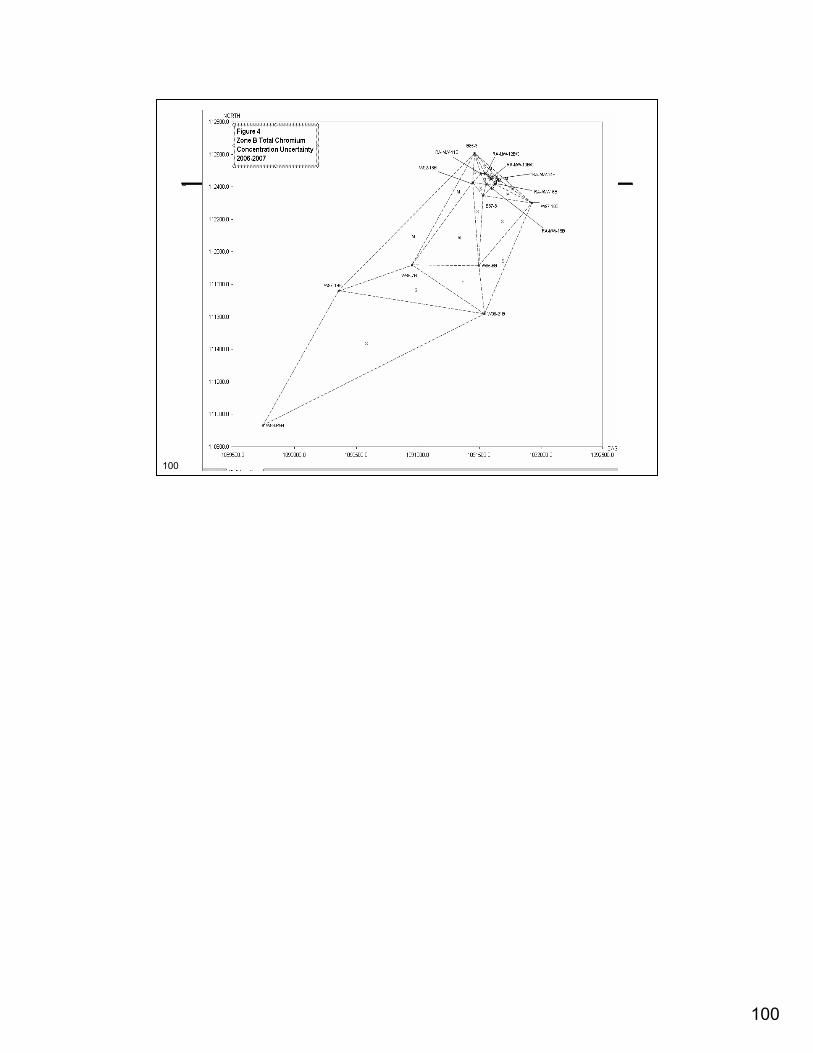
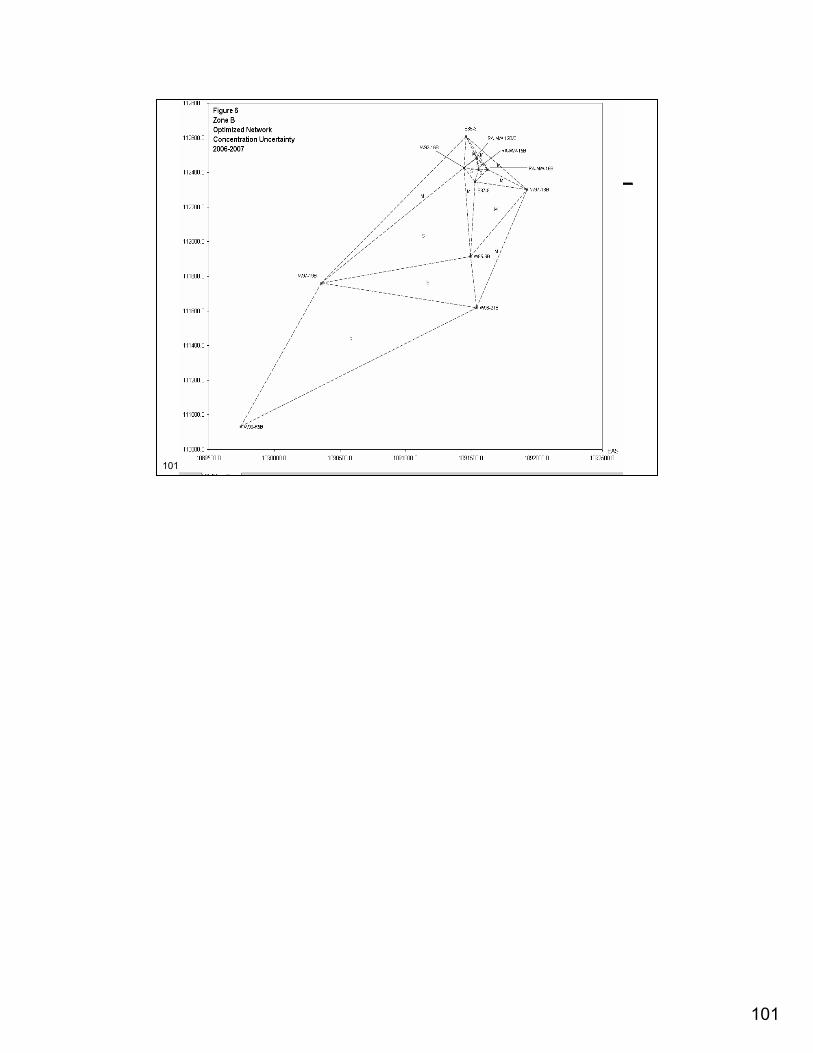
Map shows average concentrations normalized by screening levels; Two depth intervals, ISRM barrier wall yellow blob,
98
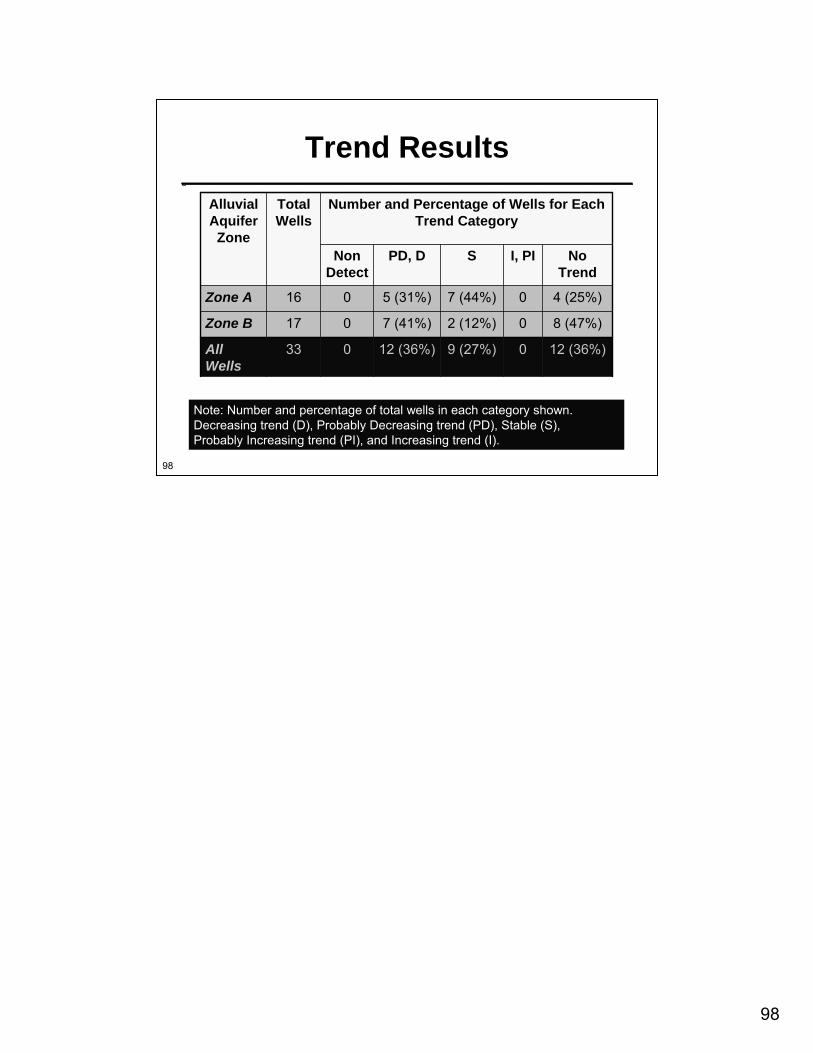
98
12 (36%)09 (27%)12 (36%)033All Wells
8 (47%)02 (12%)7 (41%)017Zone B
4 (25%)07 (44%)5 (31%)016Zone A
No Trend
I, PISPD, DNon Detect
Number and Percentage of Wells for Each Trend Category
Total Wells
Alluvial Aquifer Zone
Note: Number and percentage of total wells in each category shown. Decreasing trend (D), Probably Decreasing trend (PD), Stable (S), Probably Increasing trend (PI), and Increasing trend (I).
Trend Results
99
99
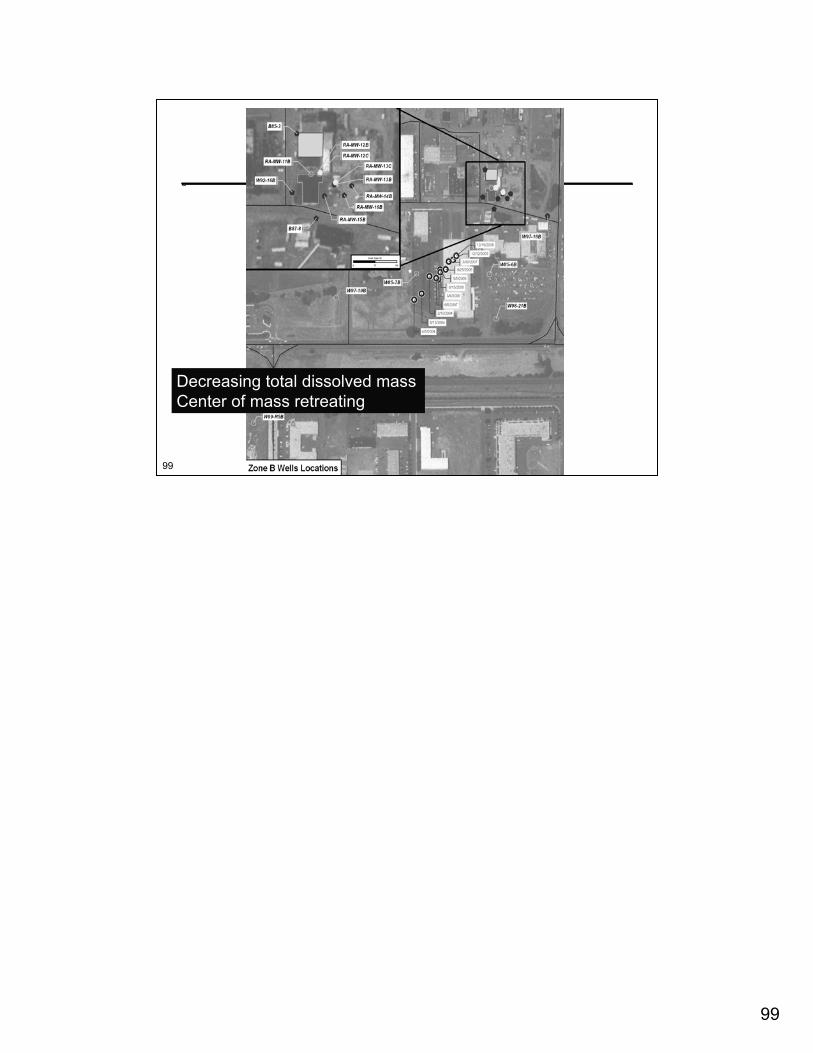
Decreasing total dissolved massCenter of mass retreating
100
100
101
101
102
102
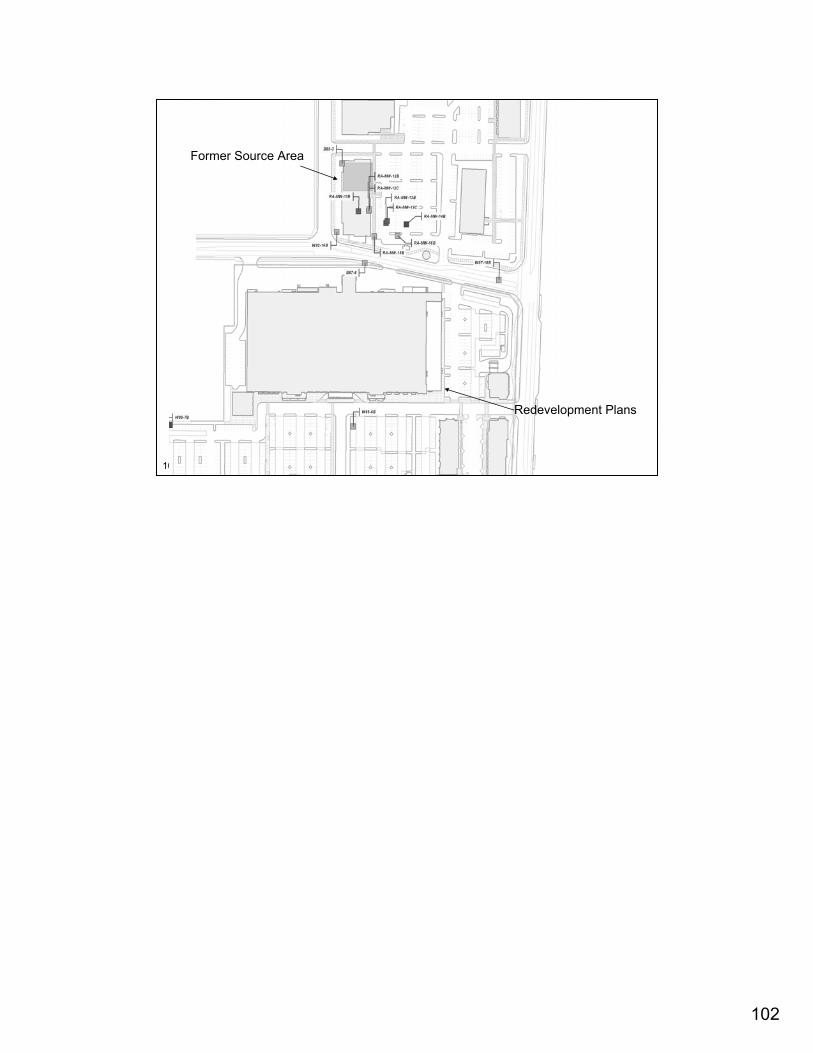
Redevelopment Plans
Former Source Area
103
103
104
104
105
105
106
106
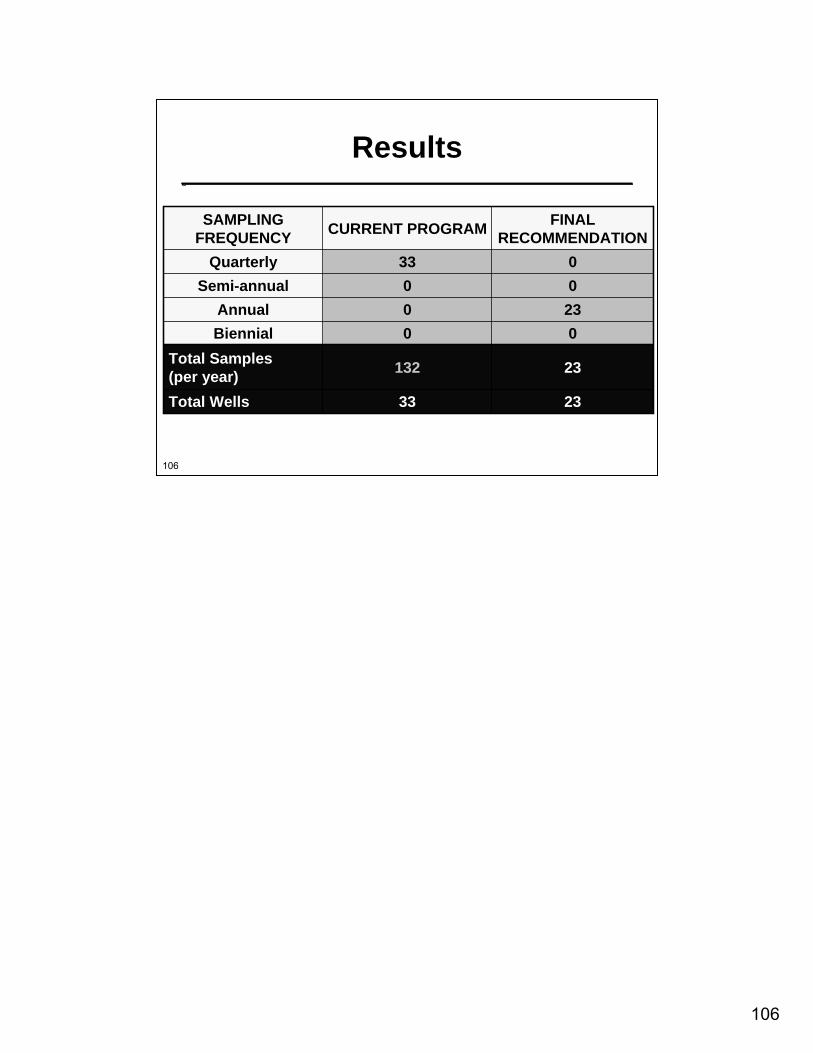
2333Total Wells
23132Total Samples (per year)
00Biennial230Annual00Semi-annual033Quarterly
FINAL RECOMMENDATIONCURRENT PROGRAMSAMPLING
FREQUENCY
Results
107
107
Results
331716
Total Wells
5 (15%)27 (82%)Total Wells1 (5%)12 (71%)B
4 (25%)15 (94%)A
“Attained”Clean-up Goal
Wells Statistically
Below MTCA
Ground-water Zone
Data Sufficiency
108
108
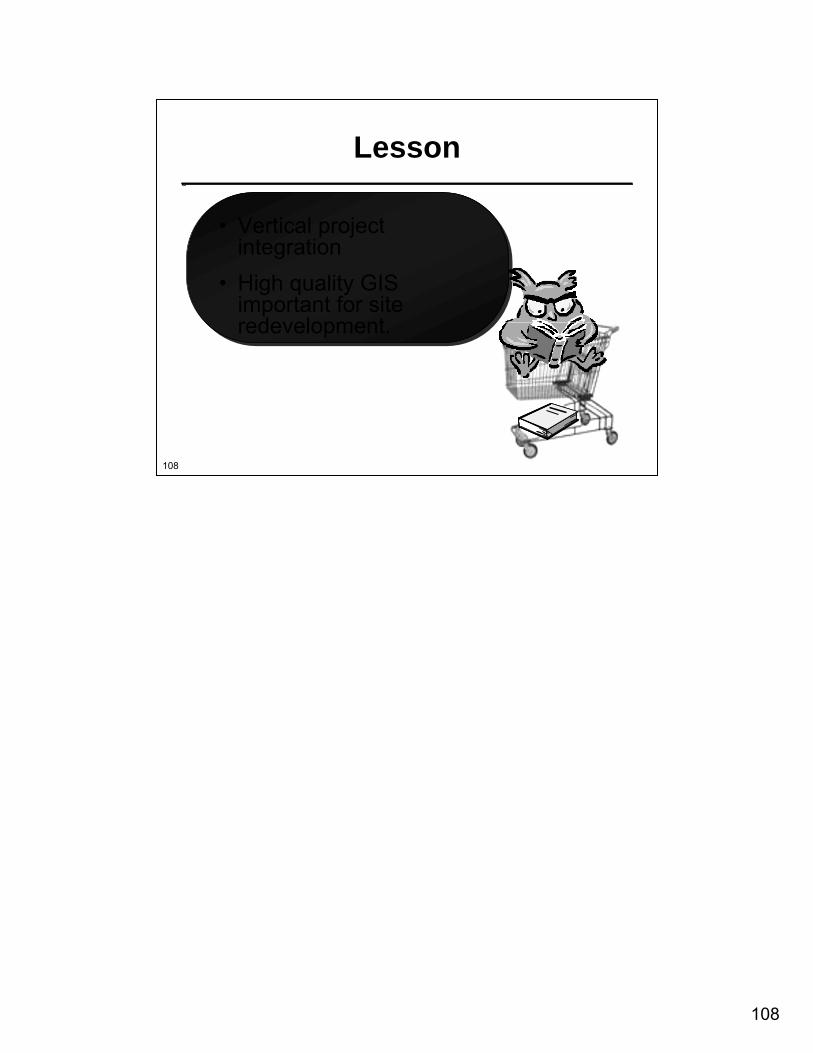
Lesson
• Vertical project integration
• High quality GIS important for site redevelopment.
109
109
LTMO ChallengesLTMO Challenges
Mindy Vanderford, Ph.D.GSI Environmental, Inc.
110
110
Challenges
DataHydrogeologyCost Stakeholders
?
111
111
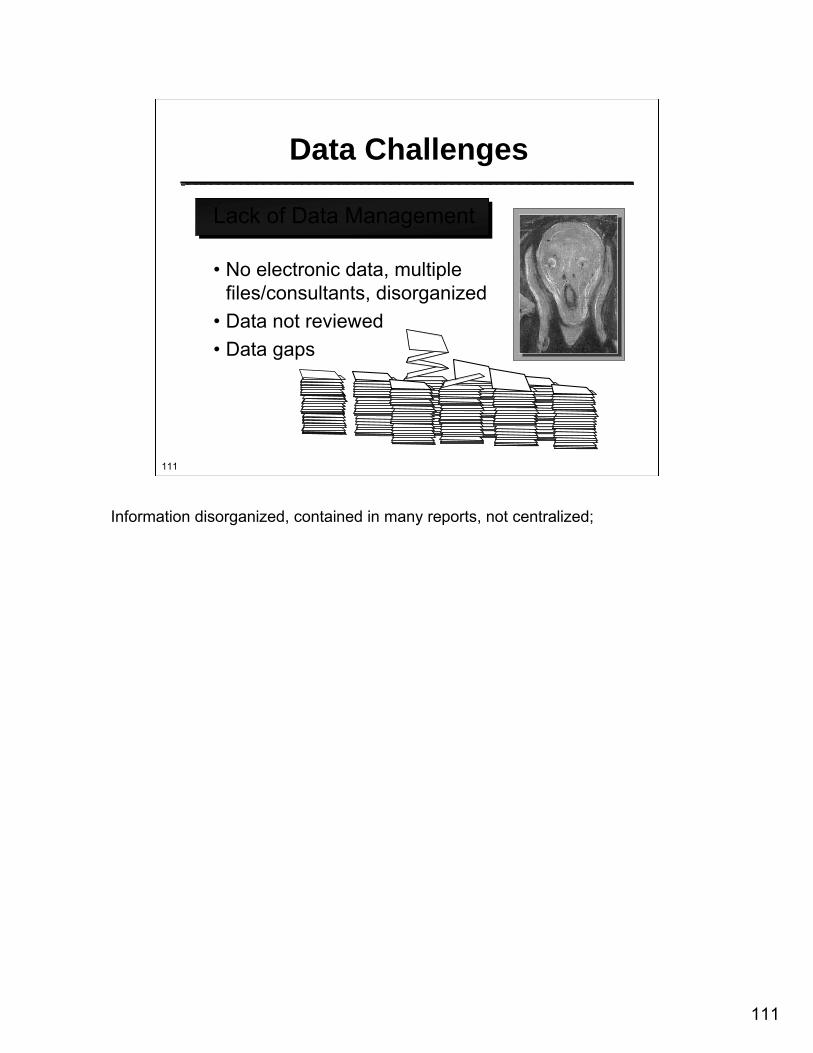
Lack of Data Management
• No electronic data, multiple files/consultants, disorganized
• Data not reviewed• Data gaps
Data Challenges
Information disorganized, contained in many reports, not centralized;
112
112
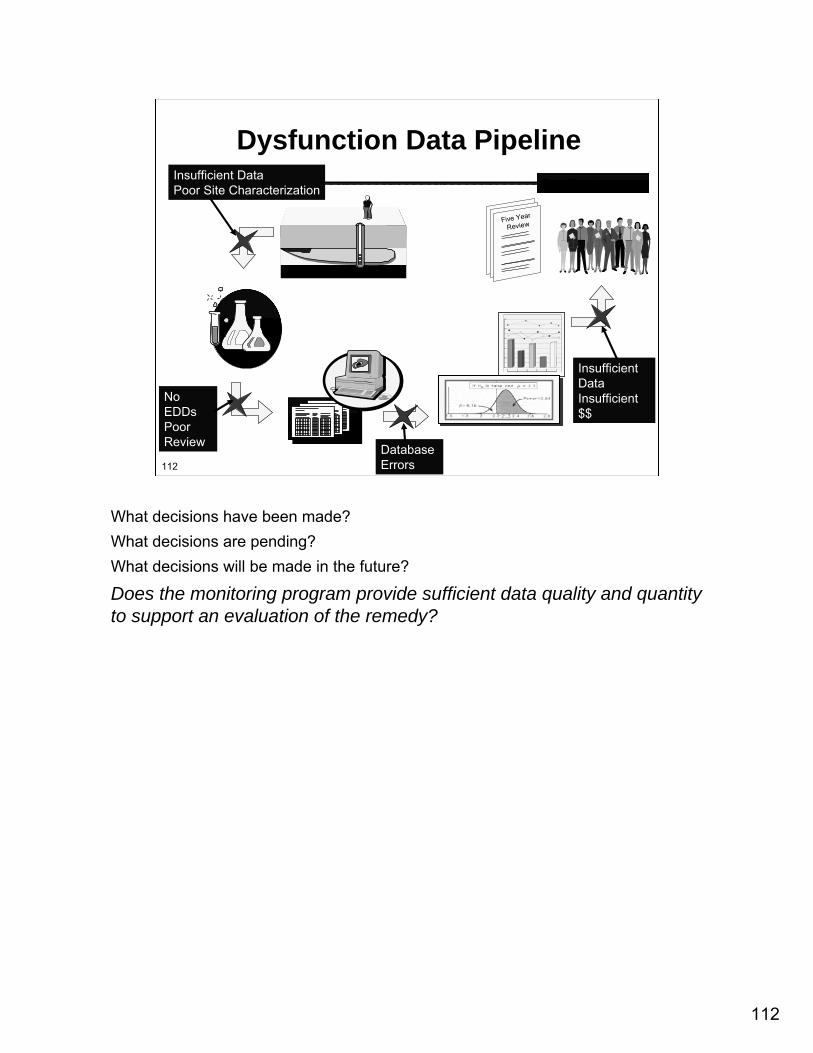
Five Year
Review
Bad RelationshipsInsufficient DataPoor Site Characterization
No EDDsPoor Review Database
Errors
Insufficient DataInsufficient $$
Dysfunction Data Pipeline
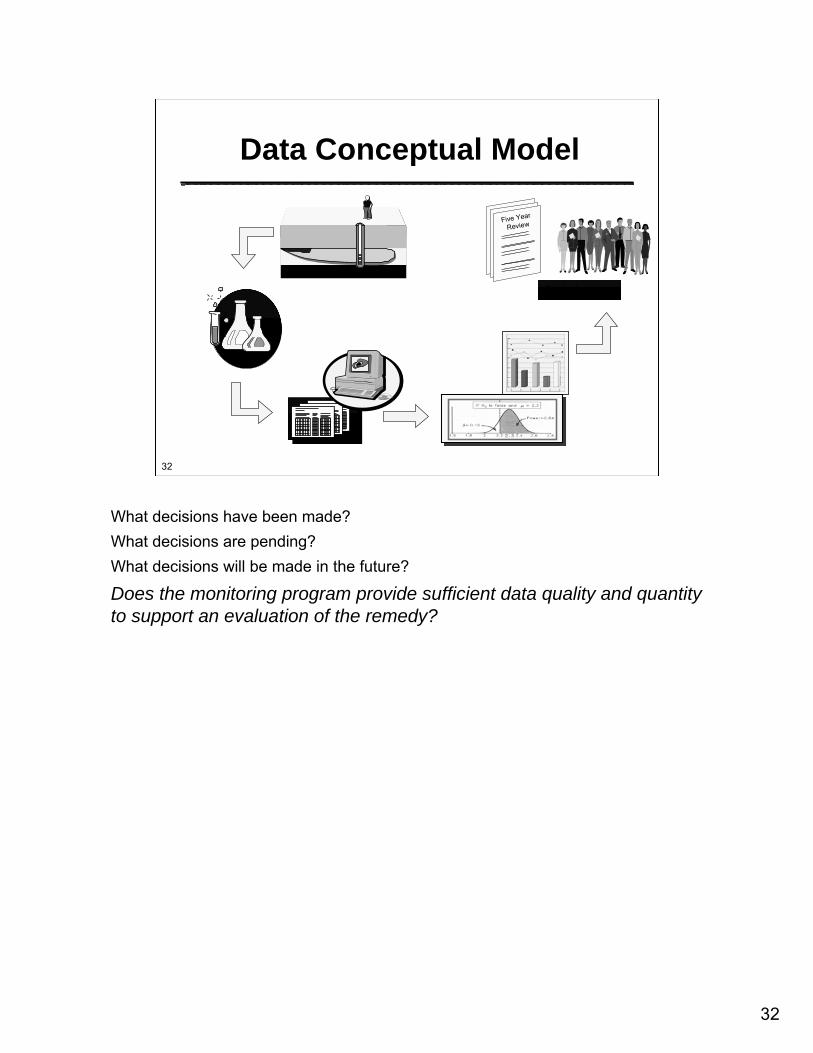
What decisions have been made?What decisions are pending?What decisions will be made in the future?
Does the monitoring program provide sufficient data quality and quantity to support an evaluation of the remedy?
113
113
Top Challenges
Information disorganized, contained in many reports, not centralized;No electronic database, missing data, lack of detection limits;Database errors: wrong CAS numbers, multiple names for the same well, multiple COC names;Data not well reviewed: dilutions in database, filtered samples; laboratory artifacts not identified;
114
114
Lack of vertical integration of information; managers don’t supervise database; poor communication among stakeholders;Lack of a statistically significant data set, big data gaps, uneven sampling intervals;No location coordinates, missing location coordinates, no shape/GIS files;No monitoring objectives, no decision points identified.
Top Challenges
115
115
Hydrogeology
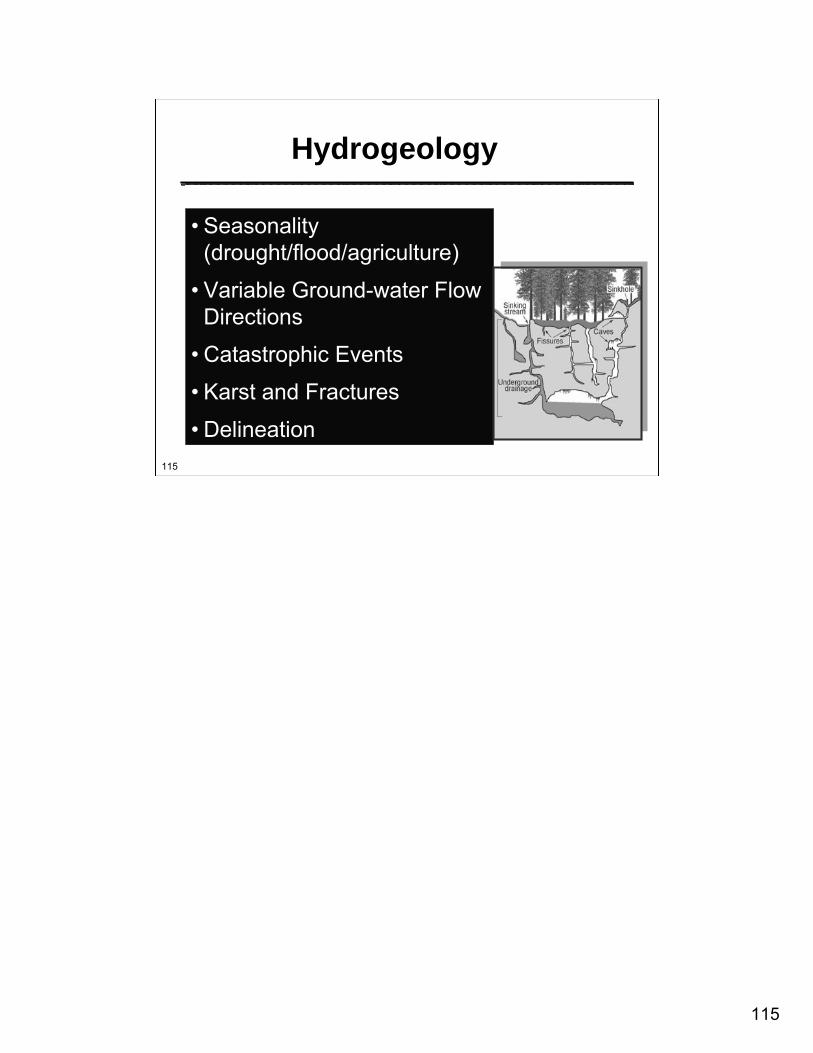
• Seasonality (drought/flood/agriculture)
• Variable Ground-water Flow Directions
• Catastrophic Events
• Karst and Fractures
• Delineation
116
116
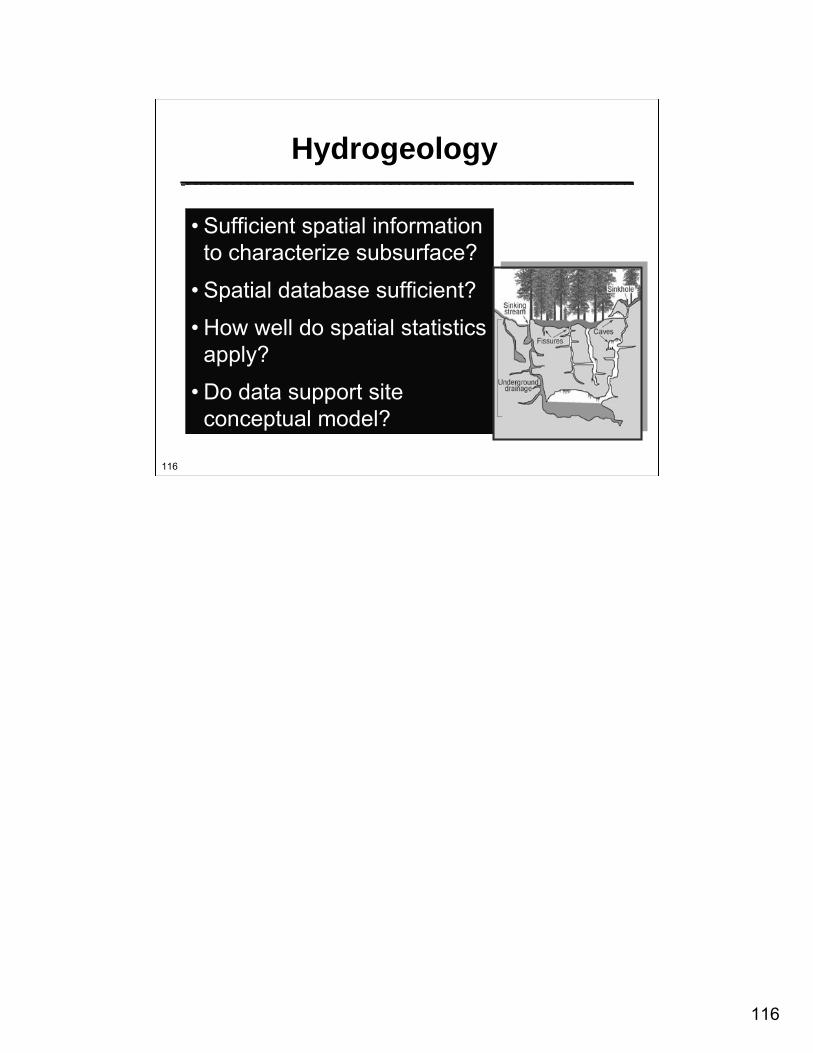
Hydrogeology
• Sufficient spatial information to characterize subsurface?
• Spatial database sufficient?
• How well do spatial statistics apply?
• Do data support site conceptual model?
117
117
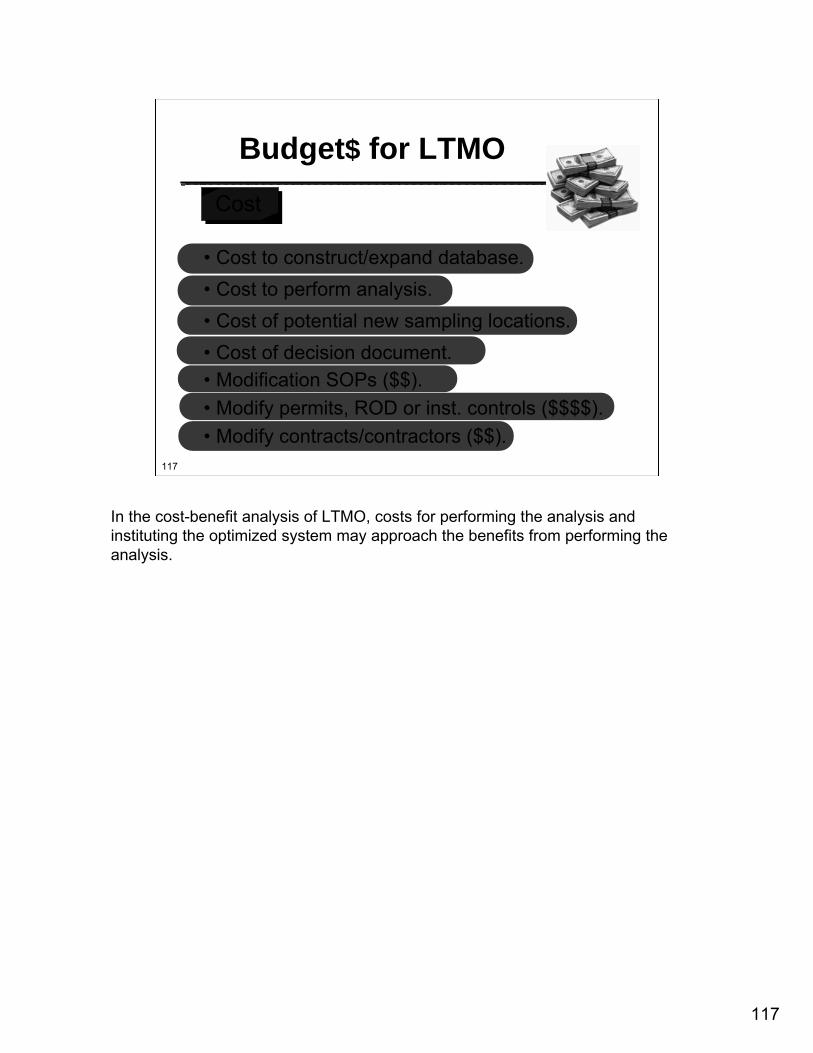
Budget$ for LTMOCost
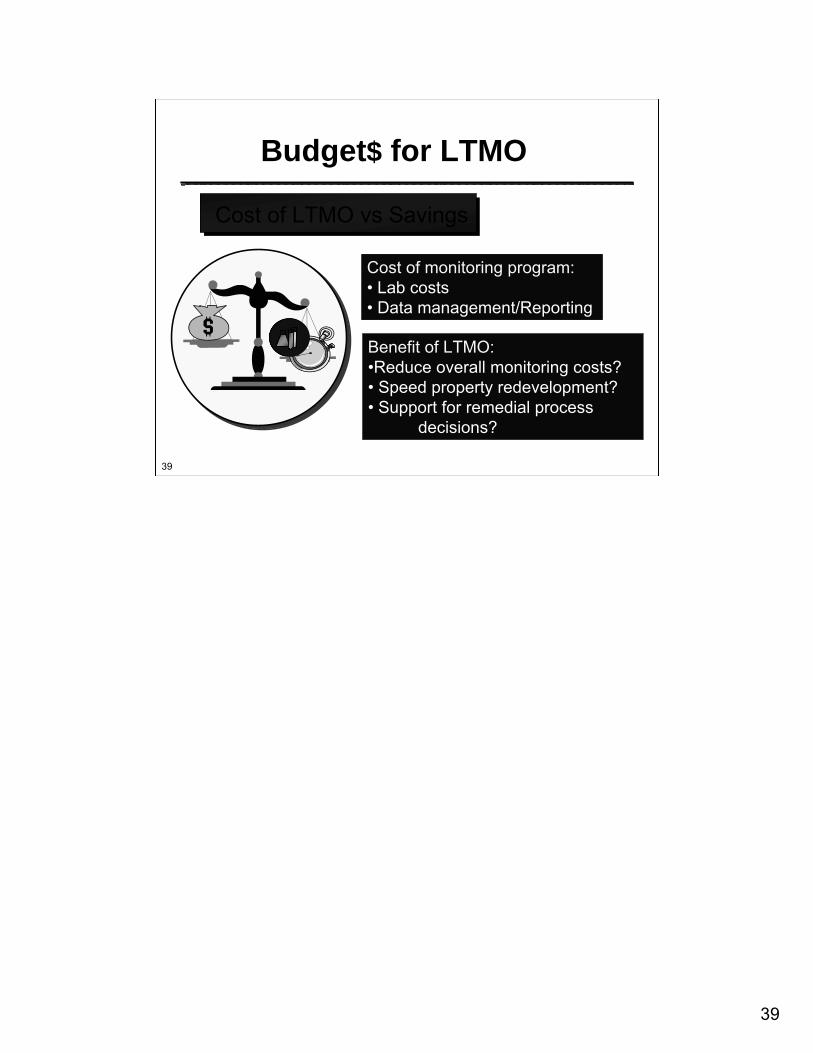
• Cost to construct/expand database.• Cost to perform analysis.• Cost of potential new sampling locations.• Cost of decision document.• Modification SOPs ($$).• Modify permits, ROD or inst. controls ($$$$).• Modify contracts/contractors ($$).
In the cost-benefit analysis of LTMO, costs for performing the analysis and instituting the optimized system may approach the benefits from performing the analysis.
118
118
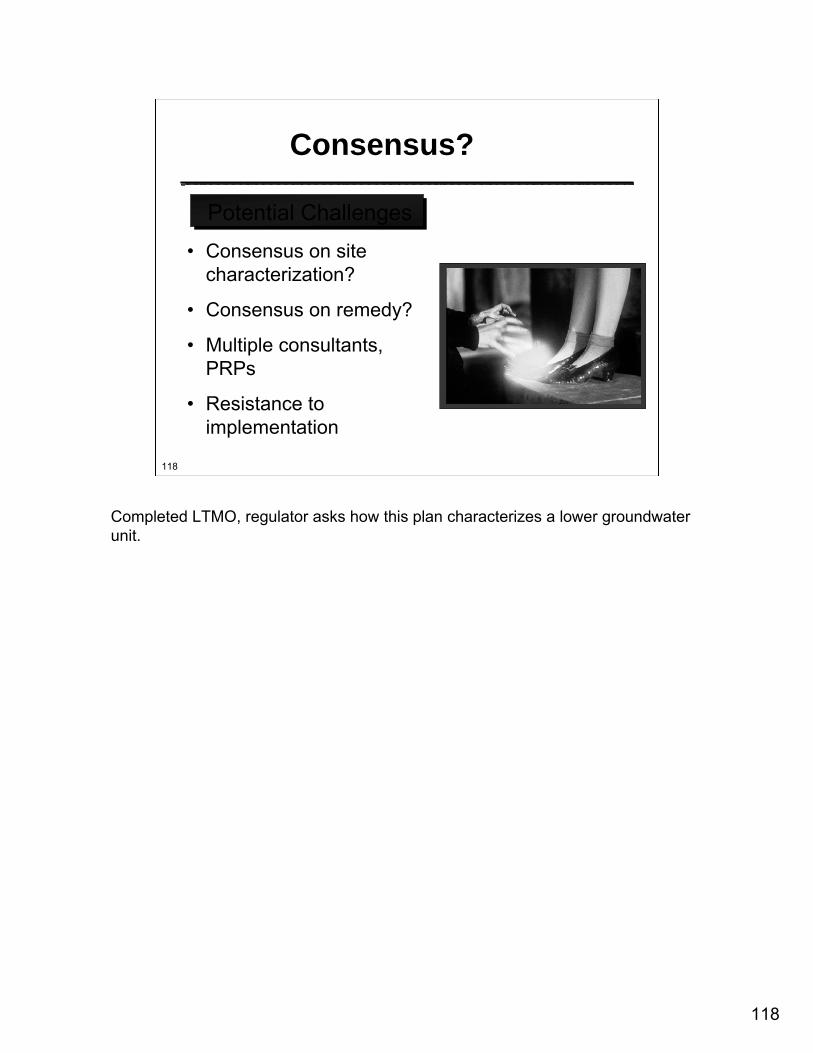
Consensus?
Potential Challenges
• Consensus on site characterization?
• Consensus on remedy?
• Multiple consultants, PRPs
• Resistance to implementation
Completed LTMO, regulator asks how this plan characterizes a lower groundwater unit.
119
119
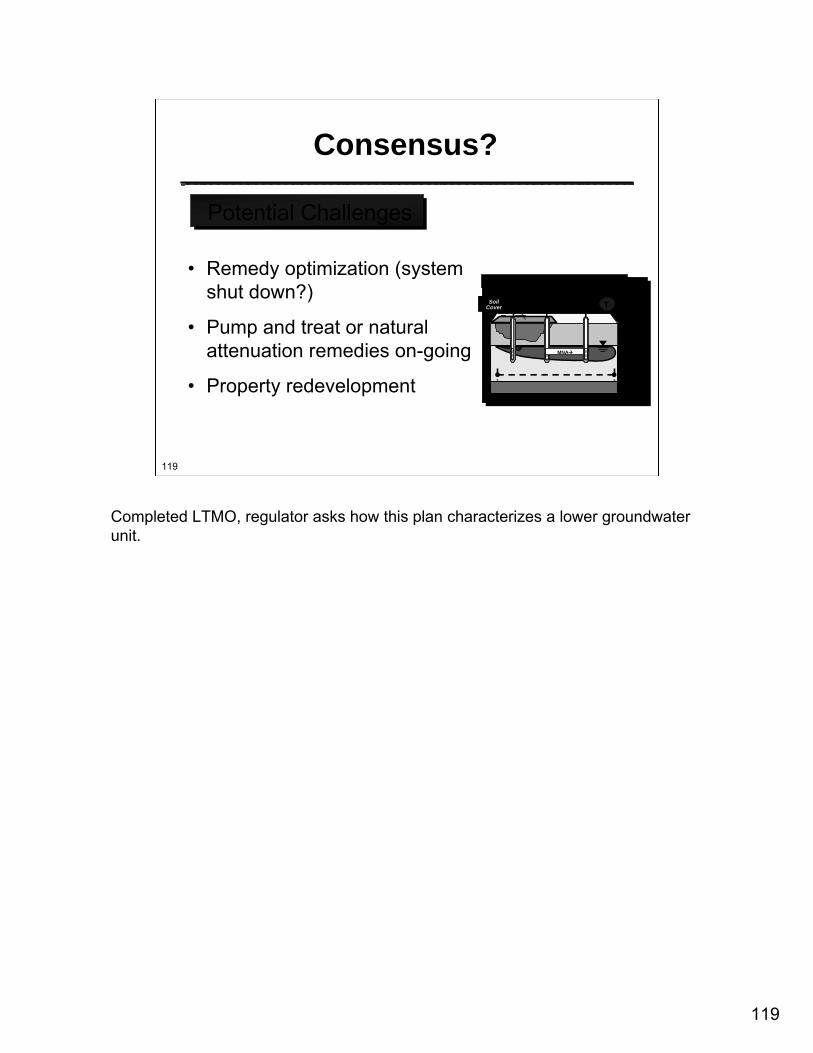
Consensus?
Potential Challenges
• Remedy optimization (system shut down?)
• Pump and treat or natural attenuation remedies on-going
• Property redevelopment
REMEDY UNDERWAY
MNA
TPump & Treat SystemSoil Cover
Completed LTMO, regulator asks how this plan characterizes a lower groundwater unit.
120
120
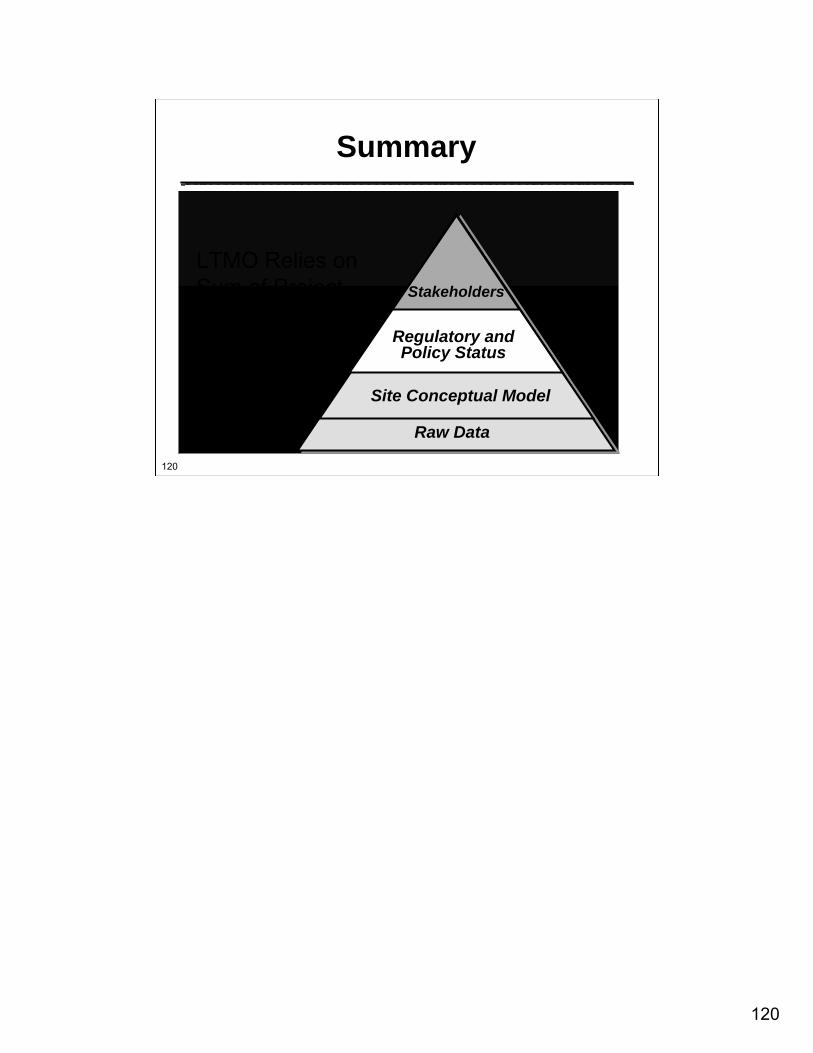
Summary
LTMO Relies on Sum of Project Data and Decisions
Raw Data
Site Conceptual Model
Stakeholders
Regulatory and Policy Status
121
121
Questions?Questions?
122
122
THANKS FOR THANKS FOR PARTICIPATING!PARTICIPATING!
After viewing the links to additional resources, please complete our online feedback form.