Published: October 13, 2011 r2011 American Chemical Society 8492 dx.doi.org/10.1021/ac201775f | Anal. Chem. 2011, 83, 8492–8500 ARTICLE pubs.acs.org/ac Top Notch Design for Fiber-Loop Cavity Ring-Down Spectroscopy Cathy M. Rushworth, Dean James, Jason W. L. Lee, and Claire Vallance* Department of Chemistry, University of Oxford, Chemistry Research Laboratory, 12 Mansfield Road, Oxford, OX1 3TA, U.K. ’ INTRODUCTION Cavity ring-down spectroscopy (CRDS) is a highly sensitive spectroscopic technique most commonly used for measuring weak absorptions of trace gas species. 1 Light is trapped within an optical cavity usually formed from two highly reflective super- mirrors, gaseous sample is introduced between the two mirrors, and the increase in cavity losses is measured by comparing the decay time constant for the cavity (the “ring-down time”) in the absence and presence of sample. 2 CRDS gains its sensitivity from two sources: first, as the light is trapped within a high finesse cavity, the path length through the sample is vastly increased relative to a single-pass experiment; second, the decay time is independent of the initial light intensity, so the measured signal is essentially immune to fluctuations in the intensity of the light source. The use of two-mirror cavities has reached maturity over the past few decades. However, interesting cavity innovations continue to emerge, particularly in the area of small volume liquid sample analysis. 3,4 Fiber-optic-based variants of CRDS are parti- cularly attractive for small volume liquid analysis since the small size of optical fibers (typically <500 μm core diameter) means that picoliter to nanoliter sample volumes can easily be inter- rogated. There are two types of fiber-optic-based cavities, employing linear and loop configurations, respectively. Linear fiber CRDS measurements use a length of fiber with either mirrors 57 or fiber Bragg gratings 8 at either end to confine the light in the cavity, in a direct analogue to the two-mirror approach. In this case, a region of the fiber cladding is often stripped and the evanescent field from the surface of the fiber core is absorbed by sample in contact with the fiber surface. In a potentially simpler cavity arrangement, fiber-loop CRDS, 9 the cavity comprises a loop of optical fiber formed by join- ing together two ends of a length of optical fiber. Light is side-coupled into and out of the fiber-loop cavity, and sample can be introduced to the circulating light simply by separating the two fiber ends by a short distance and injecting liquid sample between the fiber ends. The first fiber-loop CRDS measurements were reported by Stewart and co-workers, 10 who constructed a cavity from standard fiber-optical components and inserted a 5 cm microoptical gas sample cell. The sample region in this case (even without an absorbing species) introduced a loss of around 20% per pass, with further losses from the couplers. A fiber amplifier was required in order to offset the loop losses, and the sensitivity of the measurements thus became dependent on the amplifier’s stability. Passive (nonamplified) fiber-loop CRDS has been developed by Loock and co-workers. 11,12 In the first pulsed CRDS experiments, light from a Nd:YAG-pumped dye laser was coupled into and out of the fiber loop by bending the optical fiber at two different positions and exploiting the resulting macro- bending losses. Bend coupling is inherently inefficient: Loock’s group reported a coupling fraction of 10 8 when coupling light into the loop and 10 4 when coupling out using 3 cm bends in a loop of 50 μm core diameter optical fiber, 11 and the coupling losses themselves were significantly higher, since light was lost in all directions from the bend. Coupling efficiency can be improved by using smaller bends, but at the cost of higher round-trip losses. An alternative coupling strategy is to use commercially available couplers, although these are also relatively inefficient, and often occasion higher insertion losses than expected. Lehmann and co- workers used two 99%/1% split ratio input/output couplers and found round-trip losses of around 13%, attributed to losses from Received: July 10, 2011 Accepted: October 13, 2011 ABSTRACT: Fiber-loop cavity ring-down spectroscopy (CRDS) is a highly sensitive spectroscopic absorption technique which has shown considerable promise for the analysis of small-volume liquid samples. We have developed a new light coupling method for fiber-loop CRDS, which overcomes two disadvantages of the technique: low efficiency light coupling into the cavity and high loss per pass. The coupler is based on a 45° reflective notch polished between 10 and 30 μm into the core of a large-core-diameter (365 μm) optical fiber, and allows for nearly 100% light coupling into the cavity, with a low loss per pass (<4%). The coupler has the additional advantage that the input and output light is spatially separated on opposite sides of the fiber. The detection sensitivity of a fiber-loop CRD spectrometer employing the new coupling method is established from ring-down measurements on aqueous rhodamine 6G (Rh6G) at 532 nm. The results are compared with data obtained using the same light source and detector, but a conventional bend-coupled small-core-diameter (50 μm) optical fiber loop. With our new coupler, a detection limit of 0.11 cm 1 is found, which corresponds to detection of 0.93 μM Rh6G in a volume of only 19 nL. This is an improvement of over an order of magnitude on our bend-coupled small-core optical fiber results, in which a detection limit of 5.3 cm 1 was found, corresponding to a detection of 43 μM Rh6G in a volume of 20 pL.
Transcript
Published: October 13, 2011
r 2011 American Chemical Society 8492 dx.doi.org/10.1021/ac201775f |Anal. Chem. 2011, 83, 8492–8500
ARTICLE
pubs.acs.org/ac
Top Notch Design for Fiber-Loop Cavity Ring-Down SpectroscopyCathy M. Rushworth, Dean James, Jason W. L. Lee, and Claire Vallance*
Department of Chemistry, University of Oxford, Chemistry Research Laboratory, 12 Mansfield Road, Oxford, OX1 3TA, U.K.
’ INTRODUCTION
Cavity ring-down spectroscopy (CRDS) is a highly sensitivespectroscopic technique most commonly used for measuringweak absorptions of trace gas species.1 Light is trapped within anoptical cavity usually formed from two highly reflective super-mirrors, gaseous sample is introduced between the two mirrors,and the increase in cavity losses is measured by comparing thedecay time constant for the cavity (the “ring-down time”) in theabsence and presence of sample.2 CRDS gains its sensitivity fromtwo sources: first, as the light is trapped within a high finessecavity, the path length through the sample is vastly increasedrelative to a single-pass experiment; second, the decay time isindependent of the initial light intensity, so the measured signal isessentially immune to fluctuations in the intensity of the lightsource. The use of two-mirror cavities has reached maturity overthe past few decades. However, interesting cavity innovationscontinue to emerge, particularly in the area of small volume liquidsample analysis.3,4 Fiber-optic-based variants of CRDS are parti-cularly attractive for small volume liquid analysis since the smallsize of optical fibers (typically <500 μm core diameter) meansthat picoliter to nanoliter sample volumes can easily be inter-rogated. There are two types of fiber-optic-based cavities,employing linear and loop configurations, respectively. Linearfiber CRDS measurements use a length of fiber with eithermirrors5�7 or fiber Bragg gratings8 at either end to confine thelight in the cavity, in a direct analogue to the two-mirrorapproach. In this case, a region of the fiber cladding is oftenstripped and the evanescent field from the surface of the fibercore is absorbed by sample in contact with the fiber surface.
In a potentially simpler cavity arrangement, fiber-loop CRDS,9
the cavity comprises a loop of optical fiber formed by join-ing together two ends of a length of optical fiber. Light is
side-coupled into and out of the fiber-loop cavity, and samplecan be introduced to the circulating light simply by separating thetwo fiber ends by a short distance and injecting liquid samplebetween the fiber ends. The first fiber-loop CRDSmeasurementswere reported by Stewart and co-workers,10 who constructed acavity from standard fiber-optical components and inserted a5 cmmicrooptical gas sample cell. The sample region in this case(even without an absorbing species) introduced a loss of around20% per pass, with further losses from the couplers. A fiberamplifier was required in order to offset the loop losses, and thesensitivity of the measurements thus became dependent on theamplifier’s stability. Passive (nonamplified) fiber-loop CRDS hasbeen developed by Loock and co-workers.11,12 In the first pulsedCRDS experiments, light from a Nd:YAG-pumped dye laser wascoupled into and out of the fiber loop by bending the optical fiberat two different positions and exploiting the resulting macro-bending losses. Bend coupling is inherently inefficient: Loock’sgroup reported a coupling fraction of 10�8 when coupling lightinto the loop and 10�4 when coupling out using 3 cm bends in aloop of 50 μm core diameter optical fiber,11 and the couplinglosses themselves were significantly higher, since light was lost inall directions from the bend. Coupling efficiency can be improvedby using smaller bends, but at the cost of higher round-trip losses.An alternative coupling strategy is to use commercially availablecouplers, although these are also relatively inefficient, and oftenoccasion higher insertion losses than expected. Lehmann and co-workers used two 99%/1% split ratio input/output couplers andfound round-trip losses of around 13%, attributed to losses from
Received: July 10, 2011Accepted: October 13, 2011
ABSTRACT: Fiber-loop cavity ring-down spectroscopy (CRDS) is a highlysensitive spectroscopic absorption technique which has shown considerablepromise for the analysis of small-volume liquid samples. We have developed anew light coupling method for fiber-loop CRDS, which overcomes twodisadvantages of the technique: low efficiency light coupling into the cavityand high loss per pass. The coupler is based on a 45� reflective notch polishedbetween 10 and 30 μm into the core of a large-core-diameter (365 μm) opticalfiber, and allows for nearly 100% light coupling into the cavity, with a low loss perpass (<4%). The coupler has the additional advantage that the input and output light is spatially separated on opposite sides of thefiber. The detection sensitivity of a fiber-loopCRD spectrometer employing the new couplingmethod is established from ring-downmeasurements on aqueous rhodamine 6G (Rh6G) at 532 nm. The results are compared with data obtained using the same lightsource and detector, but a conventional bend-coupled small-core-diameter (50 μm) optical fiber loop. With our new coupler, adetection limit of 0.11 cm�1 is found, which corresponds to detection of 0.93 μM Rh6G in a volume of only 19 nL. This is animprovement of over an order of magnitude on our bend-coupled small-core optical fiber results, in which a detection limit of5.3 cm�1 was found, corresponding to a detection of 43 μM Rh6G in a volume of 20 pL.
the two couplers, the four splices required to insert the couplersinto the loop, and the sample region (an optical fiber taper).13
Waechter and co-workers recently made the fairly modestsuggestion that coupling 0.5% of the initial source light intothe cavity and keeping coupling losses below 20% representdesirable design parameters.14 To achieve this, they designed acustom interface for sending light into the fiber loop. In theirinterface, a single-mode fiber-coupled laser was aligned at ashallow angle (6�), with a large (190 μm) gap in a loop of 200 μmcore diameter optical fiber. Light was thus coupled into thefiber loop through one of the fiber ends, albeit with relatively lowintensity, and out-coupled at a large bend (8 cm radius). Round-trip gap losses totalling 23% were found, with an additional 10%loss from fiber absorptions at 405 nm. The two main drawbacksof fiber-loop CRDS should be emphasized. The first is commonto both fiber-loop and two-mirror CRDS experiments: becauseof the need to retain low losses on each cavity round-trip, only asmall amount of light can be coupled into or out of the cavity oneach pass. This means that a high-power light source (typically alaser) and a sensitive detector (typically a photomultiplier tube)are normally required. The second drawback is more specific tofiber-loop CRDS, and involves the high loss inherent in a fibercavity system relative to a two-mirror setup. This is owing to thedifficulty associated with coupling light into the side of an opticalfiber, as well as to the high losses associated with introduction of asample region to the fiber-loop cavity.
We have been working on developing a compact, low-cost,easy-to-operate fiber-loop CRD spectrometer for applications inmicrofluidics and chemical sensing. Such an instrument mustnecessarily employ a relatively low energy laser source, and inorder to optimize our signal levels, we ideally require a highlyefficient means for side-coupling light into our fiber loop. Wehave recently developed a reflective notch coupler that fits theserequirements15 for coupling into large-core fiber (at present thedemands of the fabrication process mean we are unable toincorporate notch couplers into small-core fiber loops). Ournew coupler allows nearly 100% of appropriately focused light toenter the cavity, while maintaining a relatively low loss per pass of<4%. In addition, the device functions as both an input and anoutput coupler. Light is introduced and ejected from oppositesides of the fiber, allowing us to separate the input and outputlight spatially without the need for an additional beam splitter.This is a significant improvement on previous fiber-loop cavityarrangements discussed above.
To demonstrate the performance of our new coupler, we haveinvestigated fiber-loop CRDS using both small-core and large-core multimode optical fibers under different coupling condi-tions: bend coupling in the case of the small-core fiber and notchcoupling for the large-core fiber. We have established thedetection limit for each system through direct absorption experi-ments on a common laser dye, rhodamine 6G (Rh6G). The useof larger core optical fiber is desirable for several reasons: thelarger end separations that may be achieved improve the detec-tion sensitivity of the system, and also the larger fiber diameterimproves both the ease of alignment and tolerance to misalign-ment. It should be emphasized that this paper is intended as acomparison between two types of fiber-loop cavities suitable foruse with a laser pulse in the microjoule energy range. As such, thispaper is a comparison between the results from two distinctlydifferent optimized fiber-loop cavity arrangements which use thesame laser source and detector. With more powerful laser pulses,less efficient coupling techniques (e.g., coupling in at a very loose
bend in the fiber) can be used, with concomitantly lower losses,but these are not suitable for use with our current light source.
’THEORY
The ring-down time τ of an optical cavity is defined as the timetaken for the light to decay to 1/e of its initial intensity. In both atwo-mirror cavity and a fiber-loop cavity, τ (s) is dependent onthe cavity length d (m), the refractive index of the cavity mediumnc, the speed of light in a vacuum c (m s�1) and the total round-trip transmission Ttot:
τ0 ¼ ncdcð � ln TtotÞ ð1Þ
In a two-mirror cavity, the cavity losses L = 1� T arise almostsolely from losses at the mirrors, determined by the mirrorreflectivity R, while in a fiber-loop cavity the cavity losses arisefrom the couplers used to send light into and out of the fiber loop,from any splices (joints) in the loop, and from absorption by thefiber, kfd, where kf is the wavelength-dependent attenuationcoefficient (m�1) of the fiber core.11,12 The refractive index ofthe cavity medium, nc, corresponds to the refractive index of theundoped fused silica fiber core, which has a value of 1.461 at532 nm.16
If an absorbing species is added to the cavity, then the ring-down time decreases as the cavity exhibits a higher loss. In thiscase, the expression for the ring-down time must be modified toinclude the Beer�Lambert law absorbance αCl, where α is theabsorption coefficient of themolecular species (dm3mol�1 m�1),Cis its concentration (mol dm�3), and l is the path length (m) ofthe light through the sample. In our case, the path length l isdetermined by the gap between the fiber ends, and may bemeasured accurately using a microscope. In the following, wedefine the absorption per unit path length, k = αC. The resultingring-down time in the presence of a sample is
τ ¼ ncdcð � ln Ttot þ klÞ ð2Þ
Recording ring-down traces in the absence (τ0) and presenceof an absorber (τ) allows k to be determined:
k ¼ ncdcl
1τ� 1τ0
� �ð3Þ
The minimum detection limit, kmin (m�1), can be approximated
(assuming ττ0 ≈ τ02) as17
kmin ¼ ncdΔτminclτ02
ð4Þ
where Δτmin is the minimum detectable change in ring-downtime. In our experiments, we define Δτmin as three times thestandard deviation (σ) in the baseline ring-down τ0, which isrecorded for each experiment. It should be emphasized thatimproving the sensitivity of a ring-down measurement reliesprimarily onminimizing the baseline losses andmaximizing τ0, aswell as on increasing the path length of the light through thesample on each pass.
’EXPERIMENTAL SECTION
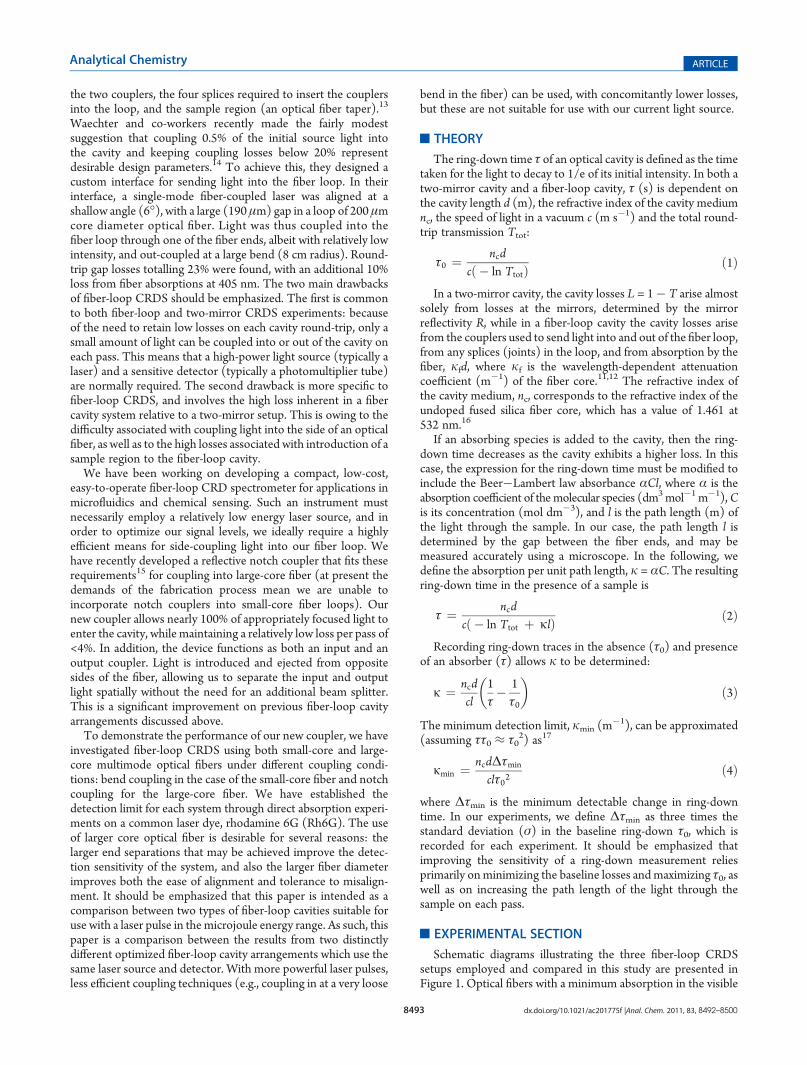
Schematic diagrams illustrating the three fiber-loop CRDSsetups employed and compared in this study are presented inFigure 1. Optical fibers with a minimum absorption in the visible
region of the spectrum were chosen (kf = 0.003 45 m�1 at532 nm, taken from the manufacturer’s specification). Thecavities, fabricated from either 50 μm core diameter optical fiber(SFS50/125Y, Fiberguide Industries) or 365 μm core diameteroptical fiber (BFH22-365, Thorlabs), will be discussedseparately below.Light Coupling. In the experiments with 50 μm fiber, bend
couplers are used to couple light into and out of the loop(Figure 1a).18 Loss of light from an optical fiber on bending(often referred to as a “macrobending” loss) is a well-knownphenomenon, and has even been characterized in fiber-basedCRDSmeasurements.5,7,12When an optical fiber is bent, some ofthe light traveling in the fiber core no longer strikes the core-cladding boundary at an angle greater than or equal to the criticalangle θc required for total internal reflection to occur. [Thecritical angle is defined by Snell’s law θc = sin�1(n2/n1), wheren1 > n2.] This light is instead refracted through the cladding, andmay be detected. Conversely, if a tight bend is illuminated ata suitable angle, then light can also be coupled into the fiber corein this manner. Custom-made poly(methyl methacrylate)(PMMA) couplers were fabricated, in which the fiber is clampedbetween a cylinder of radius 9 mm and a prism designed to directlight into and out of the bend at the appropriate angle (shown tothe right of Figure 1a). It is important to clamp the fibers verygently into the couplers to preclude losses caused by theapplication of undue pressure at the bend regions. The 9 mmbends used in these experiments caused a macrobending loss ofabout 2�3.5% per coupler, leading to a baseline loss of 4�7% perpass from the couplers alone once an input coupler and an outputcoupler were introduced into the loop. Tighter bends result inhigher coupling efficiency, and therefore increased signal levels,but at the cost of increased loop losses, and the bend radiuschosen for these experiments was the best compromise betweenthese two factors for the laser source and detector employed.
For a given bend radius, the increase in macrobending losswith increasing fiber core diameter is well-known. Indeed, wehave recorded ring-down signals (not shown) for bend-coupled105 μm core diameter optical fiber (SFS105/125Y, FiberguideIndustries) in the same way as discussed above, and we found thecoupling losses to be around 15%. The losses for 365 μm corediameter, bend coupled, are much higher. These high lossesmean that for our purposes, bend coupling is not appropriate forlarge-core-diameter fiber-loop cavities.Notch Coupler. A detailed description of the design and
fabrication of the reflective notch used for side-coupling lightinto optical fibers can be found in a recent publication by theauthors,15 and will not be covered in detail here. Briefly, thecoupler comprises a 45� notch polished into the side of one ofthe optical fiber ends and processed such that the resultingfeature has ametallic mirror coating on the angled face. Our fabri-cation process is low-cost, is rapid, and does not require anyhighly specialized equipment. The current work focuses on theuse of the reflective notch as both an input coupler and an outputcoupler for fiber-loop CRDS, as shown in Figure 1, to the right ofFigure 1b and Figure 1c, respectively. The penetration depth ofthe notch into the fiber core defines the coupling loss in oursystem, and thus we minimize the penetration depth in order tominimize the losses. If a light source is focused appropriately ontothe notch, then nearly 100% of the incident light is coupled intothe fiber-loop cavity, with a low loss per pass (<4%) for thecirculating radiation. These diagrams are the results of simula-tions carried out using the Zemax optical modeling software suite(Zemax Development Corp., 2008). In the simulations, we havefound that all the light incident on the core region of the notch iscoupled into the fiber core, if the notch surface is modeled as100% reflective. Of course, in practice the reflection at the notchsurface will be less than 100%, depending on the coating type andquality, as well as the angle of incidence at the surface and the
Figure 1. Schematic of the three fiber-loop CRDS setups and two coupling arrangements used in the present work: (a) bend-coupled 50 μm opticalfiber loop; (b) notch-coupled 365μmoptical fiber loop, with sample introduced at a second gap in the loop; (c) notch-coupled 365μmoptical fiber loop,with sample introduced in the notch-coupling region. The bend and notch couplers are shown schematically to the right of the relevant fiber loops.Zemax optical ray tracing simulations demonstrating input and output coupling at the notch coupler are superimposed on the diagrams.
wavelength of light used. In our case, silver was chosen as themetal coating as it has high reflectance over the visible and near-IR spectrum.We found that the loss in the notch region was greatly reduced
by refractive index matching the surroundings to that of the fiber,as expected. Immersing the coupling region in water wassufficient to reduce refraction and reflection loss greatly. At smallnotch penetration depths (<10% into the fiber core), losses aredominated by the quality of the optical fiber ends, rather than bythe notch surface. In effect, this is because we expect all lightencountering the mirrored notch to be coupled out of the fiber(and detected), whereas the quality of the flat fiber faces definesthe loss repeatedly experienced by the total light traveling aroundthe fiber loop.An alternative coupling strategy is to use an uncoated, nonre-
flective notch. In this case, the notch may be used as an inputcoupler, by directing light toward the notch at a near-normalangle to the fiber axis from the opposite side of the fiber to thenotch. Total internal reflection allows for high efficiency lightcoupling into the fiber loop: indeed, similar designs have beenused in side-pumped fiber lasers.19 While the fabrication of thiscoupler is simple as it only involves polishing, there are twodisadvantages of the nonreflective notch over the reflective notchcoupler. First, the uncoated notch does not function well as anoutput coupler: rather than the light incident on the notch beingreflected out of the fiber, most of the light incident will insteadrefract into cladding modes. This means that the overall signaldetected is lower. Second, index matching fluid cannot beintroduced to reduce losses associated with the break in the fiberat the coupler, since this leads to a drastic increase in the criticalangle for total internal reflection at the notch surface to wellabove 45�. This is in contrast to the reflective notch coupler,which relies on specular reflection at a metallic interface ratherthan on total internal reflection.Sample Region. Liquid is introduced in to the fiber cavities at a
small gap in the fiber loop, as shown in Figure 1. In arrangements aand b, the gap is remote from the coupling region, while inarrangement c, a gap is introduced by separating the fiber ends atthe notch coupler. The fiber ends must be of extremely highquality, in order to minimize losses at the interface between thefiber ends and the sample. In the case of the small-core fiber, fiberends are prepared by stripping the soft plastic jacket (T06S13,Thorlabs), and then cleaving with a fiber cleaver (CT-30,Fujikura). However, this cleaver is restricted to a maximum fibercladding diameter of 125 μm. For larger core optical fibers, moreelaborate end preparation is necessary. The soft jacket is strippedfrom the large-core optical fiber using a fiber stripping tool(T18S31, Thorlabs) and then cleaved using a Shortix capillarycutter (21386-U, Sigma Aldrich), before polishing on a home-builtpolishing wheel using 0.1 μm diamond lapping film (693118SO,Buehler). The fiber end is polished until it is flat and defect free.This is the most critical stage of fiber preparation; if the fiber end isof poor quality or not polished at 90� to the fiber axis, then this willtranslate into much higher losses in the ring-down experiment.Liquid is introduced into the sample gap by placing a small
capillary tube underneath the fiber ends, which are mounted witha small end separation on a micrometer-precision three-axistranslation stage (MDE510, Elliot Scientific). The meniscusformed at the top of the small capillary tube is used to introducesample directly between the fiber ends. Fresh capillary tubes wereused for each sample, and the new capillary was placed under thefiber ends in order to measure the absorption of each sample. In
the case of the small-core fiber, changing the sample caused thebare fiber ends to misalign. To address this, the ends were gluedinto ferrules and hand polished using 1 μm lapping film. Thisprevented movement of the fiber ends when changing liquidsample. In contrast, no movement of the fiber ends was observedwhen changing liquid sample in the large-core fiber cavity. Anend separation of 10 μmwas used in the small-core fiber cavity a,whereas a larger end separation of 130 μm was used in the large-core fiber cavity b.In arrangement c, liquid is introduced at the coupling region
(Figure 1c), without the need for introducing a second gap forthe sample. This results in lower cavity losses; however, realign-ment of the input beam is sometimes required when changingliquid sample between the fiber ends. When carrying outmeasurements in this configuration, the fiber ends at the notchregion were separated by 180 μm. The end separations werechosen such that the optical loss introduced to the loop by thesample region was similar in all three setups.Light Source and Detector. The light source used was a
frequency-doubledNd:YAG laser (NP-10620-100, Teem Photo-nics) which produces 0.9 ns, 6 μJ pulses of 532 nm light at arepetition rate of 7.4 kHz. The laser light is focused onto the fibercoupling region using a lens with a focal length of 20 cm. In thecase of the small-core fiber, light from the output bend coupler isdetected directly by a photomultiplier tube (PMT; H10304-06-NF, Hamamatsu), while for the large-core fiber loop, output lightfrom the notch coupler is directed to the PMT through a 3 mmdiameter liquid lightguide (NT53-428, Edmund Optics). In afiber-loop cavity, side coupling of light injects light into both thecore and cladding of the optical fiber. The short-lived claddingmodes often dominate the desired core mode signal at early timedelays after initial cavity excitation. Consequently, we time-gatethe PMT to cut out the first part of the ring-down signal.Typically, we start data acquisition 300�500 ns after the initiallaser pulse has entered the cavity, when the cladding modes havedecayed to negligible levels.
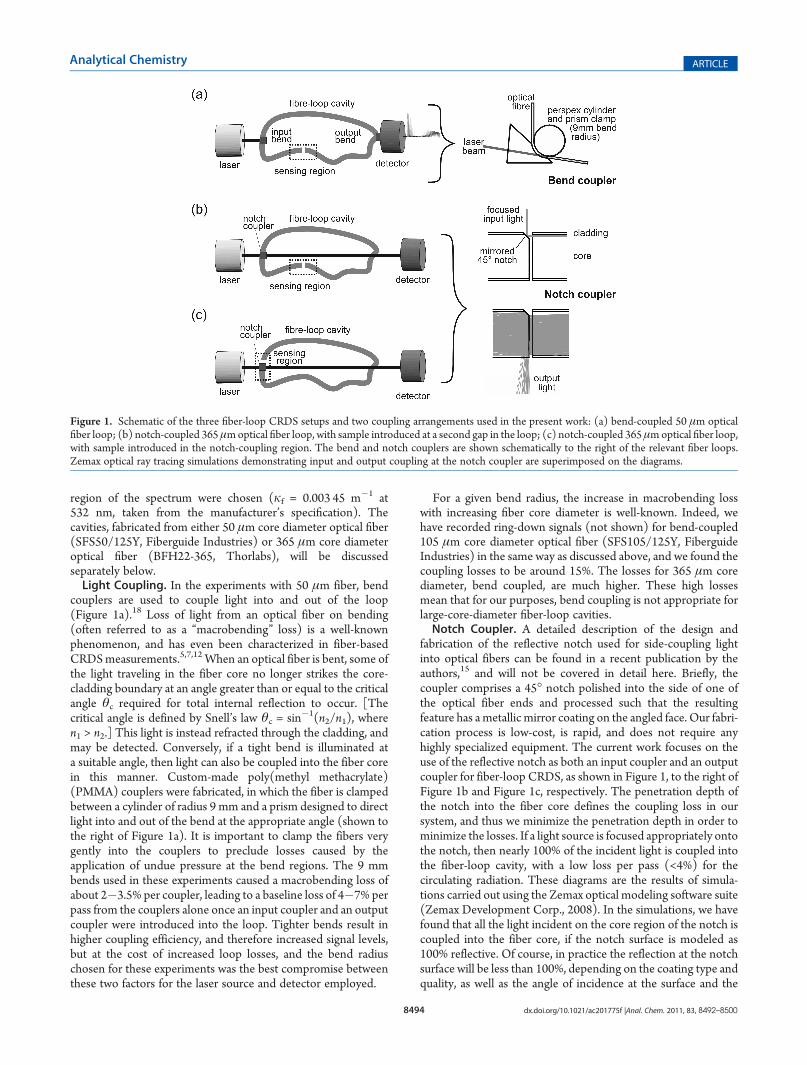
Figure 2. Typical ring-down signals obtained in fiber-loop CRDS,before introduction of a sample region. The nonexponentially decayingsignal at short time is eliminated from the data analysis, as indicated (seetext for further details). (a) Bend-coupled small-core fiber, fusionspliced: τ = 332 ns and d = 5.97 m. (b) Notch-coupled large-core fiber,fiber ends in water, no end separation: τ = 372 ns and d = 3.08 m.
Data Acquisition and Analysis. The ring-down signal fromthe PMT signal is visualized on an oscilloscope (either TDS 2024or TDS 3044B, Tektronix), which is interfaced to a personalcomputer via a GPIB-USB interface (778927-01, NationalInstruments). For the small-core fiber, single ring-down traces(averaged 128 times on the oscilloscope) were acquired andanalyzed after acquisition, whereas for the large-core fiber, ring-down traces (averaged 512 times on the oscilloscope) wereacquired and analyzed continuously using a home-written Lab-VIEW program (National Instruments, LabVIEW 10). Dataacquisition is currently limited to 4 traces per second by therelatively slow data transfer rate from the oscilloscope to thecomputer. The ring-down time of each recorded trace is deter-mined separately, and the values are averaged to give a final valuefor τ.Typical ring-down traces for both bend-coupled and notch-
coupled fiber-loop CRDS setups are presented in Figure 2. Sincethe laser pulse is significantly shorter than the round-trip time ofthe fiber-loop cavity, the optical signal detected at the cavityoutput coupler consists of an exponentially decaying train ofpulses. Owing to the presence of rapidly decaying claddingmodes and the somewhat nonlinear response of the gatedPMT during the rising edge of the signal gate, the first part ofthe recorded ring-down trace is generally not exponential, and istherefore not fitted in the data analysis. The fitted regions of thecurves are indicated in Figure 2. Once the user has defined theregion of the trace to fit and the noise threshold, a peak findingalgorithm is employed in order to determine the amplitude S ofeach pulse in the ring-down pulse train. The ring-down time maythen be determined from the slope of a logarithmic plot of thepulse amplitudes versus time, i.e., ln S = ln S0 � t/τ. A least-squares fit to the slope is carried out, and we obtain typical R2
values over 99.8%, typically fitting to 20�80 data points.Establishing the Detection Sensitivity. The sensitivity of
each system is established using the known absorption of Rh6Gat 532 nm. The (base e) absorption coefficient of Rh6G at532 nm was established in single-pass measurements through a1 cm cuvette to be (1.22( 0.06)� 105 L mol�1 cm�1. Betweeneach dye measurement, the ring-down time in water wasrecorded, in order to ensure that it had returned to its baselinevalue and therefore that no dye remained in the sample region.
’RESULTS AND DISCUSSION
The goal of this work is to compare the capabilities of fiber-loop CRDS employing our new coupling method with those of a
conventional bend-coupled fiber-loop cavity. In order to do this,the following discussion will be organized according to the keyfigures of merit, namely coupling losses, sample region losses,signal intensity, cavity mode structure, and detection sensitivity.
In order to isolate the losses from each component of the ring-down cavity, three ring-down times were determined. Ring-downtime τ1 corresponds to a fusion spliced loop without a sampleregion. Ring-down time τ2 corresponds to a loop into which, inplace of a fusion splice, a break has been introduced in order toaccommodate a sample region, but the fiber ends are in contact(i.e., the sample gap is zero). Ring-down time τ3 corresponds tothe same loop as τ2, but with the fiber ends separated by adistance l at the sample region. It should be noted that, for cavitysetups a and c, d is the same for each τmeasurement. In the caseof cavity b, however, an extra length of fiber (about 1 m) wasinserted into the fiber loop betweenmeasuring τ1 and τ2, in orderto insert a second sample region remote from the notch-couplingregion. The relevant geometric parameters for each cavity,together with the ring-down times τ1, τ2, and τ3, are shown inTable 1. The larger d value noted above appears in squarebrackets in Table 1.
The total round-trip transmission, Ttot, is calculated from τand the known loop length d in each case, by rearranging eq 1thus:
Ttot ¼ e�ncd=τc ð5ÞTtot is separated into its components using the following
equations:
T1 ¼ TcouplersTspliceTfiber ð6Þ
T2 ¼ TcouplersTbreakTfiber ð7Þ
T3 ¼ TcouplersTbreakTgapTfiber ð8Þwhere Tcouplers is the transmission through the couplers, Tsplice isthe transmission through the fusion splice, Tbreak is the transmis-sion through the fiber ends at the sample gap, Tgap is thetransmission through the sample gap itself, and Tfiber is thetransmission through the fiber loop. In all cases, the equivalentloss L is given by L = 1� T. Tfiber = e�kfd and is calculated usingthe manufacturer’s specification and the known loop length. Theremaining terms, Tcouplers, Tsplice, Tbreak and Tgap, are establishedby solving eqs 6�8 simultaneously for each setup, with theexception of Tsplice, which was instead established to be 0.983 byinserting a second fusion splice into the ring-down loop, andrepeating this 10 times in order to determine the average fusionsplice loss. The detailed results from the analysis are presented inTable 2, in terms of both percentage and decibel loss.Coupling Losses.While coupling losses in two-mirror cavities
are simply defined by the mirror reflectivity, and are typically lessthan 0.2%, coupling losses in fiber cavities are typically signifi-cantly higher. As noted earlier, the couplers used to couple lightinto and out of the cavity are often one of the major sources ofloss within a fiber-loop cavity, with different types of couplerintroducing characteristic losses. Figure 2 compares ring-downtraces for cavities fabricated from bend-coupled small-core(Figure 2a) and notch-coupled large-core (Figure 2b) opticalfibers. Figure 2a corresponds to the τ1 measurement for cavity a,and Figure 2b corresponds to the τ1 measurement for cavity b. Inboth cases the dominant source of loss is the couplers, with lessercontributions from absorption by the fiber and the fusion splice
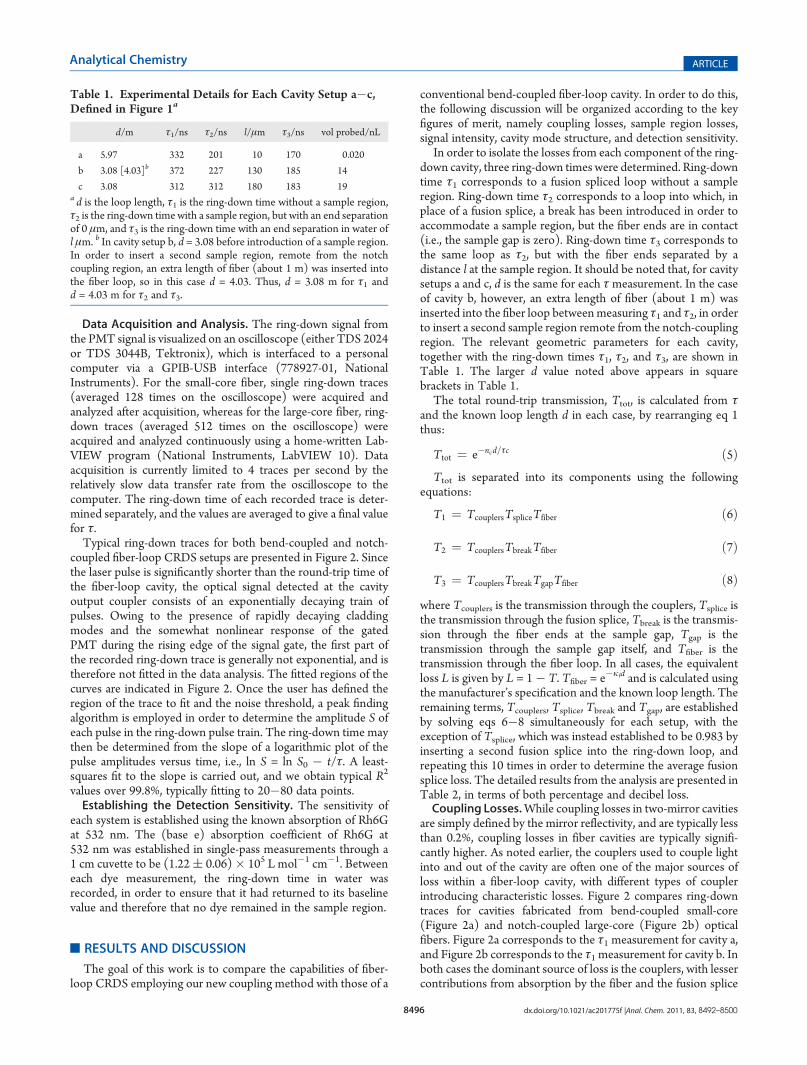
Table 1. Experimental Details for Each Cavity Setup a�c,Defined in Figure 1a
d/m τ1/ns τ2/ns l/μm τ3/ns vol probed/nL
a 5.97 332 201 10 170 0.020
b 3.08 [4.03]b 372 227 130 185 14
c 3.08 312 312 180 183 19a d is the loop length, τ1 is the ring-down time without a sample region,τ2 is the ring-down time with a sample region, but with an end separationof 0 μm, and τ3 is the ring-down time with an end separation in water ofl μm. b In cavity setup b, d = 3.08 before introduction of a sample region.In order to insert a second sample region, remote from the notchcoupling region, an extra length of fiber (about 1 m) was inserted intothe fiber loop, so in this case d = 4.03. Thus, d = 3.08 m for τ1 andd = 4.03 m for τ2 and τ3.
used to join the fiber ends into a loop, in the case of the small-corefiber. Having separated the contributions from the various lossprocesses (see Table 2), as explained in the previous section, wecan compare the coupling losses associated with the two experi-mental setups. For cavity a, the total coupling loss is 4.9%, or2.5% per bend, for the two 9 mm bends employed for input andoutput couplings. We typically find combined bend coupling andfusion splice losses to be in the region of 4�7% for 50 μm corediameter optical fiber, with the coupler loss being dependent onthe pressure exerted by the PMMA clamp on the fiber, and thesplice loss being dependent on the quality of the splice. For agiven bend radius, bend losses increase dramatically with thediameter of the fiber core. Increasing the bend radius reduces thelosses, but at the cost of a reduction in signal intensity due to lessefficient input coupling. For our applications, which employ arelatively low energy laser source; this makes bend couplingpoorly suited for use with large-core fibers in our experiments.Lower coupling losses are found for the notch-coupled large-
core-fiber ring-down shown in Figure 2b, for which Lcouplers =2.9%. The notch coupler reduces losses in two ways: first, thesame coupler functions as both an input coupler and an outputcoupler, so that only one coupler is needed; second, only a smallfraction of the light traveling in the cavity “sees” the coupler oneach pass, so the loss per pass can be minimized. By comparingLcouplers to Lbreak for cavity setup b, we can estimate the lossassociated with the notch and the fiber ends, respectively. In thiscase, Lbreak = 4.2%, which is in fact higher than Lcouplers. It shouldbe noted that the loss associated with the fiber ends is dependenton the quality of the polished fiber ends, which are polished on ahome-built polishing wheel, and thus the quality (and loss) tends
to vary somewhat. However, the data indicate that the majority ofthe loss measured at Lcouplers arises from losses between the fiberends rather than losses at the notch itself. Currently, our notchfabrication process requires a break in the fiber loop, but if analternative notch fabrication process was developed which didnot require breaking the fiber loop, then Lcouplers would bereduced substantially.Sample Region Losses. As explained in the Experimental
Section, a small gap is incorporated into the fiber loop into whicha liquid sample can be introduced. Figure 3 shows the normalizedtransmission across the gap for two cavities of configuration a,employing 50 and 105 μm core fibers, respectively, and onecavity of configuration b employing 365 μm core fiber. Thetransmission is calculated from the ring-down time, which hasbeen measured as a function of end separation for each cavity.The transmission is plotted as a function of the end separation, l,divided by the fiber core diameter ϕ, i.e., l/ϕ. Given that all threefibers have the same numerical aperture (0.22 in air), the threecurves should in principle be identical when plotted as a functionof l/ϕ. The black line in Figure 3 shows the results of a simulationbased on a model by Waechter et al.14 The model assumes aGaussian beam profile and a linear beam expansion coefficientdependent on the numerical aperture of the fiber, and it predictsthe coupling efficiency between two “perfect” fiber ends, forwhich the transmission is simply a function of the fiber core size(beam waist), the refractive indices of the fiber and surroundingmedium, and the end separation. In practice, the total transmis-sion across the gap is also a function of the reflection at each fiberend (which can be calculated using the Fresnel equations) andadditional scattering losses at the fiber ends themselves. We havenot included this in our model line shown on the graph inFigure 3, because the experimental values are normalized to thetransmission at 0 μm, which includes the reflection and (to someextent) scattering losses. Deviation from the model at larger endseparations is caused by either a non-Gaussian beam profile orsignificant scattering at the fiber ends, both of which cause thelight to diverge more rapidly than predicted by the fibernumerical aperture alone.By comparing the data for each cavity setup, we can see that
the notch-coupled loop is in good agreement with the model,indicating that the fiber ends are of high quality and that themode structure can be reasonably well-approximated as a Gauss-ian beam profile. In contrast, both bend-coupled fiber cavitiesdemonstrate poorer transmission than predicted by the model,particularly when l/ϕ > 0.4. In this case, both fiber ends werecleaved using a high precision cleaver, and we expect the losses atthe fiber ends themselves to be minimal. We believe that theadditional loss is primarily due to the poorer mode structure
Table 2. Percentage Losses for Each Cavity Setup a�c, Defined in Figure 1a
(0.209) (0.209) (0.356) (0.046) (0.163) (0.147)aThe same losses in units of dB are given in parentheses below the percentage value. Each term is defined after eqs 6�8. b In cavity setup b, d = 3.08 mbefore introduction of a sample region; hence Lfiber = 1.1% for L1. After insertion of a second sample gap, d = 4.03 m; hence Lfiber = 1.4% for L2 and L3.
Figure 3. Normalized transmission across the gap, Tgap, versus endseparation in units of fiber core diameter, l/ϕ, for cavity setup a withbend-coupled 50 and 100 μm fibers and cavity setup b with notch-coupled 365 μm fiber. The results of the model calculation (see text fordetails) are shown as the black solid line.
excited when bend coupling, which means that the losses arehigher than they would be if the beam had a more Gaussian-likeprofile. This is supported by the images shown in Figure 4 of lightemitted from each fiber end under different coupling conditions.Thus, notch coupling rather than bend coupling improves thetransmission at larger values of l/ϕ, primarily because of theimproved core mode structure achieved under these couplingconditions.The sample region losses LbreakLgap for the cavities used in the
detection sensitivity measurements are presented in Table 2. Lgapis minimized by keeping the path length between the two opticalfiber ends relatively short, although this of course comes at theexpense of the spectroscopic path length and the concentrationdetection limit. A greater problem in these experiments is thehigh loss between the two fiber ends, Lbreak, which is around 4%for the large-core fiber and 7% for the small-core fiber. As notedearlier, in order to make absorption measurements, the ends ofthe small-core fiber had to be mounted in ferrules in order tomaintain alignment. The fixing and polishing procedure intro-duces a small amount of loss relative to the fiber ends used inFigure 3, in which the fiber ends were simply cleaved and aligned.The large-core fiber, in contrast, is rigid enough to bemounted asbare fiber and still maintain alignment within the sensing region.Signal Intensity. As the notch coupler is vastly more efficient
at coupling incident light into the fiber than a bend coupler, thering-down signal intensity is improved dramatically; a maximumsignal of 4 V as read from the oscilloscope was found for thenotch-coupled loop, compared with maximum signals of around100 mV for bend-coupled loops (note that this is after time-gating the signal, as described previously, to remove the initialintense and rapidly decaying jacket and cladding modes thatpersist for approximately the first 300 ns after excitation of thecavity). The dramatic increase in signal intensity when notchcoupling is employed should allow the use of lower power lightsources and/or detectors than the laser/PMT combinationemployed in the present work.Cavity Mode Structure. In Figure 4, the mode structure
excited by the various coupling schemes is examined, via imagesof the light emitted from the fiber end. In all cases, the fiber endwas aligned approximately the same distance away from a CCDchip. In Figure 4a, in order to avoid saturating the CCD camera,only a small proportion of the laser beam was coupled into thefiber. The intensity of this image is therefore not directlycomparable with that of the remaining images. In contrast,
intensities b, c, and d were measured using the same neutraldensity filter in front of the laser beam, with optimized lightcoupling, and thus can be compared directly. The desirable modestructure is that shown in Figure 4a, which is an image of end-coupled 50 μm core diameter optical fiber. Conventional endcoupling predominantly excites core modes over claddingmodes. Images of light emitted from bend-coupled 50 μm corediameter and 105 μm core diameter fibers are shown inFigure 4b,c. A significant issue associated with bend couplingcan immediately be seen: light is coupled predominantly intocladding modes and higher order core modes, whereas the lightintensity in the core is low. In particular, the light emission for105 μm core diameter optical fiber shows the poorer modestructure resulting in this case: very little light is coupled into thecenter of the core, even compared to the amount of light coupledinto the center of the core when bend-coupling light into 50 μmcore fiber. In contrast, the improvement in core mode structurewhen notch coupling is employed is clear (Figure 4d). Light iscoupled predominantly into the core (with light emission closerto that of end-coupled optical fiber), and the emission is muchmore intense than in the bend-coupled case.Selective excitation of core modes rather than cladding modes
can be achieved with the notch coupler, as the percentagecoupled into either the core or the cladding is simply dependenton the alignment of the beam onto the notch. If the beam isaligned onto the core area of the notch only, then in theory 100%core excitation and 0% cladding excitation can be achieved. Inpractice, some cladding excitation occurs when the edge of theinput beam is incident on the cladding part of the notch.However, this can be minimized during alignment, when thelight intensity incident on the core is maximized. In our experi-ments, signal acquisition only begins at least 300 ns after theinitial light pulse, which means that we do not detect the rapidlydecaying cladding modes in our ring-down signal. Alternatively,Brown et al. have previously fitted the full ring-down signal to abiexponential composed of decaying core and cladding modesand thus extracted τcore and τcladding.
11
Detection Sensitivity. The detection limit, or minimumdetectable absorption per unit path length, kmin (given withrespect to base e), is determined from eq 4.Δτmin (the maximum3σ value measured for τ0) was established to be 4.5% of the totalring-down time for the small-core fiber and 2.5% for the large-core fiber. The improvement in the standard deviation ofrepeated measurements for the large-core fiber arises from theincrease in signal level and from the reduction in total loss perpass, thereby increasing the number of points fitted in order toextract a ring-down time. The kmin values can be used to calculatethe concentration detection limit in terms of the concentration ofRh6G, whereCmin = kmin/α, andα is known from the single-passmeasurement previously recorded. The values of kmin and Cmin
for each cavity setup are presented in Table 3.
Figure 4. Light emission from various fiber sizes, under differentcoupling conditions, recorded using a CCD camera. (a) End-coupled50 μm core diameter optical fiber. (b) Bend-coupled 50 μm corediameter optical fiber. (c) Bend-coupled 105 μm core diameter opticalfiber. (d) Notch-coupled 365 μm core diameter optical fiber.
Table 3. Detection Limits for Dilute Solutions of Rh6G forEach Cavity Setup a�c, Defined in Figure 1a
kmin/cm�1 Cmin/μM
a 5.3 43
b 0.20 1.7
c 0.11 0.93a Limits are reported in terms of absorption per unit path length (k) andconcentration (C).
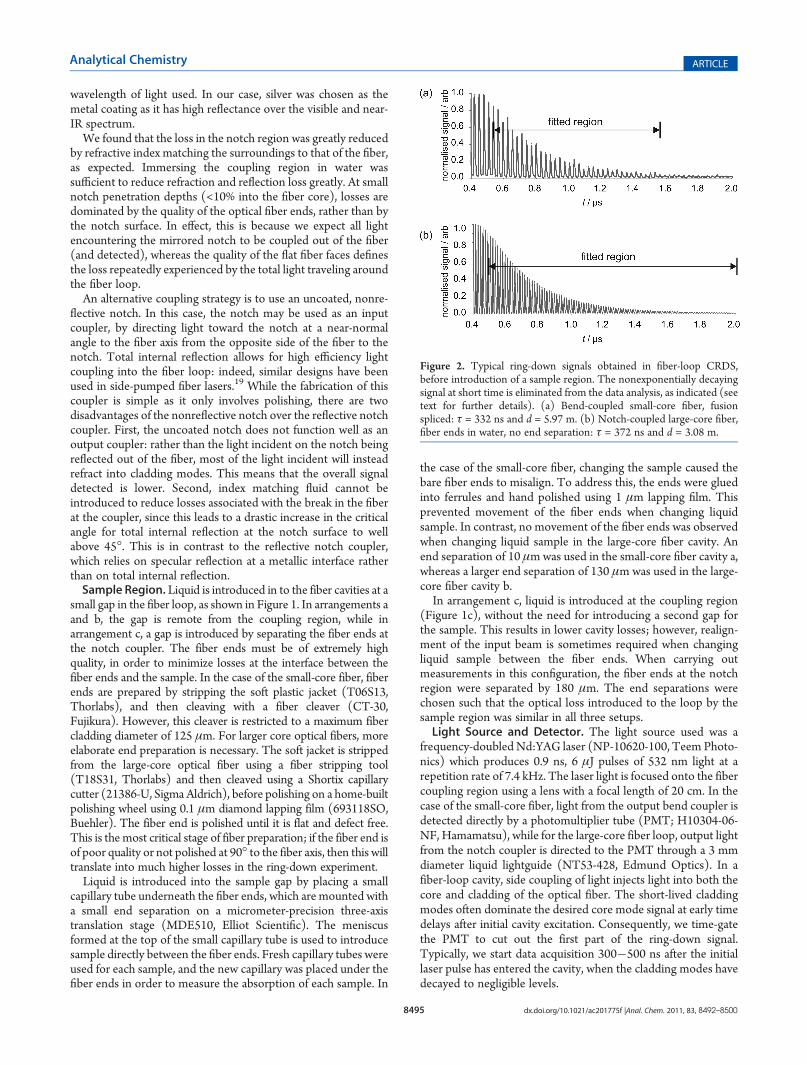
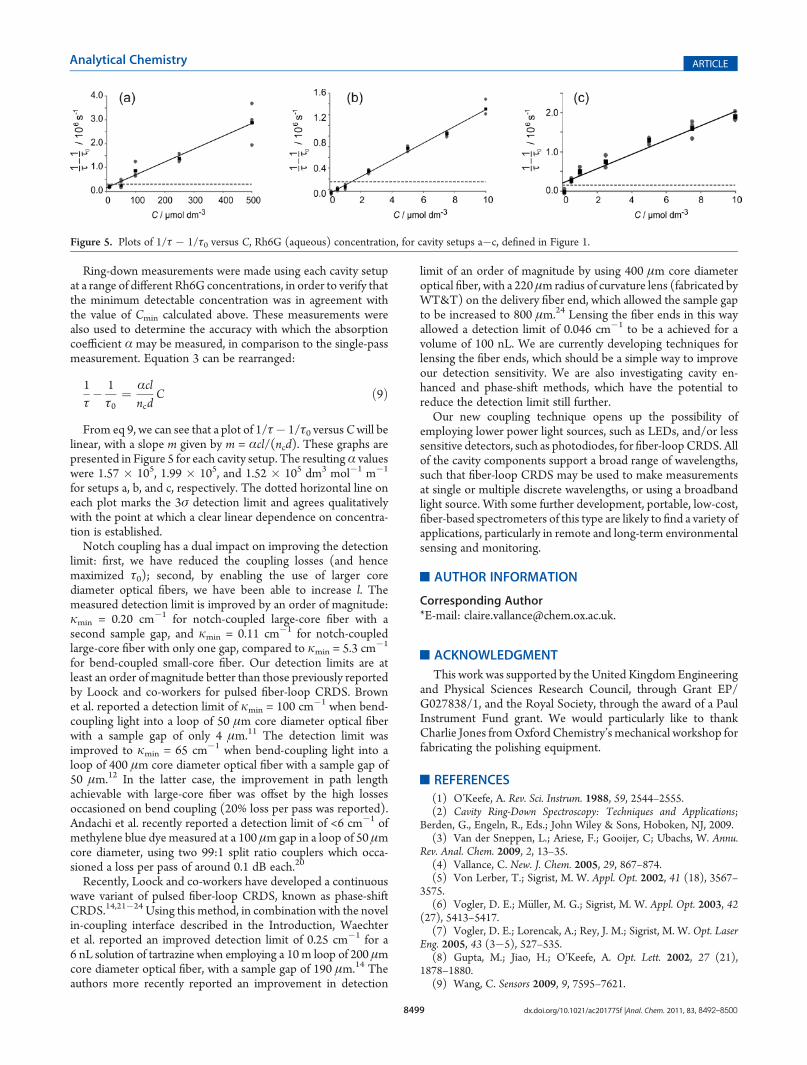
Ring-down measurements were made using each cavity setupat a range of different Rh6G concentrations, in order to verify thatthe minimum detectable concentration was in agreement withthe value of Cmin calculated above. These measurements werealso used to determine the accuracy with which the absorptioncoefficient α may be measured, in comparison to the single-passmeasurement. Equation 3 can be rearranged:
1τ� 1τ0
¼ αclncd
C ð9Þ
From eq 9, we can see that a plot of 1/τ� 1/τ0 versusCwill belinear, with a slope m given by m = αcl/(ncd). These graphs arepresented in Figure 5 for each cavity setup. The resultingα valueswere 1.57 � 105, 1.99 � 105, and 1.52 � 105 dm3 mol�1 m�1
for setups a, b, and c, respectively. The dotted horizontal line oneach plot marks the 3σ detection limit and agrees qualitativelywith the point at which a clear linear dependence on concentra-tion is established.Notch coupling has a dual impact on improving the detection
limit: first, we have reduced the coupling losses (and hencemaximized τ0); second, by enabling the use of larger corediameter optical fibers, we have been able to increase l. Themeasured detection limit is improved by an order of magnitude:kmin = 0.20 cm�1 for notch-coupled large-core fiber with asecond sample gap, and kmin = 0.11 cm�1 for notch-coupledlarge-core fiber with only one gap, compared to kmin = 5.3 cm�1
for bend-coupled small-core fiber. Our detection limits are atleast an order of magnitude better than those previously reportedby Loock and co-workers for pulsed fiber-loop CRDS. Brownet al. reported a detection limit of kmin = 100 cm�1 when bend-coupling light into a loop of 50 μm core diameter optical fiberwith a sample gap of only 4 μm.11 The detection limit wasimproved to kmin = 65 cm�1 when bend-coupling light into aloop of 400 μm core diameter optical fiber with a sample gap of50 μm.12 In the latter case, the improvement in path lengthachievable with large-core fiber was offset by the high lossesoccasioned on bend coupling (20% loss per pass was reported).Andachi et al. recently reported a detection limit of <6 cm�1 ofmethylene blue dye measured at a 100 μm gap in a loop of 50 μmcore diameter, using two 99:1 split ratio couplers which occa-sioned a loss per pass of around 0.1 dB each.20
Recently, Loock and co-workers have developed a continuouswave variant of pulsed fiber-loop CRDS, known as phase-shiftCRDS.14,21�24 Using this method, in combination with the novelin-coupling interface described in the Introduction, Waechteret al. reported an improved detection limit of 0.25 cm�1 for a6 nL solution of tartrazine when employing a 10 m loop of 200 μmcore diameter optical fiber, with a sample gap of 190 μm.14 Theauthors more recently reported an improvement in detection
limit of an order of magnitude by using 400 μm core diameteroptical fiber, with a 220 μm radius of curvature lens (fabricated byWT&T) on the delivery fiber end, which allowed the sample gapto be increased to 800 μm.24 Lensing the fiber ends in this wayallowed a detection limit of 0.046 cm�1 to be a achieved for avolume of 100 nL. We are currently developing techniques forlensing the fiber ends, which should be a simple way to improveour detection sensitivity. We are also investigating cavity en-hanced and phase-shift methods, which have the potential toreduce the detection limit still further.Our new coupling technique opens up the possibility of
employing lower power light sources, such as LEDs, and/or lesssensitive detectors, such as photodiodes, for fiber-loopCRDS. Allof the cavity components support a broad range of wavelengths,such that fiber-loop CRDS may be used to make measurementsat single or multiple discrete wavelengths, or using a broadbandlight source. With some further development, portable, low-cost,fiber-based spectrometers of this type are likely to find a variety ofapplications, particularly in remote and long-term environmentalsensing and monitoring.
This work was supported by the United KingdomEngineeringand Physical Sciences Research Council, through Grant EP/G027838/1, and the Royal Society, through the award of a PaulInstrument Fund grant. We would particularly like to thankCharlie Jones fromOxford Chemistry’s mechanical workshop forfabricating the polishing equipment.
’REFERENCES
(1) O’Keefe, A. Rev. Sci. Instrum. 1988, 59, 2544–2555.(2) Cavity Ring-Down Spectroscopy: Techniques and Applications;
Berden, G., Engeln, R., Eds.; John Wiley & Sons, Hoboken, NJ, 2009.(3) Van der Sneppen, L.; Ariese, F.; Gooijer, C; Ubachs, W. Annu.
Rev. Anal. Chem. 2009, 2, 13–35.(4) Vallance, C. New. J. Chem. 2005, 29, 867–874.(5) Von Lerber, T.; Sigrist, M. W. Appl. Opt. 2002, 41 (18), 3567–
3575.(6) Vogler, D. E.; M€uller, M. G.; Sigrist, M. W. Appl. Opt. 2003, 42
(27), 5413–5417.(7) Vogler, D. E.; Lorencak, A.; Rey, J. M.; Sigrist, M. W. Opt. Laser
Eng. 2005, 43 (3�5), 527–535.(8) Gupta, M.; Jiao, H.; O’Keefe, A. Opt. Lett. 2002, 27 (21),
1878–1880.(9) Wang, C. Sensors 2009, 9, 7595–7621.
Figure 5. Plots of 1/τ � 1/τ0 versus C, Rh6G (aqueous) concentration, for cavity setups a�c, defined in Figure 1.