WINTERGREEN RESEARCH, INC. REPORT # SH29821380 374 PAGES 136 TABLES AND FIGURES 2005 $2,800 Top Ten Telecommunications and Communications Market Opportunities, Strategies, and Forecasts, 2005 to 2010 Top Ten Telecommunications and Communications Picture by Susie Eustis MOUNTAINS OF OPPORTUNITY WinterGreen Research, Inc. Lexington, Massachusetts www.wintergreenresearch.com
Market Opportunities, Strategies, and Forecasts, 2005 to 2010
The top ten telecommunications markets have shifted to become communications markets. This is the result of convergence of voice and data networks to digital transport of voice, video, and data signals on the same network. Transport over existing TDM infrastructure is being replaced with transport over IP infrastructure. The move to digital signal transport has bought significant diversity to the markets. Companies that failed to embrace new technology have had significant market declines, like Lucent and Nortel. Other companies have moved to achieve dominance in a particular arena. Alcatel dominates digital subscriber loop technology (DSL). Fujitsu dominates the Sonet markets, increasing the value of those. Cisco has continued to push the Ethernet and IP standard adding voice and applications capability on top of the routers and switches, giving those systems more value in the market and making them communications equipment, that extend beyond Internet equipment. Nokia, Motorola, and Ericsson continue to bring style and increased functionality to the wireless markets, creating growth and new demand. Fujitsu has been developing the capability of WiMAX 802.16 fixed wireless standard, creating the opportunity to develop fixed wireless metro markets. These comments illustrate the variety evolving in communications markets. Each market participant has fund a way to achieve differentiation in the new communications equipment markets. Huawei from China has developed as a strong market presence, creating the opportunity to achieve the level of global market participant. The low cost of and high quality of the Huawei communications equipment is challenging every other market participant to move up the value stack to provide more functionality for customers. Worldwide telecommunications and communications equipment market forecasts, shipments in dollars analysis indicate strong growth in very large existing markets. Markets at $197.6 billion in 2005 are anticipated to reach $446.9 billion by 2010. The top ten telecommunications equipment provider markets at $166 billion in 2004 are forecast to reach $381 billion by 2010.
Top Ten Telecommunications and Communications Strategies and Forecasts, 2005-
2010
REPORT METHODOLOGY
THIS IS THE TWO-HUNDRED AND THIRTY-SIXTH REPORT IN A SERIES OF MARKET RESEARCH REPORTS THAT PROVIDE
FORECASTS IN COMMUNICATIONS, TELECOMMUNICATIONS, THE INTERNET, COMPUTER, SOFTWARE, TELEPHONE
EQUIPMENT, HEALTH EQUIPMENT, AND ENERGY . THE PROJECT LEADERS TAKE DIRECT RESPONSIBILITY FOR WRITING
AND PREPARING EACH REPORT. THEY HAVE SIGNIFICANT EXPERIENCE PREPARING INDUSTRY STUDIES. FORECASTS
ARE BASED ON PRIMARY RESEARCH AND PROPRIETARY DATA BASES. FORECASTS REFLECT ANALYSIS OF THE MARKET
TRENDS IN THE SEGMENT AND RELATED SEGMENTS. UNIT AND DOLLAR SHIPMENTS ARE ANALYZED THROUGH
CONSIDERATION OF DOLLAR VOLUME OF EACH MARKET PARTICIPATION IN THE SEGMENT. INSTALLED BASE ANALYSIS AND
UNIT ANALYSIS IS BASED ON INTERVIEWS AND AN INFORMATION SEARCH. MARKET SHARE ANALYSIS INCLUDES
CONVERSATIONS WITH KEY CUSTOMERS OF PRODUCTS, INDUSTRY SEGMENT LEADERS, MARKETING DIRECTORS, DISTRIBUTORS, LEADING MARKET PARTICIPANTS, OPINION LEADERS, AND COMPANIES SEEKING TO DEVELOP MEASURABLE
MARKET SHARE. OVER 200 IN DEPTH INTERVIEWS ARE CONDUCTED FOR EACH REPORT WITH A BROAD RANGE OF KEY
PARTICIPANTS AND INDUSTRY LEADERS IN THE MARKET SEGMENT. WE ESTABLISH ACCURATE MARKET FORECASTS BASED
ON ECONOMIC AND MARKET CONDITIONS AS A BASE. USE INPUT/OUTPUT RATIOS, FLOW CHARTS, AND OTHER ECONOMIC
METHODS TO QUANTIFY DATA. USE IN-HOUSE ANALYSTS WHO MEET STRINGENT QUALITY STANDARDS. INTERVIEWING
KEY INDUSTRY PARTICIPANTS, EXPERTS AND END-USERS. OUR RESEARCH INCLUDES ACCESS TO LARGE PROPRIETARY
DATABASES. LITERATURE SEARCH INCLUDES ANALYSIS OF TRADE PUBLICATIONS, GOVERNMENT REPORTS, AND
Market Opportunities, Strategies, and Forecasts, 2005 to 2010
Table of Contents TOP TEN TELECOMMUNICATIONS AND COMMUNICATIONS EXECUTIVE SUMMARY
TOP TEN TELECOMMUNICATIONS AND COMMUNICATIONS EXECUTIVE SUMMARY ES-1 Top Ten Telecommunications Company Market Driving Forces ES-1 Telecommunications Market Index 2000 to 2004 ES-5 Top Ten Telecommunications Equipment Provider Market Forecasts ES-7
TOP TEN TELECOMMUNICATIONS AND COMMUNICATIONS MARKET DESCRIPTION AND MARKET DYNAMICS
1. TOP TEN TELECOMMUNICATIONS AND COMMUNICATIONS MARKET DESCRIPTION AND MARKET DYNAMICS 1-1 1.1 Increasing Average Revenue Per User (ARPU) 1-1
1.1.1 Improved Quality Of Service 1-1 1.1.2 Reduced Capital And Operational Costs 1-2 1.1.3 Enhanced Operability 1-3
1.2 Impact of Competition 1-5 1.3 Market Growth Dynamics 1-7 1.4 Converged Voice And Data Networks 1-9 1.5 Wireless Networks 1-10
1.5.1 New Generation Of Wireless Systems 1-14 1.5.2 Provides Flexibility 1-15 1.5.3 User Experience 1-15 1.5.4 Protects Investments 1-15 1.5.5 Increases Efficiency 1-16 1.5.6 Integrated Management Tools 1-18 1.5.7 Cost-Effective Capacity And Coverage 1-18
1.6 Multimedia Markets 1-19 1.7 IP Telephony Service Solutions 1-21 1.8 Web Services 1-21 1.9 Strategies To Improve Performance 1-22 1.10 Customer Financing Arrangements 1-25 1.11 Market Makers 1-26 1.12 Demand For Total Solutions 1-31 1.13 Marketing Globally 1-32 1.14 Internet Traffic 1-34 TOP TEN TELECOMMUNICATIONS AND COMMUNICATIONS MARKET SHARES AND MARKET
FORECASTS 2. TOP TEN TELECOMMUNICATIONS COMPANY MARKET SHARES AND MARKETS FORECASTS 2-1 2.1 Top Ten Telecommunications Company Market Driving Forces 2-1 2.2 Top 10 Telecommunications Provider Shipments 2-4 2.3 Top Ten Telecommunications and Communications Equipment Segment Analysis 2-10
2.4 Worldwide Telecommunications and Communications Equipment Market Forecasts, Shipments2-15 2.4.1 Top Ten Telecommunications Equipment Provider Market Forecasts 2-18
2.5 Top Ten Telecommunications Equipment Provider Market Shares 2-19 2.5.1 Top Ten Telecommunications Service Provider Core Infrastructure Equipment Market Shares 2-23 2.5.2 Top Ten Telecommunications Service Provider IP Equipment Marke t Shares 2-25 2.5.3 Top Ten Telecommunications Enterprise Equipment Market Shares 2-26 2.5.4 Top Ten Telecommunications Wireless Infrastructure Equipment Market Shares 2-28 2.5.5 Top Ten Telecommunications Wireless Handset Market Shares 2-29
2.6 Top Ten Telecommunications Provider Equipment Market Shares 2-31 2.6.1 Nokia 2-31 2.6.2 Motorola 2-33 2.6.3 Siemens 2-34 2.6.4 Alcatel 2-36 2.6.5 NEC 2-37 2.6.6 Ericsson 2-39 2.6.7 Nortel 2-40 2.6.8 Cisco 2-42 2.6.9 Lucent 2-43 2.6.10 Fujitsu 2-45 2.6.11 Huawei 2-46 2.6.12 Avaya 2-48
2.7 Top Ten Telecommunications Provider Equipment Regional Market Shares 2-49 2.7.1 Nokia 2-49 2.7.2 Motorola 2-51 2.7.3 Siemens 2-52 2.7.4 Alcatel 2-54 2.7.5 NEC 2-55 2.7.6 Ericsson 2-57 2.7.7 Nortel 2-58 2.7.8 Cisco 2-60 2.7.9 Lucent 2-61 2.7.10 Fujitsu 2-63 2.7.11 Huawei 2-64 2.7.12 Avaya 2-66
TOP TEN TELECOMMUNICATIONS AND COMMUNICATIONS PRODUCT DESCRIPTION
3. TOP TEN TELECOMMUNICATIONS AND COMMUNICATIONS PRODUCT DESCRIPTION 3-1 3.1 Nokia Communications Products 3-1
3.1.1 Nokia Mobile Devices 3-1 3.1.2 Nokia Multimedia In 2004 3-2 3.1.3 Nokia 3G WCDMA Smartphone 3-3 3.1.4 Nokia Enterprise Solutions In 2004 3-3 3.1.5 Nokia Network Security Gateways 3-4 3.1.6 Nokia Secure Access System 3-4 3.1.7 Nokia Network Infrastructure 3-4 3.1.8 Nokia Push To Talk 3-5 3.1.9 Nokia MSC Server System 3-5
3.5 NEC 3-48 3.5.1 NEC NEAX 2000 IPS 3-48 3.5.2 NEC NEAX®2400 Internet Protocol eXchange (IPX) 3-49
3.6 Ericsson 3-50 3.6.1 Ericsson Circuit Core 3-51 3.6.2 Ericsson Packet Core 3-52 3.6.3 Ericsson IP Multimedia 3-52 3.6.4 Sony / Ericsson Wireless Handsets 3-54 3.6.5 Sony Ericsson Wireless Services For Machine-to-Machine Application Development 3-55 3.6.6 Sony Ericsson V800 3-56
3.7 Nortel Service Provider Communications Equipment 3-57 3.7.1 Nortel Voice over IP (VoIP), Voice & Multimedia 3-57 3.7.2 Nortel Local VoIP Solution 3-58 3.7.3 Nortel Long Distance VoIP Solution 3-59 3.7.4 Nortel Cable VoIP Solution 3-59 3.7.5 Nortel Wireless VoIP Solution 3-59 3.7.6 Nortel Multimedia Communications 3-60 3.7.7 Nortel TDM Voice 3-60 3.7.8 Nortel Broadband 3-60 3.7.9 Nortel Broadband Access 3-61 3.7.10 Nortel Central Office-Based xDSL / Fiber To The Home 3-61 3.7.11 Nortel Edge Services 3-62 3.7.12 Nortel Metro Ethernet Services 3-63 3.7.13 Nortel Wireless Mesh Network Solutions 3-66 3.7.14 Nortel Wireless LAN Solution 3-67 3.7.15 Nortel Edge Solutions 3-67 3.7.16 Nortel Enterprise Systems 3-67 3.7.17 Nortel Meridian 1 Option 81C 3-70 3.7.18 Nortel Meridian SL-100 3-71
3.12.1 Avaya™ DEFINITY® Servers 3-117 3.12.2 Avaya DEFINITY One™ Communications Server 3-118 3.12.3 Avaya MultiVantage Software with an Avaya DEFINITY® Server CSI and Avaya™ CMC1 Media Gateway 3-118 3.12.4 Avaya MultiVantage Software with an Avaya DEFINITY® Server SI and Avaya™ SCC1 Media Gateway or an Avaya™ MCC1 Media Gateway 3-118 3.12.5 Avaya MultiVantage Software with an Avaya DEFINITY® Server R and Avaya SCC1 Media Gateway or an Avaya MCC1 Media Gateway 3-119
SELECTED TOP TEN TELECOMMUNICATIONS AND COMMUNICATIONS COMPANY
ORGANIZATION AND STRATEGY 4. SELECTED TOP TEN TELECOMMUNICATIONS AND COMMUNICATIONS COMPANY ORGANIZATION AND STRATEGY 4-1 4.1 Nokia Organizational Structure 4-1
5.3 Cisco Systems 5-37 5.3.1 Cisco IP Communications 5-37 5.3.2 Cisco Systems Second Quarter Fiscal Year 2005 Revenue 5-38 5.3.3 Cisco IP Communications 5-43 5.3.4 Cisco / Linksys 5-43 5.3.5 Cisco / Linksys Broadband and Wireless Networking 5-46
5.4 Ericsson 5-49 5.4.1 Ericsson Revenue 5-50 5.4.2 Ericsson Customers T -Mobile UMTS network 5-52 5.4.3 Sony Ericsson Mobile Communications Revenue 5-53 5.4.4 Sony Ericsson Mobile Communications Products 5-54 5.4.5 Sony Ericsson Symbian 5-55
5.5 Fujitsu 5-55 5.5.1 Fujitsu Network Communications 5-57 5.5.2 Fujitsu Considers WiMAX vs. 3G vs. Wi-Fi 5-57 5.5.3 Fujitsu FLASHWAVE® 7500 Small System 5-57 5.5.4 Fujitsu FASST Transition Solutions 5-58 5.5.5 Fujitsu Microelectronics America 5-58
5.8.1 Lucent Technologies Maximize Service Revenues 5-75 5.8.2 Lucent Technologies Systems 5-75 5.8.3 Lucent Bell Labs 5-76
5.9 Motorola 5-86 5.9.1 Motorola Revenue 5-87
5.10 NEC 5-91 5.10.1 NEC IT And Networking Technologies 5-93 5.10.2 NEC Network Solutions Business 5-97 5.10.3 NEC Internet Broadband Network Positioning 5-98
5.11 Nokia 5-98 5.11.1 Nokia Revenue 5-100 5.11.2 Nokia Infrastructure Sales 5-103 5.11.3 Nokia Mobile Phones In The Fourth Quarter 2004 5-104 5.11.4 Nokia Multimedia In The Fourth Quarter 2004 5-105 5.11.5 Nokia Enterprise Solutions In The Fourth Quarter 2004 5-106
5.12 Nortel 5-108 5.12.1 Nortel VoIP Network Elements 5-113 5.12.2 Nortel VoIP Enabling Technologies 5-113 5.12.3 Nortel ATM (Asynchronous Transfer Mode) 5-114 5.12.4 Nortel Networking And Communication Services And Infrastructure 5-115 5.12.5 Nortel Network Elements 5-119 5.12.6 Nortel Enabling Technologies 5-119 5.12.7 Nortel ATM (Asynchronous Transfer Mode) 5-120
5.13 Samsung 5-120 5.14 Siemens 5-122
5.14.1 Siemens Business Services 5-122 5.14.2 Siemens Research and Development 5-123 5.14.3 Siemens Information and Communication Networks 5-123 5.14.4 Siemens Information and Communication Mobile Group 5-124
5.15 UT Starcom 5-125 5.15.1 UTStarcom Third Quarter 2004 Revenue 5-126 5.15.2 Key UTStarcom Customer Wins 5-127 5.15.3 UTStarcom Global Technology 5-128 5.15.4 UTStarcom Sarbanes -Oxley 5-128
TOP TEN TELECOMMUNICATIONS AND COMMUNICATIONS EXECUTIVE SUMMARY Table ES-1 ES-3 Customization Of Telecommunications Infrastructure Equipment Figure ES-2 ES-7 Indexed Sales of Selected Leading Telecommunications Equipment Suppliers, 2000-2004 Figure ES-3 ES-8 Worldwide Top Ten Telecommunications and Communications Equipment Company Market Forecasts, Shipments, Dollars, 2005-2010
TOP TEN TELECOMMUNICATIONS AND COMMUNICATIONS MARKET DESCRIPTION AND MARKET DYNAMICS
Table 1-1 1-4 Network Systems Functions Table 1-2 1-6 Telecommunications Market Shifts Table 1-3 1-8 Change In Telecommunications Equipment Markets Table 1-4 1-9 Response To Change In Telecommunications Equipment Markets Table 1-5 1-11 Service Provider Build-Out Of The Next Ge neration 3G Systems Table 1-6 1-12 Factors Impacting Build-Out Of 3G Wireless Infrastructure Table 1-7 1-13 Factors Impacting Implementation Of 3G Wireless Table 1-8 1-17 Wireless IP Network Benefits Table 1-9 1-20 Key Benefits Of Multimedia Solutions Table 1-10 1-23 Strategies To Improve Telecommunication Equipment Company Performance Table 1-11 1-28 Top Ten Telecommunication Providers As Market Makers Table 1-12 1-29 Top Ten Telecommunications Equipment Provider Market Strategies Table 1-13 1-30 Top Ten Telecommunications Equipment Provider Strategies To Adapt To Changing Markets Table 1-14 1-33 Marketing Globally TOP TEN TELECOMMUNICATIONS AND COMMUNICATIONS MARKET SHARES AND MARKET
FORECASTS Table 2-1 2-3 Customization Of Telecommunications Infrastructure Equipment Figure 2-2 2-5 Top 10 Telecommunications Provider Shipments, 2000-2004
Table 2-3 2-6 Top Ten Communications Equipment Provider Shipments and Services, 2000-2004 Figure 2-4 2-7 Indexed Sales of Leading Telecommunications Equipment Suppliers, 1993-2004 Figure 2-5 2-9 Indexed Sales of Selected Leading Telecommunications Equipment Suppliers, 2000-2004 Table 2-6 2-10 Selected communications Company shipments, 1993-2004 Figure 2-7 2-11 Worldwide Top Ten Telecommunications and Communications Equipment Company Market Segments, Shipments, Dollars, 2004 Figure 2-8 2-12 Worldwide Top Ten Telecommunications and Communications Wireless Equipment Company Market Segments, 2004 Figure 2-9 2-13 Worldwide Top Ten Telecommunications and Communications Equipment Market Segments, 2004 Figure 2-10 2-14 Worldwide Top Ten Telecommunications and Communications Equipment Company Service Provider Core Infrastructure, Access, and Transmission Shipments, Dollars, 2004 Table 2-11 2-15 Worldwide Top Ten Telecommunications and Communications Wireless Handsets, Wireless Infrastructure, Wireline, and Enterprise Telecommunications Shipment Forecast By Segment, Dollars, 2005-2010 Figure 2-12 2-16 Worldwide Top Ten Telecommunications and Communications Equipment Market Forecasts, Shipments, Dollars, 2005-2010 Table 2-13 2-17 Worldwide Telecommunications and Communications Wireless Handsets, Wireless Infrastructure, Wireline, and Enterprise Telecommunications Shipment Forecast By Segment, Dollars, 2005-2010 Figure 2-14 2-19 Worldwide Top Ten Telecommunications and Communications Equipment Company Market Forecasts, Shipments, Dollars, 2005-2010 Table 2-15 2-19 Worldwide Telecommunications and Communications Wireless Handsets, Wireless Infrastructure, Wireline, and Enterprise Telecommunications Shipment Forecast By Segment, Dollars, 2005-2010 Figure 2-16 2-20 Top Ten Telecommunications and Communications Equipment Provider Market Shares, 2004 Table 2-17 2-21 Worldwide Top Ten Telecommunications and Communications Equipment Provider Shipments By Segment, Percent, 2004 Table 2-18 2-22 Worldwide Top Ten Telecommunications and Communications Equipment Provider Shipments By Segment, Dollars, 2004 Figure 2-19 2-24 Worldwide Top Ten Service Provider Telecommunications and Communications Equipment Provider Market Segments, 2004 Figure 2-20 2-25 Worldwide Service Provider Top Ten IP Telecommunications and Communications Equipment Provider Market Segments, 2004 Figure 2-21 2-27 Worldwide Enterprise Top Ten IP Telecommunications and Communications Equipment Provider Market Segments, 2004
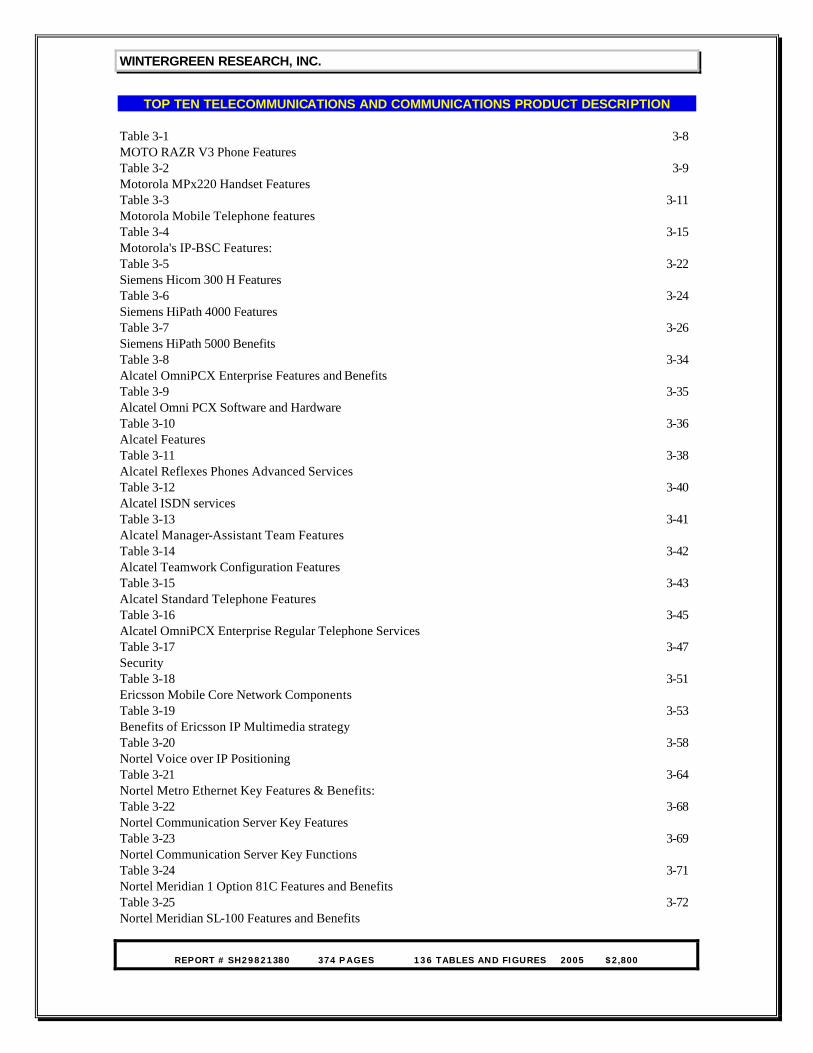
TOP TEN TELECOMMUNICATIONS AND COMMUNICATIONS PRODUCT DESCRIPTION Table 3-1 3-8 MOTO RAZR V3 Phone Features Table 3-2 3-9 Motorola MPx220 Handset Features Table 3-3 3-11 Motorola Mobile Telephone features Table 3-4 3-15 Motorola's IP-BSC Features: Table 3-5 3-22 Siemens Hicom 300 H Features Table 3-6 3-24 Siemens HiPath 4000 Features Table 3-7 3-26 Siemens HiPath 5000 Benefits Table 3-8 3-34 Alcatel OmniPCX Enterprise Features and Benefits Table 3-9 3-35 Alcatel Omni PCX Software and Hardware Table 3-10 3-36 Alcatel Features Table 3-11 3-38 Alcatel Reflexes Phones Advanced Services Table 3-12 3-40 Alcatel ISDN services Table 3-13 3-41 Alcatel Manager-Assistant Team Features Table 3-14 3-42 Alcatel Teamwork Configuration Features Table 3-15 3-43 Alcatel Standard Telephone Features Table 3-16 3-45 Alcatel OmniPCX Enterprise Regular Telephone Services Table 3-17 3-47 Security Table 3-18 3-51 Ericsson Mobile Core Network Components Table 3-19 3-53 Benefits of Ericsson IP Multimedia strategy Table 3-20 3-58 Nortel Voice over IP Positioning Table 3-21 3-64 Nortel Metro Ethernet Key Features & Benefits: Table 3-22 3-68 Nortel Communication Server Key Features Table 3-23 3-69 Nortel Communication Server Key Functions Table 3-24 3-71 Nortel Meridian 1 Option 81C Features and Benefits Table 3-25 3-72 Nortel Meridian SL-100 Features and Benefits
6 Raymond Street Lexington, MA 02421 USA Phone: (781) 863-5078 --- Fax: (781) 863-1235 or (781) 860-0897
PLEASE ENTER MY ORDER FOR:
Top Ten Telecommunications and Top Ten Telecommunications and Communications Market Opportunities, Communications Market Opportunities,
Strategies, and Forecasts 2005Strategies, and Forecasts 2005--20102010 -ALL REPORTS ARE AVAILABLE IN EITHER PRINT OR PDF-
_________PDF ________PRINT ____ENCLOSED IS MY CHECK FOR $2,800 FOR SINGLE COPY, $3,800 FOR WEB SITE POSTING ____PLEASE BILL MY COMPANY USING P.O. NUMBER_________________________________________ ____PLEASE CHARGE MY MASTERCARD/VISA/AMERICAN EXPRESS— CARD NUMBER _________________________________EXP. DATE__________________ If charging to a Credit card you may e-mail the order form, but not the card information Fax or Call with credit card information - Do not send card number as e-mail - You may send the order as e-mail ____ADDITIONAL COPIES, @ $375 (EXTRA COPY PRICE IN EFFECT ONLY WITH INITIAL ORDER) NAME________________________________________TITLE________________________________________ SIGNATURE________________________________________________________________________________ COMPANY________________________________________DIVISION________________________________________ ADDRESS________________________________________ CITY__________________________________________STATE / ZIP__________________________________________ TELEPHONE________________________________________ FAX________________________________________ EMAIL________________________________________ PLEASE NOTE: RESIDENTS OF MASSACHUSETTS AND CONNECTICUT MUST INCLUDE APPROPRIATE SALES
TAX SUBSCRIBERS OUTSIDE THE UNITED STATES MUST PROVIDE PREPAYMENT IN U.S. FUNDS