79
Topic Note: Results of the Early Years Foundation Stage Profile (EYFSP) Pilot Research report March 2013 Eleanor Cotzias, Tara Whitehorn, STA Teacher Assessment & Moderation team

Topic Note: Results of the Early Years Foundation Stage Profile (EYFSP) Pilot
Research report March 2013
Eleanor Cotzias, Tara Whitehorn, STA Teacher Assessment & Moderation team

2
Contents Table of figures 5
Executive summary 7
Key findings from the pilot 7
A Good Level of Development 7
The assessment data: Sections 2, 3 and 4 8
Feedback from teachers: Sections 5 and 6 8
1 Introduction 10
1.1 Background of the Early Years Foundation Stage Profile 10
1.2 The pilot 10
1.2.1 The sample 10
1.2.2 Methods 11
2. Analysis of the assessment data 13
Summary 13
2.1 Introduction 13
2.1.1 Weighting methodology 14
2.1.2 Comparing the performance of pilot children to the national EYFS population 14
2.2 Analysis of the headline indicators 15
2.2.1 Good Level of Development 16
2.2.2 Supporting measure 17
2.3 Point score distribution 17
2.4 Performance in the 17 early learning goals 20
2.4.1 All children 20
2.4.2 Gender 21
2.4.3 Free school meals 22
2.4.4 Ethnicity 23

3
2.4.5 English as a first language 24
2.4.6 Special educational needs 25
2.4.7 Month of birth 26
2.5 Performance in the prime areas 27
2.6 Achieving all early learning goals 28
2.7 Exceeding early learning goals 29
2.8 Characteristics and attainment 30
2.9 Correlation 31
3 Local authority analysis 33
Summary 33
3.1 Introduction 33
3.2 Local authority performance - all children 34
3.3 Local authority performance – gender 35
3.4 Local authority performance – free school meals 36
3.5 Performance in the 17 early learning goals 37
4 The links between the old Profile and new Profile 38
Summary 38
4.1 Introduction 38
4.2 Correlation 38
4.3 Performance in the old and new good level of development 40
5 Teacher questionnaires and Reception/Year 1 teacher workshop 42
Summary 42
5.1 Introduction 43
5.2 Views on the new assessment 44
5.3 Discussing the output of the Profile with parents 49
5.4 Discussing the output of the Profile with Year 1 teachers 50

4
5.5 Year 1 teachers’ views on the new Profile 51
5.6 Views on guidance and exemplification 53
6 Results from the moderation sub-sample 57
Summary 57
6.1 Introduction 58
6.2 Results from the first impressions questionnaire 58
6.3 Results from the detailed feedback events 61
6.3.1 Views on the new assessment 61
6.3.2 Views on the draft EYFSP handbook 62
6.3.3 Views on the exemplification materials 63
6.3.4 Moderation process and guidance 64
Appendices 67
Appendix A: Expected level descriptors 67
Appendix B: Participating local authorities 70
Appendix C: Performance in the old scales 71
Appendix D: The old Profile 72
Appendix E: The weight values 73
Appendix F: Correlations between the old scales and new early learning goals 74
Appendix G: Questions in the online questionnaire for Reception teachers 75
Appendix H: Questions in the online questionnaire for Year 1 teachers 77
Appendix I: Questions in the first impressions questionnaire for the moderation sub-sample 78

5
Table of figures Figure 1.1 The design of the new Profile (see appendix A for the expected descriptors) 12
Table 2.1 The difference between pilot and non-pilot children’s achievement. 15
Chart 2.2 The proportion of children that achieved a good level of development by characteristics.
16
Table 2.3 The total average point score by characteristics. 17
Chart 2.4 The distribution of point scores for all children. 18
Chart 2.5 The distribution of point scores by gender. 19
Chart 2.6 The distribution of point scores by FSM eligibility. 19
Chart 2.7 The proportion assessed as each of: emerging; expected; and exceeding across all 17
ELGs. 20
Chart 2.8 The proportion that achieved each of the 17 ELGs by gender. 21
Chart 2.9 The proportion that achieved each of the 17 ELGs by FSM. 22
Table 2.10 The proportion that achieved each of the 17 ELGs by ethnicity. 23
Chart 2.11 The proportion that achieved each of the 17 ELGs by first language. 24
Table 2.12 The proportion that achieved each of the 17 ELGs by SEN provision. 25
Table 2.13 The proportion that achieved each of the 17 ELGs by month of birth. 26
Chart 2.14 The proportion achieving the prime areas of learning by characteristic. 27
Chart 2.15 The proportions achieving all 17 ELGs by characteristics. 28
Table 2.16 The proportion exceeding in each of the ELGs by characteristic. 29
Chart 2.17 The effect of various characteristics on a child’s total point score. 31
Table 2.18 The correlations between the 17 new ELGs. 32
Table 3.1 Participating LAs. 33
Chart 3.2 LA distribution by measures of performance. 34
Chart 3.3 LA distribution by measures of performance and gender. 35
Chart 3.4 LA distribution by measures of performance and FSM. 36
Chart 3.5 The distribution across the 17 ELGs at the local authority level. 37

6
Table 4.1 The correlations between the 17 new ELGs and 13 old ELGs. 39
Table 4.2 Performance in the old and new GLD by characteristics. 40
Table 4.3 The differences between the proportion of children achieving the old GLD and modelled
GLD. 41
Table 5.1 Respondents to the Reception class teacher questionnaire 43
Table 5.2 Respondents to the Year 1 teacher questionnaire 44
Table 5.3 Time taken, on average, to complete the assessment per child 45
Figure 5.4 Teachers views of the assessment. 45
Figure 5.5 Teachers views of the assessment 2 46
Table 5.6 Assessing children against the 17 early learning goals 47
Table 5.7 Why was it difficult to decide whether children were emerging, expected or exceeding
(free text response)? 48
Figure 5.8 Views on the best fit approach. 48
Figure 5.9 Views on the new early learning goals 49
Figure 5.10 The usefulness of the new Profile when reporting to Year 1 teachers 51
Figure 5.11 Year 1 teachers’ views on the new Profile 52
Figure 5.12 Year 1 teachers’ views on the new Profile 2 53
Table 5.13 Views on the EYFSP Handbook 54
Figure 5.14 Comments on the EYFSP handbook 54
Figure 5.15 Comments on the EYFSP handbook 55
Figure 5.16 Comments on the EYFSP handbook 56
Table 5.17 Free-text responses on exemplification 56
Table 6.1 Respondents to the First Impressions Questionnaire 59
Chart 6.2 Responses to the first impressions questionnaire 60

7
Executive summary A new Early Years Foundation Stage Profile (EYFSP) was introduced in September 2012. The
new Profile made changes to the way children are assessed at the end of the EYFS (the end of
academic year in which a child turns five). This report describes the results of the EYFSP pilot
which took place in the summer term of 2012 to support the introduction of the new Profile from
September.
The pilot involved a sample of approximately 500 schools across 19 local authorities (LA).
Reception teachers in the sample schools assessed the children in their class using the then-
current Profile as well as the new Profile, resulting in assessment data for approximately 20,000
children. We also collected feedback from the teachers involved using a range of methods. A sub-
sample of 118 reception class teachers were selected to test the moderation arrangements and to
give detailed feedback on the draft guidance and exemplification materials.
The data from the pilot was used to address the following evidence gaps:
To create an understanding of performance under the new EYFSP to inform the
development of the new Good Level of Development (GLD) indicator; and
To understand the views of the sector on the new assessment, draft guidance, draft
exemplification guidance materials and the proposed moderation arrangements.
Incorporating the findings from the pilot, the Department published final EYFSP guidance
and exemplification material in November 2012.
Key findings from the pilot This section briefly summarises some of the main findings from the analysis of the pilot data.
These points provide an overview, with a much broader interpretation of the results in the main
sections of the report.
A Good Level of Development The Good Level of Development (GLD) measure is the most widely used single measure of child
development in the early years. We have made significant changes to the way children are
assessed at the end of the EYFS through the EYFS Profile. As a result, we have had to redefine
the GLD measure.
Assessment data from the pilot were used to develop a new GLD indicator.
In the new EYFSP, children will be defined as having reached a GLD at the end of the EYFS if
they achieve at least the expected level in the early learning goals in the prime areas of learning
(personal, social and emotional development; physical development; and communication and language) and in the specific areas of mathematics and literacy.

8
The assessment data: Sections 2, 3 and 4 41% of children were assessed as achieving a GLD.
The total average point score1 was 32 points.
Gaps by characteristics for example by gender and free school meals (FSM) were wider in
the new GLD than the old GLD2.
The widest gaps in the proportion of children achieving the expected level in all of the eight
ELGs within the three prime areas of learning was between children whose first language is
English and children whose first language is other than English. The gap was 19
percentage points.
61% of children achieved the expected level in all of the prime areas of learning.
Across the 17 early learning goals (ELG), performance ranged from 58% of children
achieving3 the expected level of development to 89% of children achieving the expected
level of development. The highest performing ELG was health and self-care and the lowest
was numbers.
All ELGs in the new Profile have statistically significant4 relationships with each other. This
means that if a child performs well in one ELG they are also likely to perform similarly in
other ELGs. The strength of each of these relationships is detailed in sections 2.9 and 4.2.
The difference between the lowest and highest performing LA was greatest in the numbers
and shape, space and measures ELGs.
The difference between performance in the old and new GLD was greatest for children of a
Black ethnicity. Performance between the two measures differed by 32 percentage points
with performance in the old GLD being higher. This compares to just 22 percentage points
for children of a White ethnicity.
Feedback from teachers: Sections 5 and 6 Reception teachers responding to the online questionnaires were broadly positive about the
new Profile and the associated guidance materials. Where teachers did indicate concerns
with the new Profile this tended to focus on uncertainty around making a best-fit judgement,
and in how to discuss the results of the new Profile with parents and Year 1 teachers.
Similarly Year 1 teachers were broadly positive about the usefulness of the new Profile in
terms of transition from Reception to Year 1. As with Reception teachers there was some
1 A child is assigned one point for an emerging ELG, two points for an expected ELG and three points for an
exceeding ELG. 2 The proportion of children that achieve six or more points across the seven personal, social and emotional
development and communication, language and literacy scales and 78 or more points across all 13 scales. 3 Throughout this paper, ‘achieved’ is defined as either expected or exceeding.
4 Significant at the 95% confidence level or higher.

9
concern about being able to differentiate between children within the new broader
categories of emerging, expected and exceeding.
The moderation sub-sample of teachers and moderators broadly felt that the revised Profile
does provide a snapshot of whether children are ready to begin the Year 1 curriculum and
many agreed that the change to a best-fit assessment gave scope to re-emphasise the
importance of practitioner knowledge. Aspects of concern about the new Profile included
its applicability for children whose attainment is likely to be emerging in the majority of the
ELGs.
The moderation sub-sample was largely positive about the draft handbook although many
felt further instruction on how to make a ‘best-fit’ judgement would be useful. Views on the
exemplification materials were more mixed. Some felt that the exemplification was not
‘real’, and represented unrealistic expectations of children at the end of EYFS.
Responses about the moderation process, again, were broadly positive. Feedback from
moderators suggested that that the validation of judgements in the moderation of the
revised Profile relies less on physical evidence and appears to value the expertise and
knowledge of practitioners. This was welcomed by practitioners. Concerns about
moderation of the new Profile included a loss of confidence in the outcomes of moderation
at times due to limited use of the exemplification materials and inconsistent thresholds
between the expected and exceeding outcomes.

10
1 Introduction
1.1 Background of the Early Years Foundation Stage Profile The Early Years Foundation Stage Profile (EYFSP) is a teacher assessment of children’s
development at the end of the EYFS (the end of the academic year in which the child turns five). It
should support a smooth transition to Key Stage 1 (KS1) by informing the professional dialogue
between EYFS and KS1 teachers. This information should help Year 1 teachers plan an effective,
responsive and appropriate curriculum that will meet the needs of all children. The Profile is also
designed to inform parents or carers about their child’s development against the early learning
goals (ELGs).
Following an independent review of the EYFS by Dame Clare Tickell, a new Profile was published
in March 2012, as shown in figure 1.1. The new Profile made changes to the way in which children
are assessed at the end of the EYFS. The new Profile requires practitioners to make a best-fit
assessment of whether children are emerging, expected or exceeding against each of the new 17
ELGs (see appendix A for the expected level descriptors for each ELG). The new Profile was
introduced in September 2012 and the first assessments using the new Profile will take place in
the summer of 2013.
1.2 The pilot The Department carried out a pilot of the new Profile in order to inform the development of the new
Good Level of Development (GLD) indicator. The pilot was also used to finalise the new guidance,
exemplification materials and the moderation arrangements for the new Profile. Data was collected
from a sample of schools during the 2012 summer term.
1.2.1 The sample
19 local authorities (LAs) volunteered to take part in the pilot (appendix B). The participating LAs
were already involved in the Payment by Results for Children’s Centres trials.
Each LA was asked to recruit one in five of their primary schools, with an expectation that
Reception teachers assessed all the children in their classes in these schools using the new
Profile (as well as the old Profile). LAs were asked to select schools in a range of circumstances.
A sub-sample of 118 Reception class teachers (six from each LA) were selected to test the
moderation arrangements for the new Profile and to give detailed feedback on the draft guidance
and exemplification materials.

11
1.2.2 Methods
A variety of methods were used to collect the information needed to meet the aims of the pilot.
This included:
Asking reception teachers to assess the children in their classes using both the current
Profile and the new Profile. Data from these assessments were then returned to the
Department for analysis (sections 2, 3 and 4).
Inviting all reception and Year 1 teachers in the sample of schools to complete a short
online questionnaire seeking feedback on the new assessment (section 5).
Asking each LA to nominate one teacher (Reception or Year 1) to attend a workshop at the
Department looking at the new Profile and its link to the new National Curriculum. This
workshop followed up on the data collected from the questionnaire (section 5).
Asking the LA to moderate a sample of EYFSP judgements from the 118 teachers in the
sub-sample. These 118 teachers, and their moderators, were then invited to complete
questionnaires about their first impressions of the new Profile (before they carried out their
assessments). They were also asked to attend an event to gather detailed feedback on the
new assessment and the draft guidance, exemplification materials and moderation
arrangements (sections 6).

12
Figure 1.1 The design of the new Profile (see appendix A for the expected descriptors)
Area of learning Early Learning Goal Emerging Expected Exceeding Communication and Language
Listening and attention
Understanding
Speaking
Physical development Moving and handling
Health and self-care
Personal, Social and Emotional Development
Self-confidence and self-awareness
Managing feelings and behaviour
Making relationships
Literacy Reading
Writing
Mathematics Numbers
Shape, space and measures
Understanding the world People and communities
The world
Technology
Expressive arts, designing and making
Exploring and using media and materials
Being imaginative
Learning characteristics How (name of child) learns
Playing and exploring investigating and exploring
representing experiences
having a go
Active learning being involved and absorbed
keeping on trying
enjoying achievement
Creating and thinking critically having own ideas
making links
developing strategies
13
2. Analysis of the assessment data
Summary As a result of data collected from the pilot, the Government has been able to define a new
Good Level of Development (GLD) measure. Children will have reached a good level of
development at the end of the EYFS if they achieve at least the expected level in the ELGs
in the prime areas of learning (personal, social and emotional development; physical development; and communication and language) and in the specific areas of
mathematics and literacy.
41% of children were assessed as achieving a GLD and the total average point score5 for
all children was 32 points (out of a possible score of 51 points). In the GLD, autumn born
children’s performance was the highest and the average point score was the highest for
girls and autumn born children.
Across the 17 ELGs, performance was lowest in writing and numbers and highest in moving
and handling, health and self-care and technology.
The widest gender gaps were in the being imaginative, writing, and exploring and using
media and material ELGs, where the percentage of girls and boys reaching the expected
level differed by 18, 17 and 15 percentage points respectively.
The free school meals (FSM) gaps in the moving and handling, technology and exploring
and using media and materials were narrow at 7, 7 and 8 percentage points respectively.
The widest gap in the proportion of children achieving all the prime areas of learning was
between children whose first language is English and children whose first language is other
than English. The gap was 19 percentage points.
2.1 Introduction This chapter presents the analysis of the assessment data collected from the pilot. The analysis
presented here includes a detailed look at performance in the new GLD and new supporting
measure (section 2.2), an insight into the distribution of points across the Profile (section 2.3), a
performance analysis by children’s characteristics (section 2.4 to section 2.8) and analysis of the
relationships between the different ELGs (section 2.9).
As the collected data was dependent on LAs volunteering to participate, the sample was unlikely
to be nationally representative. This, however, needed to be addressed at the analysis stage to
ensure that the results seen here are as representative as possible of the national results. For this
reason, a weighting methodology has been applied to the analysis in this section (with the
exception of sections 2.8 and 2.9 where the results are not dependent on the use of a nationally
representative sample).
5 A child is assigned one point for an emerging ELG, two points for an expected ELG and three points for an
exceeding ELG.

14
2.1.1 Weighting methodology
We know that children’s performance is, to a certain extent, dependent on various socio-
demographic factors including FSM eligibility and gender. Therefore, we compared the socio-
demographic characteristics of children in the sample to the characteristics of all EYFS children
nationally6. The differences between the characteristics of the sample and the national EYFS
population were calculated and each child in the sample was assigned a weight value. Applying
these weights to the data ensured that the sample was more comparable with the national EYFS
population.
Essentially, children with characteristics that were over-represented in the sample were weighted
down and children with characteristics that were under-represented were weighted up. To illustrate
this, using a simplified hypothetical example, if there were 25% of children of a White ethnicity in
the national population, but only 20% in our sample, the weight value would equal 0.25/0.20.
Every child of a White ethnicity would have been given a weight value of 1.25. This means their
assessment counted for more than the value of one child in the analysis. A full list of the weight
values assigned to each group can be found in appendix E.
2.1.2 Comparing the performance of pilot children to the national EYFS population
The analysis in this section was designed to test the success of the weighting methodology. It
reports on whether children that participated in the pilot (once weighted) performed similarly, better
or worse than the national EYFS population on the old Profile. This gives an indication of how the
pilot children’s performance is likely to compare to the national results. The analysis considers
children’s average total point score, performance in the old GLD7 measure and performance
across the 13 scales8 of the old Profile.
Table 2.1 shows that on the whole, children participating in the pilot performed similarly to the
national population. The most noticeable difference was between the proportions that achieved six
or more points in the reading scale where the pilot children outperformed children nationally by two
percentage points. In contrast, the proportions that achieved a GLD and six or more points in the
writing scale was exactly the same at 64% and 71% respectively. This suggests that the pilot
group (once weighted) was similar to the national population and if all other things remain
constant, it should give us a good indication of the results we can expect to see nationally from the
2013 assessments.
6 This includes all children with valid assessment data for the 2012 EYFS.
7 Defined as the percentage of children achieving six or more points across the seven personal, social and emotional
development and communication, language and literacy scales and a total of 78 points across all 13 scales. 8 See appendix D for a copy of the old Profile. In addition, a report detailing achievement in the old Profile is available
here - https://www.education.gov.uk/publications/standard/publicationDetail/Page1/DFE-RR034

15
It is, however, important to note that when the pilot was conducted, teachers were not using the
new EYFSP as their main assessment and it could be argued that they were assessing against
goals that they were not familiar with. Therefore, the implementation of the new Profile at the start
of the 2012/13 academic year may mean that approaches to teaching differ to suit the
requirements of the new Profile. The 2013 results may therefore deviate from what might be
expected according to the results of the pilot.
Table 2.1 The difference between pilot and non-pilot children’s achievement. Source: National Pupil Database and EYFSP pilot data, 2012
2.2 Analysis of the headline indicators
Based on analysis of the pilot data the new GLD measure has been defined as the proportion of
children achieving9 the ELGs within the three prime areas of learning: communication and language; physical development; and personal, social and emotional development and the
ELGs within the literacy and mathematics areas of learning. This is 12 out of a total of 17 ELGs.
The Department has also introduced a supporting measure which will measure the total number of
points10 achieved across all 17 ELGs in the EYFSP. The national measure is the average of every
child’s total point score.
9 Throughout this paper, ‘achieved’ is defined as either expected or exceeding.
10 A child is assigned one point for an emerging ELG, two points for an expected ELG and three points for an
exceeding ELG.

16
2.2.1 Good Level of Development
Chart 2.2 shows performance in the new GLD measure by characteristics. 41% of children were
assessed as achieving a GLD. In terms of characteristics, autumn born children were the highest
performing group with 52% achieving, followed by girls of which 48% achieved. Children with SEN
performed the worst, with only 3%, 11% and 11% of children with a statement, school action plus
and school action achieving a GLD respectively. 30% of children whose first language is not
English achieved a GLD compared to 43% of children whose first language is English. The highest
performing ethnic group were Chinese children where 44% achieved compared to only 29% of
Black children.
In terms of attainment gaps, there was a 13 percentage point gap between children whose first
language is not English and children whose first language is English. There was a 14 percentage
point gap between boys and girls and a 21 percentage point gap between between FSM11 and
non FSM children. Finally, the largest gap was between autumn and summer born children. The
gap was 22 percentage points.
Although the two are not directly comparable, girls and autumn born children were the top
performers in both the old and new GLD. In addition, all SEN and FSM children were the lower
performers in both.
Chart 2.2 The proportion of children that achieved a good level of development by characteristics. Source: EYFSP pilot data, 2012
11
FSM children are defined as those eligible for FSM not those claiming FSM.

17
2.2.2 Supporting measure
The supporting measure takes into account performance across all 17 ELGs. Each child scores
one point for an emerging ELG, two points for an expected and three points for an exceeding. For
each child, the total point score is the sum of their score in each of the 17 ELGs, where the
minimum score is 17 and the maximum score is 51. All children’s scores are totalled and then
averaged to create the measure.
Table 2.3 shows that the average total point score ranged from 25 points for children with SEN to
34 points for girls and autumn born children. The average score for all children was 32 points. In
terms of characteristics, the greatest difference was between non SEN and SEN children with a
gap of 8 points. The gender, FSM and first language gaps were 3 points each. The gap between
autumn and summer born children was 4 points. Generally, there was little difference between the
ethnic groups. White children, however, scored the highest with a point score of 33. Black children
the lowest with a point score of 30.
Table 2.3 The total average point score by characteristics. Source: EYFSP pilot data, 2012
2.3 Point score distribution
This section looks at total point scores in greater detail and illustrates the distribution of points
across the whole Profile. Chart 2.4 shows that the greatest proportion of children achieved 34
points, which is equivalent to children achieving the expected level across all the 17 ELGs. The
distribution starts a noticeable upward trend at approximately 30 points and then starts to decline

18
at approximately 35 points. Only 2.4% of children achieved 17 points (equivalent to emerging in
each ELG) and only 1.0% of children achieved the maximum of 51 points.
Chart 2.4 The distribution of point scores for all children. Source: EYFSP pilot data, 2012
Chart 2.5 shows that the distribution for both boys and girls also peaks at 34 points. The gender
gap does negatively affect the proportion of boys that achieved 34 points. Only 13.6% of boys
compared to 16.1% of girls achieved the 34 point threshold. Furthermore, the average point score
for girls was 34 points which was higher than the 31 point average for boys. Only 0.6 % of boys
achieved the maximum score of 51 points compared to 1.2% of girls. In contrast, 3.4% of boys
achieved the minimum score of 17 points compared to only 1.3% of girls. Finally, an interesting
observation is that at each of the total point scores from 17 to 33 there were a higher proportion of
boys. Girls had a higher proportion scoring 34 or more. This means that girls, on average, are
more likely than boys to score the expected level or higher in all ELGs.
Again, the distribution for both FSM and non FSM children peaks at 34 points (chart 2.6). As one
might expect the point scores had a tendency to be lower for FSM children than non FSM children.
Only 2.0% of non FSM children achieved 17 points compared to 4.4% of FSM children. This
compares to 1.0% and 0.5% of non FSM and FSM children achieving 51 points respectively.
Point score distribution in the new EYFSP, pilot data 2012
0
2
4
6
8
10
12
14
16
18
17 18 19 20 21 22 23 24 25 26 27 28 29 30 31 32 33 34 35 36 37 38 39 40 41 42 43 44 45 46 47 48 49 50 51
Total Point Score
% o
f chi
ldre
n ac
hiev
ing
a to
tal p
oint
sco
re o
f:
Mean = 32 points

19
Chart 2.5 The distribution of point scores by gender. Source: EYFSP pilot data, 2012
Chart 2.6 The distribution of point scores by FSM eligibility. Source: EYFSP pilot data, 2012
Point score distribution by gender in the new EYFSP, pilot data 2012
0
2
4
6
8
10
12
14
16
18
17 18 19 20 21 22 23 24 25 26 27 28 29 30 31 32 33 34 35 36 37 38 39 40 41 42 43 44 45 46 47 48 49 50 51
Total Point Score
% o
f girl
s an
d bo
ys a
chie
ving
a to
tal p
oint
sco
re o
f:
Girls Boys
Mean girls = 34 pointsMean boys = 31 pointsGap 3 points
0
2
4
6
8
10
12
14
16
18
17 18 19 20 21 22 23 24 25 26 27 28 29 30 31 32 33 34 35 36 37 38 39 40 41 42 43 44 45 46 47 48 49 50 51
% o
f FSM
and
non
FSM
chi
ldre
n ac
hiev
ing
a to
tal p
oint
sco
re o
f:
Total Point Score
Point score distribution by FSM eligibility in the new EYFSP, pilot data 2012
Non FSM FSM
Mean non FSM = 33 pointsMean FSM = 30 points
Gap 3 points

20
2.4 Performance in the 17 early learning goals
2.4.1 All children
The results show that performance in the new ELGs was generally lower than performance in the
old ELGs12. This is in terms of the proportion achieving13 the new ELGs and the proportion
achieving six or more points14 in the old scales. This is to a certain extent to be expected as the
pilot assessments were carried out before the new ELGs were implemented in schools. In
addition, as these results are only based on pilot data these findings should be treated cautiously.
Performance in the literacy and mathematics areas of learning was lower than in the other ELGs.
Chart 2.7 shows the proportion of all children assessed as: emerging; expected; and exceeding
across the 17 ELGs. The proportion that achieved in the four literacy and mathematics ELGs
(indicated by the red box) were the lowest across the whole Profile. More specifically, the lowest
proportion of children achieved writing (59%) and numbers (58%). In comparison, 88% 89% and
88% of children achieved in moving and handling, health and self-care and technology
respectively.
Chart 2.7 The proportion assessed as each of: emerging; expected; and exceeding across all 17 ELGs. Source: EYFSP pilot data, 2012
12
See appendix C for performance in the old ELGs. 13
‘Achieved’ is defined as either expected or exceeding. 14
Six or more points indicates children are working securely within the scale.

21
2.4.2 Gender
Chart 2.8 shows that girls performed best in the moving and handling ELG, whilst boys performed
the best in the technology ELG. Girls performance was noticeably lower in numbers, whilst boys
performance was the lowest in writing. Girls outperformed boys in all ELGs. The widest gender
gaps were in the being imaginative, writing, and exploring and using media and material ELGs
where the gaps were 18, 17 and 15 percentage points respectively. The narrowest gender gaps
were in the technology, numbers and health and self-care ELGs where the gaps were 1, 5 and 5
percentage points respectively
Chart 2.8 The proportion that achieved each of the 17 ELGs by gender. Source: EYFSP pilot data, 2012
Achievement in the 17 ELGs by gender, pilot data 2012
86 85
80
9391
88 88 89
77
68
61
76
8584
88
92
85
75 76
70
8486
82
76
80
65
50
55
70
7578
88
77
67
0
10
20
30
40
50
60
70
80
90
100
Lis
ten
ing
an
d
att
en
tio
n
Und
ers
tan
din
g
Sp
ea
kin
g
Mo
vin
g a
nd
ha
nd
lin
g
Hea
lth
an
d s
elf-c
are
Se
lf-c
on
fid
en
ce
an
d
se
lf-a
ware
ne
ss
Ma
na
gin
g f
ee
lin
gs
an
d b
eh
avio
ur
Ma
kin
g r
ela
tio
nsh
ips
Rea
din
g
Wri
tin
g
Num
be
rs
Sh
ap
e,
sp
ace
an
d
me
asu
res
Pe
op
le a
nd
co
mm
un
itie
s
Th
e w
orl
d
Te
ch
no
log
y
Exp
lori
ng
an
d u
sin
g
me
dia
an
d m
ate
ria
ls
Be
ing
im
ag
ina
tive
Early Learning Goal
% o
f g
irsl
an
d b
oys
ach
ievi
ng
at
leas
t ex
pec
ted
in:
Girls Boys

22
2.4.3 Free school meals
Chart 2.9 shows that FSM children performed best in the moving and handling ELG, whilst non
FSM children performed best in the health and self-care ELG. The performance of FSM children
was the worst in writing (40% achieved), whilst the performance of non FSM children was worst in
numbers (62% achieved). In terms of FSM gaps, gaps were especially wide in reading, writing and
numbers at 22, 23 and 21 percentage points respectively. In contrast, the FSM gaps in the moving
and handling, technology and exploring and using media and materials were narrow at 7, 7 and 8
percentage points respectively.
Chart 2.9 The proportion that achieved each of the 17 ELGs by FSM. Source: EYFSP pilot data, 2012
Achievement in the 17 ELGs by FSM, pilot data 2012
83 83
78
90 91
8784
86
75
63 62
76
83 84
89
86
78
70 70
63
8280
78
72
77
53
40 41
58
69 70
82
78
67
0
10
20
30
40
50
60
70
80
90
100
Lis
ten
ing
an
d
att
en
tio
n
Und
ers
tan
din
g
Sp
ea
kin
g
Mo
vin
g a
nd
ha
nd
lin
g
Hea
lth
an
d s
elf-c
are
Se
lf-c
on
fid
en
ce
an
d
se
lf-a
ware
ne
ss
Ma
na
gin
g f
ee
lin
gs
an
d b
eh
avio
ur
Ma
kin
g r
ela
tio
nsh
ips
Rea
din
g
Wri
tin
g
Num
be
rs
Sh
ap
e,
sp
ace
an
d
me
asu
res
Pe
op
le a
nd
co
mm
un
itie
s
Th
e w
orl
d
Te
ch
no
log
y
Exp
lori
ng
an
d u
sin
g
me
dia
an
d m
ate
ria
ls
Be
ing
im
ag
ina
tive
Early Learning Goal
% o
f F
SM
an
d n
on
FS
M c
hil
dre
n a
chie
vin
g a
t le
ast
exp
ecte
d i
n:
Non FSM FSM
23
2.4.4 Ethnicity
The colour coded table below (table 2.10) represents the scales(s) where each ethnic group
demonstrated their best performance (dark green), second highest performance (light green) and
lowest performance (red).
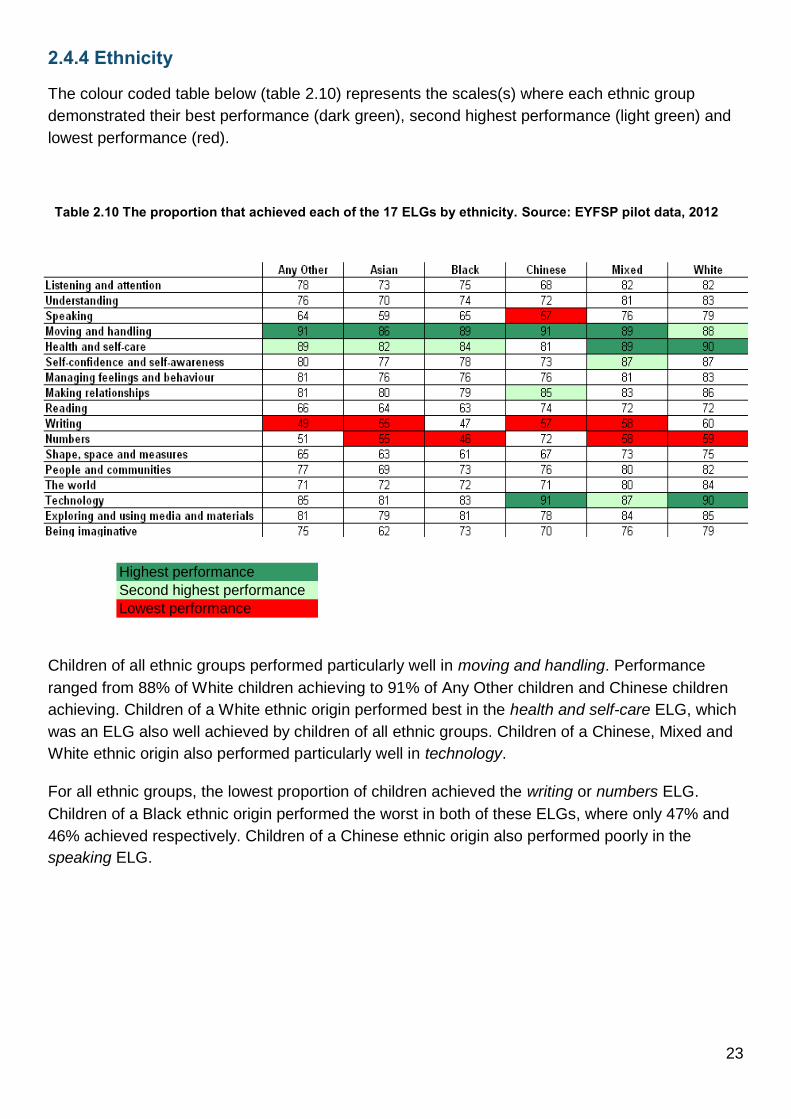
Table 2.10 The proportion that achieved each of the 17 ELGs by ethnicity. Source: EYFSP pilot data, 2012
Children of all ethnic groups performed particularly well in moving and handling. Performance
ranged from 88% of White children achieving to 91% of Any Other children and Chinese children
achieving. Children of a White ethnic origin performed best in the health and self-care ELG, which
was an ELG also well achieved by children of all ethnic groups. Children of a Chinese, Mixed and
White ethnic origin also performed particularly well in technology.
For all ethnic groups, the lowest proportion of children achieved the writing or numbers ELG.
Children of a Black ethnic origin performed the worst in both of these ELGs, where only 47% and
46% achieved respectively. Children of a Chinese ethnic origin also performed poorly in the
speaking ELG.
Highest performance
Second highest performance
Lowest performance
24
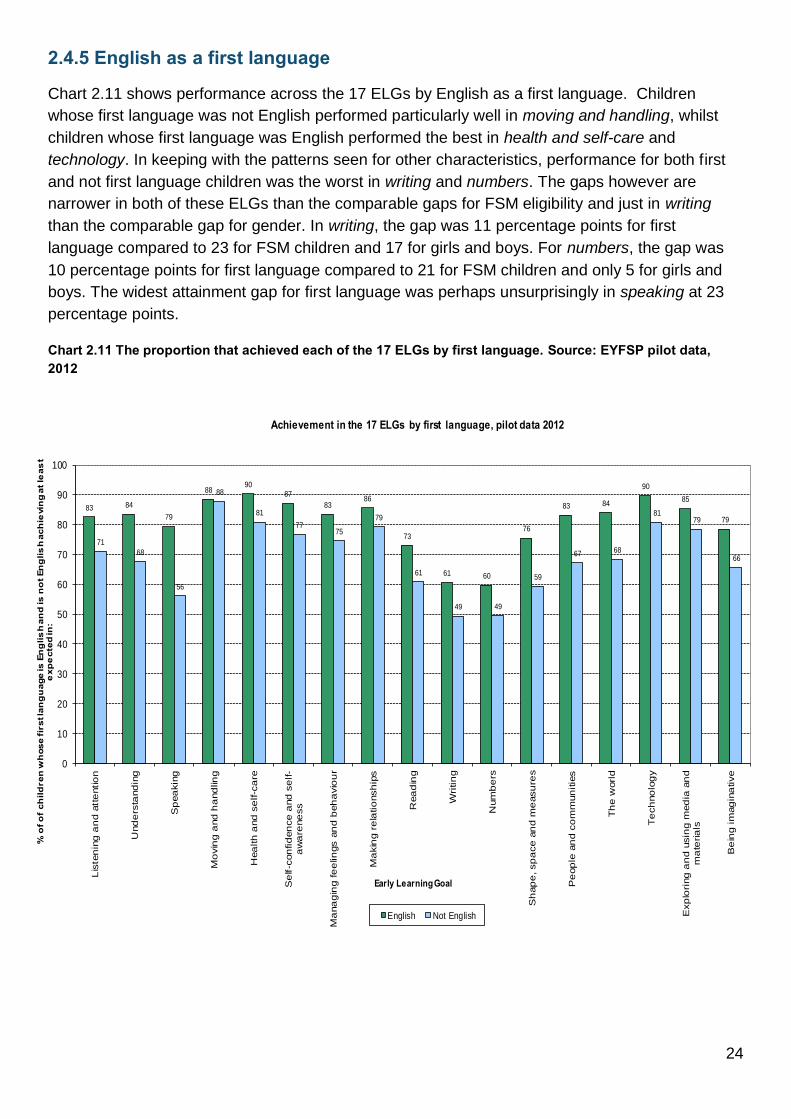
2.4.5 English as a first language
Chart 2.11 shows performance across the 17 ELGs by English as a first language. Children
whose first language was not English performed particularly well in moving and handling, whilst
children whose first language was English performed the best in health and self-care and
technology. In keeping with the patterns seen for other characteristics, performance for both first
and not first language children was the worst in writing and numbers. The gaps however are
narrower in both of these ELGs than the comparable gaps for FSM eligibility and just in writing
than the comparable gap for gender. In writing, the gap was 11 percentage points for first
language compared to 23 for FSM children and 17 for girls and boys. For numbers, the gap was
10 percentage points for first language compared to 21 for FSM children and only 5 for girls and
boys. The widest attainment gap for first language was perhaps unsurprisingly in speaking at 23
percentage points.
Chart 2.11 The proportion that achieved each of the 17 ELGs by first language. Source: EYFSP pilot data, 2012
83 84
79
8890
87
8386
73
61 60
76
83 84
90
85
79
71
68
56
88
81
7775
79
61
49 49
59
67 68
8179
66
0
10
20
30
40
50
60
70
80
90
100
Lis
ten
ing
an
d a
tte
ntio
n
Und
ers
tand
ing
Sp
ea
kin
g
Mo
vin
g a
nd
ha
nd
lin
g
Hea
lth
and
se
lf-c
are
Se
lf-c
on
fid
en
ce
and
se
lf-
aw
are
ne
ss
Ma
na
gin
g fe
elin
gs a
nd
beh
avio
ur
Ma
kin
g r
ela
tio
nsh
ips
Rea
din
g
Wri
tin
g
Num
be
rs
Sh
ap
e, sp
ace a
nd
me
asu
res
Pe
op
le a
nd
co
mm
un
itie
s
Th
e w
orl
d
Te
ch
no
log
y
Exp
lori
ng
an
d u
sin
g m
ed
ia a
nd
ma
teria
ls
Be
ing
im
ag
ina
tive
% o
f of
child
ren
wh
ose
firs
t lan
gu
age
is E
ng
lish
and
is n
ot E
ng
lish
ach
ievi
ng
at le
ast
exp
ect
ed in
:
Early Learning Goal
Achievement in the 17 ELGs by first language, pilot data 2012
English Not English

25
2.4.6 Special educational needs
Table 2.12 details the performance seen by children with SEN.
Children’s performance in all SEN groups was at its best in the technology ELG, whereas the
performance of non SEN children was at its best in health and self-care. Performance ranged from
24% of children with a statement of SEN achieving to 90% of non SEN children achieving. With
the exception of children with a statement of SEN, children’s performance also had a tendency to
be good in moving and handling and health and self-care. For school action and school action
plus, the lowest proportion of children achieved the writing ELG. For children with a statement of
SEN, the lowest proportion of children achieved the speaking ELG. Performance in numbers was
the lowest for non SEN children.
Gaps between all SEN and non SEN children were wide in comparison to the other
characteristics. The greatest gaps were in the speaking, understanding and reading ELGs where
the gaps were 44, 40 and 40 percentage points respectively.
Table 2.12 The proportion that achieved each of the 17 ELGs by SEN provision. Source: EYFSP pilot data,
2012
Highest performance
Second highest performance
Lowest performance
26
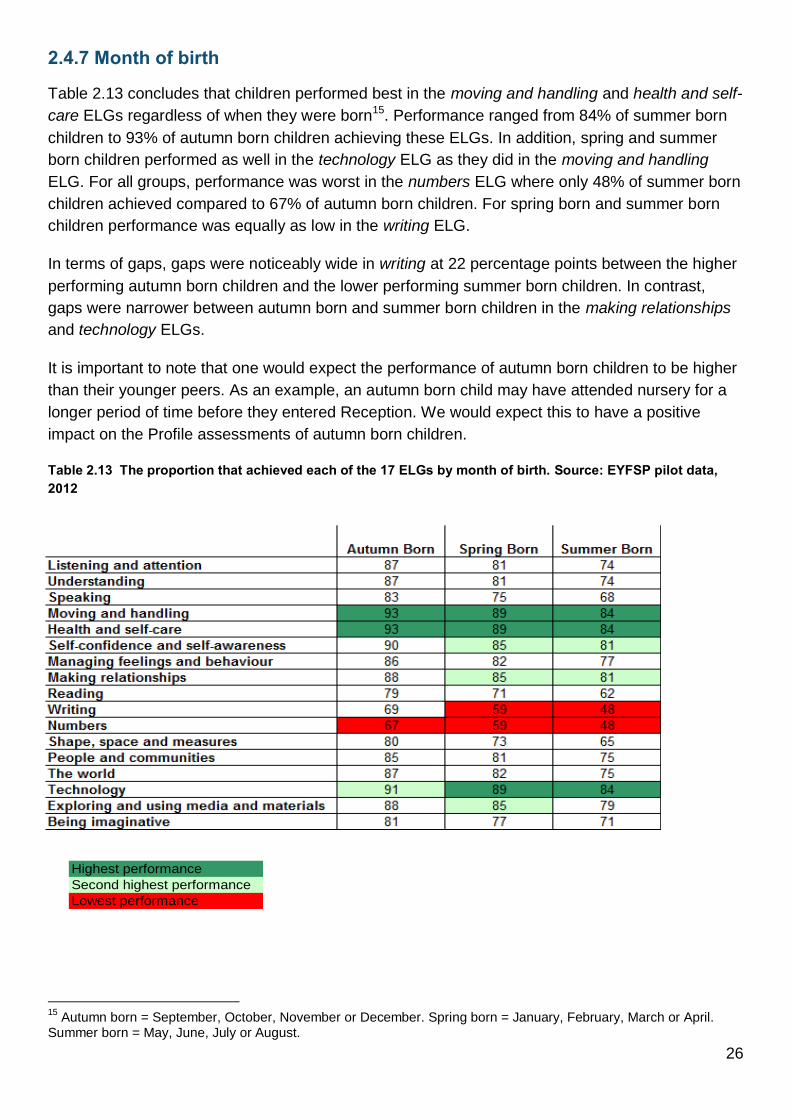
2.4.7 Month of birth
Table 2.13 concludes that children performed best in the moving and handling and health and self-
care ELGs regardless of when they were born15. Performance ranged from 84% of summer born
children to 93% of autumn born children achieving these ELGs. In addition, spring and summer
born children performed as well in the technology ELG as they did in the moving and handling
ELG. For all groups, performance was worst in the numbers ELG where only 48% of summer born
children achieved compared to 67% of autumn born children. For spring born and summer born
children performance was equally as low in the writing ELG.
In terms of gaps, gaps were noticeably wide in writing at 22 percentage points between the higher
performing autumn born children and the lower performing summer born children. In contrast,
gaps were narrower between autumn born and summer born children in the making relationships
and technology ELGs.
It is important to note that one would expect the performance of autumn born children to be higher
than their younger peers. As an example, an autumn born child may have attended nursery for a
longer period of time before they entered Reception. We would expect this to have a positive
impact on the Profile assessments of autumn born children.
Table 2.13 The proportion that achieved each of the 17 ELGs by month of birth. Source: EYFSP pilot data, 2012
15
Autumn born = September, October, November or December. Spring born = January, February, March or April. Summer born = May, June, July or August.
Highest performance
Second highest performance
Lowest performance

27
2.5 Performance in the prime areas This section describes how children with various characteristics performed in the eight ELGs in the
three prime areas of learning: communication and language; physical development; and
personal, social and emotional development.
Chart 2.14 shows that autumn born children performed the best with 70% achieving all of the
prime areas, followed closely by girls where 69% achieved likewise. Children with any SEN
provision performed the worst with only 4%, 20% and 25% achieving all the prime areas for those
with a statement of SEN, school action plus and school action respectively. Most ethnic groups
performed below the average for all children with the exception of White children where 63%
achieved this measure compared to 61% of all children. There was a 14 percentage point
difference between Asian children at 49% and White children at 63%.
In terms of other gaps, there was an 18 percentage point gap between FSM and non FSM
children. There was a 19 percentage point gap between first language and autumn and summer
born children. Finally, the narrowest gap was between the genders at 16 percentage points.
Chart 2.14 The proportion achieving the prime areas of learning by characteristic. Source: EYFSP pilot data, 2012

28
2.6 Achieving all early learning goals This section details the proportion of children achieving all 17 ELGs split by characteristics. Chart
2.15 shows that autumn born children performed the best with 48% achieving all 17 ELGs. As in
the other measures of performance in this report, children with any SEN provision performed the
worst with only 3%, 9% and 10% achieving all ELGs for those with a statement of SEN, school
action plus and school action respectively. Chinese children were the highest performing ethnic
group with 42% achieving all ELGs compared to only 25% of Black children. In terms of gaps,
there was a 20 percentage point gap between FSM and non FSM children and autumn and
summer born children. There was a 14 percentage point gap between first language. Finally, there
was a 16 percentage point gap between the genders.
Chart 2.15 The proportions achieving all 17 ELGs by characteristics. Source: EYFSP pilot data, 2012

29
2.7 Exceeding early learning goals In this section the ability of children to exceed in the ELGs is considered in greater detail.
In 14 of the 17 ELGs a higher proportion of autumn born children exceeded the goal than any
other group (table 2.16). This included the goals in all of the eight prime areas of learning as well
as the reading, writing, shape, space and measures, people and communities, the world and
technology goals. Girls had the highest proportion exceeding the goal in two of the remaining three
ELGs, which were exploring and using media and materials and being imaginative. Chinese
children had an equal proportion exceeding the goal in writing and the highest proportion
exceeding the goal in numbers. It is interesting that Chinese children were less likely to exceed in
the world than SEN children. This however could be an effect of the small numbers of children in
the sample once the data had been broken down by characteristics. Therefore these results
should be treated cautiously16.
More generally, the ELGs in which all children were the most likely to be assessed as exceeding
were listening and attention, reading, moving and handling, health and self-care and self-
confidence and self-awareness, with 17%, 17%, 16%, 16% and 16% exceeding respectively.
Table 2.16 The proportion exceeding in each of the ELGs by characteristic. Source: EYFSP pilot data, 2012
16
There were 77 children of a Chinese ethnic origin in the sample or 0.4%. Although this is a small number, it is roughly equivalent to the proportions of Chinese children nationally.
Highest proportion exceeding
Lowest proportion exceeding
30
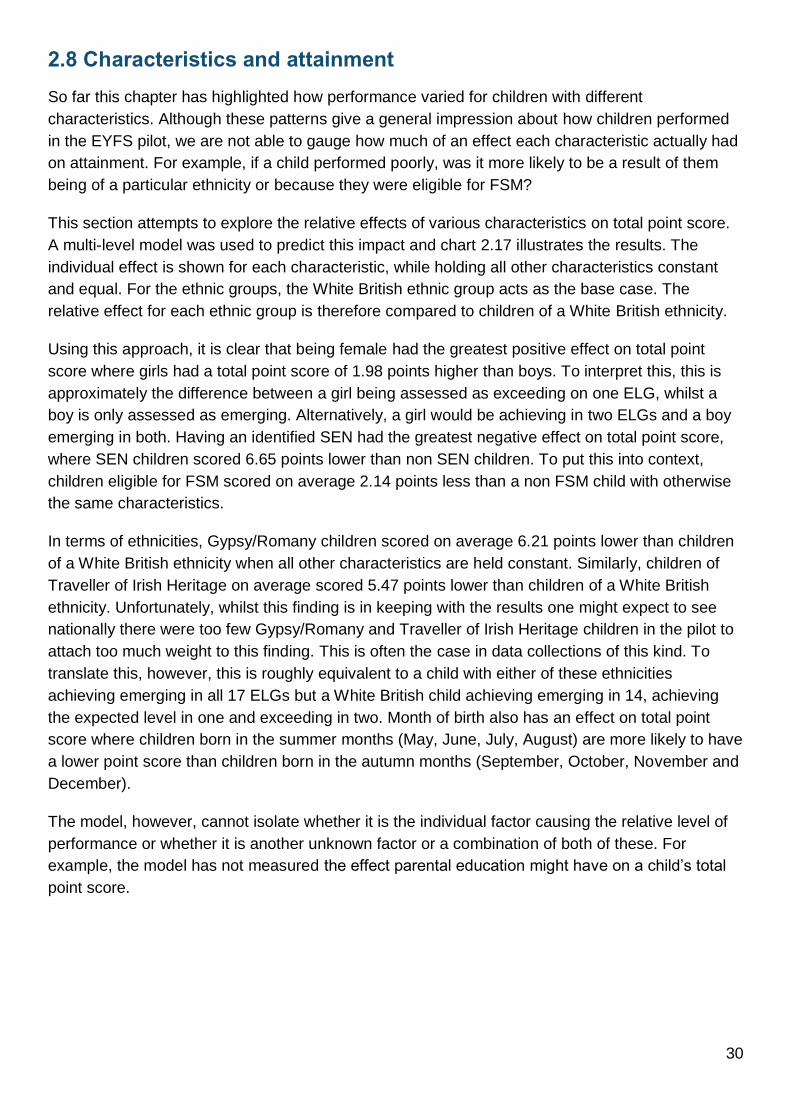
2.8 Characteristics and attainment So far this chapter has highlighted how performance varied for children with different
characteristics. Although these patterns give a general impression about how children performed
in the EYFS pilot, we are not able to gauge how much of an effect each characteristic actually had
on attainment. For example, if a child performed poorly, was it more likely to be a result of them
being of a particular ethnicity or because they were eligible for FSM?
This section attempts to explore the relative effects of various characteristics on total point score.
A multi-level model was used to predict this impact and chart 2.17 illustrates the results. The
individual effect is shown for each characteristic, while holding all other characteristics constant
and equal. For the ethnic groups, the White British ethnic group acts as the base case. The
relative effect for each ethnic group is therefore compared to children of a White British ethnicity.
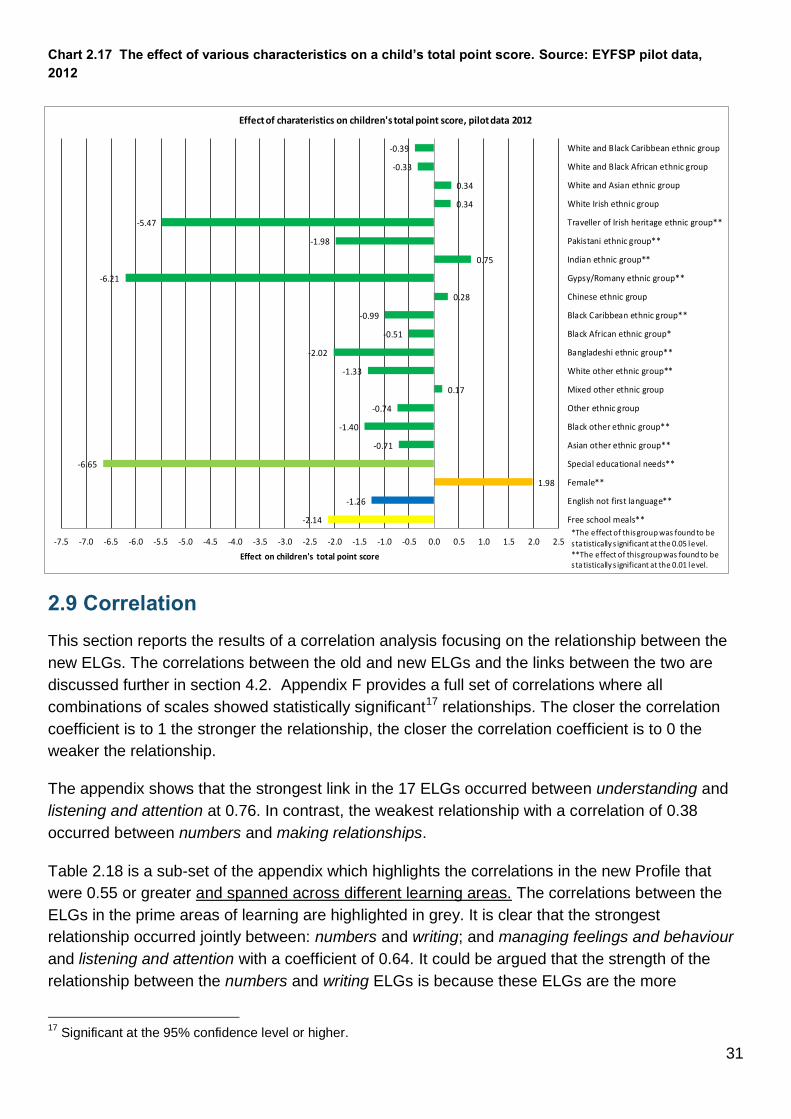
Using this approach, it is clear that being female had the greatest positive effect on total point
score where girls had a total point score of 1.98 points higher than boys. To interpret this, this is
approximately the difference between a girl being assessed as exceeding on one ELG, whilst a
boy is only assessed as emerging. Alternatively, a girl would be achieving in two ELGs and a boy
emerging in both. Having an identified SEN had the greatest negative effect on total point score,
where SEN children scored 6.65 points lower than non SEN children. To put this into context,
children eligible for FSM scored on average 2.14 points less than a non FSM child with otherwise
the same characteristics.
In terms of ethnicities, Gypsy/Romany children scored on average 6.21 points lower than children
of a White British ethnicity when all other characteristics are held constant. Similarly, children of
Traveller of Irish Heritage on average scored 5.47 points lower than children of a White British
ethnicity. Unfortunately, whilst this finding is in keeping with the results one might expect to see
nationally there were too few Gypsy/Romany and Traveller of Irish Heritage children in the pilot to
attach too much weight to this finding. This is often the case in data collections of this kind. To
translate this, however, this is roughly equivalent to a child with either of these ethnicities
achieving emerging in all 17 ELGs but a White British child achieving emerging in 14, achieving
the expected level in one and exceeding in two. Month of birth also has an effect on total point
score where children born in the summer months (May, June, July, August) are more likely to have
a lower point score than children born in the autumn months (September, October, November and
December).
The model, however, cannot isolate whether it is the individual factor causing the relative level of
performance or whether it is another unknown factor or a combination of both of these. For
example, the model has not measured the effect parental education might have on a child’s total
point score.
31
Chart 2.17 The effect of various characteristics on a child’s total point score. Source: EYFSP pilot data, 2012
2.9 Correlation This section reports the results of a correlation analysis focusing on the relationship between the
new ELGs. The correlations between the old and new ELGs and the links between the two are
discussed further in section 4.2. Appendix F provides a full set of correlations where all
combinations of scales showed statistically significant17 relationships. The closer the correlation
coefficient is to 1 the stronger the relationship, the closer the correlation coefficient is to 0 the
weaker the relationship.
The appendix shows that the strongest link in the 17 ELGs occurred between understanding and
listening and attention at 0.76. In contrast, the weakest relationship with a correlation of 0.38
occurred between numbers and making relationships.
Table 2.18 is a sub-set of the appendix which highlights the correlations in the new Profile that
were 0.55 or greater and spanned across different learning areas. The correlations between the
ELGs in the prime areas of learning are highlighted in grey. It is clear that the strongest
relationship occurred jointly between: numbers and writing; and managing feelings and behaviour
and listening and attention with a coefficient of 0.64. It could be argued that the strength of the
relationship between the numbers and writing ELGs is because these ELGs are the more
17
Significant at the 95% confidence level or higher.
-2.14
-1.26
1.98
-6.65
-0.71
-1.40
-0.74
0.17
-1.33
-2.02
-0.51
-0.99
0.28
-6.21
0.75
-1.98
-5.47
0.34
0.34
-0.33
-0.39
-7.5 -7.0 -6.5 -6.0 -5.5 -5.0 -4.5 -4.0 -3.5 -3.0 -2.5 -2.0 -1.5 -1.0 -0.5 0.0 0.5 1.0 1.5 2.0 2.5
Free school meals**
English not first language**
Female**
Special educational needs**
Asian other ethnic group**
Black other ethnic group**
Other ethnic group
Mixed other ethnic group
White other ethnic group**
Bangladeshi ethnic group**
Black African ethnic group*
Black Caribbean ethnic group**
Chinese ethnic group
Gypsy/Romany ethnic group**
Indian ethnic group**
Pakistani ethnic group**
Traveller of Irish heritage ethnic group**
White Irish ethnic group
White and Asian ethnic group
White and Black African ethnic group
White and Black Caribbean ethnic group
Effect on children's total point score
Effect of charateristics on children's total point score, pilot data 2012
*The effect of this group was found to be
s tatistically s ignificant at the 0.05 level. **The effect of this groupwas found to be s tatistically s ignificant at the 0.01 level.

32
challenging ELGs. Similarly, managing feelings and behaviour and listening and attention might
both each offer a similar level of challenge.
Eight of the nine correlations between the personal social and emotional development (PSED)
and communication and language (CL) learning areas had a coefficient of 0.55 or greater. This
illustrates the strength of the relationship between these two prime areas of learning.
Table 2.18 The correlations between the 17 new ELGs. Source: EYFSP pilot data, 2012

33
3 Local authority analysis
Summary There was a 34 percentage point gap between the 5th and 95th percentile in the new GLD.
Girls outperformed boys in all LAs in all three threshold measures detailed in this paper: the
new GLD; prime areas of learning; and all ELGs. Similarly, non FSM children outperformed
FSM children in all LAs in all three measures.
LA distribution was widest for numbers, shape, space and measures, writing, people and
communities and being imaginative. The first three are some of the ELGs where
performance was the lowest.
LA distribution was narrowest in moving and handling and self-confidence and self-
awareness.
3.1 Introduction This chapter presents an analysis of the assessment data for the LAs that participated in the pilot
(appendix B). This includes performance in the three main threshold indicators discussed in this
paper: the new GLD; prime areas or learning; and all ELGs for all children (section 3.2), by gender
(section 3.3) and by FSM (section 3.4). Finally, performance in the 17 individual ELGs at the LA
level is also considered in detail (section 3.5).
As only a sample of children from each LA participated in the pilot these results are not designed
to represent the LAs more generally and it is not necessarily expected that the figures seen here
will be replicated in the local level results. The weighting methodology applied in section 2 has not
been applied here18.
Table 3.1 list the LAs that participated in the pilot. Participation ranged from 150 children to 5,000
children participating per LA. Participation rates ranged from 9% of the EYFS children in each LA
to 44%.
Table 3.1 Participating LAs. Source: EYFSP pilot data, 2012
18
The weighting methodology was not applied here as the results were not dependent on the use of a nationally representative sample.

34
3.2 Local authority performance - all children To refresh, the new GLD measure is the proportion of children achieving in the prime areas of
learning plus the ELGs in the literacy and mathematics areas of learning. Chart 3.2 shows the
spread of performance across the three threshold indicators: the GLD; prime areas of learning;
and all ELGs. The lowest value on the chart is the 5th percentile and the highest value is the 95th
percentile.
Chart 3.2 shows that at the LA level the 5th percentile was 17% and the 95
th was 51%, a gap of 34
percentage points. The median value was 35%. When this is compared to the prime areas of
learning it is clear that the distribution was slightly narrower with a 5th percentile of 44% and a 95th
percentile of 69%, a gap of 25 percentage points. Next, when this is compared to the proportion
achieving all ELGs, the chart suggests that the distribution was wider than the prime areas of
learning but narrower than the GLD measure with a 5th percentile of 15% and a 95th percentile of
48%. This is a gap of 32 percentage points. The median was closest to the 95th percentile in the
prime areas of learning. This suggests that a higher number of LAs performed closer to the 95th
percentile in the prime areas of learning than in the other measures.
Chart 3.2 LA distribution by measures of performance. Source: EYFSP pilot data, 2012
0
10
20
30
40
50
60
70
80
90
100
Good Level of Development Prime Areas All ELGs
Perc
enta
ge achie
ving:
Performance Measure
Local Authority distribution, EYFS pilot data, 2012
35
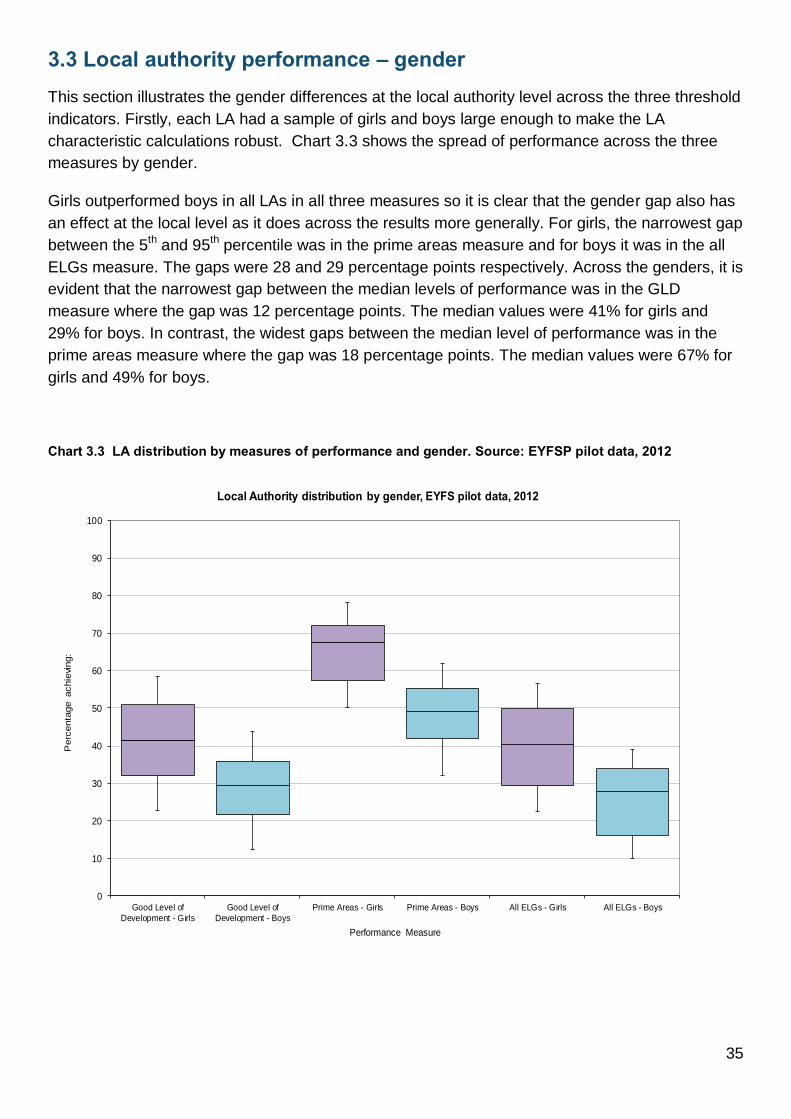
3.3 Local authority performance – gender This section illustrates the gender differences at the local authority level across the three threshold
indicators. Firstly, each LA had a sample of girls and boys large enough to make the LA
characteristic calculations robust. Chart 3.3 shows the spread of performance across the three
measures by gender.
Girls outperformed boys in all LAs in all three measures so it is clear that the gender gap also has
an effect at the local level as it does across the results more generally. For girls, the narrowest gap
between the 5th and 95th percentile was in the prime areas measure and for boys it was in the all
ELGs measure. The gaps were 28 and 29 percentage points respectively. Across the genders, it is
evident that the narrowest gap between the median levels of performance was in the GLD
measure where the gap was 12 percentage points. The median values were 41% for girls and
29% for boys. In contrast, the widest gaps between the median level of performance was in the
prime areas measure where the gap was 18 percentage points. The median values were 67% for
girls and 49% for boys.
Chart 3.3 LA distribution by measures of performance and gender. Source: EYFSP pilot data, 2012
0
10
20
30
40
50
60
70
80
90
100
Good Level ofDevelopment - Girls
Good Level ofDevelopment - Boys
Prime Areas - Girls Prime Areas - Boys All ELGs - Girls All ELGs - Boys
Perc
enta
ge achie
ving:
Performance Measure
Local Authority distribution by gender, EYFS pilot data, 2012

36
3.4 Local authority performance – free school meals This section looks at the differences at the local authority level in the three threshold indicators by
FSM eligibility. Firstly, each LA had a sample of FSM and non FSM children that was large enough
to make the LA characteristic calculations robust. Chart 3.4 shows the spread of performance
across the three measures by FSM.
Chart 3.4 LA distribution by measures of performance and FSM. Source: EYFSP pilot data, 2012
Non FSM children outperformed FSM children in all LAs in all three measures. The chart shows
that for non FSM children the narrowest gap between the 5th and 95th percentile was in the prime
areas measure. For FSM children the narrowest gap was in the all ELGs measure. Across the two
categories of FSM eligibility, it can be concluded that the narrowest gap between the median
levels of performance was in the GLD measure where the gap was 17 percentage points. The
median values were 39% for non FSM children and 22% for FSM children. The widest gap
between the median levels of performance was in the prime areas measure where the gap was 19
percentage points. The median values were 62% for non FSM children and 44% for FSM children.
In the GLD and all ELGs measure, the difference between the 5th and 95th percentile was greatest
for non FSM children. This suggests that there was greater LA variability in these measures for
these children than FSM children. The difference between the 5th and 95th percentile in the prime
0
10
20
30
40
50
60
70
80
90
100
Good Level ofDevelopment - Non FSM
Good Level ofDevelopment - FSM
Prime Areas - Non FSM Prime Areas - FSM All ELGs - Non FSM All ELGs - FSM
Perc
enta
ge achie
ving:
Performance Measure
Local Authority distribution by FSM, EYFS pilot data, 2012

37
areas measure was greater for FSM children which means that LA variability was greater for FSM
children in this measure.
3.5 Performance in the 17 early learning goals In this section performance in the 17 ELGs at the local authority level is considered in greater
detail. Chart 3.5 shows the spread of performance within all of the 17 ELGs. The lowest value is
the 5th percentile and the highest value is the 95th percentile.
Interestingly, the distribution was the widest for the ELGs where overall performance was lowest.
This specifically includes numbers and shape, space and measures, but also writing. There was a
percentage point gap of 38, 37 and 27 between the 5th and 95th percentile in each of these ELGs
respectively. In addition, the distribution was wide for the people and communities and being
imaginative ELGs where there was a percentage point gap of 30 and 29 between the 5th and 95th
percentile respectively.
In contrast, the distribution was narrow in moving and handling and self-confidence and self-
awareness, two of the ELGs where performance was amongst the highest. The percentage point
gap between the 5th and 95th percentile was 12 and 15 respectively.
Across the 17 ELGs, the 5th percentile ranged from only 31% in numbers to 78% in moving and
handling. The 95th percentile ranged from 67% in writing to 94% in technology and health and self-
care. Finally, in terms of the proportion of children achieving across the LAs the median was the
lowest for numbers and highest for health and self-care.
Chart 3.5 The distribution across the 17 ELGs at the local authority level. Source: EYFSP pilot data, 2012
0
10
20
30
40
50
60
70
80
90
100
Lis
ten
ing
an
d a
tte
ntio
n
Und
ers
tand
ing
Sp
ea
kin
g
Mo
vin
g a
nd
ha
nd
lin
g
Hea
lth
and
se
lf-c
are
Se
lf-c
on
fid
en
ce
and
se
lf-
aw
are
ne
ss
Ma
na
gin
g fe
elin
gs a
nd
beh
avio
ur
Ma
kin
g r
ela
tio
nsh
ips
Rea
din
g
Wri
tin
g
Num
be
rs
Sh
ap
e, sp
ace a
nd
me
asu
res
Pe
op
le a
nd
co
mm
un
itie
s
Th
e w
orl
d
Te
ch
no
log
y
Exp
lori
ng
an
d u
sin
g m
ed
ia a
nd
ma
teria
ls
Be
ing
im
ag
ina
tive
Perc
enta
ge achie
ving:
Early Learning Goal
Distribution by Local Authority, EYFS pilot data, 2012
38
4 The links between the old Profile and new Profile
Summary Analysis of the relationships between the old scales and the new ELGs showed that all of
the old scales had statistically significant correlations with all of the new ELGs. Where the
relationship between a scale and an ELG was particularly strong, we might expect the
children that would have performed well in the old scale to also perform well in the new
ELG.
In the old Profile, the strongest relationship was between the reading and the linking sounds
and letters scales. The weakest relationship was between creative development and
numbers scales.
Across the old and new Profile, the strongest relationship was between the two reading
ELGs. The weakest relationships were between technology (new) and emotional
development (old); and technology (new) and creative development (old).
When performance in the old and new GLD was compared, children of a Black ethnicity
were the most affected. Performance between the two measures differed by 32 percentage
points with performance in the old GLD being higher. This compares to just 22 percentage
points for children of a White ethnicity.
In a measure constructed to replicate as closely as possible the old GLD measure,
performance for all groups was lower in the modelled GLD than the old GLD.
4.1 Introduction This chapter explores the links between the old EYFSP and new EYFSP. In this section, the
sample was not weighted and children were only included in this analysis if they had both valid
new assessment data and valid old assessment data for 2012.
This section begins by investigating the interdependencies between the scales within the old and
the ELGs of the new Profile (section 4.2). This gives an indication of what the transition from the
old to new Profile might look like. Section 4.3 examines the difference in performance between the
old and new GLD.
4.2 Correlation This section reports the results of the correlation analysis to assess the relationships between the
old and new Profiles. Appendix F provides a full set of correlations for the 13 old and also the
relationships between the 13 old and 17 new ELGs. All combinations of scales showed statistically
significant19 correlations. The closer the correlation coefficient is to 1 the stronger the relationship.
The closer the correlation coefficient is to 0 the weaker the relationship.
19
Significant at the 95% confidence level or higher.
39
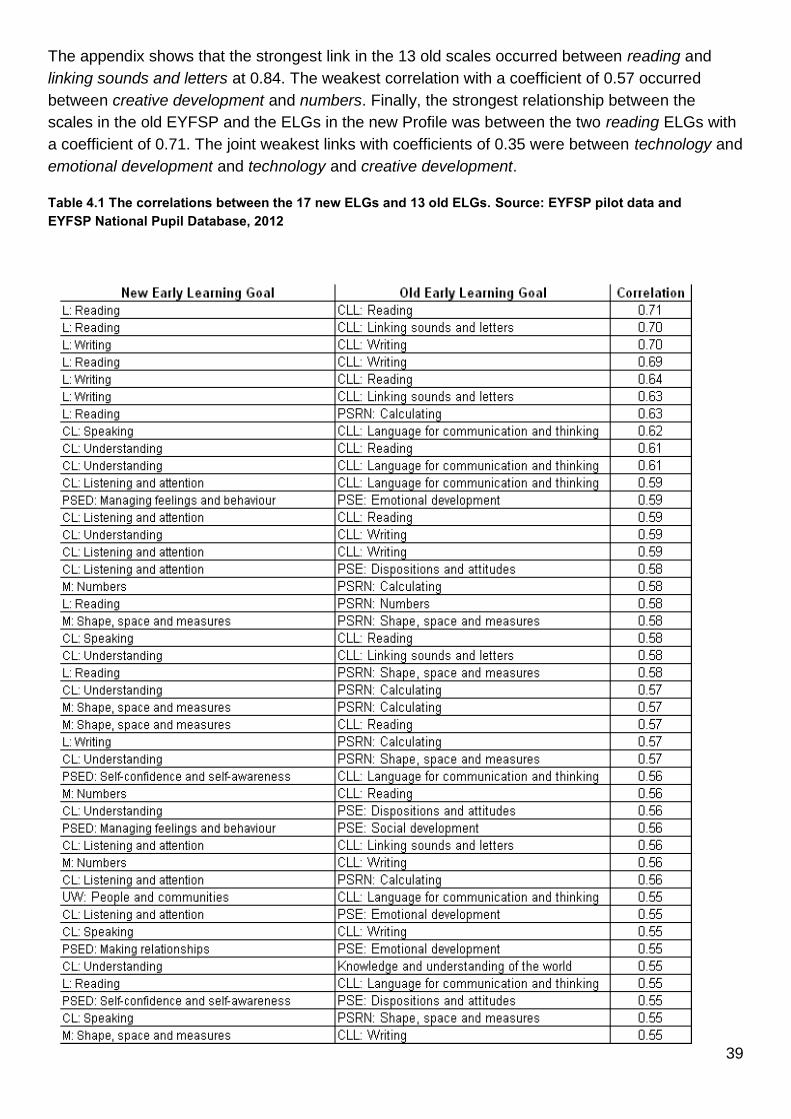
The appendix shows that the strongest link in the 13 old scales occurred between reading and
linking sounds and letters at 0.84. The weakest correlation with a coefficient of 0.57 occurred
between creative development and numbers. Finally, the strongest relationship between the
scales in the old EYFSP and the ELGs in the new Profile was between the two reading ELGs with
a coefficient of 0.71. The joint weakest links with coefficients of 0.35 were between technology and
emotional development and technology and creative development.
Table 4.1 The correlations between the 17 new ELGs and 13 old ELGs. Source: EYFSP pilot data and EYFSP National Pupil Database, 2012

40
Table 4.1 above is a sub-set of the appendix, detailing the correlations between the 13 old and 17
new that were 0.55 or greater. As discussed above, the strongest relationship occurred between
the two reading ELGs. Unsurprisingly, the links between most of the other ELGs in the
communication, language and literacy (old) and literacy (new) areas of learning were also very
strong. More interestingly, the new reading ELG correlated strongly with the old calculating ELG
with a coefficient of 0.63. The ELGs in the new communication and language area of learning
also correlated strongly with the old communication, language and literacy area of learning.
4.3 Performance in the old and new good level of development Section 2.2.1 provides a detailed analysis of how children performed under the new GLD. This
section, however, compares the differences between performance in the old20 and new GLD21.
The old GLD was defined as the proportion of children that achieve six or more points across the
seven personal, social and emotional development and communication, language and literacy
scales and 78 or more points across all 13 scales. The new GLD has been defined as the
proportion that achieve at least the expected level in the early learning goals in the prime areas of
learning (personal, social and emotional development; physical development; and
communication and language) and in the specific areas of mathematics and literacy.
Table 4.2 shows that the proportion of children that achieved the new GLD was 23 percentage
points lower than the proportion that achieved the old GLD in 2012.
Table 4.2 Performance in the old and new GLD by characteristics. Source: EYFSP pilot data and EYFSP National Pupil Database, 2012
20
Figures based on the EYFS national population in 2012. 21
Figures based on pilot children.

41
In addition, the table shows that performance in the new GLD was lower than performance in the
old GLD for all characteristics22. The greatest difference between the two was for children of a
Black ethnicity where 61% of children achieved the old GLD and only 29% of children achieved
the new GLD, a gap of 32 percentage points. In contrast, the smallest difference was for children
with SEN with a gap of 13 percentage points. It should be noted, however, that performance for
SEN children was low in both measures. The difference for children of a Chinese ethnicity was
also small at 18 percentage points.
Next, to determine whether the differences between achievement in the old and new ELGs has
been caused by including a different set of ELGs in the new measure, this section models the
results for a measure that most closely resembles the old GLD. This measure has been
constructed to have a specific focus on the ELGs that are the most similar to the ELGs in the old
GLD, for example, by including the communication ELGs but by omitting an emphasis on
mathematics. The definition of this measure is the percentage of children achieving at least 34
points23 and at least the expected level in: communication and language; literacy; and personal,
social and emotional development. This measure also captures the points element using a similar
principle as the old GLD. The 34 point threshold suggests children achieved all ELGs in the same
way that the 78 point threshold suggests children were working securely (six or more points) within
all ELGs, allowing for some counterbalancing.
Table 4.3 shows the proportion of children that achieved the newly constructed GLD and the old
GLD24 by gender and FSM. It is clear that for in all categories fewer children achieved the
modelled GLD than the old GLD. The biggest difference was for FSM children, albeit only slightly.
Finally, it is also worth noting that the proportion of children that achieved the new GLD (41%) and
the modelled GLD (42%) was only 1 percentage point different.
Table 4.3 The differences between the proportion of children achieving the old GLD and modelled GLD. Source: EYFSP pilot data and Early Years Foundation Stage pupil characteristics SFR, 2012
22
Data taken from the Early Years Foundation Stage Profile Attainment by Pupil Characteristics in England SFR, 2011/12 and the 2012 National Pupil Database. 23
With a scoring system of emerging = one point, expected= two points and exceeding= three points. 24
Defined as the percentage of children achieving six or more points across the seven personal, social and emotional development and communication, language and literacy scales and a total of 78 points across all 13 scales.

42
5 Teacher questionnaires and Reception/Year 1 teacher workshop
Summary Generally, the feedback from teachers responding to the questionnaires and participating in
the workshop was positive:
Over half of the respondents agreed that they had been able to complete the
assessment and the section on the characteristics of learning accurately.
Over half of the respondents found the EYFSP handbook useful in completing the
assessment and just under half found the exemplification material helpful.
Over half of the respondents found it easy to decide whether children were at the
emerging, expected or exceeding level.
When asked whether it was more difficult to make this judgment for any of the
ELGs, between a fifth and a quarter of respondents said no. Almost a half said this
was more difficult for the numbers ELG and between a fifth and a quarter said it was
more difficult for the writing, being imaginative and people and communities ELGs.
This was generally because respondents either felt there was too much content in
the goals, the goals were too challenging, or because the content of the goals had
not been taught this year.
Around six out of ten respondents felt that the new Profile provided them with a
good basis for discussing children’s development with parents and Year 1 teachers.
Between 50-60% of the Year 1 teachers thought that the information from the new
Profile (the assessment against the goals and the information on the characteristics
of learning) would be useful in planning for the children coming into their class, they
tended to think that the Profile gave them a useful snapshot of children’s
development. As with Reception teachers there was some concern about being
able to differentiate between pupils within each of the categories of emerging,
expected and exceeding which did not give them enough information or enable
them to identify gaps in learning and thus what their next steps should be.
Where Reception teachers indicated a concern with the new Profile this tended to focus on
uncertainty around making a best-fit assessment; how to use the information from the
Profile to best inform parents and Year 1 teachers; and making the exemplification more
accessible. Similarly Year 1 teachers, while generally positive, did raise concerns about the
level of detail contained in the new Profile which meant that good transition conversations
with the Reception teacher would be essential.

43
5.1 Introduction
Shortly after completing the new Profile assessments, we asked all Reception teachers and Year
1 teachers in our pilot schools to complete a short online questionnaire. We received
questionnaire responses from 204 Reception class teachers and 39 Year 1 teachers.
Respondents were overwhelmingly female, and from maintained schools. We received responses
from teachers with a range of experience and from teachers across the country, although there
was a low response rate from the London LAs (see tables 5.1 and 5.2).
Table 5.1 Respondents to the Reception class teacher questionnaire
Number Percentage Gender Female 198 97
Male 4 2
Not stated 2 1
Type of school Maintained 185 91
Academy/Free School 11 5
Independent 2 1
Not stated 6 3
Length of time teaching Less than a year 2 1
1 year 11 5
2-5 years 52 26
6-9 years 37 18
10 years or more 102 50
Length of time as a Reception teacher Less than a year 4 2
1 year 22 11
2-5 years 89 44
6-9 years 44 22
10 years or more 42 21
Not stated 3 2
Region North East 3 2
North West 32 16
Yorkshire and the Humber 19 9
East Midlands 19 9
West Midlands 3 2
East of England 48 24
London 10 5
South East 37 18
South West 28 14
Not stated 5 23
TOTAL RESPONDENTS 204

44
Table 5.2 Respondents to the Year 1 teacher questionnaire
Number Percentage Gender Female 38 97
Male 1 3
Type of school Maintained 38 97
Academy/Free School 1 3
Independent 0 0
Length of time teaching Less than a year 0 0
1 year 2 5
2-5 years 15 39
6-9 years 6 15
10 years or more 16 41
Length of time as a Year 1 teacher
Less than a year 2 5
1 year 7 18
2-5 years 21 54
6-9 years 6 15
10 years or more 3 8
Region
North East 6 15
North West 8 21
Yorkshire and the Humber 7 18
East Midlands 6 15
West Midlands 2 5
East of England 6 15
London 1 3
South East 4 10
South West 3 8
TOTAL RESPONDENTS 39
To complement the data gathered from the online questionnaires we held a feedback session with
19 teachers (10 Reception teachers and 9 Year 1 teachers) where we gathered more detailed
feedback about the new Profile and its link with the curriculum for Year 1.
5.2 Views on the new assessment Nearly all of the respondents stated that it took less than an hour to complete the assessment for
each child, and over two thirds said that it took them half an hour or less. Less than 5% of
respondents said it took them an hour or more.

45
Table 5.3 Time taken, on average, to complete the assessment per child
Time taken to complete assessment for one child
Percentage Cumulative percentage
Up to 10 minutes 20.1 20.1
10-20 minutes 0.0 20.1
20-30 minutes 48.5 68.6
30-40 minutes 18.1 86.8
40-50 minutes 4.4 91.2
50-60 minutes 5.4 96.6
More than 60 minutes 3.4 100
This was supported by feedback from the teachers’ workshop where the majority of teachers said
that the assessment against the 17 ELGs had taken them in the range of 10-20 minutes per child.
Many commented that they got quicker as they got used to the new Profile. Many commented that
the section on the Characteristics of Learning had taken them longer.
We asked respondents whether they had been able to accurately complete the assessments (see
Q2 in appendix G). Over half of respondents to this question agreed that they were able to
complete the assessment accurately (54% agreed and 4% strongly agreed). Around a fifth of
respondents disagreed that they could accurately complete the assessment (20% disagreed and
2% strongly disagreed) and a further fifth neither agreed nor disagreed.
190 respondents commented further. 43% of comments included a positive remark about the
accuracy of the assessment. Many of these comments related to the knowledge that teachers had
built up of the children in their class, which made it relatively easy to assess their development.
Figure 5.4 Teachers views of the assessment.
At this point in the academic
year I have a good
understanding of each child’s
development and felt that it
was quite straightforward to
assess if the children were
‘emerging’, ‘expected’ or
‘exceeding’ using the sample
materials provided.
Although it took time to
adjust our thinking to
the new areas of
assessment, it was a
quicker way to record
their achievements
especially as we had a
good knowledge of
children’s abilities. After working with the children
all year I really know what
their strengths and
weaknesses are.

46
Just over one in ten of the comments (12% n = 23) were regarding the best-fit approach.
Comments generally focussed on the subjective nature of a best-fit judgement. Some commented
that this meant that the data was less consistent and less precise and others commented that they
were unsure about the threshold for deciding if a child had achieved the ELG. Many teachers in
the workshop were generally happy with the best-fit approach. They liked the freedom this gave
them but they did raise concerns with the accuracy and consistency of the data resulting from this
approach.
The same proportion of comments (12%, n=22) related to the exemplification materials. 14 people
commented that the exemplification material had not helped them compared to 7 people who
thought the exemplifications were helpful.
The same proportion of comments related to the categories of emerging, expected and exceeding
being very broad. There was some concern that the three categories are too broad to give an
accurate description of individual children’s abilities and do not allow teachers to differentiate
between the children in each group. This was echoed by some of the teachers in the workshop.
Some teachers in the workshop also noted that because the goals tended to emphasise talking
and speaking, this made it harder to award children an expected level if they used other forms of
communication, especially SEN or children with a first language other than English.
Figure 5.5 Teachers views of the assessment
2
The early learning goals are
extremely broad, and using
a 'best-fit' judgement is not
precise. It is dependent on
each practitioner and their
expectation. I prefer a
system with no ambiguity.
I did feel however that some
statements were particularly
lengthy and whilst I
understand the concept of
'best fit' it was sometimes
difficult to ensure that
certain children were
accurately plotted.
I used the exemplification materials to support my judgements and
felt that I was able to assess accurately based on the statements
provided. I felt the new method of assessment made it difficult to
show any differences between less able children who may be
working at a level which is just below the expected level, and SEN
children who may be working far below age-related expectations.
I didn’t feel there was enough given in the way of
exemplification to help me make the judgements and I
wanted to be as accurate as possible for the sake of the
children.
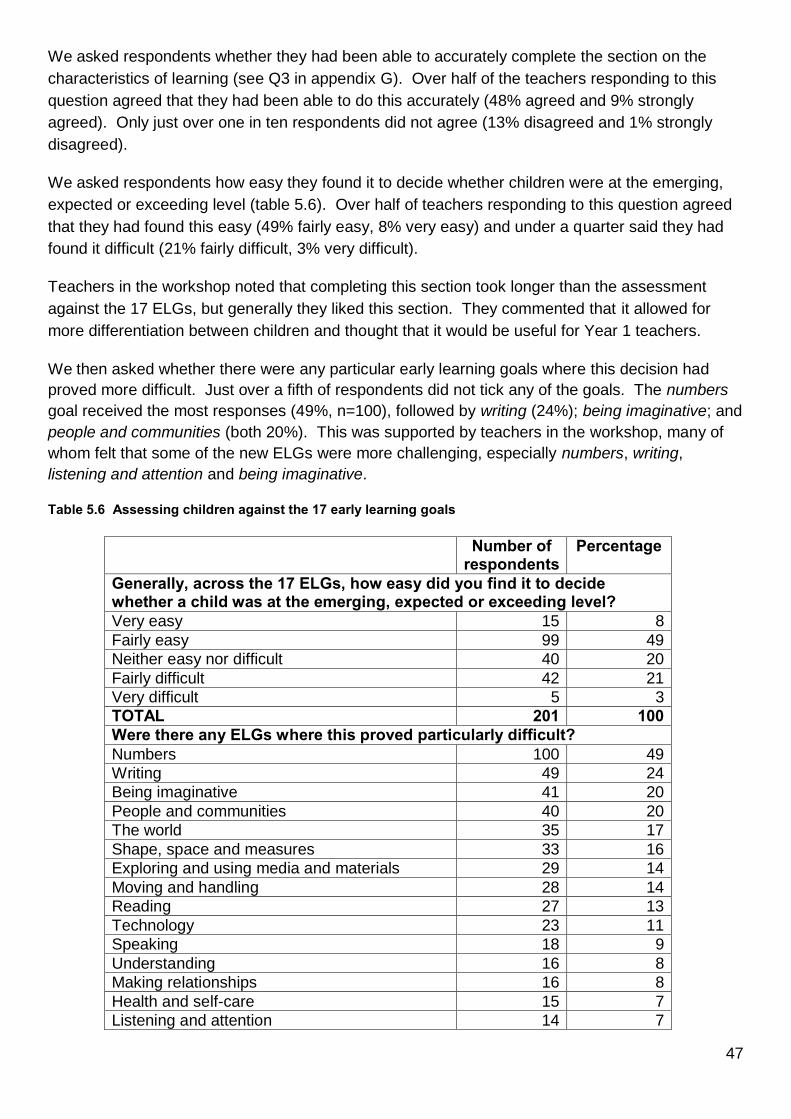
47
We asked respondents whether they had been able to accurately complete the section on the
characteristics of learning (see Q3 in appendix G). Over half of the teachers responding to this
question agreed that they had been able to do this accurately (48% agreed and 9% strongly
agreed). Only just over one in ten respondents did not agree (13% disagreed and 1% strongly
disagreed).
We asked respondents how easy they found it to decide whether children were at the emerging,
expected or exceeding level (table 5.6). Over half of teachers responding to this question agreed
that they had found this easy (49% fairly easy, 8% very easy) and under a quarter said they had
found it difficult (21% fairly difficult, 3% very difficult).
Teachers in the workshop noted that completing this section took longer than the assessment
against the 17 ELGs, but generally they liked this section. They commented that it allowed for
more differentiation between children and thought that it would be useful for Year 1 teachers.
We then asked whether there were any particular early learning goals where this decision had
proved more difficult. Just over a fifth of respondents did not tick any of the goals. The numbers
goal received the most responses (49%, n=100), followed by writing (24%); being imaginative; and
people and communities (both 20%). This was supported by teachers in the workshop, many of
whom felt that some of the new ELGs were more challenging, especially numbers, writing,
listening and attention and being imaginative.
Table 5.6 Assessing children against the 17 early learning goals
Number of respondents
Percentage
Generally, across the 17 ELGs, how easy did you find it to decide whether a child was at the emerging, expected or exceeding level? Very easy 15 8
Fairly easy 99 49
Neither easy nor difficult 40 20
Fairly difficult 42 21
Very difficult 5 3
TOTAL 201 100 Were there any ELGs where this proved particularly difficult? Numbers 100 49
Writing 49 24
Being imaginative 41 20
People and communities 40 20
The world 35 17
Shape, space and measures 33 16
Exploring and using media and materials 29 14
Moving and handling 28 14
Reading 27 13
Technology 23 11
Speaking 18 9
Understanding 16 8
Making relationships 16 8
Health and self-care 15 7
Listening and attention 14 7

48
Managing feelings and behaviour 12 6
Self-confidence and self-awareness 11 5
None 46 23
152 respondents made further comments on this. Table 5.7 shows the types of responses
received most often.
Table 5.7 Why was it difficult to decide whether children were emerging, expected or exceeding (free text response)?
Number of comments
Percentage of comments
(N=104) Content of goals was too much/too broad/ambiguous making the best-fit assessment hard
46 30
Content of goal was more/too challenging 41 27
Content of goals was not taught this year 29 19
Difficult to decide whether children were expected or exceeding
16 11
Comment about specific element of a goal 13 9
Need more guidance exemplification 9 6
3 categories does not allow enough differentiation
7 5
Comment about SEN/first language 7 5
Between a quarter and a third of the comments (30%, n=46) raised the issue that they had
struggled because of the best-fit approach (figure 5.8). Some felt there was too much content in
the goals and others struggled to know what the threshold was for achieving the goal.
Figure 5.8 Views on the best fit approach.
The idea of 'best-fit' is a complete contrast to what we have
been used to, and I think it will be difficult to moderate.
The new early learning goals seem to have taken
the many small steps that children could make on
the old Profile and simply joined them together.
Given that we are not allowed to use this as a
checklist, how do we decide if a child is emerging,
expected or exceeding? If they have achieved half
of the early learning goal statements are they
emerging or expected?

49
A similar proportion of comments related to the level of challenge of the new early learning goals –
and numbers in particular (27%, n=41). Teachers in this category remarked that the level of
challenge seemed higher which meant that fewer children were achieving expected on the new
Profile than were achieving scale point 6 or more on the old Profile, and that fewer children were
expected in this goal than in the other goals (figure 5.9).
Figure 5.9 Views on the new early learning goals
In addition just under a fifth (19% n = 29) of the comments raised the issue that it was hard to
assess children in the areas where expectations had changed as teachers had not necessarily
covered these areas in that academic year.
5.3 Discussing the output of the Profile with parents Although fewer than one in ten respondents had actually discussed the results of the new Profile
with any parents, just under two thirds of teachers said that the they thought the new Profile would
provide them with a good basis for discussing each child’s development with parents (62%)
compared with just over two thirds of teachers who did not (38%).
Of the 15 teachers who had discussed the new Profile with parents, 4 said that it was very/fairly
easy compared to 7 who said it was very/fairly difficult. Opinions varied about why teachers found
it difficult. Some teachers said the new profile did not provide enough detail and some said that
parents hadn’t understood how the new assessment worked.
Numbers- The new 'expected' level equates with the
current scale point 9 numbers as labels for
counting/calculation - Therefore a child who is currently
exceeding is viewed in the new EYFSP as expected and
so forth- seems a mis-match in expectations.
Numbers - there are lots of children
who under the current system are
strong at numbers as labels for
counting but are not so confident in
the calculating strand but in the new
ELG this is lumped together and so
the best fit was often hard to judge as
they had about half the statement
really securely and the other half not.
as much.

50
As with teachers responding to the survey, not many of the teachers in the workshop had
discussed the new Profile with parents. Many felt that the new Profile provided a sound basis for
discussion although there was a general agreement that parents would need more information
than just the 17 outcomes in order to understand their child’s attainment, and that the information
may not be as easy to understand or digest as the scores against the old scales. They felt that the
report/discussions with parents would be more difficult where a child was assessed as emerging
against the goals, and that as parents evening was typically about celebrating children’s progress,
this might be more difficult with the new Profile.
5.4 Discussing the output of the Profile with Year 1 teachers
60 per cent of respondents felt that the new assessment would provide them with a good basis for
discussing each child’s development with Year 1 teachers, compared to 40 per cent who did not.
Over half of the teachers (60%) had actually discussed the new Profile with their Year 1 teachers.
Of these 119 teachers, just over half (53%) said they had found it very/fairly easy, compared to a
quarter of teachers who found it very/fairly difficult. A similar proportion said they found it neither
easy nor difficult (see Q17-Q19 in appendix G).
Just over 100 teachers made a further comment about this issue and opinion was generally
divided between those who did not like the fact that the assessment generated less information
and those that did. Around a third of comments (n=37) related to concerns that the broad
categories of emerging, expected and exceeding did not allow enough differentiation of the level of
development reached by children and did not give Year 1 teachers enough detail about the child.
A number of teachers in the workshop also commented on this. One teacher commented that in
the new Profile it will be easy to identify high-fliers and lower-ability children but that there will be a
big group of children in the expected category with a wide range of skills and abilities, who, on
face value, will all look the same on the assessment. Teachers in the workshop felt that transition
conversations between Reception and Year 1 teachers would become even more important with
the new Profile. They were concerned that in schools where this is not standard practice, children
may suffer. Some suggested that there should be a specific section in the guidance for Year 1
teachers which encouraged them to engage with Reception teachers and informed them about
how to make the best use of the information from the new Profile to plan and support children’s
development.
A quarter of the comments (n=26) referred to teachers being generally happy with using the new
assessment to report to Year 1 teachers. There were references to the fact that there were fewer
statements to report on, and the fact that it gave a concise summary of children’s achievement.
One in ten of the comments also referred to Year 1 teachers liking the characteristics of learning
section.

51
Figure 5.10 The usefulness of the new Profile when reporting to Year 1 teachers
5.5 Year 1 teachers’ views on the new Profile The majority of Year 1 teachers (90%, n=35) stated that the Reception class teacher had
discussed the results of the new Profile with them and just over half (56%, n=22) said they had
been involved in discussions about whether to categorise children as exceeding in any of the
ELGs.
We asked Year 1 teachers what they thought about the information resulting from the new Profile,
compared to the current Profile. Two thirds thought there was less information than in the current
Profile and half thought that the information was less useful than the current Profile, compared to a
quarter who thought it was more useful and a quarter who thought it was the same.
Half of the Year 1 teachers agreed that the information from the new Profile will be useful in
planning for, and supporting the learning and development of children coming into their class next
year (5% strongly agreed, 46% agreed), while a third who disagreed (18% strongly disagreed,
15% disagreed).
35 teachers commented further on this. Between a quarter and a third (29%, n=10) commented
that they were generally happy with the information from the new Profile, there was a roughly
equal split between those who said the report offered a useful summary or snapshot of where
children were in their development (n=5), and those who especially liked the characteristics of
learning (n=3). Around a fifth of comments were about the categories of emerging, expecting and
exceeding being very broad and teachers were concerned that this did not allow them to
differentiate sufficiently between the children in each group. Another fifth thought that the Profile
It was difficult as the children who are working in one
area are still very different. A child who is emerging
can be a higher level than another child who is
emerging. The levels are too vast!
They liked that there were less statements. They liked the
learning characteristics as it gave detailed individual feedback
of each child. They felt that it gave a clearer view of where
each child was academically. They asked lots of questions and
we were able to look through the examples given.

52
did not give them enough information and just under a fifth (17%) were concerned that the Profile
did not enable them to identify gaps in children’s learning or identify the next steps for them.
Figure 5.11 Year 1 teachers’ views on the new Profile
Six out of ten of the Year 1 teachers agreed that the information on children’s characteristics of
learning would be useful in planning for the children coming into their class next year (10%
strongly agreed, 51% agreed) and only 15% disagreed (5% strongly disagreed, 10% disagreed).
34 teachers commented further on this. Six out of ten of the comments echoed the responses to
the previous questions, talking about how this section gave them useful additional information
about the children which they could use for planning purposes. Between a tenth and a fifth of
comments reported that they did not think this information would be useful to them.
It gives a quick overview as
to where the children are in
each area of their learning.
The learning characteristics
will help with planning and
the assessments will assist
with grouping.
The expected statements are too broad and we will be
presuming that the children can do everything in the box.
Separate conversations will be needed in support of this.
The new Profile gives a rough idea of where the children are in
each area but there is not enough information as to where the
gaps are in the children’s learning or even exactly where they
are. Emerging covers a whole range of levels and so does
expecting. The information is a starting point for discussion but
we will have to go back to the development matters sheets to
get a true picture of where the children are.

53
Figure 5.12 Year 1 teachers’ views on the new Profile 2
This was supported by feedback from the Year 1 teachers who attended the workshop. Key
points arising from this were that:
The fact that there is less detail in the new Profile, and much broader categories, makes
transition conversations essential in order to elicit further information about the child.
The teachers agreed that the new Profile was better aligned with the National Curriculum
and felt that the new expectations at the end of EYFS helped to close the gap between
Reception and Year 1, which, traditionally has always seemed quite a big leap for children.
5.6 Views on guidance and exemplification
We asked teachers whether they had everything they needed to complete the assessment.
Around two thirds of respondents said they had everything they needed (62%, n=125) compared
to just over a third who did not (38%, n=77). Of those who said they did not have everything they
needed, 74 people made a further comment about this. Just over a third of the comments (n=25)
mentioned the need for improved exemplification. Over a quarter of the comments (n=21)
mentioned the need for descriptions or exemplification for the exceeding and emerging categories.
More than one in ten of the comments (n=12) also said that some examples of the characteristics
of learning assessment would have been helpful (see Q4-Q5 in appendix G).
We asked respondents whether they thought the draft EYFSP Handbook was useful in completing
the assessment (see Q6 in appendix G). Over half of the respondents agreed that it had been
helpful (9% strongly agree, 47% agree) and only 17% did not think it had been helpful (2%
It is a good way for me to
plan my classroom based on
the learners I will have
Particular strengths
and weaknesses and
preferred ways of
learning will help me
to plan better for the
children's needs
After a child has been
in the class for about
a week I would know
all this information any
way.
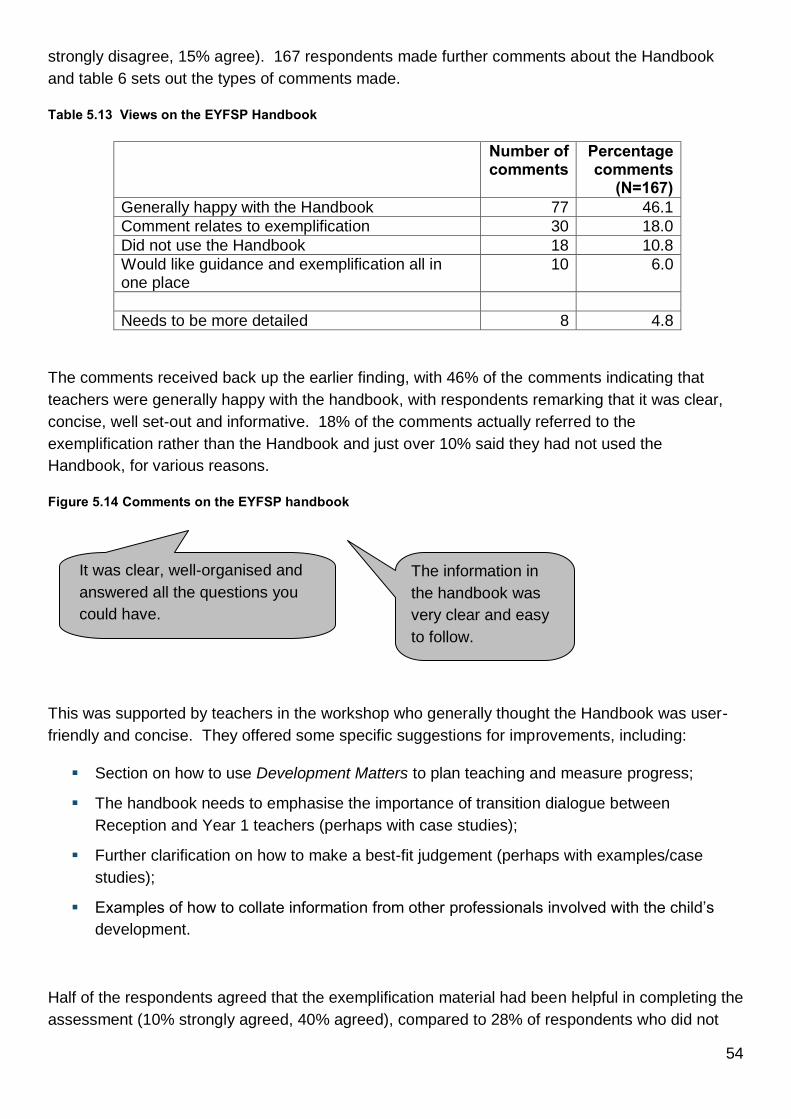
54
strongly disagree, 15% agree). 167 respondents made further comments about the Handbook
and table 6 sets out the types of comments made.
Table 5.13 Views on the EYFSP Handbook
Number of comments
Percentage comments
(N=167) Generally happy with the Handbook 77 46.1
Comment relates to exemplification 30 18.0
Did not use the Handbook 18 10.8
Would like guidance and exemplification all in one place
10 6.0
Needs to be more detailed 8 4.8
The comments received back up the earlier finding, with 46% of the comments indicating that
teachers were generally happy with the handbook, with respondents remarking that it was clear,
concise, well set-out and informative. 18% of the comments actually referred to the
exemplification rather than the Handbook and just over 10% said they had not used the
Handbook, for various reasons.
Figure 5.14 Comments on the EYFSP handbook
This was supported by teachers in the workshop who generally thought the Handbook was user-
friendly and concise. They offered some specific suggestions for improvements, including:
Section on how to use Development Matters to plan teaching and measure progress;
The handbook needs to emphasise the importance of transition dialogue between
Reception and Year 1 teachers (perhaps with case studies);
Further clarification on how to make a best-fit judgement (perhaps with examples/case
studies);
Examples of how to collate information from other professionals involved with the child’s
development.
Half of the respondents agreed that the exemplification material had been helpful in completing the
assessment (10% strongly agreed, 40% agreed), compared to 28% of respondents who did not
It was clear, well-organised and
answered all the questions you
could have.
The information in
the handbook was
very clear and easy
to follow.

55
agree (8% strongly disagreed, 20% disagreed). 190 Respondents made further comments about
the exemplification (see table 5.17). A third of the comments (36% n=72) remarked that the
exemplification had been useful, including that it had been useful in ensuring consistency and that
it had included a good range of examples and gave practitioners confidence in their assessments.
Figure 5.15 Comments on the EYFSP handbook
Around a quarter of comments (23%, n=47) raised concerns about the layout and accessibility of
the exemplification, a concern also raised by the workshop participants. There were calls for hard
copies of the exemplification (from survey respondents and workshop participants) as practitioners
had found it difficult to use the exemplification in its present format. Many also thought that there
was too much material; again this was echoed by some of the workshop participants. Just over
10% of comments referred to the coverage of the exemplification – many said that they would
have liked to see examples of children’s work at the emerging and exceeding levels, and to see
examples from SEN children. Workshop participants also said that exemplification of exceeding
would be helpful, and some asked for further demarcation of the expected category, with
examples of work that was just within expected, compared to work that was well within expected.
A good range of examples were
given for each of the areas of
learning.
It was clear and supported moderation,
especially with children who might be
between emerging and expected.
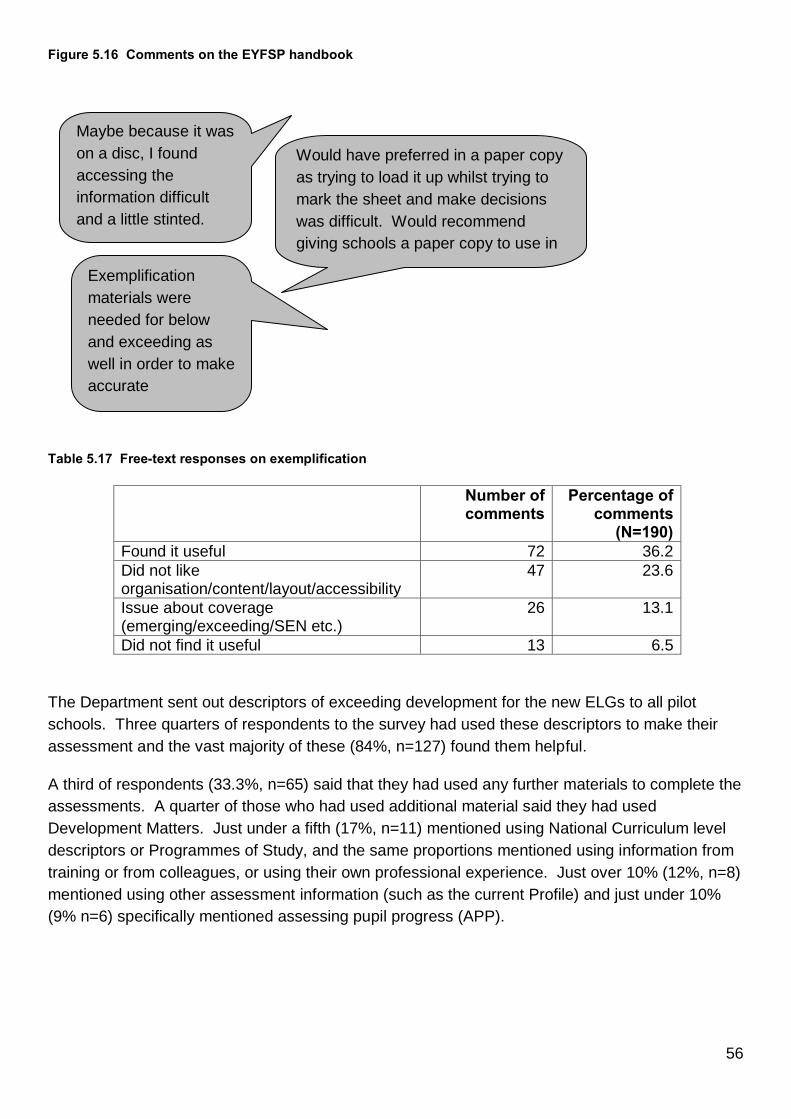
56
Figure 5.16 Comments on the EYFSP handbook
Table 5.17 Free-text responses on exemplification
Number of comments
Percentage of comments
(N=190) Found it useful 72 36.2
Did not like organisation/content/layout/accessibility
47 23.6
Issue about coverage (emerging/exceeding/SEN etc.)
26 13.1
Did not find it useful 13 6.5
The Department sent out descriptors of exceeding development for the new ELGs to all pilot
schools. Three quarters of respondents to the survey had used these descriptors to make their
assessment and the vast majority of these (84%, n=127) found them helpful.
A third of respondents (33.3%, n=65) said that they had used any further materials to complete the
assessments. A quarter of those who had used additional material said they had used
Development Matters. Just under a fifth (17%, n=11) mentioned using National Curriculum level
descriptors or Programmes of Study, and the same proportions mentioned using information from
training or from colleagues, or using their own professional experience. Just over 10% (12%, n=8)
mentioned using other assessment information (such as the current Profile) and just under 10%
(9% n=6) specifically mentioned assessing pupil progress (APP).
Maybe because it was
on a disc, I found
accessing the
information difficult
and a little stinted.
Would have preferred in a paper copy
as trying to load it up whilst trying to
mark the sheet and make decisions
was difficult. Would recommend
giving schools a paper copy to use in
the future. Exemplification
materials were
needed for below
and exceeding as
well in order to make
accurate
judgements.
57
6 Results from the moderation sub-sample
Summary Teachers’ first impressions of the new EYFSP (prior to them carrying out the new
assessments) were broadly positive. The percentage of broadly positive responses to each
of the five questions on the first impressions questionnaire (see appendix I) ranged from
56% in relation to whether the Profile would provide an accurate picture of a child’s learning
and development at the end of EYFS, through 66% for the usefulness of Profile as a means
of providing information for parents, to 84% in relation to whether the Profile would be
manageable. Responses to the three follow-up questions at the detailed feedback events
were a lot less positive, indicating that having had chance to complete the assessment
using the draft handbook and exemplification materials, there were some elements of the
Profile that needed further clarification and development.
In the detailed feedback events, positive responses indicated that the revised Profile does
provide a snapshot of whether children are ready to begin the Year 1 curriculum (delegates
specifically mentioned the effective characteristics of effective learning) and many agreed
that the change to a best-fit assessment gave scope to re-emphasise the importance of
practitioner knowledge. Aspects of concern about the new Profile included its applicability
for children whose attainment is likely to be emerging in the majority of the early learning
goals. Practitioners felt that the move from detailed scale points to three outcome
categories did not give much room to recognise the achievements of these children.
Delegates felt that on its own the new Profile did not provide the depth of information
needed to provide adequate transition information, as the breadth of the outcome bands
hides important detail about children’s learning and development. Delegates also felt that
the best-fit method of assessment and the wording of some of the goals could be
interpreted differently by different practitioners, potentially resulting in a loss of consistency
and accuracy.
Delegates were largely positive about the draft handbook although many felt further
instruction on how to make a ‘best-fit’ judgement would be useful. Views on the
exemplification materials were more mixed. Some delegates felt that the exemplification
represented unrealistic expectations for children at the end of EYFS. On the positive side,
delegates felt that the materials illustrated the range of evidence that practitioners could use
in making their assessments. All delegates felt that the CD_ROM version of the
exemplification materials was not accessible as there were too many documents to look at
which was hard to navigate.
The responses received from moderators to the revised process were broadly positive, with
some common themes about issues which should be addressed. Feedback suggests that
the validation of judgements in the moderation of the revised Profile relies less on physical
evidence and appears to value the expertise and knowledge of practitioners. However, one
of the concerns raised by moderators was the issues of the best-fit judgements being more
open to interpretation. The majority of practitioners were positive about the moderation
process and welcomed the renewed focus on their knowledge of the child. There were

58
concerns however about elements of the process, including a loss of confidence in the
outcomes of moderation at times due to limited use of the exemplification materials and
inconsistent thresholds between the expected and exceeding outcomes.
6.1 Introduction Local Authorities nominated 118 Reception class teachers to be included in a sub-sample whose
judgements on the new Profile would be moderated and who would take part in detailed feedback
events to evaluate the effectiveness of the draft EYFSP handbook, the exemplification materials
and the moderation arrangements. Local Authorities were asked to select teachers with a range of
experience and from a range of schools in a range of circumstances. As well as having a sample
of their new Profile judgements moderated, this sub-sample were asked to complete a first
impressions questionnaire (see appendix I) prior to carrying out the assessments and to attend a
detailed feedback event. The aim of these feedback events was to:
Evaluate whether the revised Profile ensures that practitioners are able to make accurate
and consistent judgements about the attainment of children.
Evaluate the exemplification and guidance on the new Profile provided to practitioners
Evaluate whether the revised moderation arrangements are fit for purpose
Results pertaining to each of these aims are discussed separately below.
In all, 264 responses were received to the first impressions questionnaire and 136 delegates
attended feedback events, this included reception teachers and moderators.
6.2 Results from the first impressions questionnaire We received 264 responses to the first impressions questionnaire (see table 6.1). The number of
responses received was greater than the number of teachers in the sub-sample (n=118) because
some LAs chose to open up the questionnaire to all teachers in the sample. As the questionnaire
was completed under the same circumstances by all participants – during a local launch event,
using material produced by STA – all responses have been included in the analysis.
Responses to the questionnaire (see appendix I), which was completed prior to teachers carrying
out their assessments, were largely positive (see chart 6.2). The percentage of broadly positive
responses to each of the five questions ranged from 56% in relation to whether the Profile would
provide an accurate picture of a child’s learning and development at the end of EYFS, through
66% for the usefulness of Profile as a means of providing information for parents, to 84% in
relation to whether the Profile would be manageable.

59
Table 6.1 Respondents to the First Impressions Questionnaire
Characteristic
Number of
confirmed
respondents
Comments
EYFS practitioner 229 Dual roles possible
EYFS Profile moderator 48
Experienced with EYFS Profile 202
Some moderators provided this
information Experienced teacher but new to EYFS 19
Newly qualified teacher 13
Maintained school 187
No PV providers included as LAs
not in a position to know which
providers would have children for
whom a Profile must be
completed at the time the sample
was agreed
Special school 12
Academy 13
Independent school 5
Free school 0
PV provider 0
Inner city catchment 63
Urban catchment 103
Rural catchment 65
Single age class 165
Mixed age class 65
Children with SEND 191
Children with EAL 138

60
Chart 6.2 Responses to the first impressions questionnaire
Additional commentary from both broadly positive and negative respondents suggests that most
concerns focused on the need for additional information or activity around the core EYFSP in
order to address the following issues;
The breadth of learning and development covered by each of the three outcome bands
The need to ensure the Profile sits within an effective transition process
The tracking of progress of individual children within the Reception year; and
The need to support parents in understanding their child’s learning and development,
especially where the child has special educational needs or disabilities.
At the detailed feedback events the sub-sample were asked a series of follow-up questions to see
whether their opinions had changed after having completed the assessment. The degree of
confidence expressed by delegates following assessment and moderation was significantly lower
than on first impression. Some of this loss of confidence may be accounted for by the detailed
nature of the provisos attached to the majority of the first impressions questionnaires. However, it
should be noted that at three of the four feedback events, there were no positive responses to the
three follow-up questions below.
Do you think the 2013 EYFSP will provide an accurate picture of each child’s learning and
development at the end of EYFS?
71
68
60
86
59
29
32
40
14
41
0 10 20 30 40 50 60 70 80 90 100
On first reading, is the information in the handbook clear and sufficient tosupport you in making or moderating EYFSP assessments?
Do you think the 2013 EYFSP will provide parents with the information parentsneed about their child?
Do you feel that the 2013 EYFSP will provide the information needed by Year 1teachers to plan effectively for each child
Do you think the 2013 EYFSP will be manageable for you to use as anassessment?
Do you think the 2013 EYFSP will provide an accurate picture of each child'slearning and development at the end of the EYFS?
Percentage of responses
Responses to the first impressions questionnaire
Positive
Negative

61
Do you feel that the 2013 EYFSP will provide the information needed by Year 1 teachers to
plan effectively for each child?
Do you think the 2013 EYFSP will provide the information parents need about their child?
When the qualifying comments from the first impressions questionnaires are considered in
conjunction with both sets of responses, it can be seen that there is strong and consistent opinion
that the 2013 Profile and its associated materials required some development activity and
additional guidance in order to deliver its stated purposes.
6.3 Results from the detailed feedback events
6.3.1 Views on the new assessment
A key focus of these events was to assess whether the new Profile ensures that practitioners are
able to make accurate and consistent judgements about the attainment of children. This question
needs to be set in the context of the purposes and uses of the revised Profile, as agreed with
Ofqual:
“The primary purpose of EYFS Profile is to provide a reliable, valid and accurate assessment of
individual children at the end of the EYFS.
“The primary purpose of EYFS Profile is to provide a reliable, valid and accurate assessment of
individual children at the end of the EYFS.
The following primary uses of EYFS Profile data should apply (and these have informed the
development of the Profile):
To inform parents/carers about their child’s development against the ELGs and the
characteristics of their learning;
To support a smooth transition to Key Stage 1 by informing the professional dialogue between
EYFS and KS1 teachers; and
To help Year 1 teachers plan an effective, responsive and appropriate curriculum that will meet
the needs of all children.
In addition DfE consider that a secondary purpose of the assessment is to provide an accurate
national data set relating to levels of child development at the end of the EYFS which can be used
to monitor changes in levels of children’s development/school readiness nationally and locally”
(Source: p6, Draft EYFSP handbook, STA, 2012)
Throughout the varied feedback recorded in response to questions about the Profile some
common themes can be noted in relation to these purposes and uses:

62
Positive responses indicated that the revised Profile does provide a snapshot of whether
children are ready to begin the Year 1 curriculum, and it is felt likely that some parents will
be happy with the approach taken, especially those who will be reassured that their child’s
learning and development is in line with national expectations. The narrative relating to the
characteristics of effective learning will be useful and informative, and there is scope to re-
emphasise the importance of practitioner knowledge in the making of best-fit judgements.
Delegates also agreed that the expected standards for mathematics and literacy have
‘raised the bar’ in terms of children’s learning and development.
There was also a consistent and sizeable body of opinion about those aspects of EYFSP
implementation which give rise to concern. The revised Profile is seen as being of very
limited applicability and relevance for children with special educational needs or disabilities
(SEND), and reporting to parents viewed as very difficult for children with a majority of
outcomes in the emerging band. There was evidence of incipient disengagement of
practitioners whose class includes many or all children with SEND. The emerging band was
felt to disadvantage these children by failing to recognise their learning or to discriminate
between children with very different characteristics of learning and development.
On its own the revised Profile is judged as not able to provide the information needed for
transition purposes for any child, as the breadth of the outcome bands hides important
detail about children’s learning and development. In addition, the best-fit method of
assessment and the wording of some ELGs allowed for individual local interpretation and
application of the ELGs descriptors with consequent loss of accuracy and consistency. The
key purpose of the learning characteristic narrative was also questioned, as this would be
significantly different if designed for parents or as part of the transition information for Year
1 teachers.
Delegates felt that the outcomes of the revised Profile would be influenced by home
circumstances to a greater extent than at present, and that quiet children and those who’s
learning and development exceeds an ELG but is not captured by the associated exceeding
descriptor, would be disadvantaged. The wording of some ELGs is seen as heavily biased
towards spoken language rather than a child’s understanding or ability in that area of
learning; this also hinders the implementation of guidance around the assessment of
children with communication difficulties.
There is felt to be a lack of consistency in the pitch of some ELGs at the expected level,
and the exceeding descriptors are seen as inconsistent in terms of their relationship with
the expected level and current National Curriculum levels where these exist. The method of
implementation of the exceeding descriptions is unclear, and practitioner delegates report
some localised disaggregation of bands and ELGs into elements and sub-levels in order to
add detail to the picture of the child.
6.3.2 Views on the draft EYFSP handbook
The handbook was welcomed by delegates and there was much consistency in their responses to
this aspect of the pilot. In particular the principled approaches to assessment, continuing emphasis

63
on practitioners’ professional knowledge of children’s learning and development and the inclusion
of guidance on a range of aspects of implementation were seen as positive steps towards
accurate and consistent judgement. Information relating to responsibilities was felt to be clear,
though further information was felt to be needed for newly qualified teachers and Year 1
colleagues who were less familiar with current practice.
Delegates felt that further work was needed around instructions for making ‘best-fit’ judgements,
especially some perceived conflicts between this methodology and ELG wording, and the
implementation of the Profile for children with SEND. Definitions of terminology were welcomed,
and additional clarification requested, especially where wording within the ELG is not sufficiently
specific for consistency of judgement.
Disquiet was expressed across the board at the differing order of the ELGs in the Profile and
Development Matters. Overwhelmingly delegates wanted a single guidance document as a source
of reference, with greater detail about the individual ELGs and some exemplification within the
handbook itself. The ability to have a printed hard copy of this material was also strongly
expressed.
6.3.3 Views on the exemplification materials
Responses by delegates to the exemplification were mixed, though there were some significant
areas of agreement and some of the variation of response appears to be linked to the outcomes
attained by children in the delegate’s class.
It should be noted that all the exemplification material had come from, and been moderated by, a
working party of practitioners and local authority moderation managers with extensive EYFS
experience. However some delegates reported that they felt the exemplification was ‘not real’ and
represented an unrealistic level of child development for children at the end of EYFS. Some felt
there was a lack of matching of the exemplification to the pitch of some of the ELGs; this could be
resolved by the addition of ‘blurb’ to further clarify key points within each ELG. Others welcomed
the content of the exemplification as illustrating the range of evidence which could contribute to
accurate assessment, especially the inclusion of post-it notes, parental comments and handwritten
anecdotal observations.
There was consistency around attitudes to the accessibility of the exemplification; this was seen
as time consuming, difficult to navigate and unworkable in normal classroom circumstances. Local
restrictions on downloading and printing were frequently mentioned as barriers to the effective use
of exemplification and hence the accurate benchmarking of judgements. Accessibility problems
were especially noted in relation to moderation where navigation to a specific piece of
exemplification would be useful to illustrate or clarify a judgement.
Whilst there was recognition that in many cases, the characteristic of a child (especially with
respect to SEND and first language) did not impact upon how they demonstrated attainment, a
wider range of exemplification from these groups of children would be welcomed, alongside further
detail about making accurate judgements in these circumstances.

64
Exemplification materials were viewed as vital for developing the knowledge of teaching assistants
and colleagues less familiar with the assessment of children in EYFS. Improved accessibility and
enhancement with additional material and information would be welcomed in support of the
development of local internal moderation and training processes seen as critical for the successful
implementation of the revised Profile.
6.3.4 Moderation process and guidance
Feedback on the moderation process for the revised Profile was sought from practitioners and
moderators separately as the differing experience of each group was felt to be important to the
evaluation of both the Profile and the proposed moderation model.
6.3.4.1 Moderator feedback The responses received from Moderators to the revised process were broadly positive, with some
common themes about issues which should be addressed. Responses also highlighted some lack
of consistency in the use and interpretation of the revised sampling model and the moderation
requirements booklet as a whole, with implications for the practical questions of document
production and publication.
Feedback suggests that the validation of judgements in the moderation of the revised Profile relies
less on physical evidence and appears to value the expertise and knowledge of practitioners.
Whilst some felt that moderation was very time consuming, it was generally agreed that this would
improve as familiarity with the revised Profile, exemplification material and moderation process
developed. The provision of a moderation ‘note of visit’ format was welcomed as a starting point
for further local development. The characteristics of effective learning were viewed very positively
in terms of their contribution to the holistic picture of a child which underpins accurate and valid
assessment and effective moderation.
The main areas of concern expressed by moderators are as follows:
the concept of best fit is open to interpretation between local authorities, resulting in
inconsistent judgements and data
there is a lack of consistency between documents in the order of the ELGs
time implications for moderating large multiple form entry schools and settings
difficulty in moderating judgements in the exceeding band due to insufficient guidance and
exemplification, and inconsistent thresholds between the expected and exceeding levels
a need for further clarification around the moderation of outcomes for children with SEND
as individuals, and of special schools in particular. Special schools present a very distinct
challenge with regard to moderation, in that, where all children are judged to be at the

65
emerging level of development, the outcomes may often be very easily validated – however
the usefulness of this process and the value of the Profile in such circumstances, were
almost universally questioned
an inability to use the exemplification materials effectively during moderation due to
difficulties of access and navigation
the data resulting from the Profile will not provide the level of detail for analysis by local
authorities needed to support and challenge schools
6.3.4.2 Practitioner feedback The majority of delegates reported some confidence when taking part in the moderation of their
judgements using the revised Profile, especially as the focus on a professional dialogue exploring
their professional knowledge was seen to be highlighted. The renewed focus on practitioners’
knowledge of the child was welcomed, and a wide range of supporting evidence, gathered from
normal classroom practice, was mentioned as providing additional information to support the
validation of judgements.
The learning characteristic information was viewed positively within the context of moderation,
providing invaluable information to support the validation of judgements. This was especially so for
children with SEND for whom the majority (if not all) of their Profile outcomes were at the emerging
level. In some cases, discussion of the learning characteristic information was the only focus for
discussion, where outcomes of emerging were very clear cut.
It should be noted that a wide range of sampling methods were noted amongst participating local
authorities, and it is clear that the principles on which the moderation process rests, especially
around sampling, have not be consistently understood or followed. In addition, the exemplification
materials proved inaccessible in many moderation visit circumstances, and practitioners were
frustrated by the problems this caused for the matching of children’s attainment to the ELG. The
lack of exemplification for the exceeding band was also keenly felt by many delegates.
The concerns shared by the majority of practitioner delegates are as follows:
problems with sampling in special schools and multiple form entry schools where it was
considered that a degree of flexibility should be advocated in the guidance material
limited use of the exemplification materials during moderation visits due to the difficulties of
access under visit conditions; this led to a reduction in confidence in the outcomes of
moderation
inconsistent thresholds between the expected and exceeding levels leading to a loss of
confidence at times during the moderation dialogue
difficulty in making and describing judgements for number and being imaginative, due to the
amount of content in these ELGs, some of which was new to the EYFS curriculum
conflicting interpretations of ELG wording which could result in the production of
inconsistent and inaccurate data

66
unease around the lack of detail and usefulness of the emerging band, though this was
considered easy to moderate.

67
Appendices
Appendix A: Expected level descriptors
The prime areas
Communication and language
Listening and attention: children listen attentively in a range of situations. They listen to stories,
accurately anticipating key events and respond to what they hear with relevant comments,
questions or actions. They give their attention to what others say and respond appropriately, while
engaged in another activity.
Understanding: children follow instructions involving several ideas or actions. They answer ‘how’
and ‘why’ questions about their experiences and in response to stories or events.
Speaking: children express themselves effectively, showing awareness of listeners’ needs. They
use past, present and future forms accurately when talking about events that have happened or
are to happen in the future. They develop their own narratives and explanations by connecting
ideas or events.
Physical development
Moving and handling: children show good control and co-ordination in large and small
movements. They move confidently in a range of ways, safely negotiating space. They handle
equipment and tools effectively, including pencils for writing.
Health and self-care: children know the importance for good health of physical exercise, and a
healthy diet, and talk about ways to keep healthy and safe. They manage their own basic hygiene
and personal needs successfully, including dressing and going to the toilet independently.
Personal, social and emotional development
Self-confidence and self-awareness: children are confident to try new activities, and say why
they like some activities more than others. They are confident to speak in a familiar group, will talk
about their ideas, and will choose the resources they need for their chosen activities. They say
when they do or don’t need help.
Managing feelings and behaviour: children talk about how they and others show feelings, talk
about their own and others’ behaviour, and its consequences, and know that some behaviour is
unacceptable. They work as part of a group or class, and understand and follow the rules. They
adjust their behaviour to different situations, and take changes of routine in their stride.

68
Making relationships: children play co-operatively, taking turns with others. They take account of
one another’s ideas about how to organise their activity. They show sensitivity to others’ needs
and feelings, and form positive relationships with adults and other children.
The specific areas
Literacy
Reading: children read and understand simple sentences. They use phonic knowledge to decode
regular words and read them aloud accurately. They also read some common irregular words.
They demonstrate understanding when talking with others about what they have read.
Writing: children use their phonic knowledge to write words in ways which match their spoken
sounds. They also write some irregular common words. They write simple sentences which can be
read by themselves and others. Some words are spelt correctly and others are phonetically
plausible.
Mathematics
Numbers: children count reliably with numbers from 1 to 20, place them in order and say which
number is one more or one less than a given number. Using quantities and objects, they add and
subtract two single-digit numbers and count on or back to find the answer. They solve problems,
including doubling, halving and sharing.
Shape, space and measures: children use everyday language to talk about size, weight,
capacity, position, distance, time and money to compare quantities and objects and to solve
problems. They recognise, create and describe patterns. They explore characteristics of everyday
objects and shapes and use mathematical language to describe them.
Understanding the world
People and communities: children talk about past and present events in their own lives and in
the lives of family members. They know that other children don’t always enjoy the same things,
and are sensitive to this. They know about similarities and differences between themselves and
others, and among families, communities and traditions.
The world: children know about similarities and differences in relation to places, objects, materials
and living things. They talk about the features of their own immediate environment and how
environments might vary from one another. They make observations of animals and plants and
explain why some things occur, and talk about changes.

69
Technology: children recognise that a range of technology is used in places such as homes and
schools. They select and use technology for particular purposes.
Expressive arts and design
Exploring and using media and materials: children sing songs, make music and dance, and
experiment with ways of changing them. They safely use and explore a variety of materials, tools
and techniques, experimenting with colour, design, texture, form and function.
Being imaginative: children use what they have learnt about media and materials in original
ways, thinking about uses and purposes. They represent their own ideas, thoughts and feelings
through design and technology, art, music, dance, role-play and stories.
70
Appendix B: Participating local authorities
Barnsley Blackpool Bolton Buckinghamshire Croydon Darlington East Riding of Yorkshire Hertfordshire Knowsley Lambeth Lewisham Lincolnshire London Borough of Barking & Dagenham Oldham Plymouth Portsmouth Shropshire Southampton Swindon

71
Appendix C: Performance in the old scales

72
Appendix D: The old Profile

73
Appendix E: The weight values
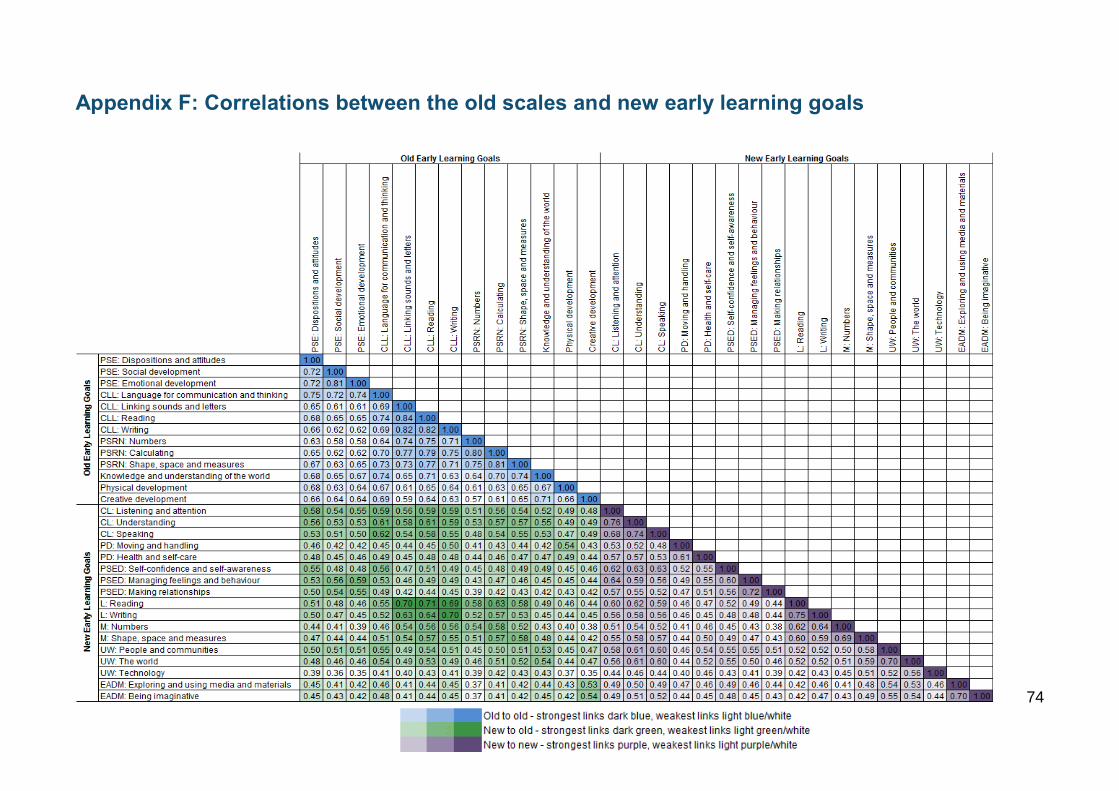
74
Appendix F: Correlations between the old scales and new early learning goals

75
Appendix G: Questions in the online questionnaire for Reception teachers
1. On average, how long did it take you to complete the assessment for one child?
2. Please indicate whether you agree or disagree with the following statement: I was able to accurately complete the assessment Please explain your answer.
3. Please indicate whether you agree or disagree with the following statement: I was able to accurately complete the section on the characteristics of learning.
4. Did you have everything you needed in order to complete the assessment accurately?
5. If no, what else did you need?
6. Please indicate whether you agree or disagree with the following statement: I found the EYFS Profile Handbook useful in helping me to complete the assessments. Why was this?
7. Please indicate whether you agree or disagree with the following statement: I found the exemplification material useful in helping me to complete the assessments. Why was this?
8. Did you use the exceeding descriptions?
9. If yes, did you find them helpful?
10. Did you use any other guidance?
11. If yes, what other guidance did you use?
12. Generally, across the 17 ELGS, how easy did you find it to decide whether a child was at the emerging, expected or exceeding level?
13. Were there any early learning goals where this proved particularly difficult? (Respondents could tick all goals that applied). Why was this?

76
14. In your opinion, does the new assessment provide you with a good basis for discussing each child’s development with their parents?
15. Did you discuss the results of the new Profile with any parents?
16. How easy did you find it to discuss the new Profile with parents? Why was this?
17. In your opinion, does the new assessment provide you with a good basis for discussing each child’s development with Year 1 teachers?
18. Did you discuss the results of the new Profile with any Year 1 teachers?
19. How easy did you find it to discuss the new Profile with Year 1 teachers? Why was this?
20. How many years have you been teaching?
21. How long have you been a Reception class teacher?
22. Gender?
23. Current Local Authority?
24. Type of school you currently work in?

77
Appendix H: Questions in the online questionnaire for Year 1 teachers
1. Did your Reception class teacher(s) discuss the results of the new EYFSP with you?
2. Were you involved in discussions with Reception class teacher(s) about whether to categorise children as exceeding any of the early learning goals?
3. What is your opinion on the: a. amount of information generated from the assessment? b. usefulness of the information from the assessment?
4. Please indicate whether you agree or disagree with the following statement: The information from the new Profile will be useful in planning and supporting the learning and development of children coming into my class next year. Why do you think this is?
5. Please indicate whether you agree or disagree with the following statement: The information on children’s characteristics of learning will be useful in planning and supporting the learning and development of children coming into my class next year. Why do you think this is?
6. How many years have you been teaching?
7. How long have you been a Year 1 teacher?
8. Gender?
9. Current Local Authority?
10. Type of school you currently work in?

78
Appendix I: Questions in the first impressions questionnaire for the moderation sub-sample
1. Do you think the 2013 EYFSP will provide an accurate picture of each child’s learning and development at the end of EYFS?
2. Do you think the 2013 EYFSP will be manageable for you to use as an assessment?
3. Do you feel that the 2013 EYFSP will provide the information needed by Year 1 teachers to plan effectively for each child?
4. Do you think the 2013 EYFSP will provide the information parents need about their child?
5. On first reading, is the information in the handbook clear and sufficient to support you in making or moderating EYFSP assessments?

© Crown copyright [March 2013]
Ref: DFE– RR291
ISBN: 978-1-78105-228-0
You may re-use this information (excluding logos) free of charge in any format or medium, under
the terms of the Open Government Licence. To view this licence, visit
http://www.nationalarchives.gov.uk/doc/open-government-licence/ or e-mail:
Where we have identified any third party copyright information you will need to obtain permission
from the copyright holders concerned.
The views expressed in this report are the authors’ and do not necessarily reflect those of the
Department for Education.
Any enquiries regarding this publication should be sent to us at Eleanor Cotzias , Level 4,
Sanctuary Buildings, Great Smith Street, London, SW1P 3BT
Email: eleanor.cotzias @education.gsi.gov.uk
This document is also available from our website at:
http://www.education.gov.uk/researchandstatistics/research


