TOP INCOMES IN KOREA, 1933-2010: EVIDENCE FROM INCOME TAX STATISTICS NAK NYEON KIM * Department of Economics, Dongguk University Seoul 100-715, Korea [email protected]AND JONGIL KIM Department of Economics, Dongguk University Seoul 100-715, Korea [email protected]Received January 2014; Accepted May 2014 Abstract This paper constructs the long-term series of top income shares in Korea using income tax statistics. Top income shares dropped sharply after WWII, remained low during industrializa- tion periods, and has ascended since the mid-1990s. We suggest that the fall in the top income shares after WWII can be explained by the economic collapse and political disruption after liberation. The rising income concentration in the last 15 years could be attributable to the drastic shift in industrial structure and the institutional factors such as the reduction in the marginal tax rate and the post-crisis changes in the corporate governance system. Keywords: top income shares, income tax statistics, inequality, Korea JEL Classification Codes: N10, O15 I. Introduction The indices of income inequality such as Gini coefficients and poverty rates are constructed based on the Household Income and Expenditure Survey by the Korea Statistical Office. 1 Although the household survey is a suitable source to compute the indices of income inequality, it does not allow us to study the long-run trend in income inequality. The raw data Hitotsubashi Journal of Economics 56 (2015), pp.1-19. Ⓒ Hitotsubashi University * Corresponding author 1 To be exact, income inequality indices such as Gini Coefficients and income decile distributions are currently computed based on the Household Income and Expenditure Survey by the Korea Statistical Office and the Farm Household Economy Survey by the Ministry of Agriculture and Forestry.
This paper constructs the long-term series of top income shares in Korea using income tax
statistics. Top income shares dropped sharply after WWII, remained low during industrializa-
tion periods, and has ascended since the mid-1990s. We suggest that the fall in the top income
shares after WWII can be explained by the economic collapse and political disruption after
liberation. The rising income concentration in the last 15 years could be attributable to the
drastic shift in industrial structure and the institutional factors such as the reduction in the
marginal tax rate and the post-crisis changes in the corporate governance system.
Keywords: top income shares, income tax statistics, inequality, Korea
JEL Classification Codes: N10, O15
I. Introduction
The indices of income inequality such as Gini coefficients and poverty rates are
constructed based on the Household Income and Expenditure Survey by the Korea Statistical
Office.1 Although the household survey is a suitable source to compute the indices of income
inequality, it does not allow us to study the long-run trend in income inequality. The raw data
Hitotsubashi Journal of Economics 56 (2015), pp.1-19. Ⓒ Hitotsubashi University
* Corresponding author1 To be exact, income inequality indices such as Gini Coefficients and income decile distributions are currently
computed based on the Household Income and Expenditure Survey by the Korea Statistical Office and the Farm
Household Economy Survey by the Ministry of Agriculture and Forestry.
of the household survey are available only since 1990 and do not cover single-person
households prior to 2006.2 Moreover, they provide household income data only for wage and
salaried workers in the earlier years by excluding self-employed and family workers in the
survey. In addition, Kim and Kim (2013) found that the household survey leaves out a
considerable number of top income households in the sample and also severely understates
household financial income. Due to the problem of under-coverage and under-reporting, the
existing indices of income inequality do not allow us to study the evolution in income
inequality in Korea because the homogeneous data are available only for a small number of
recent years and even the available data may not adequately reflect the actual situation of
income inequality.
Instead of using the indices based on the household survey, this paper constructs the long-
term series of top income shares in order to study the evolution of income concentration in
Korea. We estimate income shares for the top income groups, such as the top 1% of the income
distribution, by using income tax statistics. Although the top income shares do not provide
information about the income distribution of lower income groups, they allow us to construct a
homogeneous long-term indicator of income concentration. They also enable us to study the
evolution of income concentration in Korea in a comparative perspective as the top income
shares have been constructed for many countries such as France (Piketty, 2003), the U.S.
(Piketty and Saez, 2003), the U.K. (Atkinson, 2005), and Japan (Moriguchi and Saez, 2008).3
Income tax statistics in Korea go back to the colonial period. The global income tax
system which taxes the aggregate income from various income sources of a taxpayer was
introduced in 1934 for the first time in Korea.4 Since then, there have been three major
changes in tax system in addition to numerous minor revisions. Thus, available information
from income tax statistics varies over time. Notwithstanding missing periods due to limited
information from the data source, this paper investigates the long-term trend in income
inequality in Korea from 1933 to 2010.
During this period, Korea underwent several different regimes. Korea was under Japanese
colonial rule from 1910 to 1945 and experienced a wartime control system after 1937. After
liberation in 1945, the Korean Peninsula was divided into two nations, the South and the North.
Subsequently, the Korean War broke out in 1950 lasting for three years. After the war, South
Korea achieved long and rapid economic growth although its growth rate subsided after the
economic crisis in 1997. This paper will provide a starting point to discuss how income
inequality has evolved under these different regimes.
The paper is organized as follows. Section II describes the data and outlines the estimation
methods. Section III presents the findings from the construction of top income shares. Section
IV explores the plausible causes for the changes in income concentration and section V
provides the conclusion.
HITOTSUBASHI JOURNAL OF ECONOMICS [June2
2 The Gini coefficients, decile income distributions, and poverty rates since 1990 are reported on the website (http:
//kostat.go.kr) of the Korea Statistical Office.3 Top income shares series of various countries can be obtained from Alvaredo, Atkinson, Piketty and Saez, the
World Top Income Database(http: //topincomes.g-mond.parisschoolofeconomics.eu). Top income shares series seem to
become an alternative measure of income inequality as they are accumulated. The OECD report on income inequality
paid attention to top income shares along with traditional indices of income inequality (OECD, 2011).4 The terminology of global income tax came from the English translation of Chonghap Soduk Sae in the Statistical
Yearbook of National Tax published by the National Tax Service of Korea.
II. Data and Methodology5
In this section, we will briefly introduce the nature of data and the methods of estimation
and provide a detailed description as well as a complete set of results in Appendix.
Top income shares are computed by dividing the amount of income accruing to the
specified top income groups by total income. We define income as a gross income earned by
individuals before tax deductions and exemptions. It includes all types of income such as
salaries, wages, bonuses, interest, dividends, rents, and business income including self-
employment income. However, earnings from capital gains are not included in income.
We utilize information on the self-assessed income in the tabulation of the global income
tax. Self-assessed income filed for global income tax returns includes various types of personal
income, such as interest, dividends, and rents, as well as wage and business income. The global
income tax system was first introduced in 1934 by the colonial government. The data on the
number of taxpayers, the amount of income, tax paid, and tax rate by income brackets for the
colonial period can be obtained from Chōsen Zeimu Tōkeisho [Statistical Tables of Public
Revenue of Colonial Korea] and Chōsen Sōtokufu Tōkei Nenpō [Statistical Yearbook of the
Government of Colonial Korea]. After liberation in 1945, the global income tax system was
abolished. Instead, separate taxes were imposed at source on labor income, business income,
rental income from real estate, and interest and dividends until 1975, when the global income
tax system was reintroduced. Thus, the data on the total income earned by taxpayers are not
available for this period of the separate tax system, although statistics on the amount of tax
paid for each source of income are reported. The data after 1957 can be obtained from Kuksae
Tonggae Yonbo [Statistical Yearbook of National Tax]. Unfortunately, our data source does not
provide separate statistics on the tax withheld at source such as wage income for the period of
1976-1994. However, the data on wage income tax for 1979-85 can be obtained from an
internal source of the National Tax Service.
Table 1 displays the major changes in the tax system since the colonial periods. During the
period of 1933-1953, householdʼs total amount of income (class III income following the
terminology at that time, which is close to the current definition of global income) was taxed if
a household, the tax unit at that time, earns more than the exemption point. For the period of
1954-1975, earnings from different sources were taxed separately because Korea did not adopt
the global income tax system. Therefore, it is not possible to construct top income shares for
this period because the tabulation of income tax does not allow us to extract data on the total
amount of income of taxpayers. The global income tax system was reintroduced in 1975.
However, a fraction of the top income groups are exempt from filing global income tax returns.
Taxpayers with wage income which includes wages, salaries and bonuses do not have to file
global income tax returns if the amount of income from sources other than wage income does
not exceed a certain level. Thus, income accruing to this group of top income earners is not
counted in the tables of global income tax returns. Therefore, we have to combine the
tabulations of global income tax and wage income tax to make up for these missing top wage
earners.6 We also need to take into account other types of income taxes withheld at source.
TOP INCOMES IN KOREA, 1933-2010: EVIDENCE FROM INCOME TAX STATISTICS2015] 3
5 The detail description on data and methodology can be downloaded at the website of the Hitotsubashi Journal of
Economics (http://hdl.handle.net/10086/27197).
However, these types of income do not affect our estimate of top income shares as much. Our
data source allows us to estimate top income shares including other income items in addition to
the wage income since 2009. However, we found that it does not make any significant
difference. It is due to the fact that the income levels of taxpayers who have income tax
withheld at source for these items are not high enough to be included in the top income groups.
Top income groups are defined relative to the total number of adults, defined as 20 years
old and above, which can be computed from population statistics. Other candidates for the
control total for the population could be the total number of taxpayers or total employment.
Due to the tax exemption and withholding tax system, only a small fraction of individuals file
income tax returns. Therefore, the total number of taxpayers is not a consistent control total for
time-series and cross-section comparison because its scope varies among different tax systems.
Total employment is too narrow as it excludes individuals relying on non-labor sources.
Although the adult population, our control total, includes the economically inactive population,
it provides a relatively proper reference for comparison over time and across countries.7 We
obtain the total number of adults from population statistics published by the Korea Statistical
Office. For the period before 1945, we interpolate the data for missing years by using the rate
of change between the population census in 1930, 1935, 1940 and 1944. The number of adults
is presented in Table A1 in Appendix.
We cannot compute the control total for income from income tax statistics because the
income tax statistics do not count the taxpayers who do not file income tax returns. Thus, we
rely on National Accounts. We obtain the total amount of income after subtracting those items
which do not belong to personal earnings from the income of households in the table of income
account by institutional sectors. For the colonial period, we use the data constructed by Kim ed.
HITOTSUBASHI JOURNAL OF ECONOMICS [June4
6 For the detail method, see Appendix A.3.3.7 Our definition is the same as that of Moriguchi and Saez (2008) who constructed the top income shares series for
Japan.
Interest
Individual
(Financial income
included in global
income)Separate income
taxation
Class III income tax
(1933-1942)Global income(1976-present)
Household
1993-1953 1954-1975
Tax unit
1976-1995
Source: Authorsʼ tabulation based on the Income Tax Law of Korea obtained from the website of the Ministry of
Government Legislation (Available from URL: http://www.law.go.kr).
Notes: 1) Periods specified in the parentheses are those during which the tax statistics are available.
2) Income tax statistics used in this paper are shaded.
1996-present
Wage income(1957-1974,1979-1985,1995-present)
Others
Dibidends
Class II income tax
(interest)
Business income and
rents
TABLE 1. EVOLUTION OF INCOME TAX SYSTEM IN KOREA, 1933-PRESENT
Global income
taxation
(2012). Due to the fact that the income account by institutional sectors was not constructed in
this study, we compute household income by subtracting imputed rents from the sum of
compensation to employees and operating surplus. Our control total for income is presented in
Table A1 in Appendix.
We estimate the top income shares by using the number of taxpayers and the amount of
income by income brackets obtained from income tax statistics. To estimate the income shares
of the top fractiles such as top 10%, 1%, 0.1%, and 0.01%, we use the same Pareto
interpolation method as Piketty and Saez (2001: 39). The Pareto distribution has a cumulative
distribution function specified as F(y)=1-(k/y)a in which k and a are constants and a is called
the Pareto coefficient. The distribution has a property that the average income of taxpayers with
income level above a threshold income, y, is proportional to y by the factor of b and b=a/(a-1).
Table 2 shows the raw data from income tax statistics in 2010 which provide the number
of taxpayers and their income by income brackets. Table 2 also presents the control totals for
population and income as well as the cumulative rates for each income bracket. In 2010, the
taxpayers earning more than 117 million won account for 0.66% of adult population and their
income takes 9.73% of total personal income. Taxpayers earning more than 96 million won
account for 1.21% of adults and their income accounts for 13.21% of total personal income.
From this, we know that the top 1% income share in 2010 is in between 9.73% and 13.21%.
By using the property of Pareto distribution as mentioned above, we can compute b and a for
each income bracket from Table 2. To compute the top 1% income share, we use the Pareto
coefficient for the income bracket with a cumulative rate of the population closest to 1%, which
is 2.16 in Table 2. Once we get the Pareto coefficient, we can compute the threshold income
for the top 1% by using the cumulative distribution function specified above. The average
income for the top 1% income earners can be computed by multiplying the threshold income by
b. The income shares for upper and lower income fractiles can be computed similarly by using
the Pareto interpolation. According to Table 2, the estimated Pareto coefficient a decreases as
TOP INCOMES IN KOREA, 1933-2010: EVIDENCE FROM INCOME TAX STATISTICS2015] 5
Pareto coefficient
33
mil.won
54
75
96
117
222
21
Sum
325
Sources: Number of taxpayers and their reported income by income brackets are obtained from the Statistical
Yearbook of National Tax in 2010. The control totals for population and income are obtained from population
statistics and National Accounts, respectively.
536
mil.won thou.persons tril.won population income b a
taxpayersreported
income
average
income
control total for
population/incomeincome branckets
cummulative rate
(%)
67.23
A B B/A C D ΣA/C ΣB/D
upper limit thou.persons tril.won
61 26 18.48 58.47 2.46 1.68
21 5,060 56 11
TABLE 2. INCOME TAX STATISTICS, CONTROL TOTAL, AND PARETO COEFFICIENTS
IN 2010
31.47
31.70 1.70 2.42
54 2,640 110 42 12.38 48.89 1.99 2.01
33
lower limit
2,373
490 41 84 2.47 19.67 1.74 2.36
75 1,222 77 63 5.60
0.66 9.73 2.05 1.95
117 212 22 105 1.21 13.21 1.86 2.16
96
1.69
325 32 8 263 0.16 5.18 2.36 1.73
222 195 29 149
1,324 0.03 2.72 2.47 1.68
536 18 7 405 0.08 3.85 2.44
12,556 429 38,946 638
13 17
the income level increases for the top income groups. It implies that the increase in the income
level is accelerated in the top income group. However, it is not the case for the income groups
lower than the top 10%. Thus, we cannot apply this method to these lower income groups.
Thus, we do not report the income shares for lower income group similar to other studies.
Table 3 presents the estimated threshold and average income levels for top income groups
in 2010. The size of the top 0.01% income group in 2010 was 3,895 and one should earn more
than 1.10 billion Korean won (US$ 995,346) in order to belong to this group.8 The average
income of the top 0.01% was 2.73 billion won. The top 5-1% denoted in the table is the top
5% income group excluding the top 1% income earners. The size of this group is 1.55 million
and its average income is 72.5 million won (US$ 62,747). Our estimates of the threshold and
average income levels for the top income groups for other years are presented in Tables A2 and
A3 in Appendix.
Because our estimates of top income shares rely on self-assessed income tax statistics
which are based on the reported income, it is possible that the estimated top income shares
based on global income tax statistics may be affected considerably by the trend in tax evasion.
It is known that business income in general is quite subject to tax evasion.9 Since we do not
have the reliable information about tax evasion, we cannot make any adjustment for this.
Instead, we compute the top wage income shares as a supplement. Compared to business
income, tax evasion may not be significant for wage income, tax for which is withheld at
source.
Therefore, top wage income shares are computed by dividing the wage income accruing to
the top wage income groups by total wage income, similarly to top income shares. Top wage
income groups are defined relative to the total number of employment. Our control total for
wage income earners is consistent with the definition of employment in official statistics which
include regular, temporary and daily workers. Because the income tax statistics exclude a large
HITOTSUBASHI JOURNAL OF ECONOMICS [June6
8 The annual average market exchange rate in 2010 (1,156 Korean won per one US dollar) was used for conversion.9 When we compare National Accounts and income tax statistics, we discovered that approximately 26% of business
income may evade tax. Other types of income such as interest, dividends, and wage, taxes on which are usually
withheld at source, may be fully detected by income tax statistics. See Kim and Kim (2013).
Full Population 38,946,431
Top 10%
16,383
Threshold income
levels (thou.Won)Income groups
Number of adults age
(person)
Average income
levels (thou.won)
Top 1%
Top 5%
Top 0.01%
Top 0.5%
Sources: Table A2, A3 in Appendix.
Notes: Top 10-5% is the top 10% excluding the top 5%. It is the same for others.
Top 0.1%
Top 0.5-0.1% 155,786 173,557
104,948 Top 1-0.5% 194,732 113,443
57,063 Top 5-1% 1,557,857 72,535
36,201 Top 10-5%
Percentile Threshold
1,947,322 46,724
1,104,380 Top 0.01% 3,895 2,730,837
283,886 Top 0.1-0.01% 35,052 467,515
135,564
TABLE 3. THRESHOLD AND AVERAGE INCOME LEVELS FOR TOP INCOME GROUPS
IN 2010
proportion of workers earning below the exemption point, we cannot use the total sum of wage
income in income tax statistics, except for that of recent years when the relevant information is
provided. Therefore, we use the amount of wage and salaries in National Accounts in order to
compute the control total for wage income. Thus, wage income in our definition includes
wages, salaries, and bonuses. It allows us to compute the top wage income shares back to 1963,
the earliest year for which the data for total employment are available. The data on the control
total for total employment and wage income are presented in Table B1 in Appendix. We also
used a Pareto interpolation method to estimate the threshold and average wage income levels,
which are presented in Tables B2 and B3 in Appendix.
III. Empirical Results
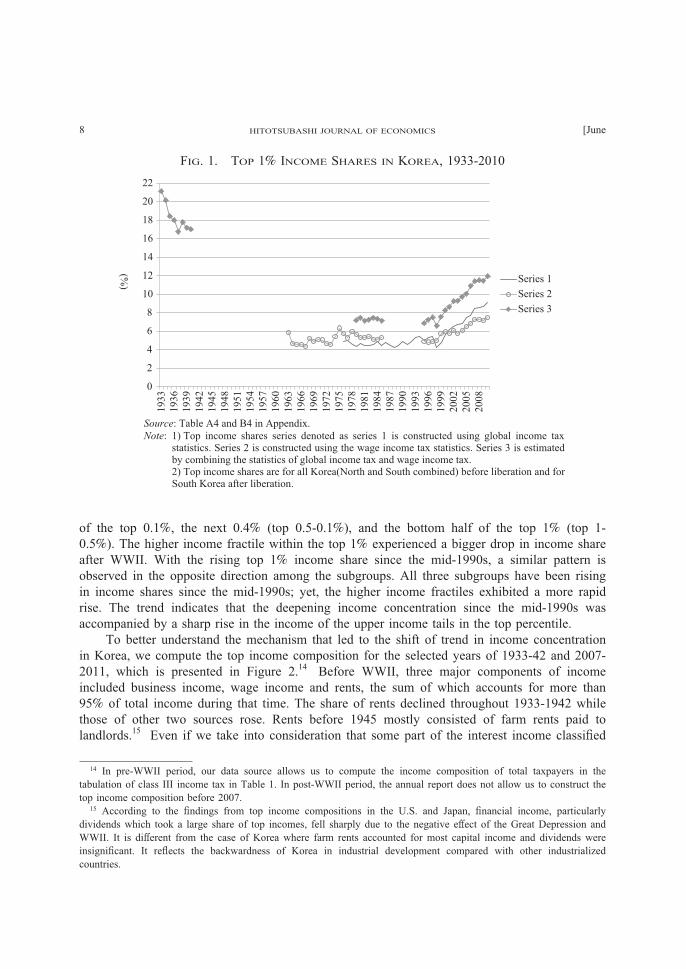
Figure 1 displays three series of the top 1% income share; series 1 based on the global
income tax statistics, series 2 based on wage income tax statistics, and finally, series 3
constructed after combining global income tax statistics and wage income tax statistics.10
Series 3 is most comprehensive in coverage among the three series and could be considered as
our final estimate of top income shares. The difference between series 3, which combines two
income tax statistics and series 1, which is based on global income tax statistics, is the income
share of the top 1% income group who earns wage income only and thus do not have to file
global income tax returns.11 Although we cannot directly compare the estimate of top wage
income shares (series 2) and other estimates of top income shares (series 1 and 3) due to
different definitions of the control total, the trend in top income shares series does not look
much different from that in top wage income shares series.12 Thus, from Figure 1, we may
conclude that income concentration in Korea was very high during the pre-WWII period,
dropped sharply after WWII, stayed stable during the period of high growth, and increased
noticeably after the mid-1990s.13
We also compute the income shares of top fractiles other than top 1%, which are presented
in Figure A1 in Appendix. The trends demonstrate that the income shares of upper income
fractiles changed more in the long run. The top 1% income shares dropped sharply after WWII,
whereas the top 5-1% income shares stayed with no significant change. In contrast, the top 1%
income shares increased more rapidly than the top 5-1% income shares since the mid-1990s. It
was also true when we decompose the top percentile into three subgroups, income shares series
TOP INCOMES IN KOREA, 1933-2010: EVIDENCE FROM INCOME TAX STATISTICS2015] 7
10 For the pre-WWⅡ period, this procedure is not needed because the global income tax covers all the wage income
above the exemption point.11 For income shares of smaller fractiles, such as the top 0.1% or 0.01%, the difference between the two estimates of
top income shares decreases and becomes insignificant. The reason is that there are few who do not file global income
tax returns among the upper income earners.12 The similarity of the two series implies that the tax evasion mentioned in section II does not affect the overall
pattern of the long-term trend of the top income shares.13 One should note that both estimates of top income shares (series 1 and 3) were not adjusted for the inconsistent
coverage of financial income over time. As explained in Appendix A.1, financial income over a certain amount began
to be taxed as global income in 1996; however, this practice was suspended for 3 years (1998-2000) after the economic
crisis. Therefore, our estimates of top income shares before 1995 and during 1998-2000 could be underestimated
because the financial income was not counted during these periods. This factor partly explains the big drop of the top
income shares in 1998.
of the top 0.1%, the next 0.4% (top 0.5-0.1%), and the bottom half of the top 1% (top 1-
0.5%). The higher income fractile within the top 1% experienced a bigger drop in income share
after WWII. With the rising top 1% income share since the mid-1990s, a similar pattern is
observed in the opposite direction among the subgroups. All three subgroups have been rising
in income shares since the mid-1990s; yet, the higher income fractiles exhibited a more rapid
rise. The trend indicates that the deepening income concentration since the mid-1990s was
accompanied by a sharp rise in the income of the upper income tails in the top percentile.
To better understand the mechanism that led to the shift of trend in income concentration
in Korea, we compute the top income composition for the selected years of 1933-42 and 2007-
2011, which is presented in Figure 2.14 Before WWII, three major components of income
included business income, wage income and rents, the sum of which accounts for more than
95% of total income during that time. The share of rents declined throughout 1933-1942 while
those of other two sources rose. Rents before 1945 mostly consisted of farm rents paid to
landlords.15 Even if we take into consideration that some part of the interest income classified
HITOTSUBASHI JOURNAL OF ECONOMICS [June8
14 In pre-WWII period, our data source allows us to compute the income composition of total taxpayers in the
tabulation of class III income tax in Table 1. In post-WWII period, the annual report does not allow us to construct the
top income composition before 2007.15 According to the findings from top income compositions in the U.S. and Japan, financial income, particularly
dividends which took a large share of top incomes, fell sharply due to the negative effect of the Great Depression and
WWII. It is different from the case of Korea where farm rents accounted for most capital income and dividends were
insignificant. It reflects the backwardness of Korea in industrial development compared with other industrialized
countries.
FIG. 1. TOP 1% INCOME SHARES IN KOREA, 1933-2010
Source: Table A4 and B4 in Appendix.Note:
0
2
4
6
8
10
12
14
16
18
20
22
1933
1936
1939
1942
1945
1948
1951
1954
1957
1960
1963
1966
1969
1972
1975
1978
1981
1984
1987
1990
1993
1996
1999
2002
2005
2008
Series 1Series 2Series 3
(%)
1) Top income shares series denoted as series 1 is constructed using global income tax statistics. Series 2 is constructed using the wage income tax statistics. Series 3 is estimated by combining the statistics of global income tax and wage income tax. 2) Top income shares are for all Korea(North and South combined) before liberation and for South Korea after liberation.
as class II income tax was not counted, the share of financial income was insignificant
compared to the three types of income. According to the recent top income composition in
2007-2010, the share of wage income was the largest, although it decreased over time. The
share of business income has increased fast instead. Comparing the income compositions of top
income groups in 2007-2010 and the pre-WWII period, we find that the share of farm rents
which was large in the pre-WWII period became nil in 2010 and those of wage income and
financial income went up instead.
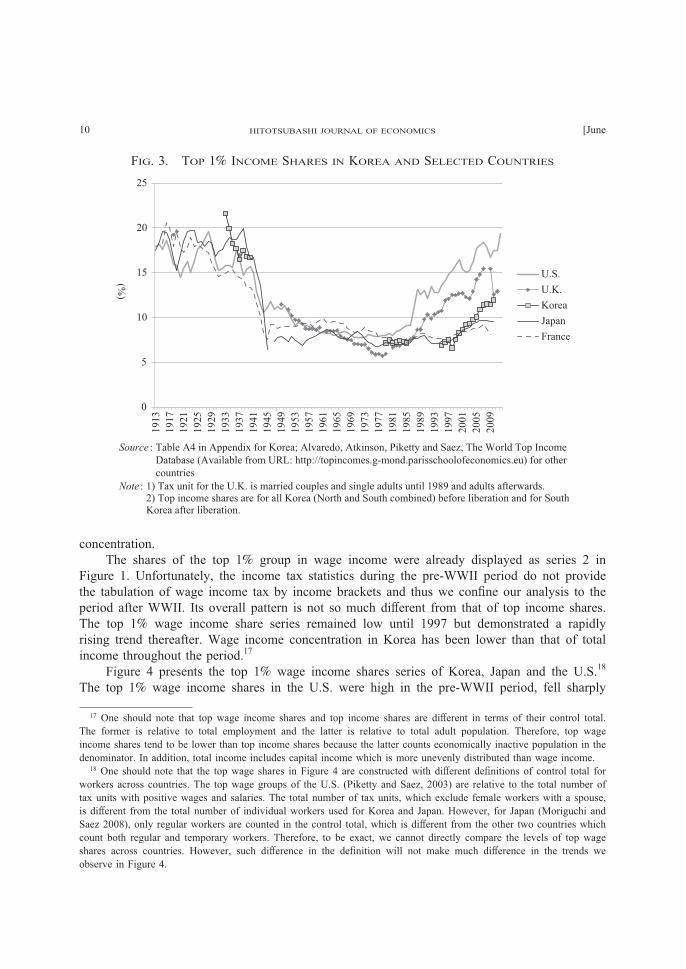
Figure 3 displays the top 1% income share series in Korea and other countries in order to
provide a comparative perspective. Korea is not so much different from other countries in the
overall pattern of the trend by showing a U-shaped pattern of income concentration. The top
1% income shares in Korea were as high as those in other countries during the pre-WWII
period. Notwithstanding the missing years, we may guess that Koreaʼs top income shares fell
sharply as those of other countries after WWII and remained low until the mid-1990s.16
In the
mid-1990s when top income shares in Korea began to rise, the level of top income shares in
Korea was similar to those in Japan and France and were much lower than the levels of the
U.S. and the U.K. However, top income shares in Korea since the mid-1990s has ascended
much faster than those in Japan and France. In terms of slope, a rising trend in Korea is similar
to those in the U.S and the U.K. As a result, the top income share in Korea in 2010 was
located in between those of two country groups which show diverging patterns in income
TOP INCOMES IN KOREA, 1933-2010: EVIDENCE FROM INCOME TAX STATISTICS2015] 9
16 Our guess is based on the trend of top wage income shares in Figure 1.
FIG 2. TOP INCOME COMPOSITION IN KOREA
Source: Table A5 in Appendix.Notes: (1) The income composition for 1933-1942 is computed for total taxpayers in the tabulation of class
III income tax statistics, which account for various groups from the top 1.4% in 1933 to the top4.8% in 1942. For 2007-2010, the top income composition is for the top 1% income earners. (2) For1933-1942, a portion of interest is excluded. (3) For 2007-2011, taxpayers whose financial incomeincluding interest and dividends is less than 40 million won are excluded. (4) Top incomecompositions are for all Korea (North and South combined) before liberation and for South Koreaafter liberation.
The shares of the top 1% group in wage income were already displayed as series 2 in
Figure 1. Unfortunately, the income tax statistics during the pre-WWII period do not provide
the tabulation of wage income tax by income brackets and thus we confine our analysis to the
period after WWII. Its overall pattern is not so much different from that of top income shares.
The top 1% wage income share series remained low until 1997 but demonstrated a rapidly
rising trend thereafter. Wage income concentration in Korea has been lower than that of total
income throughout the period.17
Figure 4 presents the top 1% wage income shares series of Korea, Japan and the U.S.18
The top 1% wage income shares in the U.S. were high in the pre-WWII period, fell sharply
HITOTSUBASHI JOURNAL OF ECONOMICS [June10
17 One should note that top wage income shares and top income shares are different in terms of their control total.
The former is relative to total employment and the latter is relative to total adult population. Therefore, top wage
income shares tend to be lower than top income shares because the latter counts economically inactive population in the
denominator. In addition, total income includes capital income which is more unevenly distributed than wage income.18 One should note that the top wage shares in Figure 4 are constructed with different definitions of control total for
workers across countries. The top wage groups of the U.S. (Piketty and Saez, 2003) are relative to the total number of
tax units with positive wages and salaries. The total number of tax units, which exclude female workers with a spouse,
is different from the total number of individual workers used for Korea and Japan. However, for Japan (Moriguchi and
Saez 2008), only regular workers are counted in the control total, which is different from the other two countries which
count both regular and temporary workers. Therefore, to be exact, we cannot directly compare the levels of top wage
shares across countries. However, such difference in the definition will not make much difference in the trends we
observe in Figure 4.
FIG. 3. TOP 1% INCOME SHARES IN KOREA AND SELECTED COUNTRIES
Source : Table A4 in Appendix for Korea; Alvaredo, Atkinson, Piketty and Saez, The World Top IncomeDatabase (Available from URL: http://topincomes.g-mond.parisschoolofeconomics.eu) for othercountries
Note : 1) Tax unit for the U.K. is married couples and single adults until 1989 and adults afterwards. 2) Top income shares are for all Korea (North and South combined) before liberation and for SouthKorea after liberation.
0
5
10
15
20
25
1913
1917
1921
1925
1929
1933
1937
1941
1945
1949
1953
1957
1961
1965
1969
1973
1977
1981
1985
1989
1993
1997
2001
2005
2009
U.S.U.K.KoreaJapanFrance
(%)
during the war, and steadily declined until it began to ascend rapidly in the 1970s. As a result,
the top wage share in the U.S ascended to a higher level than that of the pre-WWII period. The
high wage income concentration in Japan also declined sharply several years ahead of the U.S.
from 1935 to 1944, rose substantially from 1951 to 1961, then again declined gradually, and
remained low relatively to that of the U.S.19As a result, wage income concentration in the
U.S. became much higher than that in Japan in recent years. In terms of top wage income
shares, Korea followed Japan with a time lag until the mid-1990s. Although the top wage
income shares in the U.S. began to rise in the 1970s, those in Korea and Japan remained low.
In terms of the level of wage income concentration, Korea was similar to Japan until the mid-
1990s. Although we cannot observe the current trend in Japan in Figure 4, Korea appears to be
diverging from Japan in the past 15 years in terms of top wage income shares.
Figure 5 displays the average wage income (in 2010 constant price) of the top decile and
the remaining bottom 90%. The top decile is decomposed into the top 0.1%, the top 0.1-1%,
and the top 1-10%. First of all, we find the growth rate of the average wage income subsided
after the economic crisis in 1997. However, average wage income series of top income groups
do not show a distinguishable stagnation of growth unlike that of the bottom 90%. Until 1985,
the average wage incomes of all income groups, including the bottom 90%, increased at similar
rates. In contrast, the average wage incomes diverged after 1997 between the top 10% and the
bottom 90%. In particular, the growth rate of the average wage income of the top 0.1% is
distinguished from those of other income groups.
TOP INCOMES IN KOREA, 1933-2010: EVIDENCE FROM INCOME TAX STATISTICS2015] 11
19 Moriguchi and Saez (2008) interpret the rise and fall of the top wage income shares in Japan around the 1960s as
the phenomenon caused by the transition of Japan from the a labor-surplus to a labor-shortage economy with rapid
industrialization.
FIG. 4. TOP 1% WAGE INCOME SHARES OF KOREA, JAPAN AND THE U.S.
Sources: Table B4 in Appendix for Korea; Moriguchi and Saez (2008) for Japan; Piketty and Saez (2003) and updated estimates (Available from URL: http://elsa.berkeley.edu/~saez) for the U.S.
2
4
6
8
10
12
14
1927
1930
1933
1936
1939
1942
1945
1948
1951
1954
1957
1960
1963
1966
1969
1972
1975
1978
1981
1984
1987
1990
1993
1996
1999
2002
2005
2008
2011
U.S.KoreaJapan
(%)
IV. Understanding the Evolution of Income Concentration in Korea
We have found that (i) income concentration in Korea was as high as those in other
countries in the pre-WWII period during 1933-40, (ii) it fell sharply after WWII and remained
low until the mid-1990s, (iii) income concentration has increased in the last 15 years, and (iv)
as a result, in terms of top income shares, Korea is now higher than Japan and France although
it is lower than the U.K and the U.S. Let us briefly discuss the factors which may have
influenced the trends in top income shares in Korea.
First, how can we explain the sharp fall of the top income shares after WWII? High
income concentration in the pre-WWII period reflects the characteristics of the Korean
economy during the colonial period. The Japanese colonizers in Korea played a dominant role
with their comparative advantage in capital and technology. The Japanese in Korea contributed
approximately 90% of starting capital to corporations in Korea and thus most executive officers
in large corporations were Japanese.20
The Japanese in Korea who accounted for 2.9% of the
population in Korea (in 1940) also owned a sizeable area of land as large as 9.5% of cultivated
land in Korea (in 1942).21
It implies that many Japanese landlords in Korea were big
landowners. Although we cannot provide statistical evidence from income tax statistics that do
not distinguish the ethnicity of taxpayers, there is no doubt that the Japanese accounted for a
large share of top income groups at that time.
After liberation, these Japanese colonizers withdrew from Korea and left their assets which
were vested in the U.S. army military government in Korea. The military government in 1945-
HITOTSUBASHI JOURNAL OF ECONOMICS [June12
20 According to Joo (1991), the Japanese in Korea contributed 84-88% of starting capital during 1926-39.21 The data for the population and landownership of Japanese in Korea are obtained from the population census and
Huh (2005), respectively.
FIG. 5. AVERAGE WAGE INCOME BY INCOME GROUPS IN KOREA
Source: Authors’ calculation from Tables B1 and B4 in Appendix.
1
10
100
1,00019
6319
6519
6719
6919
7119
7319
7519
7719
7919
8119
8319
8519
8719
8919
9119
9319
9519
9719
9920
0120
0320
0520
0720
09
top 0.1%top 1-0.1%top 10-1%totalbottom 90%
Mill
ion
won
at c
onst
ant 2
010
Pric
es in
log
scal
e
1948 transferred these assets to the Korean government. The Korean government nationalized
the big enterprises in key industries such as electricity and distributed other assets to the private
sector during the 1950s. Although we donʼt have evidence on the change in ownership
distribution before and after liberation, the ownership distribution does not seem more
concentrated after liberation. Regardless of asset concentration, the income earned from these
assets decreased much after liberation, which could have affected the income concentration in
Korea. The withdrawal of Japanese entrepreneurs as well as the severing of the Korean
economy from the Japanese economic bloc made a disruptive impact on the Korean economy.
The division of country into two nations and ensuing political chaos engendered economic
disorganization in South Korea. In addition, vested properties were not well managed by the
officially designated managers until they were transferred to Korean entrepreneurs. Therefore, it
is not plausible that those who would replace the Japanese in top income groups after 1945
earned as much as the Japanese.
Income inequality among Koreans at that time may be mostly attributable to inequality in
landownership. During the colonial period, landownership was concentrated in the hands of a
small number of landlords and thus most farmers were small sharecropping tenants in Korea.22
This landownership was de-concentrated by land reform. According to the Land Reform Act in
1949, the holdings of Korean landlords owning more than 3 chongbo (7.5 acres) were not
allowed and the excess holdings were redistributed to the tenants. Although the landlords
received securities for the land transfer, the real value of securities sharply dwindled with high
inflation. Consequently, the landlords who accounted for a large proportion of the top income
group lost their vital source of income after the land reform. De-concentration took place in the
late 1940s even before the land reform because landlords expecting the land reform sold their
land widely.
Second, why did income concentration stay relatively low throughout 30 years of rapid
growth until the mid-1990s? Low income concentration during this period may be due to a
rapid decrease of labor surplus in the Korean economy with a drastic expansion of modern
industries. During the period of high growth, the non-agricultural sector expanded employment
at rates as high as 4-8% per annum as Korea pursued industrialization by promoting labor-
intensive export industries. It induced the labor movement from agriculture to other industries
such as manufacturing. The decrease of farm household population by 4-5% per annum led to
the end of a labor surplus and the ensuing wage increase in the rural areas.
During the initial period of industrialization, the impact of expansion of the non-
agricultural sectors is too small to have a considerable effect on farm household income.
Therefore, we often observe a polarizing pattern of income growth between the traditional
sector and the modern sector during industrialization. Farm household population continued to
increase until the mid-1960s after an initial spurt of economic growth because the high
population growth overwhelmed the labor drain from the rural areas. Until the mid-1970s,
Koreaʼs rural areas were overpopulated with surplus of farmers. The overpopulation in the rural
areas continued until high growth began to reduce the rural population. As rapid growth in
Korea actively created jobs in non-agricultural sectors and induced the labor movement out of
TOP INCOMES IN KOREA, 1933-2010: EVIDENCE FROM INCOME TAX STATISTICS2015] 13
22 According to the Statistical Yearbook of the Government of Colonial Korea, land under tenant farming accounted
for 57.9% of total cultivated land in 1940 (67.6% in case of paddy field) and tenant farmers accounted for 76.4% of
farm households.
agriculture, the overall earnings of workers increased in all sectors of the economy.23
In this
respect, the benefits of economic growth during this period trickled down to the bottom income
groups. Thus, Korea could maintain low income concentration even though it experienced a
drastic structural change.
Third, why did income concentration rise since the mid-1990s? It may be the result from
composite factors including the change in industrial and demographic structures and
institutional changes in the tax system and corporate governance. First of all, job creation
became stagnant after the mid-1990s, which weakened the trickle-down effect which we
observed previously during the period of high growth. The growth rate of non-agricultural
employment fell to approximately 2% in the 2000s from 5% in the early 1990s. It corresponds
with the subsiding GDP growth rate as Korea enters a mature stage of development. In addition
to the stagnant economic growth, the employment inducement effect of economic growth has
been weakened since the 1990s as the industrial structure in Korea shifted toward technology-
intensive industries from labor-intensive ones. This trend accelerated as Korea deepened its
economic relationship with China after establishing diplomatic relations in 1992. In addition,
Korean companies relocated their labor-intensive industries and production processes to sites in
low-wage countries, which further reduced the demand for unskilled workers in Korea. It
resulted in the reduction of manufacturing employment because the job creation in high-
technology industries cannot compensate for the job destruction in low-skill labor-intensive
industries. Koreaʼs manufacturing sector, which actively absorbed the labor during the period of
rapid growth, began to release its labor. Thus, polarizing demands for workers with differentskill levels placed an end to the trickle-down effect of economic growth which had a favorable
effect in income inequality until the mid-1990s.
This explanation which is based on the structural change in Korea may well account for
the deterioration of income inequality in Korea, but may not fully explain the increase of top
incomes. One of the plausible factors which might have contributed to this rising top incomes
is the reduction of marginal tax rates (MTRs). The highest statutory MTR, which was as high
as 70% in the 1970s, steadily declined to half of the peak level as presented in Table B5 in
Appendix. Korea was no exception to the neoliberalism trend of public policy which many
developed countries adopted in the early 1980. We estimate the MTR for the average taxpayer
in the top 0.1% wage income group in order to see a true burden of tax for additional income.24
As we can observe in Figure 6, it is lower than the top MTR because some individuals in the
group do not pay tax at the top MTR. It was high in the late 1970s at 54% when the top MTR
was 70%. It continued to fall and finally decreased to 35% in recent years.
Piketty, Saez, and Stantcheva (2011) suggested three channels in which the change in
MTR could affect the top income shares. First, the tax cut may have a supply-side effect byincentivizing the economic activities of the top income groups. Second, it may reduce tax
evasion or increase reported income for tax returns by a pass-through of income from other
types of income (for instance, corporate income) to personal income. Third, CEOs may
HITOTSUBASHI JOURNAL OF ECONOMICS [June14
23 According to Figure 5, the average wage income of all income groups including both the top and the bottom
increased at similar rates during the period of high growth in Korea.24 To obtain the MTR of the average taxpayer in the top 0.1% group, we take the weighted average of the average
taxpayers of the top 0.01% and the top 0.1-0.01%. See Appendix B4 for the estimation of MTR for the average
taxpayer in the top wage income group.
intensify rent-seeking behaviors to influence their pay setting. Piketty, Saez, and Stantcheva
(2011) found that the third channel was most important in the U.S.
How could the declining MTRs affect top income shares in Korea? The figure 6 does not
show a close long-term relationship between MTRs and top income shares as the case of the
U.S. in Saez (2004). However, there is a negative relationship between MTRs and top income
shares in Korea after the mid-1990s. In addition, the capital income increased much faster than
wage income among top income earners during the same period.25
It implies that lowered
MTRs may increase the saving capacity of top income groups which may help wealth
accumulation and thus result in income increase.
Another factor which contributed to the rising top incomes may be the adoption of Anglo-
Saxon corporate governance system in Korea after the 1997 economic crisis. Moriguchi and
Saez (2008) point out Japanʼs highly developed internal labor markets as one of the important
factors for the diverging trends between the U.S. and Japan. In Japan, the absence of
competitive markets for corporate executives might have prevented the rise of wage inequality.
According to Piketty and Saez (2003: Figure 11), the average compensation of the top 100
CEOs on the Forbes list has increased much faster than the average wage since the early 1970s.
This contrasting divergence of compensation between top managers and average workers did
not happen in Japan whose corporate culture emphasizes firm-specific human capital under the
TOP INCOMES IN KOREA, 1933-2010: EVIDENCE FROM INCOME TAX STATISTICS2015] 15
25 Although the top 0.1% wage income share rose in Korea, other types of income including capital income increased
much faster than wage income for the group. It is shown by widening gap between top income and top wage income
shares in Figure 6. Thus, the positive effect of tax cuts on asset accumulation may have been substantial in Korea. It
may not be true of the U.S. where wage income drove the rising income concentration.
FIG. 6. TOP 0.1% WAGE INCOME SHARES AND MARGINAL TAX RATE IN KOREA
Source: Table B5 in Appendix for Top MTR; the MTRs for average Top 0.1% (Top 0.1% MTR) based on theauthors’ calculation.
0.5
1.0
1.5
2.0
2.5
3.0
3.5
4.0
4.5
0
10
20
30
40
50
60
70
80
1963
1965
1967
1969
1971
1973
1975
1977
1979
1981
1983
1985
1987
1989
1991
1993
1995
1997
1999
2001
2003
2005
2007
2009
Top 0.1% Income Share Top 0.1% Wage Share
Mar
gina
l Tax
Rat
e (%
)
Top
inco
me
shar
es (%
)
Top MTR Top 0.1% MTR
internal promotion system.
Due to the fact that micro-data on top wage groups such as CEO compensation are not
available in Korea, we instead investigate the average wage income of the top tails.26
We
discovered in Figure 5 that the growth rate of the top 0.1% average wage income was
distinguished from those of other income groups. While the top 1% wage income share
increased from 4.89% in 1995 to 7.45% in 2010, the top 0.1% wage income share increased
faster from 1.27% to 2.16% during the same period.27
It implies that the average wage of the
top 0.1% wage earners in 2010 was 21.6 times greater than the average wage of all wage
earners whereas it was just 12.7 times greater in 1995. In 1995, the wage level of top 0.1%
wage earners relative to the average wage in Korea was similar to that of Japan (about 10 times
of the average wage). However, it increased to more than 20 times of the average wage, higher
than that of Japan, although it was much lower than that of the U.S. (about 40 times in 2010).
Although we cannot specify who belong to the top 0.1%, 16,971 taxpayers in 2010, we
speculate that most executive officers of large corporations would belong to this group. After
the economic crisis in 1997, many large corporations in Korea reformed their corporate
structure and adopted selected elements of the Anglo-Saxon corporate governance system
(Chung 2008: 156-189). Compared with the pre-crisis period, equity financing became a major
method of raising capital for large corporations. Thus, the voice of shareholders became more
influential. Large shareholders asked for further reform in order to align the management to
investorsʼ interests. The increasing share of foreign shareholders accelerated the transition
toward Anglo-Saxon style shareholder capitalism in Korea. It increased the competitive
pressures to the top management in Korea. In addition, large corporations that survived the
economic crisis increased their scale and scope in business, which increased the demand for
able professional managers. Without mature manager markets in Korea, large corporations,
particularly Chaebols having many affiliated companies, activated the internal labor markets for
corporate officers, delegated management to professional officers, and controlled them through
monitoring and performance-based rewards. Many CEOs in large corporations received
exceptional pay-raises along with stock options. That is, Chaebols developed highly competitive
internal labor markets for managers of affiliated companies under the umbrella of family
owners. In this respect, Korea appears to be located in between the U.S. and Japan in terms of
the scope of manager markets and incentive systems. This type of performance-based incentive
system for the top management was disseminated to the lower levels of management (Chung
2008: 248-259).
V. Conclusion
In this paper, we constructed the long-term series of top income shares in Korea from
1933 to 2010. From this, we have obtained the following main findings on the evolution of
income concentration in Korea.
HITOTSUBASHI JOURNAL OF ECONOMICS [June16
26 We may obtain information on the compensation of executive officers from the report disclosed by corporations
(http://dart.fss.or.kr) since 1999. However, the information is not so reliable enough to construct a consistent series of
compensation of the top managers.27 The estimates of top wage income shares are presented in Table B4 in Appendix.
First, income concentration was very high prior to WWII when Korea was under a
colonial rule and dropped drastically after WWII. This pattern is not so much different fromwhat previous studies found for other industrialized countries such as Japan and the U.S.
However, the cause for the change could be different. Unlike other countries where the falling
capital income of top income groups played an important role, Koreaʼs case is due to the
collapse of the colonial system. After liberation, Japanese colonizers who accounted for a large
share of the top income groups in Korea withdrew by leaving their businesses in Korea. The
land reform after liberation reduced the rental income of the Korean top income groups who
earned most of their income from land lease and personal business. Thus, the collapse of the
top income share after liberation is attributable to the political chaos from regime change.
Second, top income shares series in Korea remained low throughout the period of rapid
industrialization until it began to ascend in the mid-1990s. Income inequality in Korea has
deteriorated with the rapidly rising top income shares after the economic crisis. Korea was able
to maintain a low level of income concentration during the period of rapid growth because the
economic growth accompanied active job creations and the steady increase of wage income.
This trickle-down effect was weakened as Korea entered a mature stage of economic
development. With globalization and deepening economic relationships with low-wage countries
such as China, major companies in Korea accelerated the shift of their major business towards
technology-intensive sectors by moving labor-intensive industries and production processes to
other countries with abundant labor. This structural change reduced the demand for low-skilled
workers while it increased the demand for high-skilled professionals. Consequently, the average
wage income of the bottom income groups stayed stagnant in real terms for the last 15 years.
Although the diverging demand for different types of workers in the labor market may explain
the worsening income distribution in the overall economy, it is not enough to explain why top
incomes increased so rapidly last 15 years.
Thus, third, we pay attention to two institutional factors for the rise of top incomes, the
marginal tax rate (MTR) and the corporate governance structure. Falling MTRs since the 1980s
helped the top income groups to accumulate capital and increase their capital income. In
comparison with other countries, Korea belongs to the country group with big drop in MTRs
and rapid increase in top income shares. In addition, the changes in the corporate governance
structure after the economic crisis contributed to the big pay-raises of the top management in
large corporations. After the economic crisis, large corporations in Korea relied on direct capital
market instead of indirect finance and adopted some elements of the Anglo-Saxon style
corporate system. Without mature outside CEO markets, large corporations, particularly
Chaebols with many affiliated companies, activated internal labor markets for corporate officers
and intensified competition among the top managers of affiliated companies through
performance-based rewards. In this respect, Korea appears to be in between the U.S. and Japan
in the scope of the CEO market and incentive system.
In this paper, we have studied the long-run evolution of top income shares in Korea by
utilizing the income tax statistics instead of the household survey which suffers from the
problem of under-reporting of top incomes. However, top income shares cannot provide
detailed information on the situation of the bottom 90 % income groups. Thus, we may need to
combine the income tax statistics and the household survey in order to achieve a deeper
understanding of income distribution in Korea, which could be our next research topic.
TOP INCOMES IN KOREA, 1933-2010: EVIDENCE FROM INCOME TAX STATISTICS2015] 17
REFERENCES
Alvaredo, F., A.B. Atkinson, T. Piketty and E. Saez, The World Top Incomes Database
(Available from URL: http://topincomes.g-mond.parisschoolofeconomics.eu)
Atkinson, A.B. (2005), “Top Incomes in the UK over the 20th Century,” Journal of the Royal
Statistical Society 168, pp.325-43.
Bank of Korea, ECOS (Available from URL: http://ecos.bok.or.kr)
Chung, K. (2008), Hanguk Kyungyung Ysip nyun [Corporate Management in Korea Last 20
Years], SERI. (in Korean)
Chōsen Sōtokufu (Japanese Government General of Korea), Chōsen sōtokufu tōkei nenpō
[Statistical Yearbook of the Government of Colonial Korea], Seoul, various years. (in
Japanese)
Chōsen Sōtokufu (Japanese Government General of Korea), Chōsen Zeimu Tōkeisho [Statistical
Tables of Public Revenue of Colonial Korea], Seoul, various years. (in Japanese)
Huh, S.Y. (2005), Kaebal Upnun Kaebal [Development without Development], Eunhaengnamu
(in Korean).
Joo, I. (1991), “Iljeha Josunin Hoesa Jabon ui Donghyang [Trends in Korean Corporate Capital
under Japanese Rule]”, Kyungje Sahak [Review of Economic History] 15, pp.31-66. (in
Korean)
Kim, N.N. ed. (2012), Hanguk ui Janggi Tonggye: Kungmin Kyejung [National Accounts of
Korea, 1911-2010], Seoul National University Press, Seoul.
Kim, N.N. and J. Kim(2013), “Sodok Jipyo Ui Jae Gumto [Reexamining Income distribution
indices of Korea],” Journal of Korean Economic Analysis 19, pp.1-57. (in Korean)
Korea Tax Administration, Kuksae Tonggae Yeonbo [Statistical Yearbook of National Tax],
various years. (in Korean)
Korea Ministry of Government Legislation, website (Available from URL: http://www.law.go.
kr/main.html)
Korea Statistical Office, Gagae Dongjhyang Josa [Household Income and Expenditure Survey],
various years. (in Korean)
Korea Statistical Office, Gyungjae Hwaldong Ingu Josa [Annual Report on Economically Active
Population Survey], various years.
Korea Statistical Office, KOSIS (Available from URL: http://kosis.kr/)
Moriguchi, C. and E. Saez (2008), “The Evolution of Income Concentration in Japan, 1886-
2005: Evidence from Income Tax Statistics,” The Review of Economics and Statistics 90,