23
T opsil Semiconductor Materials A/S Materials A/S Financial result Q2 2010 Nordea Markets 27 August 2010

Topsil Semiconductor Materials A/SMaterials A/SFinancial resultQ2 2010Q
Nordea Markets27 August 2010

100AGENDAAGENDA
Highlights and financial performance in Q2 20103 Highlights and financial performance in Q2 2010
The Greenfield Project
Expectations for 2010
3
8
12 Expectations for 2010
Appendix: Back up slides
12
15
KELD LINDEGAARD ANDERSEN (CEO)+45 2170 8772, [email protected]
JENS CHRISTIAN NIELSEN (CFO)+45 2010 2320, [email protected]
10-08-26COMPANY PRESENTATION Page 2

100HIGHLIGHTS FROM Q2 2010HIGHLIGHTS FROM Q2 2010
• Positive market development continues• FZ remains strong with high demand for NTD products• CZ markets has rebounded further
• Consolidated revenue in Q2 up by 21.7% (YoY) - earnings in line with expectations
• Growth in both FZ and CZ businesses
• Share offering with DKK 86m in proceeds successfully closed
• New bank arrangement• Committed facility for a 3-year period
• Full year guidance maintained
10-08-26COMPANY PRESENTATION Page 3
100
INCREASED GROWTH IN BOTH FZ AND CZ IN Q2INCREASED GROWTH IN BOTH FZ AND CZ IN Q2
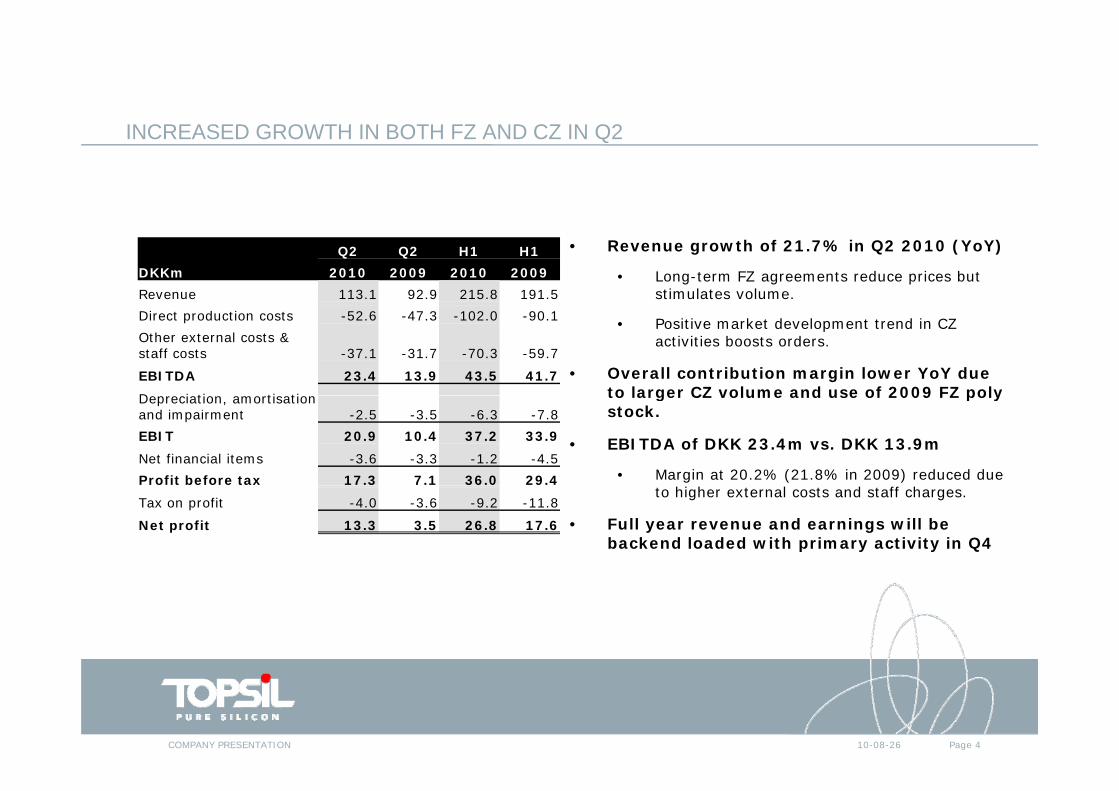
• Revenue growth of 21.7% in Q2 2010 (YoY)
• Long-term FZ agreements reduce prices but stimulates volume.
DKKmQ2 Q2 H1 H1
2010 2009 2010 2009Revenue 113.1 92.9 215.8 191.5
• Positive market development trend in CZ activities boosts orders.
• Overall contribution margin lower YoY due to larger CZ volume and use of 2009 FZ poly
Direct production costs -52.6 -47.3 -102.0 -90.1Other external costs & staff costs -37.1 -31.7 -70.3 -59.7
EBITDA 23.4 13.9 43.5 41.7D i ti ti ti to larger CZ volume and use of 2009 FZ poly
stock.
• EBITDA of DKK 23.4m vs. DKK 13.9m
• Margin at 20.2% (21.8% in 2009) reduced due
Depreciation, amortisation and impairment -2.5 -3.5 -6.3 -7.8EBIT 20.9 10.4 37.2 33.9Net financial items -3.6 -3.3 -1.2 -4.5Profit before tax 17.3 7.1 36.0 29.4
to higher external costs and staff charges.
• Full year revenue and earnings will be backend loaded with primary activity in Q4
Tax on profit -4.0 -3.6 -9.2 -11.8
Net profit 13.3 3.5 26.8 17.6
10-08-26COMPANY PRESENTATION Page 4

100
NWC UP DUE TO HIGHER TRADE RECEIVABLESNWC UP DUE TO HIGHER TRADE RECEIVABLES
• Assets held for sale reduced due to di id d ( 3 )
DKKmH1 H1 FY
2010 2009 2009dividend payment (PLN 31m)
• Financial assets up from higher prepayments
• NWC back at December 2009 level as
Intangible assets 32.8 44.8 31.5Property, plant and equipment 106.9 150.1 94.1
Financial assets 105.6 61.9 80.1Non-current assets 245.3 256.8 205.7I t i 113 6 125 5 108 0 • NWC back at December 2009 level as
activities increase
• Inventories at same level as per Q1 2010.
Inventories 113.6 125.5 108.0Receivables 106.9 79.8 118.9Cash and cash equivalents 134.9 85.4 11.8Assets held for sale 92.6 0.0 147.4
Current assets 448.0 290.7 386.1ASSETS 693 3 547 5 591 8 • Minority interests down due to
dividend paid from Cemat70
• Net interest bearing debt eliminated with proceeds from share offerings
ASSETS 693.3 547.5 591.8
Equity, Topsil 356.8 189.3 236.0-minority interests 38.3 64.5 64.6Non-current liabilities 132.1 143.1 120.9C t li biliti 151 9 150 6 157 3Current liabilities 151.9 150.6 157.3Liabilities relating to assets held for sale 14.2 0.0 12.9
Total liabilites 298.2 293.7 291.2EQUITY AND LIABILITIES 693.3 547.5 591.8
Capital invested 326.8 230.2 330.8Net working capital 132.2 54.7 132.2Investment in PPP 18.9 14.4 22.2Net interest-bearing debt (66.0) 26.1 30.7
10-08-26COMPANY PRESENTATION Page 5

100
CONTINUEOSLY POSITIVE CASH FLOWS DUE TO HIGHER EBITCONTINUEOSLY POSITIVE CASH FLOWS DUE TO HIGHER EBIT
DKKmQ2 Q2 H1 H1
2010 2009 2010 2009
• CFFO impacted by change in NWC
• Increase in trade receivables due to hi h ti it i l t t f Q2
DKKm 2010 2009 2010 2009EBIT 20.9 10.4 37.2 33.9Adjustments 3.4 3.3 8.8 8.0Change in net working capital -21.7 -9.8 -5.6 2.5
higher activity in last part of Q2
• Fixed assets investments up due to more equipment Greenfield activities
Cash flows from operating activities 2.6 3.9 40.4 44.4Income tax paid 0.0 0.2 -1.5 -0.3
Financial income received 0 5 0 9 1 5 2 2 more equipment. Greenfield activities to accelerate in 2nd half of 2010
• Free cash flows of DKK 81.6m
Financial income received 0.5 0.9 1.5 2.2
Financial income paid -4.1 -4.2 -2.7 -6.7Cash flows from operations -1.0 0.8 37.7 39.6
• CFFF impacted by payment to minority interest.
Cash flows from investing activities -15.3 -5.0 -22.0 -15.4
Cash flows from financing activities 67.1 4.0 65.9 -2.9Cash flows 50.8 -0.2 81.6 21.3
10-08-26COMPANY PRESENTATION Page 6

100NEW BANK AGREEMENT TO SUPPORT IMPLEMENTATION OF GROWTH STRATEGYNEW BANK AGREEMENT TO SUPPORT IMPLEMENTATION OF GROWTH STRATEGY
• Topsil enters into an agreement with a new bank – Jyske Bank
• Access to committed loan facilities with much greater flexibility and better terms than the existing bank facilities.
• Facilities consist of both operating and investment facilities and will support the p g ppexecution of the strategy plan “Seizing the Opportunity”
• 45.0m DKK overdraft facility/80.0m DKK investment facility
• 3-year committed facilities• 3 year committed facilities
• Release of cash collateral for guarantees issued to supplier/customer
• Headroom in covenants in order to support the strategic plan
10-08-26COMPANY PRESENTATION Page 7
100AGENDAAGENDA
Highlights and financial performance in Q1 20103 Highlights and financial performance in Q1 2010
The Greenfield Project
Expectations for 2010
3
8
12 Expectations for 2010
Appendix: Back up slides
12
15
10-08-26COMPANY PRESENTATION Page 8
100SUBSTANTIAL INVESTMENTS IN GREENFIELD PROJECT AND EXPANDED PRODUCTION CAPACITY FROM 2010PRODUCTION CAPACITY FROM 2010
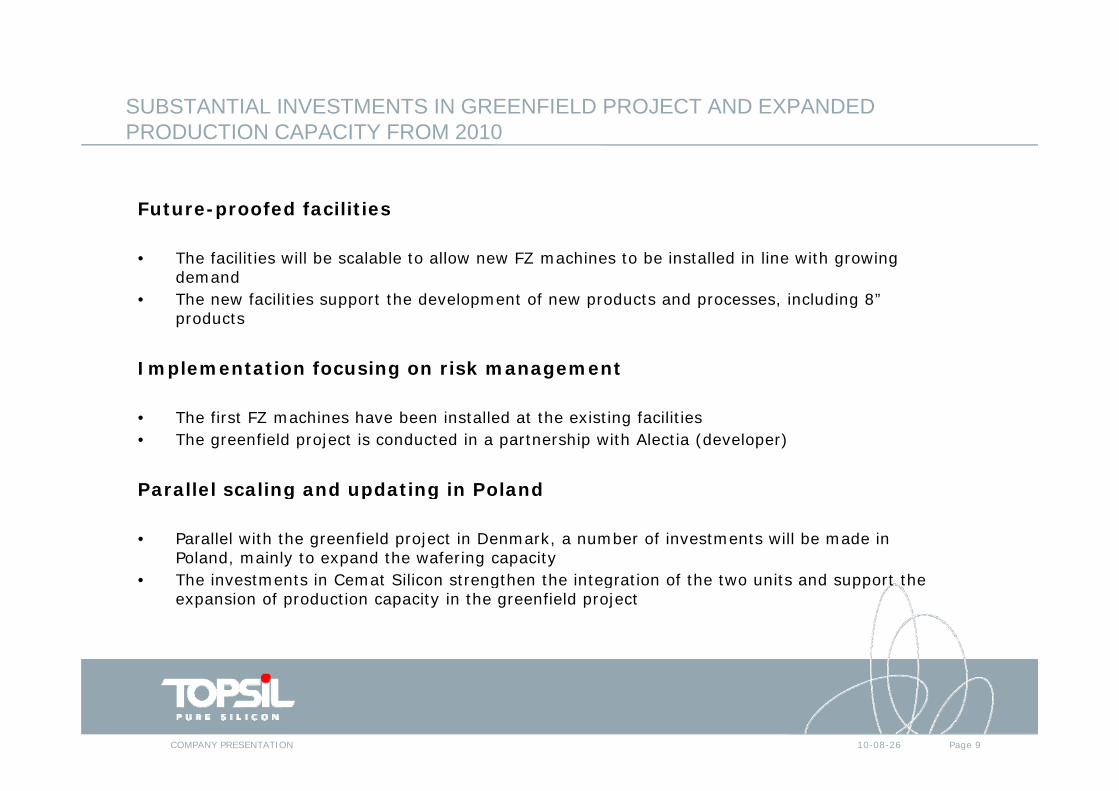
Future-proofed facilitiesp
• The facilities will be scalable to allow new FZ machines to be installed in line with growing demand
• The new facilities support the development of new products and processes, including 8” pp p p p , gproducts
Implementation focusing on risk management
• The first FZ machines have been installed at the existing facilities• The greenfield project is conducted in a partnership with Alectia (developer)
Pa allel scaling and pdating in PolandParallel scaling and updating in Poland
• Parallel with the greenfield project in Denmark, a number of investments will be made in Poland, mainly to expand the wafering capacityTh i t t i C t Sili t th th i t ti f th t it d t th • The investments in Cemat Silicon strengthen the integration of the two units and support the expansion of production capacity in the greenfield project
10-08-26COMPANY PRESENTATION Page 9

100NEW FUTURE PROOF FLOAT ZONE MACHINES INSTALLEDNEW FUTURE PROOF FLOAT ZONE MACHINES INSTALLED
• Installation completed June 2010.
• Currently test runs are being conducted according to plan.
• Commissioning expected September 2010.
• New pullers improved in a number of ways, compared to earlier models.
• Designed to be able to • Designed to be able to manufacture 8’’ FZ wafers.
10-08-26COMPANY PRESENTATION Page 10

100TOPSIL’S NEW PRODUCTION FACILITIES DRAFT JULY 2010TOPSIL S NEW PRODUCTION FACILITIES, DRAFT JULY 2010
10-08-26COMPANY PRESENTATION Page 11

100PLAN FOR BUILDING NEW GREENFIELDPLAN FOR BUILDING NEW GREENFIELD
Phase 0 CommencementPhase 1 Programme and suggestionsPhase 2 Main projectPhase 3 Erection of new facilities
Topsil projects
Phase 4 New machineryPhase 5 Move
10-08-26COMPANY PRESENTATION Page 12

100AGENDAAGENDA
Highlights and financial performance in Q1 20103 Highlights and financial performance in Q1 2010
The Greenfield Project
Expectations for 2010
3
8
13 Expectations for 2010
Appendix: Back up slides
13
15
10-08-26COMPANY PRESENTATION Page 13
100
LEVEL OF ACTIVITIES EXPECTED TO INCREASE IN 2010LEVEL OF ACTIVITIES EXPECTED TO INCREASE IN 2010
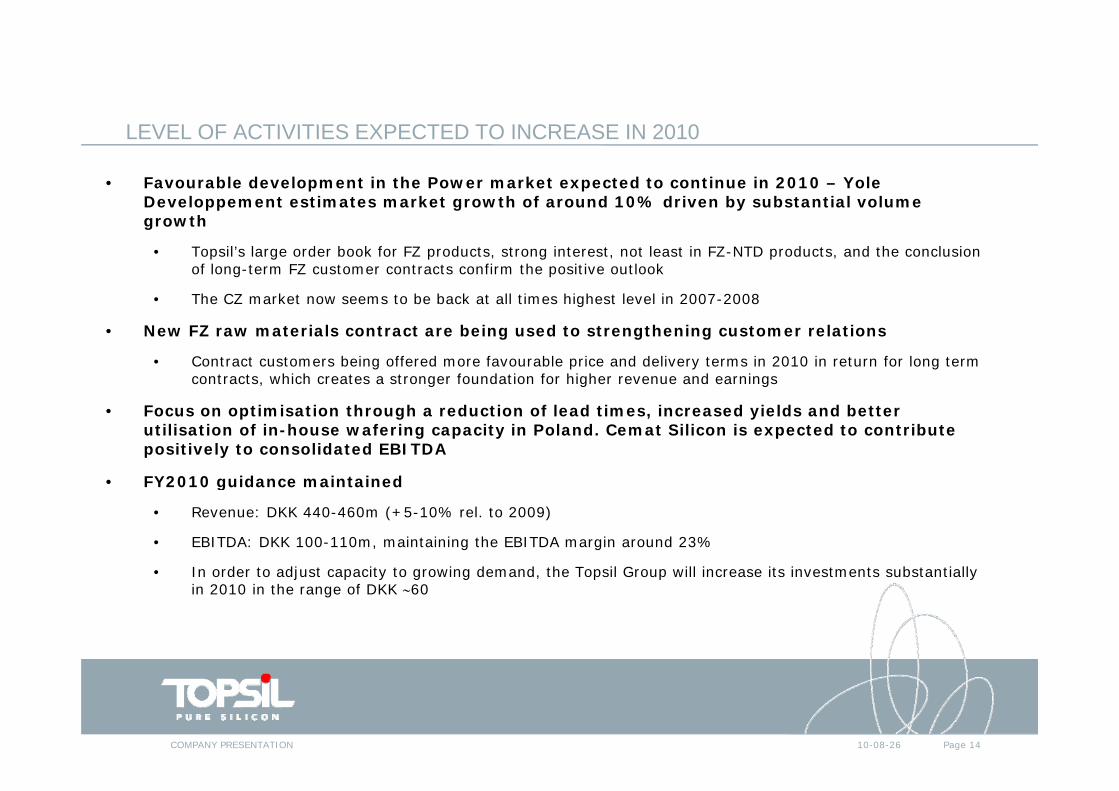
• Favourable development in the Power market expected to continue in 2010 – YoleDeveloppement estimates market growth of around 10% driven by substantial volume
th growth
• Topsil’s large order book for FZ products, strong interest, not least in FZ-NTD products, and the conclusion of long-term FZ customer contracts confirm the positive outlook
• The CZ market now seems to be back at all times highest level in 2007-2008g
• New FZ raw materials contract are being used to strengthening customer relations
• Contract customers being offered more favourable price and delivery terms in 2010 in return for long term contracts, which creates a stronger foundation for higher revenue and earnings
• Focus on optimisation through a reduction of lead times, increased yields and better utilisation of in-house wafering capacity in Poland. Cemat Silicon is expected to contribute positively to consolidated EBITDA
• FY2010 guidance maintainedFY2010 guidance maintained
• Revenue: DKK 440-460m (+5-10% rel. to 2009)
• EBITDA: DKK 100-110m, maintaining the EBITDA margin around 23%
• In order to adjust capacity to growing demand, the Topsil Group will increase its investments substantially In order to adjust capacity to growing demand, the Topsil Group will increase its investments substantially in 2010 in the range of DKK 60
10-08-26COMPANY PRESENTATION Page 14

APPENDIX
Back up slidesp
26-08-2010COMPANY PRESENTATION Page 15

100TOPSIL – A NICHE PRODUCER OF SILICON FOR THE SEMICONDUCTOR INDUSTRYINDUSTRY
• +50 years’ experience in the processing of silicon to the semiconductor industry
• Strong position within the production of float zone (FZ) and since 2008 czochralski (CZ) silicon
• Sells mainly to semiconductor markets, the Power market, MEMS, Optoelectronics & detectors as well as RF electronics / IPD, a market totalling USD 1.3bn or around 10% of the total silicon market for the semiconductor industry (2009)
• Favourable position among the four largest suppliers of silicon with a global market share of 7% of the Power market
• Professionalism and technological weight as core competencies
• Strong customer and supplier relations
Ni h l t t f i hi h/ di d t • Niche plus strategy focusing on high/medium power products for selected customers
• Long-term contracts running until the end of 2015 and 2017 with the only two producers of the FZ raw material (polysilicon)(polysilicon)
• Long-term contracts running until the end of 2015 with the largest and most important customers, ensuring a significant part of revenue
10-08-26COMPANY PRESENTATION Page 16

100
GROUP OVERVIEWGROUP OVERVIEW
• Production based on FZ technology
The Topsil Group
TOPSIL Semiconductor Materials A/S
(Denmark)
gy• Head office with administrative functions• Development of FZ-based production• 82% of 2009 revenue – about 100 employees
Cemat Silicon S.A.
100%
• Production based on CZ technology and in-house production of CZ and FZ wafers
(Poland)
53%
• Development of CZ-based production• 15% of 2009 revenue – about 220 employees
Cemat 70 S.A(Poland)
• Property company – non-core activity – held for sale• 47% owned by the Polish state (24.7%), SPEC (9.4%) and other
private investors (12.9%) • Earnings and cash flow neutral - 55 employeesg p y
10-08-26COMPANY PRESENTATION Page 17

100
FROM SAND TO HIGH END PRODUCTFROM SAND TO HIGH END PRODUCT
FZ
CZ
10-08-26COMPANY PRESENTATION Page 18

100THE TOPSIL GROUP ADDRESSES FOUR SEMICONDUCTOR MARKETS THE POWER MARKET IS THE LARGEST BY FAR IN TERMS OF REVENUE- THE POWER MARKET IS THE LARGEST BY FAR IN TERMS OF REVENUE
Source: Yole Developpement and the Topsil Group, 2009
Revenue split for Topsil Group (2009)90% 3% 2% 5%
10-08-26COMPANY PRESENTATION Page 1910-08-26COMPANY PRESENTATION Page 19
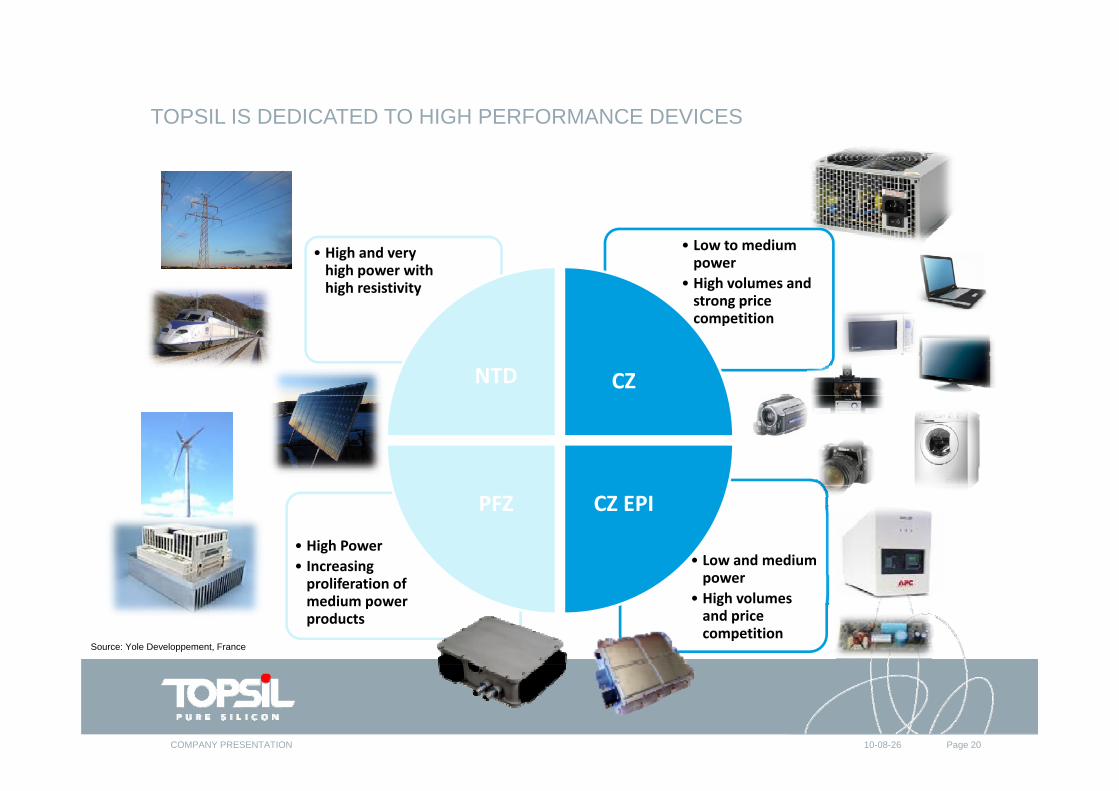
100TOPSIL IS DEDICATED TO HIGH PERFORMANCE DEVICES
• Low to medium power
• High volumes and strong price
• High and very high power with high resistivity
g pcompetition
NTD CZ
• Low and medium power
• High Power• Increasing
CZ EPI PFZ
power• High volumes and price competition
proliferation of medium power products
Source: Yole Developpement, France
10-08-26COMPANY PRESENTATION Page 20

100THE POWER ELECTRONICS MARKET (2009E)
Energy Mili & AOthers
2009 power wafer market size, split by application
Transportation$22.7 M
Energy$10.4 M
1%
Military & Aerospace$11.1 M
1% Telecommunication$45.7 M
4%
$44.7 M4%
Automotive$163.1 M
16%
Medical$33.7 M
3%
$22.7 M2%
Computer and officeequipment$267.6 M
Industry$197.6 M
19%$ 67.6 M
26%
Lighting$35.8 M
3%
Consumer$220.4 M
21%
Breakdown over a total wafer market size of $1,052M Kilde: Yole Developpement, France
3%
10-08-26
Page 21
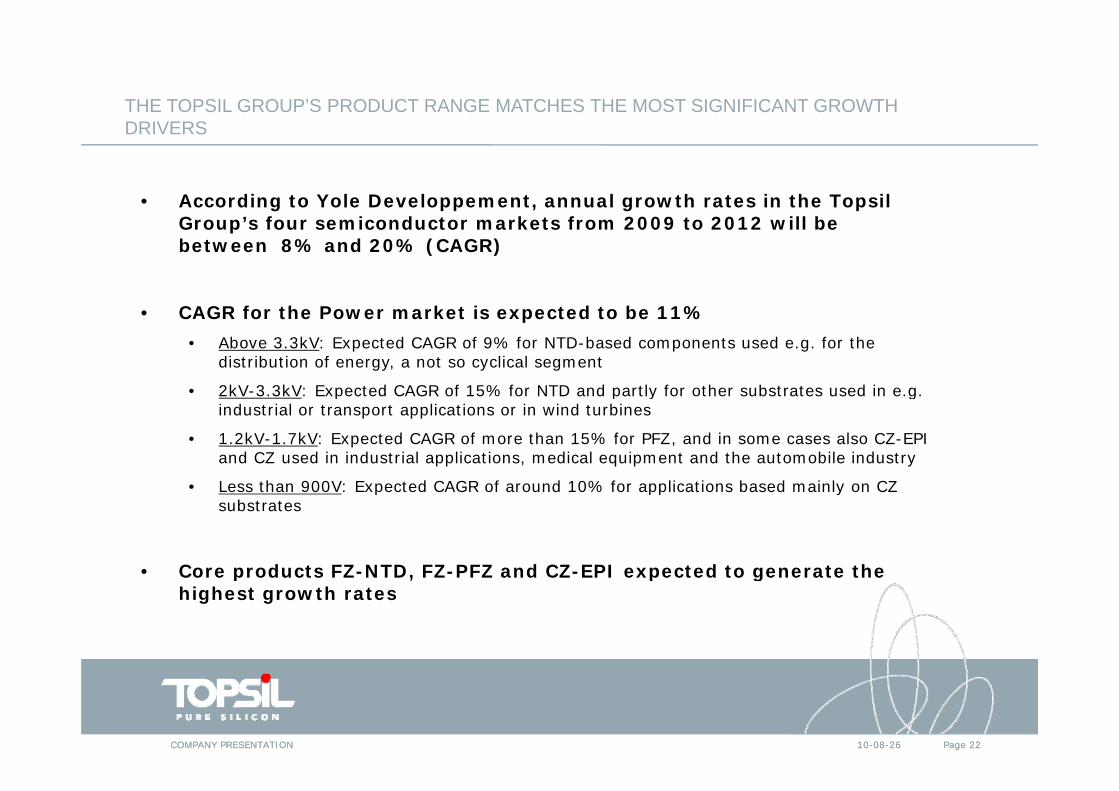
100THE TOPSIL GROUP’S PRODUCT RANGE MATCHES THE MOST SIGNIFICANT GROWTH DRIVERSDRIVERS
• According to Yole Developpement, annual growth rates in the Topsil G ’ f i d k f 2009 20 2 ill bGroup’s four semiconductor markets from 2009 to 2012 will be between 8% and 20% (CAGR)
CAGR f h P k i d b 11%• CAGR for the Power market is expected to be 11%• Above 3.3kV: Expected CAGR of 9% for NTD-based components used e.g. for the
distribution of energy, a not so cyclical segment
• 2kV-3.3kV: Expected CAGR of 15% for NTD and partly for other substrates used in e.g. 2kV 3.3kV: Expected CAGR of 15% for NTD and partly for other substrates used in e.g. industrial or transport applications or in wind turbines
• 1.2kV-1.7kV: Expected CAGR of more than 15% for PFZ, and in some cases also CZ-EPI and CZ used in industrial applications, medical equipment and the automobile industry
• Less than 900V: Expected CAGR of around 10% for applications based mainly on CZ • Less than 900V: Expected CAGR of around 10% for applications based mainly on CZ substrates
• Core products FZ-NTD, FZ-PFZ and CZ-EPI expected to generate the Core products FZ NTD, FZ PFZ and CZ EPI expected to generate the highest growth rates
10-08-26COMPANY PRESENTATION Page 2210-08-26COMPANY PRESENTATION Page 22
100
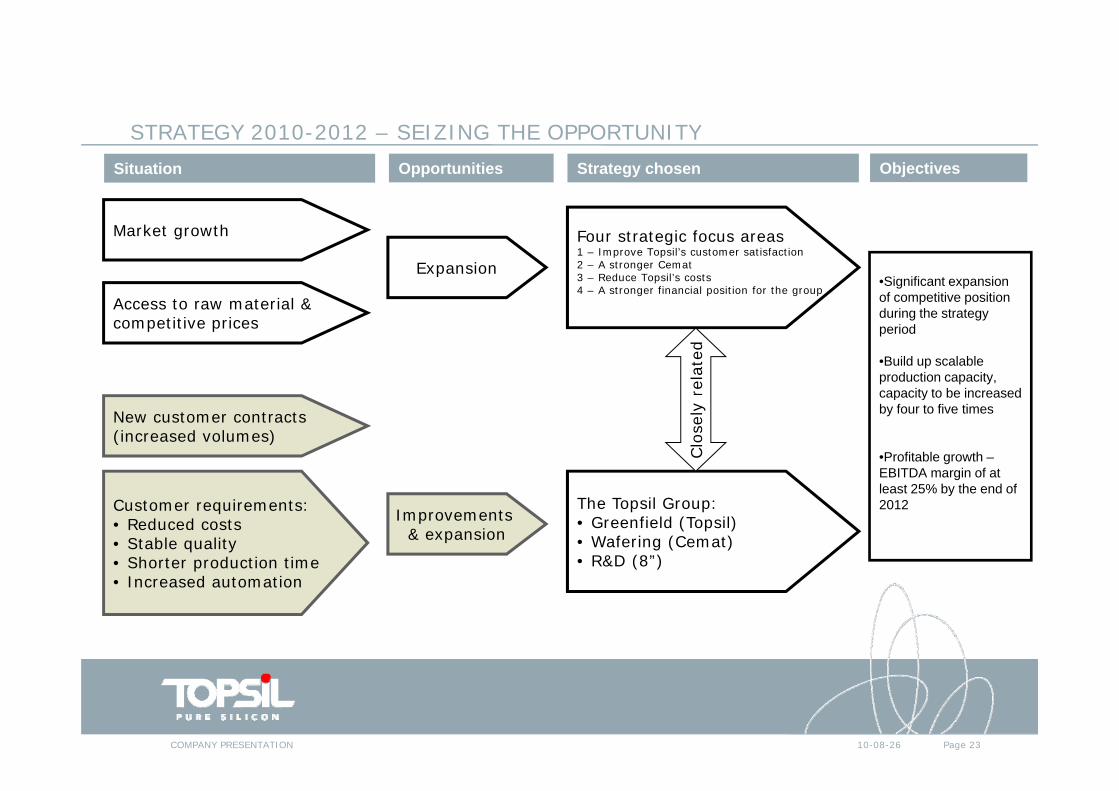
STRATEGY 2010 2012 SEIZING THE OPPORTUNITYSTRATEGY 2010-2012 – SEIZING THE OPPORTUNITYSituation Opportunities Strategy chosen Objectives
Market growth
Access to raw material &
Expansion
Four strategic focus areas1 – Improve Topsil’s customer satisfaction 2 – A stronger Cemat3 – Reduce Topsil’s costs4 – A stronger financial position for the group
•Significant expansion of competitive position Access to raw material &
competitive prices
rela
ted
during the strategy period
•Build up scalable production capacity, capacity to be increased
New customer contracts(increased volumes)
Clo
sely
capacity to be increased by four to five times
•Profitable growth –EBITDA margin of at l t 25% b th d f
Customer requirements: • Reduced costs• Stable quality• Shorter production time
Improvements & expansion
The Topsil Group:• Greenfield (Topsil)• Wafering (Cemat) • R&D (8”)
least 25% by the end of 2012
• Increased automation
10-08-26COMPANY PRESENTATION Page 23


