12
Research & Forecast Report GREATER TORONTO AREA INDUSTRIAL MARKET Fourth Quarter 2016
| Date post: | 07-Feb-2017 |
| Category: |
Documents |
| Upload: | matt-albertine |
| View: | 23 times |
| Download: | 2 times |

Research & Forecast Report
GREATER TORONTO AREAINDUSTRIAL MARKET Fourth Quarter 2016
Market Summaries
GTA Market Overview ....................................................................................................3 GTA Central ............................................................................................................. 4 GTA East ................................................................................................................. 5 GTA North ............................................................................................................6-7 GTA West .............................................................................................................8-9
Glossary ............................................................................................................................. 10
Table of Contents

3Research & Forecast Report | Q4 2016 | Greater Toronto Area / Industrial | Colliers International
GTA Market Overview
Market OverviewThe Greater Toronto Area (GTA) reported an overall availability rate of 2.8 percent in Q4 2016, a 0.1 percentage point decrease from the previous quarter. The GTA East market experienced the largest decrease in the availability rate – a difference of 109,937 square feet which was positively absorbed this quarter. The GTA Central market remains to have the lowest availability rate in the GTA at 1.7%. The Scarborough submarket in the GTA Central is an example of one of the oldest industrial markets in the GTA that is being reinvigorated as companies are finding value in this market. Close proximity to the City of Toronto, a good local labour pool and lack of supply throughout the GTA are some of the reasons for the high demand in Central markets such as Scarborough.
A total of 513,076 square feet of new supply was introduced to the market this quarter, most of which occurred in GTA West and the remainder in the GTA North. Conversely, the total vacant space decreased by 18 percent from Q3 2016. The largest development completed this quarter was 3075 Caravelle Drive, by the Orlando Corporation in the Mississauga East submarket. The total size of the building is 183,258 square feet, which has been fully leased by Mevotech. Altogether, the GTA had 4,164,515 square feet of new supply in 2016 with the GTA North responsible for 21 percent and the GTA West responsible for 79 percent. Approximately 5.4 million square feet of development will be constructed by the end of 2017, all within the GTA West and North markets.
RealNet data shows the overall average sale price per square foot for industrial buildings in the GTA was $154 this quarter, just a slight increase from last quarter’s $151 per square foot.
Market IndicatorsRelative to prior period
Market Q3 2016
Market Q4 2016
Trend
AVAILABILITY RATE 2.9% 2.8%
NET ABSORPTION 2,215,712 880,896
UNDER CONSTRUCTION 5,420,584 5,862,245
RENTAL RATE** $5.60 $5.75
*Projected **Rental rates for current quarter are for CBD. Rent forecast is for metro-wide rents.
More specifically, a drastic drop occurred in the GTA North market, down 43 percent from last quarter equaling $75.05 per square foot. Four transactions, one in Vaughan, one in Markham and two in Newmarket, were responsible for the drop, due to the fact their recorded transaction price was less than $73 per square foot. Real Capital Analytics recorded the sales volume at $178 million for the GTA industrial market – a 4 percent increase from last quarter. In addition, the median cap rate for 2016 was 6.4 percent.
Greater Toronto Area Expected & Completed New Supply (2010 - Present)
Developments Under Construction (SF)
Completed New Supply (SF)
Availability Rate - Current
Historical Performance and Forecast
0.0%0.5%1.0%1.5%2.0%2.5%3.0%3.5%4.0%4.5%
-3,000,000-2,000,000-1,000,000
01,000,0002,000,0003,000,0004,000,0005,000,0006,000,000
2012
Q4
2013
Q1
2013
Q2
2013
Q3
2013
Q4
2014
Q1
2014
Q2
2014
Q3
2014
Q4
2015
Q1
2015
Q2
2015
Q3
2015
Q4
2016
Q1
2016
Q2
2016
Q3
2016
Q4
2017
1Q
*
2017
2Q
*
2017
3Q
*
2017
4Q
*
*Forecasted data
(600,000)
(400,000)
(200,000)
-
200,000
400,000
600,000
800,000
0.0%
1.0%
2.0%
3.0%
4.0%
5.0%
6.0%
7.0%
8.0%
9.0%
10.0%
2009
Q2
2009
Q3
2009
Q4
2010
Q1
2010
Q2
2010
Q3
2010
Q4
2011
Q1
2011
Q2
2011
Q3
2011
Q4
2012
Q1
2012
Q2
2012
Q3
2012
Q4
2013
Q1
2013
Q2
2013
Q3
2013
Q4
2014
Q1
2014
Q2
Net Absorption (SF) New Supply (SF) Vacancy Rate (%)Net Absorption (SF) Current Qtr New Supply (SF)
0
1,000,000
2,000,000
3,000,000
4,000,000
5,000,000
6,000,000
7,000,000
8,000,000
9,000,000
10,000,000
Q2
2010
Q3
2010
Q4
2010
Q1
2011
Q2
2011
Q3
2011
Q4
2011
Q1
2012
Q2
2012
Q3
2012
Q4
2012
Q1
2013
Q2
2013
Q3
2013
Q4
2013
Q1
2014
Q2
2014
Q3
2014
Q4
2014
Q1
2015
Q2
2015
Q3
2015
Q4
2015
Q1
2016
Q2
2016
Q3
2016
Q4
2016
Greater Toronto Area Expected & Completed New Supply(2010 - Present)
Developments Under Construction (SF) Completed New Supply (SF)

44 Research & Forecast Report | Q4 2016 | Greater Toronto Area / Industrial | Colliers International
GTA CentralThe GTA Central market’s availability rate remained stable at 1.7 percent from last quarter, making it the lowest amongst all other markets. This market also experienced the smallest increase in rental rates in comparison to Q4 2015 at $4.65 per square foot from $4.62. This quarter saw 45,924 square feet of positive absorption, the largest contributor being the Central-Weston submarket, specifically in 5701-5711 Steeles Avenue West. The largest listings added to the market this quarter were 755 Passmore Avenue in Scarborough East, 700 Ormont Drive in Weston and 375 Kennedy Road in Scarborough South. The number of sales transactions almost doubled this quarter to 30 from Q3 2016, while the average price per square foot declined from $124.30 to $95.33 – the largest decrease taking place in Central-Scarborough East.
Trends > The largest notable deal this quarter was Technicolor Canada Inc’s lease of 1271 Tapscott Road in Scarborough, which was brokered by Colliers International.
Notable Lease TransactionsTENANT NAME - ADDRESS MARKET SIZE (SF)
1. Technicolor Canada Inc - 1271 Tapscott Road
Central-Scarborough
East158,458
2. Burgham Sales Ltd - 3641 McNicoll Avenue
Central-Scarborough
East110,130
3. GMP Group- 1995 Markham Road
Central-Scarborough
East100,000
Summary Statistics Q4 2016 Regional Industrial Market 2016 Q3 2016 Q4 Trend
Availability Rate 1.7% 1.7%
Net Absorption 1,030,812 45,924
Under Construction (SF) 0 0
Average Asking Rent (PSF) $4.71 $4.65
Average Sale Price (PSF) $124.30 $95.33
Notable Lease Notable Sale New Supply
Notable Sale TransactionsADDRESS PRICE SIZE (SF)
4. 33 Green Belt Drive $18,000,000 142,000
5. 75 Rexdale Boulevard $15,048,954 320,747
6. 5900 Finch Avenue East $13,265,000 166,751
Highway 407
Finch Ave
Hig
hway
404
Yong
e St
Vict
oria
Par
k Av
e
Steeles Ave
Mar
kham
Rd
Hig
hway
400
Eglinton Ave
TORONTO
Highway 401
54
Lake Ontario
1236
Historical Performance and Forecast
0.0%
0.5%
1.0%
1.5%
2.0%
2.5%
3.0%
3.5%
4.0%
-2,000,000
-1,500,000
-1,000,000
-500,000
0
500,000
1,000,000
1,500,000
2,000,000
2012
Q4
2013
Q1
2013
Q2
2013
Q3
2013
Q4
2014
Q1
2014
Q2
2014
Q3
2014
Q4
2015
Q1
2015
Q2
2015
Q3
2015
Q4
2016
Q1
2016
Q2
2016
Q3
2016
Q4
2017
1Q
*
2017
2Q
*
2017
3Q
*
2017
4Q
*
*Forecasted data
(600,000)
(400,000)
(200,000)
-
200,000
400,000
600,000
800,000
0.0%
1.0%
2.0%
3.0%
4.0%
5.0%
6.0%
7.0%
8.0%
9.0%
10.0%
2009
Q2
2009
Q3
2009
Q4
2010
Q1
2010
Q2
2010
Q3
2010
Q4
2011
Q1
2011
Q2
2011
Q3
2011
Q4
2012
Q1
2012
Q2
2012
Q3
2012
Q4
2013
Q1
2013
Q2
2013
Q3
2013
Q4
2014
Q1
2014
Q2
Net Absorption (SF) New Supply (SF) Vacancy Rate (%)Net Absorption (SF) Current Qtr New Supply (SF) Availability Rate - Current
5Research & Forecast Report | Q4 2016 | Greater Toronto Area / Industrial | Colliers International
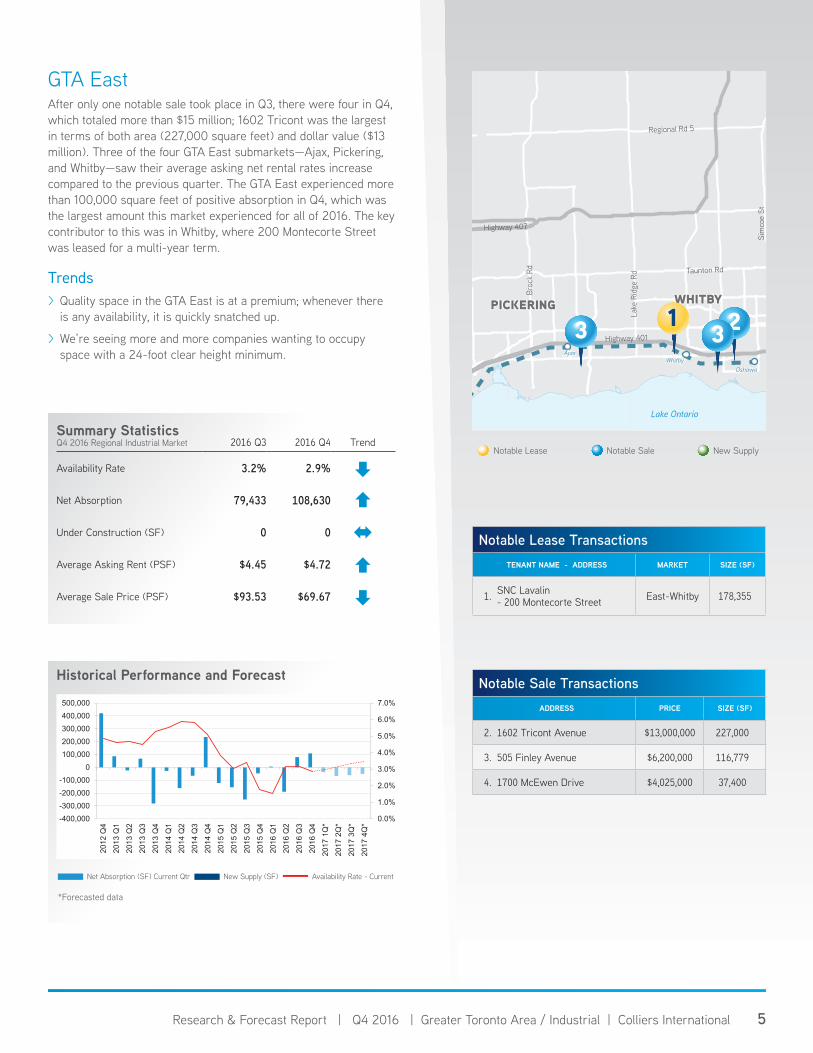
GTA EastAfter only one notable sale took place in Q3, there were four in Q4, which totaled more than $15 million; 1602 Tricont was the largest in terms of both area (227,000 square feet) and dollar value ($13 million). Three of the four GTA East submarkets—Ajax, Pickering, and Whitby—saw their average asking net rental rates increase compared to the previous quarter. The GTA East experienced more than 100,000 square feet of positive absorption in Q4, which was the largest amount this market experienced for all of 2016. The key contributor to this was in Whitby, where 200 Montecorte Street was leased for a multi-year term.
Trends > Quality space in the GTA East is at a premium; whenever there is any availability, it is quickly snatched up.
> We’re seeing more and more companies wanting to occupy space with a 24-foot clear height minimum.
Summary Statistics Q4 2016 Regional Industrial Market 2016 Q3 2016 Q4 Trend
Availability Rate 3.2% 2.9%
Net Absorption 79,433 108,630
Under Construction (SF) 0 0
Average Asking Rent (PSF) $4.45 $4.72
Average Sale Price (PSF) $93.53 $69.67
Notable Lease Notable Sale New Supply
Historical Performance and Forecast
*Forecasted data
(600,000)
(400,000)
(200,000)
-
200,000
400,000
600,000
800,000
0.0%
1.0%
2.0%
3.0%
4.0%
5.0%
6.0%
7.0%
8.0%
9.0%
10.0%
2009
Q2
2009
Q3
2009
Q4
2010
Q1
2010
Q2
2010
Q3
2010
Q4
2011
Q1
2011
Q2
2011
Q3
2011
Q4
2012
Q1
2012
Q2
2012
Q3
2012
Q4
2013
Q1
2013
Q2
2013
Q3
2013
Q4
2014
Q1
2014
Q2
Net Absorption (SF) New Supply (SF) Vacancy Rate (%)Net Absorption (SF) Current Qtr New Supply (SF) Availability Rate - Current
0.0%
1.0%
2.0%
3.0%
4.0%
5.0%
6.0%
7.0%
-400,000-300,000-200,000-100,000
0100,000200,000300,000400,000500,000
2012
Q4
2013
Q1
2013
Q2
2013
Q3
2013
Q4
2014
Q1
2014
Q2
2014
Q3
2014
Q4
2015
Q1
2015
Q2
2015
Q3
2015
Q4
2016
Q1
2016
Q2
2016
Q3
2016
Q4
2017
1Q
*
2017
2Q
*
2017
3Q
*
2017
4Q
*
Regional Rd 5
Taunton Rd
Broc
k Rd
Lake
Rid
ge R
d
Sim
coe
St
Highway 407
Highway 401
Oshawa
AjaxWhitby
WHITBYPICKERING 2
Lake Ontario
233 1
Notable Lease TransactionsTENANT NAME - ADDRESS MARKET SIZE (SF)
1. SNC Lavalin- 200 Montecorte Street East-Whitby 178,355
Notable Sale TransactionsADDRESS PRICE SIZE (SF)
2. 1602 Tricont Avenue $13,000,000 227,000
3. 505 Finley Avenue $6,200,000 116,779
4. 1700 McEwen Drive $4,025,000 37,400
66 Research & Forecast Report | Q4 2016 | Greater Toronto Area / Industrial | Colliers International
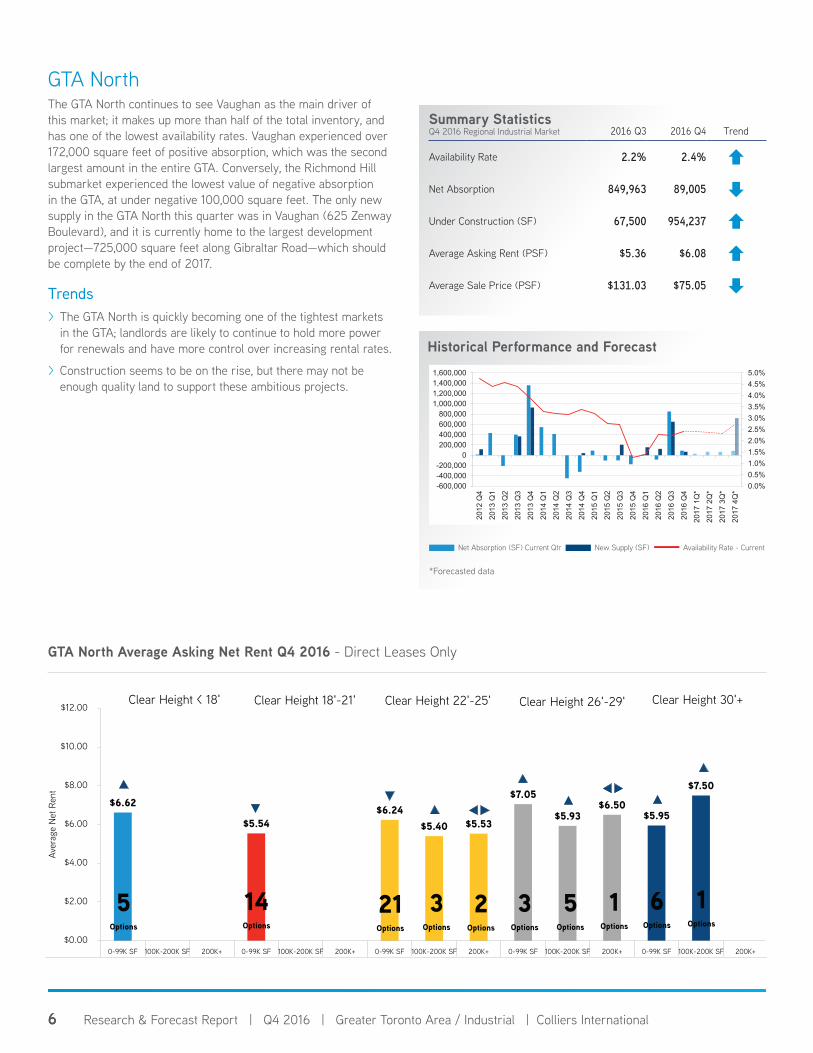
GTA NorthThe GTA North continues to see Vaughan as the main driver of this market; it makes up more than half of the total inventory, and has one of the lowest availability rates. Vaughan experienced over 172,000 square feet of positive absorption, which was the second largest amount in the entire GTA. Conversely, the Richmond Hill submarket experienced the lowest value of negative absorption in the GTA, at under negative 100,000 square feet. The only new supply in the GTA North this quarter was in Vaughan (625 Zenway Boulevard), and it is currently home to the largest development project—725,000 square feet along Gibraltar Road—which should be complete by the end of 2017.
Trends > The GTA North is quickly becoming one of the tightest markets in the GTA; landlords are likely to continue to hold more power for renewals and have more control over increasing rental rates.
> Construction seems to be on the rise, but there may not be enough quality land to support these ambitious projects.
Summary Statistics Q4 2016 Regional Industrial Market 2016 Q3 2016 Q4 Trend
Availability Rate 2.2% 2.4%
Net Absorption 849,963 89,005
Under Construction (SF) 67,500 954,237
Average Asking Rent (PSF) $5.36 $6.08
Average Sale Price (PSF) $131.03 $75.05
GTA North Average Asking Net Rent Q4 2016 - Direct Leases Only
Historical Performance and Forecast
*Forecasted data
(600,000)
(400,000)
(200,000)
-
200,000
400,000
600,000
800,000
0.0%
1.0%
2.0%
3.0%
4.0%
5.0%
6.0%
7.0%
8.0%
9.0%
10.0%
2009
Q2
2009
Q3
2009
Q4
2010
Q1
2010
Q2
2010
Q3
2010
Q4
2011
Q1
2011
Q2
2011
Q3
2011
Q4
2012
Q1
2012
Q2
2012
Q3
2012
Q4
2013
Q1
2013
Q2
2013
Q3
2013
Q4
2014
Q1
2014
Q2
Net Absorption (SF) New Supply (SF) Vacancy Rate (%)Net Absorption (SF) Current Qtr New Supply (SF) Availability Rate - Current
0.0%0.5%1.0%1.5%2.0%2.5%3.0%3.5%4.0%4.5%5.0%
-600,000-400,000-200,000
0200,000400,000600,000800,000
1,000,0001,200,0001,400,0001,600,000
2012
Q4
2013
Q1
2013
Q2
2013
Q3
2013
Q4
2014
Q1
2014
Q2
2014
Q3
2014
Q4
2015
Q1
2015
Q2
2015
Q3
2015
Q4
2016
Q1
2016
Q2
2016
Q3
2016
Q4
2017
1Q
*
2017
2Q
*
2017
3Q
*
2017
4Q
*
$6.62
$5.54 $6.24
$5.40 $5.53
$7.05
$5.93 $6.50
$5.95
$7.50
$0.00
$2.00
$4.00
$6.00
$8.00
$10.00
$12.00
0-99K SF 100K-200K SF 200K+ 0-99K SF 100K-200K SF 200K+ 0-99K SF 100K-200K SF 200K+ 0-99K SF 100K-200K SF 200K+ 0-99K SF 100K-200K SF 200K+
Aver
age
Net R
ent
GTA North Average Asking Net Rent Q4 2016 - Direct Leases Only
Clear Height < 18' Clear Height 18'-21' Clear Height 22'-25'
5Options
21Options
2Options
3Options
14Options
3Options
5Options
1Options
6Options
1Options
Clear Height 26'-29' Clear Height 30'+
7Research & Forecast Report | Q4 2016 | Greater Toronto Area / Industrial | Colliers International
Notable Lease Notable Sale New Supply
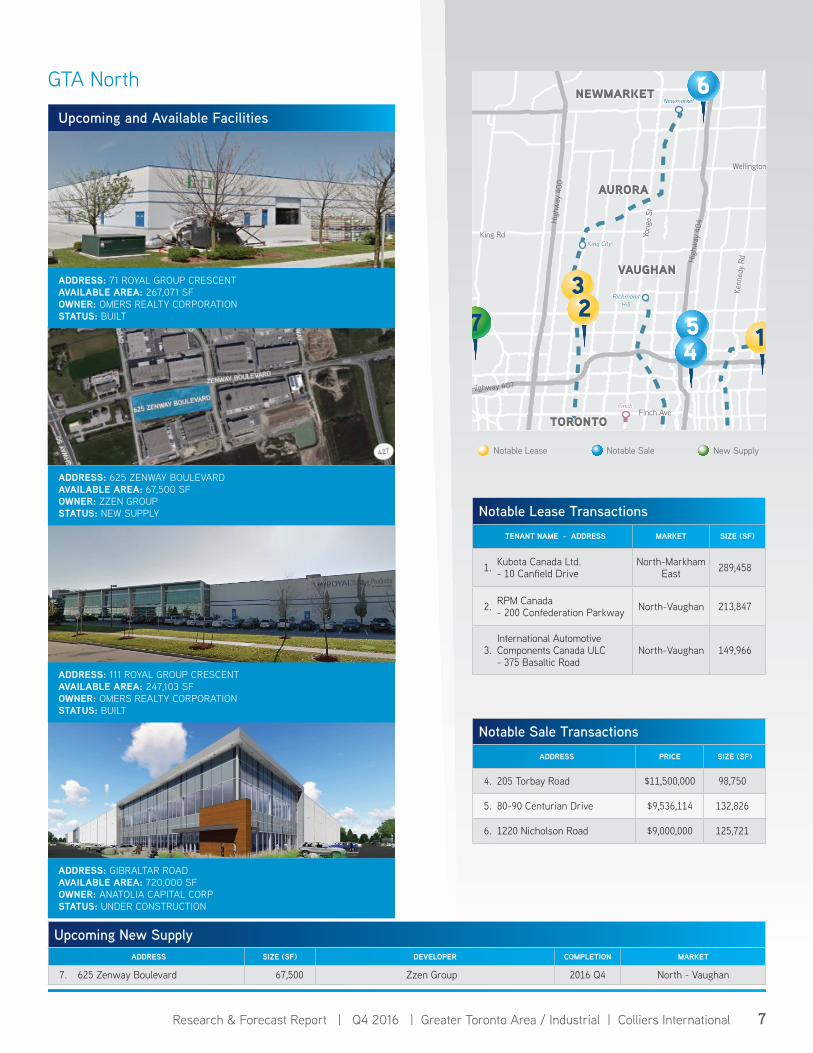
GTA North
Notable Lease TransactionsTENANT NAME - ADDRESS MARKET SIZE (SF)
1. Kubota Canada Ltd.- 10 Canfield Drive
North-Markham East 289,458
2. RPM Canada- 200 Confederation Parkway North-Vaughan 213,847
3.International Automotive Components Canada ULC- 375 Basaltic Road
North-Vaughan 149,966
Upcoming and Available Facilities
Finch Ave
High
way
404
Yong
e St
Kenn
edy
Rd
King Rd
Wellington St
Mar
kham
Rd
Hig
hway
400
Highway 407
Stouffville
Newmarket
King City
RichmondHill
Markham
Finch
TORONTO
NEWMARKET
AURORA
VAUGHANMARKHAM
5 1
3
6
274
Upcoming New SupplyADDRESS SIZE (SF) DEVELOPER COMPLETION MARKET
7. 625 Zenway Boulevard 67,500 Zzen Group 2016 Q4 North - Vaughan
Notable Sale TransactionsADDRESS PRICE SIZE (SF)
4. 205 Torbay Road $11,500,000 98,750
5. 80-90 Centurian Drive $9,536,114 132,826
6. 1220 Nicholson Road $9,000,000 125,721
ADDRESS: 71 ROYAL GROUP CRESCENTAVAILABLE AREA: 267,071 SFOWNER: OMERS REALTY CORPORATIONSTATUS: BUILT
ADDRESS: 625 ZENWAY BOULEVARDAVAILABLE AREA: 67,500 SFOWNER: ZZEN GROUPSTATUS: NEW SUPPLY
ADDRESS: GIBRALTAR ROADAVAILABLE AREA: 720,000 SFOWNER: ANATOLIA CAPITAL CORPSTATUS: UNDER CONSTRUCTION
ADDRESS: 111 ROYAL GROUP CRESCENTAVAILABLE AREA: 247,103 SFOWNER: OMERS REALTY CORPORATIONSTATUS: BUILT
8 Research & Forecast Report | Q4 2016 | Greater Toronto Area / Industrial | Colliers International
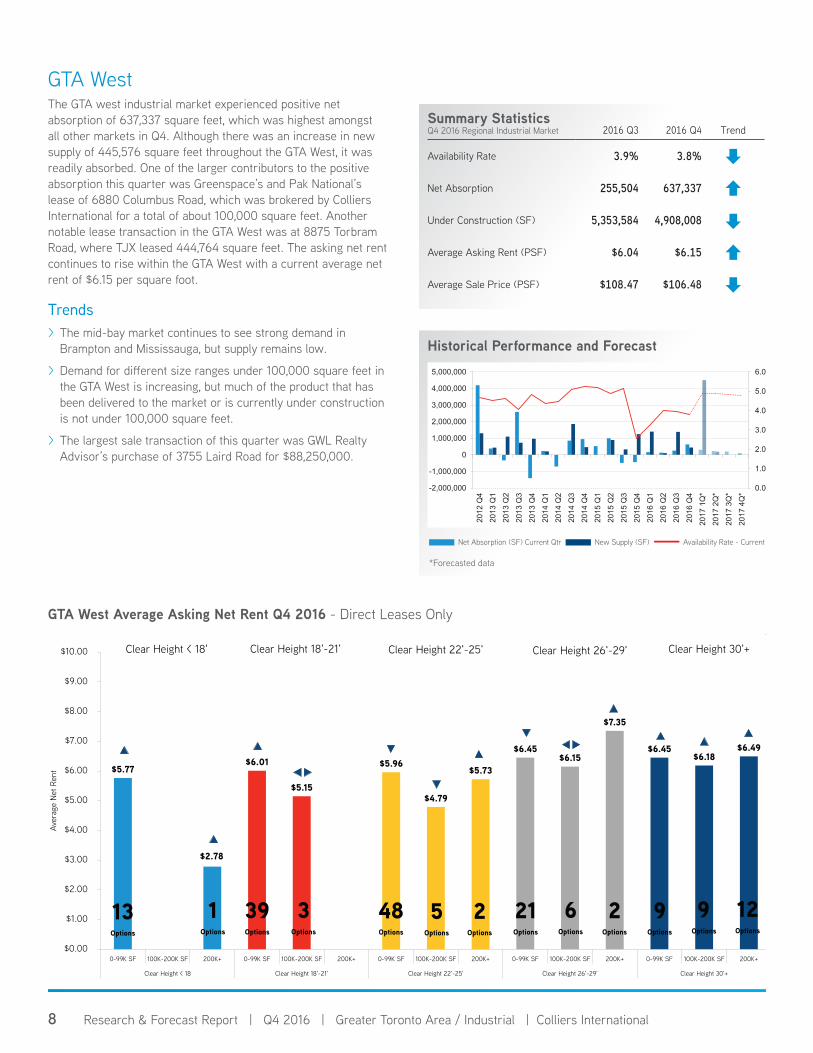
GTA WestThe GTA west industrial market experienced positive net absorption of 637,337 square feet, which was highest amongst all other markets in Q4. Although there was an increase in new supply of 445,576 square feet throughout the GTA West, it was readily absorbed. One of the larger contributors to the positive absorption this quarter was Greenspace’s and Pak National’s lease of 6880 Columbus Road, which was brokered by Colliers International for a total of about 100,000 square feet. Another notable lease transaction in the GTA West was at 8875 Torbram Road, where TJX leased 444,764 square feet. The asking net rent continues to rise within the GTA West with a current average net rent of $6.15 per square foot.
Trends > The mid-bay market continues to see strong demand in Brampton and Mississauga, but supply remains low.
> Demand for different size ranges under 100,000 square feet in the GTA West is increasing, but much of the product that has been delivered to the market or is currently under construction is not under 100,000 square feet.
> The largest sale transaction of this quarter was GWL Realty Advisor’s purchase of 3755 Laird Road for $88,250,000.
Summary Statistics Q4 2016 Regional Industrial Market 2016 Q3 2016 Q4 Trend
Availability Rate 3.9% 3.8%
Net Absorption 255,504 637,337
Under Construction (SF) 5,353,584 4,908,008
Average Asking Rent (PSF) $6.04 $6.15
Average Sale Price (PSF) $108.47 $106.48
GTA West Average Asking Net Rent Q4 2016 - Direct Leases Only
Historical Performance and Forecast
*Forecasted data
(600,000)
(400,000)
(200,000)
-
200,000
400,000
600,000
800,000
0.0%
1.0%
2.0%
3.0%
4.0%
5.0%
6.0%
7.0%
8.0%
9.0%
10.0%
2009
Q2
2009
Q3
2009
Q4
2010
Q1
2010
Q2
2010
Q3
2010
Q4
2011
Q1
2011
Q2
2011
Q3
2011
Q4
2012
Q1
2012
Q2
2012
Q3
2012
Q4
2013
Q1
2013
Q2
2013
Q3
2013
Q4
2014
Q1
2014
Q2
Net Absorption (SF) New Supply (SF) Vacancy Rate (%)Net Absorption (SF) Current Qtr New Supply (SF) Availability Rate - Current
0.0%
1.0%
2.0%
3.0%
4.0%
5.0%
6.0%
-2,000,000
-1,000,000
0
1,000,000
2,000,000
3,000,000
4,000,000
5,000,000
2012
Q4
2013
Q1
2013
Q2
2013
Q3
2013
Q4
2014
Q1
2014
Q2
2014
Q3
2014
Q4
2015
Q1
2015
Q2
2015
Q3
2015
Q4
2016
Q1
2016
Q2
2016
Q3
2016
Q4
2017
1Q
*
2017
2Q
*
2017
3Q
*
2017
4Q
*
$5.77 $6.01
$5.15
$5.96
$4.79
$5.73
$6.45 $6.15
$7.35
$6.45 $6.18
$6.49
$0.00
$1.00
$2.00
$3.00
$4.00
$5.00
$6.00
$7.00
$8.00
$9.00
$10.00
0-99K SF 100K-200K SF 200K+ 0-99K SF 100K-200K SF 200K+ 0-99K SF 100K-200K SF 200K+ 0-99K SF 100K-200K SF 200K+ 0-99K SF 100K-200K SF 200K+
Clear Height < 18 Clear Height 18'-21' Clear Height 22'-25' Clear Height 26'-29' Clear Height 30'+
Aver
age
Net R
ent
GTA West Average Asking Net Rent Q4 2016 - Direct Leases Only
Clear Height < 18' Clear Height 18'-21' Clear Height 22'-25' Clear Height 30'+
13Options
3Options
39Options
5Options
2Options
21Options
6Options
2Options
9Options
48Options
Clear Height 26'-29'
9Options
1Options
12Options
$2.78

9Research & Forecast Report | Q4 2016 | Greater Toronto Area / Industrial | Colliers International
GTA West
Notable Lease Notable Sale New Supply
ADDRESS: 3075 CARAVELLE DRIVEAVAILABLE AREA: 0 SFOWNER: ORLANDO CORPORATIONSTATUS: NEW SUPPLY
ADDRESS: 545 DEERHURST DRIVEAVAILABLE AREA: 25,000 SFOWNER: METRUS PROPERTIESSTATUS: NEW SUPPLY
ADDRESS: 175 WESTCREEK BOULEVARDAVAILABLE AREA: 78,000 SFOWNER: PANATTONISTATUS: NEW SUPPLY
ADDRESS: 6400 KENNEDY ROADAVAILABLE AREA: 0 SFOWNER: PEEL PROPERTIESSTATUS: EXPANSION
Upcoming and Available Facilities
Notable Lease TransactionsTENANT NAME - ADDRESS MARKET SIZE (SF)
1. TJX- 8875 Torbram Road
West-Brampton East 444,764
2. JARDEN- 20 Hereford Street
West-Brampton West 283,000
3. GENCO- 95 Market Drive West-Milton 237,000
401
Lake Ontario
Highway 407
QEW
Highway 401
Highway 410
Hig
hway
400
8CP Intermodal
BRAMPTON7
8
9
9
64
9
8
3
1
OAKVILLE
2 75
Pearson Airport
MISSISSAUGA
CN Intermodal
Upcoming New SupplyADDRESS SIZE (SF) DEVELOPER COMPLETION MARKET
7. 3075 Caravelle Drive 183,258 Orlando Corporation 2016 Q4 West - Mississauga East
8. 175 Westcreek Boulevard 130,000 Panattoni 2016 Q4 West - Brampton West
9. 545 Deerhurst Drive 84,318 Metrus Properties 2016 Q4 West - Brampton East
Notable Sale TransactionsADDRESS PRICE SIZE (SF)
4. 3755 Laird Road $88,250,000 502,250
5. 1590 South Gateway Road $23,750,000 195,322
6. 4151 North Service Road $23,168,855 209,095

10 Research & Forecast Report | Q4 2016 | Greater Toronto Area / Industrial | Colliers International
Glossary
Weighted Average Asking Net Rent: The dollar amount requested by landlords for an available space, expressed as an average based on the weight of available space.
Availability: The total amount of space that is currently being marketed as available for lease or sublease at the end of the quarter. It includes space that is available, regardless of whether the space is vacant or occupied.
Net Absorption: The net absorption in available space in a given market between the current quarter and the previous quarter.
Direct Availability: Space that is being offered for lease directly from the landlord or owner of a building, not space by another tenant in the building trying to sublet a space that has already been leased.
Sublease Availability: Sublet space that is available for sublease by a tenant to another lessee for a term equal to or shorter than that held by the tenant under its original lease with the landlord.
Under Construction: Buildings where actual ground breaking has occurred (site excavation or foundation poured) and construction is ongoing (not abandoned or discontinued) but for which a certificate of occupancy has not yet been issued.
New Supply: Total square footage with completed construction, where all that remains is the installation of tenant finishes.
Days on the Market (DOM): How many days an available industrial property has been on the market for.
GTA Central: Includes East York, Etobicoke, North York, Scarborough, Toronto and York.
GTA East: Includes Ajax, Oshawa, Pickering, and Whitby.
GTA North: Includes Aurora, Markham, Newmarket, Richmond Hill, Vaughan and Whitchurch-Stouffville.
GTA West: Includes Brampton, Burlington, Caledon, Halton Hills, Milton, Mississauga and Oakville.
11Research & Forecast Report | Q4 2016 | Greater Toronto Area / Industrial | Colliers International
Forecast Assumptions & TerminologyAbsorption was calculated using moving averages of historical absorption data and supplemented with incoming new speculative and build-to-suit developments.
Colliers International has adopted NAIOP’s terms and definitions which is reflected in this glossary and report.

Copyright © 2017 Colliers International.
The information contained herein has been obtained from sources deemed reliable. While every reasonable effort has been made to ensure its accuracy, we cannot guarantee it. No responsibility is assumed for any inaccuracies. Readers are encouraged to consult their professional advisors prior to acting on any of the material contained in this report.
About Colliers International Group Inc.
Colliers International Group Inc. is an industry leading global real estate services company with more than 16,000 skilled professionals operating in 66 countries. With an enterprising culture and significant employee ownership, Colliers professionals provide a full range of services to real estate occupiers, owners and investors worldwide. Services include strategic advice and execution for property sales, leasing and finance; global corporate solutions; property, facility and project management; workplace solutions; appraisal, valuation and tax consulting; customized research; and thought leadership consulting.
Colliers professionals think differently, share great ideas and offer thoughtful and innovative advice that help clients accelerate their success. Colliers has been ranked among the top 100 outsourcing firms by the International Association of Outsourcing Professionals’ Global Outsourcing for 11 consecutive years, more than any other real estate services firm.
colliers.com
554 offices in 66 countries on 6 continentsUnited States: 153 Canada: 34 Latin America: 24 Asia Pacific: 231 EMEA: 112
$2.5billion US* in annual revenue
2.0billion square feet under management
16,000professionals and staff
*Based on 2015 results
MARKET CONTACT:Peter GarriganManaging Director, Industrial Practice Group Toronto Region DIRECT: +1 (416) 620 [email protected]
REGIONAL AUTHORS:Shawn GilliganSenior Analyst | Toronto DIRECT: +1 (416) 607 [email protected]
Max Shapinko Market Intelligence Coordinator | Toronto DIRECT: +1 (416) 791 [email protected]
Shay RajaduraiMarket Intelligence Coordinator | Toronto DIRECT: +1 (416) 620 [email protected]
Colliers International | TorontoOne Queen Street East, Suite 2200Toronto, ON | Canada
+1 416 777 2200


