Page 1
TOTAL PRODUCTIVE MAINTENANCE PRACTICES AND
EQUIPMENT EFFECTIVENESS: A CASE STUDY OF BAMBURI
CEMENT LIMITED
KENNEDY NGUGI
A RESEARCH PROJECT SUBMITTED IN PARTIAL
FULFILLMENT OF THE REQUIREMENTS FOR THE AWARD
OF MASTER OF BUSINESS ADMINISTRATION (MBA)
DEGREE, SCHOOL OF BUSINESS, UNIVERSITY OF NAIROBI
OCTOBER, 2015
Page 2
ii
DECLARATION
This project is my original work and has not been submitted for an award of any
degree in any other university.
Signed………………………………………… Date………………………………….
Kennedy Ngugi
D61/61184/2011.
This project has been submitted for the examination with our approval as the
university supervisors.
Signed……………………………………………..Date………………………………
Dr. James Muranga Njihia,
Senior Lecturer, Department of Management Science,
University of Nairobi.
Signed……………………………………………..Date………………………………
Mr. Stephen Odock,
Lecturer, Department of Management Science,
University of Nairobi.
Page 3
iii
ACKNOWLEDGEMENTS
I would like to acknowledge and thank the Almighty God for His grace and for giving
me the time and strength to carry out this research.
I would also like to acknowledge my supervisor Mr. Stephen Odock who tirelessly
reviewed and critiqued the report during it preparation. Without his guidance and
valued support, this study would not have been completed.
Page 4
iv
DEDICATION
This project is dedicated to my mother, sisters, nieces and nephews.
Page 5
v
ABSTRACT
The reliable performance of equipment is critical for prompt product and service
delivery and eventual profitability of manufacturing organisations. In order to
enhance this reliable performance of equipment, these organisations have deployed
alternative models and strategies of equipment maintenance to complement the
traditional strategies of equipment maintenance. Total Productive Maintenance (TPM)
is one of the models of equipment maintenance whose implementation has been
proposed in order to increase and sustain the effectiveness of equipment. The
objective of this study was to explore the relationship between the implementation of
total productive maintenance (TPM) practices and the equipment effectiveness of a
typical large scale manufacturing concern in Kenya, taking the case of Bamburi
Cement Limited (BCL). The study used secondary data collected from the
organisation’s archived records. Inferential statistics was used to analyse and present
the data. The preliminary results of the analysis showed that the implementation of
TPM practices at BCL caused a significant increase in the equipment effectiveness in
the organisation. The analysis also showed that of the many TPM practices deployed,
autonomous maintenance of equipment by production operators played the biggest
role in increasing the equipment effectiveness. This study provides insights to
operations managers on the strategies of implementation of various TPM practices to
improve the effectiveness of their production equipment. In particular, the study
recommends the implementation of autonomous maintenance in manufacturing, by
ensuring that equipment operators are proficient in basic maintenance of their
equipment. In the current era of global competition, implementation of these TPM
practices will assist greatly in ensuring continued and sustainable production of
quality products and services.
Page 6
vi
TABLE OF CONTENTS
DECLARATION.......................................................................................................... ii
ACKNOWLEDGEMENTS ...................................................................................... iii
DEDICATION............................................................................................................. iv
ABSTRACT .................................................................................................................. v
TABLE OF CONTENTS ........................................................................................... vi
LIST OF TABLES ...................................................................................................... ix
LIST OF FIGURES ..................................................................................................... x
ACRONYMS AND ABBREVIATIONS ................................................................... xi
CHAPTER ONE: INTRODUCTION ........................................................................ 1
1.1 Background of the Study ..................................................................................... 1
1.1.1 Total Productive Maintenance .................................................................... 2
1.1.2 Equipment Effectiveness ............................................................................ 4
1.1.3 Total Productive Maintenance and Equipment Effectiveness .................... 6
1.1.4 Bamburi Cement Limited ........................................................................... 7
1.2 Research Problem ................................................................................................ 9
1.3 Research Objective ............................................................................................ 12
1.4 Value of the Study ............................................................................................. 12
CHAPTER TWO: LITERATURE REVIEW ......................................................... 13
2.1 Introduction ........................................................................................................ 13
2.2 Theoretical Foundation of Total Productive Maintenance ................................ 13
2.3 Strategies of Implementation of Total Productive Maintenance ....................... 15
Page 7
vii
2.3.1 Human-oriented Strategy .......................................................................... 15
2.3.2 Process-oriented Strategy.......................................................................... 17
2.4 Total Productive Maintenance Practices ............................................................ 18
2.4.1 New Equipment Management................................................................... 19
2.4.2 Elimination of Sources of Lost Equipment Time ..................................... 20
2.4.3 Autonomous Maintenance ........................................................................ 20
2.4.4 Planned Maintenance ................................................................................ 21
2.5 Empirical Review............................................................................................... 22
2.6 Conceptual Framework ...................................................................................... 25
CHAPTER THREE: RESEARCH METHODOLOGY ........................................ 26
3.1 Introduction ........................................................................................................ 26
3.2 Research Design................................................................................................. 26
3.3 Case selection..................................................................................................... 27
3.4 Operationalization of Study Variables ............................................................... 28
3.5 Data Collection .................................................................................................. 30
3.6 Data Analysis ..................................................................................................... 31
CHAPTER FOUR: DATA ANALYSIS, RESULTS AND DISCUSSION ........... 33
4.1 Introduction ........................................................................................................ 33
4.2 Implementation of TPM Practices and Equipment Effectiveness ..................... 33
4.2.1 Nature and Degree of Relationship between TPM Practices and
Equipment Effectiveness ......................................................................................... 35
4.2.2 TPM Practices and Availability Rate ........................................................ 37
4.2.3 TPM Practices and Performance Rate ...................................................... 41
4.2.4 TPM Practices and Quality Rate ............................................................... 43
4.2.5 TPM Practices and OEE Rate ................................................................... 46
Page 8
viii
CHAPTER FIVE: SUMMARY, CONCLUSION AND RECOMMENDATIONS
...................................................................................................................................... 50
5.1 Introduction ........................................................................................................ 50
5.2 Summary of the Findings of the Study .............................................................. 50
5.3 Conclusions ........................................................................................................ 52
5.4 Recommendations .............................................................................................. 53
5.5 Limitations of the Study..................................................................................... 54
5.6 Suggestions for Further Research ...................................................................... 55
REFERENCES ........................................................................................................... 56
APPENDICES ............................................................................................................ 61
APPENDIX 1: FORMULAE FOR CALCULATING EQUIPMENT
EFFECTIVENESS ................................................................................................... 61
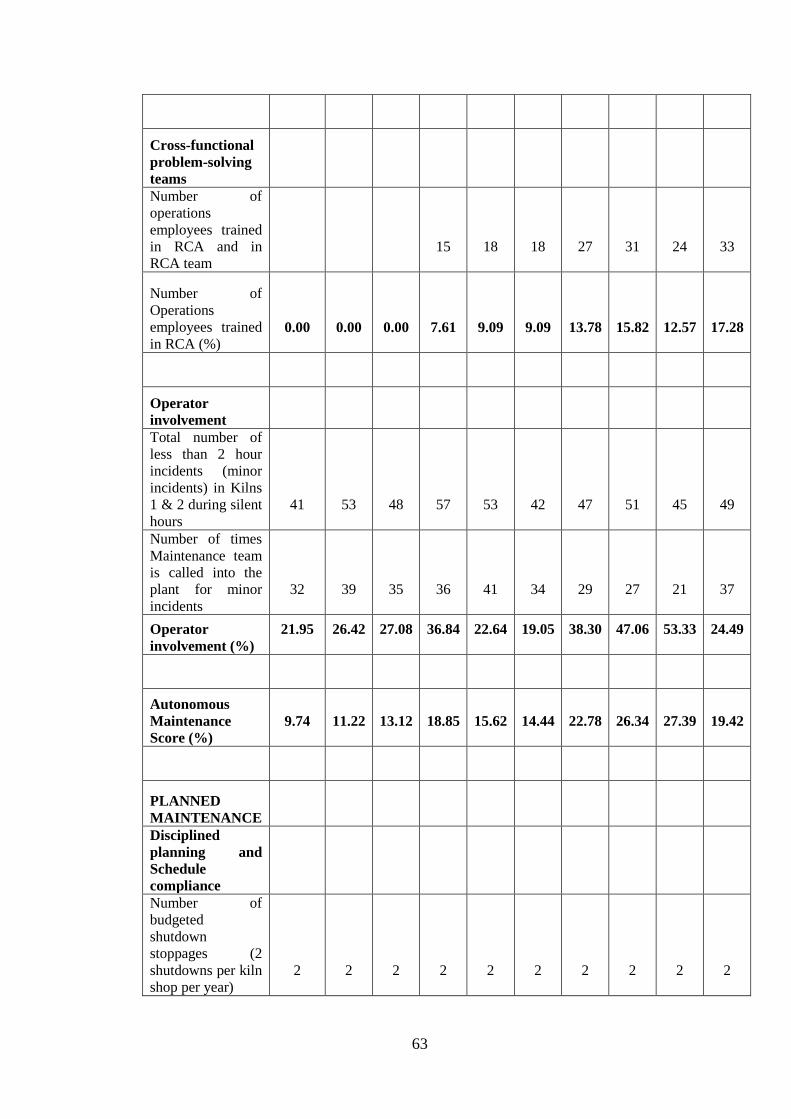
APPENDIX 2: DATA COLLECTION TABLE...................................................... 62
Page 9
ix
LIST OF TABLES
Table 4.1: TPM Practices and Equipment Effectiveness Data .................................... 34
Table 4.2 Correlations between TPM Practices and the Availability, Performance,
Quality and OEE Rates of BCL ................................................................. 36
Table 4.3 Regression results of TPM Practices and the Availability Rate of BCL ..... 38
Table 4.4 Regression results of TPM Practices and the Performance Rate of BCL .... 41
Table 4.5 Regression results of TPM Practices and the Quality Rate of BCL ............ 44
Table 4.6 Regression results of TPM Practices and the OEE Rate of BCL ................ 47
Page 10
x
LIST OF FIGURES
Figure 2.1: Conceptual Framework of the study ......................................................... 25
Page 11
xi
ACRONYMS AND ABBREVIATIONS
BCL Bamburi Cement Limited
CMMS Computerised Maintenance Management System
EEM Early Equipment Management
GDP Gross Domestic Product rate
ICR International Cement Review
IMF International Monetary Fund
JIPM Japan Institute of Plant Maintenance
MI Maintainability Improvement
MP Manufacturing Performance
MTPA Million tonnes per year
OEE Overall equipment effectiveness
PM Planned Maintenance
RCA Root Cause Analysis
SIB Standard Investment Bank
SSA Sub Saharan Africa
SQRT Square Root
TPM Total Productive Maintenance
WCM World Class Manufacturing
Page 12
1
CHAPTER ONE: INTRODUCTION
1.1 Background of the Study
The efficiency and effectiveness of equipment plays a dominant role in modern
manufacturing industry in determining the performance of the organization’s
production function as well as the level of success achieved in the organization. The
performance of the production function is diminished by inefficient equipment that
generate losses occasioned by equipment failure, reduced performance and defective
products (Seng, Jantan, & Ramayah, 2005). To increase manufacturing productivity,
production improvement strategies are employed that aim to minimize input and
maximize output (Rajan & Sajumon, 2013). Total productive maintenance (TPM) is
an operational strategy that aims to overcome the production losses caused by
equipment inefficiency (Seng et al., 2005). TPM improves production output by
increasing not just the sheer quantity produced, but also by improving quality,
reducing costs and meeting delivery dates while improving safety and health
conditions and the working environment in general (Nakajima, 1988).
Plant maintenance is an important service function of an efficient production system.
It helps in maintaining and increasing the operational efficiency of plant facilities by
decreasing the number, frequency, and severity of equipment breakdowns thereby
reducing operating costs and increasing the effectiveness of production (Sethia,
Shende, & Dange, 2014). TPM is a continuous improvement process of equipment
maintenance whose goal is to reduce emergency and unscheduled maintenance of
equipment by empowering operators to carry out basic routine maintenance of their
equipment (Jain, Bhatti, & Singh, 2014). By promoting the optimal utilization of
organisational resources such as machinery, men, and materials, TPM meets
Page 13
2
maintenance needs by keeping equipment in top condition so as to avoid breakdowns
and delays in production (Sethia et al., 2014).
The Kenyan cement industry has seen a steady increase in production capacity driven
by the entry of new cement producers into the market and extensive capacity
expansion by existing players in response to increasing competition. This has led to
consistent oversupply of cement in the market (Faida Investment Bank, 2014). The
challenges of dampened profitability margins caused by increased competition among
the existing cement producers as well as the threat of competition from cheaper
imports has increased the need for cost containment through increased productivity
and more efficient operations to ensure sustainable world class competitiveness
(Molonket, Ombuki, & Wawire, 2014). To increase productivity, organizations
develop techniques and maintenance strategies that focus on the prevention of
equipment failures and increasing equipment availability for operation (Bartz, Siluk,
& Bartz, 2014). Among these strategies and techniques, preventive maintenance,
predictive maintenance, total productive maintenance (TPM) and more recently, the
reliability-centered maintenance stand out (Khalil, Saad, & Gindy, 2009).
1.1.1 Total Productive Maintenance
Total productive maintenance (TPM) is a process of maintenance management that
empowers the organization with a progressive, continuous philosophy of enabling all
manpower resources to work together to accomplish the mutual goal of manufacturing
efficiency (Gupta, Tewari, & Sharma, 2006). The goal of TPM is to increase the
productivity of plant and equipment through the involvement of all employees in the
organization in the various departments like production, maintenance, technical
Page 14
3
services, and stores (Wang, 2005). TPM was introduced into manufacturing in order
to avoid wastages in a quickly changing economic environment, produce goods
without reducing product quality, reduce costs and produce a low batch quantity at the
earliest possible time (Hangad & Kumar, 2013).
TPM is a maintenance program philosophy which is similar in nature to total quality
management (TQM) in several aspects, including the total commitment of upper-level
management to the programme, empowerment of employees to take initiatives and
corrective actions, and the need for continuity and long-term strategy. With the
implementation of TPM, maintenance is no longer the necessary evil, but a vitally
important part of the business. The general vision of TPM eliminates any “conflict of
interest” between production and maintenance departments (Chan, 2005).
The goal of Total Productive Maintenance (TPM) is to increase the productivity of
plants and equipment through the involvement of all employees in the organization in
the various departments like production, maintenance, technical services, and stores
(Wang, 2005). TPM involves maximising the utilisation of equipment to establish a
comprehensive approach towards maintenance of equipment during the entire product
life span, involving all employees from top management to shop-floor workers,
promoting preventive maintenance through staff motivation and increasing
productivity while, at the same time, improving employee morale and job satisfaction
(Sharma, Kumar, & Kumar, 2006).
TPM describes a synergistic relationship among all organizational functions, but
particularly between production and maintenance, for the continuous improvement of
Page 15
4
product quality, operational efficiency, productivity and safety. TPM brings
maintenance into focus as a necessary and vitally important part of the business. It is
no longer regarded as a non-profit activity. TPM focuses upon the entire organization
for the systematic identification and elimination of wastes like planned and unplanned
downtime, inefficient operation cycle time, and quality defects in manufacturing and
related processes (Sharma et al., 2006).
With competition in manufacturing industries rising relentlessly, TPM has proved to
be the maintenance improvement philosophy preventing the failure of an organization
(Eti, Ogaji, & Probert, 2006). Wakjira and Singh (2012) argue that today, an effective
TPM strategy and programs are needed, which can cope with the dynamic needs and
discover the hidden but unused or underutilized resources (human brainpower, man-
hours, machine-hours). A well conceived TPM implementation program will not only
improve the equipment efficiency and effectiveness but also bring appreciable
improvements in other areas of the manufacturing enterprise.
1.1.2 Equipment Effectiveness
Organizations should implement good equipment maintenance systems in order to
continuously improve both productivity and product quality due to customer
requirement of good quality product, less product delivery time and low production
costs (Jain et al., 2014). To operate efficiently and effectively, manufacturing sectors
need to ensure no disruption of production due to equipment breakdown, stoppages
and failure (Gupta & Garg, 2012). The most efficient way to maximize equipment
output is to eliminate the major causes of losses that prevent the equipment from
being effective (Wang, 2005).
Page 16
5
There are six big time losses encountered in industrial operations: equipment failure,
setup and adjustment, idling and minor stoppages, reduced speed, defects in process,
and reduced yield. Equipment failure and setup and adjustment are categorized as
downtime time loss, and result in the reduction of availability of the equipment; idling
and minor stoppages and reduced speed are categorized as speed loss, thus reducing
the performance of the equipment; defects in process and reduced yields are
considered as defect losses and result in reduction of the quality rate of the equipment
(Nakajima, 1988).
The quantification of these accumulations of waste in time and its comparison to the
total available time can give the production and the maintenance management
personnel a general view of the actual performance of the plant, which can help them
to focus the improvement on the bigger loss (Kocher, Kumar, Singh, & Dhillon,
2012). Nakajima (1988) proposes that the six big losses encountered in manufacturing
be combined into one measure of overall equipment effectiveness (OEE). OEE is a
measure of total equipment performance, that is, the degree to which the equipment is
doing what it is supposed to do (Williamson, 2006). OEE is calculated by obtaining
the product of the availability of the equipment, performance efficiency of the process
and the rate of quality products. An OEE of 85 percent is considered as being world
class and a benchmark to be established for a typical manufacturing concern
(Nakajima, 1988).
Page 17
6
1.1.3 Total Productive Maintenance and Equipment Effectiveness
Total Productive Maintenance is a strategy used to maintain equipment in optimum
condition in order to prevent unexpected breakdown, speed losses, and quality defects
occurring from process activities. The objective of TPM implementation is to create a
sustainable competitive advantage of an organization by increasing manufacturing
productivity and equipment efficiency (Gupta et al., 2006). It is a manufacturing
program designed primarily to maximize equipment effectiveness throughout its
entire life through the participation and motivation of the entire work force
(Nakajima, 1998).
Overall equipment effectiveness (OEE) is a metric for evaluating the progress of
implementation of TPM (Nakajima, 1988). It is a framework for measuring the
efficiency and effectiveness of a process, by breaking it down into three constituent
components; availability, performance and quality. OEE is a metric for defining
equipment effectiveness in a TPM program (Vorne, 2013). The overall goal of TPM
is to raise the overall equipment effectiveness (OEE) (Huang et al., 2002). TPM
employs OEE as a quantitative metric for measuring the performance of a productive
system (Huang et al., 2002). OEE is the core metric for measuring the success of a
TPM implementation program (Jeong & Phillips, 2001).
TPM practices aim to make the improvement of OEE and labor productivity, and
eventually to secure zero equipment failure, zero defects and rework and zero
industrial accidents (Shirose, 1999). The strategic objective of TPM implementations
is to reduce the occurrence of unexpected machine breakdowns that disrupt
production and lead to losses, which, according to Gosavi (2006), can exceed millions
of dollars annually. TPM practices enable improvement of the performance of
Page 18
7
production facilities by continuously and systematically addressing the sources of
major losses and wastes inherent in the production systems (Gupta, Sonwalkar, &
Chitale, 2001). The OEE measure is central to the formulation and execution of a
TPM improvement strategy (Ljungberg, 1998). TPM has the standards of 90 per cent
availability rate, 95 percent performance efficiency rate and 99 percent rate of quality.
This results in an OEE measure of 85 percent (Sohal, Olhager, O’Neill, & Prajogo,
2010).
TPM is a strategic change management approach that has a considerable impact on
the internal efficiency of manufacturing organization by increasing the effectiveness
of the production environment, especially through increasing the effectiveness of
equipments (Sharma, Gera, Kumar, Chaudhary, & Gupta, 2012). Its implementation
can significantly contribute towards improvement in organizational behavior in the
manufacturing enterprises leading to world class competitiveness (Ahuja, Khamba,&
Choudhary, 2006).
1.1.4 Bamburi Cement Limited
Bamburi Cement Limited (BCL) was founded by Felix Mandl (a director of Cementia
Holdings A.G. Zurich) in 1951. Cementia later partnered with Blue Circle PLC (UK).
Cementia was acquired by Lafarge in 1989, making Lafarge an equal shareholder
with Blue Circle in BCL. In 2001, Lafarge acquired Blue Circle to become BCL’s
principle shareholder (Collomb, Brenneisen, Groom, & Hillenmeyer, 2004). In July
2015, Lafarge merged with Holcim to form LafargeHolcim, the biggest producer of
building materials in the world (International Cement Review, 2015).
Page 19
8
According to Ecobank Research (2014), cement producers in Sub Saharan Africa
(SSA) are facing serious challenges to their competitiveness and commercial viability,
the most significant being the risk of overcapacity following the wave of investment
in new plants expected over the next five years. The sector is also vulnerable to rising
production costs, which are among the highest in the world. Given Africa’s poorly
developed power networks, cement companies depend on costly fuel imports for
power generation, exposing the sector to volatility in international energy prices. High
energy costs reduce the competitiveness of locally produced cement, especially when
compared with cheaper imports from Asia.
By early 1995, Kenya’s economy became substantially liberalised, bringing with it
new opportunities and new threats, particularly in the form of imports to threaten the
domestic market. It was the realisation in 1993/4 that imports were going to pose a
serious threat to the future profitability of BCL that drove many of the actions that
took place in BCL from 1995 onwards. Although BCL was profitable, and looked like
becoming more so over the next few years, it was evident that, in the long run, the
company’s very existence would be threatened unless its cost base was substantially
reduced (Collomb et al., 2004).
The challenges of dampened profitability margins caused by fierce competition
among the existing cement producers in the region as well as the threat of competition
from cheaper imports has increased the need for cost containment through increased
productivity and more efficient operations to ensure sustainable world class
competitiveness (Molonket et al., 2014). To this end, organizations have developed
techniques and maintenance strategies that focus on the prevention of equipment
failures, and increasing equipment availability for operation and reliability when in
Page 20
9
use (Bartz, Siluk, & Bartz, 2014). Among these strategies and techniques, preventive
maintenance, predictive maintenance, total productive maintenance (TPM) and more
recently, the reliability-centered maintenance stand out (Khalil et al., 2009).
BCL’s management then started preparing the company for adapting to a continually
changing environment and to increasing labour costs. By introducing new working
practices, streamlining operations, re-training managers and instilling the concept of
delegation, BCL was able to halve its workforce, reduce overtime levels, achieve
safety records and increase running times, efficiencies and output (Collomb et al.,
2004).
1.2 Research Problem
The main objective of total productive maintenance (TPM) is to enhance the overall
effectiveness of factory equipment, and the provision of an optimal group
organization approach for the accomplishment of system maintenance practices. In
manufacturing industries, TPM is one of the very important factory maintenance
methodologies that are used throughout a product life cycle that try to optimize the
effective use of production installations (Wang, 2005). This effectiveness can be
measured in terms of the overall equipment effectiveness (OEE), which is a function
of equipment availability, performance efficiency, and quality rate (Huang et al.,
2002).
According to Standard Investment Bank (2013), excess capacity in the East African
cement sector is likely to suppress any price increase, and the cement producing
companies will have to continue absorbing increasing production costs. To deal with
the risk of increased local and global competition, BCL has been forced to radically
Page 21
10
rethink its strategy and focus on reduction of operational costs (Molonket et al.,
2014). Faced with the phenomenon of globalization, equipment maintenance becomes
focused under the vision of quality and productivity management. In that sense, the
adoption of a model of strategic maintenance management such as TPM has been
increasingly accepted in industrial organizations (Bartz et al., 2014).
Past studies have been conducted on the effects of TPM practices on equipment
effectiveness. For instance, Sharma et al. (2006) conducted a case study to establish
the various issues related with TPM implementation in a semi-automated cell in an
Indian manufacturing firm. They found that TPM not only leads to an increase in
efficiency and effectiveness of manufacturing systems, measured in terms of OEE, by
reducing the wastages but also prepares the plant to meet the challenges put forward
by globally competing economies to achieve world class manufacturing (WCM)
status.
Wakjira and Singh (2012) conducted a study to evaluate the contributions of TPM
initiatives towards improving manufacturing performance in the Ethiopian malt
manufacturing industry. Their study established that focused TPM implementation
can strategically contribute towards realization of significant manufacturing
performance enhancements. Bartz et al. (2014) conducted a study on the
implementation of a maintenance management model based on (TPM) in a production
line of a metallurgical company in Brazil. They observed that after the
implementation of TPM, there was a significant improvement of the performance
indicators of the production lines. They thus concluded that the TPM assists in
improving industrial performance and competitiveness of the production line studied.
Page 22
11
Some local researchers have investigated TPM practices in Kenyan firms, but none on
the effects of TPM on equipment effectiveness. Induswe (2013) for example
investigated the challenges, success factors and benefits of TPM implementation in
large manufacturing firms in Kenya. Ateka (2013) examined the adoption of TPM
practices in large manufacturing firms located in Mombasa County. Matuga (2013)
conducted a study to establish the contribution of TPM strategy on Unilever Kenya’s
competitive advantage.
The researcher is not aware of any studies that have focused on the effects of the
implementation of TPM practices on equipment effectiveness of the Kenyan
manufacturing industry and specifically in the Kenyan cement industry. This is
significant because the cement industry in Kenya is facing a very challenging future
due to increased competition from emerging local manufacturers and from imports
SIB (2013). This study made an attempt to fill that gap.
Eti et al. (2006) have argued that with competition in manufacturing industries rising
relentlessly, TPM has proved to be the maintenance improvement philosophy
preventing the failure of organizations. The researcher therefore studied the effects of
the implementation of TPM practices on equipment effectiveness in the Kenyan
cement industry, taking the case of Bamburi Cement Limited. This leads to the
research question; does the implementation of TPM practices affect the equipment
effectiveness of a manufacturing firm?
Page 23
12
1.3 Research Objective
The objective of the study was to establish the relationship between the
implementation of TPM practices and the availability rate, performance rate, quality
rate and the overall equipment effectiveness (OEE) rate at Bamburi Cement Limited
(BCL).
1.4 Value of the Study
This study is valuable to researchers, scholars, managers and policy makers both in
the private and public sectors. To the researchers and scholars, the study highlights
the relationship between the implementation of the various TPM practices and the
overall equipment effectiveness of a Kenyan cement manufacturing enterprise.
The study is useful to professionals and managers in Kenyan cement companies in
highlighting the benefits in equipment effectiveness occasioned by adoption of TPM
practices and the success factors required for successful TPM implementation, which
can help them justify the need for implementing TPM practices in their respective
organisations, and improve the equipment effectiveness of these organizations.
To policy makers it is hoped the study provides insights into ways of increasing
industrial productivity and competitiveness to enable them formulate policies that
may help create maximum value from their industries by using their resources
creatively to increase performance and guarantee survival in the face of increasing
global competition.
Page 24
13
CHAPTER TWO: LITERATURE REVIEW
2.1 Introduction
This chapter presents the literature review. First, the theoretical foundation of the
study is discussed. The strategies of implementation of TPM are then discussed,
followed by the equipment maintenance practices that comprise the implementation of
a TPM program. A summary of the empirical review of the relationship between TPM
and operational performance is then presented. Finally, the conceptual framework that
was adopted by the study is presented.
2.2 Theoretical Foundation of Total Productive Maintenance
Maintenance of facilities and equipment in good working condition is essential to the
attainment of the specified level of quality and reliability and efficient working.
Maintenance is defined as activities that retain the performance of equipment. The
number, frequency, and severity of equipment breakdowns can be decreased with
proper maintenance. Maintenance includes repairing current deficiencies in
equipment performance and taking action to prevent future problems. The major
categories of maintenance include breakdown maintenance (where people wait until
equipment fails before repairing it), preventive maintenance (PM) (where a system is
created for diagnosing equipment condition and taking action to prolong the service
life of the equipment), corrective maintenance (where equipment with design
weaknesses are redesigned to improve reliability or maintainability) and maintenance
prevention (MP) (which involves design of new equipment while focusing on
improving reliability) (Sethia et al., 2014).
Page 25
14
Preventive maintenance is the daily maintenance of equipment that involves cleaning,
inspection, oiling and retightening, done in order to retain the healthy condition of
equipment and prevent failure through the prevention of deterioration, periodic
inspection or equipment condition diagnosis, to measure deterioration. Maintenance
prevention is the design of new equipment that involves studying the weaknesses of
current equipment and incorporating in the new equipment failure prevention
techniques while enabling easier maintenance and prevention of product defects.
TPM is an equipment maintenance philosophy where preventive maintenance is
performed by the equipment operators in a practice called autonomous maintenance
and maintenance prevention is done by a dedicated maintenance crew to improve
equipment reliability (Venkatesh, 2007). The objective of implementing TPM in
manufacturing is to eliminate losses and wastes by ensuring employee participation in
equipment maintenance (Vorne, 2013). The underlying TPM concept is that if plant
machinery is maintained properly, there will see a sharp decline in machine
breakdowns, safety and quality problems (Sethia et al., 2014).
TPM consists of three words: total; this signifies to consider every aspect of
equipment maintenance and involving everybody from top to bottom, productive;
emphasis is on trying to do maintenance while production goes on and minimize
troubles for production, maintenance; means keeping equipment in good condition
autonomously by production operators – repair, clean, grease, and accept to spend
necessary time on them (Ahuja & Khamba, 2007). TPM is “a structured equipment-
centric continuous improvement process that strives to optimize production
effectiveness by identifying and eliminating equipment and production efficiency
Page 26
15
losses throughout the production system life cycle through active team based
participation of employees across all levels of the operational hierarchy” (Pomorski,
2004, p. 6).
TPM implementation involves the adoption of life cycle approach for improving the
overall equipment effectiveness (OEE) of production equipment, improvement of
equipment productivity by highly motivated workers through job enlargement, and
the use of voluntary small group activities for identifying the causes of failure, and
performing equipment modifications to prevent these failures (Venkatesh, 2007).
TPM emphasizes proactive and preventative maintenance to maximize the OEE of
equipment. The implementation of a TPM program creates a shared responsibility for
equipment that encourages greater involvement by equipment operators in preventive
maintenance (Vorne, 2013).
2.3 Strategies of Implementation of Total Productive Maintenance
In order to achieve a successful implementation of TPM in a manufacturing
organization, two approaches or strategies are employed; Human-oriented strategy
and Process-oriented Strategy (Varotaria & Barelwala, 2014). Human-oriented
strategy factors are important while formulating the foundation prior to TPM
implementation; whereas the process oriented strategy factors are important in the
subsequent phase of achieving a successful TPM implementation within an
organization (Pathak, 2015).
2.3.1 Human-oriented Strategy
Human-oriented strategies are strategies that actively involve the administrative
application of management methods in implementing TPM practices in order to
Page 27
16
achieve a high implementation of TPM (Varotaria & Barelwala, 2014). The
application of human oriented strategy involves three important aspects; Top
management commitment and leadership, Total Employee Involvement and Cultural
transformation (Pathak, 2015).
Top management commitment and leadership is crucial to the successful
implementation of TPM (Tsang & Chan, 2000). The top management establishes a
strategic direction for TPM implementation by formulating a master plan for effective
TPM implementation within the organization, enabling cultural transformation,
communicating TPM goals and objectives throughout the organization, providing
sufficient resources for influencing process improvements, providing appropriate
training and education for the workforce to develop TPM related competencies,
encouraging cross functional working within the organization by enhancing inter-
departmental synergy, and promoting proactive maintenance initiatives (Pathak,
2015).
Total employee involvement is achieved when all employees to have a common
understanding of the basic principles of TPM. Shop floor operators have the most
hands-on experience with the machines they operate daily. In order to achieve
successful autonomous maintenance by the shop floor operators, high levels of
maintenance awareness and simple routine maintenance tasks are integrated into their
daily duties (Varotaria & Barelwala, 2014).
The TPM implementation process requires a radical transformation in the
organization’s culture to enhance total employee involvement towards manufacturing
Page 28
17
performance enhancement. The top management has to make concerted efforts to
enhance motivation within the organization by creating awareness about the true
potential of TPM philosophy and effectively communicating to the employees the
direct benefits of TPM implementation. Organizations should ensure buy-in from all
employees during the planning and execution phases of TPM implementation by
addressing employees’ behavioural barriers towards TPM and developing a
consciousness that TPM implementation will generate additional skill sets and
competencies thereby making the employees more valuable to the organization
(Pathak, 2015).
2.3.2 Process-oriented Strategy
Process-oriented Strategy includes all kinds of technical approaches to maximize the
overall equipment efficiency by quantitatively, increasing the equipment availability
and qualitatively, eliminating all production losses resulting from inefficient
equipment (Varotaria & Barelwala, 2014). Process-oriented strategy factors include
conventional and proactive maintenance strategies, training and education, and failure
prevention and focused production system enhancement (Pathak, 2015).
Majority of the equipment failures can be attributed to the lack of standard operating
procedures for business functions including production systems. It is therefore
imperative to develop standard work practices and safe operating procedures to be
implemented by a competent and motivated workforce. Processes and procedures for
collecting and analyzing data associated with manufacturing performance should be
developed. To enhance manufacturing performance, the organization should
Page 29
18
endeavour to influence continuous improvements in the production systems (Pathak,
2015).
The ability of the organization to implement TPM practices successfully depends on
the competencies of the workforce. To implement TPM, the entire workforce in the
organization needs to acquire new knowledge, skill and abilities related to TPM.
Employee training encompasses systematic development of competencies, knowledge
and mindset essential for task execution and work performance (Varotaria &
Barelwala, 2014). They should develop and implement a loss-elimination process that
involves identifying failures and analyzing causes, setting improvements to eliminate
the failures, and confirming and consolidating the results (Seng et al., 2005).
2.4 Total Productive Maintenance Practices
The aim of TPM is to increase the availability and effectiveness of existing equipment
in a given situation, through the effort of minimizing input (improving and
maintaining equipment at optimal level to reduce its life cycle cost) and the
investment in human resources which results in better hardware utilization (Afefy,
2013). TPM maximizes the effectiveness of equipment through the use of autonomous
maintenance by production operators and the use of small group activities to improve
equipment reliability, maintainability and productivity (Sharma et al., 2006).
There is a complexity and divergence of TPM programs adopted throughout industry
(Bamber et al., 1999). Infact, Aspinwall and Elgharib (2013) argue that there is no
single correct method for the implementation of a TPM program. There are many
frameworks for implementing TPM in different organizations having varying
Page 30
19
environments for garnering suitable manufacturing competencies in order to achieve
organizational goals and objectives (Ireland & Dale, 2001).
TPM provides a comprehensive company-wide approach to maintenance
management, which can be divided into long-term and short-term TPM practices or
elements. Long-term TPM efforts focus on new equipment management and
elimination of sources of lost equipment time. Short term TPM activities include an
autonomous maintenance program for the production department and a planned
maintenance program for the maintenance department (McKone et al., 2001).
2.4.1 New Equipment Management
New equipment management is a system whereby shop-floor personnel participate in
the concept and design phase of new equipment in order to develop equipment that
requires less maintenance, and is more easily maintained when maintenance is
required (Japan Institute of Plant Maintenance, 1996). New equipment management
variables assess how the plant directs practical knowledge and understanding of
manufacturing equipment gained through TPM towards improving the design of new
equipment, so as to ensure that new equipment reaches planned performance levels
much faster due to fewer start up issues (Venkatesh, 2007).
New equipment management entails design activities that are carried out during the
planning and construction of new equipment, that impart to the equipment high
degrees of reliability, maintainability, economy, operability, safety, and flexibility,
while considering maintenance information and new technologies, and to thereby
reduce maintenance expenses and deterioration losses (Pomorski, 2004). Sethia et al.,
Page 31
20
(2014) describe new equipment management as a maintenance strategy which
involves design of new equipment while focusing on improving reliability and refer to
the practice as maintenance prevention (MP).
2.4.2 Elimination of Sources of Lost Equipment Time
Lost equipment time variables assess the incorporation of error detection and
prevention strategies into the production process and the creation of small groups of
employees to work together proactively to achieve regular, incremental improvements
in equipment operation (Vorne, 2013). In order to eliminate the sources of lost
equipment time, root cause analysis is applied to eliminate recurring sources of
equipment failures and quality defects.
To ensure elimination of sources of lost equipment time, the organization targets
quality issues with improvement projects focused on removing root sources of
defects. The practice reduces maintenance costs by catching equipment defects early.
Recurring problems are identified and resolved by cross-functional teams. The
practices combine the collective talents of a company to create an engine for
continuous improvement (Vorne, 2013). Manufacturing organizations should make
intensive efforts to improve the performance of production systems by developing
failure prevention initiatives and enhancing the focus on manufacturing system
improvements (Pathak, 2015).
2.4.3 Autonomous Maintenance
Autonomous Maintenance places responsibility for routine maintenance, such as
cleaning, lubricating, and inspection, in the hands of operators. More responsibility
Page 32
21
for maintenance gives operators greater “ownership” of their equipment, increases
operators’ knowledge of their equipment, ensures equipment is well-cleaned and
lubricated and helps identify emergent issues before they become failures. It also frees
maintenance personnel for higher-level maintenance tasks (Venkatesh, 2007).
There are four elements of autonomous maintenance: focus on housekeeping on the
production line, cross-training of personnel, creation and utilization of teams of
production and maintenance personnel, and operator involvement in the maintenance
delivery system (McKone et al., 2001). Housekeeping of the production line involves
creation of a work environment that is clean and well-organized. It consists of the five
elements of sort (eliminate anything that is not truly needed in the work area), set in
order (organize the remaining items), shine (clean and inspect the work area),
standardize (create standards for performing the above three activities) and sustain
(ensure the standards are regularly applied) (Vorne, 2013).
Cross-training of personnel ensures operators develop skills to routinely maintain
equipment and identify emerging problems and that maintenance personnel learn
techniques for proactive and preventive maintenance. Creation and utilization of
teams of production and maintenance personnel ensures employees work together
proactively to achieve regular, incremental improvements in equipment operation
(Vorne, 2013).
2.4.4 Planned Maintenance
Planned Maintenance (PM) is a system where maintenance tasks and equipment
stoppages are scheduled based on predicted and/or measured failure rates. PM efforts
Page 33
22
are evolved from a reactive to a proactive method. The objectives of PM are to
achieve and sustain availability of machines, optimize maintenance cost, reduces
spares inventory and improve reliability and maintainability of machines (Venkatesh,
2007).
Implementation of a PM system reduces instances of unplanned down time
significantly. It enables equipment maintenance to be planned for periods when the
equipment is not scheduled for production and reduces inventory by enabling better
control of wear-prone and failure-prone parts (Vorne, 2013). JIPM (1996) suggest
three elements of planned maintenance: disciplined planning of maintenance tasks,
information tracking of equipment and process conditions, and compliance to the
maintenance schedule.
2.5 Empirical Review
Several studies have been conducted that seek to establish the relationship between
the implementation of TPM practices in an organization and the operational
performance of the organization. According to Venkatesh (2007), the direct benefits
of TPM implementation include increase in productivity and overall equipment
efficiency (OEE), reduction in customer complaints, reduction in the manufacturing
cost by 30%, satisfying the customers’ needs by 100 % (delivering the right quantity
at the right time, in the required quality) and reduced accidents.
Sharma et al. (2006) conducted a case study to examine the need to develop, practice
and implement such maintenance practices, which not only reduce sudden sporadic
failures in semi-automated cells but also reduce both operation and maintenance costs
Page 34
23
in a semi-automated cell in an Indian manufacturing firm. The findings indicate that
TPM leads to increase in efficiency and effectiveness of manufacturing systems,
measured in terms of OEE index, by reducing the wastages. The availability of the
cell improved by 17 percent, while performance efficiency improved by 8 percent and
quality rate by 20 percent. The OEE measure had increased from 39 to 69 percent.
Ahuja and Khamba (2007) established through a case study of the Indian
manufacturing industry that there has been significant improvement in overall
equipment effectiveness of all the production facilities as a result of TPM initiatives.
The benefits realized through effective TPM implementation program included OEE
improvement by 14 - 45 per cent, reduction in customer rejections by 50-75 per cent,
reduction in accidents by 90-98 per cent, reduction in maintenance cost by 18-45 per
cent, reduction in defects and rework by 65-80 per cent and a reduction in
breakdowns by 65-78 per cent.
Bartz et al. (2013) conducted a study of a maintenance management model based on
TPM in a production line of a metallurgical company in Brazil, with high-precision
equipment requiring effective maintenance to maintain the quality of the production
process. The study concluded that TPM assists in improving industrial performance
and competitiveness of the production line studied. It was observed that the rate of
production efficiency improved from 79.25 to 83.72 percent, and the rate of rework
was reduced from 4.6 to 2.3 percent.
Paropate and Sambhe (2013) performed a study on the implementation of TPM in a
midsized cotton spinning plant in India. The study found that TPM enables
Page 35
24
improvement in the availability, performance efficiency and the quality rate of the
carding machine, resulting in improvement of the overall equipment effectiveness of
the equipment. The values for availability, quality rates, performance efficiency and
overall equipment effectiveness before TPM implementation were 89.6832%,
79.29%, 96.4783% and 68.9866% respectively and the values after TPM
implementation were 91.96%, 79.758%, 97.177% and 71.465% respectively.
Some local researchers have investigated TPM practices in Kenyan firms, but none on
the effects of TPM on equipment effectiveness. Ateka (2013) for example conducted
a study to examine the adoption of TPM practices in large manufacturing firms
located in Mombasa County. His study identified increased quality and improved
productivity as the key benefits resulting from TPM implementation. The study
results also showed that the most important critical success factor of TPM is co-
operation and involvement of both the operators and the maintenance workers.
Induswe (2013) conducted a study to investigate the challenges, success factors and
benefits of TPM implementation in large manufacturing firms in Kenya. His study
found the benefits of implementing TPM to be elimination of waste and losses,
reduction of equipment breakdown, reduction of maintenance costs, optimization of
equipment reliability, improvement of operator skills and boosting of the morale of
employees.
Matuga (2013) conducted a study to establish the contribution of total productive
maintenance strategy to the competitive advantage of Unilever Kenya Limited. Her
study found that increased profit margins, reduced accidents in the factory, reduced
customer complaints resulting from better quality products, reduced machine
Page 36
25
Independent Variables Dependent Variables
breakdown, reduction in maintenance costs and maintenance workforce costs through
reduction of overtime labour cost, better planning and scheduling, improved
equipment efficiency and availability, employee recognition and empowerment
through improved capabilities and competencies, better relationships between
operators and maintenance personnel and better competitive edge in global arena were
the contributions that Total Productive Maintenance strategy has brought to Unilever
Kenya Limited.
2.6 Conceptual Framework
This study attempts to investigate the impact of implementation of Total Productive
Maintenance (TPM) practices on operational performance, given by Overall
Equipment Effectiveness (OEE). As shown in Figure 2.1, the dependent variable of
the study is the OEE which is the product of the equipment availability, performance
and quality rates. The independent variables are the various practices of TPM. The
independent variables used in this study are elimination of lost equipment time,
autonomous maintenance and planned maintenance.
Figure 2.1: Conceptual Framework of the study
TPM Practices:
Elimination of Lost Equipment
Time
Autonomous Maintenance
Planned Maintenance
Overall Equipment Effectiveness
(OEE)
Availability Rate
Performance Rate
Quality Rate
Overall Equipment
Effectiveness (OEE)
Page 37
26
CHAPTER THREE: RESEARCH METHODOLOGY
3.1 Introduction
This chapter presents the methodology of the study. It describes the procedure that
was used in conducting the study. It comprises of the research design, justification of
selecting the case, the data collection procedure that was used in the study,
operationalization of the study variables, and the data analysis techniques that were
employed in the study.
3.2 Research Design
The research employed a longitudinal case study design. According to Yin (2003), a
case study is an empirical inquiry that investigates a contemporary phenomenon
within its real life context, especially when the boundaries between the phenomenon
and the context are not clearly evident. Case study design is used when the focus of
the study is to answer how and why questions, when the behavior of those involved in
the study cannot be manipulated, when it is necessary to cover contextual conditions
believed to be relevant to the phenomenon under study, and when the boundaries
between the phenomenon and the context are not clear. Eisenhardt (1989) describes
the case study as a research strategy which focuses on understanding the dynamics
present within single settings. In-depth single-company case studies help develop
theories and are particularly suitable for understanding phenomena that are dynamic
in nature.
The longitudinal case method provides the opportunity to examine continuous
processes in context and to draw in the significance of various interconnected levels
of analysis. Furthermore, a longitudinal case study can often better capture firm
Page 38
27
dynamics over time (Pettigrew, 1990). Longitudinal data collected gives a better
guide to long-term processes and outcomes and are more informative about the causal
relations that are the drivers of disadvantage or success. Longitudinal studies offer
causality – why and how things happen (Kuula & Putkiranta, 2012).
3.3 Case selection
In order to determine the effect of implementation of TPM practices on the equipment
effectiveness of manufacturing firms, the study took the case of Bamburi Cement
Limited (BCL), focusing on their Mombasa plant. BCL is owned by LafargeHolcim,
the biggest producer of building materials in the world (ICR, 2015). According to
Molonket et al., (2014), BCL is not only the largest cement producer in Kenya but
also the most efficient cement plant in the country, resulting in larger profit margins
relative to its competitors.
By early 1995, Kenya’s economy became liberalised, bringing new opportunities, and
also new threats, particularly in the form of imports to threaten the domestic cement
market. It was the realisation that imports were going to pose a serious threat to the
future profitability of BCL that drove many of the actions that took place from 1995
onwards. Although BCL was profitable, it was evident that in the long run, the
company’s very existence would be threatened unless its cost base was substantially
reduced (Collomb et al., 2004).
BCL’s management then started preparing the company for adapting to a continually
changing environment and to increasing labour costs. By introducing new working
practices, streamlining operations, re-training managers and instilling the concept of
delegation, BCL was able to halve its workforce, reduce overtime levels, achieve
Page 39
28
safety records and increase running times, efficiencies and output (Collomb et al.,
2004). The study sought to establish the impact of implementation of various TPM
practices in BCL on the equipment effectiveness of the organization.
3.4 Operationalization of Study Variables
This section describes the variables in the study and how they were operationalized.
The independent variables of the study were elimination of sources of lost equipment
time, autonomous maintenance and planned maintenance. The dependent variables of
the study were the plant performance indicators measured using equipment
availability, performance and quality rates to give an overall measure of overall
equipment effectiveness (OEE).
Availability rate is the ratio of the actual production time to the potential production
time (Vorne, 2013). In this study, equipment availability for BCL was defined as the
percentage of the time the kiln shop (Kilns 1 and 2) was available for operation,
weighted for Kilns 1 and 2 to give a global availability rate. Performance rate is the
ratio of the actual output produced by equipment while in operation to the theoretical
output of the equipment during that operation time (Kocher et al., 2012).
Equipment performance of BCL was defined as the ratio of the amount of clinker
produced by the kiln shop to the rated production capacity of the shop, weighted to
give a global performance rate. Quality rate is the percentage ratio of the number of
units produced to the number of the units produced that meet specifications
(Nakajima, 1988). Quality rate for BCL was used to refer to the measured value of the
compound tri calcium silicate (abbreviated C3S) in the clinker produced in the kiln
Page 40
29
shop as compared to a set target of C3S, expressed as a percentage, and weighted to
give an overall value of global quality rate.
Lost equipment time variables assess the incorporation of error detection and
prevention strategies into the production process (Venkatesh, 2007). The error
detection and prevention strategy employed at BCL is Root Cause Analysis (RCA).
RCA is a structured method of determining the root causes of equipment failures and
quality defects in order to prescribe solutions and prevent recurrence of the failures
(Japanese Institute of Plant Maintenance, 1996). Elimination of lost equipment time at
BCL was measured as the ratio of the number of RCAs conducted by the plant every
year to the number of failures in the major equipment line (kiln shop) during that year,
expressed as a percentage.
Autonomous maintenance variables include measures for cross-training of employees,
use of cross-functional problem-solving teams, and operator involvement in basic
equipment maintenance (McKone et al., 2001). The extent of cross-training of
employees at BCL was measured as the ratio of the number of employees in
operations (either the production or the maintenance departments) who were trained
to perform cross functional roles, to the total number of employees in that particular
department. The extent of use of cross-functional problem-solving teams at BCL was
measured as the ratio of the number of operations employees trained and proficient in
RCA who are members of cross functional RCA teams in the plant to the total number
of employees in operations at a particular time.
Page 41
30
Operator involvement at BCL was measured as the ratio of the number of times a
dedicated maintenance team was called into the plant during silent hours of operation
(at night and during holidays) for a less than 2 hours kiln stoppage to the total number
of such stoppages in the kiln shop. The three measures of autonomous maintenance
were weighted equally into one measure that was used an indicator of the extent of
implementation of autonomous maintenance at BCL.
Measures of planned maintenance include disciplined planning, information tracking,
and schedule compliance (JIPM, 1996). The extent of planned maintenance at BCL
was measured as the ratio of the number of kiln stoppages on planned condition-based
maintenance to the number of kiln stoppages on incidents (unplanned stoppages) in
one year. This measure was used to assess two of the planned maintenance variables:
the level of implementation of disciplined planning as well as the level of compliance
to the maintenance schedule (schedule compliance).
3.5 Data Collection
The study employed secondary data both for the independent and the dependent
variables. Bi-annual data for the independent variables (elimination of lost equipment
time, autonomous maintenance and planned maintenance) were collected from
records of number of RCAs conducted after failures, creation and use of cross-
functional problem-solving teams, cross training of employees, operator involvement
in daily equipment maintenance, disciplined planning of maintenance tasks, tracking
of information on production performance, and compliance to maintenance schedules
for a period of fifteen years from the year 2000 to 2014.
Page 42
31
Bi-annual data for the dependent variables (equipment availability, performance and
quality rates) was collected using a data collection table from documented and
archival records of equipment availability, performance and quality rates of the kiln
shop in BCL’s Mombasa Plant over the review period. The data was used to calculate
the overall equipment effectiveness of the equipment during the review period.
3.6 Data Analysis
The analysis focused on understanding the relationship between the adoption of the
TPM practices of elimination of sources of lost equipment time, autonomous
maintenance and planned maintenance and equipment effectiveness of BCL. The
study was a longitudinal case study and the data was quantitative in nature. Inferential
statistics was used to analyze the data. Overall Equipment Effectiveness (OEE)
performance was measured in terms of equipment availability, performance and
quality rates as well as the overall computed OEE rate. OEE is the product of the
equipment availability, performance and quality rates (Vorne, 2013).
Multivariate linear regression analysis was used to analyze the effect of
implementation of the TPM practices on equipment availability, performance and
quality rates as well as the overall equipment efficiency (OEE) rate. According to
Weisberg (2005), regression analysis can be used to determine the dependence of a
response variable on one or more predictors, including prediction of future values of a
response, discovering which predictors are important, and estimating the impact of
changing a predictor on the value of the response. The linear regression model used
took the form:
Page 43
32
Y1 = β0 + β1X1 + β2X2 + β3X3 + ε
Y2 = β0 + β1X1 + β2X2 + β3X3 + ε
Y3 = β0 + β1X1 + β2X2 + β3X3 + ε
Y = β0 + β1X1 + β2X2 + β3X3 + ε
Where: Y1, Y2, Y3 were the equipment availability, performance and quality rates
respectively and Y the overall equipment effectiveness (OEE); β0 being a constant,
and β1 – β3 being the regression coefficients. X1, X2 and X3 were the TPM practices of
elimination of lost equipment time, autonomous maintenance and planned
maintenance respectively, and ε the error term.
Page 44
33
CHAPTER FOUR: DATA ANALYSIS, RESULTS AND
DISCUSSION
4.1 Introduction
The objective of this study was to determine the effect of adoption of TPM practices
on the equipment effectiveness at Bamburi Cement Limited (BCL). This chapter
presents the findings of the study and the analysis of the findings with regard to the
objectives of this research, and a discussion of the same.
4.2 Implementation of TPM Practices and Equipment Effectiveness
The bi-annual data for the availability, performance and quality rates of BCL as well
as the bi-annual data for the TPM practices considered in the study (elimination of
sources of lost equipment time, autonomous maintenance and planned maintenance)
were collected and recorded. The data were for a period of fifteen years from the year
2000 to 2014 and were summarised in table 4.1.
Page 45
34
Table 4.1: TPM Practices and Equipment Effectiveness Data
Year Month Y1 Y2 Y3 Y X1 X2 X3
2000 Jan - June 90.93 78.50 90.02 64.25 0.00 9.74 0.00
2000 June - Dec 89.80 79.07 89.40 63.48 0.00 11.22 0.00
2001 Jan - June 88.92 80.38 89.92 64.27 42.11 13.12 0.00
2001 June - Dec 90.94 77.65 89.35 63.10 48.00 18.85 0.00
2002 Jan - June 91.21 78.72 91.25 65.52 42.86 15.62 28.57
2002 June - Dec 91.10 78.99 91.02 65.50 41.18 14.44 40.00
2003 Jan - June 89.68 78.58 94.54 66.62 57.89 22.78 50.00
2003 June - Dec 90.18 80.57 93.29 67.78 50.00 26.34 40.00
2004 Jan - June 87.14 77.95 94.90 64.46 26.67 27.39 33.33
2004 June - Dec 86.63 80.23 94.00 65.33 53.85 19.42 50.00
2005 Jan - June 92.49 77.89 93.26 67.19 31.58 30.58 66.67
2005 June - Dec 91.88 75.22 93.54 64.65 52.94 27.86 25.00
2006 Jan - June 91.19 79.69 95.25 69.22 26.67 29.87 28.57
2006 June - Dec 93.36 71.06 96.43 63.97 28.57 31.83 66.67
2007 Jan - June 92.22 76.18 93.31 65.55 54.55 27.52 40.00
2007 June - Dec 92.74 77.89 94.68 68.39 45.00 27.52 33.33
2008 Jan - June 93.75 80.62 94.98 71.79 29.63 31.99 50.00
2008 June - Dec 93.18 81.90 95.47 72.85 44.00 26.52 40.00
2009 Jan - June 94.83 81.90 95.02 73.80 50.00 35.64 66.67
2009 June - Dec 93.95 96.41 94.83 85.89 38.46 35.49 66.67
2010 Jan - June 91.28 83.73 97.96 74.87 47.06 36.51 50.00
2010 June - Dec 91.94 83.11 97.32 74.37 57.89 37.41 40.00
2011 Jan - June 96.96 83.11 97.86 78.86 60.00 35.96 66.67
2011 June - Dec 97.08 88.19 98.92 84.70 50.00 37.83 60.00
2012 Jan - June 93.08 88.19 90.01 73.89 38.10 36.62 66.67
2012 June - Dec 92.33 81.04 95.45 71.42 63.64 29.20 50.00
2013 Jan - June 94.08 83.81 98.01 77.27 50.00 40.33 40.00
2013 June - Dec 94.19 84.94 98.46 78.78 52.94 40.64 66.67
2014 Jan - June 94.68 85.20 99.25 80.05 65.22 49.08 50.00
2014 June - Dec 95.20 86.09 98.84 81.01 61.11 45.59 66.67
Where Y1, was the equipment availability rate at BCL measured as the ratio of the
actual production time of the kiln shop to the total potential production time; Y2, was
the equipment performance rate at BCL measured as the ratio of the amount of clinker
produced by the kiln shop to the rated production capacity of the shop; and Y3 the
quality rate at BCL measured as the value of the compound tri calcium silicate
(abbreviated C3S) in the clinker produced in the kiln shop as compared to a set target
Page 46
35
of C3S, expressed as a percentage. Y was the value of overall equipment effectiveness
(OEE) rate at BCL, obtained by calculating the product of the availability,
performance and quality rates at BCL. X1, X2, and X3 were the TPM practices of
elimination of lost equipment time, autonomous maintenance and planned
maintenance respectively.
There is a general increase in the level of implementation of the three TPM practices
of elimination of lost equipment time, autonomous maintenance and planned
maintenance during the period under consideration. Correlation and regression
analyses were conducted to evaluate the relationship between the implementation of
TPM practices and the equipment availability, performance and quality rates as well
as the overall equipment effectiveness (OEE) of BCL. The results of the analyses are
summarized in the sections below.
4.2.1 Nature and Degree of the Relationship between TPM Practices and
Equipment Effectiveness
A Pearson's correlation analysis was run to determine the nature of the relationship
between the implementation of the TPM practices of elimination of lost equipment
time, autonomous maintenance and planned maintenance and the equipment
availability, performance and quality rates as well as the overall equipment
effectiveness (OEE) of BCL. The results of the analysis are summarised in table 4.2.
Page 47
36
Table 4.2 Correlations between TPM Practices and the Availability,
Performance, Quality and OEE Rates of BCL
Correlations
Y1 Y2 Y3 Y X1 X2 X3
Availability rate
(Y1)
Pearson
Correlation 1
Sig. (2-
tailed)
Performance rate
(Y2)
Pearson
Correlation .447* 1
Sig. (2-
tailed) .013
Quality rate (Y3)
Pearson
Correlation .569**
.348 1
Sig. (2-
tailed) .001 .060
OEE rate (Y)
Pearson
Correlation .756**
.867**
.719**
1
Sig. (2-
tailed) .000 .000 .000
Lost Equipment
Time (X1)
Pearson
Correlation .315 .245 .535**
.424* 1
Sig. (2-
tailed) .091 .192 .002 .020
Autonomous
Maintenance (X2)
Pearson
Correlation .688**
.520**
.838**
.799**
.535**
1
Sig. (2-
tailed) .000 .003 .000 .000 .002
Planned
Maintenance (X3)
Pearson
Correlation .567**
.420* .642
** .631
** .453
* .736
** 1
Sig. (2-
tailed) .001 .021 .000 .000 .012 .000
*. Correlation is significant at the 0.05 level (2-tailed).
**. Correlation is significant at the 0.01 level (2-tailed).
From the analysis, it is observed that there is a weak, positive and insignificant
relationship between implementation of elimination of lost equipment time and the
availability rate (r = 0.315, n = 30, p = 0.091). There is a strong, positive and
significant relationship between implementation of autonomous maintenance and the
availability rate (r = 0.688, n = 30, p = 0.000). There is a moderate, positive and
significant relationship between implementation of planned maintenance and the
availability rate (r = 0.567, n = 30, p = 0.001).
Page 48
37
There is a weak, positive and insignificant correlation between implementation of
elimination of lost equipment time and the performance rate (r = 0.245, n = 30, p =
0.192). There is a moderate, positive and significant correlation between
implementation of autonomous maintenance and the performance rate (r = 0.520, n =
30, p = 0.003). There is a moderate, positive and significant correlation between
implementation of planned maintenance and the performance rate (r = 0.420, n = 30, p
= 0.021).
There is a moderate, positive and significant correlation between implementation of
elimination of lost equipment time and the quality rate (r = 0.535, n = 30, p = 0.002).
There is a very strong, positive and significant correlation between implementation of
autonomous maintenance and the quality rate (r = 0.838, n = 30, p = 0.000). There is a
strong positive correlation between implementation of planned maintenance and the
quality rate (r = 0.642, n=30, p = 0.000).
There is a moderate, positive and significant correlation between implementation of
elimination of lost equipment time and the OEE rate, r = 0.424, n = 30, p = 0.020.
There is a very strong, positive and significant correlation between implementation of
autonomous maintenance and the OEE rate (r = 0.799, n = 30, p = 0.000). There is a
strong, positive and significant correlation between implementation of elimination of
planned maintenance and the OEE rate (r = 0.631, n=30, p = 0.000).
4.2.2 TPM Practices and Availability Rate
A regression analysis was performed to determine the relationship between the
implementation of the TPM Practices of elimination of lost equipment time,
Page 49
38
autonomous maintenance and planned maintenance and the availability rate of BCL.
The results are summarized in table 4.3.
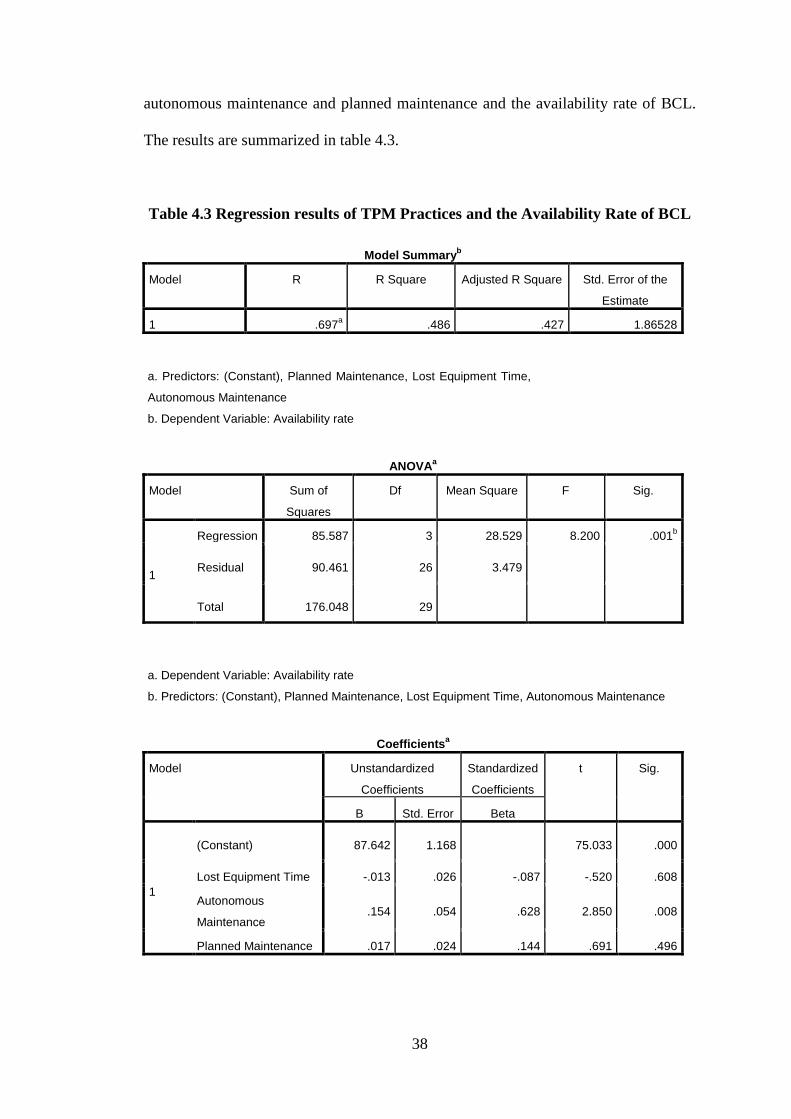
Table 4.3 Regression results of TPM Practices and the Availability Rate of BCL
Model Summaryb
Model R R Square Adjusted R Square Std. Error of the
Estimate
1 .697a .486 .427 1.86528
a. Predictors: (Constant), Planned Maintenance, Lost Equipment Time,
Autonomous Maintenance
b. Dependent Variable: Availability rate
ANOVAa
Model Sum of
Squares
Df Mean Square F Sig.
1
Regression 85.587 3 28.529 8.200 .001b
Residual 90.461 26 3.479
Total 176.048 29
a. Dependent Variable: Availability rate
b. Predictors: (Constant), Planned Maintenance, Lost Equipment Time, Autonomous Maintenance
Coefficientsa
Model Unstandardized
Coefficients
Standardized
Coefficients
t Sig.
B Std. Error Beta
1
(Constant) 87.642 1.168
75.033 .000
Lost Equipment Time -.013 .026 -.087 -.520 .608
Autonomous
Maintenance .154 .054 .628 2.850 .008
Planned Maintenance .017 .024 .144 .691 .496
Page 50
39
Coefficientsa
Model Correlations Collinearity Statistics
Zero-
order
Partial Part Tolerance VIF
1
(Constant)
Lost Equipment Time .315 -.101 -.073 .706 1.417
Autonomous
Maintenance .688 .488 .401 .407 2.457
Planned Maintenance .567 .134 .097 .453 2.206
a. Dependent Variable: Availability rate
From Table 4.3, the results of the regression indicated a strong, positive relationship
between TPM practices and the availability rate of BCL (R = 0.697). Adjusted R2
shows that 42.7% of the variation in the availability rate of BCL is explained by the
linear combination of the TPM practices of elimination of lost equipment time,
autonomous maintenance and planned maintenance.
To determine the significance of correlation coefficient r for TPM practices and the
availability rate of BCL, a test of significance was done as follows.
H0: r = 0 (The coefficient of correlation is not significant)
H1: r ≠ 0 (The coefficient of correlation is significant)
It was a two tailed test of 5% level of significance df = n-2 = 30-2 = 28.
The decision rule therefore was to reject H0 if computed t is greater than 2.048
(Garcia, 2010).
Computed t = r*SQRT [((n – 2) / (1 – r2))] = 0.697*SQRT [((30-2) / (1-0.697
2))] =
5.1434. Decision: since the computed t (5.1434) is greater than critical t (2.048), the
null hypothesis is rejected implying that the coefficient of correlation between TPM
practices and the availability rate of BCL is significant.
Page 51
40
The independent variables of the study were the TPM practices of elimination of lost
equipment time, autonomous maintenance and planned maintenance. The VIF values
for the independent variables were 1.417, 2.457 and 2.206. Since the VIF values are
less than 5, there is no multicollinearity among the independent variables of the study
(Hair, Ringle, & Sarstedt, 2011).
The regression equation for predicting the availability rate of BCL was:
Y1 = 87.642 – 0.013X1 + 0.154X2 + 0.017X3
Where Y1 was the equipment availability rate and X1, X2, and X3 were the TPM
practices of elimination of lost equipment time, autonomous maintenance and planned
maintenance respectively.
The regression equation above establishes that taking all factors into account constant
at zero, the availability rate of BCL will be at 87.62%. It also establishes that a 1%
increase in implementation of lost equipment time practices would actually result in a
.013% decrease in the availability rate of BCL. A 1% increase in implementation of
autonomous maintenance practices would result in a .154% increase in the availability
rate of BCL, while a 1% increase in implementation of planned maintenance practices
would result in a .017% increase in the availability rate of BCL. The analysis shows
that of the three TPM practices, it was only the implementation of autonomous
maintenance practices that statistically predicted the availability rate of BCL
significantly, p = .008.
Page 52
41
4.2.3 TPM Practices and Performance Rate
A regression analysis was performed to determine the relationship between the
implementation of the TPM Practices of elimination of lost equipment time,
autonomous maintenance and planned maintenance and the performance rate of BCL.
The results are summarized in table 4.4.
Table 4.4 Regression results of TPM Practices and the Performance Rate of BCL
Model Summaryb
Model R R Square Adjusted R Square Std. Error of the
Estimate
1 .525a .276 .192 4.24653
a. Predictors: (Constant), Planned Maintenance, Lost Equipment Time,
Autonomous Maintenance
b. Dependent Variable: Performance rate
ANOVAa
Model Sum of Squares Df Mean Square F Sig.
1
Regression 178.520 3 59.507 3.300 .036b
Residual 468.859 26 18.033
Total 647.379 29
a. Dependent Variable: Performance rate
b. Predictors: (Constant), Planned Maintenance, Lost Equipment Time, Autonomous Maintenance
Coefficientsa
Model Unstandardized
Coefficients
Standardized
Coefficients
t Sig.
B Std. Error Beta
1
(Constant) 74.489 2.659
28.012 .000
Lost Equipment Time -.016 .059 -.054 -.272 .788
Autonomous
Maintenance .227 .123 .484 1.851 .076
Planned
Maintenance .019 .054 .088 .356 .724
Page 53
42
Coefficientsa
Model Correlations Collinearity Statistics
Zero-order Partial Part Tolerance VIF
1
(Constant)
Lost Equipment
Time .245 -.053 -.045 .706 1.417
Autonomous
Maintenance .520 .341 .309 .407 2.457
Planned
Maintenance .420 .070 .059 .453 2.206
a. Dependent Variable: Performance rate
From Table 4.4, the results of the regression indicated a moderate, positive
relationship between TPM practices and the performance rate of BCL (R = 0.525).
Adjusted R2
shows that 19.2% of the variation in the performance rate of BCL is
explained by the linear combination of the TPM practices of elimination of lost
equipment time, autonomous maintenance and planned maintenance.
To determine the significance of correlation coefficient r for TPM practices and the
performance rate of BCL, a test of significance was done as follows.
H0: r = 0 (The coefficient of correlation is not significant)
H1: r ≠ 0 (The coefficient of correlation is significant)
It was a two tailed test of 5% level of significance df = n-2 = 30-2 = 28.
The decision rule therefore was to reject H0 if computed t is greater than 2.048.
Computed t = r*SQRT [((n – 2) / (1 – r2))] = 0.525*SQRT [((30-2) / (1-0.525
2))] =
3.264. Decision: since the computed t (3.264) is greater than critical t (2.048), the null
hypothesis is rejected implying that the coefficient of correlation between TPM
practices and the performance rate of BCL is significant.
Page 54
43
The regression equation for predicting the performance rate of BCL was:
Y2 = 74.489 – 0.016X1 + 0.227X2 + 0.019X3
Where Y2 was the equipment performance rate and X1, X2, and X3 were the TPM
practices of elimination of lost equipment time, autonomous maintenance and planned
maintenance respectively.
The regression equation above establishes that taking all factors into account constant
at zero, the performance rate of BCL will be at 74.49%. It also establishes that a 1%
increase in implementation of lost equipment time practices would actually result in a
.016% decrease in the performance rate of BCL. A 1% increase in implementation of
autonomous maintenance practices would result in a .227% increase in the
performance rate of BCL, while a 1% increase in implementation of planned
maintenance practices would result in a .019% increase in the performance rate of
BCL. The analysis shows that none of the three TPM practices statistically predicted
the performance rate of BCL significantly, p > .05.
4.2.4 TPM Practices and Quality Rate
A regression analysis was performed to determine the relationship between the
implementation of the TPM Practices of elimination of lost equipment time,
autonomous maintenance and planned maintenance and the quality rate of BCL. The
results are summarized in table 4.5.
Page 55
44
Table 4.5 Regression results of TPM Practices and the Quality Rate of BCL
Model Summaryb
Model R R Square Adjusted R
Square
Std. Error of the
Estimate
1 .845a .713 .680 1.72230
a. Predictors: (Constant), Planned Maintenance, Lost Equipment Time,
Autonomous Maintenance
b. Dependent Variable: Quality rate
ANOVAa
Model Sum of Squares Df Mean
Square
F Sig.
1
Regression 191.849 3 63.950 21.559 .000b
Residual 77.124 26 2.966
Total 268.973 29
a. Dependent Variable: Quality rate
b. Predictors: (Constant), Planned Maintenance, Lost Equipment Time, Autonomous Maintenance
Coefficientsa
Model Unstandardized
Coefficients
Standardized
Coefficients
t Sig.
B Std. Error Beta
1
(Constant) 86.776 1.079
80.459 .000
Lost Equipment Time .022 .024 .118 .943 .354
Autonomous
Maintenance .225 .050 .746 4.533 .000
Planned
Maintenance .006 .022 .039 .250 .805
Page 56
45
Coefficientsa
Model Correlations Collinearity Statistics
Zero-order Partial Part Tolerance VIF
1
(Constant)
Lost Equipment Time .535 .182 .099 .706 1.417
Autonomous
Maintenance .838 .664 .476 .407 2.457
Planned Maintenance .642 .049 .026 .453 2.206
a. Dependent Variable: Qualityrate
From Table 4.4, the results of the regression indicated a strong, positive relationship
between TPM practices and the quality rate of BCL (R = 0.845). Adjusted R2
shows
that 68.0% of the variation in the quality rate of BCL is explained by the linear
combination of the TPM practices of elimination of lost equipment time, autonomous
maintenance and planned maintenance.
To determine the significance of correlation coefficient r for TPM practices and the
quality rate of BCL, a test of significance was done as follows.
H0: r = 0 (The coefficient of correlation is not significant)
H1: r ≠ 0 (The coefficient of correlation is significant)
It was a two tailed test of 5% level of significance df = n-2 = 30-2 = 28.
The decision rule therefore was to reject H0 if computed t is greater than 2.048.
Computed t = r*SQRT [((n – 2) / (1 – r2))] = 0.845*SQRT [((30-2) / (1-0.845
2))] =
8.361. Decision: since the computed t (8.361) is greater than critical t (2.048), the null
hypothesis is rejected implying that the coefficient of correlation between TPM
practices and the quality rate of BCL is significant.
Page 57
46
The regression equation for predicting the quality rate of BCL was:
Y3 = 86.776 + 0.022X1 + 0.225X2 + 0.006X3
Where Y3 was the equipment quality rate and X1, X2, and X3 were the TPM practices
of elimination of lost equipment time, autonomous maintenance and planned
maintenance respectively.
The regression equation above establishes that taking all factors into account constant
at zero, the quality rate of BCL will be at 87.78%. It also establishes that a 1%
increase in implementation of lost equipment time practices would result in a .022%
increase in the quality rate of BCL. A 1% increase in implementation of autonomous
maintenance practices would result in a .225% increase in the quality rate of BCL,
while a 1% increase in implementation of planned maintenance practices would result
in a .006% increase in the quality rate of BCL. The analysis shows that of the three
TPM practices, it was only the implementation of autonomous maintenance practices
that statistically predicted the quality rate of BCL significantly, p < .001.
4.2.5 TPM Practices and OEE Rate
A regression analysis was performed to determine the relationship between the
implementation of the TPM Practices of elimination of lost equipment time,
autonomous maintenance and planned maintenance and the OEE rate of BCL. The
results are summarized in table 4.6.
Page 58
47
Table 4.6 Regression results of TPM Practices and the OEE Rate of BCL
Model Summaryb
Model R R Square Adjusted R Square Std. Error of the
Estimate
1 .802a .643 .601 4.25740
a. Predictors: (Constant), Planned Maintenance, Lost Equipment Time,
Autonomous Maintenance
b. Dependent Variable: OEE rate
ANOVAa
Model Sum of Squares df Mean Square F Sig.
1
Regression 846.985 3 282.328 15.576 .000b
Residual 471.262 26 18.125
Total 1318.247 29
a. Dependent Variable: OEE rate
b. Predictors: (Constant), Planned Maintenance, Lost Equipment Time, Autonomous Maintenance
Coefficientsa
Model Unstandardized
Coefficients
Standardized
Coefficients
t Sig.
B Std. Error Beta
1
(Constant) 55.602 2.666
20.856 .000
Lost Equipment Time -.006 .059 -.013 -.094 .926
Autonomous
Maintenance .492 .123 .735 4.001 .000
Planned
Maintenance .030 .055 .096 .551 .587
Page 59
48
Coefficientsa
Model Correlations Collinearity Statistics
Zero-order Partial Part Tolerance VIF
1
(Constant)
Lost Equipment Time .424 -.018 -.011 .706 1.417
Autonomous
Maintenance .799 .617 .469 .407 2.457
Planned Maintenance .631 .107 .065 .453 2.206
a. Dependent Variable: OEE rate
From Table 4.4, the results of the regression indicated a strong, positive relationship
between TPM practices and the OEE rate of BCL (R = 0.802). Adjusted R2
shows
that 60.1% of the variation in the OEE rate of BCL is explained by the linear
combination of the TPM practices of elimination of lost equipment time, autonomous
maintenance and planned maintenance.
To determine the significance of correlation coefficient r for TPM practices and the
quality rate of BCL, a test of significance was done as follows.
H0: r = 0 (The coefficient of correlation is not significant)
H1: r ≠ 0 (The coefficient of correlation is significant)
It was a two tailed test of 5% level of significance df = n-2 = 30-2 = 28.
The decision rule therefore was to reject H0 if computed t is greater than 2.048.
Computed t = r*SQRT [((n – 2) / (1 – r2))] = 0.802*SQRT [((30-2) / (1-0.802
2))] =
7.105. Decision: since the computed t (7.105) is greater than critical t (2.048), the null
hypothesis is rejected implying that the coefficient of correlation between TPM
practices and the OEE rate of BCL is significant.
Page 60
49
The regression equation for predicting the OEE rate of BCL was:
Y = 55.602 - 0.006X1 + 0.492X2 + 0.030X3
Where Y was the equipment OEE rate and X1, X2, and X3 were the TPM practices of
elimination of lost equipment time, autonomous maintenance and planned
maintenance respectively.
The regression equation above establishes that taking all factors into account constant
at zero, the OEE rate of BCL will be at 55.6%. It also establishes that a 1% increase in
implementation of lost equipment time practices would actually result in a .006%
decrease in the OEE rate of BCL. A 1% increase in implementation of autonomous
maintenance practices would result in a .492% increase in the OEE rate of BCL, while
a 1% increase in implementation of planned maintenance practices would result in a
.030% increase in the OEE rate of BCL. The analysis shows that of the three TPM
practices, it was only the implementation of autonomous maintenance practices that
statistically predicted the OEE rate of BCL significantly, p = .000.
Page 61
50
CHAPTER FIVE: SUMMARY, CONCLUSION AND
RECOMMENDATIONS
5.1 Introduction
This chapter discusses the overall findings of the study, with the aim of answering the
research questions. The chapter also presents conclusions and recommendations
drawn from the study on the objectives of the study and gives suggestions for future
possible studies.
5.2 Summary of the Findings of the Study
The study established that the implementation of various TPM practices at Bamburi
Cement Limited (BCL) had a significant effect on the availability, performance and
overall equipment effectiveness (OEE) rates achieved by the organization. With the
gradual implementation of the three TPM practices of elimination of lost equipment
time, autonomous maintenance and planned maintenance, the OEE rate of BCL
increased from an average rate of 65.03% in the years from 2000 to 2005 to an
average rate of 77.52% in the years from 2006 to 2014. The implementation of the
three TPM practices increased the equipment availability rate from 89.65% to
94.08%, the performance rate from 79.06% to 84.74% and the quality rate from
91.77% to 97.21% through the same time period.
Of the three TPM practices studied, autonomous maintenance was found to be the
biggest contributor to changes in the availability, performance and quality rates of
BCL, with a 1% increase in the implementation of the autonomous maintenance
practices of operator involvement, cross training of employees and creation of
multidisciplinary problem solving teams resulting in a 0.154%, 0.227% and a 0.225%
Page 62
51
increase in the availability, performance and quality rates of BCL respectively.
Implementation of the planned maintenance practices of disciplined planning and
schedule compliance was found to be the second largest contributor to the changes in
the availability, performance and quality rates of BCL, with a 1% increase in planned
maintenance practices resulting in a 0.017%, 0.019% and a 0.006% increase in the
availability, performance and quality rates of BCL respectively.
Further, the study determined that the implementation of elimination of lost
equipment time actually resulted in a decrease in the availability and performance
rates of BCL, with a 1% increase in the elimination of lost equipment time practice of
conducting root cause analyses (RCA) for equipment failures resulting in a 0.013%
and 0.016% decrease in the availability and performance rates of BCL respectively.
One possible explanation of this observation is that the RCAs conducted at BCL did
not address the true causes of equipment failures, and could therefore not be useful in
preventing recurrence of the failures and so would add little value to the maintenance
process. The study however showed that a 1% increase in the implementation of
elimination of lost equipment time resulted in a 0.022% increase in the quality rate of
BCL.
Autonomous maintenance was found to be the biggest contributor to changes in OEE
rate of BCL, with a 1% increase in the implementation of the autonomous
maintenance practices of operator involvement, cross training of employees and
creation of multidisciplinary problem solving teams resulting in a 0.492% increase in
the OEE rate of BCL. Implementation of the planned maintenance practices of
disciplined planning and schedule compliance was found to be the second largest
Page 63
52
contributor to the increases OEE rate of BCL, with a 1% increase in planned
maintenance practices resulting in a 0.030% increase in the OEE rate of BCL. The
study also established that a 1% increase in the implementation of elimination of lost
equipment time resulted in a 0.006% decrease in the OEE rate of BCL.
5.3 Conclusions
This study concludes that there is a significant relationship between the
implementation of total productive maintenance (TPM) practices at BCL from the
year 2000 to 2014 and the improvement in the availability, performance, quality and
overall equipment effectiveness (OEE) rates that was witnessed in the organisation
during that time period. The combined effect of the implementation of the three TPM
practices of elimination of lost equipment time, autonomous maintenance and planned
maintenance was an increase in all of the indicators of equipment effectiveness.
Of the three TPM practices considered, autonomous maintenance of plant equipment
by the production teams was found to have the biggest effect in the OEE of the
equipment in the kiln shop of BCL, followed by the planned maintenance of the
equipment. The study did not find the implementation of elimination of lost
equipment time at BCL to have any effect on the OEE of the organisation.
The findings of the study agree with the findings of Paropate and Sambhe (2013) who
performed a study on the implementation of TPM in a midsized cotton spinning plant
in India and established that TPM enables improvement in the availability,
performance and the quality rates of the carding machine, by increasing the
availability, quality, performance and overall equipment effectiveness rates from
Page 64
53
89.6832%, 79.29%, 96.4783% and 68.9866% respectively before TPM
implementation to 91.96%, 79.758%, 97.177% and 71.465% respectively after TPM
implementation.
The findings of the study also agree with those of Sharma et al. (2006) who
established that TPM leads to increase in efficiency and effectiveness of
manufacturing systems, measured in terms of OEE index. The study findings also
agree with the findings of Ahuja and Khamba (2007) who established through a case
study of the Indian manufacturing industry that there had been an improvement in
overall equipment effectiveness of all the production facilities as a result of TPM
initiatives notably OEE improvement by 14 - 45 per cent.
The findings of the study are also consistent with the findings of Ateka (2013) who
examined the adoption of TPM practices in large manufacturing firms located in
Mombasa County and identified increased quality and improved productivity as the
key benefits resulting from TPM implementation. His study also established that the
most important critical success factor of TPM is co-operation and involvement of both
the operators and the maintenance workers in equipment maintenance.
5.4 Recommendations
In order to realize significant gains in the reliability, performance and quality rates of
their equipment, manufacturing organizations should consider implementing the TPM
practices outlined in this study. Specifically, organisations should invest their
resources in creating a culture of autonomous maintenance of their production
Page 65
54
equipment by the production operators. They should endeavour to create a strong
production team that is knowledgeable in the basic skills of equipment maintenance.
A strong production team would be able to identify emerging operational problems
early on and correct them or seek assistance from more knowledgeable employees
before major breakdowns occur. This in turn would increase the availability of the
equipment to continue with production and ensure that the highest quality product is
produced, and at the optimal production capacity. Prevention of major equipment
breakdowns would also increase the lifetime of the equipment and reduce the costs
associated with their maintenance, thereby increasing the profitability of the
organizations.
Organizations should also ensure that a regular equipment maintenance schedule is
created for all their production equipment in consultation with the equipment
manufacturer. The schedule is followed diligently by the maintenance team. Creation
of a regular maintenance schedule and adherence to a disciplined maintenance plan
will ensure that all emerging problems with the equipment are addressed promptly.
This in turn will increase the equipment availability, performance and quality rates by
enabling the equipment to run without any unnecessary stoppages due to breakdowns
and at the correct speed while producing the best quality product.
5.5 Limitations of the Study
The study used secondary data of the availability, performance and quality rates
achieved by BCL for a period of fifteen years. Due to the sensitivity of the
information, and the obligations placed on the researcher and the custodians of the
Page 66
55
information, the study was not able to establish more data points, and to obtain data
for a longer time period, thereby limiting the scope of the period under the study.
Due to the amount and complexity of the data needed for the study and the time
constraints placed on the researcher, the researcher could not be able to obtain and
analyze data for the whole production line at BCL, from the quarrying stage of
cement production to the finishing stage. This limited the scope of the study to the
clinker production shop (kiln shop) of the organization.
5.6 Suggestions for Further Research
The study focused on the effects of implementation of the TPM practices on the OEE
rate of the equipment in the kiln shop of BCL. It did not consider the effect of
implementation of the practices on the OEE rates of the other equipment in the
organization. A follow-up study should be conducted that will consider the effects of
implementation of the TPM practices on the other equipment in the production line of
BCL.
The study focused on the effects of the implementation of TPM practices on the
overall equipment efficiency (OEE) of BCL. It was limited to one organization and
the results are limited to the organization. They therefore cannot be generalized for
other cement companies in the country and elsewhere without considering the context
due to differing management philosophies employed and capabilities of the
workforce. The study therefore recommends further work on the effects of the
implementation of TPM practices in other Kenyan cement manufacturing
organizations to be conducted.
Page 67
56
REFERENCES
Afefy, Islam H. (2013). "Implementation of Total Productive Maintenance and
Overall Equipment Effectiveness Evaluation." International Journal of
Mechanical & Mechatronics Engineering IJMME-IJENS 13(01).
Ahuja, I.P.S., J.S. Khamba, (2007),"An evaluation of TPM implementation initiatives
in an Indian manufacturing enterprise", Journal of Quality in Maintenance
Engineering, 13(4), 338 – 352.
Ahuja, I. S., Khamba, J. S., & Choudhary, R. (2006, January). Improved
organizational behavior through strategic total productive maintenance
implementation. In ASME 2006 International Mechanical Engineering
Congress and Exposition (pp. 91-98). American Society of Mechanical
Engineers.
Aspinwall, E., & Elgharib, M. (2013). TPM implementation in large and medium size
organisations. Journal of Manufacturing Technology Management, 24(5), 688-
710.
Ateka, N. (2013). Adoption of total productive maintenance practices among large
manufacturing firms in Mombasa County, Kenya (Unpublished MBA Thesis).
University of Nairobi, Kenya.
Bamber, C. J., Sharp, J. M., & Hides, M. T. (1999). Factors affecting successful
implementation of total productive maintenance: a UK manufacturing case
study perspective. Journal of Quality in Maintenance Engineering, 5(3), 162-
181.
Bartz, T., Cezar M. S. J., & Paula B. B. A., (2014). Improvement of industrial
performance with TPM implementation. Journal of Quality in Maintenance
Engineering, 20(1), 2-19.
Chan, F. T. S., Lau, H. C. W., Ip, R. W. L., Chan, H. K., & Kong, S. (2005).
Implementation of total productive maintenance: A case study. International
Journal of Production Economics, 95(1), 71-94.
Collomb, B., Brenneisen, B., Groom, C., & Hillenmeyer, J.C. (2004). Bamburi
Cement: Memories of the past, Challenges for the future. Bamburi Cement
Limited, Nairobi/Kenya.
Cua, K. O., McKone, K. E., & Schroeder, R. G. (2001). Relationships between
implementation of TQM, JIT, and TPM and manufacturing
performance. Journal of Operations Management, 19(6), 675-694.
Dal, B., Tugwell, P., & Greatbanks, R. (2000). Overall equipment effectiveness as a
measure of operational improvement - A practical analysis. International
Journal of Operations & Production Management, 20(12), 1488-1502.
Ecobank Research (2014). Middle Africa Insight Series | Commodities | Cement.
Nairobi, Kenya: Aithnard, P.G.
Page 68
57
Eisenhardt, K. M. (1989). Building theories from case study research. Academy of
management review, 14(4), 532-550.
Eti, M. C., Ogaji, S. O. T., & Probert, S. D. (2006). Reducing the cost of preventive
maintenance (PM) through adopting a proactive reliability-focused
culture. Applied Energy, 83(11), 1235-1248.
Faida Investment Bank. (2014). Kenya Cement Sector: Initiation of Coverage.
Nairobi, Kenya: Kiarie, B. & Njihia, S.
Flynn, B. B., Schroeder, R. G., Flynn, E. J., Sakakibara, S., & Bates, K. A. (1997).
World-class manufacturing project: overview and selected results.
International Journal of Operations & Production Management, 17(7), 671-
685.
Garcia, E. (2010). A tutorial on correlation coefficients. Retrieved from http://www.
miislita. com.
Gosavi, A. (2006). A risk-sensitive approach to total productive maintenance.
Automatica, 42(8), 1321-1330.
Gupta, A. K., & Garg, R. K. (2012). OEE improvement by TPM implementation: A
case study. International Journal of IT, Engineering and Applied Sciences
Research, 1(1).
Gupta, R. C., Sonwalkar, J., & Chitale, A. K. (2001). Overall equipment effectiveness
through total productive maintenance. Prestige Journal of management and
Research, 5(1), 61-72.
Gupta, S., Tewari, P. C., & Sharma, A. K. (2006). TPM concept and implementation
approach. Maintenance World, 21, 1-18.
Hangad, W. S., & Kumar, S. (2013). TPM-A Key Strategy for Productivity
Improvement in Medium Scale Industry. International Journal of Emerging
Technology and Advanced Engineering, 3(6), 485-492.
Hair, J. F., Ringle, C. M., & Sarstedt, M. (2011). PLS-SEM: Indeed a silver
bullet. Journal of Marketing Theory and Practice, 19(2), 139-152.
Huang, S. H., Dismukes, J. P., Shi, J., Su, Q., Wang, G., Razzak, M. A., & Robinson,
D. E. (2002). Manufacturing system modeling for productivity
improvement. Journal of Manufacturing Systems, 21(4), 249-259.
Induswe, J. (2013). Implemention Of Total Productive Maintenance In Large
Manufacturing Firms In Kenya (Unpublished MBA Thesis). University of
Nairobi, Kenya.
International Cement Review. (2015). Holcim and Lafarge complete global merger.
Retrieved July 19, 2015, from http://www.cemnet.com/News/story/157210
Page 69
58
Ireland, F., & Dale, B. G. (2001). A study of total productive maintenance
implementation. Journal of Quality in Maintenance Engineering, 7(3), 183-
192.
Jain, A., Bhatti, R., & Singh, H. (2014). Total productive maintenance (TPM)
implementation practice: A literature review and directions. International
Journal of Lean Six Sigma, 5(3), 293-323.
Japan Institute of Plant Maintenance. (1996). TPM For Every Operator (Shopfloor
Series). (Productivity Press), ISBN: 1563270803
Jeong, K. Y., & Phillips, D. T. (2001). Operational efficiency and effectiveness
measurement. International Journal of Operations & Production
Management, 21 (11), 1404-1416.
Khalil, J., Saad, S. M., & Gindy, N. (2009). An integrated cost optimisation
maintenance model for industrial equipment. Journal of Quality in
Maintenance Engineering, 15(1), 106-118.
Kocher, G., Kumar, R., Singh, A., & Dhillon, S. S. (2012). An Approach for Total
Productive Maintenance and Factors Affecting its Implementation in
Manufacturing Environment. International Journal on Emerging
Technologies, 3(1), 41-47.
Kuula, M., Putkiranta, A., (2012),"Longitudinal benchmarking studies in operations
management: lessons learned", Benchmarking: An International Journal, 19
(3), 358 – 373.
Lazim, H. M., Salleh, M. N., Subramaniam, C., & Othman, S. N. (2013). Total
Productive Maintenance and Manufacturing Performance: Does Technical
Complexity in the Production Process Matter? Complexity, 3, 0-78.
Ljungberg, Õ. (1998). Measurement of overall equipment effectiveness as a basis for
TPM activities. International Journal of Operations & Production
Management, 18(5), 495-507.
Matuga, H. (2013). Contribution of total productive maintenance strategy to the
competitive advantage of Unilever Kenya Limited (Unpublished MBA Thesis).
University of Nairobi, Kenya.
McKone, K. E., Schroeder, R. G., & Cua, K. O. (2001). The impact of total
productive maintenance practices on manufacturing performance. Journal of
Operations Management, 19(1), 39-58.
McKone, K. E., & Weiss, E. N. (1998). TPM: planned and autonomous maintenance:
bridging the gap between practice and research. Production and Operations
Management, 7(4), 335-351.
Miyake, D. I. (1999). Matching the promotion of total quality control and total
productive maintenance: an emerging pattern for the nurturing of well-
balanced manufacturers. Total Quality Management, 10(2), 243-269.
Page 70
59
Molonket L., Ombuki C., & Wawire N. (2014). Effects of competition on the
profitability of cement manufacturers in Kenya. European Journal of Business
and Social Sciences, 3(7), 40-48.
Nakajima, S. (1988). Introduction to TPM: total productive maintenance.Productivity
Press, Inc, P. O. Box 3007, Cambridge, Massachusetts 02140, USA, 1988.
129.
Paropate, R. V., & Sambhe, R. U. (2013). The Implementation and Evaluation of
Total Productive Maintenance – A Case Study of mid-sized Indian Enterprise.
International Journal of Application or Innovation in Engineering &
Management (IJAIEM), 2(10). ISSN 2319 – 4847.
Pathak, S. S. (2015). TPM Implementation to fine-tune manufacturing performance:
An Indian industrial way. International Journal of Business Quantitative
Economics and Applied Management Research, 1(8). ISSN: 2349-5677.
Pettigrew, A. M. (1990). Longitudinal field research on change: Theory and
practice. Organization science, 1(3), 267-292.
Pomorski, T. R. (2004). Total Productive Maintenance (TPM) Concepts and
Literature Review. Brooks Automation, Inc. April 30, 2004.
Rajan, R., Sajumon, K. T. (2013). Evaluation of the contributors of OEE (Overall
Equipment Effectiveness) using Shapley value: A Case Study. International
Journal of Innovative Research in Science, Engineering and Technology. 2(1).
ISSN 2347 - 6710.
Jain, A., Bhatti, R. S., & Singh, H. (2015). OEE enhancement in SMEs through
mobile maintenance: a TPM concept. International Journal of Quality &
Reliability Management, 32(5), 503-516.
Rodrigues, M., & Hatakeyama, K. (2006). Analysis of the fall of TPM in
companies. Journal of Materials Processing Technology, 179(1), 276-279.
Seng, O. Y., Jantan, M., & Ramayah, T. (2005). Implementing total productive
maintenance (TPM) in malaysian manufacturing organisation: an operational
strategy study. The ICFAI Journal of Operations Management, 4(2), 53-62.
Sethia, C. S., Shende, P. N., & Dange, S. S. (2014, October). A Case Study on Total
Productive Maintenance in Rolling Mill. In Journal of Emerging Technologies
and Innovative Research, 1(5). ISSN-2349-5162.
Sharma, K., Gera, G., Kumar, R., Chaudhary, H. K., & Gupta, S. K. (2012). An
empirical study approach on TPM implementation in manufacturing industry.
International Journal on Emerging Technologies, 3(1), 18-23.
Sharma, R. K., Kumar, D., & Kumar, P. (2006). Manufacturing excellence through
TPM implementation: a practical analysis. Industrial Management & Data
Systems, 106(2), 256-280.
Page 71
60
Shirose, K. (Ed.). (1999). TPM: Total Productive Maintenance: New Implementation
Program in Fabrication and Assembly Industries. Japan Institute of Plant
Maintenance (JPM), 1999.
Sohal, A., Olhager, J., O’Neill, P., & Prajogo, D. (2010). Implementation of OEE–
issues and challenges. Competitive and Sustainable Manufacturing Products
and Services, Milano: Poliscript, (1997), 1-8.
Standard Investment Bank. (2013). East Africa Cement Sector Valuation Update.
Redesigning East Africa’s landscape. Nairobi, Kenya: Mwangi, F., Musau, E.,
& Kithinji, B.
Tsang, A. H., & Chan, P. K. (2000). TPM implementation in China: a case
study. International Journal of Quality & Reliability Management, 17(2), 144-
157.
Varotaria, J., Barelwala, C. (2014). TPM Implementation in PNG Distribution
Industry. International Journal of Mechanical and Industrial Technology,
2(1), 10-15.
Venkatesh, J. (2007). An introduction to total productive maintenance (TPM).The
plant maintenance resource center, 3-20.
Vorne Industries Inc. (2013). TPM – Total Productive Maintenance. Retrieved from
http://www.leanproduction.com/tpm.html
Wakjira, W., & Ajit Pal Singh, M. (2012). Total productive maintenance: A case
study in manufacturing industry. Global Journal of Researches in
Engineering, 12(1-G).
Wang, F. K. (2005). Applying a control chart to the learning curve in TPM
adoption. Journal of Quality Technology & Quantitative Management, 2(2),
237-248.
Weisberg, S. (2005). Applied linear regression (Vol. 528). John Wiley & Sons.
Williamson, R. M. (2006). Using Overall Equipment Effectiveness: The Metric and
the Measures. Strategic Work System, Inc, 1-6.
Yin, R. (2003). Case study research: Design and methods. Sage Publications, Inc, 5,
11.
Page 72
61
APPENDICES
APPENDIX 1: FORMULAE FOR CALCULATING EQUIPMENT
EFFECTIVENESS
Availability rate (%) = Valuable operating time / Available operating time
Where:
Valuable operating time = Operating time + Breakdown time
Available operating time = Total time available for production (Jain et al., 2014)
Performance rate (%) = [(Cycle time x Number of final goods produced) / Valuable
operating time]
Where:
Cycle time = Time taken to produce one unit = 1/Capacity per hour (Jain et al.,
2014)
Quality rate (%) = [(Total production – Rejection) / Total production] (Jain et al.,
2014)
OEE rate (%) = Availability rate x Performance rate x Quality rate (Jain et al.,
2014)
Page 73
62
APPENDIX 2: DATA COLLECTION TABLE
TPM
PRACTICE
YEAR
2000 2000 2001 2001 2002 2002 2003 2003 2004 2004
Jan -
June
June
- Dec
Jan -
June
June
- Dec
Jan -
June
June
- Dec
Jan -
June
June
- Dec
Jan -
June
June
- Dec
LOST
EQUIPMENT
TIME
Total number of
incidents in Kiln
shop
21 26 19 25 21 17 19 14 15 13
Total number of
Root Cause
Analyses done
8 12 9 7 11 7 4 7
Lost Equipment
Time Score (%)
0.00 0.00 42.11 48.00 42.86 41.18 57.89 50.00 26.67 53.85
AUTONOMOUS
MAINTENANCE
Cross-training of
employees
Maintenance
personnel trained
in basics of
cement production
10 10 14 14 14 14 19 19
Total number of
Maintenance
personnel
115 115 110 110 113 113 109 109 107 107
Maintenance
cross-training rate
(%)
0.00 0.00 9.09 9.09 12.39 12.39 12.84 12.84 17.76 17.76
Production
personnel trained
in basics of
equipment
maintenance
11 11 13 13 15 15 17 17 14 14
Total number of
Production
personnel
89 89 87 87 85 85 87 87 84 84
Production cross-
training rate (%)
12.36 12.36 14.94 14.94 17.65 17.65 19.54 19.54 16.67 16.67
Global cross-
training rate (%)
7.58 7.58 12.68 12.68 15.61 15.61 16.95 16.95 17.09 17.09
Page 74
63
Cross-functional
problem-solving
teams
Number of
operations
employees trained
in RCA and in
RCA team
15 18 18 27 31 24 33
Number of
Operations
employees trained
in RCA (%) 0.00 0.00 0.00 7.61 9.09 9.09 13.78 15.82 12.57 17.28
Operator
involvement
Total number of
less than 2 hour
incidents (minor
incidents) in Kilns
1 & 2 during silent
hours
41 53 48 57 53 42 47 51 45 49
Number of times
Maintenance team
is called into the
plant for minor
incidents
32 39 35 36 41 34 29 27 21 37
Operator
involvement (%)
21.95 26.42 27.08 36.84 22.64 19.05 38.30 47.06 53.33 24.49
Autonomous
Maintenance
Score (%)
9.74 11.22 13.12 18.85 15.62 14.44 22.78 26.34 27.39 19.42
PLANNED
MAINTENANCE
Disciplined
planning and
Schedule
compliance
Number of
budgeted
shutdown
stoppages (2
shutdowns per kiln
shop per year)
2 2 2 2 2 2 2 2 2 2
Page 75
64
Total number of
stoppages on
planned condition-
based maintenance
on Kilns 1 & 2
7 5 4 5 6 4
Planned
Maintenance
Score (%)
28.57 40.00 50.00 40.00 33.33 50.00
TPM
PRACTICE
YEAR
2005 2005 2006 2006 2007 2007 2008 2008 2009 2009
Jan -
June
June
- Dec
Jan -
June
June
- Dec
Jan -
June
June
- Dec
Jan -
June
June
- Dec
Jan -
June
June
- Dec
LOST
EQUIPMENT
TIME
Total number of
incidents in Kiln
shop
19 17 15 21 22 20 27 25 12 13
Total number of
Root Cause
Analyses done
6 9 4 6 12 9 8 11 6 5
Lost Equipment
Time Score (%)
31.58 52.94 26.67 28.57 54.55 45.00 29.63 44.00 50.00 38.46
AUTONOMOUS
MAINTENANCE
Cross-training of
employees
Maintenance
personnel trained
in basics of
cement production
19 19 25 25 25 25 29 29 34 34
Total number of
Maintenance
personnel
103 103 104 104 107 107 105 105 102 102
Maintenance
cross-training rate
(%)
18.45 18.45 24.04 24.04 23.36 23.36 27.62 27.62 33.33 33.33
Production
personnel trained
in basics of
equipment
maintenance
15 15 15 15 20 20 20 20 27 27
Page 76
65
Total number of
Production
personnel
84 84 81 81 81 81 83 83 78 78
Production cross-
training rate (%)
17.86 17.86 18.52 18.52 24.69 24.69 24.10 24.10 34.62 34.62
Global cross-
training rate (%)
18.09 18.09 20.65 20.65 24.18 24.18 25.46 25.46 34.12 34.12
Cross-functional
problem-solving
teams
Number of
operations
employees trained
in RCA and in
RCA team
31 34 35 40 40 45 45 49 61 61
Number of
Operations
employees trained
in RCA (%) 16.58 18.18 18.92 21.62 21.28 23.94 23.94 26.06 33.89 33.89
Operator
involvement
Total number of
less than 2 hour
incidents (minor
incidents) in Kilns
1 & 2 during silent
hours
50 54 53 48 58 51 61 52 35 43
Number of times
Maintenance team
is called into the
plant for minor
incidents
21 28 26 22 36 33 32 37 21 26
Operator
involvement (%)
58.00 48.15 50.94 54.17 37.93 35.29 47.54 28.85 40.00 39.53
Autonomous
Maintenance
Score (%)
30.58 27.86 29.87 31.83 27.52 27.52 31.99 26.52 35.64 35.49
PLANNED
MAINTENANCE
Disciplined
planning and
Schedule
Page 77
66
compliance
Number of
budgeted
shutdown
stoppages (2
shutdowns per kiln
shop per year)
2 2 2 2 2 2 2 2 2 2
Total number of
stoppages on
planned condition-
based maintenance
on Kilns 1 & 2
3 8 7 3 5 6 4 5 3 3
Planned
Maintenance
Score (%)
66.67 25.00 28.57 66.67 40.00 33.33 50.00 40.00 66.67 66.67
TPM
PRACTICE
YEAR
2010 2010 2011 2011 2012 2012 2013 2013 2014 2014
Jan -
June
June
- Dec
Jan -
June
June
- Dec
Jan -
June
June
- Dec
Jan -
June
June
- Dec
Jan -
June
June
- Dec
LOST
EQUIPMENT
TIME
Total number of
incidents in Kiln
shop
17 19 15 18 21 22 20 17 23 18
Total number of
Root Cause
Analyses done
8 11 9 9 8 14 10 9 15 11
Lost Equipment
Time Score (%)
47.06 57.89 60.00 50.00 38.10 63.64 50.00 52.94 65.22 61.11
AUTONOMOUS
MAINTENANCE
Cross-training of
employees
Maintenance
personnel trained
in basics of
cement production
36 36 36 36 37 37 38 38 41 41
Total number of
Maintenance
personnel
99 99 98 98 95 95 92 92 96 96
Page 78
67
Maintenance
cross-training rate
(%)
36.36 36.36 36.73 36.73 38.95 38.95 41.30 41.30 42.71 42.71
Production
personnel trained
in basics of
equipment
maintenance
27 27 25 25 28 28 30 30 33 33
Total number of
Production
personnel
75 75 73 73 69 69 65 65 64 64
Production cross-
training rate (%)
36.00 36.00 34.25 34.25 40.58 40.58 46.15 46.15 51.56 51.56
Global cross-
training rate (%)
36.14 36.14 35.21 35.21 39.95 39.95 44.28 44.28 48.14 48.14
Cross-functional
problem-solving
teams
Number of
operations
employees trained
in RCA and in
RCA team
63 63 61 61 65 65 68 68 74 74
Number of
Operations
employees trained
in RCA (%) 36.21 36.21 35.67 35.67 39.63 39.63 43.31 43.31 46.25 46.25
Operator
involvement
Total number of
less than 2 hour
incidents (minor
incidents) in Kilns
1 & 2 during silent
hours
47 39 42 48 51 45 52 45 46 48
Number of times
Maintenance team
is called into the
plant for minor
incidents
29 23 26 27 35 41 34 29 21 27
Operator
involvement (%)
38.30 41.03 38.10 43.75 31.37 8.89 34.62 35.56 54.35 43.75
Autonomous
Maintenance
Score (%)
36.51 37.41 35.96 37.83 36.62 29.20 40.33 40.64 49.08 45.59
Page 79
68
PLANNED
MAINTENANCE
Disciplined
planning and
Schedule
compliance
Number of
budgeted
shutdown
stoppages (2
shutdowns per kiln
shop per year)
2 2 2 2 2 2 2 2 2 2
Total number of
stoppages on
planned condition-
based maintenance
on Kilns 1 & 2
4 5 3 4 3 4 5 3 4 3
Planned
Maintenance
Score (%)
50.00 40.00 66.67 50.00 66.67 50.00 40.00 66.67 50.00 66.67