28
the Belgian market in Flanders July 2013 toerisme vlaanderen Tourism in figures 2012
the Belgian market in Flanders July 2013
toer ismevlaanderen
Tourism in figures 2012

TABLE OF CONTENT
A. THE BELGIAN MARKET IN FLANDERS 5
1. Key figures 5
2. Distribution within Flanders 5
3. Trends 8
4. Economic indicators 13
5. Motive of stay 15
6. Type of accommodation 16
7. Seasonality 17
B. PROFILE OF THE BELGIAN LEISURE MARKET IN FLANDERS 19
The Belgian Market 19
1. Profile 19
2. Competitive position and motivation 21
3. Characteristics of the trip 22
4. Information sources 24
5. Activities 24
6. Satisfaction and return visit 25
7. Spending 27
C. CONCEPTS AND DEFINITIONS 28
Figure 1: The Belgian market in Flanders by region 2012 (arrivals (left) and overnights (right)) ............. 5 Figure 2: Belgian overnights in Flanders 2012 ................................................................................................ 6 Figure 3: Belgian overnights in the historic cities 2012 .................................................................................. 7 Figure 4: Trend of Belgian overnights in Flanders 2003-2012 ...................................................................... 8 Figure 5: Trend of Belgian arrivals in Flanders 2003-2012 ............................................................................ 9 Figure 6: Trend of the average length of stay of Belgians in Flanders 2003-2012 ..................................... 9 Figure 7: Trend of Belgian overnights in Brussels, Antwerp and Bruges 2008-2012 .............................. 10 Figure 8: Trend of Belgian overnights in Ghent, Leuven, Mechelen 2008-2012 ...................................... 11 Figure 9: Trend of Belgian overnights at the coast 2008-2012 ................................................................... 11 Figure 10: Trend of Belgian overnights in the Flemish countryside 2008-2012 ........................................ 12 Figure 11: Trend of the Belgian economy 2008-2012 .................................................................................. 13 Figure 12: Belgian Outbound Travel 2008-2012 ........................................................................................... 14 Figure 13: The Belgian market in Flanders by motive of stay 2012 (overnights) ..................................... 15 Figure 14: The Belgian market in Flanders by type of accommodation 2012 (overnights) ..................... 16 Figure 15: Belgian overnights in Flanders – seasonality 2012 .................................................................... 17 P Kennisbeheer 3 coverfoto © Westtoer
t oer ismevlaanderen
Figure 16: Belgian overnights in the historic cities – seasonality 2012 ...................................................... 17 Figure 17: Trend Belgian overnights in Flanders – seasonality 2008-2012 .............................................. 18 Figure 18: Age of the surveyed Belgian overnight leisure tourist in Flanders ........................................... 20 Figure 19: Top 5 reasons for Belgians visiting the coast .............................................................................. 22 Figure 20 Top 5 reasons for Belgians visiting the art cities ......................................................................... 22 Figure 21: Top 5 reasons for Belgians visiting the Flemish countryside .................................................... 22 Figure 22: Satisfaction of the Belgian overnight leisure tourist in Flanders ............................................... 26 Figure 23: Evaluation of value for money* by the Belgian overnight leisure tourist in Flanders............. 26 Figure 24: Intentional return visit* by the Belgian overnight leisure tourist in Flanders ........................... 27
Table 1: Total foreign and Belgian market in Flanders 2012 ......................................................................... 5 Table 2: The Belgian market in Flanders by region 2012 .............................................................................. 5 Table 3: The Belgian market in Flanders by destination 2012 ...................................................................... 6 Table 4: The Belgian market in the historic cities 2012 .................................................................................. 6 Table 5: Trend of Belgian overnights, arrivals and average length of stay in Flanders 2003-2012 ......... 8 Table 6: Trend of Belgian overnights in Flanders 2008-2012 ...................................................................... 10 Table 7: Trend of the Belgian economy 2008-2012 ...................................................................................... 13 Table 8: Trend of the Belgian population 2008-2012 .................................................................................... 14 Table 9: The Belgian market in Flanders by motive of stay 2012 (overnights) ......................................... 15 Table 10: The Belgian market in Flanders by type of accommodation 2012 (overnights) ...................... 16 Table 11: Profession and educational level of the head of the family of the Belgian overnight leisure
tourist in Flanders ....................................................................................................................................... 21 Table 12 Travelling group of the Belgian overnight leisure tourist in Flanders ......................................... 23 Table 13: Transport taken by the Belgian overnight leisure tourist to Flanders ........................................ 23 Table 14: Booking of accommodation by the Belgian overnight leisure tourist in Flanders .................... 24 Table 15: Information sources used by the Belgian overnight leisure tourist in Flanders ....................... 24 Table 16: Return visit by the Belgian overnight leisure tourist in Flanders ................................................ 26 Table 17: Average spend of the Belgian overnight leisure tourist in Flanders .......................................... 27
Kennisbeheer 4
A. The Belgian market in Flanders
1. Key figures
Table 1: Total foreign and Belgian market in Flanders 2012
total Belgian % Belgian travellers travellers arrivals 10.988.858 4.611.521 42,0% overnight stays 24.888.349 11.112.587 44,6% length of stay (nights) 2,3 2,4 -
Source: Tourism Flanders based on GDS
2. Distribution within Flanders
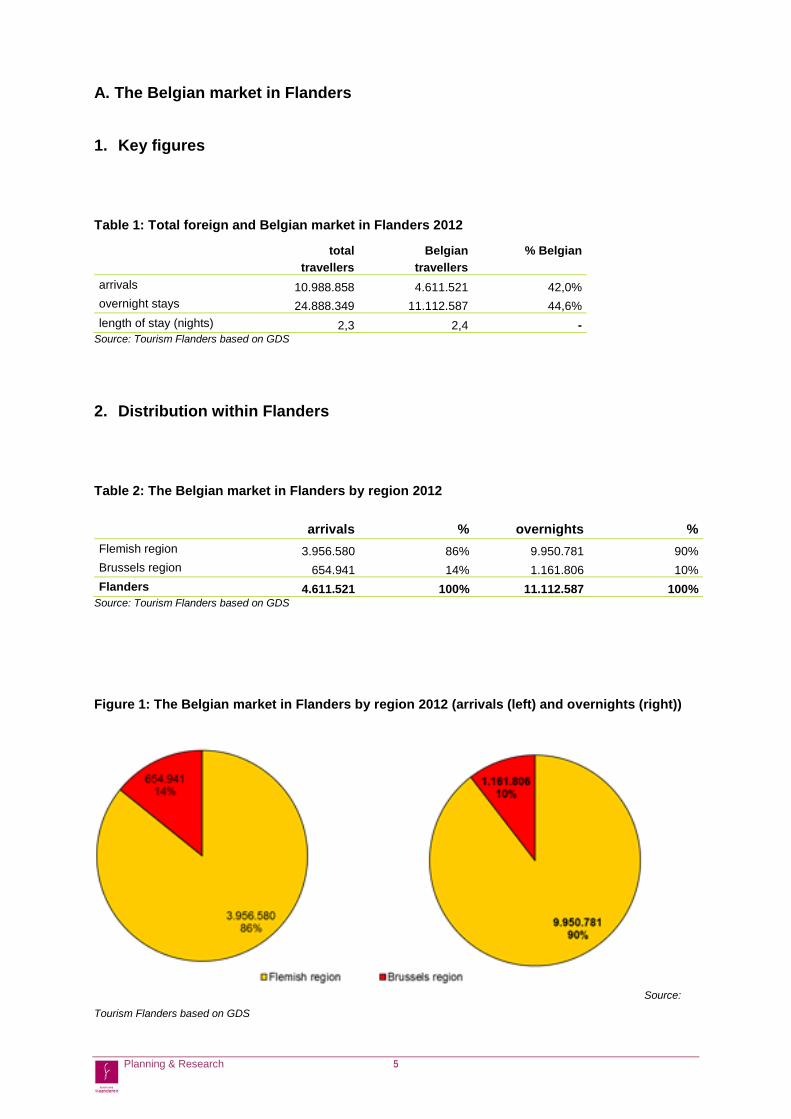
Table 2: The Belgian market in Flanders by region 2012
arrivals % overnights % Flemish region 3.956.580 86% 9.950.781 90% Brussels region 654.941 14% 1.161.806 10% Flanders 4.611.521 100% 11.112.587 100%
Source: Tourism Flanders based on GDS
Figure 1: The Belgian market in Flanders by region 2012 (arrivals (left) and overnights (right))
Source:
Tourism Flanders based on GDS
Planning & Research 5
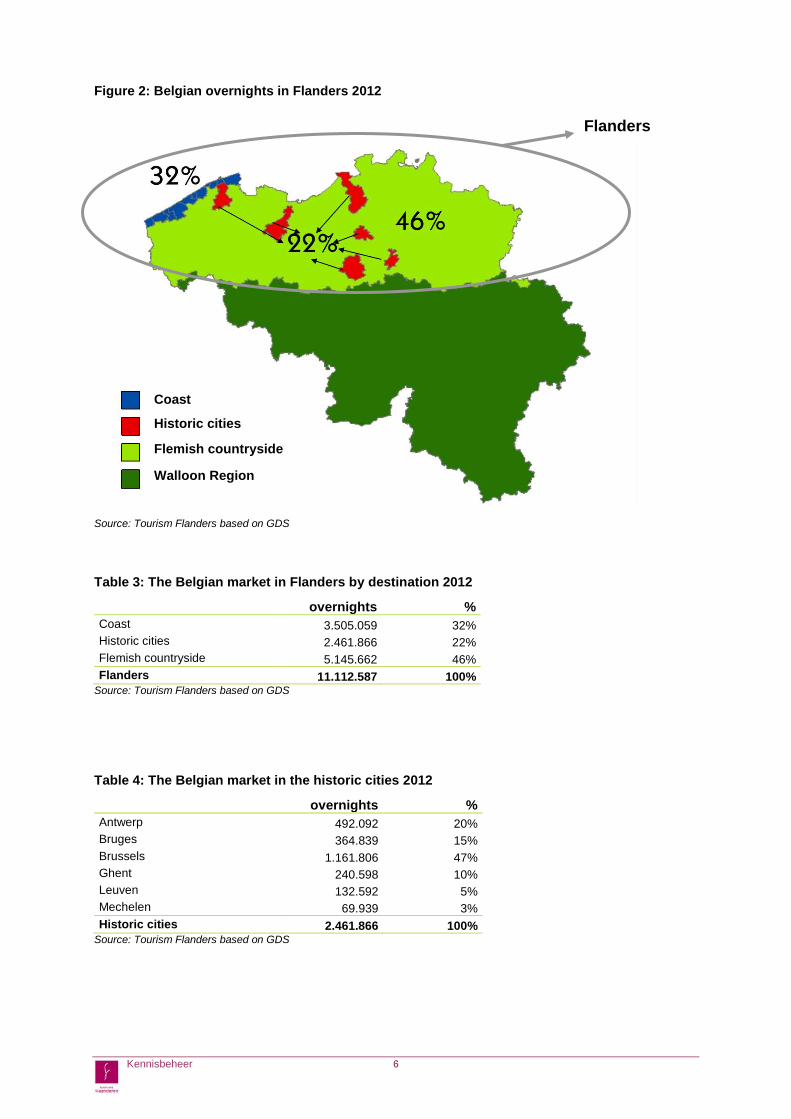
Figure 2: Belgian overnights in Flanders 2012
Source: Tourism Flanders based on GDS
Table 3: The Belgian market in Flanders by destination 2012
overnights % Coast 3.505.059 32% Historic cities 2.461.866 22% Flemish countryside 5.145.662 46% Flanders 11.112.587 100%
Source: Tourism Flanders based on GDS
Table 4: The Belgian market in the historic cities 2012
overnights % Antwerp 492.092 20% Bruges 364.839 15% Brussels 1.161.806 47% Ghent 240.598 10% Leuven 132.592 5% Mechelen 69.939 3% Historic cities 2.461.866 100%
Source: Tourism Flanders based on GDS
Historic cities
Coast
Flemish countryside
Walloon Region
Flanders
Kennisbeheer 6
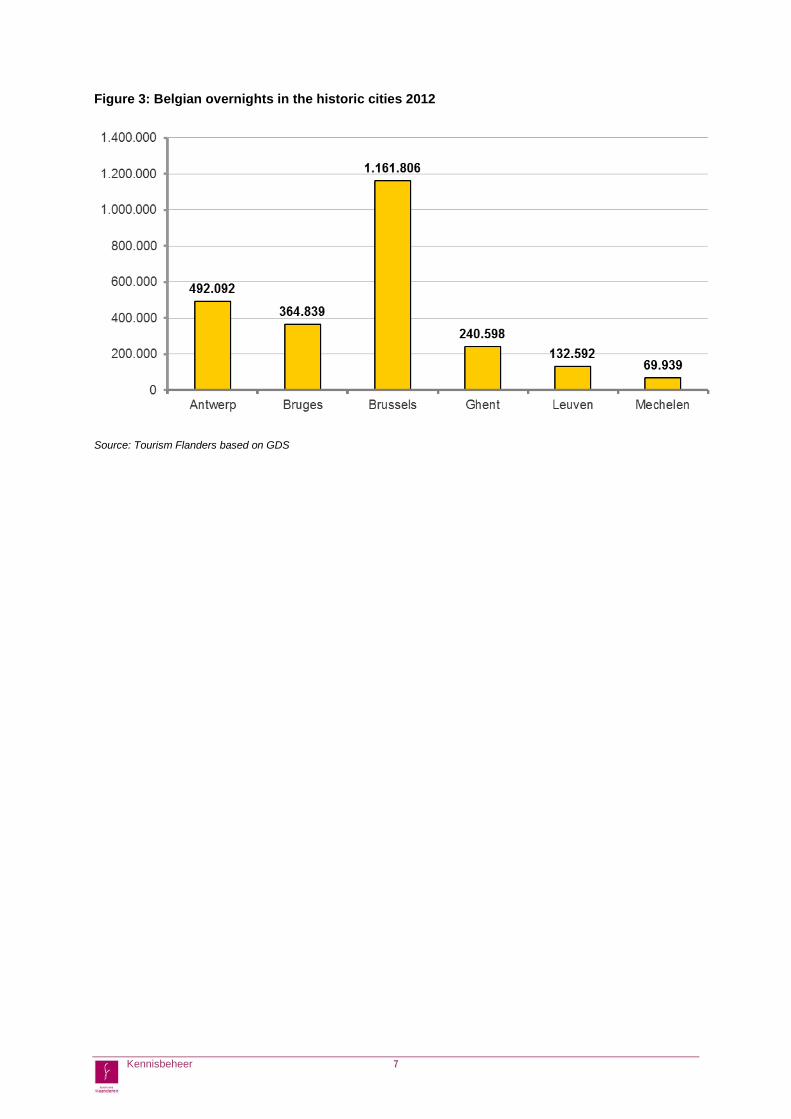
Figure 3: Belgian overnights in the historic cities 2012
Source: Tourism Flanders based on GDS
Kennisbeheer 7
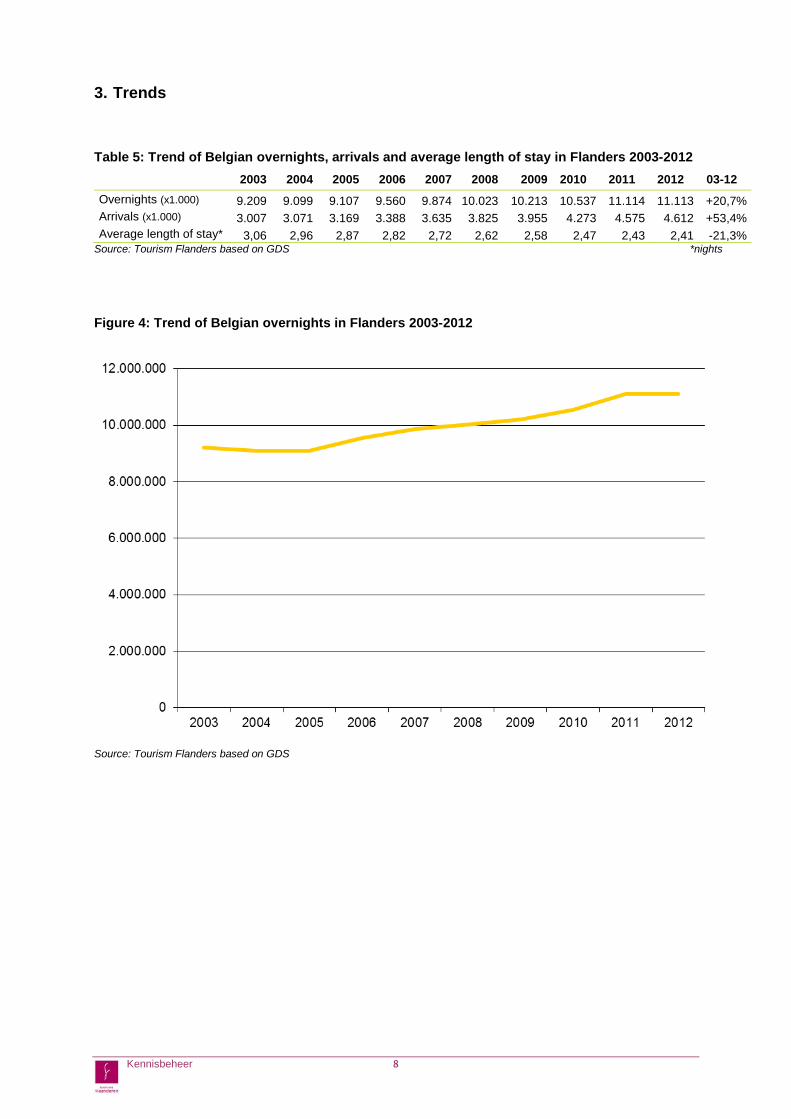
3. Trends
Table 5: Trend of Belgian overnights, arrivals and average length of stay in Flanders 2003-2012 2003 2004 2005 2006 2007 2008 2009 2010 2011 2012 03-12 Overnights (x1.000) 9.209 9.099 9.107 9.560 9.874 10.023 10.213 10.537 11.114 11.113 +20,7% Arrivals (x1.000) 3.007 3.071 3.169 3.388 3.635 3.825 3.955 4.273 4.575 4.612 +53,4% Average length of stay* 3,06 2,96 2,87 2,82 2,72 2,62 2,58 2,47 2,43 2,41 -21,3%
Source: Tourism Flanders based on GDS *nights
Figure 4: Trend of Belgian overnights in Flanders 2003-2012
Source: Tourism Flanders based on GDS
Kennisbeheer 8
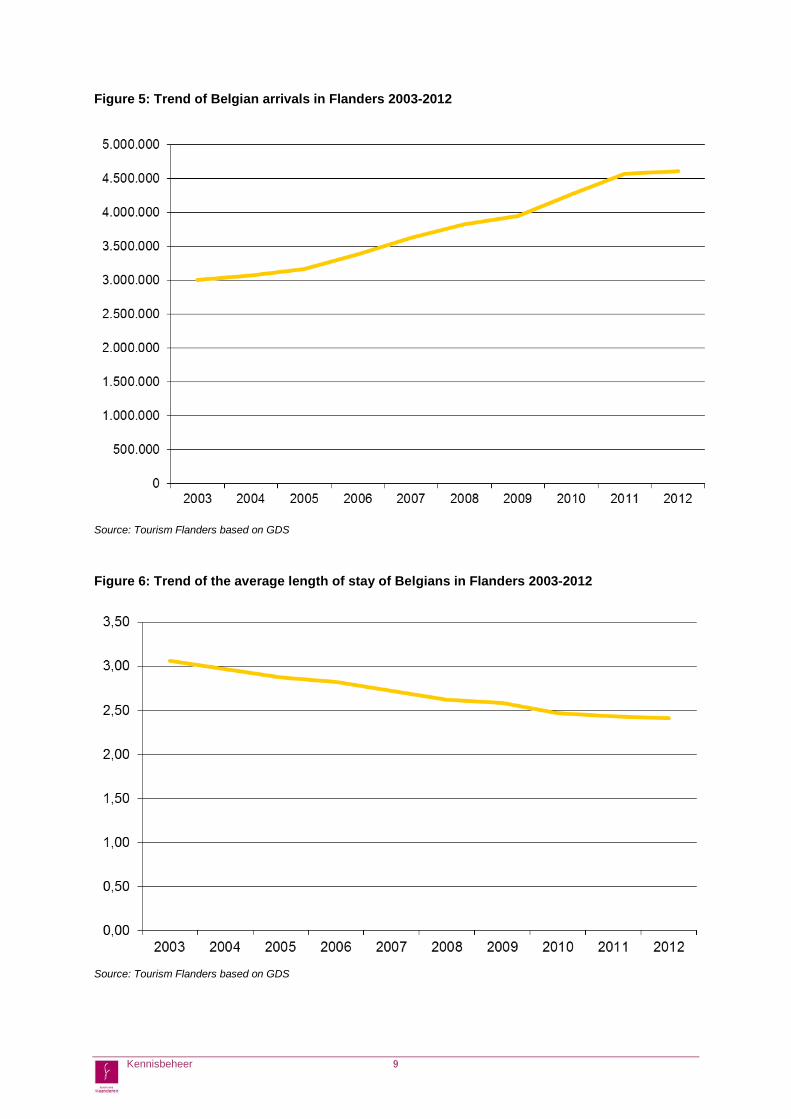
Figure 5: Trend of Belgian arrivals in Flanders 2003-2012
Source: Tourism Flanders based on GDS
Figure 6: Trend of the average length of stay of Belgians in Flanders 2003-2012
Source: Tourism Flanders based on GDS
Kennisbeheer 9
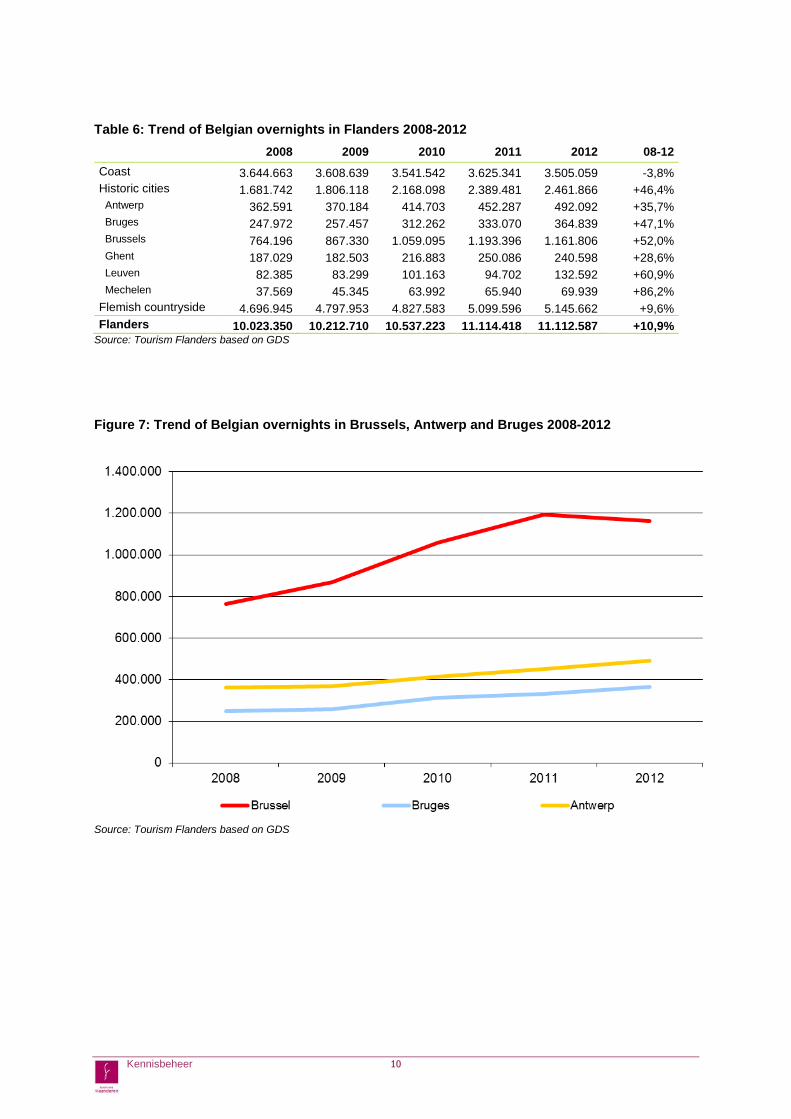
Table 6: Trend of Belgian overnights in Flanders 2008-2012 2008 2009 2010 2011 2012 08-12 Coast 3.644.663 3.608.639 3.541.542 3.625.341 3.505.059 -3,8% Historic cities 1.681.742 1.806.118 2.168.098 2.389.481 2.461.866 +46,4% Antwerp 362.591 370.184 414.703 452.287 492.092 +35,7% Bruges 247.972 257.457 312.262 333.070 364.839 +47,1% Brussels 764.196 867.330 1.059.095 1.193.396 1.161.806 +52,0% Ghent 187.029 182.503 216.883 250.086 240.598 +28,6% Leuven 82.385 83.299 101.163 94.702 132.592 +60,9% Mechelen 37.569 45.345 63.992 65.940 69.939 +86,2% Flemish countryside 4.696.945 4.797.953 4.827.583 5.099.596 5.145.662 +9,6% Flanders 10.023.350 10.212.710 10.537.223 11.114.418 11.112.587 +10,9%
Source: Tourism Flanders based on GDS
Figure 7: Trend of Belgian overnights in Brussels, Antwerp and Bruges 2008-2012
Source: Tourism Flanders based on GDS
Kennisbeheer 10
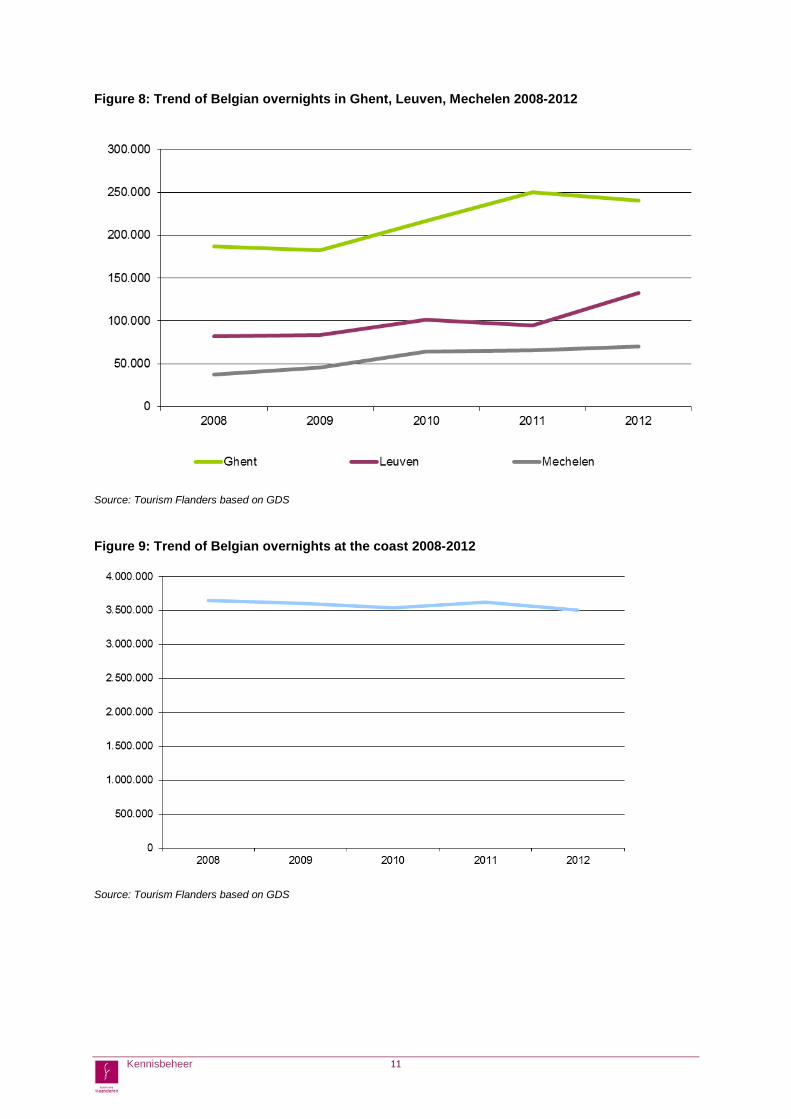
Figure 8: Trend of Belgian overnights in Ghent, Leuven, Mechelen 2008-2012
Source: Tourism Flanders based on GDS
Figure 9: Trend of Belgian overnights at the coast 2008-2012
Source: Tourism Flanders based on GDS
Kennisbeheer 11
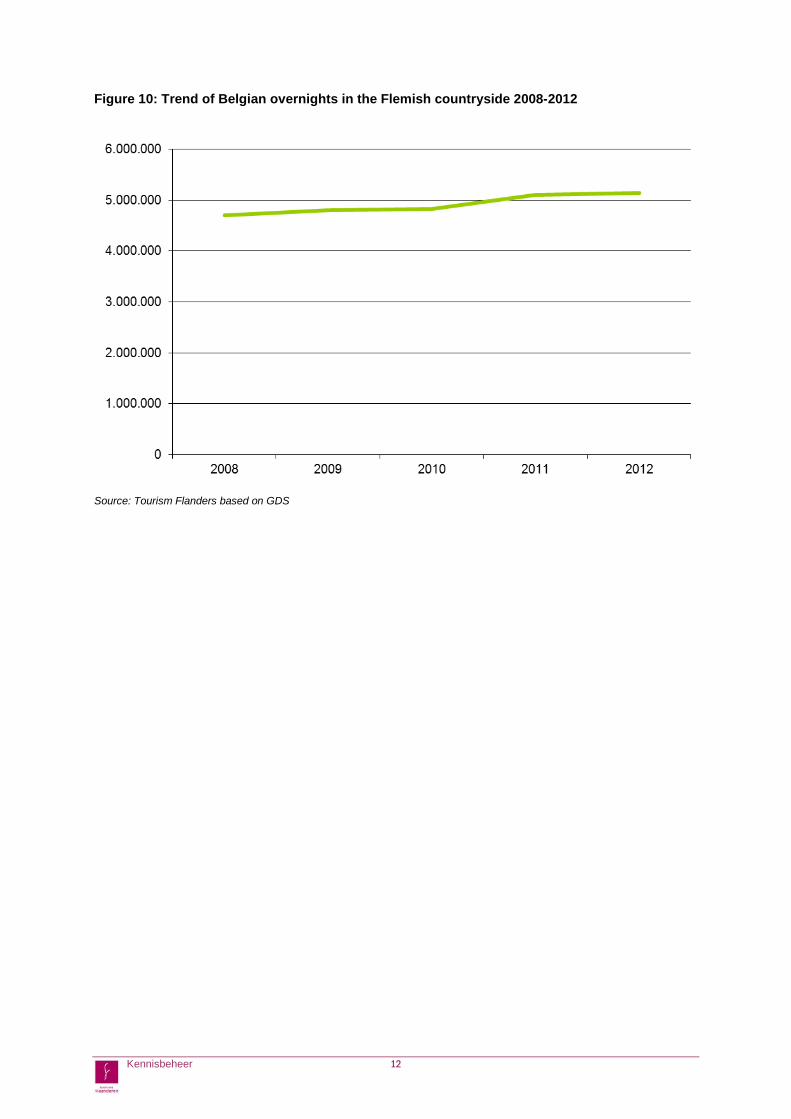
Figure 10: Trend of Belgian overnights in the Flemish countryside 2008-2012
Source: Tourism Flanders based on GDS
Kennisbeheer 12
4. Economic indicators
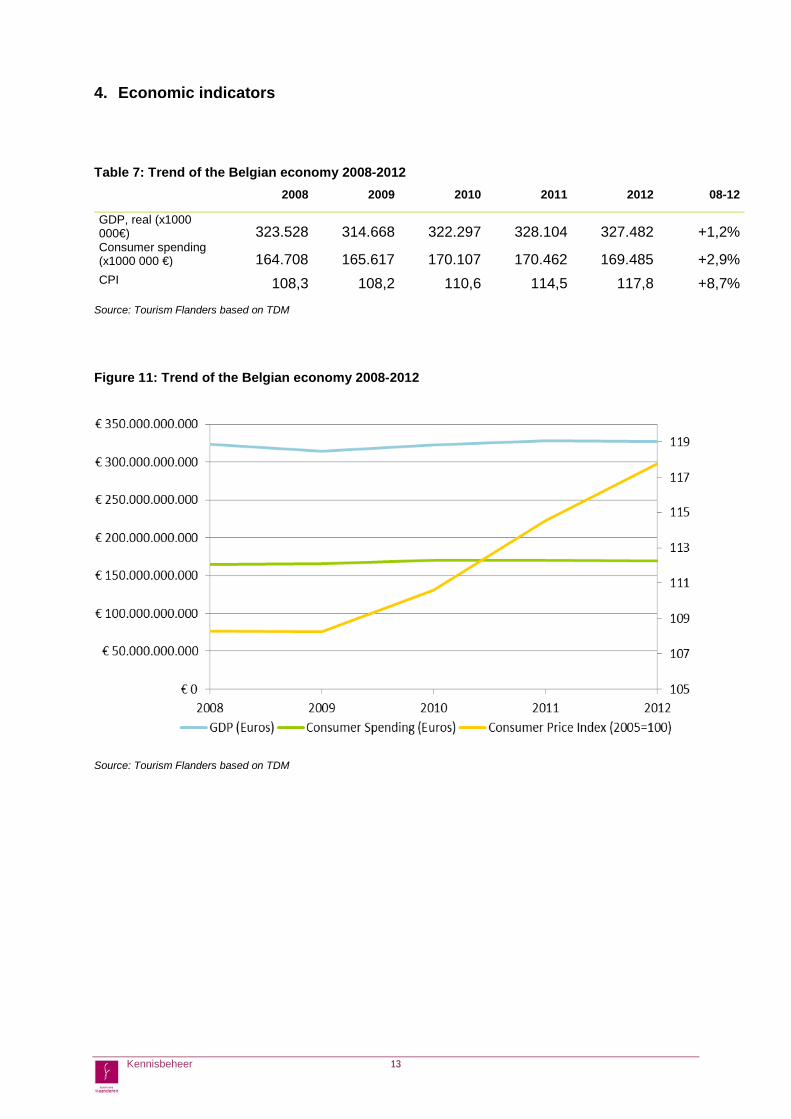
Table 7: Trend of the Belgian economy 2008-2012 2008 2009 2010 2011 2012 08-12
GDP, real (x1000 000€) 323.528 314.668 322.297 328.104 327.482 +1,2% Consumer spending (x1000 000 €) 164.708 165.617 170.107 170.462 169.485 +2,9% CPI 108,3 108,2 110,6 114,5 117,8 +8,7%
Source: Tourism Flanders based on TDM
Figure 11: Trend of the Belgian economy 2008-2012
Source: Tourism Flanders based on TDM
Kennisbeheer 13
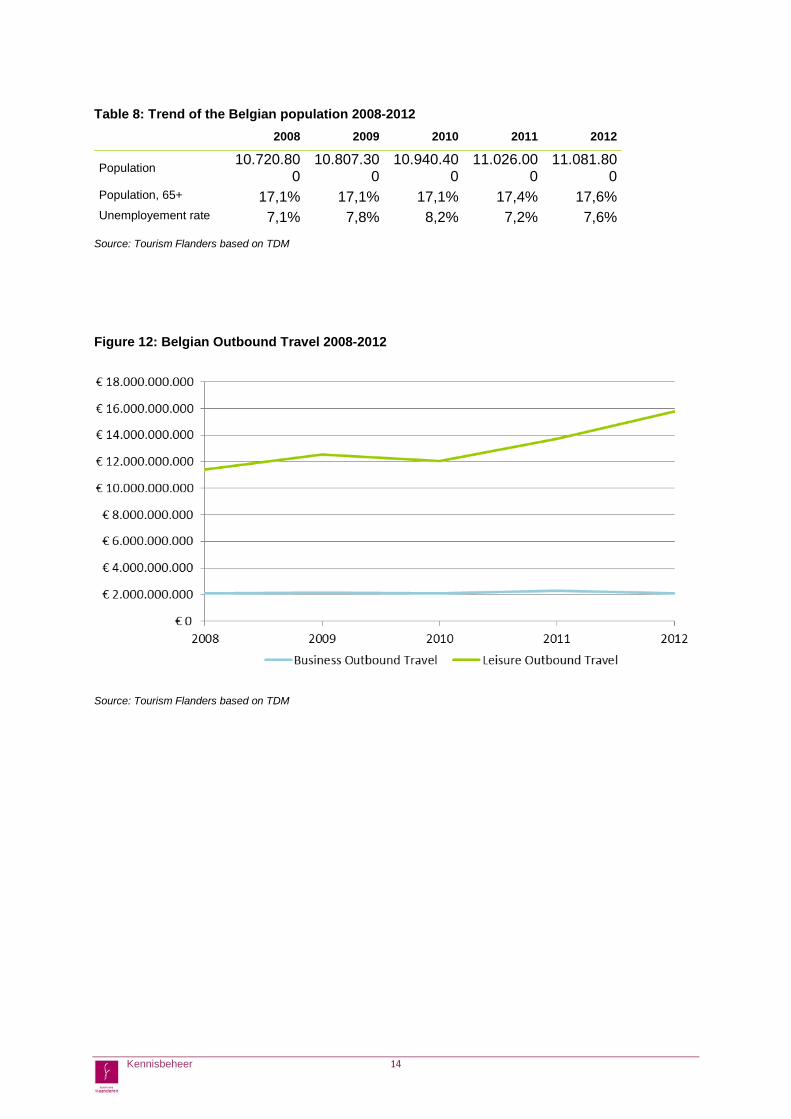
Table 8: Trend of the Belgian population 2008-2012 2008 2009 2010 2011 2012
Population 10.720.800
10.807.300
10.940.400
11.026.000
11.081.800
Population, 65+ 17,1% 17,1% 17,1% 17,4% 17,6% Unemployement rate 7,1% 7,8% 8,2% 7,2% 7,6%
Source: Tourism Flanders based on TDM
Figure 12: Belgian Outbound Travel 2008-2012
Source: Tourism Flanders based on TDM
Kennisbeheer 14
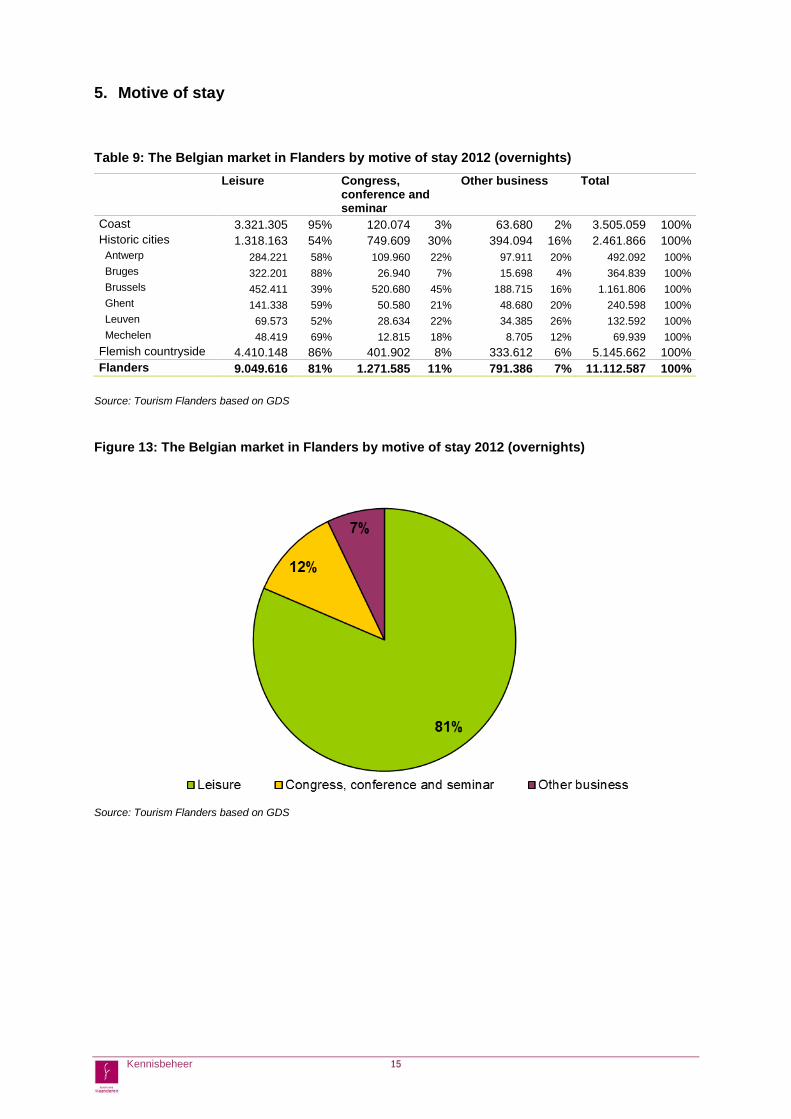
5. Motive of stay
Table 9: The Belgian market in Flanders by motive of stay 2012 (overnights)
Leisure Congress, conference and seminar
Other business Total
Coast 3.321.305 95% 120.074 3% 63.680 2% 3.505.059 100% Historic cities 1.318.163 54% 749.609 30% 394.094 16% 2.461.866 100% Antwerp 284.221 58% 109.960 22% 97.911 20% 492.092 100% Bruges 322.201 88% 26.940 7% 15.698 4% 364.839 100% Brussels 452.411 39% 520.680 45% 188.715 16% 1.161.806 100% Ghent 141.338 59% 50.580 21% 48.680 20% 240.598 100% Leuven 69.573 52% 28.634 22% 34.385 26% 132.592 100% Mechelen 48.419 69% 12.815 18% 8.705 12% 69.939 100% Flemish countryside 4.410.148 86% 401.902 8% 333.612 6% 5.145.662 100% Flanders 9.049.616 81% 1.271.585 11% 791.386 7% 11.112.587 100%
Source: Tourism Flanders based on GDS
Figure 13: The Belgian market in Flanders by motive of stay 2012 (overnights)
Source: Tourism Flanders based on GDS
Kennisbeheer 15
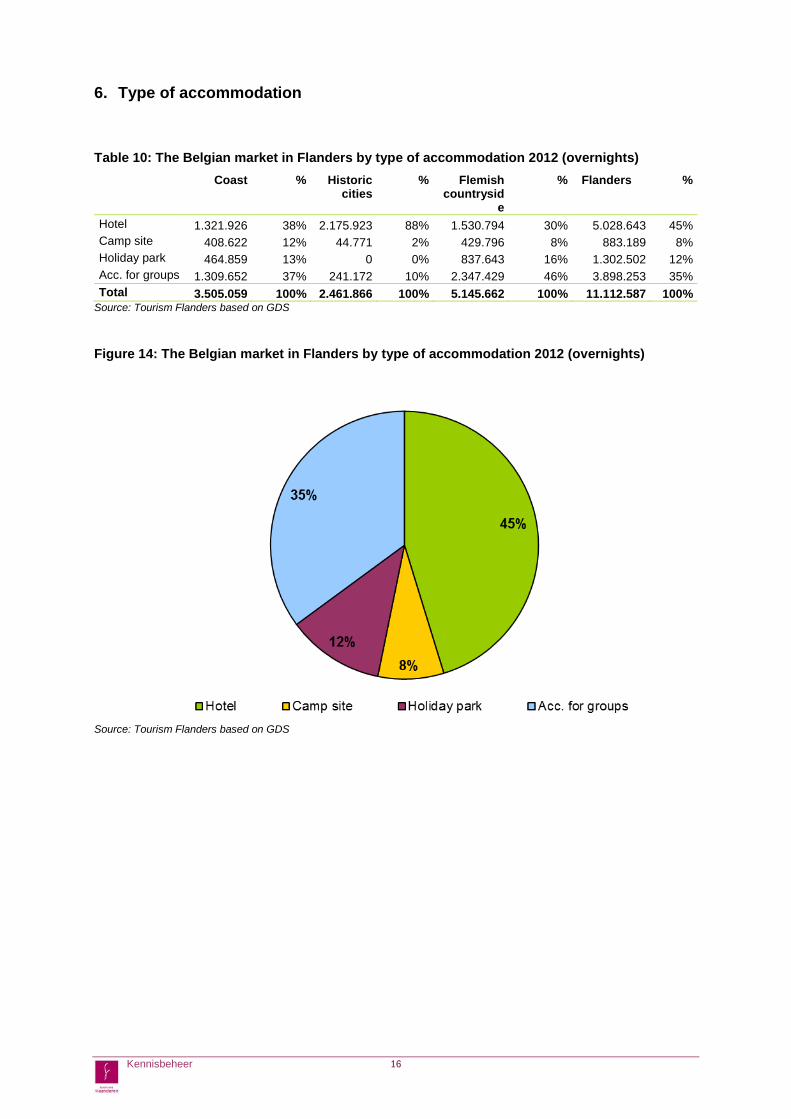
6. Type of accommodation
Table 10: The Belgian market in Flanders by type of accommodation 2012 (overnights)
Coast % Historic cities
% Flemish countrysid
e
% Flanders %
Hotel 1.321.926 38% 2.175.923 88% 1.530.794 30% 5.028.643 45% Camp site 408.622 12% 44.771 2% 429.796 8% 883.189 8% Holiday park 464.859 13% 0 0% 837.643 16% 1.302.502 12% Acc. for groups 1.309.652 37% 241.172 10% 2.347.429 46% 3.898.253 35% Total 3.505.059 100% 2.461.866 100% 5.145.662 100% 11.112.587 100%
Source: Tourism Flanders based on GDS
Figure 14: The Belgian market in Flanders by type of accommodation 2012 (overnights)
Source: Tourism Flanders based on GDS
Kennisbeheer 16
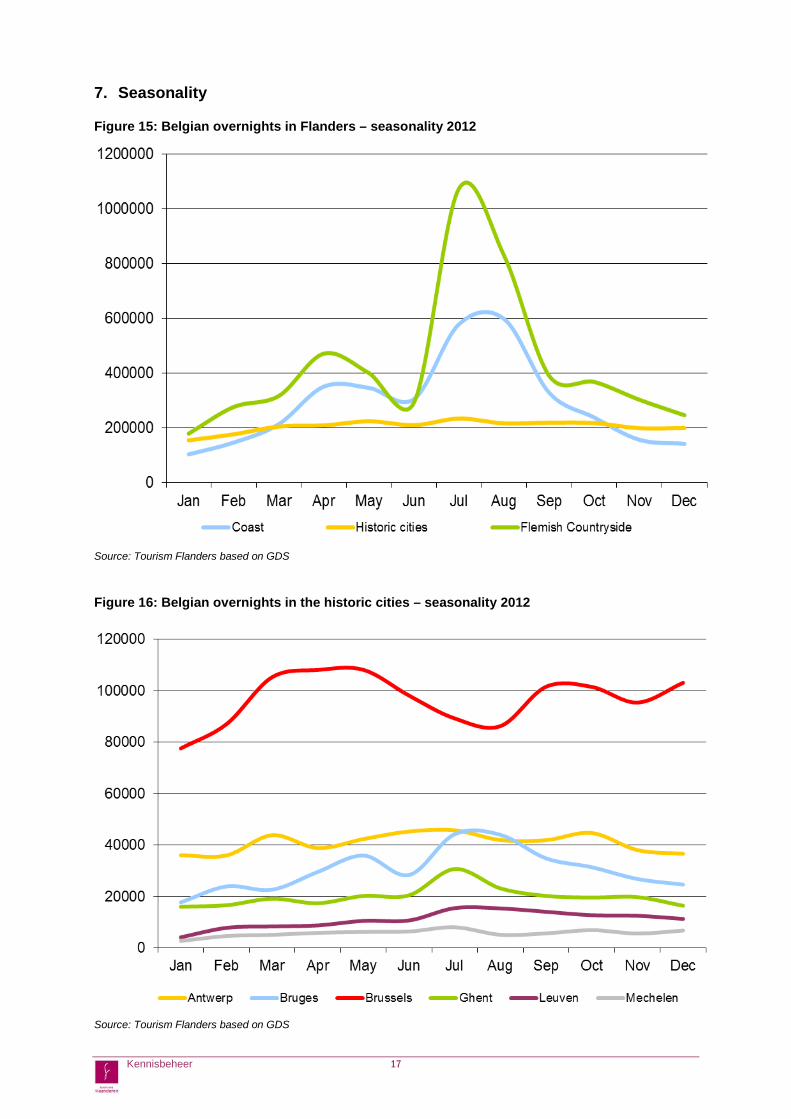
7. Seasonality
Figure 15: Belgian overnights in Flanders – seasonality 2012
Source: Tourism Flanders based on GDS
Figure 16: Belgian overnights in the historic cities – seasonality 2012
Source: Tourism Flanders based on GDS
Kennisbeheer 17
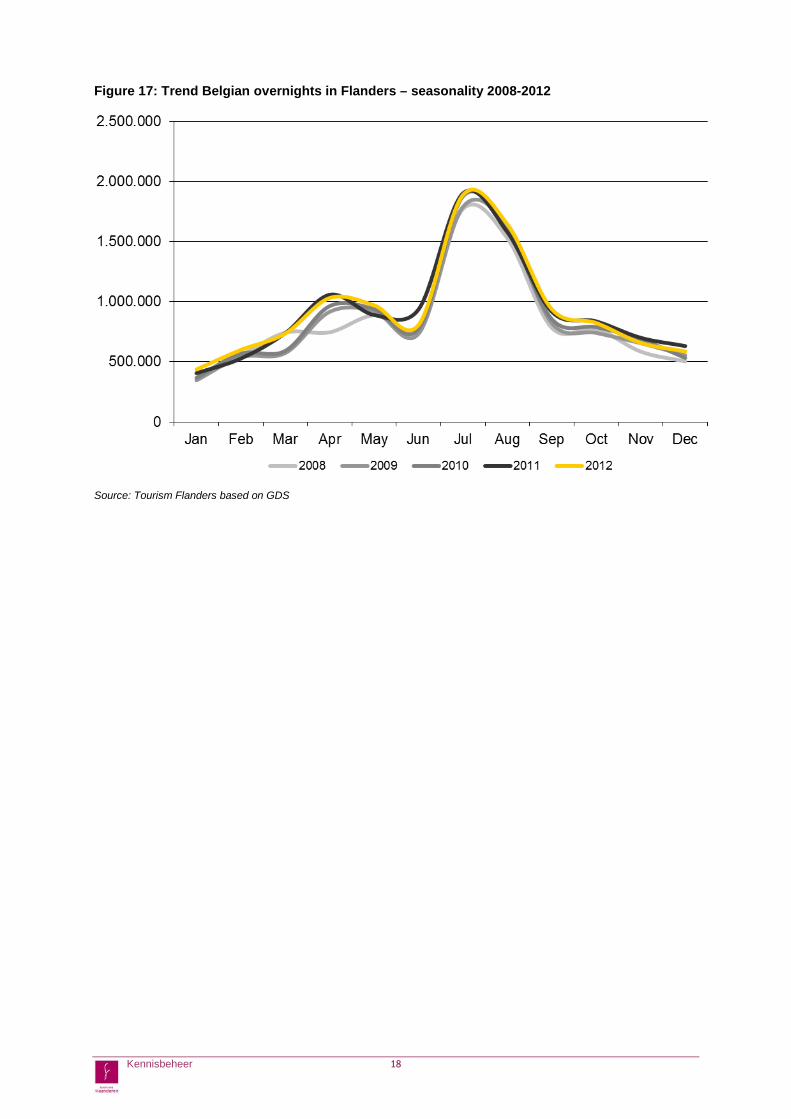
Figure 17: Trend Belgian overnights in Flanders – seasonality 2008-2012
Source: Tourism Flanders based on GDS
Kennisbeheer 18
B. PROFILE OF THE BELGIAN LEISURE MARKET IN FLANDERS This chapter is based on “the holiday maker in Flanders 2011”, an extensive market study carried out
every five years in Flanders. In this section we focus on the main characteristics of the Belgian leisure
market in Flanders. We look at the profile, motivations, characteristics of the trip, information source,
activities, satisfaction and spending of the foreign tourist in Flanders.
The Belgian Market
The domestic market for overnight leisure stays is largest in Flanders. According to statistics produced by the FPS Economy, Directorate-General Statistics, it accounts for a little over 11 million overnight stays excluding overnight stays in holiday homes and bed & breakfast establishments. The number is on a rising trend. 46% of these Belgian overnight stays are in the countryside, 21% in the cities and the remaining 33% on the coast. The FPS Directorate-General Statistics covers only holiday home rentals on the coast, and only those offered through rental agencies are counted. The figure reaches almost 4 million Belgian overnight stays. This brings the total number of domestic overnight stays to 15 million, of which almost 13 million are leisure stays. Westtoer also provides figures for direct rentals on the coast, i.e. overnight stays in holiday homes not rented through an estate agent. This gives another 4.8 million. The exact proportion of Belgians is unknown, but it is certainly the overwhelming majority. A great many Belgians also stay bed & breakfast or in holiday homes in the Flemish countryside. The organisation “Logeren in Vlaanderen” estimates the number of Belgian recreational overnight stays in holiday homes in the countryside at 375,000, and 235,000 in bed & breakfast establishments. The majority of Belgians on the coast are from Flanders. As much as a fifth of them come from the province of Antwerp. Flemish Brabant and East Flanders each account for 15%. In the art cities, the figures divide according to region. 60% of Belgians who stay overnight in one of the art cities live in the Flemish Region, 39% in the Walloon Region and just 1% in the Brussels Region. All the Belgians surveyed in the Flanders countryside were Flemings. The West Flemings travel the Flemish countryside most. They account for 27% of the overnight stays, and residents of the provinces of Antwerp and East Flanders each account for a quarter. 1. Profile The Belgian tourist in the survey is, on average, youngest in the art cities: 45. Compared with the other nationalities, this makes him among the youngest. At the coast he is oldest. And, at 55 years of age, he is also a little older than average. In the Flemish countryside the average age of the respondent is 51. Of all Belgians, the 50-64 group is most strongly represented in all three destinations. But the destinations differ for the other age groups. On the coast the 35-49 group is almost as large as the 50-64 group. The over-65s account for a share of 30%. Young Belgians are found at the coast in much smaller numbers. In the art cities we see a completely different picture. Young people account for more than 30%, and half of those are under 25. This group is larger than any other nationality. The over-65s account for just 6% in the cities. In the Flemish countryside the distribution is better balanced. The groups of young and old are approximately the same size.
Kennisbeheer 19
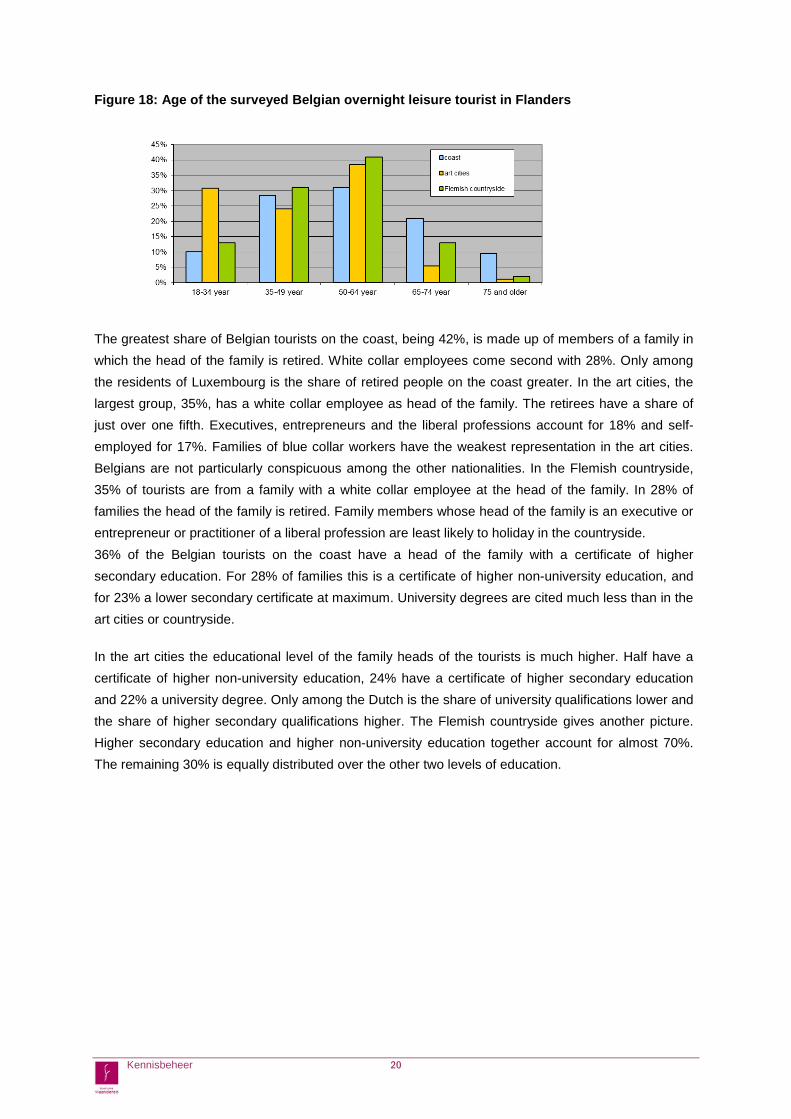
Figure 18: Age of the surveyed Belgian overnight leisure tourist in Flanders The greatest share of Belgian tourists on the coast, being 42%, is made up of members of a family in which the head of the family is retired. White collar employees come second with 28%. Only among the residents of Luxembourg is the share of retired people on the coast greater. In the art cities, the largest group, 35%, has a white collar employee as head of the family. The retirees have a share of just over one fifth. Executives, entrepreneurs and the liberal professions account for 18% and self-employed for 17%. Families of blue collar workers have the weakest representation in the art cities. Belgians are not particularly conspicuous among the other nationalities. In the Flemish countryside, 35% of tourists are from a family with a white collar employee at the head of the family. In 28% of families the head of the family is retired. Family members whose head of the family is an executive or entrepreneur or practitioner of a liberal profession are least likely to holiday in the countryside. 36% of the Belgian tourists on the coast have a head of the family with a certificate of higher secondary education. For 28% of families this is a certificate of higher non-university education, and for 23% a lower secondary certificate at maximum. University degrees are cited much less than in the art cities or countryside. In the art cities the educational level of the family heads of the tourists is much higher. Half have a certificate of higher non-university education, 24% have a certificate of higher secondary education and 22% a university degree. Only among the Dutch is the share of university qualifications lower and the share of higher secondary qualifications higher. The Flemish countryside gives another picture. Higher secondary education and higher non-university education together account for almost 70%. The remaining 30% is equally distributed over the other two levels of education.
Kennisbeheer 20
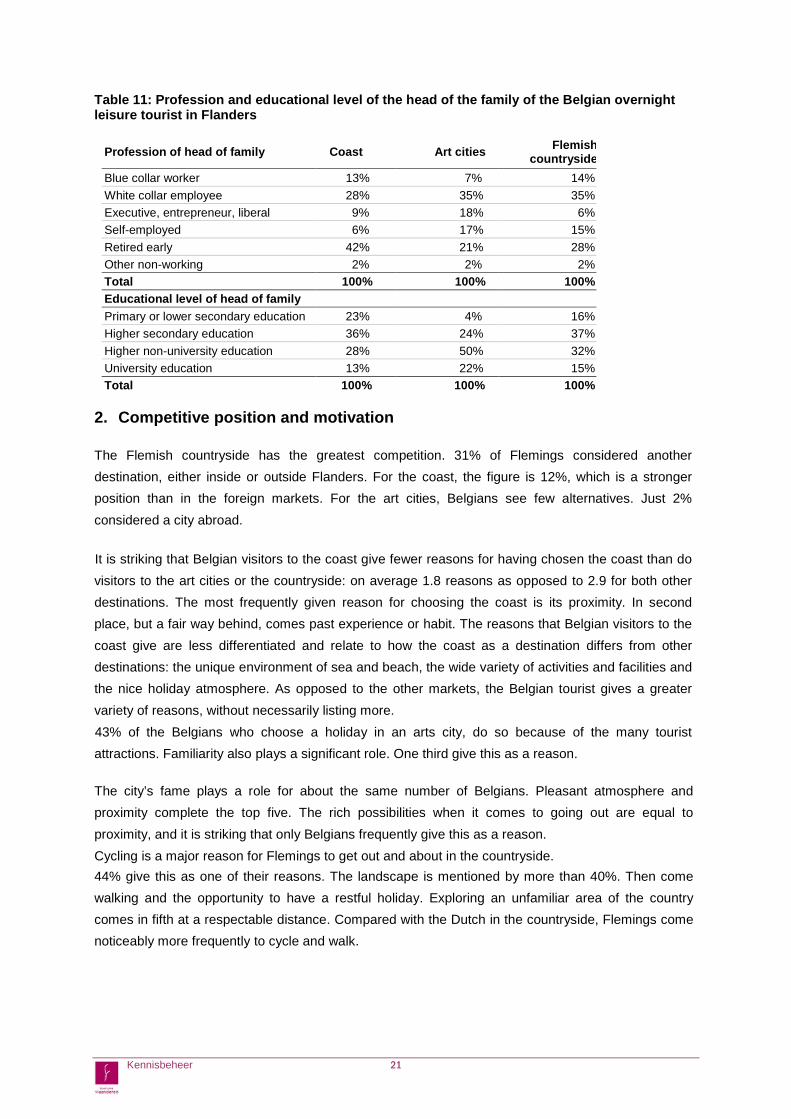
Table 11: Profession and educational level of the head of the family of the Belgian overnight leisure tourist in Flanders
Profession of head of family Coast Art cities Flemish countryside
Blue collar worker 13% 7% 14% White collar employee 28% 35% 35% Executive, entrepreneur, liberal
9% 18% 6%
Self-employed 6% 17% 15% Retired early 42% 21% 28% Other non-working 2% 2% 2% Total 100% 100% 100% Educational level of head of family Primary or lower secondary education 23% 4% 16% Higher secondary education 36% 24% 37% Higher non-university education 28% 50% 32% University education 13% 22% 15% Total 100% 100% 100%
2. Competitive position and motivation The Flemish countryside has the greatest competition. 31% of Flemings considered another destination, either inside or outside Flanders. For the coast, the figure is 12%, which is a stronger position than in the foreign markets. For the art cities, Belgians see few alternatives. Just 2% considered a city abroad.
It is striking that Belgian visitors to the coast give fewer reasons for having chosen the coast than do visitors to the art cities or the countryside: on average 1.8 reasons as opposed to 2.9 for both other destinations. The most frequently given reason for choosing the coast is its proximity. In second place, but a fair way behind, comes past experience or habit. The reasons that Belgian visitors to the coast give are less differentiated and relate to how the coast as a destination differs from other destinations: the unique environment of sea and beach, the wide variety of activities and facilities and the nice holiday atmosphere. As opposed to the other markets, the Belgian tourist gives a greater variety of reasons, without necessarily listing more. 43% of the Belgians who choose a holiday in an arts city, do so because of the many tourist attractions. Familiarity also plays a significant role. One third give this as a reason. The city’s fame plays a role for about the same number of Belgians. Pleasant atmosphere and proximity complete the top five. The rich possibilities when it comes to going out are equal to proximity, and it is striking that only Belgians frequently give this as a reason. Cycling is a major reason for Flemings to get out and about in the countryside. 44% give this as one of their reasons. The landscape is mentioned by more than 40%. Then come walking and the opportunity to have a restful holiday. Exploring an unfamiliar area of the country comes in fifth at a respectable distance. Compared with the Dutch in the countryside, Flemings come noticeably more frequently to cycle and walk.
Kennisbeheer 21
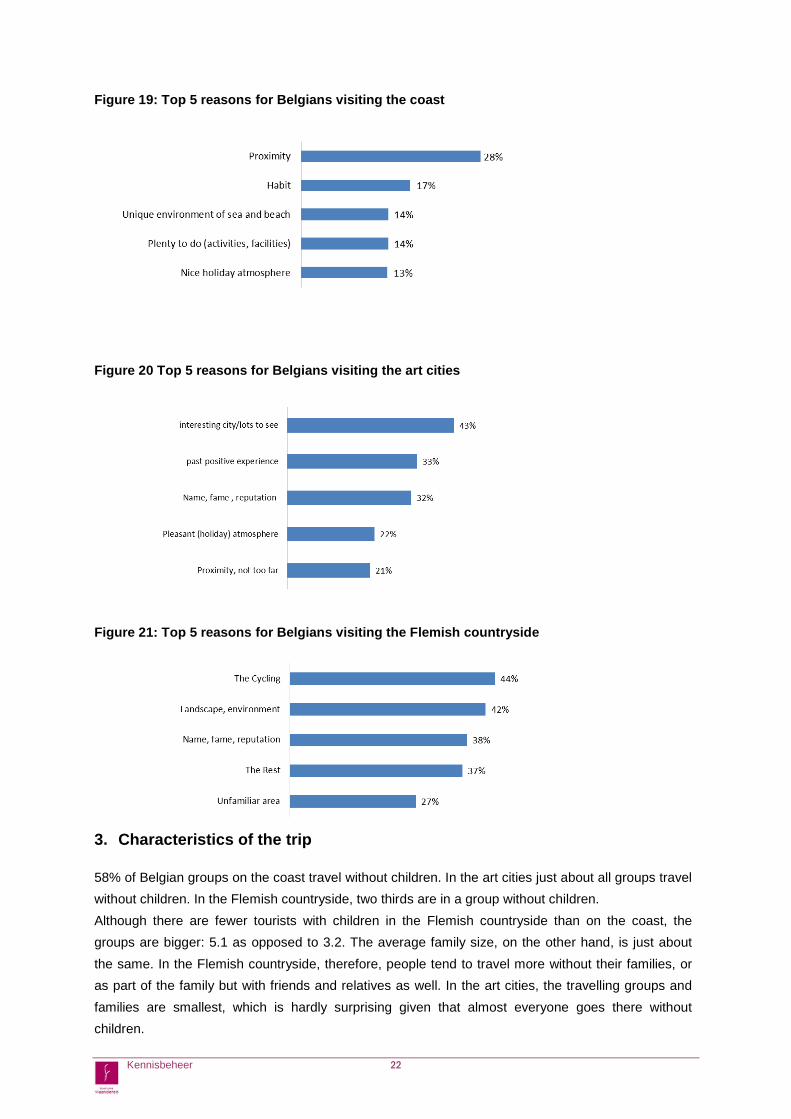
Figure 19: Top 5 reasons for Belgians visiting the coast
Figure 20 Top 5 reasons for Belgians visiting the art cities
Figure 21: Top 5 reasons for Belgians visiting the Flemish countryside
3. Characteristics of the trip 58% of Belgian groups on the coast travel without children. In the art cities just about all groups travel without children. In the Flemish countryside, two thirds are in a group without children. Although there are fewer tourists with children in the Flemish countryside than on the coast, the groups are bigger: 5.1 as opposed to 3.2. The average family size, on the other hand, is just about the same. In the Flemish countryside, therefore, people tend to travel more without their families, or as part of the family but with friends and relatives as well. In the art cities, the travelling groups and families are smallest, which is hardly surprising given that almost everyone goes there without children.
Kennisbeheer 22
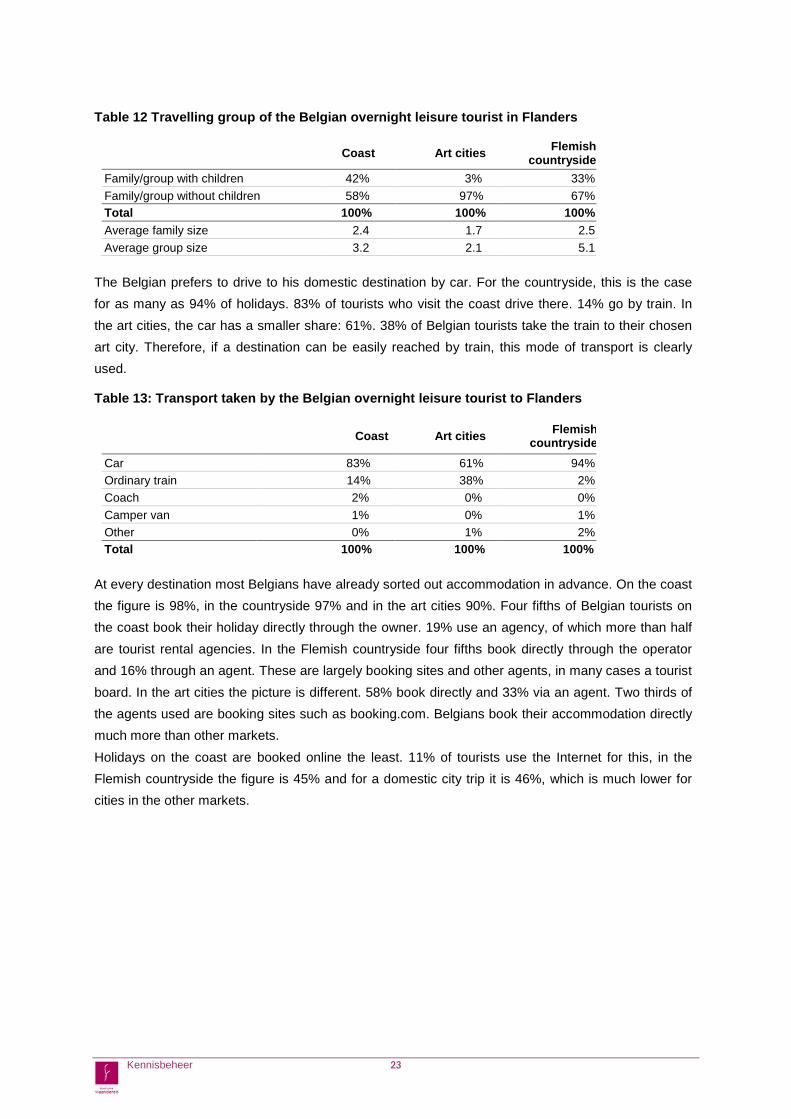
Table 12 Travelling group of the Belgian overnight leisure tourist in Flanders
Coast Art cities Flemish
countryside Family/group with children 42% 3% 33% Family/group without children 58% 97% 67% Total 100% 100% 100% Average family size 2.4 1.7 2.5 Average group size 3.2 2.1 5.1
The Belgian prefers to drive to his domestic destination by car. For the countryside, this is the case for as many as 94% of holidays. 83% of tourists who visit the coast drive there. 14% go by train. In the art cities, the car has a smaller share: 61%. 38% of Belgian tourists take the train to their chosen art city. Therefore, if a destination can be easily reached by train, this mode of transport is clearly used.
Table 13: Transport taken by the Belgian overnight leisure tourist to Flanders
Coast Art cities Flemish countryside
Car 83% 61% 94% Ordinary train 14% 38% 2% Coach 2% 0% 0% Camper van 1% 0% 1% Other 0% 1% 2% Total 100% 100% 100%
At every destination most Belgians have already sorted out accommodation in advance. On the coast the figure is 98%, in the countryside 97% and in the art cities 90%. Four fifths of Belgian tourists on the coast book their holiday directly through the owner. 19% use an agency, of which more than half are tourist rental agencies. In the Flemish countryside four fifths book directly through the operator and 16% through an agent. These are largely booking sites and other agents, in many cases a tourist board. In the art cities the picture is different. 58% book directly and 33% via an agent. Two thirds of the agents used are booking sites such as booking.com. Belgians book their accommodation directly much more than other markets. Holidays on the coast are booked online the least. 11% of tourists use the Internet for this, in the Flemish countryside the figure is 45% and for a domestic city trip it is 46%, which is much lower for cities in the other markets.
Kennisbeheer 23
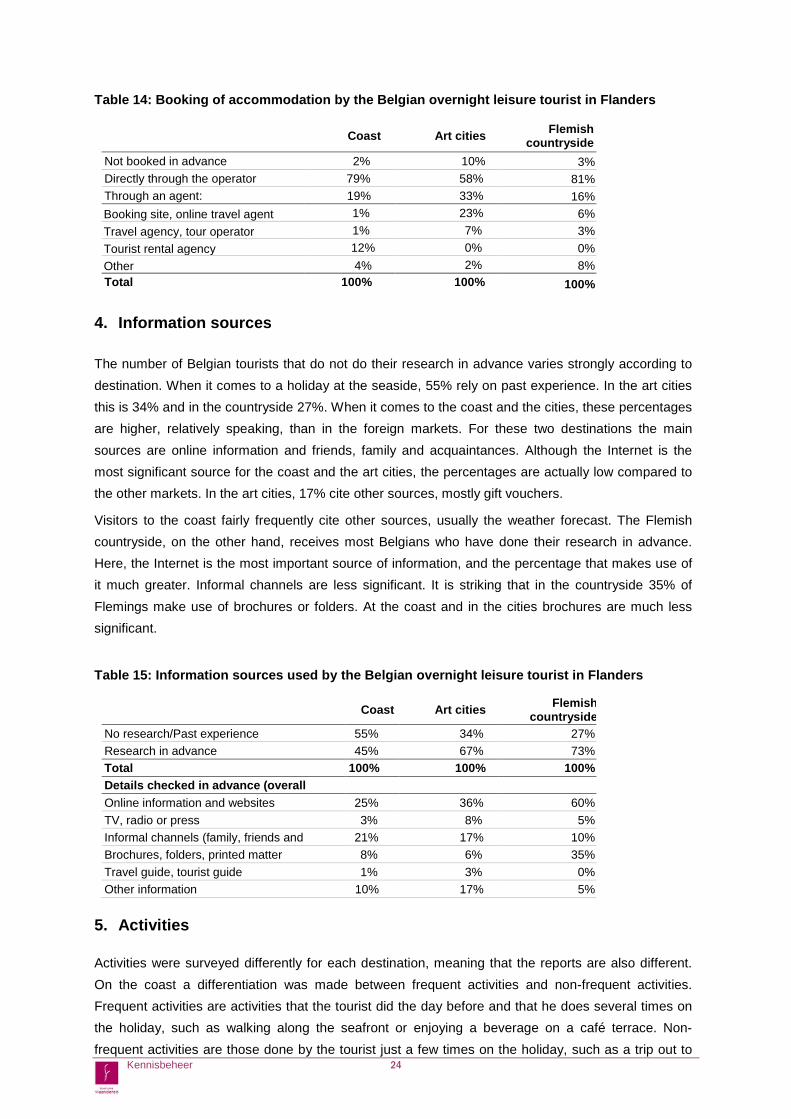
Table 14: Booking of accommodation by the Belgian overnight leisure tourist in Flanders
Coast Art cities Flemish countryside
Not booked in advance 2% 10% 3% Directly through the operator 79% 58% 81% Through an agent: 19% 33% 16% Booking site, online travel agent 1% 23% 6% Travel agency, tour operator 1% 7% 3% Tourist rental agency 12% 0% 0% Other 4% 2% 8% Total 100% 100% 100%
4. Information sources The number of Belgian tourists that do not do their research in advance varies strongly according to destination. When it comes to a holiday at the seaside, 55% rely on past experience. In the art cities this is 34% and in the countryside 27%. When it comes to the coast and the cities, these percentages are higher, relatively speaking, than in the foreign markets. For these two destinations the main sources are online information and friends, family and acquaintances. Although the Internet is the most significant source for the coast and the art cities, the percentages are actually low compared to the other markets. In the art cities, 17% cite other sources, mostly gift vouchers.
Visitors to the coast fairly frequently cite other sources, usually the weather forecast. The Flemish countryside, on the other hand, receives most Belgians who have done their research in advance. Here, the Internet is the most important source of information, and the percentage that makes use of it much greater. Informal channels are less significant. It is striking that in the countryside 35% of Flemings make use of brochures or folders. At the coast and in the cities brochures are much less significant.
Table 15: Information sources used by the Belgian overnight leisure tourist in Flanders
Coast Art cities Flemish
countryside No research/Past experience 55% 34% 27% Research in advance 45% 67% 73% Total 100% 100% 100% Details checked in advance (overall
Online information and websites 25% 36% 60% TV, radio or press 3% 8% 5% Informal channels (family, friends and
21% 17% 10%
Brochures, folders, printed matter 8% 6% 35% Travel guide, tourist guide 1% 3% 0% Other information 10% 17% 5%
5. Activities Activities were surveyed differently for each destination, meaning that the reports are also different. On the coast a differentiation was made between frequent activities and non-frequent activities. Frequent activities are activities that the tourist did the day before and that he does several times on the holiday, such as walking along the seafront or enjoying a beverage on a café terrace. Non-frequent activities are those done by the tourist just a few times on the holiday, such as a trip out to Kennisbeheer 24
the hinterland. In the art cities the trips are mostly short, and so the survey focused on the activities that the visitors had already done or planned to do, and whether there had been any excursions during the trip. In the Flemish countryside the survey asked about activities throughout the holiday and about excursions.
Belgians at the seaside do 5.4 activities on average several times during their stay. More than four fifths of Belgian visitors to the coast go for a walk on the seafront. This is the most frequently cited activity and Belgians do it more often than any other nationality. At 73%, resting comes second and 68% enjoy a beverage on a café terrace once in a while. Shopping is also reported by more than half. Of the activities done less frequently during the holiday, a day trip to another seaside resort is the most popular. Half of the Belgians do this during their stay on the coast. 14% go on a cycling trip lasting for more than 1 hour, 11% visit an attraction and the same percentage of Belgians visit a town or village in the hinterland. Foreign tourists do the latter much more frequently.
In the art cities, Belgians cite 5.1 activities on average. As in all other markets, walking around the city centre is the favourite activity in the art cities. 92% report that they do this. Eating and drinking are also very important: 72% cite a visit to a restaurant as an activity and 64% enjoy a beverage on a café terrace. These are therefore the second and third most popular activities. 62% also go shopping. Activities linked to the cultural/historical character of the cities are carried out much less frequently by the Belgians than by the foreign tourists. Belgian tourists also do the least number of activities. Where excursions are concerned, Belgians, not unexpectedly, score very low. Only 6% go on excursions, whereas foreigners, of course, have a greater urge to visit other towns when staying in Flanders.
In the Flemish countryside, fewer different activities are undertaken, on average 4.0 per Belgian. 64% of Belgians walk and 59% visit a café or terrace. Cycling, top of the list of reasons, comes third here with 45%. Half of the Belgians in the countryside go on an excursion to another place.
6. Satisfaction and return visit The most satisfied domestic tourists are to be found in the Flemish countryside. More than 80% are very satisfied to extremely satisfied with their holiday. This gives a score of 4.1 out of 5, which is higher than among the Dutch. On the coast, the share of tourists that are very satisfied to extremely satisfied is 72%, and the score is 3.8 out of 5. Belgian tourists in the art cities, like foreign tourists, are more critical. 37% of Belgian city trippers are very satisfied to extremely satisfied. The remaining 63% are satisfied and no one is not satisfied. This brings the score to 3.4. Compared with the other nationalities, only the Dutch in the art cities are more satisfied. The Germans, the British and the Americans are as satisfied as the Belgians.
Kennisbeheer 25
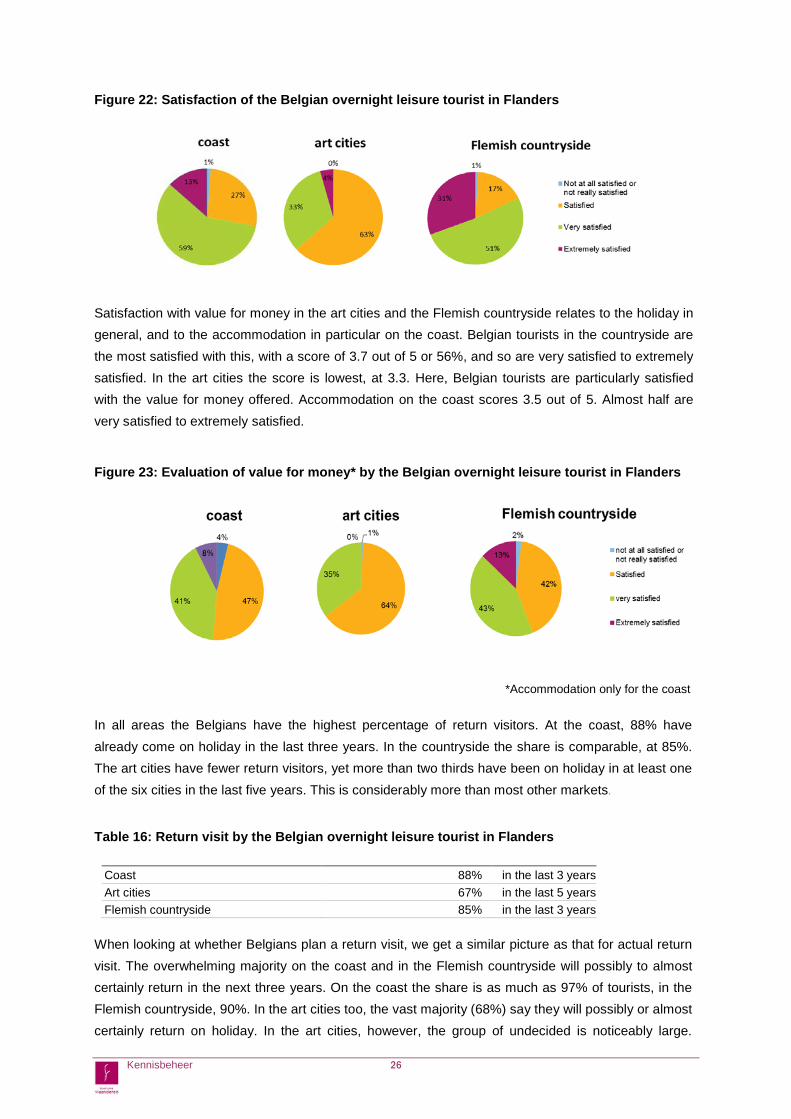
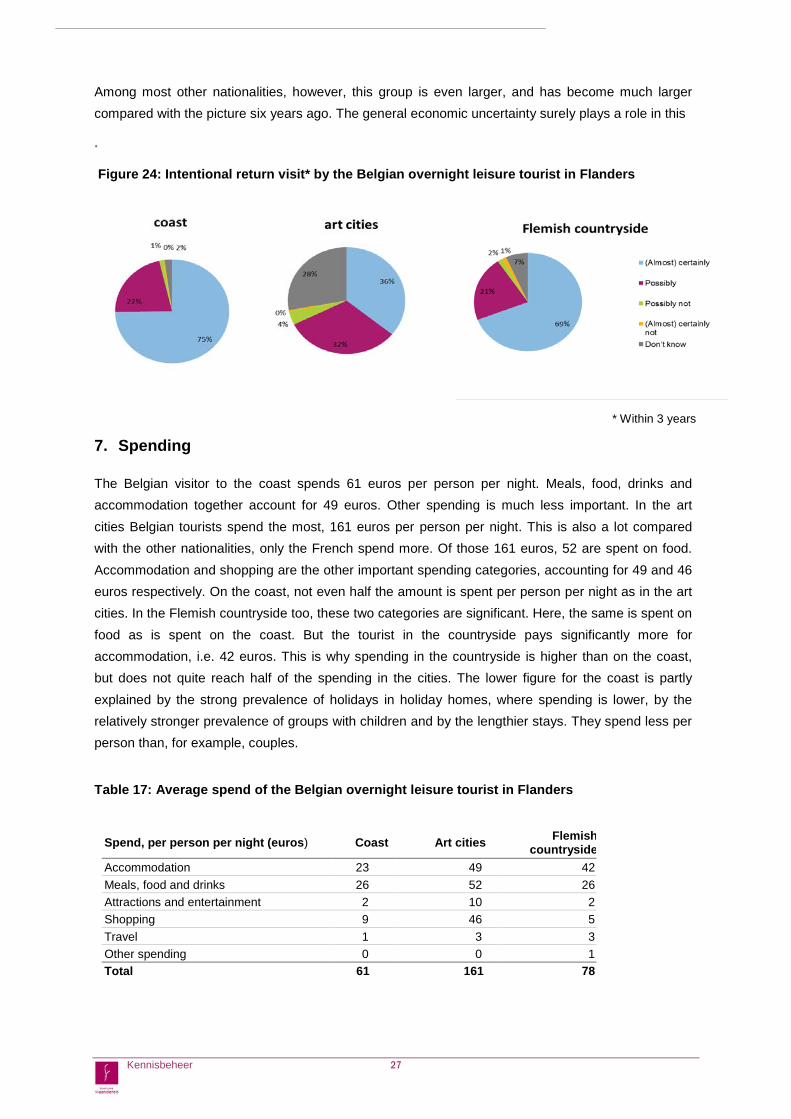
Figure 22: Satisfaction of the Belgian overnight leisure tourist in Flanders Satisfaction with value for money in the art cities and the Flemish countryside relates to the holiday in general, and to the accommodation in particular on the coast. Belgian tourists in the countryside are the most satisfied with this, with a score of 3.7 out of 5 or 56%, and so are very satisfied to extremely satisfied. In the art cities the score is lowest, at 3.3. Here, Belgian tourists are particularly satisfied with the value for money offered. Accommodation on the coast scores 3.5 out of 5. Almost half are very satisfied to extremely satisfied.
Figure 23: Evaluation of value for money* by the Belgian overnight leisure tourist in Flanders
*Accommodation only for the coast In all areas the Belgians have the highest percentage of return visitors. At the coast, 88% have already come on holiday in the last three years. In the countryside the share is comparable, at 85%. The art cities have fewer return visitors, yet more than two thirds have been on holiday in at least one of the six cities in the last five years. This is considerably more than most other markets.
Table 16: Return visit by the Belgian overnight leisure tourist in Flanders
Coast 88% in the last 3 years Art cities 67% in the last 5 years Flemish countryside 85% in the last 3 years
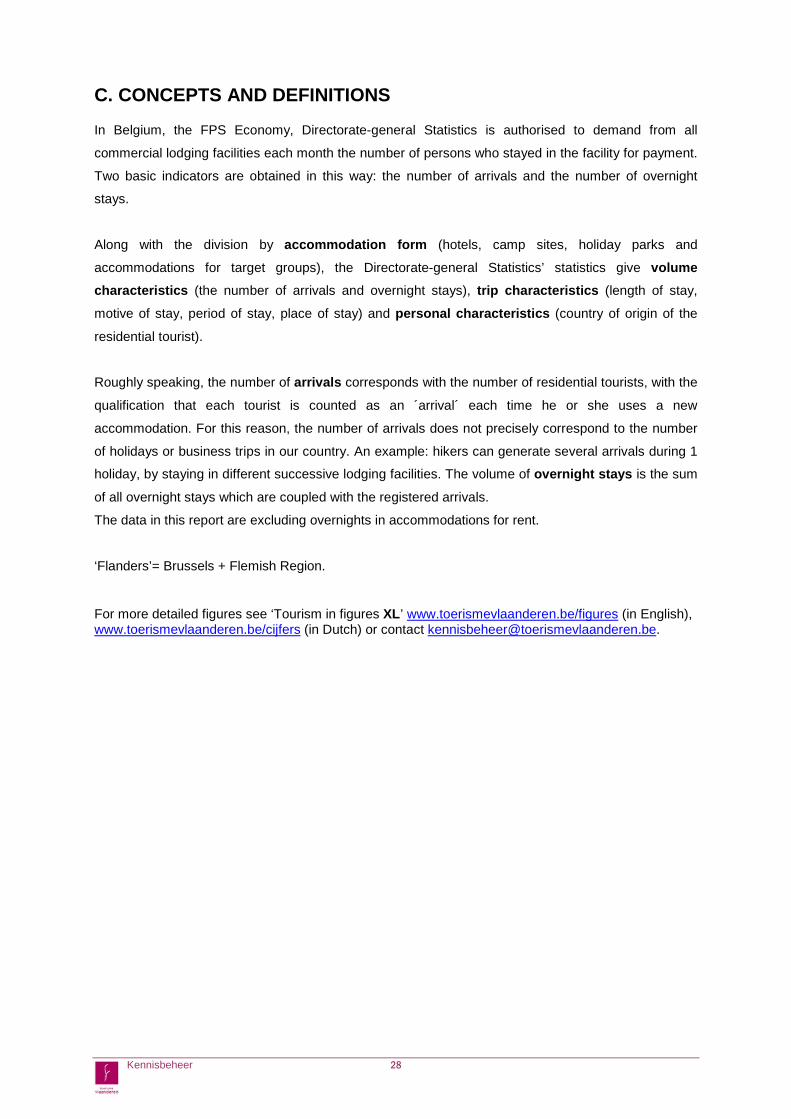
When looking at whether Belgians plan a return visit, we get a similar picture as that for actual return visit. The overwhelming majority on the coast and in the Flemish countryside will possibly to almost certainly return in the next three years. On the coast the share is as much as 97% of tourists, in the Flemish countryside, 90%. In the art cities too, the vast majority (68%) say they will possibly or almost certainly return on holiday. In the art cities, however, the group of undecided is noticeably large.
Kennisbeheer 26
Among most other nationalities, however, this group is even larger, and has become much larger compared with the picture six years ago. The general economic uncertainty surely plays a role in this
.
Figure 24: Intentional return visit* by the Belgian overnight leisure tourist in Flanders 28
* Within 3 years 7. Spending The Belgian visitor to the coast spends 61 euros per person per night. Meals, food, drinks and accommodation together account for 49 euros. Other spending is much less important. In the art cities Belgian tourists spend the most, 161 euros per person per night. This is also a lot compared with the other nationalities, only the French spend more. Of those 161 euros, 52 are spent on food. Accommodation and shopping are the other important spending categories, accounting for 49 and 46 euros respectively. On the coast, not even half the amount is spent per person per night as in the art cities. In the Flemish countryside too, these two categories are significant. Here, the same is spent on food as is spent on the coast. But the tourist in the countryside pays significantly more for accommodation, i.e. 42 euros. This is why spending in the countryside is higher than on the coast, but does not quite reach half of the spending in the cities. The lower figure for the coast is partly explained by the strong prevalence of holidays in holiday homes, where spending is lower, by the relatively stronger prevalence of groups with children and by the lengthier stays. They spend less per person than, for example, couples.
Table 17: Average spend of the Belgian overnight leisure tourist in Flanders
Spend, per person per night (euros) Coast Art cities Flemish countryside
Accommodation 23 49 42 Meals, food and drinks 26 52 26 Attractions and entertainment 2 10 2 Shopping 9 46 5 Travel 1 3 3 Other spending 0 0 1 Total 61 161 78
Kennisbeheer 27
C. CONCEPTS AND DEFINITIONS In Belgium, the FPS Economy, Directorate-general Statistics is authorised to demand from all
commercial lodging facilities each month the number of persons who stayed in the facility for payment.
Two basic indicators are obtained in this way: the number of arrivals and the number of overnight
stays.
Along with the division by accommodation form (hotels, camp sites, holiday parks and
accommodations for target groups), the Directorate-general Statistics’ statistics give volume characteristics (the number of arrivals and overnight stays), trip characteristics (length of stay,
motive of stay, period of stay, place of stay) and personal characteristics (country of origin of the
residential tourist).
Roughly speaking, the number of arrivals corresponds with the number of residential tourists, with the
qualification that each tourist is counted as an ´arrival´ each time he or she uses a new
accommodation. For this reason, the number of arrivals does not precisely correspond to the number
of holidays or business trips in our country. An example: hikers can generate several arrivals during 1
holiday, by staying in different successive lodging facilities. The volume of overnight stays is the sum
of all overnight stays which are coupled with the registered arrivals.
The data in this report are excluding overnights in accommodations for rent.
‘Flanders’= Brussels + Flemish Region.
For more detailed figures see ‘Tourism in figures XL’ www.toerismevlaanderen.be/figures (in English), www.toerismevlaanderen.be/cijfers (in Dutch) or contact [email protected].
Kennisbeheer 28


