Towards a Carbon-Neutral Future: Towards a Carbon-Neutral Future: Jimmy Adegoke Chris Green Center for Applied Environmental Research (CAER) University of Missouri- Kansas City Scenario-based Assessment of Climate- induced Risks to Regional Energy Production and Trends in the Kansas City Area
Transcript
Towards a Carbon-Neutral Future:Towards a Carbon-Neutral Future:
Jimmy Adegoke
Chris Green
Center for Applied Environmental Research (CAER) University of Missouri-Kansas City
Scenario-based Assessment of Climate-induced Risks to
Regional Energy Production and Trends in the Kansas City Area
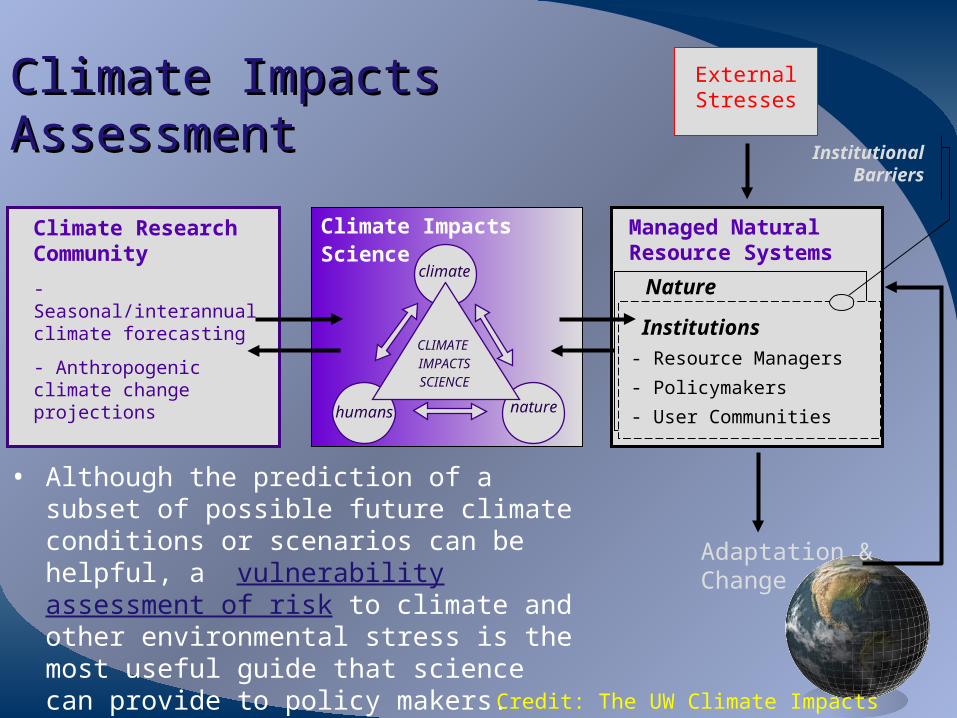
• Although the prediction of a subset of possible future climate conditions or scenarios can be helpful, a vulnerability assessment of risk to climate and other environmental stress is the most useful guide that science can provide to policy makers.
Credit: The UW Climate Impacts Group (CIG)
People Driven – Regional FocusPeople Driven – Regional Focus
Motivation:• Increase regional
resilience to climate variability and change
• Produce science useful to the decision making communityAn understanding of the patterns and consequences of
past climate variability, policy responses and their impacts is essential for preparing for future changes in climate.
AgricultureWater Resources
EnergyHealth
Climate Protection in Kansas City MOClimate Protection in Kansas City MOTimeline
1996
The Environmental Management Commission (EMC) was created.
2001
The EMC created the KC Sustainability Plan to holistically address city operations, codes and ordinances, and regional cooperation.
2004
City adopts a mandatory LEED Silver Rating for all new city buildings.
2005
The EMC negotiated curb-side recycling in 2005. Mayor Kay Barnes signs the Climate Protection Partnership in 2005.
2006
The EMC’s recommended Climate Protection Resolution was passed.
2007
The EMC led efforts in 2007 to implement cost-effective mitigation strategies to reduce GHG emissions from city operations below
30% 2000 levels by 2020.
Climate Protection in Kansas City MOClimate Protection in Kansas City MO
• Formed by the Greater Kansas City Chamber of Commerce
• 145 area businesses have signed on
• Obligations include:– conduct an inventory of greenhouse gas emissions– set clear reduction goals that maximize economic
opportunity and minimize business and regulatory risk
The Greater Kansas City Chamber of Commerce The Greater Kansas City Chamber of Commerce Climate Protection PartnershipClimate Protection Partnership
UMKC Center for Applied Environmental Research (CAER) provides Technical Consulting
Services to the Partnership
Swope Community Enterprises
Swope Community Enterprise Services
Swope Health Services
Swope Community Builders
Swope Center for Career Advancement
Applied Urban Research Institute
Carbon Emission Accounting for Swope Community Enterprises (SCE)
Total:• $270,326 for electricity• $18,272 for natural gas• $65,580 for automotive fuel• $138,101 for paper purchases• $9,365 for waste disposal____
$501,644
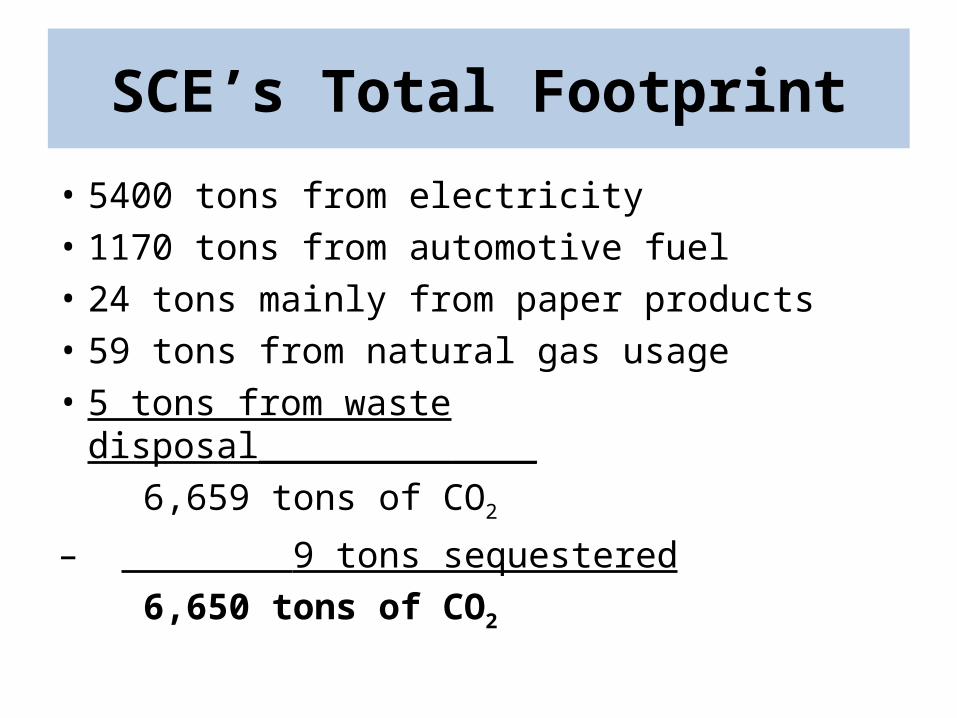
SCE’s Total Footprint
• 5400 tons from electricity• 1170 tons from automotive fuel• 24 tons mainly from paper products• 59 tons from natural gas usage• 5 tons from waste disposal_____________ 6,659 tons of CO2
– 9 tons sequestered 6,650 tons of CO2
Mitigation Projections
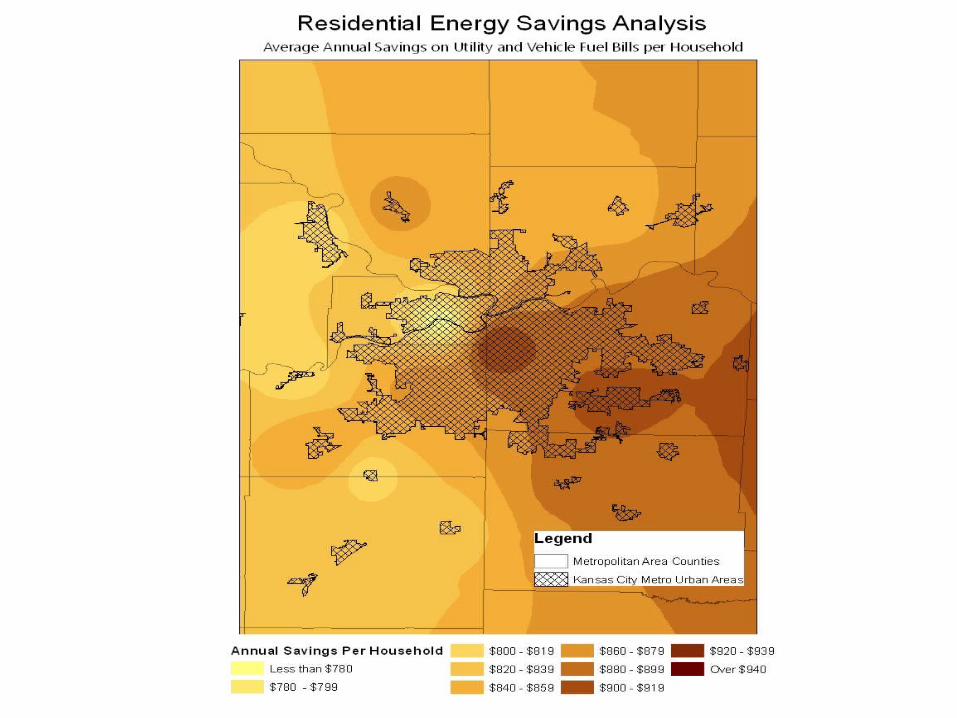
A Residential “Savings” AssessmentA Residential “Savings” Assessment
Potential savings of policies encouraging energy efficiency measures can be calculated region-wide
1. Household numbers by city and county are provided in Census’s Tiger data available from esri.com
2. Energy usage data available by region on DOE’s website
3. Average reductions in energy usage and bills using specific energy efficient devices are available on Energy Star website
4. Reductions in energy usage from energy efficient devices and measures can be subtracted from total household energy data per city or county in an excel spreadsheet
The spreadsheet can be displayed in ArcGIS and potential savings can be graded using ArcGIS statistical analysis tools.
Households per
city/county
Census Bureau
Energy usage per
household
DOE
xEnergy usage reductions
Energy Star
- =Reduced
energy usage per household
New Energy Usage
What is the potential for KCMO to What is the potential for KCMO to move toward a carbon-neutral move toward a carbon-neutral
future?future?
1. UMKC Center for Applied Environmental Research (CAER) is conducting this study on behalf of the Kansas City Environmental Management Commission (EMC)
2. Goal is to identify risks and opportunities from future climate change to specific sectors in Kansas City Metropolitan Area
Scenarios for a Carbon Constrained World
The Hazard-Vulnerability Paradigm
• The hazard-vulnerability paradigm focuses on the protection of society by emphasizing assessment of risk associated with climate and other environmental stress and/or hazards.
• This approach quantifies the sensitivity of individual sectors such as transportation, health, agriculture, energy etc to a specific hazard and is therefore, more appropriate as guides to Policy Makers, than trying to predict only a subset of possible future climate conditions.
• Study boundaries
1. Urban area – KCMO city limits
2. Surrounding area – census designated metropolitan area, fifteen counties and over 120 cities or MARC nine-county area
a) Determine sector composition and key stakeholders
b) Research climate-impact studies conducted by government agencies, private institutions, or other entities that are relevant to particular sectors
Identifying Stakeholders and Partners
Energy Sector Stakeholders
a) Power Production Companies – KCP&L,
b) Commercial & Residential Consumers
c) County & City Governments
d) Regulators
Phase IIPhase II
2. Sectoral interviews and focus groups
a) Conduct interviews and focus groups with sector stakeholders to discuss climate-related perceptions, impacts, adaptations, and mitigation methods
3. Sector surveys
a) Based on the interview results, construct an online survey instrument to collect information on the impacts from specific extreme weather events on individual sectors