Issues in Employment and Poverty Discussion Paper 22 Towards a more employment-intensive and pro-poor economic growth in Ethiopia: Issues and policies by Mulat Demeke Fantu Guta Tadele Ferede Employment Strategy Department, International Labour Office, Geneva March 2006
Transcript
Issues in Employment and Poverty
Discussion Paper
22
Towards a more employment-intensive and pro-poor economic growth in Ethiopia:
Issues and policies
by
Mulat Demeke Fantu Guta
Tadele Ferede
Employment Strategy Department, International Labour Office, Geneva
March 2006
ii
Copyright ISBN 92-2-118664-4 & 978-92-2-118664-9 (print) ISBN 92-2-118665-2 & 978-92-2-118665-6 (web pdf)
iii
Table of Contents
Acronyms…….................................................................................................................. v List of Tables .............................................................................................................…viii List of Figures .................................................................................................................. ix Preface………………………………………………………………………………...... xi Executive Summary .......................................................................................................xiii 1. Introduction................................................................................................................... 1
1.1. Background............................................................................................................. 1 1.2. Objectives of the study ........................................................................................... 1 1.3. Methodology and data sources ............................................................................... 2 1.4. Organization of the study ....................................................................................... 2
2. An Overview of the Macro-Economy & Major Structural Problems........................... 3
2.1. An overview of the economy.................................................................................. 3 2.2. Recent policy changes and directions..................................................................... 5
3. The Labor Market and Poverty ..................................................................................... 7
3.1. Population growth, labor force and employment ................................................... 7 3.2. Unemployment and underemployment .................................................................. 8 3.3. Incidence of poverty by major occupation ........................................................... 10
3.3.1. Employment and incidence of poverty ...........................................................10 3.4. Outstanding issues and implications for an employment strategy ....................... 16
3.4.1. Quality of education ........................................................................................16 3.4.2. The return to education… ...............................................................................17
4. Growth, Productivity and Returns in Agriculture....................................................... 19
4.1. Resource base ....................................................................................................... 19 4.1.1. Agricultural resource potentials ......................................................................19 4.1.2. Farm management practices and farming systems..........................................22
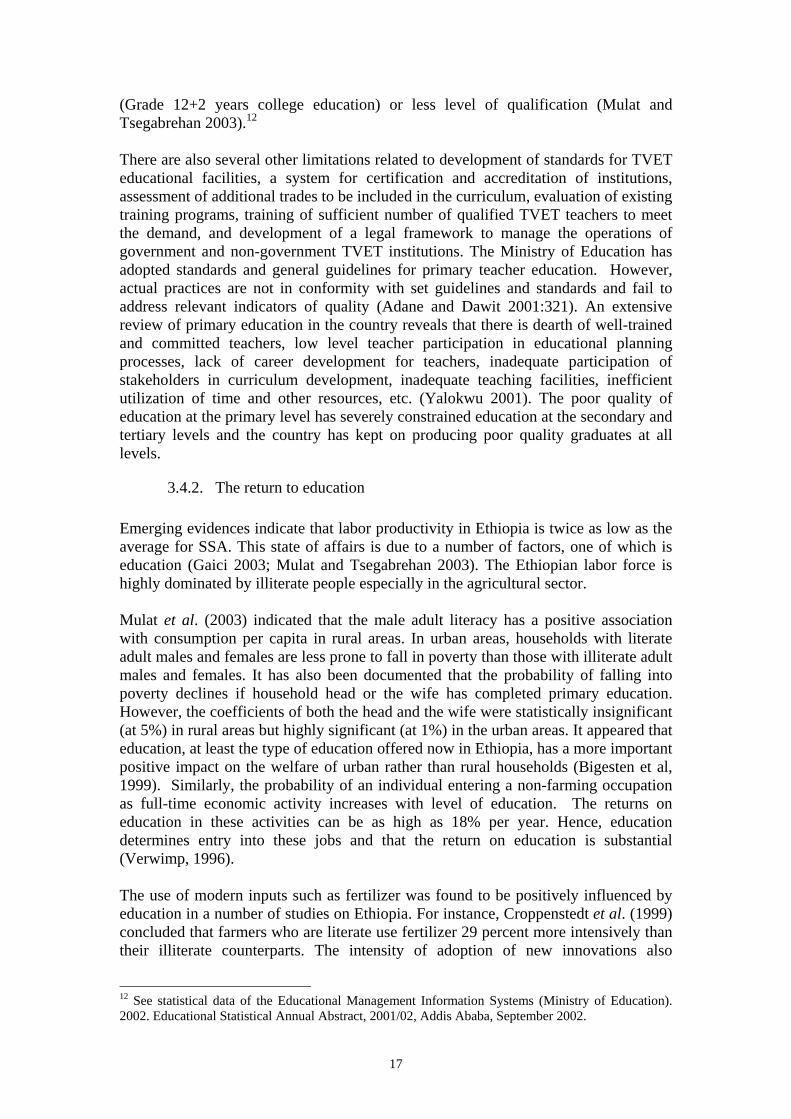
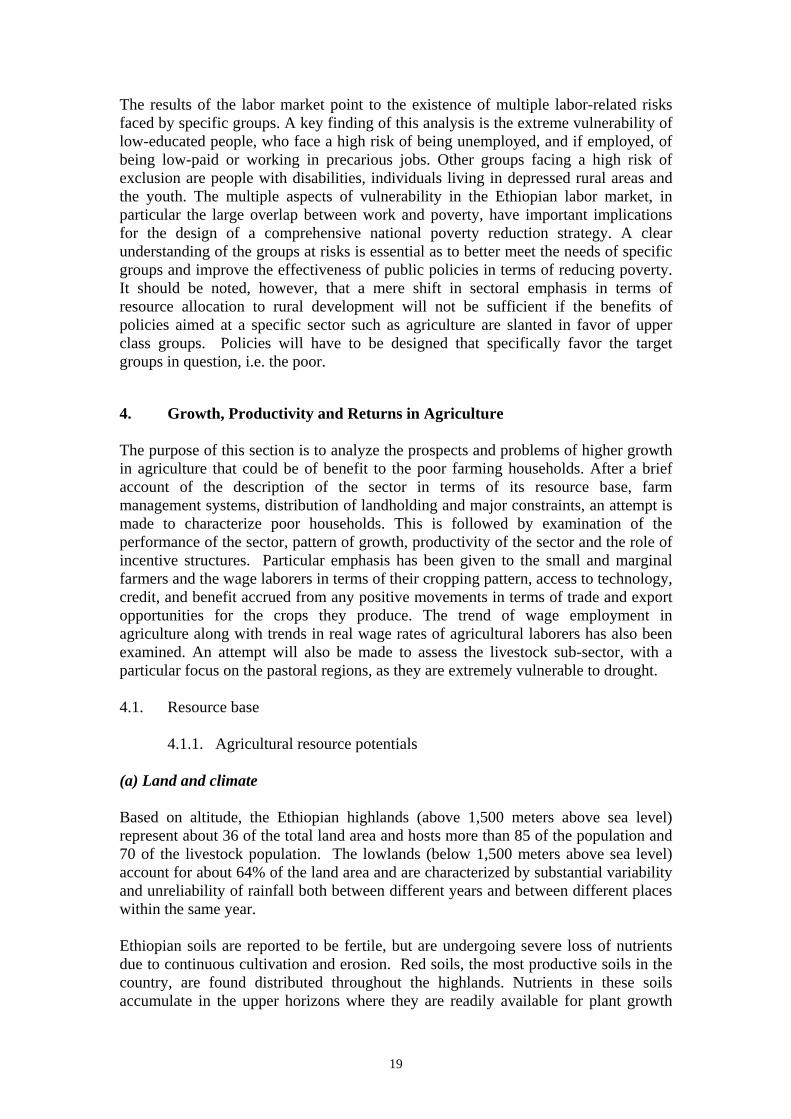
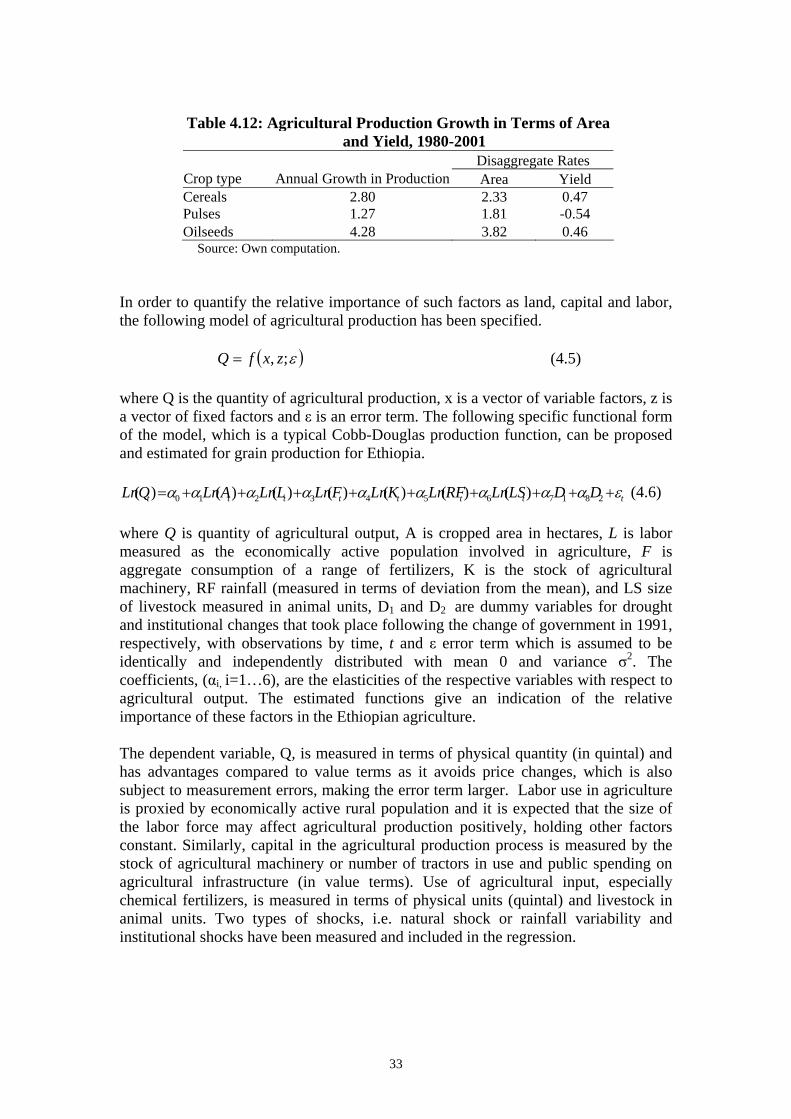
4.2. Performance of the agricultural sector.................................................................. 23 4.2.1. Crop production and area cultivated ...............................................................23 4.2.2. Livestock sub-sector (with emphasis on the pastoral areas) ...........................24 4.2.3. Labor intensity of crops and livestock activities .............................................25 4.2.4. Trends in agricultural investment (private sector) ..........................................27 4.2.5. Agricultural growth, productivity and incentives ...........................................30
5. Diversification of Rural Livelihoods .......................................................................... 35
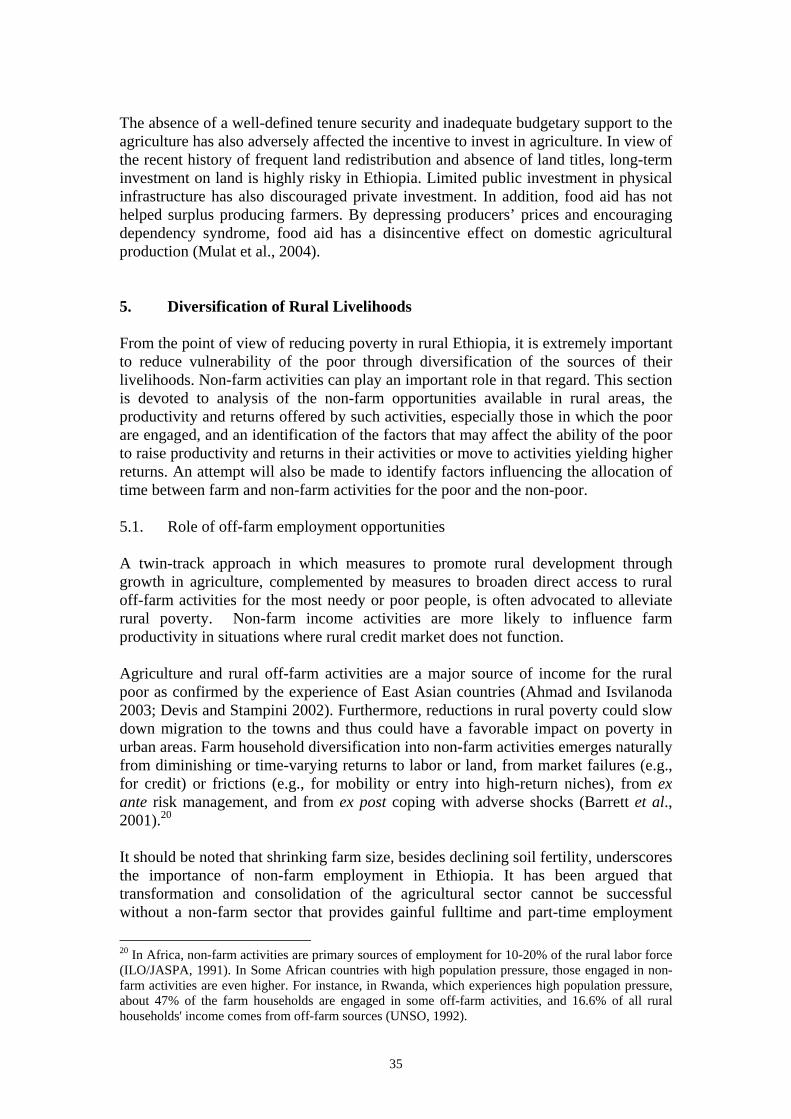
5.1. Role of off-farm employment opportunities......................................................... 35 5.2. Participation and contributions of off-farm employment activities...................... 36 5.3. Determinants of off-farm employment in rural ethiopia: an econometric analysis ........................................................................................................................ 38 5.4. Constraints to off-farm employment .................................................................... 41
6. Growth of Labor-intensive Manufacturing................................................................. 43
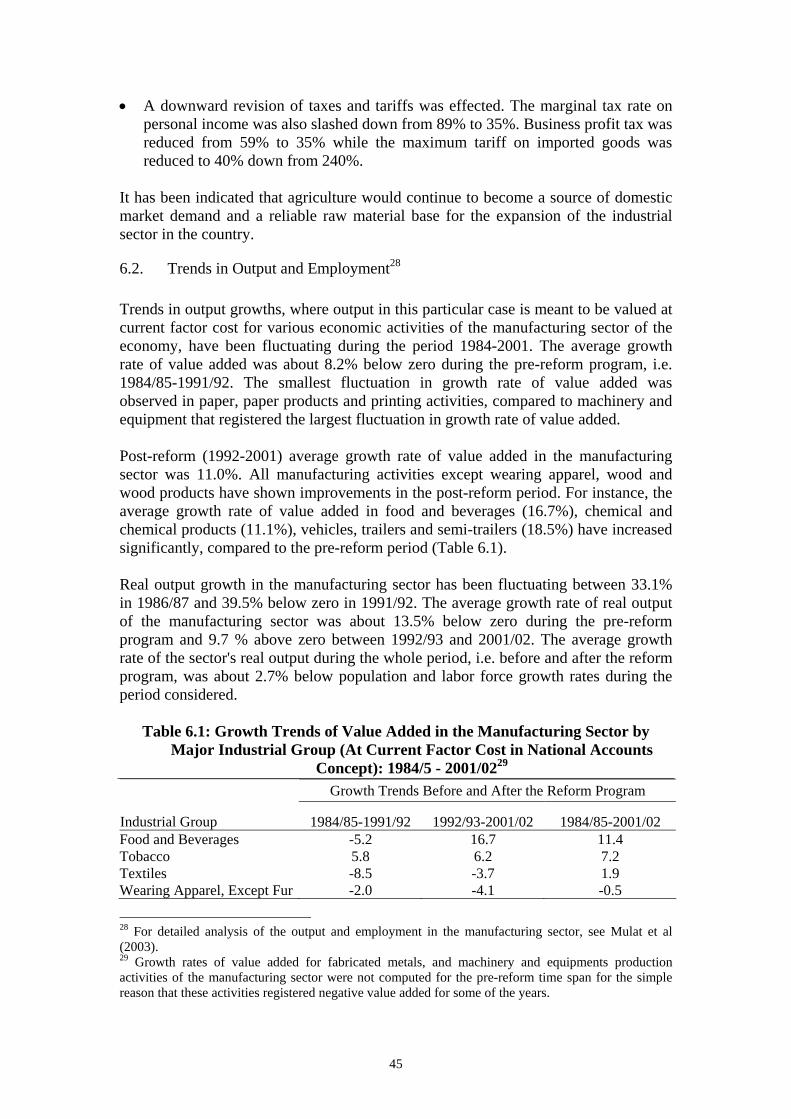
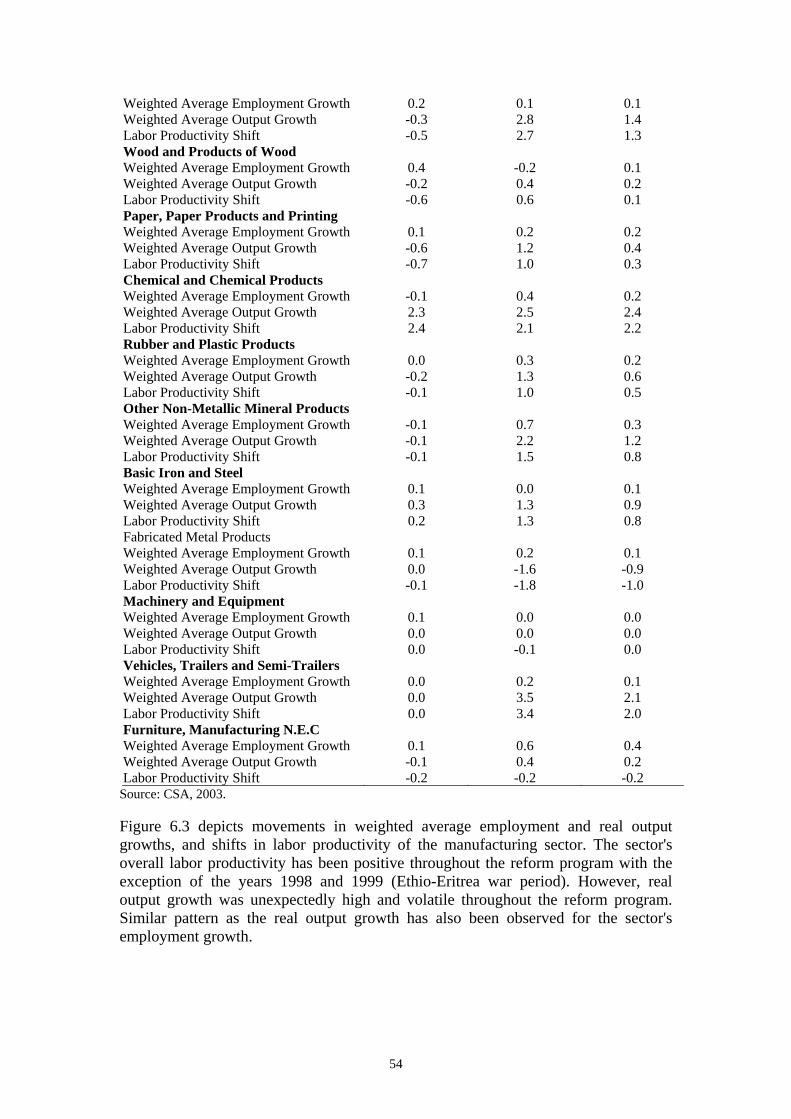
6.1. Brief overview of the manufacturing sector policies and strategies..................... 43 6.2. Trends in output and employment ........................................................................ 45 6.3. Employment decomposition and labor productivity growth in the manufacturing sector ................................................................................................... 50
iv
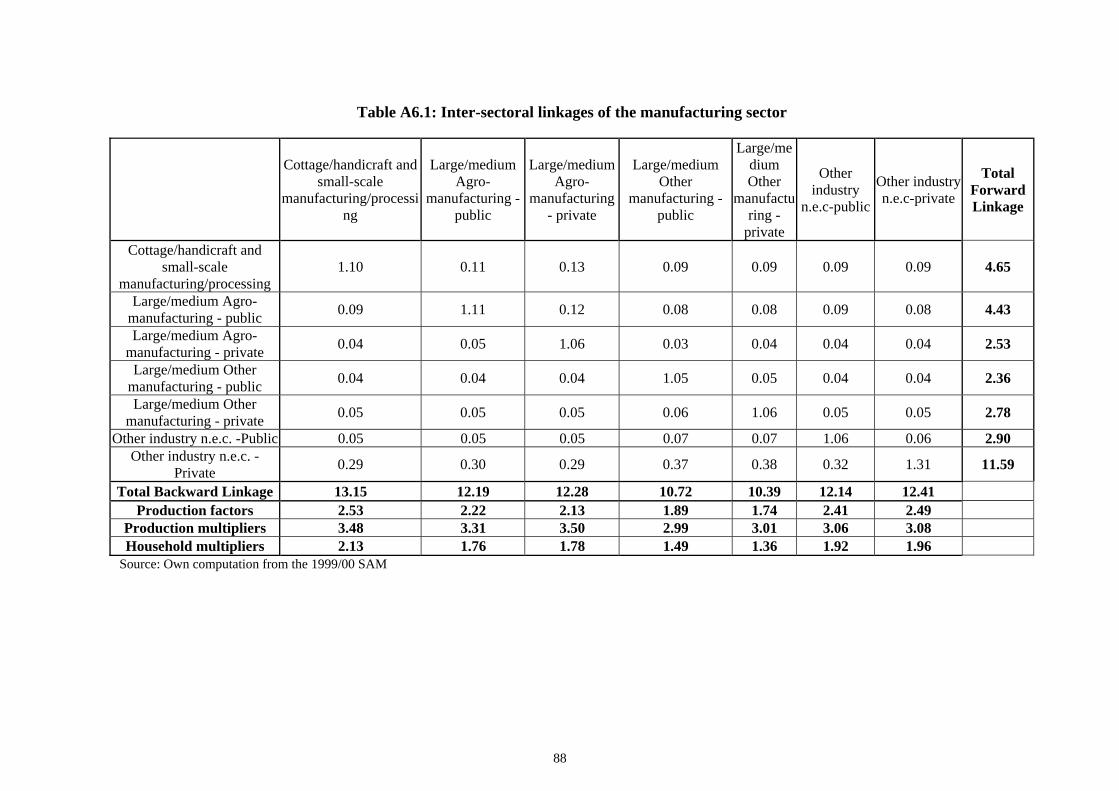
6.4. Labor and capital productivity and shifts in real earnings.................................... 52 6.5. Inter-sectoral linkages of the manufacturing sector: a sam-based analysis.......... 56
6.5.1. Analysis of linkages using sam multipliers.....................................................57 7. Micro and Small Enterprises (MSES)......................................................................... 59
7.1. Characteristics, performance and contribution..................................................... 60 7.1.1. Basic attributes of MSES ................................................................................60 7.1.2. Contribution of MSES.....................................................................................60
7.2. Policy and other constraints.................................................................................. 63 7.2.1. MSE and the policy environment....................................................................63 7.2.2. Other constraints .............................................................................................65
8. Employment through Labor-based Approaches in Infrastructure............................... 66
8.1. Public expenditure in infrastructure ..................................................................... 66 8.2. Public work programs and labor-based infrastructure.......................................... 68
8.2.1. Infrastructure programs as a safety nets ......................................................70 8.2.2. Development-oriented infrastructure programs ..............................................73
9. Conclusions and Policy Implications.......................................................................... 74 References...................................................................................................................... 81 Annexes........................................................................................................................... 87
v
Acronyms AAU Addis Ababa University ADLI Agricultural Development Led Industrialization CFW Cash For Work CSA Central Statistical Authority EGS Employment Generation Schemes EPRDF Ethiopian People's Revolutionary Democratic Front ERA Ethiopia Roads Authority FeMSDA Federal Micro and Small Enterprise Development Agency FFW Food For Work GDP Gross Domestic Product HICES Household Income, Consumption and Expenditure Survey ILO International Labor Organization IMF International Monetary Fund LDCs Least Developed Countries LMS Low and Medium-Scale manufacturing industries MEDaC Ministry of Economic Development and Cooperation MFIs Micro Finance Institutions MOFED Ministry of Finance and Economic Development MOLSA Ministry of Labor and Social Affairs MSME Medium, Small and Micro Enterprises PRSP Poverty Reduction Strategy Program PSNP Productive Safety Net Program PRISM Poverty Reduction through Irrigation and Smallholder Markets ReMSDA Regional Micro and Small Enterprise Development Agency RSDP Road Sector Development Program SDPRSP Sustainable Development and Poverty Reduction Strategy Program SAP Structural Adjustment Program SAM Social Accounting Matrix SMEs Small and Micro Enterprises SNNPR Southern Nations and Nationalities Peoples Region SSMIs Small-scale Manufacturing industries TGE Transitional Government of Ethiopia TVET Technical Vocational Education Training USAID United Stated Agency for International Development WFP World Food Program WMS Welfare Monitoring Survey
vi
vii
List of Tables
Table 2.1: Growth Patterns, 1960-2002 (in per cent)…………………………….…… 4 Table 3.1: Population of Ethiopia………………………………………………….…… 7 Table 3.2: Urban and Rural Labor Force……………………………………………….. 8 Table 3.3: Employment Contribution of the Urban Informal Sector (%), 1999………... 8 Table 3.4: Distribution of Current Unemployment Rate by Education, 1999 (%)….….. 9 Table 3.5: Unemployment in Urban and Rural Ethiopia………………………….……. 9 Table 3.6: Mean Hours Worked and Percent of Employed Population Available or Seeking to Work Extra Hours, 1999……………………………………………………. 10 Table 3.7: Distribution of Poverty by Major Occupation/Activity of Household Head for Rural and Urban Areas in 1999…………………….………………………….……. 11 Table 3.8: Distribution of Poverty by Sex of Household Heads for Rural and Urban Areas in 1999………………………………………………………………… .….….. 13 Table 3.9: Distribution of Poverty Status by Age of Household Heads for Rural and Urban Areas in 1999……………………………………………………………………. 13 Table 3.10: Can the Household Head Read and Write?………………………………… 14 Table 3.11: Asset Possession of the Poor………………………………………….……. 14 Table 3.12: Distance to the Nearest Food Market (in km) for Poor……………………. 15 Table 3.13: Distance to the Nearest School and Health Center (in km)………………... 15 Table 3.14: Distance to the Nearest Weather Road (in km)……………………………. 15 Table 4.1: Method of Ploughing………………………………………………………... 22 Table 4.2: Area Under Improved Farm Management Practices by Crop Type, Private Holdings, 2001/02 (%)……………………………………………………………….…. 23 Table 4.3: Holders by Educational Level, Private Holdings, 2001/02 (in %)……….…. 23 Table 4.4: Number and Area of Holdings by Size, 2001/02……………………….…… 24 Table 4.5: Tenure System and Land Use, 2001/02…………………………………….. 24 Table 4.6: Relative Total Productive Labor Time-intensity by Productive Activities (in minutes)…………………………………………………………………………….…… 25 Table 4.7: Percentage Share Productive Labor Time of Total Productive Labor Time… 26 Table 4.8: Relative Total Productive Labor Time by Productive Activities and Gender (in minutes)……………………………………………………………………….…….. 26 Table 4.9: Percentage Distribution Of Agricultural Investment Projects, Initial Capital and Employment, 1992-2000………………………………………………………….. 28 Table 4.10: Agricultural Productivity and Employment………………………………... 30 Table 4.11: Yearly Trend in Agricultural Wage Rate (in US$) per annum……………. 31 Table 4.12: Agricultural Production Growth in Terms of Area and Yield, 1980-2001…………………………………………………………………………………….. 33 Table 5.1: Type of Employer and Reasons for Participating in Wage Employment (1999)……………………………………………………………………………….…... 37 Table 5.2: Marginal Effects of the Determinants of Rural Non-farm Employment.…… 40 Table 6.1: Growth Trends of Value Added in the Manufacturing Sector by Major Industrial Group (at Current Factor Cost in National Accounts Concept): 1984/5 - 2001/02……………………………………………………………………………….…. 45 Table 6.2: Growth Trends of Employment in the Manufacturing Sector by Major Industrial Group: 1984/85 - 2001/02……………………………………………….…… 46 Table 6.3: Growth Trends of Employment-Intensity of Output in the Manufacturing Sector by Major Industrial Group: 1984/85 - 2001/02……………………………….…. 47 Table 6.4: Labor-intensity in the Manufacturing Sector, 1983-2001…………………… 49
viii
Table 6.5: Growth Trends of Employment Share in the Manufacturing Sector by Major Industrial Group…………………………………………………………………. 51 Table 6.6: Decomposition of Labor Productivity Shifts in the Manufacturing Sector……………………………………………………………………………….…… 53 Table 6.7: Decomposition of Labor Productivity Shifts in the Manufacturing Sector by Industrial Group………………………………………………………………………… 53 Table 7.1: Employment and Output Contribution of Small-scale Enterprises, 2001/02…………………………………………………………………………………. 61 Table 7.2: The Level of Labor Productivity in Small-scale Manufacturing Industries.……………………………………………………………………………….. 61 Table 7.3: Educational Level of Employees, 2002……………………………………... 62 Table 7.4: Distribution of Number of Persons Engaged, 2002…………………………. 62 Table 7.5: Sectoral Distribution of Informal Sector Operators, 2002………………….. 63 Table 7.6: Sectoral Distribution of Workers and Productivity, 2002…………………… 63 Table 8.1: Comparative Government Expenditure in Roads and Other Sectors……….. 66 Table 8.2: Conditions of Road Network (in %)………………………………………… 69 Table 8.3: Rural Infrastructure Development through FFW Program…………….…… 71 Table 8.4: Regional Distribution of Beneficiaries in the FFW Program, 1999/00….….. 72
ix
List of Figures
Figure 2.1: Trends in Sectoral GDP Growth Rates……..………………………………. 4 Figure 3.1: Employment in Rural Areas………………………………………………... 12 Figure 3.2: Employment in Urban Areas……………………………………….………. 12 Figure 3.3: Educational Level and Poverty in Rural Areas….………………………….. 14 Figure 4.1: Trends in Agricultural Investment (in billion Birr)………………………… 29 Figure 4.2: Number of Jobs created by Agricultural Investment (in thousands)….……. 29 Figure 4.3: Trends in Government Expenditure in Agriculture………………………… 29 Figure 4.4: Patterns of Agricultural Value Added Per Worker…………………….…… 31 Figure 4.5: Trends in Agricultural Employment……………………………………….. 31 Figure 4.6: Trends in Agricultural Wages Rate………………………………………… 32 Figure 6.1: Employment and Real Output Growth Trends in the Manufacturing Sector: 1984/85 - 2001/02…….…………………………………………………….…………... 47 Figure 6.2: Trends in Labor-intensity of Selected Manufacturing Industries….……….. 50 Figure 6.3: Trends in Overall Labor Productivity Growth in the Manufacturing Sector: 1984/85-2001/02………………………………………………………………………... 55 Figure 6.4: Overall Labor Productivity Shifts in the Manufacturing Sector: 1984/85-2001/02………………………………………………………………………………….. 55 Figure 6.5: Shifts in Real Labor and Capital Productivity and Real Earnings Growth in the Manufacturing Sector: 1984/85-2001/02…………………………………….……... 56 Figure 8.1: Comparison of Trends in Road Expenditure (as % of total expenditure)….. 66 Figure 8.2: Pattern of Recurrent Expenditure…………………………………………... 68 Figure 8.3: Trends in Capital Expenditure………………………………………..…….. 68
x
xi
Preface An earlier study on Ethiopia1 found that although the economy of the country achieved modest growth during the 1990s, the results of that growth were not translated into poverty reduction. And a primary reason for that was that the rate of employment growth compared to output growth was rather low. The present study follows up on the earlier one and undertakes a more detailed investigation into the labour market and the key sectors of the economy with a view to understanding how Ethiopia’s economic growth could be made more employment-intensive and pro-poor. The study focuses on sectors where the poor are concentrated and analyses how their growth could be steered in a pro-poor direction. Following an assessment of the structure, performance, problems and constraints of the macro economy from 1960-2002 in section two, the authors explore the micro economic characteristics of the labour market and investigate poverty incidence in section three. The bulk of the paper is devoted to the assessment of the sources of output growth, employment and poverty mobility. By using descriptive and econometric analysis of cross-section and time series data and an employment and growth decomposition approach, the following are quantified: the incidence of poverty by occupation; the determinants of sectoral growth, productivity and investment; and the determinants of non-farm activities, productivity and returns in rural areas. The data sources used include National Income Statistics, Household Income and Expenditure Surveys (1995/96 and 1999/00), Welfare Monitoring Survey (1999/00), National Labour Force Survey (1999), Industrial Establishment Surveys, Urban Informal Surveys, Agricultural Census (2003), and Population Censuses. An identification of economic characteristics of poverty groups reveals that there is a relatively high concentration of the poor in agriculture, the informal sector and unpaid family activities - low productivity and low-return sectors. The results of the labour market analysis point to the existence of multiple labour-related risks faced by specific groups. A key finding is the vulnerability of low-educated people and the farming population in rural and urban areas, who are at high risk of being unemployed, remain longer in unemployment, and if employed, are in low-paid and precarious work. The returns to growth and productivity in agriculture are explored in section four with the study calling for increased labour productivity through greater technological change, improvement in human capital and incentives to producers. Sections 5 through 7 cover the diversification of rural livelihoods, small and micro enterprise and the growth of labour intensive manufacturing activities. The paper also discusses the potential of creating employment through labour-based approaches in infrastructure in the search for sustainable growth and hence, poverty reduction. Particular emphasis is given to public works programmes. A number of policy recommendations are offered on a regional, sectoral and employment status basis. To conclude the authors argue that growth alone does not have much impact on poverty reduction in Ethiopia; the pattern and employment content of growth is
1 Mulat Demeke, et.. al.: Growth, employment, poverty and policies in Ethiopia. Issues in Employment and Poverty Discussion Paper 12. Geneva, ILO.
xii
crucial for poverty reduction. The multiple aspects of vulnerability in the labour market, in particular the large overlap between work and poverty, have important implications for the design of a comprehensive national poverty reduction strategy. The study calls for more pro-poor growth policies aimed at creating productive employment and at the same time addressing the main constraints of the different sectors where the poor are concentrated. This includes appropriate targeting of public expenditure, increased provision of primary education and health so the poor can move from low-productivity and low-return activities to higher yielding sectors. Rizwanul Islam Director Geneva, March 2006 Employment Strategy Department
xiii
Executive Summary Poverty alleviation would remain a crucial part of the overall development agenda in Ethiopia in the years to come. The economy is among the most vulnerable in sub-Saharan Africa and with per capita of only US$100. Ethiopia is one of the poorest countries in the world. Nearly 50 per cent of the country’s GDP originates from agriculture, which has suffered from recurrent droughts and extreme fluctuations of output. The agricultural sector is dominated by smallholder households who produce and cultivate more than 94% of the agricultural output. Small farm households depend for their survival on agricultural production. The main objective of the study was, therefore, to examine the relationship between labor market conditions, sectoral growth, and poverty in the Ethiopian context. The study used various types of analysis, including a descriptive and econometric analysis of cross-section and time series data, and employment decomposition approach. The tempo of economic growth over the last three decades was unsatisfactory: real GDP has been growing at a rate of 2.6 per cent during the period 1960-2002, while population has been growing, on average, by 2.7 per cent, implying a 0.1 per cent decline in the growth rate of per capita income per annum. The pattern of sectoral growth reveals that the industrial and services sectors accounted for a large share of the growth of real GDP: agricultural, industrial, and service sectors grew, on average, by about 1.4 per cent, 3.4 per cent, and 4.7 per cent per annum, respectively, during the period 1960-2002. Agriculture contributed only 1.0 per cent of the growth of the national economy while industry and services contributed 0.5 per cent and 1.8 per cent, respectively, during the period 1960-2002. The growth of the economy was largely attributed to the growth of the service sector. The periods 1960-1973 and 1992-2002 witnessed a liberal type of economic policy while the period 1973-1991 was marked by a planned economic system characterized by extensive government intervention in all spheres of economic activities (socialist system). The performance of the economy was worst during the central planning system when real GDP registered an average growth rate of only 1.8 per cent per annum. The economy recovered in the 1990s as real GDP grew on average by about 4.2 per cent per annum. However, the performance of agriculture remained poor, registering an average growth rate of only 1.5 per cent per annum. Between 1984 and 1999, the total labor force increased by 3.8 per cent per annum. Over the same period, the urban labor force increased by 5.6 per cent per year, while the rural labor force rose by 3.6 per cent per year and hence, the share of urban labor force increased from 9.8 per cent in 1984 to 12.4 per cent in 1999 with significant difference between males and females. For instance, the female labor force increased by about 4.3 per cent, compared to 3.4 per cent of males over the same period. The size of the labor force is estimated to increase from 44.2 million in 2004 to 81.9 million in 2030. About two million persons will be added to the labor force annually. The number of employed population increased from 14.6 million in 1984 to 25.3 million in 1999, growing at slightly higher rate than the population growth rate. Urban employment increased from 1.3 million in 1984 to 2.8 million in 1999, while rural
xiv
employment increased from 13.2 to 22.4 million between 1984 and 1999. The corresponding figures for males were 4.3 per cent and 3.3 per cent. However, the structure of employment by working status reveals that the majority were unpaid family workers, followed by low-paid, self-employed workers during the period 1994-1999. The proportion of unemployed people has remained high in urban than rural areas. Unemployment in rural areas increases less rapidly than in urban areas due to the fact that agriculture absorbs labor via progressive subdivision of family holdings (‘sponge effects’). Illiterate people accounted for a larger share of the unemployed population. However, the relative share of the unemployed, who completed higher grades (especially Grade 12), increased, while the share of illiterate unemployed declined during the two census periods, indicating that unemployment has been creeping up the education ladder. Unemployment is also a youth phenomenon in the country. For instance, unemployment rate is highest in the age group 15-19 years, when secondary school leavers join the workforce, followed by the age group 20-24 years, when tertiary education graduates enter the labor market. Despite the heterogeneous nature of jobs and characteristics of households, the incidence of poverty is relatively high in both rural and urban areas. The largest concentration of vulnerable or poor people in rural areas is in farming activities and most are unpaid family workers. The rural areas tend to have higher rates of vulnerable people in relation to the total population. In the absence of formal job creation, agriculture provides a safety net for the labor force as well as a buffer against the dramatic fall in living standards. However, the low level of productivity (resulting from a massive influx of labor on very small plots) and extremely high poverty rates in agriculture point to the limitations of this coping mechanism for long-term poverty reduction. On the other hand, a large proportion of the urban poor are concentrated in the informal private sector and most are unpaid family workers. The available evidence clearly shows that the majority of the poor are engaged in low productivity and low-return activities such as agriculture and urban informal sector. For the poor, agriculture and the informal sector serve as a fundamental survival strategy. The basic characteristics of the poor include low educational level and relatively large family size. Because of poor education, health and nutrition status, human capital formation is extremely low in Ethiopia. The education system did not help students to improve their cognitive skills and motivate them for success, especially in the 1980s. This is due to absence of vocational and technical trainings, inadequate resources allocated to books and other materials, and curricula that were not relevant to the realities of the country (i.e. were not work oriented, did not encourage productive self-employment, etc.). Although improvements have been observed in the 1990s, education facilities are inadequate compared to the increasing number of students. Shortage of qualified teachers has been a major constraint throughout the Technical and Vocational Education and Training (TVET) schools. The quality of teachers in terms of training and motivation is also low, contributing to the deterioration in the quality of education at all levels. Poor quality and low level of education system are the main causes of low labor productivity in nearly all sectors of the economy. In addition, HIV/AIDS crisis is
xv
currently killing the prime labor force of the country. With the world’s third largest population of HIV/AIDS patients, the impact of the disease is likely to be more catastrophic than even the worst drought the country has ever faced. High level of poverty, widespread hopelessness among the youth (due to lack of employment) and demobilisation of soldiers (which took place twice between 1991 and 2001) has undermined the effort to control the spread of the disease. The country needs to mobilize all available resources to control and minimize the impact of the disease. Families and orphans affected by HIV/AIDS should be supported through community-based programs with long-term commitments to ensure that orphans are getting education and their food requirements are met. The government should place HIV/AIDS at the center of its activities, along with food security and poverty alleviation programs. Growth decomposition reveals that area expansion has been the main source of agricultural output growth. About 83 per cent of the growth in cereal production was due to area expansion during the period 1980-2001. Econometric analysis shows that agricultural infrastructural capital, application of chemical fertilizer and rainfall are the main determinants of agricultural production. Rural labor force is not positively associated with agricultural production. This is consistent with the observation that agricultural value added per worker, and wage rate have declined over time due to declining farm size, yield stagnation and decline for some crops and unfavorable terms of trade. The small and marginal farmers have not benefited from agriculture as relative prices have gone against food crops. A close examination of the cropping pattern reveals that the majority of small farmers produce crops, which are destined for home consumption. Relative prices of subsistence crops have become unfavorable to farmers in recent years as reflected in the ratio of fertilizer to grain prices. Most small and marginal farmers do no produce cash crops. There has been no significant variation in terms of the composition or mix of crops grown by small and marginal farmers over the years. In terms of labor-intensity, livestock activity is found to be more labor-intensive than crop production but the sector has the lowest return owing to a number of structural problems such as lack of animal feed, disease, low genetic potential, etc. Shrinking farm size and declining soil fertility in agriculture underscores the importance of non-farm employment. It has been argued that transformation and consolidation in the agricultural sector cannot be successful without a non-farm sector that provides gainful fulltime and part-time employment opportunity for the growing rural population. Diversifying income sources into off-farm activities is thus necessary not only to create employment for new entrants into the labor force and supplement the income of landless and near landless families, but also to provide downstream and upstream services to agriculture. Nonetheless, these opportunities are limited in the country. With little or no presence of input dealers (fertilizer, improved seeds, chemicals), equipment suppliers and renters, service providers (e.g. veterinary, extension), processors, packers and cold transporters in rural areas, it has become impossible to create a productive non-farm employment with strong backward and forward linkages between agriculture and the non-agricultural sector. The constraints facing off-farm employment include inadequate institutional support, weak demand (due to and lack of urbanization and widespread poverty), inadequate policy
xvi
environment, inadequate human assets, lack of associations or unions, absence of business development service, poor financial services, inadequate physical and social infrastructure and lack of effective participation. A concerted effort aimed at rectifying both demand and supply side constraints simultaneously is required to create a viable off-farm employment opportunity and may include, among others: • Establishing central and regional agencies that specifically cater to the needs of
non-farm activities and ensuring that actors within the sector are properly represented in the governing bodies of these institutions, i.e. involve representatives of the different groups, including women groups, in policy formulation and implementation.
• Assisting cooperatives, trade associations, labor unions and interest/solidarity groups to protect members’ interest, improve access to raw materials and markets.
• Strengthening and streamlining training activities, i.e. coordinating the various training activities given by different organizations (public, NGOs, etc.). Resources are also required to design appropriate material and demand-driven training programs for the sector;
• Building the capacity for technology development and dissemination of proven technologies;
• Establishing labor market information system such as wage rates, demand for workers in a specific area, etc. This would also encourage employers such as commercial farmers and surplus producers in high potential areas to expand their operation and create more job opportunities; and
• Supporting financial institutions such as micro finance institutions and rural banks to ease the credit constraints of the sector.
The manufacturing sector is generally characterized by weak production, consumption and income linkages with the domestic economy. The sector is highly dependent on imported sources for its raw material requirements. Weak inter-sectoral (with other sectors such as agriculture) and intra-sectoral (within the manufacturing sector) implies that the sector has not been the source of dynamism for the economy at large. Within the manufacturing sector, agro-processing industries such as food and beverages, textiles, leather and leather products have relatively strong linkages with agriculture, even though the sub-sector is not expanding. Stiff competition from imports has adversely affected the textile sub-sector. Imported cooking oil and wheat flour (these are also donated in the form of food aid) have also created difficulties for local enterprises. The focus of the revival strategy in the manufacturing industry should be to ensure that growth is sufficiently employment friendly and pro-poor. Support should be provided to those manufacturing activities that are relatively employment-intensive and have strong linkages with the rest of the economy (e.g. textiles, food and beverages, tanning and dressing of leather, other non-metallic mineral products, paper products and printing, and wearing apparel) that serve as a source of job creation. Currently, these activities operate below capacity (only half of their capacity) owing to a number of supply and demand side problems. Special intervention such as improved access to credit, technological development, protection from unfair competition (from import), market information, other infrastructure, etc. is required in
xvii
expanding these sectors. Supportive policies and programmes to improve competitiveness and absorptive capacity are required for those manufacturing sectors in which labor-intensity has remained unchanged (e.g. basic iron and steel, machinery and equipment, trailers, furniture manufacturing n.e.c). Government support should also include the establishment of industrial zones and other common facility centers and business development services. It should be reiterated that the specific nature of the government support should emerge from consultations with the representatives of the stakeholders in the sector. Any policy that lacks the full support of the different actors is bound to have minimal impact. Although small-and medium-scale industries account for a sizable proportion of the industrial GDP and employment for the growing labor force, labor productivity has been low and stagnant. The poor are concentrated in grain mills, food and beverages, and manufacture of metal products where the majority of workers earn incomes that are less than the national poverty line. A significant proportion of the poor also work in the urban informal sector, which is characterized by low productivity and very low return. Within the urban informal sector, urban agriculture and allied activities, manufacturing and trade, hotels and restaurants absorb many of the urban poor. Micro and small-scale enterprises as well as informal sector activities have been performing poorly owing to a number of factors. The major determinant of performance is working capital but access to financial services is limited. Partnership and networking are unknown and skill in business training and technical knowledge are lacking for the most part. Owners of small businesses lack the necessary capacity to benefit from innovative management and expand their businesses. As the small market is shared among too many operators, income earned is barely enough to meet subsistence requirement. The majority of operators have joined the enterprises for lack of better opportunity. The weak purchasing power of the rural community for the products has been identified as one of the major bottlenecks for the growth of the enterprises. In addition, the business environment is hardly conducive for their sustainable development. A comprehensive package of support necessary to address both the supply and demand side problems of the sector may include, among others: • Strengthening Micro and Small Enterprise Development Agencies by involving
representatives of the different operators within the sub-sector in the governing board of the agencies in order to provide intuitional and policy support, information and consultancy advices, technical and marketing services, etc. based on felt needs,
• Supporting associations and networks, especially those catering to women entrepreneurs, and promoting the use of ICT wherever possible;
• Encouraging entrepreneurship to exploit niche market and product diversification: One of the ways to overcome the problem of producing the same kind of items and competing for local market is to develop and promote entrepreneurship;
• Enhancing domestic/local demand through improving marketing facilities (e.g. display centers) and agricultural productivity in the hinterland and increase income of town dwellers in order to overcome the weak market demand currently constraining small enterprises. Any improvement in the production, consumption
xviii
and distribution linkages between small businesses in urban areas and agriculture would help increase income and productivity of both;
• Improving the business environment: and access to infrastructure such as working premises, telephone, water, and electricity, which are commonly cited as the immediate obstacles for small and micro-enterprise businesses. Effective ways must be sought to ensure that small enterprises benefit from the services of formal commercial banks, specialized banks and micro-finance institutions.
Public work programs involving infrastructure development have an enormous anti-poverty impact, not only as an ‘employment-based safety net’ but also as contributors to sustainable growth and, hence, poverty reduction. In Ethiopia, public works are implemented in the form of food-for-work (FFW), cash-for-work (CFW) programs or employment generation schemes (EGS) in which case resources, either in the form of food grain or cash, are given to the vulnerable groups of the population. Two types of infrastructure programs can be distinguished in Ethiopia, namely, those that provide safety nets and those based on labor-based approaches, as opposed to capital-intensive infrastructure development. EGS have been designed and implemented not to alleviate poverty per se but as a short-term policy response to emergency situations. With no adequate planning and community participation in the programs, terraces, feeder roads, tree planting, etc. built through EGS have not helped change the lives of drought- prone areas. This type of infrastructure is also of poor quality. This is clearly demonstrated by lack of improvement in the living conditions of people who have been participating in EGS for last two or three decades. If properly designed and implemented and with full participation of the beneficiaries, the recently introduced Productive Safety Net Program (PSNP) of the Government has the potential to effectively link relief with development activities and ultimately enable participants to exit the cycle of dependency on food aid. Five million impoverished farmers are to be targeted under government-led PSNP. The main objectives are to provide transfers to food insecure population in away that prevents asset depletion at the household level and creates assets at the community level. Finally, what clearly stands out from this study is that growth as such does not have much impact on poverty reduction in the Ethiopian context. The pattern and employment content of growth, which substantially differs across sectors, has significant implication for poverty reduction since all income classes do not share the fruits of growth equally. The absence of the so-called the “trickle down” effect of growth calls for an identification growth patterns that are more efficient in terms of reducing poverty. Ethiopia requires a more pro-poor growth policies aimed at creating productive employment and at the same addressing the main constraints of the different sectors where the poor are concentrated. Equally important are the appropriate targeting of public expenditure, increased provision of primary education and health so the poor can ascend easily from low-productivity and low-return activities to higher yielding sectors. But the most important starting point for sustainable pro-poor growth in Ethiopia is to put in place an institutional system or good governance that allows full participation of the public in policy formulation, implementation and monitoring. Greater devolution of power and transparency in governance are important from the point of view of mobilizing all available resources and unlocking the potential of Ethiopian farmers and entrepreneurs.
1
1. Introduction 1.1. Background Ethiopia is a poor developing country in “transition” from a centrally-planned to a mixed-market economy. It has an agriculture-based economy, dominated by smallholder households who produce more than 90 per cent of the agricultural output and cultivate more than 90% of the total cropped land. The industrial sector in the country is underdeveloped and largely owned by the state. Although the country has registered a commendable overall macro economic performance since the 1990s, the severity of poverty in the country remains unchanged. The proportion of people living under the absolute poverty line in 1999/00 was close to the level five years earlier (1995/96), estimate at 45 per cent (MOFED 2002). Poverty (on the aggregate) has, at best, not decreased in spite of improved economic performances in the 1990s. Moreover, poverty is concentrated in the rural areas where basic services are in critical shortage to meet the bare minimum demands. All poverty indices (i.e. head count, poverty gap and squared poverty gap) showed no significant improvement in rural areas in 1999/00 compared to 1995/96.2 In urban areas, both head count and poverty gap indices rather increased while squared poverty gap index declined during the period considered.3 Economic growth did not lead to any significant improvement in poverty indices because growth was not employment-intensive and growth of employment fell far short of the growth of labor force. According to Mulat et al. (2003), employment and labor market variables have a significant impact on poverty. The critical question that arises from the experience of the 1990s is: since growth was not sufficiently employment-intensive and pro-poor, what can be done to achieve that? In order to answer this question, it is necessary to analyse the growth patterns and constraints of the various sectors that are critical from the point of view of achieving pro-poor growth in Ethiopia. Also important is to see how the poor can benefit from growth in those sectors. Indeed, from a labor market point of view, it is important to examine the labor market characteristics of the poor and identify possible factors that influence the ability to move to employment/sectors yielding higher productivity and returns. 1.2. Objectives of the study Since employment has been identified as one of the critical avenues for poverty reduction, it is important to examine the structure of the labor market in order to identify the sectors where the poor or vulnerable groups are concentrated or specify potential sectors for reducing poverty for leverage intervention. The main objective of the study is, therefore, to examine the relationship between the labour market
2 This decline in poverty is not consistent with the performance of the agricultural sector, however. It is important to recall that real agricultural output increased by only 1.9% per annum between 1995/96 and 1999/00, compared to the increase of the rural population by about 3% per annum. This apparent decline in per capita output growth is also reflected in the decline of per capita rural income (Mulat et al., 2003). 3 It should be noted, however, that the changes in all poverty indices are not statistically significant (even at 10 per cent).
2
conditions, growth, and poverty in the Ethiopian context. Subsumed in the main objective are the following specific objectives, which need to:
• Assess the structure, performance, problems and constraints of the macro economy;
• Characterize the labor market situation; • Investigate poverty mobility and quantify the incidence of poverty by
occupation; • Quantify the determinants of sectoral growth, productivity and investment; • Analyze the determinants of non-farm activities, productivity and returns in
rural areas; • Look into the role of incentives for growth and poverty reduction; • Examine the potential for employment creation through the adoption of labor
approaches in infrastructure; and • Suggest some policy recommendations based on the findings of the study.
1.3. Methodology and data sources Both descriptive and econometric techniques have been used to address the aforementioned objectives. Moreover, employment and growth decomposition techniques have also been employed. The specific method used in the study is indicated in each section. The data for this study have come from various sources including National Income Account Statistics, Rural and Urban Household Surveys conducted by the Department of Economics of Addis Ababa University, Household Income, Consumption, and Expenditure Surveys (1995/96 and 1999/00), Welfare Monitoring Survey (1999/00), National Labor Force Survey (1999), Industrial Establishment Surveys (for various years including 2003), Urban Informal Surveys, Agricultural Census (2003), and Population Censuses. 1.4. Organization of the study The study is organized in nine sections. Section 2 provides an overview of the macro-economy and major structural problems in Ethiopia. Section 3 presents the labor market and poverty. Section 4 is on growth, productivity and returns in Agriculture. Section 5 deals with diversification of rural livelihoods. Small and Micro Enterprise and growth of labor-intensive manufacturing activities are presented in Sections 6 and 7, respectively. Section 8 discusses employment through labor-based approaches in infrastructure. Finally, conclusions and recommendations are discussed in Section 9.
3
2. An Overview of the Macro-Economy and Major Structural Problems
2.1. An overview of the economy The tempo of economic growth over the last three decades was unsatisfactory. Real GDP has been growing at a rate of 2.60 per cent during 1960-2002. On the other hand, population had been growing, on average, by 2.71 per cent during the same period, implying a 0.11 per cent annual decline in the growth rate of per capita income. Looking at the sectoral growth rates, one can observe a larger share of the growth of real GDP has come from the industrial and services sectors than from agriculture. Indeed, agricultural GDP, industrial GDP, and service GDP grew on average by 1.35 per cent, 3.35 per cent, and 4.70 per cent per annum, respectively, during the period 1960-2002. It can be argued that prevailing government economic policies mattered for the growth process. The period 1960-1974, representing the Imperial era, witnessed liberal type of economic policy under the traditional system of public administration, while the period 1975-1991 was marked by a planned economic system in which there was extensive government intervention in all spheres of economic activities. The third regime, 1992-2002, is a period of more liberal economic system similar to that of the first regime. The performance of the economy was the worst during the reign of the second regime when real GDP registered an average growth rate of 1.84% per annum. All sectors, especially agriculture, performed very badly during this period (Table 2.1). On other hand, the performance of the economy has shown improvement in the 1990s: real GDP grew on average by about 4.18 per cent. However, the performance of agriculture was very poor in this regime too: it recorded an average growth rate of 1.53 per cent. Indeed, the performance of agriculture in the first regime was better than the latter two regimes (Table 2.1). Agricultural growth was less constrained by degradation and drought under the Imperial regime. The agricultural sector, which accounted for a lion’s share of the national economy made little contribution to the growth of the economy. Decomposing the growth of the economy into different sectors showed that agriculture contributed only 0.78 per cent of the growth of the national economy while industry and services contributed 0.35 per cent and 1.50 per cent, respectively, during the period 1960-2002. The growth of the overall economy was largely attributed to the growth of the services sector.4 Nonetheless, the growth in the services sector was attributed to expansion in 4 The contribution of each sector to the national economy can be determined using the simple total factor productivity accounting technique. Let Y denotes real GDP; YA YI and YS refer, respectively, to agricultural GDP, Industrial GDP and Service GDP. From the national income accounts,
SIA YYYY ++= Taking the total derivate of Y and dividing both sides of the equation by Y and rearranging yields,
⎥⎦⎤
⎢⎣⎡
⎥⎦
⎤⎢⎣
⎡+⎥⎦
⎤⎢⎣⎡
⎥⎦
⎤⎢⎣
⎡+⎥⎦
⎤⎢⎣⎡
⎥⎦
⎤⎢⎣
⎡=
YY
YdY
YY
YdY
YY
YdY
YdY S
S
SI
I
IA
A
A ***
The above specification can be reduced to
SSIIAA SrSrSrg ++= , where g is the growth rate of real GDP; rA, rI and rS refer, respectively, to the growth rates of agriculture, industry and services. Similarly, SA, SI and SS are the shares of agriculture, industry and services, respectively.
4
administration and defense expenditures. It had little to do with expansion of education and health services, which are crucial to improve the stock of human capital, and improvement in trade, transport and communications services (believed to widen markets) (Zerihun 2003). Figure 2.1 shows the variability of annual growth rates of sectoral outputs. The growth rates of industry and services have been volatile, although the extent of fluctuations is lower than agriculture. The volatility of the different sectors is explained by the complex interactions of different factors such as war, drought, mismanagement and policy failures. A look at the pattern of growth rates by regime reveals that the growth rate of agriculture was relatively stable during the imperial era (1961-1973), while other sectors were volatile. On the other hand, the growth rates of all sectors were highly unstable during the period covering 1973-1991 and 1992-2002 when (Table 2.1).
Table 2.1: Growth Patterns, 1960-2002 (in per cent) Average
Sector/Year 1960-1973
1974-1991 1992-2002 1960-2002
Real GDP at constant factor cost 3.71 1.84 4.18 2.60 Agriculture 2.10 0.70 1.53 1.35 Industry 7.04 2.81 7.74 3.35 Services 7.33 3.44 6.97 4.70
Source: Own computation from EEA/EEPRI database.
Figure 2.1: Trends in Sectoral GDP Growth Rates
-30%
-20%
-10%
0%
10%
20%
30%
40%19
61/62
1963
/64
1965
/66
1967
/68
1969
/70
1971
/72
1973
/74
1975
/76
1977
/78
1979
/80
1981
/82
1983
/84
1985
/86
1987
/88
1989
/90
1991
/92
1993
/94
1995
/96
1997
/98
1999
/2000
2001
/02
Agriculture Industry Services
5
2.2. Recent policy changes and directions In 1974, the Imperial government was violently overthrown by a group of military officers known as the Derg. The Derg replaced the liberal economic policies of the Imperial era with a centralized socialist economic system that discouraged market economy and private property. The land reform proclamation of 1975 nationalized all land, abolished landlordism, and tenancy and redistributed land to peasants in proportion to household size. This proclamation gave provision for the establishment of peasant associations and service cooperatives, and subsequent formation of state farms, and marketing parastatals.5 Moreover, all medium and large private enterprises were also nationalized. Farmers in some high potential areas were forced to join collective farms, similar to those of the former Soviet Union and other communist countries. With regard to trade, prohibitive tariffs, extensive quotas, and complicated licensing procedures heavily limited foreign trade as well as domestic trade. Small farmers were forced to join cooperatives and deliver grain to a government-marketing agency known as the Agricultural Marketing Corporation (AMC). These policies generated disastrous economic outcomes that, combined with brutal political repression, led to civil conflicts. The conflicts brought the downfall of the Derg and the Ethiopian People's Revolutionary Democratic Front (EPRDF) assumed power in 1991. The EPRDF government has focused on reorienting the economy through market reforms and privatization since 1992. The reform measures taken so far by the government include reduction of tariffs, removal of import quota, simplifying licensing procedures, and devaluation of the local currency. Compulsory grain delivery quota and cooperative membership were discontinued and small farmers were allowed to cultivate for themselves.6 With the objective of revitalizing the economy, the government adopted an Agricultural Development-led Industrialization (ADLI) strategy as a central plank of its development program, with a focus on the productivity growth of small farm households and labor-intensive industrialization. It has been argued that the strategy could address the serious challenges that the country is facing, such as poverty and food insecurity, by efficiently utilizing relatively abundant resources (i.e. labor and land). This strategy aims at improving the production and productivity of smallholder agriculture through generation, adoption and diffusion of new farm technologies in the form of improved inputs and farming methods. With the objective of mobilizing small farmers and disseminating better
5 Villagization (planned relocation of people) and forceful resettlement programs were also initiated to support the establishment of large-scale commercial farms. 6 With regard to land, however, the Federal Government has chosen to uphold the land policy of the former socialist government on the ground that private freehold system would lead to sales of land and result in massive displacement of peasants in times of drought or shocks. Government’s position in this regard is clearly articulated in the 1995 constitution which says ‘… the right to ownership of rural and urban land, as well as of all natural resources is exclusively vested in the state and the peoples of Ethiopia (EPRDF, 1995:98). Land is common property of the nations, nationalities and Peoples of Ethiopia and shall not be subject to sale or to other means of transfer’. With the intention of securing tenure security, attempts have been made to introduce land certification. For instance, some regions (e.g. Tigray) have recently introduced land titles to prove more security and encourage investment. However, a study in Tigray reported that land certification, although a positive initiative, cannot address issues of insecurity, ownership and transfer of land (Atakilte 2003).
6
farming practices, a new extension system known as the Participatory Demonstration and Extension Training System (PADETS) has been put in place. Following a series of consultation processes with the farming community, the private sector, NGOs, donors, and civil societies, the government has prepared a Sustainable Development and Poverty Reduction Strategy Program (SDPRP). The strategy calls for empowering local community and demand-driven approach to technology generation and dissemination. The Government has also committed itself to the devolution of power to woredas (districts) and kebeles (villages) facilitating the direct participation of the people in growth and poverty reduction endeavors. A consultative process has also been undertaken to establish a partnership between the Government and its development partners. A high-level workshop was organized by the Government (on 11-12 June, 2003) in a bid to form the new “Coalition for Food Security”. The Coalition aims at attaining food security for five million chronically food insecure people, while, at the same time, improving and sustaining the overall food security of an additional ten million people within a period of five years. Although the consultation processes and Coalition signals a major departure from past traditions and practices, the same top-down approach intervention has continued with little effective participation of the actual stakeholders—the farming community. In the absence of grassroots organizations representing the interest of farmers and weak civil society, the task of designing and implementing agricultural policies is left to the sole monopoly of the government. The Federal Food Security Steering Committee (FSSC), chaired by the Deputy Prime Minister, formulates policies and strategies while the Regional Food Security Coordination Offices serve as focal points for the overall coordination activities in the regions. All food security activities at woreda (district) level are discussed by the Woreda Development Committee, consisting of representatives of all sector offices of the Government. A Woreda Food Security Desk oversees the practical implications of the various elements of the program, provides guidance to each sector involved in the woreda, and coordinates priorities and capacity building efforts, in close liaison with regional actors. This is hardly a reflection of inclusive institutions and effective ownership of the program by the real stakeholders (the farming community, local traders, etc.) does not exist. The absence of independent grassroots organizations (e.g. association of producers, farmers’ unions, etc.) is perhaps the biggest challenge to the realization of the decentralization objective. Both the SDPRP and the New Coalition for Food Security attach great importance to the role of resettlement projects. Intra-regional voluntary settlement in sparsely populated and under-utilized areas is considered as the main instrument of attaining food security. The program is envisaged to involve 440,000 heads of households (totaling 2.2 million people including their families) in four regions (Amhara, Oromiya, Southern Nations, Nationalities and Peoples (SNNP) and Tigray). Preliminary study puts serious doubt on Government claim of the presence of abundant and unoccupied land suitable for cultivation even in regions with more favorable weather condition and fertile land such as Oromiya and SNNP (Alemneh 2003). Governments in Ethiopia resort to resettlement following their failure to develop the non-agricultural sector (to absorb the surplus rural labor) and promote
7
intensification on the farm (to increase the absorptive capacity and productivity of the land). 3. The Labor Market and Poverty The basic purpose of this section is to provide a picture of the labor market characteristics in the Ethiopian economy. In doing so, an attempt will be made to discuss the current and projected population and labor force growth with the objective of showing the employment challenge in terms of the number of new entrants to the labor force each year. The starting point of this will be a description of the labor force structure by categories of employment (e.g., employers, self-employment, casual wage employment, regular wage employment, unpaid workers, etc.). The incidence of poverty in each of these categories will be quantified. Differences in earnings (and wages, where relevant) between the poor and the non-poor in each category of employment will be examined. In order to identify the constraints faced by the poor in moving to higher productivity employment, the characteristics of the poor as well as the non-poor (in terms of education, skills, ownership of assets, etc.) will be examined. In addition, the impact of location as well as HIV/AIDS will be analyzed. 3.1. Population growth, labor force and employment The population of Ethiopia more than doubled since 1970, increasing from 27.5 million in 1980 to 71.1 million 2004. The growth rate has accelerated from 2.2% in the 1960s and 2.4% in the 1970s and to a peak of 3.0% in the 1980s. In the 1990s, the growth rate declined slightly, to 2.8%. It is projected that the rate will only decline to 2.6% by 2010 and 1.9% in 2030. The total population of the country is projected to reach 129.1 million by the year 2030. Sustained high rates of population growth have produced a very steep population pyramid, in which people between the ages of 0-14 years constitute a very large share of the total population. Table 3.1 indicates that the share of population aged 0-14 years was 48.2% in 1984 and 34.7% in 2004.
Table 3.1: Population of Ethiopia
Year Population (in ‘000)
Growth Rate (in %)
Population aged <15 Years
Old Age Population
Child Dependency Ratio
1984 40066 3.00 19311.96 2081.96 1.02 1994 53087 2.81 24101.50 2162.18 0.90 2004 71066 2.65 24641.42 2245.48 0.56 2010 83483 2.62 35555.00 2332.00 0.78 2030 129059 1.85 42863.00 4836.00 0.53 Source: CSA, 1984 and 1994 and NOP, 2000. One of the effects of rapid population growth is to increase the size of the labor force. The labor force of the country is projected to increase from 44.2 million in 2004 to 81.9 million in 2030, entailing an average annual growth rate of 2.4%. In terms of absolute numbers, this suggests an addition of about two million people to the labor force annually. The big challenge is how the economy, given its dismal performance in providing employment opportunities for the current workforce, can generate a minimum of two million jobs every year to maintain a stable labor market structure. On average, the total labor force increased by 3.8% per annum between 1984 and1999 with significant variations between urban and rural areas (Table 3.2).
8
Table 3.2: Urban and Rural Labor Force Labor Force (‘000’)
Urban Rural Total
Year Male Female Male Female Male Female 1984 881 569 7,701 5,592 8,582 6,161 1994 1,625 1,133 13,402 10,344 15,026 11,477 1999 1,708 1,573 12,545 9,967 14,253 11,540 Source: CSA, 1984, 1994 and 1999.
With regard to the number of employed population, the number increased from 14.6 million in 1984 to 25.3 million in 1999, growing at an average rate of 3.7% per year. The growth of employment in urban areas, estimated at 5.2% per year, exceeded that of rural areas by 3.6% per year. Like many developing economies, the informal sector has been the most important source of employment for the growing population in Ethiopia. According to the 1999 Labor Force Survey, employment in the urban informal sector has been estimated at 1.2 million against 1.1 million in the urban formal sector, indicating that half of the urban workers are employed in the informal sector.7 The proportion of the informal employment would have been much higher had persons working in subsistence agriculture and those who work in private households as housemaids and guards been included in this classification. The number of people working in the informal sector has been increasing over time, confirming the growing importance of the sector in terms of absorbing employment and serving as a source of income generation for the vast majority of workers in the country. Table: 3.3: Employment Contribution of the Urban Informal Sector (%), 1999 Sex Formal Informal Not-identified Not-stated Male 68.1 42.3 64.7 63.1 Female 31.9 57.7 35.3 36.9 Total 100 100 100 100 Source: CSA, 1999. 3.2. Unemployment and underemployment In Ethiopia, the number of unemployed people increased from 169,621 in 1984 to 770,844 in 1994, representing an average annual growth rate of 2.91% per year (equal to the population growth rate). Widespread unemployment was observed during the early 1990s. The 1999 National Labor Force Survey shows that the number of the
7 The 1999 National Labor Force Survey by CSA considers people working in the government institutions, non-governmental organization employees, and members of producers’ cooperatives as being working in the formal sector and considered as formal employees. On the other hand, other employed workers whose employment status were employer, private organization employee, self-employed, and apprentice were categorized as formal, informal or not-identified based on whether the enterprise they are employed keep book of accounts, has ten or more workers, and has business license (CSA, 1999:147). Accordingly, if an enterprise doesn’t keep records, has less than ten workers and has no license, then that enterprise is considered as “informal”.
9
unemployed population increased to 2.2 million in 1999, with unemployment rate of 8.0%, substantially higher than the rate registered in the 1980s and early 1990s. In terms of age composition, unemployment is essentially a youth phenomenon where it accounted for about 42.9% of the total unemployed. A look at the distribution of unemployed population by educational status shows that illiterate people accounted for a larger share of the unemployed population, about 29.1% in 1984 and 22.6% in 1994. The striking result is that the relative share of unemployed who have attained/completed higher grades (especially grade 12) increased, from 20% in 1984 to 28.3% in 1994, while the share of illiterate declined during the two census periods, indicating that unemployment has started to creep up the education ladder. The 1999 Labor Force Survey also confirmed this fact, i.e. the highest unemployment rate was recorded in groups that have completed Grade 12 and attended Grades 9-11 (Table 3.4).
Table 3.4: Distribution of Current Unemployment Rate by Education, 1999 (%)
As for the rural-urban distribution, the proportion of unemployed people has remained high in urban than in rural areas. Urban unemployment rate increased from 7.9 in 1984 to 22 in 1994, while the corresponding figures for the rural areas were 0.42 and 0.69 respectively. Rural areas absorb the labor supply through progressive subdivision of family holdings, also known as the “sponge effect”.
Table 3.5: Unemployment in Urban and Rural Ethiopia 1984 1994 1999
Description Total Male Female Total Male Female Total Male Female Unemployed population 169,621 83,088 86,533 770,844 415,717 355,127 2,171,735 638,112 1,533,623Unemployed popn (% share) 49.0 51.0 53.9 46.1 29.4 70.6 Unemployment Rate (%) 1.15 0.97 1.40 2.91 2.77 3.09 8.0 4.3 12.5 Source: CSA, 1984, 1994 and 1999. The available evidence indicates that hidden unemployment or underemployment has become a serious problem in the country. One indicator of underemployment is the percentage of workers, among those classified as workers or employed, who had sought or were available or searching for additional work on some days of the year.
10
Nearly half of the employed workers were available for working additional hours and underemployment is more rampant in urban (55.0) than rural (43.6) areas. This is a clear evidence of self-perceived underemployment and if this group of people is included in the unemployed category, then the number of unemployed people will increase substantially. The Labor Force Survey reports that the mean number of hours worked was about 23.3 per week in the country, and the figures for urban and rural areas were 35.6 and 21.8 hours, respectively, in 1999 (Table 3.6).8 Other sources have also confirmed that the majority of workers in urban areas work relatively longer hours (40-48 hours per week) than workers in rural areas (about 13-21 hours per week) (e.g. CSA 1999).9 Overall, the mean number of hours worked by the employed population is low, reflecting under-utilization of the employed labor force.
Table 3.6: Mean Hours Worked and Percent of Employed Population Available or Seeking to Work Extra Hours, 1999
Total Urban Rural Male 27.1 38.0 25.8 Female 18.4 32.7 16.5 Total 23.3 35.6 21.8
Available or Seeking to Work Additional Hours Male 49.0 55.3 48.3 Female 38.8 49.2 37.4 Total 44.6 55.0 43.6
Source: CSA, 1999.
3.3. Incidence of poverty by major occupation The Central Statistical Authority (CSA) has conducted household income, consumption and expenditure survey and Welfare Monitoring survey in 1999 with the objective of assessing household living standards. Such initiative is of a recent phenomenon, as only two household budget and welfare surveys have been conducted so far in the country: 1995 and 1999. The sample size and coverage has greatly improved in the 1999 survey. Although the data is rich in terms of containing essential aspects household characteristics, consumption pattern, employment status, sector of employment, health, access to basic infrastructure, etc., it is a two point cross-sectional data and hence difficult to assess the dynamics of poverty and employment mobility. For this reason, the 1999 household budget and welfare monitoring surveys have been used to examine the key attributes of the poor in the Ethiopian context.
3.3.1. Employment and incidence of poverty Of the 14,286 rural households, 10,623 households were living on adult equivalent real consumption per capita of Birr 300 and above and the subsequent analysis on 8 Mean hours of worked has been computed based on the number of hours worked in the last seven days. 9 It should be noted that there is substantial seasonal variation in the number of hours worked in the rural areas. The reported figure may be understated since the survey was conducted during slack periods (i.e. during the month of March) in which peasants remain relatively idle.
11
incidence of rural poverty for the year 1999 is based on these households. Similarly, out of the 8,431 urban households, where consumption information is available, 7,722 households were living on adult equivalent real consumption per capita of Birr 300 over the same period. As expected, the proportion of the poor is higher in rural areas than urban centers in 1999: about 86.4% and 59.4% of households were poor in rural and urban areas of the country, respectively. Figure 3.1 reveals that about 82.3% of the sample population was engaged in the private formal sector [mainly farming activity] followed by informal employment (about 6.3%) in rural areas in 1999. There is very limited diversification of income sources in rural areas. The picture in urban areas is quite different as a large proportion (about 37.3%) of the population were engaged in the private informal sector followed by employment in the public sector, private formal and self-employed informal in that order (Figure 3.2). The dominance of informal employment in the urban areas confirms the fact that this sector is increasingly serving as a refugee sector, absorbing a larger part of the growing population but at the cost of low labor productivity. One of the household characteristics that determine the level of poverty is occupation of household heads. As shown in Table 3.7, about 88.2% and 90.7% of rural households, whose major occupation was private formal sector and unpaid family, i.e., farm activities, were living on adult equivalent real consumption per capita below the poverty line10. Only 11.9% and 9.3% were living on real consumption per capita above the poverty line (non-poor). In urban areas, a large proportion of the poor are concentrated in the informal private sector and unpaid family activities (Table 3.7). The majority of the poor in the country are engaged in low productivity and low-return activities such as agriculture and urban informal sector.
Table 3.7: Distribution of Poverty by Major Occupation/Activity of Household Head for Rural and Urban Areas in 1999 (%)
Poverty Status Rural Urban
Employment status Poor Non-poor Poor Non-poor Employer 88.10 11.90 33.8 66.2 Employed in private or formal sector 88.20 11.80 62.9 37.1 Employed private informal sector 83.30 16.70 70.9 29.1 Self-employed formal 84.60 15.40 59.6 40.4 Self-employed informal 83.30 16.70 69.1 30.9 Employed in public sector 50.30 49.70 44.1 55.9 Employed in NGOs 74.30 25.70 53.4 46.6 Employed by households 71.40 28.60 56.6 43.4 Unpaid family worker 90.70 9.30 71.4 28.6 Others 80.00 20.00 67.6 32.4 Total 86.40 13.60 59.4 40.6 Source: CSA, Household Income, consumption and expenditure and Welfare Monitoring Surveys, 1999
10 The national poverty line is Birr 1075 per adult per annum.
12
Figure 3.1: Employment in rural areas (1999)
othersunpaid family worker
employed by househol
employed in NGO
employed in public s
self-employed inform
self-employed formal
employed private inf
employed in private
employer
Per
cent
100
80
60
40
20
0
Figure 3.2: Employment in urban areas (1999)
othersunpaid family worker
employed by househol
employed in NGO
employed in public s
self-employed inform
self-employed formal
employed private inf
employed in private
employer
Per
cent
40
30
20
10
0
Source: Same as Table 3.7
13
About 76.1% of the households were male-headed and 23.9% female-headed in rural areas 1999/00. The proportion of female-headed households is relatively larger in urban than in rural areas over the same period, however. In urban centers, for example, about 60.3% were male-headed while 39.7% were female-headed. The distribution of poverty status by gender of household head shows that about 87.9% of the male-headed families are poor compared to 81.9% among female-headed households. It appears that the incidence of poverty is relatively lower among female than male-headed households in rural areas. This result is also consistent with other empirical evidences in the country (Mulat et al, 2003; MOFED, 2002). However, in urban areas, the incidence of poverty is higher for households headed by females than males. One possible but plausible explanation is that female households in rural areas often have access to resources such land to survive while those with no land often migrate to urban areas to work in the informal sector. For example, of the total rural female households, about 95.4% have their own land in 1999. Over the same period, about 62% of female households owned cattle.
Table 3.8: Distribution of Poverty by Sex of Household Heads for Rural and Urban Areas in 1999
Poverty Status Rural Urban
Gender Poor Non-poor Poor Non-poor Male 87.9 12.1 57.40 42.60 Female 81.9 18.1 62.40 37.60 Total 86.4 14.6 59.40 40.60 Source: Same as Table 3.7 With regard to distribution of poverty status by age of household head, the level of poverty generally increased with age in both rural and urban areas (Table 3.9). In the absence of social security (except those employed in the public sector and a few private enterprises), poverty is likely to increase with age. Table 3.9: Distribution of Poverty Status by Age of Household Heads for Rural
and Urban Areas in 1999 (%) Poverty Status
Rural Urban Age Poor Non-poor Poor Non-poor Below 18 years 79.40 23.90 58.50 39.80 18-29 years 79.50 20.40 42.80 57.80 30-44 years 88.10 11.20 56.00 41.40 45-64 years 90.20 10.30 69.60 29.90 65 years and above 82.90 17.10 69.10 30.90 Total 86.40 13.60 59.40 40.60 Source: Same as Table 3.7 It has been argued that education is one of the major determinants of poverty status of households. About 87.4% of the poor households in rural areas were headed by household heads that could not read and write, compared to 83.4% among literates. The corresponding proportions of poor were 74.8 (illiterate) and 50.5% (literate) in urban areas (Table 3.10). The impact of education in rural areas is more visible when the households are grouped into various educational levels. Figure 3.3 shows that the
14
proportion of poor in rural areas declines rapidly with an increase in educational attainment of household heads.11
Table 3.10: Can the household head read and write? Poverty Status
Rural Urban Response Poor Non-poor Poor Non-poor
Yes 83.40 16.60 50.50 49.50 No 87.40 12.60 74.80 25.20 Total 86.40 14.60 59.40 40.60 Source: Same as Table 3.7
Figure 3.3: Educational level and poverty in rural areas
Source: Same as Table 3.7 An attempt has also been made to examine asset ownership of poor households in rural and urban areas. For instance, a large proportion of the rural poor keep farm animals. Table 3.11 indicates that about 78% of poor households owned cattle in rural areas, compared to 15% in urban areas. Ownership of animals by itself does not help unless the animals are used to generate income. It is also important to note that more than three-fourth of the poor in rural areas don’t have radio, while a significant proportion of the poor households have radios in urban areas.
Table 3.11: Asset Possession of the poor Response (%)
Source: Same as Table 3.7 11 Lack of information on educational level of household heads in 1994/95 confined the analysis to the case of the 1999/00 only.
15
Only about 14.7% of the rural poor live within one kilometer from the nearest food market, compared to 69% in urban areas (Table 3.12). The majority of the rural poor (56%) have to travel some over six kilometers to reach the nearest food market. Lack of access to road is bound to reinforce subsistence production in rural areas.
Table 3.12: Distance to the nearest food market (in km) for poor Distance in km Rural Urban
Less than or equal to one km (<=1) 14.7 69 Between 2-5kms 29.2 28.2 Between 6-9kms 27.8 2.5
Between 10-15kms 17.6 0 >=16kms 10.6 0.2
Total 100 100 Source: Same as Table 3.7 Table 3.13 depicts the proportion of poor households and basic social infrastructure. About 43% of the rural poor live more than two kilometers away from primary schools and the situation is worse with regard to secondary schools where more than half of the rural poor live more than 16 kilometers away from it. In other words, close to 60% of the rural poor had to travel a minimum of 16 kilometers to access secondary school in 1999. With regard to health facilities, close to 30% of the rural poor are 6-9kilometers away from the nearest health services. The situation is much better in urban areas: about 81% and 48% of the urban poor have to travel less one-kilometer to reach the nearest primary school and secondary school, respectively. A similar trend has been observed with respect to access to roads. About 29% of the rural poor live more than 16 kilometers away from all weather roads and 19% from dry weather roads (Table 3.14). The rural poor don’t have access to basic economic and social infrastructure and this tends to exacerbate their poverty situation.
Table 3.13: Distance to the nearest school and health center, km Primary School Secondary School Health Center Distance in km Rural Urban Rural Urban Rural Urban Less than or equal to one
km (<=1km) 29.00 80.50 2.00 46.70 10.30 64.30 Between 2-5kms 42.50 18.60 7.70 45.70 26.90 32.60 Between 6-9kms 19.90 0.60 14.10 5.40 29.50 2.40
3.4. Outstanding issues and implications for an employment strategy
3.4.1. Quality of education Human capital is extremely low in Ethiopia due to adverse synergies between poor education, health and nutrition status. One of the major problems of the education system in the 1980s was that it did not help students improve their cognitive skills and motivate them for success. This is due to the fact that education was theory-oriented without due emphasis to vocational and technical trainings. The amount of resources allocated to books and other materials was very small. The number of students per teacher and class increased significantly. The teaching profession was not attractive salary wise. Only those people who could not find employment in other fields joined the teaching profession. As a result the quality of teachers suffered a lot. In addition, the curricula at various levels were not relevant to the objective realities of Ethiopia (MOE 2002). Since 1994, a new Education and Training Policy has been adopted taking into consideration the limitations of the previous educational system. The education policy emphasized development of the physical and mental potential and problem-solving capacity of individuals by expanding and providing basic education to all. The 1994 education policy document stipulates that one of the strategies of the education policy is the promotion of vocational and technical education and training. The aim has been to establish a vocational/technical training system with appropriate linkage to the academic system. The realization of universal primary education for all by the year 2015 was indicated in the First Five-Year Education Sector Development Program (1997/98 to 2001/02), ESDP I. The government has also developed the Second-Five-Year Education Program (2000/2001 to 2004/2005), ESDP II. Technical and Vocational Education and Training (TVET) has been given special emphasis and an extensive program aimed at restructuring the technical and vocational education and training was launched in 2000. Training curricula have been developed for many trades in modular form for 10+1, 10+2 and 10+3 level. The number of schools, colleges, and universities expanded during the late 1990s. Enrolment ratio has also increased substantially. However, such rapid expansion was achieved at the cost of quality. For instance, the number of secondary schools has shown an average growth rate of 3.8 percent per annum, but growth in the number of secondary school teachers failed to match the growth in the number of schools and students during the period 1995/96-1999/2000. At primary level (i.e. Grade 1-8), pupil to teacher ratio (PTR) increased from 37 in 1995/96 to 64 in 2001/02. At secondary school level (i.e. Grade 9-12), the ratio increased from 33 in 1995/96 to 54 in 2001/02. Pupil to section ratio increased from 63 in 1995/96 to 75 1999/2000. The evidence indicates that existing services or facilities are inadequate for the increasing number of students, implying deterioration in the quality of education at all levels. The quality of teachers in terms of training and motivation is also low and in-service programs are inadequate. For instance, shortage of qualified teachers has been a major constraint throughout the TVET schools: of the 2,214 teachers in government and non-government TVET teachers in 2001/02, 1,720 (77.7 percent) have only Diplomas
17
(Grade 12+2 years college education) or less level of qualification (Mulat and Tsegabrehan 2003).12 There are also several other limitations related to development of standards for TVET educational facilities, a system for certification and accreditation of institutions, assessment of additional trades to be included in the curriculum, evaluation of existing training programs, training of sufficient number of qualified TVET teachers to meet the demand, and development of a legal framework to manage the operations of government and non-government TVET institutions. The Ministry of Education has adopted standards and general guidelines for primary teacher education. However, actual practices are not in conformity with set guidelines and standards and fail to address relevant indicators of quality (Adane and Dawit 2001:321). An extensive review of primary education in the country reveals that there is dearth of well-trained and committed teachers, low level teacher participation in educational planning processes, lack of career development for teachers, inadequate participation of stakeholders in curriculum development, inadequate teaching facilities, inefficient utilization of time and other resources, etc. (Yalokwu 2001). The poor quality of education at the primary level has severely constrained education at the secondary and tertiary levels and the country has kept on producing poor quality graduates at all levels.
3.4.2. The return to education Emerging evidences indicate that labor productivity in Ethiopia is twice as low as the average for SSA. This state of affairs is due to a number of factors, one of which is education (Gaici 2003; Mulat and Tsegabrehan 2003). The Ethiopian labor force is highly dominated by illiterate people especially in the agricultural sector. Mulat et al. (2003) indicated that the male adult literacy has a positive association with consumption per capita in rural areas. In urban areas, households with literate adult males and females are less prone to fall in poverty than those with illiterate adult males and females. It has also been documented that the probability of falling into poverty declines if household head or the wife has completed primary education. However, the coefficients of both the head and the wife were statistically insignificant (at 5%) in rural areas but highly significant (at 1%) in the urban areas. It appeared that education, at least the type of education offered now in Ethiopia, has a more important positive impact on the welfare of urban rather than rural households (Bigesten et al, 1999). Similarly, the probability of an individual entering a non-farming occupation as full-time economic activity increases with level of education. The returns on education in these activities can be as high as 18% per year. Hence, education determines entry into these jobs and that the return on education is substantial (Verwimp, 1996). The use of modern inputs such as fertilizer was found to be positively influenced by education in a number of studies on Ethiopia. For instance, Croppenstedt et al. (1999) concluded that farmers who are literate use fertilizer 29 percent more intensively than their illiterate counterparts. The intensity of adoption of new innovations also
12 See statistical data of the Educational Management Information Systems (Ministry of Education). 2002. Educational Statistical Annual Abstract, 2001/02, Addis Ababa, September 2002.
18
increased to 115 for farmers with 4 or more years of formal education, as compared to those with less than 4 years of schooling. Tesfaye and Shiferaw (2001) also observed that the probability of adopting chemical fertilizer increased by a factor of 1.15 for farmers who had above average level of education. Tassew (2003), based on household survey, found that human capital have both direct and indirect effects on household welfare. Schooling indirectly affects welfare through both its effects on increasing the adoption of innovations and through enabling farmers to enter into profitable non-farm activities. In aggregate, an extra year of schooling raised household welfare by 8.5%. By investing more in human capital, farmers become more willing and more able to adopt technology and consequently earn higher income and escape out of poverty. These pieces of evidence do suggest that education is one of the processes by which a society can preserve, enrich and transmit the accumulated knowledge, skills and values of its cultural heritage and environment in order to foster the well being of the population.
3.4.3. HIV/AIDS and the labor force Ethiopia, like many other Sub-Sahara African countries, is faced with the critical development challenges HIV/AIDS epidemic. HIV/AIDS epidemic has deepened the extent of poverty by selectively removing the economically active labor force. For instance, the Ministry of Health estimates that at present more than 3 million people are infected with HIV/AIDS and more than 90% of these are in the age group of 15-49 years. Estimates (UN 1998) indicate that in East Africa, including Ethiopia, more than 30% of the population in some urban areas is living with HIV/AIDS. The available evidence shows that the epidemic is increasingly extending to poverty stricken rural areas of Ethiopia (NOP 1999). The direct costs of the disease often exceed a poor household’s annual income in rural Ethiopia. For instance, the average treatment costs and funeral expenses have been estimated to be birr 2,494, compared to the net farm income which varied between birr 270 and 620 (Bollinger et al., 1994). A death of an adult male usually leads to an increase in female-headed households and consequently, a decline in farm income.13 HIV/AIDS has increased illness and mortality rates, lowering productivity and raising health care costs and continue to be a major constraint on sustained growth. By way of summary, agriculture appears to be providing a safety net for a significant proportion of the labor force as well as a buffer against the dramatic fall in living standards in the absence of formal job creation. However, the low level of productivity (resulting from a very small plots and limited use of modern technology) points to the limitations of this coping mechanism for long-term poverty reduction.
13 Farm households use remittance and off-farm income to purchase assets such as oxen, ploughs, and fertilizer, which are used to capitalize farm production (Reardon, Crawford, and Kelly, 1995; Marenya et al., 2003). These sources of income are often jeopardized among AIDS-afflicted households, particularly those that are asset-poor and vulnerable to begin with (e.g., Mushati et al., 2003; FASAZ 2003; Yamano and Jayne 2004; Donovan et al., 2003). As a result, afflicted households face a multifaceted loss of labor, capital, and knowledge.
19
The results of the labor market point to the existence of multiple labor-related risks faced by specific groups. A key finding of this analysis is the extreme vulnerability of low-educated people, who face a high risk of being unemployed, and if employed, of being low-paid or working in precarious jobs. Other groups facing a high risk of exclusion are people with disabilities, individuals living in depressed rural areas and the youth. The multiple aspects of vulnerability in the Ethiopian labor market, in particular the large overlap between work and poverty, have important implications for the design of a comprehensive national poverty reduction strategy. A clear understanding of the groups at risks is essential as to better meet the needs of specific groups and improve the effectiveness of public policies in terms of reducing poverty. It should be noted, however, that a mere shift in sectoral emphasis in terms of resource allocation to rural development will not be sufficient if the benefits of policies aimed at a specific sector such as agriculture are slanted in favor of upper class groups. Policies will have to be designed that specifically favor the target groups in question, i.e. the poor. 4. Growth, Productivity and Returns in Agriculture The purpose of this section is to analyze the prospects and problems of higher growth in agriculture that could be of benefit to the poor farming households. After a brief account of the description of the sector in terms of its resource base, farm management systems, distribution of landholding and major constraints, an attempt is made to characterize poor households. This is followed by examination of the performance of the sector, pattern of growth, productivity of the sector and the role of incentive structures. Particular emphasis has been given to the small and marginal farmers and the wage laborers in terms of their cropping pattern, access to technology, credit, and benefit accrued from any positive movements in terms of trade and export opportunities for the crops they produce. The trend of wage employment in agriculture along with trends in real wage rates of agricultural laborers has also been examined. An attempt will also be made to assess the livestock sub-sector, with a particular focus on the pastoral regions, as they are extremely vulnerable to drought. 4.1. Resource base
4.1.1. Agricultural resource potentials (a) Land and climate Based on altitude, the Ethiopian highlands (above 1,500 meters above sea level) represent about 36 of the total land area and hosts more than 85 of the population and 70 of the livestock population. The lowlands (below 1,500 meters above sea level) account for about 64% of the land area and are characterized by substantial variability and unreliability of rainfall both between different years and between different places within the same year. Ethiopian soils are reported to be fertile, but are undergoing severe loss of nutrients due to continuous cultivation and erosion. Red soils, the most productive soils in the country, are found distributed throughout the highlands. Nutrients in these soils accumulate in the upper horizons where they are readily available for plant growth
20
and, as a result, they have high inherent fertility. The only drawback of such soils is that they lack of phosphorous, particularly the older ones. The erosion-prone central and northern highlands have low nitrogen and relatively high phosphorous content. Soils in the south and southwestern part of the country have also high nitrogen and low phosphorous. High level of agricultural productivity can be achieved in less degraded areas provided measures are taken to compensate for deficient nutrients and management practices are improved to protect against erosion (Alemneh 2003). The climate in Ethiopia varies mainly according to elevation. The lowland areas have an average annual temperature of over 27° C and receive less than 450 mm of rain annually. Most of the highland plateaus lie between 1,500 and 2,300 masl (mid-highland) and have an average temperature of ∼25° C with an annual rainfall ranging from 500 to 1,500 mm. Above 2,300 masl is a temperate zone with an average temperature of ∼16° C and an annual rainfall between 900 and 1,500 mm. The main rainy season occurs between mid-June and September, followed by a dry season that may be interrupted in February or March by a short rainy season. But an increasing part of the country has been subjected to drought to irregular rains and drought in recent years. The diversity of soil, climate, and elevation allows production of a wide range of agricultural commodities. The agricultural sector spans diverse agro ecological zones with corresponding diversity in crop production. There are, for instance, 18 major agro ecological zones with different physical and biological potentials. Nearly all types of tropical and temperate crops can be grown in the highland areas (with altitude of ~1500 masl). The climate is ideal to grow various kinds of horticultural crops. Coffee and tea are grown in the moist mid-highland areas. With irrigation, lowland areas can be used to grow important industrial crops such as cotton and sugar cane. The potential to grow citrus fruits is also very high. Lowland pastures could be improved and used for commercial livestock production. But enormous diversity also implies developing research and technological capacity to deal with each specific situation, which is obviously very expensive. (b) Water resources Ethiopia has a substantial amount of water resources, though its distribution and occurrences through time and space is erratic. The surface water potential amounts to over 110 billion cubic meters per annum. There are 12 major river basins, with the Abay (Blue Nile) Basin alone accounting for about 53% of the total annual runoff. Ethiopia, known as the ‘water tower’ of north-eastern Africa, has all its major rivers (except Awash) leave the country and flow into neighboring countries, thus requiring the consent of neighboring states for large-scale water projects. About 90% of the annual runoff goes to rivers that flow into the Sudan, Egypt, Somalia and Kenya (Admasu 2003). It has been estimated that less than 1% of the annual surface water is used for irrigation. Of the 3.6 million hectares of irrigable land, less than 5% has been utilized so far. Irrigation received minimal attention in the country’s development policy despite the chronic problem of drought. Water harvesting in the form of micro ponds has been made the focus of the recent food security program, but the amount of water collected is believed to be too small to have a significant impact on grain production.
21
The country’s potential in small, medium and large-scale irrigation projects has yet to be utilized. (c) Genetic resources Ethiopia is famous for its rich and diversified flora and fauna. Its flora is estimated at over 6,000 species. It is the primary gene center for several of the world’s important crops including Arabica coffee, teff, ensete, noug, and the Ethiopian rape. Ethiopia is also the main center for sorghum, finger millet, field pea, chickpea, perennial cotton and sesame. The unique landscape and climate regimes have made the country a veritable island in the eastern Sahel. Most major plant communities, found north of the Equator in Africa, grow in Ethiopia. The natural vegetation is widely used for food, fuel, construction, fodder, fiber, medicine, etc. However, the disappearance of the genetic pool and the diversity of known plants and species have been accelerating in the past decades due to drought and degradation, hence a concerted effort is required to protect this erosion of diversity at farm and community level (Alemneh 2003). It is possible to identify crop or any other plant species of economic value that would perform very well under marginal and moisture-stress conditions provided appropriate research is conducted. (d) Livestock resources Ethiopia has one of the largest livestock populations in Africa. Animals are primarily part of the mixed subsistence farming system, providing inputs (draught, transport and manure) to the cropping system and generating consumables and saleable products (meat, milk, manure, eggs, hides and skins). A high degree of crop-livestock integration and production is made possible by the availability of grazing land free of trypansomiasis and other major animal diseases in the highlands. The lowlands are generally low-rainfall zones where crop production has considerable risk and pastoral-based livestock production dominates. Pastoralists raise mainly sheep and goats with some cattle and/or camel. Sheep farming is practiced in the highland areas with altitude of over 3000 masl. Cattle grazing thrive at 1,500 to 3000 m range of altitude. However, farmers and pastoralists in Ethiopia rely on unimproved pasture for forage and more frequently on crop by-products. Overgrazing is also one of the major factors behind the alarming rate of soil degradation in the country. The country, especially food insecure districts, could greatly benefit from a comprehensive package aimed at limiting the number of animal to the carrying capacity of the land, improved breeds as well as improving feed, veterinary and marketing services for the livestock sector. (e) Human resources If given the opportunity, the country’s large labor force is believed to be hardworking and productive as evidenced in the past architectural wonders of the Axum obelisks, the Rock Hewn churches of Lalibella and the Castle of Emperor Fasiladas at Gondar. Indeed, many observers over the last half century have identified Ethiopia as one of the world’s oldest civilizations and a land of great potential. The first country report of the World Bank on Ethiopia in 1950 indicated that Ethiopia has “industrious and intelligent” people and believed that “the possibilities for the country’s further economic growth are significant” (Easterly 2002). But traditional beliefs and attitudes have discouraged savings, encouraged wasteful consumption and tolerated corrupt
22
public administration. The number of holidays observed by refraining from farm work is extremely high among followers of the Coptic Church in rural areas. Education and an enabling environment are required to transform old cultures and attitudes and make the country labor force more productive.
4.1.2. Farm management practices and farming systems Ethiopia has varied agro-ecological zones and topography, with diversified natural vegetations. Ethiopian farmers have developed different types of complex farming methods and cropping patterns in response to climatic diversity, highland mixed agriculture, lowland mixed agriculture, pastoral complex, and shifting cultivation. But agricultural productivity is one of the lowest in the world owing to limited use of modern agricultural techniques and traditional farm management practices, besides declining soil fertility and recurrent drought. About 44% of the farming households used ox- or horse-driven plowing methods, while 37% used both hoe and ox/horse in 2001/02 (CSA 2003). The use of tractors is very limited, only 0.1% (Table 4.1). Although the use of draft animals is more widespread in Ethiopia than in any other parts of Africa, agricultural productivity is not any better. Agricultural inputs such as fertilizers, improved seeds and pesticides are not applied by majority of farmers. About 39% of the total cropped land area has been fertilized, compared to 8.2% for pesticides and 2.8% for improved seeds in 2001/02, indicating that the fertilizer has become relatively more important for many of the small farm households in the country. 14 A significant proportion, about 81%, of the fertilized land was allotted to cereal crops compared to pulses (5.5%), oilseeds (1.3%) and permanent crops (6.8%). A similar pattern has been observed in other agricultural inputs in which cereals accounted for a larger proportion of the cropped land under improved farming practices (Table 4.2). Agricultural production is guided by the need to meet subsistence food requirements. Diversification into high value cash crops is limited in Ethiopia. One of the major problems is limited capacity of farmers to break subsistence mentality. A large proportion of smallholders, about 64.6%, were illiterate, while 13.6% have some informal education, 16.9% and 4.7% have completed grade 1-6 and 7-12, respectively, in 2001/02. Only 0.2% have completed grade 12 or above (Table 4.3).
Table 4.1: Method of Ploughing Method Number of holders Share (in %) Hand Dug 1,864,987 18.2 Ox/Horse driven 4,540,817 44.3 Tractor 9,775 0.10 Hand Dug and Ox/Horse 3,818,850 37.2 Tractor and Ox/Horse 18,769 0.20
Source: CSA, 2003.
14 Fertilizer has also been the dominant agricultural input in all regions. With regard to the application of fertilizer by specific crop type, teff has been the most fertilized crop followed by maize, wheat and barely in 2001/02.
23
Table 4.2: Area Under Improved Farm Management Practices by Crop
Source: CSA, 2003. 4.2. Performance of the agricultural sector
4.2.1. Crop production and area cultivated Agriculture is composed of crop production, livestock, forestry and fishery sub-sectors. Crops accounted for more than 90% of the total cropped land, while vegetables, root crops and permanent crops played a less important role in terms of area coverage and output during the period 2001/02. Crop production is mainly exercised in the highland areas together with livestock production and contributes almost 65% of the agricultural GDP and animal husbandry contributes 25%. The remaining 10% is generated from forestry, fishing and other activities. The dominant activity in the lowlands is animal husbandry. The sector is dominated by small-farm households, which account for 95% of the total area under crop and for more than 90% of the total agricultural output. Moreover, small-scale farmers produce 94% of food crops and 98% of coffee and the balance is produced by state and private commercial farms. About 37% of the farming households in the country cultivate less than 0.5 hectares and about 87% cultivate less than 2 hectares. Only 12.8% of the farmers own more than 2 hectares of land and 0.9% own more than 5 hectares (Table 4.4). About 86% cultivate their own land, while some 10% rent in land, mainly in the form of sharecropping. With regard to land use, about three-fourths of the total land was under temporary crops, compared to 6% of the permanent crops in 2001 (Table 4.5). Wood or forestland accounted for a negligible proportion of the total land area, about 0.8% in 2001/02.
24
Table 4.4: Number and Area of Holdings by Size, 2001/02 Size of holding (in ha) Number of households Percent <0.1 819,394 7.6 0.1-0.5 3,175,027 29.5 0.5-1.0 2,767,746 25.7 1.0-2.0 2,612,288 24.3 2.0-5.0 1,276,773 11.9 5.0-10.0 97,037 0.9 >10.0 333 0.0 Total 10,748,598.00 100
Source: CSA, 2003.
Table 4.5: Tenure System and Land Use, 2001/02
Tenure type Number of households Area (ha) Owned 10,547,597.00 86.3 Rented 2,134,137.00 10.1 Other 1,000,815.00 3.6 Total 13,682,549.00 100 Land use Temporary crops 10,155,839 74.2 Permanent crops 5,805,161 6.0 Fallow land 3,278,341 7.6 Permanent mead/ pasture 3,727,319 8.7 Wood or forest land 1,486,960 0.8 All other land 10,226,668 2.7 Total 10,758, 597 100
Source: CSA, 2003.
4.2.2. Livestock sub-sector (with emphasis on the pastoral areas) Livestock is considered as a security during crop failure and additional income for farmers in Ethiopia. There are about 41 million cattle, 14.7 million sheep, 13.7 million goats, 0.5 million camels, 1.5 million horses, 4 million Asses, 42.9 million poultry and 4.6 million bee colonies (CSA 2003). A large proportion of cattle and sheep is found in the highlands, while a large number of goats and camels are found in the lowlands (MEDaC 1999). Substantial regional variations have been observed in terms of the distribution of the livestock population. For instance, about 43.3% of the total cattle population was found in the Oromia region, followed by Amhara (25.5%) and SNNP (21.3%) in 2001/02. In pastoral regions such as Afar and Somali, the cattle population accounts for 2.1% of the total, compared to 49.3% of camels. A significant number of cattle is found in Borena, a pastoral area of Oromia.
The role of livestock as a source of food is critical for both highland and lowland inhabitants. The main food contributions include, among other things, meat and meat products, milk and milk products, eggs, and honey. In mixed farming systems in the highlands, 26% of the livestock output is used as food, while in the pastoral areas it is 61%. Livestock products are main source of food in pastoral areas. For example, about 83.3% and 66.7% of milk is used for household consumption in Afar and Somali regions, respectively, and the remaining is used for sale and wage payments
25
(wage in kind) and other purposes (CSA 2003). Although the country has large livestock population, productivity of the sector is extremely low due to, inter alia, diseases, shortage of feed, low genetic potential and weak market environment. Emerging evidences indicate that the country loses an estimated of 8.1% of its cattle, 14.2% of sheep, and 11.1% of goats per year (Ayele 2003). Traditional methods of animal husbandry render current output per unit of domestic breed of livestock too low. Therefore, it appears that investment opportunities are potentially attractive for modern commercial livestock breeding, production and processing of meat, milk and eggs.
4.2.3. Labor intensity of crops and livestock activities15 Land has become a limiting factor for agricultural activities in Ethiopia due to, among others, population pressure and land degradation. In such economic setting, evidently, if labor is used productively, it can help create capital and regenerate natural resources. The total amount of productive time varies noticeably among activities such as farm work, livestock husbandry and other employment-generating activities, between villages and gender in Ethiopia. Labor time devoted to livestock accounted for the largest proportion of the total labor time. Table 4.6 reveals that animal husbandry has been identified as the most labor-intensive in all villages except in Eteya where it accounts for about 98% as much time as farming activities. In the three villages, farmers spend about 33-95% more time on animal husbandry than on farm work. Farmers devote less time to farm work in all villages. For example, farming activities account for only 24% in Debre Berhan, 41% in Yetemen, 43% in Eteys, and 32% in Azedebo. This can be compared with labor time spent on livestock activities in each village: livestock activities accounts for about 70, 55, 42 and 62% of the total time in the four villages, respectively (Table 4.7). Table 4.6: Relative total productive labor time-intensity by productive activities
15 The data have come from the Intensive Monitoring Survey of the Fifth Round Household Survey. A total of 120 farmers from four villages (Debre Berhan, Yetmen, Eteya and Azedebo) were contacted every fortnight for a period of a little over one year. Each sample household was visited 26 times and each time all economically active members of the household were asked to provide information on their time use over the 24 hours ending at the time of the visit.
26
Table 4.7: Percentage share productive labor time of total productive labor time
Village Activity type N Mean (minutes) % Debre Berhan Agricultural/farm work 31 7218.71 24.44 Livestock activities 31 20764.68 70.31 Other employment/work 31 1548.39 5.24 Total 31 29531.77 100 Yetmen Agricultural/farm work 30 8498.5 40.72 Livestock activities 30 11383.5 54.54 Other employment/work 29 1741.72 8.35 Total 31 20870 100 Eteya Agricultural/farm work 32 7839.69 43.01 Livestock activities 32 7689.38 42.19 Other employment/work 29 2976.55 16.33 Total 32 18226.56 100 Azedebo Agricultural/farm work 33 6384.55 31.61 Livestock activities 33 12491.97 61.85 Other employment/work 28 1558.39 7.72 Total 33 20198.79 100 Source: Monitoring Survey, 5th Round Household Survey, Department of Economics, Addis Ababa University For male-headed households, farm activity (i.e. crop production) accounts for a significant proportion of their labor time in all villages except Debre Berhan. Farmers in Debre Berhan spend 29% more time on livestock-related operations than on farming. Livestock husbandry is the second most important activity in the other three villages, claiming 54 to 80% as much time as farming (Table 4.8). Contrary to male-headed households, animal husbandry took the largest time of women’s productive time in Debre Berhan and Azedebo villages. Female labor is mainly used for activities that are less productive than farming. On the other hand, farm work in Yetmen and non-farm employment in Eteya accounts for the largest proportion of the productive labor time for women. It appears that female spouses do not spend a lot of time on productive or income-generating activities: they spend the equivalent of only about 21% of the time spent by the male heads of the family. There is a large scope for increasing the participation of women in productive activities, provided the drudgery of fetching water, collecting firewood as well as processing and cooking is eased through appropriate technology.
Table 4.8: Relative total productive labor time by productive activities and gender (in minutes)
Male-headed households Women Village Activity type
Source: Monitoring Survey, 5th Round Household Survey, Department of Economics, Addis Ababa University Extreme rural poverty observed in the country is the consequence of excessive underemployment. Farmers spend the equivalent of only 96 to 158 days per annum on farm work and this uncovers that fact that rural labor is far from being fully employed. Livestock activity has been identified as the most labor-intensive sector and yet generates the lowest return. Even after accounting for draught power, the contribution of livestock to income is very low as the feed condition, veterinary services and genetic potential are extremely poor. It appears that poverty alleviation efforts in Ethiopia cannot bring the desired results without creating gainful employment opportunities for the underemployed rural labor force. Individuals and communities must be mobilized to create productive employment opportunities in labor-intensive agriculture, rural infrastructure and non-farm employment. A much greater level of output could be produced with the same amount of time if only existing cropping patterns are changed in favor of more profitable crops or the same crops are producing using more productive technologies. Improved animal husbandry would not only generate more income but also requires less labor time. Livestock management practice should also be changed to overcome the degradation caused by free grazing and feeding crop residues. The introduction of new technologies is also important to reduce the domestic load of women and improve their prospect of income-earning capacity.
4.2.4. Trends in agricultural investment (private sector) It has been widely recognized that investment in agriculture is the key in improving the productivity of the sector. After having assumed power in 1991, the present government took a number of reform measures in the area of investment to encourage and promote private investment in Ethiopia. A total of 763 projects with an investment capital of 4.4 billion Birr (526.12 million USD at the 2000/01 exchange rate), were licensed for domestic investors between 1992 and 2000. Another 31 projects, with initial investment capital of 2.7 billion Birr (321.6 million USD), have been licensed for foreign investors. Agriculture's share in total domestic and foreign investments amounted to 24.1% and 11.31%, respectively, in terms of licensed projects and 11.4% and 19.5%, respectively, with respect to initial investment capital, respectively (EIA, 2002).16 Investment (by both domestic and foreigner investors) is concentrated in mixed food and cash crops farming, food crops and agricultural services. Cash crops have generated relatively more employment
16 Although the number of licensed investment projects seems quite high since the reform period, the number of projects that actually either started operation or proceed according to their project plan has been very low. For instance, of all projects licensed by the Ethiopian investment Commission since 1992, 52% failed to carry out their projects according to their project plan or abandon their projects altogether.
28
opportunities, about 21% for permanent and 12% for temporary workers, compared to other activities (Table 4.9). Private sector investment in the agricultural sector is constrained by several factors, including lack of adequate infrastructure (roods, telecommunication, and power), unfavorable land policy, limited access to finance, and unfavorable marketing and price policy environment. Many of the investors that received license have never become operational or some have closed down because of conflict over land with local pastoralists or farmers (e.g. Awash Valley, Bale zone). The government policy forbids private investment in areas inhabited by small farmers. Only remote areas are allowed for commercial farming activity. But the cost of operating a commercial farm, under conditions currently prevailing in the country, greatly outweighs its return even for Investors that leased land from formers state farms (with developed infrastructure). This is reflected in the sharp decline in agricultural investment and employment after an initial spurt in the mid 1990s (Figure 4.1 and 4.2). Across the nation, very few of the original State Farms are still functioning, either privately or as state owned enterprises.17 The only exceptions are the modern horticultural (mainly flower farms) that have rapidly expanded around the capital city in recent years.
Table 4.9: Percentage Distribution Of Agricultural Investment Projects, Initial Capital And Employment, 1992-2000
Source: Own computation from Ethiopian Investment Commission data
17 S. Lautze, et al., Risk And Vulnerability In Ethiopia: Learning From The Past, Responding To The Present, Preparing For The Future,A Report For The U.S. Agency For International Development, June 2003.
29
Figure 4.1: Trends in Agricultural Investment (in billion Birr)
0
500
1000
1500
1992 1993 1994 1995 1996 1997 1998 1999 2000
Figure 4.2: Number of jobs created by private agricultural investment (000s)
020406080
100120140160
1992 1993 1994 1995 1996 1997 1998 1999 2000
Despite the dominance and significance of agriculture in the overall economy, the level of government resources invested has been limited particularly in the 1980s. Government expenditure in agriculture was, on average, 1.6%of GDP during the period spanning 1980-2001 and the trend increased only marginally from 1.3%in 1992 to 1.5 in 2001 (Figure 4.3). The share of agricultural expenditure in the total government expenditure was also very low and showed a fluctuating trend between 2 (the trough) 13 (the peak) for the period 1980/81-2001/02. Although the magnitude of government expenditure in agriculture has shown an increasing trend, in absolute terms in recent years, the proportion of agricultural expenditure has remained low.
Figure 4.3: Trends in Government Expenditure in Agriculture
0
2
4
6
8
10
12
14
1980
/81
1981
/82
1982
/83
1983
/84
1984
/85
1985
/86
1986
/87
1987
/88
1988
/89
1989
/90
1990
/91
1991
/92
1992
/93
1993
/94
1994
/95
1995
/96
1996
/97
1997
/98
1998
/99
1999
/00
2000
/01
2001
/02
Agricultural expenditure as % of GDP Agricultural expenditure as % of total expenditure
Source for figures 4.1, 4.2 and 4.3: MoFED; CSA (various issues)
30
4.2.5. Agricultural growth, productivity and incentives
Determinants of agricultural growth and productivity Within the context of growth in food and agriculture, emphasis is placed on productivity because expansion of arable land is very limited in most countries due to lack of suitable land and/or because of environmental priorities. In addition, the difference between actual and technically feasible yields for most crops implies great potential for increasing food and agriculture production through improvements in productivity, even without further advances in technology (Getahun 2004). The performance of the Ethiopian agriculture has been less than satisfactory throughout the 1980s and 1990s. For instance, agricultural value added per worker declined by about 0.72% in 1975-1991, 1.1% in 1992-2003 and 0.16% between 1960 and 1974. On other hand, agricultural employment has been increasing, on the average, at a rate of 3.1% per year during the period 1960-20003. As a result, per capita income and agricultural production per capita has declined continuously over time (Table 4.10 and Figure 4.4). The agricultural wage rate has been declining at a rate of 0.17 per year during the period spanning 1980-2001, a clear evidence of the worsening situation of rural income. But it has shown slight improvements during the late 1990s, increasing at rate of 0.3% per year in 1992-2001 compared to a negative growth rate of 1.5% per year in 1980-1991 (Table 4.11 and Figure 4.6). In slow growing or shrinking sectors such as agriculture, low and declining productivity means that employment increases and agriculture acts as ‘sinks’ for labor in rural areas. Workers in rural areas are increasingly absorbed in agriculture where productivity is not only low but also declining. One explanation for this is the existence of limited employment opportunity outside agriculture. But most importantly, lack of any real technological change in agriculture meant declining labor productivity. This points to what must be a major objective of policy in Ethiopia: increase labor productivity through greater technological change, improvement in human capital and better incentives to producers to alleviate poverty. Table 4.10: Agricultural productivity and employment
In terms of growth accounting framework, observed agricultural production growth could be expressed as the sum of the contributions associated with the growth of area (A) and yield (Y). Formally, the growth decomposition often assumes the following functional form:
iii YAQ *= (4.1)
where Qi, Ai and Yi refer, respectively, to agricultural output, area harvested and yield for the ith crop. Denoting total agricultural production, area harvested and yield by Q, A and Y, the above specification can be expressed as:
YAQ *= (4.2)
Alternatively, the logarithmic transformation of equation (4.2) and taking the first difference with respect to time gives the growth rate of the respective variables.
tY
tA
tQ
∂∂
+∂
∂=
∂∂ )(ln)(ln)(ln (4.3)
Denoting the growth rate of agricultural output by θ and, area and yield by β and τ, respectively. Thus, agricultural output growth is simply the sum of area expansion and yield growth and is given by:
τβθ += . (4.4)
Table 4.12 gives the breakdown of the sources of agricultural production growth in terms of area and yield for the period 1980-2000. 18 Cereal production grew by 2.80% per annum between 1980 and 2001. The growth rates of pulses and oilseeds were 1.27% and 4.28% per annum, respectively. Yield of cereals and oilseeds increased by only 0.46 and 0.47% per annum, respectively, while that of pulses declined by about 0.54% per year. On the other hand, the cultivated area for cereals, pulses and oilseeds increased annually by 2.33, 1.81, and 3.82%, respectively. In other words, growth in output was overwhelmingly due to expansion in the area cultivated, with little gains in yield.
18 It should be noted that, by definition, total production by crop type (Qi) is given by: Qi =Ai*Yi, where: Qi, Ai and Yi refer, respectively, to total production, harvested area and yield for the ith crop. The sum of the growth rates A and Y equals the growth rate for Q. The following equations were estimated to determine the growth rates for A and Y: LnA = α + β (time); and LnY = γ + τ (time). Thus, Q = β + τ.
33
Table 4.12: Agricultural Production Growth in Terms of Area
and Yield, 1980-2001 Disaggregate Rates
Crop type Annual Growth in Production Area Yield Cereals 2.80 2.33 0.47 Pulses 1.27 1.81 -0.54 Oilseeds 4.28 3.82 0.46
Source: Own computation. In order to quantify the relative importance of such factors as land, capital and labor, the following model of agricultural production has been specified.
( )ε;, zxfQ = (4.5) where Q is the quantity of agricultural production, x is a vector of variable factors, z is a vector of fixed factors and ε is an error term. The following specific functional form of the model, which is a typical Cobb-Douglas production function, can be proposed and estimated for grain production for Ethiopia.
tttttttt DDLSLnRFLnKLnFLnLLnALnQLn εααααααααα +++++++++= 28176543210 )()()()()()()( (4.6) where Q is quantity of agricultural output, A is cropped area in hectares, L is labor measured as the economically active population involved in agriculture, F is aggregate consumption of a range of fertilizers, K is the stock of agricultural machinery, RF rainfall (measured in terms of deviation from the mean), and LS size of livestock measured in animal units, D1 and D2 are dummy variables for drought and institutional changes that took place following the change of government in 1991, respectively, with observations by time, t and ε error term which is assumed to be identically and independently distributed with mean 0 and variance σ2. The coefficients, (αi, i=1…6), are the elasticities of the respective variables with respect to agricultural output. The estimated functions give an indication of the relative importance of these factors in the Ethiopian agriculture. The dependent variable, Q, is measured in terms of physical quantity (in quintal) and has advantages compared to value terms as it avoids price changes, which is also subject to measurement errors, making the error term larger. Labor use in agriculture is proxied by economically active rural population and it is expected that the size of the labor force may affect agricultural production positively, holding other factors constant. Similarly, capital in the agricultural production process is measured by the stock of agricultural machinery or number of tractors in use and public spending on agricultural infrastructure (in value terms). Use of agricultural input, especially chemical fertilizers, is measured in terms of physical units (quintal) and livestock in animal units. Two types of shocks, i.e. natural shock or rainfall variability and institutional shocks have been measured and included in the regression.
(4.7) Note that numbers in brackets denote t-ratios of the parameter estimates. What stands out very clearly from regression is that the size of the rural labor force employed in the agricultural sector is negatively correlated with grain production and is statistically significant at 10%. The marginal contribution of rural workers to grain production is negative, confirming the earlier finding that the Ethiopian agriculture serves as a refugee sector, characterized by high employment expansion accompanied by declining labor productivity (Mulat et al., 2003). It can be argued that transferring labor from agriculture to other sectors of the economy and expansion of fertilizer and infrastructure would increase agricultural production and productivity in the country. There are opportunities for productive employment of the labor force in public work programs (see section 8) The coefficients for agricultural infrastructural capital, fertilizer and dummy for drought coefficients are all statistically significant at 5%. In particular, infrastructural capital and fertilizer have a strong impact in boosting grain production, with the magnitude of elasticity of 0.87 and 0.16, respectively. Since the dummy variable for drought has been added to account for severe climate anomalies during the period considered, rainfall has been omitted from the estimation. Natural shock, such as drought, has a statistically strong impact on agricultural production, i.e. it reduces agricultural output by about 14%, ceteris paribus. However, the coefficient of agricultural machinery is insignificant although it has the correct sign.19 The sign of the coefficient of the dummy variable reflecting the effects of institutional change on grain production since 1992 appears to be positive. In general, the agricultural sector is characterized by low input and low output. Growth in agricultural output was predominantly affected by expansion of area into marginal and ecologically fragile areas with little gain in yield. Apart from the high degree of inter- and intra-seasonal climatic variability and massive soil degradation, the poor performance of the agricultural sector is caused by inadequate incentives. Relative prices have become extremely unfavorable to farmers in recent years as reflected in the ratio of DAP (widely used chemical fertilizer) to grain prices. For instance, the cost of 100 kg of DAP was only 123 kg of maize in 1992. By 2001, farmers were forced to sell 820 kg of maize to buy 100 kg of DAP, representing a 670 percent increase over 1992 (Development Studies Associates, 2001). Fertilizer prices have increased sharply as a result of currency devaluation, removal of subsidy and increasing cost of transporting the input from a port in a neighboring country. At the same time, output prices have tended to decline due to inadequacies in the grain markets (e.g. lack of market information and limited financial and skill capacity of traders) and underdeveloped infrastructure.
19 It is expected that draught oxen proxied by livestock units might contribute to increased agricultural production through an increase in labor productivity (allowing for faster and better tilling, for planting on time, or for manure transportation) and through the production of organic fertilizer. But contrary to the expectation it is turned out to be negative which requires further scrutiny.
35
The absence of a well-defined tenure security and inadequate budgetary support to the agriculture has also adversely affected the incentive to invest in agriculture. In view of the recent history of frequent land redistribution and absence of land titles, long-term investment on land is highly risky in Ethiopia. Limited public investment in physical infrastructure has also discouraged private investment. In addition, food aid has not helped surplus producing farmers. By depressing producers’ prices and encouraging dependency syndrome, food aid has a disincentive effect on domestic agricultural production (Mulat et al., 2004). 5. Diversification of Rural Livelihoods From the point of view of reducing poverty in rural Ethiopia, it is extremely important to reduce vulnerability of the poor through diversification of the sources of their livelihoods. Non-farm activities can play an important role in that regard. This section is devoted to analysis of the non-farm opportunities available in rural areas, the productivity and returns offered by such activities, especially those in which the poor are engaged, and an identification of the factors that may affect the ability of the poor to raise productivity and returns in their activities or move to activities yielding higher returns. An attempt will also be made to identify factors influencing the allocation of time between farm and non-farm activities for the poor and the non-poor. 5.1. Role of off-farm employment opportunities A twin-track approach in which measures to promote rural development through growth in agriculture, complemented by measures to broaden direct access to rural off-farm activities for the most needy or poor people, is often advocated to alleviate rural poverty. Non-farm income activities are more likely to influence farm productivity in situations where rural credit market does not function. Agriculture and rural off-farm activities are a major source of income for the rural poor as confirmed by the experience of East Asian countries (Ahmad and Isvilanoda 2003; Devis and Stampini 2002). Furthermore, reductions in rural poverty could slow down migration to the towns and thus could have a favorable impact on poverty in urban areas. Farm household diversification into non-farm activities emerges naturally from diminishing or time-varying returns to labor or land, from market failures (e.g., for credit) or frictions (e.g., for mobility or entry into high-return niches), from ex ante risk management, and from ex post coping with adverse shocks (Barrett et al., 2001).20 It should be noted that shrinking farm size, besides declining soil fertility, underscores the importance of non-farm employment in Ethiopia. It has been argued that transformation and consolidation of the agricultural sector cannot be successful without a non-farm sector that provides gainful fulltime and part-time employment
20 In Africa, non-farm activities are primary sources of employment for 10-20% of the rural labor force (ILO/JASPA, 1991). In Some African countries with high population pressure, those engaged in non-farm activities are even higher. For instance, in Rwanda, which experiences high population pressure, about 47% of the farm households are engaged in some off-farm activities, and 16.6% of all rural households' income comes from off-farm sources (UNSO, 1992).
36
opportunities for the growing rural population. In addition to diversifying income, rural non-farm employment is an important stepping-stone to urban skills and structural transformation. Studies indicate that relatively rich households have more diversified incomes and that those with initially more diversified incomes also have a greater increase in both income and calorie intake. This indicates that inequality may increase over time due to differential access to non-farm employment (Block and Webb 2001). Other studies (Woldehanna and Oskam 2001; Smith et al., 2001) also indicate the existence of labor market duality in which the skilled and educated enter high paid jobs or self-employment with good returns, while the unskilled and uneducated depend on low-paying casual employment opportunities. Most off-farm employment opportunities of the poor are also low-paying due to low farm income and availability of surplus labor.
5.2. Participation and contributions of off-farm employment activities Farmers in rural Ethiopia perform different types of off-farm activities, which could be classified as wage employment (includes cash or food for work) and business or self-employment. The 1999 Ethiopian Rural Household survey revealed that the major reason for participating in such activities is limited or low agricultural income (81.9%), an indication that the agricultural sector is unable to generate adequate income for the rural population. The Survey has also indicated that government organizations (29.9%), small-farm households (29.7%) and non-governmental organizations (NGOs) (23.4%) were the main employers or sources of wage employment during the period considered (Table 5.1). The main type of work performed was food-for work (administered by government or NGOs) as reported by 38.8% of the participants in wage employment. It is evident that the ability of most households to get a more reliable source of employment is limited. Food aid is provided only as a temporary relief to an emergency situation (see section 8 for more discussion on public works and food aid). Another important source of wage employment for the rural people is farming activity (24%). However, this opportunity is largely limited to smallholders who normally pay low wage rates and hire labor for a short period of time. Demand for labor is reckoned to have declined over the years because of restrictions on land tenure and population growth, which have increasingly reduced farm sizes while improvements in yields have not been realized for the most parts. The recent collapse of international coffee prices and the effects of recurrent drought have further reduced the capacity of small farmers to hire labor. Wage employment on commercial farms is negatively affected by the failure to successfully privatize state farms and limited support to private investment in agriculture (as shown in section 4 above).
37
Table 5.1: Type of Employer and Reasons for Participating in Wage Employment (1999)
Kind of employer Number Percent Small farmers 119 29.7 Commercial farmers 16 4.0 NGO 94 23.4 Government organization 120 29.9 Urban dwellers 15 3.7 Church/mosque 6 1.5 Individual trader 1 0.2 Construction worker 15 3.7 Private employer 2 0.5 Contractor 1 0.2 Other 12 3.0 Total 401 100.0
Reason for participating in off-farm activity Limited agricultural income 253 81.88 Large family 16 5.18 Favorable demand for goods/services 7 2.27 Seasonal nature of agricultural labor 9 2.91 Level of education 3 0.97 Availability of off-farm opportunities 14 4.53 For house construction purpose 1 0.32 Others 6 1.94 Total 309 100.0
Source: Fifth Round Rural Household Survey, Dept. of Economics, Addis Ababa University. The main type of business activities in the rural areas are trading, weaving, tailoring, basketry, blacksmithing, pottery, selling food and drinks as well as selling firewood, charcoal and wood for construction. The return from these activities is generally low due to low purchasing power of the rural community and low level of urbanization in the country. The small towns are also inhabited by poor people as impoverished, landless and asset-less people seeking to make a living from petty trading, prostitution or begging, especially during food crises, are the ones commonly attracted to the towns. In 1996, the Ethiopian Ministry of Labor and Social Affairs (MoLSA) conducted a survey of 5,699 representative rural households in all the major regions of the country (Amhara, Oromya, SNNPR, Tigray, and Afar –the sedentary population only). The survey focused on the prevalence of agricultural wage employment and rural non-farm employment in Ethiopia. According to the study, about 44 percent of the sample households had been involved in agricultural wage employment and rural non-farm employment (business income). However, off-farm income contributed only marginally to overall household incomes. In all five regions, the share of agricultural wage employment and nonfarm (business) income was only 10.2 per cent of the total household income.21 21 Federal Democratic Republic of Ethiopia, Ministry of Labour and Social Affairs (MoLSA), Agricultural Wage Employment and Rural Non-farm Employment in Ethiopia. Survey Results. August 1997, Addis Ababa, 1997.
38
The limitation of the agricultural sector in creating sustainable livelihoods and the need to develop alternative income opportunities are increasingly being recognized by the government as well as by donors. The development of the non-farm sector is critical to ensure food security, especially in marginal areas. The determinants of off-farm employment are discussed below with the objective of identifying key constraints and policy implications. 5.3. Determinants of off-farm employment in rural Ethiopia: An econometric
analysis It has been argued that participation in the non-farm activity is believed to be influenced by a range of household, economic and geographic characteristics. To identify the main determinants of off-farm involvement in rural areas, a probit model of discrete choice has been used. In this analysis, the dependent variable takes a value of one if a household has participated in any off-farm activity and zero otherwise22. A number of factors have been identified that are potentially affecting involvement in the off-farm employment, which include the following: Demographic variables: include household size, age and gender of household head. Three age groups have been identified in the model: between zero and 9 years; the number of active members of the household (between 10 and 64 years); and number of members of the household above 64 years of age. With regard to gender, a dummy variable has been introduced. This variable takes one if the head of the household is male and zero otherwise. Education variables: four education variables, represented by a dummy variable, have been included in the regression: a dummy variable for those who can read and write and another dummy variable for those with primary, secondary and post secondary education. Income related and risk-bearing capability variables: included in this category are holding size (measured in hectare), a dummy variable for oxen ownership, and dummy variable for land quality (whether own farm land is fertile or not). 22 Formally, the probability model can be written as:
εβ += jXy ' (5.1) where, Xj is a vector of demographic and other determinants influencing off-farm participation, β is a vector of parameters to be estimated, ε is a random disturbance term assumed to be normally, independently and identically distributed with zero mean and constant variance (σ2), and y is given by:
⎩⎨⎧ −
=otherwise
activityfarmoffinesparticipathouseholdaify
01
(5.2)
More precisely, the following probit equation will be estimated:
( ) ( )jj XXyob Φ== /1Pr (5.3) where, Φ is the cumulative normal distribution function and the rest are as defined above.
39
Access to modern technology: measured in terms of irrigation practices and involvement in the new extension program, both are represented by a dummy variable. Table 5.2 presents the marginal effects of each explanatory variable23. The fit of the model is good: Chi-square is significant at 1% level. For ease of interpretation, the analysis of the determinants of off-farm employment is based on the marginal effects, which indicates the effect of a percentage change in the explanatory variable on the probability of involvement in off-farm activities, evaluating all other variables at their mean values. 24 The demographic variables show that the probability of joining off-farm activity is significantly lower for families with more number of older (above 64 years). Non-farm activities do not seem to fit older people. The sex of the head of the household, number of children and active members of the household do not have any significant effect on the probability of participating in off-farm activities. Household size does not seem to be associated with non-farm participation and households who concentrate on own farm activities are less likely to have a member employed in off-farm activities. The coefficient on participation of the new extension program (dummy variable) suggests that the probability of participating in off-farm employment is lower for participants, compared to non-participants. This may be due to the fact that households (involved in the extension program) have relatively higher incomes from their own farm and are constrained by time compared to poorer households. The coefficients for education dummies indicate that the probability of involving in off-farm activities is significantly lower for those with primary level of education as compared to those with no education. Literate household heads may have realized the low return and decided to work on agriculture only. Nevertheless, the coefficient of the variable for post-secondary level of education is positive and significant at 15% level of significance. Participation in off-farm activities seems to increase at higher level of education. As for farm characteristics, all indicators are statistically significant in influencing the probability of off-farm employment. For instance, the probability of off-farm participation declines as holding size increases by about 7 percentage points, perhaps because households may concentrate in the cultivation of their own farms. Also the quality of land matters for off-farm employment, with lower probability of participation for those with good quality of land.
23 The dataset used in this study came from the Ethiopian Rural Household Survey that was collected by the Department of Economics of Addis Ababa University in collaboration with USAID in the 1999/2000 crop season. This survey involved 1,681 households with average family size of 5.9 members, implying a total of 9,918 individuals. The model of the determinants of off-farm employment has been based on 1531 rural households. 24 For dummy variables, the marginal effect has been calculated as the change in the dependent variable associated with a move from a value of zero for the dummy to one, keeping all other variables constant at their mean values.
40
Table 5.2: Marginal Effects of the Determinants of rural non-farm Employment
Dependent variable participation in off-farm employment dy/dx Robust z P>|z| Constant -1.134 0.171 -6.630 0.000 Demographic variables Dummy for gender -0.014 0.038 -0.360 0.716 Number of persons less than 10 years of age 0.005 0.009 0.520 0.601 Number of active household members (10-64 years) -0.005 0.005 -0.950 0.343 Number of household members with age above 64 years -0.005 0.022 -4.170 0.000 Employment, oxen ownership and infrastructure Dummy for agricultural employment* -0.005 0.035 -0.150 0.878 Dummy for irrigation* -0.022 0.053 -0.420 0.686 Dummy for participation in the new extension program* -0.082 0.030 -2.730 0.006 Dummy for oxen ownership* 0.032 0.029 1.110 0.266 Education variables Dummy for those with primary level* -0.038 0.026 -1.790 0.073 Dummy for those with secondary level* -0.038 0.054 -0.700 0.485 Dummy for those with postsecondary level* 0.365 0.245 1.490 0.137 Farm characteristics Logarithm of holding size -0.070 0.013 -5.460 0.000 Dummy for lem and teuf* 0.052 0.025 2.060 0.040 Dummy for teuf (poor quality land)* 0.134 0.037 3.650 0.000 (*) dy/dx is for discrete change of dummy variable from 0 to 1
In general, non-participants appear to have more land and labor resources than participants. These characteristics are thought to give non-participants better farm resources and make them less attracted to non-farm activities. Those participating in non-farm activities tend to be relatively younger and poorer. Diversification at low level of income is only a coping system to meet survival needs. The productivity and return of off-farm activities appear to be even lower than the traditional farming sector. There may be some threshold level beyond which non-farm income can be attractive with positive impact on poverty. It is important to note that rural businesses in the form of input dealers and processors of farm products are rare in Ethiopia. Markets for fertilizer, improved seeds, chemicals and veterinary drugs are underdeveloped and often under control of parastatals that have no local presence to provide retailing services. There are no rural markets for farm tools and equipment. Pumps, pipes and other important implements can only be bought if government offices (e.g. Ministry of Agriculture) have projects or programs to supply these items. Small-scale processing is limited to flour and oil mills. Milk and meat processing and marketing is unknown to the vast majority of the farmers, despite the largest livestock population in the country.
41
5.4. Constraints to off-farm employment Rural policies should aim at integrating farm and non-farm activities at the household level and should not be confined to agricultural polices or sectoral problems and issues alone. A lasting solution to agricultural problems of the country comes through adopting a broader local development strategy that includes both farm and non-farm activities. In this regard there is a need to improve the productivity of non-farm income and the following deserve greater attention in promoting off-farm activities in Ethiopia. (a) Inadequate institutional support Off-farm activities cannot develop without institutional support to meet their regulatory, training, credit, technological and organizational requirements. Government institutions that can support and facilitate the establishment and operation of off-farm activities in Ethiopia are either weak or completely lacking. Moreover, poor people in rural areas have some limited access to training relevant to off-farm activities. Lack of appropriate material and demand-driven training program, shortage of fund, inadequately trained manpower, poorly motivated staff, lack of complementary services (e.g. equipment, credit), etc. have undermined the contribution of the training effort. There is weak coordination between government training services, the private sector and NGOs to create demand-driven and dynamic training systems and approaches. With regard to technological development, most tools used in the handicraft sector are rudimentary and have rarely shown improvement over time. Public institutions engaged in technology development and dissemination for non-farm or rural micro-enterprises are almost non-existent. The private sector is weak and the role of the government in technology development, promotion and marketing is minimal. There are no government initiatives to encourage manufacturers as development partners in addressing the problem of technology. (b) Lack or inadequate human assets Very little has been done in building the human capacity of the country. Illiteracy is a serious obstacle to the expansion of off-farm business as it makes it impossible to introduce basic accounting. Illiteracy is an obstacle to development as it creates resistance to new ways of doing things. Old traditions that encourage too many festivals and holidays (non-working days) have resulted in low or no savings and reinforced subsistence-oriented production. Some specific crafts, of which blacksmith is a well-known example, are socially rejected and practitioners of such crafts suffer from various kinds of discrimination. Non-farm employment is also constrained by inadequate health care system. Many seasonal migrant workers are discouraged by high incidence of malaria in receiving areas such as Raya and Humera in Tigray, Metema in Amhara, and Awash Valley in Afar.
42
(c) Limited access to financial services Lack of finance has been often identified as the greatest constraint to the growth and development of small business undertakings. Start-up capital is particularly a severe limiting factor for new enterprises. Collateral requirements and bias against informal sector have made formal banks inaccessible to small enterprises. For many rural households, money for investment in non-farm enterprises is hard to come by and any amount obtained from friends and relatives, moneylenders or incomes acquired from seasonal labor migration. is too small and/or too expensive. Although rapid expansion of micro-finance institutions (MFIs) in recent years has eased financial constraint in some regions, particularly in Tigray (Dedebit Credit and Saving Institution, DCSI) and Amhara regions (Amhara Credit and Saving Institutions, ACSI), the operation of these local government affiliated MFIs is dependent on local government assistance – woreda and kebele officials- to select beneficiaries and enforce repayment. This is unlikely to be sustainable and the risk of massive default in case of any government change is very high. It has been reported that MFIs in Ethiopia are characterized by operational inefficiency, inadequate incentives, shortage of funds, absence of business plan, and weak governance. Attempts to combine credit services with business advice services, training and other promotional efforts are also limited. Similarly, low diversification of financial products, insurance, savings, credit, investment, etc., has limited the range of services offered by MFIs in Ethiopia. A weak culture of loan repayment is also a serious threat to rural credit services. A substantial amount of unpaid loan has created lax behavior towards loan repayment. Extreme poverty is also forcing many households to divert loans for household consumption purposes. (d) Poor physical and social infrastructure Both hard infrastructure (e.g. roads, telecommunications, electrification) and soft infrastructure (e.g. banking systems, market information system) are lacking in many rural areas and this has increased transaction costs and reduced the productivity of off-farm activities. Due to low quality of roads and absence of feeder roads, most households are a long distance away from roads. Hence transporting goods to marketplaces becomes costly. Lack of market information and poor infrastructure for off-farm activities have made trading (in crops, livestock or handicraft products) an uncertain business and limited its scope to a small geographic area. Similarly, lack of institutional support, particularly in rural areas, has not encouraged business and investment in Ethiopia. (e) Lack of trade associations and unions Lack of sustained development in Ethiopia is due to lack of producer organizations to articulate the interest of peasants and ensure their active participation in planning and execution of development projects. Independent farmers’ unions, interest groups, unions of wageworkers and associations/network of craftsmen have never been part of rural life. In the absence of civic organizations to protect their interest, interactions with public officials have placed a huge burden on poor people. They are unable to
43
take advantage of new economic opportunities or engage in activities outside subsistence farming. (f) Underdeveloped urban centers The well-being of the rural community is very much dependent on the existence of market and a range of services as well as off-farm employment opportunities in urban areas. Small towns serve as production supply and support system, agro and resource processing centers, linkage to (inter) national markets for selling rural products, non-agricultural employment for rural labor, centers for higher order public and private services, consumer convenience centers for purchasing non-durable and durable goods, and centers for information and knowledge25. However, this symbiotic relationship was never properly understood by policy makers in Ethiopia. With less than 5 percent of the total population living in small impoverished towns, demand is a huge constraint to any off-farm activity.26 Addressing supply-side issues alone would have minimal impact on the development of the non-farm sector. Overall, in the absence of organized risk-averting methods such as insurance policies, government programs, etc., farmers attempt to minimize risk by diversifying their activities and sources of income. However, off-farm activities have remained underdeveloped due to inadequate institutional support, lack or inadequate human assets, limited access to financial services, poor physical and social infrastructure, inadequate policy environment, lack of trade associations and unions and the weak market demand. Government support to establish industrial zones, commercial zones and other common facility centers (e.g. incubators or business start up premises) so as to ease the problem of premise and introduce new technologies and ideas is non-existent for the most part. 6. Growth of Labor-Intensive Manufacturing Pro-poor growth in Ethiopia will hinge critically on the structural transformation of the economy and sources of livelihood of the poor. In that respect, it will be important to achieve not only a faster growth of manufacturing, but also a more employment-intensive manufacturing sector. It is, therefore, important to look at the growth potential of labor-intensive manufacturing. A review of the policy environment faced by the manufacturing sector is also provided.27 6.1. Brief overview of the manufacturing sector policies and strategies The level of industrialization in Ethiopia was at an incipient stage during the imperial period (prior to 1974). A conscious effort towards developing a modern industrial sector did not start till the 1950s. It was only in the 1950s when development plans (the three consecutive five year plans) began to be formulated that the development of the sector began to be shaped by policies and strategies pertinent to the sub-sector. A 25 Douglas, M. ‘A Regional network strategy for reciprocal rural-urban linkages: An agenda for policy research with reference to Indonesia’, Third World Planning Review, Vol 20, No.1, 1998. 26 Only 15% of the total population lives in urban areas at national level and perhaps the majority of the urban dwellers live the in the capital Addis Ababa. 27 Because of lack of sufficient data, the determinants of investment in the sector could not be undertaken.
44
number of proclamations were promulgated to encourage foreign investment including tax incentives, provisions of credit on favorable terms with effective protection for domestic industries. During the later years of the Imperial era, the main strategy for industrial development was import substitution, a process assisted by a system of import duties intended to encourage the domestic production of manufactured goods. The government of the time put much faith on private foreign investment and it went to great lengths to attract foreign investment. As a result, a number of light and consumer goods manufacturing establishments were created. On the contrary, small-scale industries were not given due attention and failed to develop. During the socialist military regime (1974-1991), nearly all medium- and large-scale manufacturing industries were nationalized. The participation of the private sector was deliberately discouraged through imposition of capital ceilings and special treatment was made to public companies in the allocation of foreign exchange, market access, subsidies, etc. The industrial development strategy of the military government was, however, similar to that of the Imperial regime, i.e. import substitution industrialization. This development strategy brought no major change in the structure of manufacturing industries. The industrial structure remained the same as manufacturing industries continued to be dominated by light and consumer goods producing industries that were concentrated in the major urban centers and were highly dependent on imported inputs with poor linkages with the rest of the economy. After the overthrow of the socialist government (in May 1991), a well-articulated industrial development strategy came in 2003. The development strategy duly acknowledges the role of the private sector as an engine of economic transformation in the development of a robust and competitive industrial sector. The basic essence of the industrial sector strategy, as envisaged in the document, is promotion of industries that have strong linkages with other sectors of the economy, especially the agricultural sector, i.e. agro-processing and labor-using industries. Specifically, the strategy focuses on selected manufacturing activities such as textiles (garment industry), meat, leather and leather products that would generate substantial stimulus for the economy because these are largely based on domestic resources (as the country has relatively comparative advantage in these manufacturing activities). A number of measures have already been taken to encourage private sector participation in the economy in general and in the industrial sector in particular. These include, among other things, the following: • The lifting of the restriction on private sector investment capital and number of
business ventures; • The easing of licensing requirements and regulations; • The enactment of an investment code, which upon successive revisions, opened up
a wider range of economic activities both for domestic and foreign investors. The investment code is also accompanied by investment incentives in the form of tax holidays, duty free importation of investment goods and the like and had been designed to favor investment in selected sectors and regions;
45
• A downward revision of taxes and tariffs was effected. The marginal tax rate on personal income was also slashed down from 89% to 35%. Business profit tax was reduced from 59% to 35% while the maximum tariff on imported goods was reduced to 40% down from 240%.
It has been indicated that agriculture would continue to become a source of domestic market demand and a reliable raw material base for the expansion of the industrial sector in the country.
6.2. Trends in Output and Employment28 Trends in output growths, where output in this particular case is meant to be valued at current factor cost for various economic activities of the manufacturing sector of the economy, have been fluctuating during the period 1984-2001. The average growth rate of value added was about 8.2% below zero during the pre-reform program, i.e. 1984/85-1991/92. The smallest fluctuation in growth rate of value added was observed in paper, paper products and printing activities, compared to machinery and equipment that registered the largest fluctuation in growth rate of value added. Post-reform (1992-2001) average growth rate of value added in the manufacturing sector was 11.0%. All manufacturing activities except wearing apparel, wood and wood products have shown improvements in the post-reform period. For instance, the average growth rate of value added in food and beverages (16.7%), chemical and chemical products (11.1%), vehicles, trailers and semi-trailers (18.5%) have increased significantly, compared to the pre-reform period (Table 6.1). Real output growth in the manufacturing sector has been fluctuating between 33.1% in 1986/87 and 39.5% below zero in 1991/92. The average growth rate of real output of the manufacturing sector was about 13.5% below zero during the pre-reform program and 9.7 % above zero between 1992/93 and 2001/02. The average growth rate of the sector's real output during the whole period, i.e. before and after the reform program, was about 2.7% below population and labor force growth rates during the period considered.
Table 6.1: Growth Trends of Value Added in the Manufacturing Sector by
Major Industrial Group (At Current Factor Cost in National Accounts Concept): 1984/5 - 2001/0229
Growth Trends Before and After the Reform Program Industrial Group 1984/85-1991/92 1992/93-2001/02 1984/85-2001/02 Food and Beverages -5.2 16.7 11.4 Tobacco 5.8 6.2 7.2 Textiles -8.5 -3.7 1.9 Wearing Apparel, Except Fur -2.0 -4.1 -0.5
28 For detailed analysis of the output and employment in the manufacturing sector, see Mulat et al (2003). 29 Growth rates of value added for fabricated metals, and machinery and equipments production activities of the manufacturing sector were not computed for the pre-reform time span for the simple reason that these activities registered negative value added for some of the years.
46
Apparel Tanning and Dressing of Leather 4.2 1.8 11.2 Wood and Products of Wood -3.5 -5.2 4.8 Paper, Paper Products and Printing -3.8 8.6 8.6 Chemical and Chemical Products -40.0 11.1 -0.5 Rubber and Plastic Products -12.0 14.5 10.0 Other Non-Metallic Mineral Products -0.4 15.9 18.0 Basic Iron and Steal -3.8 6.4 15.1 Fabricated Metal Products 10.3 Machinery and Equipment -1.0 Vehicles, Trailers and Semi-Trailers -10.5 18.5 14.3 Furniture, Manufacturing N.E.C 6.2 14.8 13.8 Average Growth -8.2 11.0 8.5 Source: Own computation. Growth trends of employment in the manufacturing sector indicate that there was some decline in employment growth of the sector. Employment declined by about 1.4% during the pre-reform period, while it increased by about 1.5% during the post-reform period. Employment in the manufacturing sector had grown by about 0.4% per annum almost for the past two decades, which clearly indicates that the sector's contribution to employment creation and reduction poverty was minimal (Table 6.2).
Table 6.2: Growth Trends of Employment in the Manufacturing Sector by Major Industrial Group: 1984/85 - 2001/02
Growth Trends Before and After the Reform Program Industrial Group 1983/84-1991/92 1992/93-2001/02 1983/84-2001/02 Food and Beverages -1.3 2.8 0.5 Tobacco -5.3 -2.7 -1.5 Textiles -2.4 -3.5 -2.3 Wearing Apparel, Except Fur Apparel 4.3 -0.9 0.7 Tanning and Dressing of Leather 3.0 0.1 1.8 Wood and Products of Wood 8.9 -12.3 -1.9 Paper, Paper Products and Printing 1.2 3.1 2.0 Chemical and Chemical Products -12.9 10.5 1.8 Rubber and Plastic Products -9.7 9.1 0.9 Other Non-Metallic Mineral Products -4.2 8.4 4.4 Basic Iron and Steal 6.1 1.2 2.5 Fabricated Metal Products -3.9 5.3 2.7 Machinery and Equipment 17.4 -4.2 6.8 Vehicles, Trailers and Semi-Trailers -2.4 15.6 7.2 Furniture, Manufacturing N.E.C 7.1 12.9 9.8 Average Growth -1.4 1.5 0.4
Source: Own computation from CSA data
47
Figure 6.1 shows that the movements in the sector's real output has been fluctuating very tremendously, particularly during the pre-reform period, although the fluctuation in real output growth was relatively small during post-reform period. Unlike fluctuation in real output growth, fluctuation in employment growth was very minimal, and it was almost consistent both before and after the reform program. Figure 6.1: Employment and Real Output Growth Trends in the Manufacturing
Sector: 1984/85 - 2001/02
-60.0%
-40.0%
-20.0%
0.0%
20.0%
40.0%
60.0%
80.0%100.0%
1985
1986
1987
1988
1989
1990
1991
1992
1993
1994
1995
1996
1997
1998
1999
2000
2001
2002
Year
Gro
wth
(%
)
Real Output Growth Employment Growth
Source: CSA, 2003.
The average growth rate of the sector's employment intensity of output was about 6.8% during the pre-reform period. Post-reform growth rate of employment intensity of output was 9.5% below zero, suggesting that manufacturing sector's output was less labor-intensive, compared to the pre-reform period. The average growth rate of employment intensity of output was about 8 below zero for about two decades, which indicates that the sector's production structure has not been pro-poor (Table 6.3). With the exception of wearing apparel (except fur apparel), and chemical and chemical products manufacturing activities, all the remaining production activities of the manufacturing sector exhibited a decline in employment-intensity of output almost for the past two decades. In a country where labor is abundant, such production strategy may not be helpful in alleviating the incidence of poverty that the country faces.
Table 6.3: Growth Trends of Employment-Intensity of Output in the
Manufacturing Sector by Major Industrial Group: 1984/85 - 2001/02 Growth Trends Before and After the Reform Program
Industrial Group 1983/84-1991/92 1992/93-2001/02 1983/84-2001/02
Food and Beverages 3.8 -13.9 -10.9 Tobacco -11.2 -8.8 -8.7 Textiles 6.1 0.2 -4.2 Wearing Apparel, Except Fur Apparel 6.3 3.3 1.2 Tanning and Dressing of Leather -1.2 -1.8 -9.4 Wood and Products of Wood 12.3 -7.1 -6.8 Paper, Paper Products and 5.1 -5.5 -6.6
48
Printing Chemical and Chemical Products 27.1 -0.7 2.3 Rubber and Plastic Products 2.3 -5.4 -9.1 Other Non-Metallic Mineral Products -3.8 -7.5 -13.6 Basic Iron and Steal 9.9 -5.2 -12.6 Fabricated Metal Products -5.0 Machinery and Equipment -3.2 Vehicles, Trailers and Semi-Trailers 8.1 -2.9 -7.2 Furniture, Manufacturing N.E.C 0.9 -1.9 -4.0 Total 6.8 -9.5 -8.1
Source: Own computation from CSA data From the point of view of pro-poor growth, it is important to identify and characterize labor-intensive manufacturing industries. In that regard, a standard measure of labor-intensity has been adopted. Labor-intensity (LI) for every manufacturing branch (i) at any year (t) is calculated as the ratio of labor engaged per unit of value added and is given by:
it
itit VA
LLI = (6.1)
If we define LI as the total manufacturing labor-intensity and VA as the total manufacturing value added, then the total manufacturing labor-intensity can be decomposed as the summary of the intensities of every branch weighted by its share in the manufacturing value added, where the weights are given by the value added shares of each industry. Formally, it can be written as:
∑ ∑∑== ⎥
⎥⎦
⎤
⎢⎢⎣
⎡===
n
i it
it
it
itn
i it
it
t
tt VA
VAVAL
VAL
VAL
LI11
* (6.2)
Define the value added share of each manufacturing activity by Sit, then the weighted labor-intensity as given by equation (6.2) is expressed as:
∑=
=n
iititt SLILI
1
* (6.3)
Similarly, the weighted labor-intensity (LI)itw of each manufacturing activity can be
expressed as: ( ) itit
wit SLILI *= (6.4)
Table 6.4 presents the results of the weighted labor-intensity of the various manufacturing activities. It has been indicated that despite the decline in employment in the 1990s, textiles and food and beverages have been identified as the largest employers of labor. Regardless of the policy regime, these manufacturing activities accounted for, on average, about more than 60% of the total manufacturing employment in the country during the period 1983-2001. Tanning and dressing of leather, other non-metallic mineral products, and paper products together accounted for close to one-fifth of the total employment over the same period. With regard to labor-intensity, significant variations have been observed across the manufacturing industries. For instance, textiles and food and beverages are relatively the most labor-intensive of all manufacturing industries, followed by tanning and dressing of leather, paper and printing and other non-metallic mineral products. Interestingly, labor-intensity has shown a declining trend in all manufacturing
49
industries in the post reform period, indicating that the Ethiopian manufacturing sector has become more capital-intensive than labor (Figure 6.2). The largest decline has been observed in the most labor-intensive manufacturing activities, i.e. textiles and food and beverages where each declined, respectively, by about 232% and 164% during the period 1983-2001. This clearly shows that the manufacturing sector has not been pro-poor and confirming the fact that growth doesn’t trickle down to the poor. This can be one explanation for the apparent increase in urban poverty in the post reform period. Although the economy has registered remarkable growth in the 1990s, such growth has never translated into a reduction in poverty. From the point of view of reducing the rampant urban as well as rural poverty, the trend in the labor-intensity of the manufacturing sector is frustrating and the future is not promising as well if the present trend continues.
Table 6.4: Labor-intensity in the manufacturing sector, 1983-2001 Employment share (%) Weighted labor-intensity Industrial Group 1983-1991 1992-2001 19983-1991 1992-2001 1983-2001 Food and Beverages 28.0 27.7 4.0 1.5 2.1 Tobacco 1.1 1.0 0.2 0.1 0.1 Textiles 36.8 29.0 5.3 1.6 2.5 Wearing Apparel, Except Fur Apparel 4.3 4.3 0.6 0.2 0.3 Tanning and Dressing of Leather 6.8 7.9 1.0 0.4 0.6 Wood and Products of Wood 2.3 2.0 0.3 0.1 0.2 Paper, Paper Products and Printing 5.0 5.8 0.7 0.3 0.4 Chemical and Chemical Products 3.3 3.8 0.5 0.2 0.3 Rubber and Plastic Products 2.9 3.0 0.4 0.2 0.2 Other Non-Metallic Mineral Products 4.4 6.9 0.6 0.4 0.4 Basic Iron and Steal 1.1 1.3 0.2 0.1 0.1 Fabricated Metal Products 1.8 2.3 0.3 0.1 0.2 Machinery and Equipment 0.2 0.4 0.0 0.0 0.0 Vehicles, Trailers and Semi-Trailers 0.5 0.9 0.1 0.1 0.1 Furniture, Manufacturing N.E.C 1.5 3.8 0.2 0.2 0.2 Total 100.0 100.0 14.4 5.5 7.7
Source: Own computation from CSA data
50
Figure 6.2: Trends in labor-intensity of selected manufacturing industries
0.000.020.040.060.080.100.120.140.16
1983
1984
1985
1986
1987
1988
1989
1990
1991
1992
1993
1994
1995
1996
1997
1998
1999
2000
2001
Year
Labo
r-in
tens
ity
Food and Beverages Textiles Tanning and Dressing of Leather
6.3. Employment decomposition and labor productivity growth in the manufacturing sector
In decomposing employment shifts within the manufacturing sector of the economy, the following framework is employed. Suppose we define employment ratio at time t by λt = Lt/Pt, where Lt denotes total of population employed in the manufacturing sector and Pt stands for total population of the country at time t. Let Lit be employment in the ith manufacturing activity at time t, with ∑=
iitt LL . Let Yit be
real output in the ith manufacturing activity at time t, where real output per capita of the ith manufacturing activity at time t is given by yit = Yit/Pt. The labor output ratio in the ith manufacturing activity at time t can be written as βit = Lit/Yit, and the employment ratio in the ith manufacturing activity at time t can be given by λit= Lit/Pt. Hence, the manufacturing sector's employment ratio at time t can be given by
( )( ) ∑∑ ==
iitittit
iititt yPYYL βλ (6.5)
Taking the fist time difference of the above expression gives:
( )∑ −=i
itititt y ρλλ ˆˆˆ (6.6)
Where λ̂ t denotes the growth rate of the manufacturing sector's overall employment share at time t, yitˆ
represents real output per capita growth of the ith manufacturing activity, and ρ̂ it growth rate of real labor productivity of the ith manufacturing sector. Equation (6.6) above decomposes manufacturing sector's overall employment ratio into weighted average of real per capita output levels of the various production activities of the manufacturing sector and the corresponding weighted average labor productivities of the various production activities. This decomposition provides a framework in which sources of job creation can usefully be explored.
51
Real output of majority of production activities of the manufacturing sector was shrinking relative to population growth, and at the same time real labor productivity of majority of the production activities was either close to zero or declining, leaving growth rate of employment share of the various production activities to fall during the pre-reform program. During the indicated period, average real output of the manufacturing sector weighted by employment share of the sector was declining at 1.1% per annum relative to population growth. During same period, average real labor productivity weighted by employment share of the manufacturing sector was declining at the rate of 0.5% per annum. Decline in real output per capita and real labor productivity for majority of production activities of the manufacturing sector resulted in a decline in the growth rate of employment share of the sector. With the exception of food and beverages, tobacco and textiles production activities, where employment share was shrinking, the employment share remained about the same during the pre-reform program. During the post reform program, real output of all the production activities, with the exception of fabricated metal production activity, has been expanding relative to population growth. Similarly, average real labor productivity, except the fabricated metal for which average real labor productivity has been declining, has been rising, leaving growth rate of employment share of majority of production activities of the sector negligible. For instance, for the textiles manufacturing activity, average real output growth relative to population growth has been trailing behind average real labor productivity, which implies that employment share of textiles has been shrinking relative to other production activities of the sector during the post-reform program. On the average, post-reform period production activity of the manufacturing sector can be characterized by a very marginal increase in employment share. During this period, average real output per capita has been expanding at the rate of 3.3% per annum while average real labor productivity has been increasing at 3.2% per annum, which leaves employment share expansion of the sector at 0.1% per annum. Table 6.5 depicts growth trends of employment share of the various production activities of the manufacturing sector. Table 6.5: Growth Trends of Employment Share in the Manufacturing Sector by
Major Industrial Group Before and After the Reform Program Industrial Group 1984/85-1991/92 1992/93-2001/02 1984/85-2001/02 Food and Beverages -0.2 0.0 -0.1 Tobacco -0.1 0.0 0.0 Textiles -0.3 -0.2 -0.2 Wearing Apparel, Except Fur Apparel 0.0 0.0 0.0 Tanning and Dressing of Leather 0.0 0.0 0.0 Wood and Products of Wood 0.0 0.0 0.0 Paper, Paper Products and Printing 0.0 0.0 0.0 Chemical and Chemical Products 0.0 0.1 0.0 Rubber and Plastic Products 0.0 0.0 0.0 Other Non-Metallic Mineral 0.0 0.1 0.0
52
Products Basic Iron and Steal 0.0 0.0 0.0 Fabricated Metal Products 0.0 0.0 0.0 Machinery and Equipment 0.0 0.0 0.0 Vehicles, Trailers and Semi-Trailers 0.0 0.0 0.0 Furniture, Manufacturing N.E.C 0.0 0.1 0.0 Average Employment Share Growth -0.5 0.1 -0.2 Source: CSA, 2003
6.4. Labor and capital productivity and shifts in real earnings One way of analyzing labor productivity shifts is decomposing the source of labor productivity into its components. Labor productivity growth can be decomposed into components in the same way as the growth rate of overall employment share of the manufacturing sector shown above. Suppose we denote overall productivity at time t of the manufacturing sector, defined as the ratio of the sector's total real output to total employment in the sector, by ∑==
iititttt LYLYρ . Then by taking the first
deference of this expression, one can approximately decompose the overall real labor productivity of the sector as follows.
( ) ( )[ ]∑ −=i
ittitittitt LLLYYY ˆˆρ̂ (6. 7)
In this equation ρ̂ t represents the overall growth rate of real labor productivity at time t.Y itˆ denotes real output growth rate of the ith manufacturing production activity at time t, and Litˆ is employment growth in the ith manufacturing production activity at time t. Equation (6.7) decomposes the overall labor productivity of the manufacturing sector into movements in output and employment, weighted by shares of output and employment, respectively. Changes in the overall labor productivity can also be written as a weighted average of each activities’ labor productivity shifts plus a correction term involving a weighted reallocations of output or employment across the various production activities of the sector. This decomposition can be written as follows:
( ) ( ) ( )[ ]∑∑ −+=i
ittittititi
titt YLLYYLL ˆˆˆ ρρ (6.8)
( ) ( ) ( )[ ]∑∑ −+=i
ittittititi
titt LLLYYYY ˆˆˆ ρρ (6.9)
Equations (6.8) above show how the overall labor productivity change in the manufacturing sector can be written as a weighted average labor productivity shifts plus a correction factor that involves weighted reallocations of output across the various production activities. Employment shares of each production activity are used as weights to determine the average labor productivity shifts in the above equation, while the reallocation weights are given by ( ) ( )[ ]LLYY tittit − . Similarly, equation (6.9) shows how the overall labor productivity change in the manufacturing sector can be written as a weighted average labor productivity shifts plus a correction factor that
53
involves weighted reallocations of employment across the various production activities, where output shares are used as weights for determining average labor productivity shifts in the sector. Weighted average employment growth of the manufacturing sector stood at about 3.5% per annum during the pre-reform program, where the weights are given by employment shares of each of the production activity in the manufacturing sector. During same period, weighted average real output growth, where output in this particular case is value added at constant factor cost and the weights are given by output shares of each of the production activities in the manufacturing sector, declined by 4.7% per annum, leaving labor productivity to fall by 8.1% per annum. Post-reform program weighted average employment growth has increased to 5.9% per annum, while real output growth has jumped to a growth rate of 26.2% per annum, implying a labor productivity shift of 20.2%. A common pattern under liberalization involves slow output growth accompanied by positive productivity growth in traded goods sector of the economy. Since majority of the outputs of production activities in the manufacturing sector can be regarded as traded goods, one would have expected slow growth in real output of the sector, which is found to be very high in the Ethiopian manufacturing sector case (For details of productivity shift by industrial group, refer to Table 6.7).
Table 6.6: Decomposition of Labor Productivity Shifts in the Manufacturing Sector
Growth Trends Before and After the Reform Program Sources of Labor Productivity Shifts 1984/85-1991/92 1992/93-2001/02 1984/85-2001/02 Weighted Average Employment Growth 3.5 5.9 4.8 Weighted Average Output Growth -4.7 26.2 12.5 Labor Productivity Shift -8.1 20.2 7.6
Table 6.7: Decomposition of Labor Productivity Shifts in the Manufacturing Sector by Industrial Group
Growth Trends Before and After the Reform Program Sources of Labor Productivity Shifts by Industrial Group 1984/85-1991/92 1992/93-2001/02 1984/85-2001/02Food and Beverages Weighted Average Employment Growth -0.1 0.8 0.4 Weighted Average Output Growth -4.6 9.5 3.3 Labor Productivity Shift -4.5 8.8 2.9 Tobacco Weighted Average Employment Growth -0.1 0.0 0.0 Weighted Average Output Growth 0.2 0.7 0.5 Labor Productivity Shift 0.3 0.7 0.5 Textiles Weighted Average Employment Growth -0.6 -0.7 -0.7 Weighted Average Output Growth -1.6 1.7 0.3 Labor Productivity Shift -1.0 2.5 0.9 Wearing Apparel, Except Fur Apparel Weighted Average Employment Growth 0.2 0.0 0.1 Weighted Average Output Growth 0.1 0.2 0.2 Labor Productivity Shift -0.1 0.2 0.1 Tanning and Dressing of Leather
54
Weighted Average Employment Growth 0.2 0.1 0.1 Weighted Average Output Growth -0.3 2.8 1.4 Labor Productivity Shift -0.5 2.7 1.3 Wood and Products of Wood Weighted Average Employment Growth 0.4 -0.2 0.1 Weighted Average Output Growth -0.2 0.4 0.2 Labor Productivity Shift -0.6 0.6 0.1 Paper, Paper Products and Printing Weighted Average Employment Growth 0.1 0.2 0.2 Weighted Average Output Growth -0.6 1.2 0.4 Labor Productivity Shift -0.7 1.0 0.3 Chemical and Chemical Products Weighted Average Employment Growth -0.1 0.4 0.2 Weighted Average Output Growth 2.3 2.5 2.4 Labor Productivity Shift 2.4 2.1 2.2 Rubber and Plastic Products Weighted Average Employment Growth 0.0 0.3 0.2 Weighted Average Output Growth -0.2 1.3 0.6 Labor Productivity Shift -0.1 1.0 0.5 Other Non-Metallic Mineral Products Weighted Average Employment Growth -0.1 0.7 0.3 Weighted Average Output Growth -0.1 2.2 1.2 Labor Productivity Shift -0.1 1.5 0.8 Basic Iron and Steel Weighted Average Employment Growth 0.1 0.0 0.1 Weighted Average Output Growth 0.3 1.3 0.9 Labor Productivity Shift 0.2 1.3 0.8 Fabricated Metal Products Weighted Average Employment Growth 0.1 0.2 0.1 Weighted Average Output Growth 0.0 -1.6 -0.9 Labor Productivity Shift -0.1 -1.8 -1.0 Machinery and Equipment Weighted Average Employment Growth 0.1 0.0 0.0 Weighted Average Output Growth 0.0 0.0 0.0 Labor Productivity Shift 0.0 -0.1 0.0 Vehicles, Trailers and Semi-Trailers Weighted Average Employment Growth 0.0 0.2 0.1 Weighted Average Output Growth 0.0 3.5 2.1 Labor Productivity Shift 0.0 3.4 2.0 Furniture, Manufacturing N.E.C Weighted Average Employment Growth 0.1 0.6 0.4 Weighted Average Output Growth -0.1 0.4 0.2 Labor Productivity Shift -0.2 -0.2 -0.2
Source: CSA, 2003. Figure 6.3 depicts movements in weighted average employment and real output growths, and shifts in labor productivity of the manufacturing sector. The sector's overall labor productivity has been positive throughout the reform program with the exception of the years 1998 and 1999 (Ethio-Eritrea war period). However, real output growth was unexpectedly high and volatile throughout the reform program. Similar pattern as the real output growth has also been observed for the sector's employment growth.
55
Figure 6.3: Trends in overall labor productivity growth in the manufacturing sector: 1984/85-2001/02
Weighted Employment Growth Weighted Output Growth Labour Productivity Growth
Overall weighted average labor productivity shifts, where weights are given by each production activity's employment shares, indicate a 1.4% decline in pre-reform period while the post-reform labor productivity has been rising at the rate of 2.4% per annum, which is consistent with labor periodicity of traded goods under liberalization. Similar pattern was also observed in overall weighted average labor productivity change, where output shares are used as weights in the computation of average labor productivity. The following figure depicts movements in weighted average labor productivity change over the entire period of analysis.
Figure 6.4: Overall labor productivity shifts in the manufacturing sector: 1984/85-2001/02
Weighted Average Labour Productivity Growth (Output Share weights)Wighted Average Labour Productivity Growth (Labour Share weights)
56
As can be seen from Figure 6.5, overall weighted average labor productivity shift is more volatile when output shares of each production activity are used as weights than when labor shares are used as weights. Pre-reform period growth trends of real capital productivity in the manufacturing sector indicate that capital productivity was declining in all production activities with the exception of tobacco, and basic iron and steel production. During this period, the average real capital productivity of the sector declined by about 14% per annum. Improvement in real capital productivity of the manufacturing sector has been observed during the post-reform period, where the sector's real capital productivity growth stood at about 2% per annum. A similar pattern has also been observed for shifts in real earnings with the changes in real capital productivity. During the pre-reform period, real earning of the manufacturing sector's employees was falling at an annual rate of 4.5%. Significant improvement in real earnings has been observed during the post-reform program: real earrings increased by about 8 per annum (Figure 6.4). With the exception of the year 1994/95, real earnings of the labor force employed in the manufacturing sector have been increasing. Unlike real earnings, real capital productivity has been declining throughout the reform period with the exception of the first three years of the reform program while real labor productivity during the post-reform was fluctuating. Figure 6.5: Shifts in real labor and capital productivity and real earnings growth
Real Wages & Salaries Growth Real Capital Productivity Growth Real Labour Productivity Growth
Source: CSA, 2003. 6.5. Inter-sectoral linkages of the manufacturing sector: A SAM-based analysis It is known that the various sectors of the economy are interdependent as users of inputs from other sectors and as suppliers of inputs to other sectors. According to Herischman’s terminology, the former is termed as backward linkage and the latter is called forward linkage (Sadoulet and Janvry 1995). Backward linkage measures the proportion of an activity’s output that represents purchases from other activities, while forward linkage measures the proportion of an activity’s output that is used as inputs by other sectors. Such inter-sectoral linkages between the different sectors, especially between agriculture and industry are the basis for self-enforcing and sustaining
57
economic growth. For instance, basic industry cannot be built without a well-developed agriculture, which will provide raw materials, labor, food, etc. And transformation of the agricultural sector requires a robust industrial sector that will supply farm tools, equipments, and other chemical inputs necessary for the agricultural sector. Such type of inter-relationships can be captured using Social Accounting Matrix (SAM)-based multiplier analysis, which shows the inter-connections of the various sector of the economy. In that regard, the linkage analysis will be based on a recently constructed SAM for Ethiopia (for detailed description of the SAM, see Alemayehu and Tadele 2004).
6.5.1. Analysis of linkages using SAM multipliers Following the pioneer work by Stone (1978), SAM has been widely used as a consistent accounting framework to analyze and model the structure of an economy. The SAM framework represents a matrix of double-accounts in which rows and columns denote receipts and expenditures, respectively. As a consistent accounting framework, it is an accounting necessity that receipts and expenditures must balance in all entries and this ensures the consistency of the system. The present SAM is a 40x40 matrix and contains fourteen production activities, five factors of production, eight commodities, a transaction cost account, fifteen institutions, combined capital account and rest of the world account. This SAM captures diverse production activities, interdependencies among the various sectors and institutions that govern the distribution of resources among the different socio-economic groups. Production activities have been disaggregated into four agricultural activities, seven industrial activities, two services and a food-for-work activity. Apart from providing an overview of the structure of the economy during the reference period (i.e.1999/00 in this case), SAM provides the degree of interdependence of the economy. For the purpose of assessing inter-sectoral linkages, the SAM accounts need to be partitioned into endogenous and exogenous, and such distinction may depend on what is perceived as endogenous or exogenous for the operation of the economy. Following the usual distinction, government and rest of the world accounts are treated as exogenous. In this study, capital account is considered as endogenous due to the fact that the level of investment or resource stock is endogenously determined by investment decisions undertaken by different economic agents distinguished in the SAM. Following the conventional approach of input-output models, the relationship between endogenous and exogenous accounts can be expressed as:
xyAy n += (6.10) where, y, An and x are, respectively, a vector of incomes of endogenous accounts, a matrix of average propensities and a vector of incomes of exogenous accounts. This intuitively implies that the row totals of the endogenous accounts can be obtained by multiplying the average expenditure propensities for each row by the corresponding column sum and adding exogenous income. The income of endogenous accounts can be expressed as:
58
[ ] xMxAIy an =−= −1 (6.11)
where, Ma is termed as the social accounting multiplier since it measures the income accruing to endogenous accounts as a result of a unit injection, i.e. it shows how a change in any element of the exogenous accounts will affect the endogenous accounts. That is, through income and consumption linkages within the SAM, changes in the exogenous accounts determine the level of income of endogenous accounts. The above methodology has been employed to examine inter-sectoral linkages in the Ethiopian economy. Accordingly, the ith column sum of the aggregate multiplier matrix (Ma) gives the total input requirement from all sectors and this is the economy-wide backward linkage of this sector. The ith row sum of the aggregate multiplier matrix indicates the total forward linkage of the ith sector. These linkage types can be used for assessing the degree of interdependence of a given sector. A look at the aggregate multiplier matrix reveals that, among the production activities, peasant farming-lowland mixed has got the highest backward linkage (14.92), followed by peasant farming-highland mixed (14.80) (see Table A6.1 in the annex). The inclusion of income and final consumption linkages into input-output matrix makes agriculture superior in terms of growth linkages. Since agriculture is the main source of income and expenditure, it induces industrialization under the force of effective demand. Note that linkages based on inter-activity flows only reveal that peasant agriculture has weak forward and backward linkage effects. This is due to the fact that it is a producer of primary and final commodities. Manufacturing activities have relatively low backward linkages indicating their high dependence on imported sources and less dependence on domestic materials (i.e., weak integration with the rest of the domestic economy). It should be noted that of the manufacturing activities, large/medium agro-processing public and private manufacturing industries (these are mainly food processing, textiles and leather industries) have relatively better backward linkages with the rest of the economy. With regard to forward linkages, the agricultural sector has relatively high forward linkage compared to the manufacturing sector. For instance, peasant farming-highland mixed has got the largest forward linkage followed by peasant livestock production (mainly pastoralists). Within the manufacturing activities, large/medium agro-processing (public) has got relatively high forward linkages followed by large/medium other manufacturing, compared to other manufacturing activities distinguished in the SAM. Thus, the manufacturing sector has weak linkage effects with the domestic economy, especially with the agricultural sector mainly because the sector is highly dependent on imported raw materials and hence, fails to be the sources of dynamism for the economy at large. Overall, the performance of the manufacturing sector in terms of employment generation and poverty reduction has been limited. Employment in the manufacturing sector had grown by about 0.4 per annum almost for the past two decades (well below labor force growth rate). Similarly, the employment intensity of output of the sector declined in the post reform period. Average real labor productivity weighted by employment share of the manufacturing sector declined in the 1980s, but marginally improved during the post reform period. In particular, employment expansion has
59
been observed in food and beverages, chemical and chemical products, other non-metallic mineral products, and furniture manufacturing not elsewhere classified (n.e.c.) during the post reform period. In expanding sectors such as food and beverages, productivity increase does not translate into employment reduction. However, in shrinking sectors (e.g. textiles), higher productivity leads to a reduction in employment. In the remaining activities, employment share remained unchanged. These are slow growing activities and hence higher productivity is accompanied by employment contraction. The majority of the manufacturing activities have not served as a source of job creation for the growing labor force. Accordingly, a fall in the real earnings of the sector was also observed during the pre-reform period despite some improvements in the post-reform program. From the point of view of pro-poor growth, food and beverage, textiles, chemical and chemical products, other non-metallic mineral products, and furniture have been identified as having high labor-intensity and relatively strong linkages with the rest of the economy. Although labor-intensity has shown a declining trend over time, these activities have a good potential for future growth and can serve as a source of job creation if their problems have been adequately addressed. The major problems facing these manufacturing activities can be classified as technology, market, finance, input, policy issues, and human resources related problems. Specifically, the main factors constraining their operation include, among others, shortage of raw materials, lack of demand, lack of working capital, frequent machinery break/failure, and shortage of spare parts. A solution to these problems has become very difficult in Ethiopia because of the government’s reluctance to involve chambers and other associations in policy decisions, implementation and monitoring. The current practice is largely top-down with no formal institutional arrangement for participation of stakeholders in key decisions. Businessmen and industrialists also suffer from the old perception (propounded under the socialist regime) that they are exploiters and do not contribute to the good of society. 7. Micro and Small Enterprises (MSES) Micro and small enterprises are widely regarded as a major source of employment. It is, therefore, important to look at the sector as a whole with a focus on its composition; productivity and returns associated with different activities; the segments where the poor are concentrated, where there is potential for growth that can benefit the poor; and where the constraints are. This section will be devoted to an analysis of these issues as well as the policy environment that this sector faces with a view to identifying changes that may be needed, especially from the point of view of raising the incomes of the poor engaged in this sector.
60
7.1. Characteristics, performance and contribution
7.1.1. Basic attributes of MSEs Most rural poor are engaged in agricultural or related activities as laborers or small-scale farmers in the informal sector. Although the definitions30 vary according to the country context, it is generally agreed that the informal sector, whether rural or urban, comprises small scale and micro-enterprises producing and distributing goods and services in unregulated but competitive markets. These enterprises are generally independent, largely family owned, employ low levels of skills and technology, and are highly labor intensive. These micro-enterprises are concentrated largely in low-income low productivity activities, especially in petty trades and services. It has been documented that MSEs play a significant role in terms of their employment generation capacity, quick production response and their adaptation to weak infrastructure and use of local resources, and as a means of developing indigenous entrepreneurial and managerial skills for sustained industrialization (Fasika and Daniel 1999). The Ethiopian government is now faced with two key policy problems, namely the creation of jobs or employment opportunities to alleviate the widespread poverty and the creation of an internationally competitive industrial structure. These two problems are closely linked, as job creation is often necessary to replace jobs lost due to structural change and international competition.
7.1.2. Contribution of MSEs Micro and small enterprises (MSEs) provide income and employment for significant proportions of workers in rural and urban areas by producing basic goods and services for rapidly growing populations. SMEs play an important role in Ethiopian economy, typically contributing over 99% of all enterprises, over 60% of private sector employment, and about 30% or so of exports. A recent survey by the Central Statistical Authority (CSA) (2003) indicates that there were 31,863 Small Scale Manufacturing Industries (SSMIs) in the country. About 63% of the total establishments were located in urban areas while the remaining (37%) in rural areas, mainly grain mill services. Of the total value added, close to 79% has been contributed by grain mill industry followed by metal and food and beverage industries in 2001/02 (Table 7.1). Excluding grain mills, the value added has shown a growth rate of about 8% per year since 1995.31 Note that the value added generated by SSMIs accounts for about 2.6% of the national GDP and 24% of the industrial GDP during the period considered. The small-scale industries absorbed about 97,781 of the labor force in 2001/02, which is equivalent to only three persons per establishment. The largest employers were 30 In the Ethiopian context, micro enterprises are business enterprises found in all sectors of the Ethiopian economy with a paid-up capital (fixed assets) of not more than Birr 20,000, but excluding high-tech consultancy firms and other high-tech establishments. Similarly, small enterprises are business enterprises with a paid-up capital of more than Birr 20,000 ($2,500) but not more than Birr 500,000 ($62,500) but excluding high-tech consultancy firms and other high-tech establishments (Ministry of Trade and Industry, 1997).
31 Note that the 1995 survey does not include grain mills.
61
grain mills (~85%), manufacture of furniture (~4.4%), manufacture of fabricated metal products (~4.0%) and food and beverages (~2.6%). About 46% and 42% of the employees were permanent paid employees and unpaid family workers, respectively, during the period under consideration. About 12% were identified as seasonal and temporary workers, paid and unpaid apprentices.
Table 7.1: Employment and output contribution of Small-scale Enterprises, 2001/02
Manufacture of luggage, handbags and footwear 15 140.39 0.0 Manufacture of wood and wood products 167 2,203.27 0.5 Manufacture of paper and paper product 4 1,056.87 0.2
Publishing, printing and reproduction of recording media 228 5,975.78 1.3 Manufacture of chemicals and chemical products 2 267.57 0.1 Manufacture of other non-metallic mineral products 106 3,943.09 0.9 Manufacture of fabricated metal products, except machinery and equipment 1,306 31,223.40 6.7
Manufacture of machinery and equipment, n.e.c 30 461.28 0.1
Manufacture of parts and accessories for motor vehicles 5 117.67 0.0 Manufacture of furniture 1,099 19,748.68 4.3 Total 31,863 463,816.59 100.0
Note: n.e.c means ‘not elsewhere classified’. Source: CSA, 2003. Table 7.2 reveals the levels of labor productivity in small-scale manufacturing activities. The weighed labor productivity is relatively high in grain mills followed by manufacture of metal products, food and beverages, and manufacture of furniture. In terms of the return to labor, close to 40% and 31% of the total employees earn wages less than birr 100 and between birr 100-149 per month, respectively, i.e. more than 70% earn less than birr 150 monthly (birr 1,800 per year). Taking the average household size of about four in urban areas, then per capita income would be less than the minimum threshold or poverty line of the country (i.e. birr 1075 per person per year or about birr 89.60 per person per month). Regardless of the type of activity, about 99.9% earn basic wages and salaries less than the national poverty line during the period considered. The wage structure by activity shows substantial variation. For instance, about three-fourth of the total employees in grain mills earn less than birr 150 per month compared to 55% in food and beverages. Alternatively, about 97% and 89% of the total workers in grain mills and food and beverages earn less than birr 300 per month. Similarly, about 72%, 73% and 71% of total workers in wearing and apparel, manufacture of metal products and furniture earn less than birr 300 per month, respectively (see Table A7.1). This shows that the poor workers are highly concentrated in grain mills, food and beverages, and manufacture of metal products and furniture, which are deemed to be low return sectors.
62
Table 7.2: The level of labor productivity in small-scale manufacturing ndustries
Industrial Group Number of
persons engagedShare (in
%) Weighed labor
productivity Food and Beverage 2,593 2.7 218.85 Grain mills 82,868 84.7 3,757.46 Textiles 81 0.1 11.04 Wearing Apparel 1,996 2.0 89.91 Manu. of luggage, handbags and footwear 59 0.1 1.44 Manu. of wood and wood products 663 0.7 22.53 Manufacture of paper and paper product 31 0.0 10.81 Publishing, printing and reproduction of recording media 694 0.7 61.11 Manu. of chemicals and chemical products 11 0.0 2.74 Manu. of other non-metallic mineral products 480 0.5 40.33 Manu. of fabricated metal products, except machinery and equipment 3,898 4.0 319.32 Manu. of machinery and equipment, n.e.c 106 0.1 4.72
Manu. of parts for motor vehicles 26 0.0 1.20 Manufacture of furniture 4,275 4.4 201.97 Source: Computed from Small-Scale Manufacturing Industries Survey (CSA, 2003) Low wages in the SSMIs can be attributed to low level of education. About 75% of the total persons engaged in SSMIs were literate—about 63% and 27% had primary (grade 1-8 level) and secondary (grade 9-12 level) education, respectively. This indicates that workers with low level of education dominate the SSMIs.
Table 7.3: Educational Level of Employees, 2002 Level of education Number Share (in %) Literate 66,189 74.5 Illiterate 22,666 25.5 Highest Grade Completed 1-8 41,699 63.0 9-12 17,625 26.3 Above 12 1,181 1.9 Not Stated 5,802 8.8 Total 66,189 100.0
Source: CSA, 2003. CSA (2003) has also carried out informal sector sample survey in major urban centers. The result showed that there were 799,353 informal sector operators that absorbed about 997,380 persons in 2002. About 80% of the operators were owners while the rest were employees. Of the total workforce engaged in the sector, close to 60% are female, suggesting that the informal sector is dominated by women.
Table 7.4: Distribution of Number of Persons Engaged, 2002 Sex Operators Employees Total Persons
Note: the figures in parentheses are shares (in %). Source: CSA, 2003.
63
The majority (43.3%) of informal sector operators are in the manufacturing sector followed by trade, hotels and restaurants (37.8%). About 81% of informal sector operators are concentrated in the two sub-sectors. About 56% of workers are also employed in manufacturing and about 34% in trade, hotels and restaurants. Close to 53% of informal sector operators are illiterate, with only 33% reporting primary level education (Grades 1-8).
Table 7.5: Sectoral Distribution of Informal Sector Operators, 2002 Sector Number of
operators Share (in %)
Agriculture, Hunting Forestry and Fishing
12,089 15
Mining and Quarrying 1,019 0.13 Manufacturing 346,037 43.3 Construction 17,595 2.2 Trade, Hotels, and Restraints 302,009 37.8 Transport 10,643 1.3 Community and personal services 109,960 13.8 Total 799,352 100.0
Source: CSA, 2003. With regard to the labor productivity, value added per person engaged was lowest in urban agriculture (~birr 100) and highest in the construction activity (~birr 2,761) in 2002. Based on value added per person, the poor are concentrated in agriculture and allied activities, manufacturing and trade, hotels and restaurants that are low return or low productivity sectors.32
Table 7.6: Sectoral Distribution of Workers and Productivity, 2002
Sector Number of Employees
Value Added (in birr ‘000’)
Value Added Per Person Engaged
(in birr) Agriculture, hunting, forestry and fishing 6,211 3.1 1,826.22 0.2 99.79 Mining and Quarrying 135 0.1 2,046.67 0.3 1773.55 Manufacturing 110,065 55.6 259,364.75 34.6 568.66 Construction 3,031 1.5 56,941.39 7.6 2760.66 Trade, Hotels and Restaurants 67,868 34.3 272,351.84 36.3 736.33 Transport 1,834 0.9 17,527.51 2.3 1404.79 Community and personal services 8,890 4.5 140,175.52 18.7 1179.43 Total 198,034 100.0 750,233.90 100.0 752.20 Source: CSA, 2003.
7.2. Policy and other constraints
7.2.1. MSE and the policy environment Micro enterprise development is increasingly being seen as an essential ingredient in the promotion of broad-based growth in improving the well-being of the poor and 32 Unfortunately, the survey on micro and small enterprises does not have information on wages and, hence, difficult to capture the size and structure of wages in the sector.
64
women. There is an increasing policy focus to strengthen entrepreneurship and the contribution of micro-enterprises to attain economic growth with equity as well as to address gender and poverty reduction issues. International aid agencies such as the World Bank provide targeted assistance to SME and approved more than birr 10 billion in SME support programs over the last five years (Beck et al., 2003). The government is committed to developed MSE with different support service programs which include skill upgrading programs for MSE operators, strengthening the use of appropriate modern technologies that boost their capacity to create long-term jobs, alleviate the financial problems of MSEs through credit availability, improve market access to large business purchases and export markets (Box 1).
Box 1: Specific Contents of the MSE Development Strategy (1) Facilitate economic growth and bring about equitable development: It is argued that the expansion of MSEs stimulates economic growth using local resources and is the basis for equitable distribution of income and wealth. (2) Create long-term jobs: Although MSEs are largely labor-intensive (reduce unemployment), they are characterized by low productivity and return. It is, therefore, essential to upgrade their skills and strengthen use of appropriate modern technologies to improve their capacity to create more jobs. (3) Strengthen cooperation between MSEs: Promoting inter-sectoral linkages within MSEs and between MSEs and medium and large-scale enterprises are the key for overcoming constraints in the area of resources. (4) Provide the basis for medium and large-scale enterprises: It is generally argued that MSEs are the bedrock for the growth of medium and large-scale enterprises and stimulate indigenous entrepreneurship. (5) Promote exports: Because MSEs depend heavily on domestic raw materials, the strategy also pays due attention in helping MSEs to participate in international market in which the country has relatively comparative advantage (e.g. leather and leather products, textiles, horticulture, etc.). (6) Balance preferential treatment between MSEs and bigger enterprises: The strategy aims at correcting the preferential treatment given to bigger enterprises and it also aims at achieving the greatest possible cooperation and interaction between the various enterprises in the economy. It should be noted that while the Investment Code of Ethiopia grants incentives for the industrial sector, has completely ignored micro and small-scale enterprises. Although the MSE development strategy intends to reduce the cost of inputs and making their outputs competitive in price, it does not explicitly indicated the type of incentive structures. The government has established the Federal Micro and Small Enterprises Development Agency (FeMSEDA) and the regional Micro and Small Enterprises Development Agencies (ReMSEDAs) to support the sector. However, these government institutions are totally controlled and managed by civil servants with little input, if any, from the operators of MSE. Hence, policies and programs designed and implemented in the sector often fail as they lack ownership and consensus.
65
7.2.2. Other constraints It has been indicated that the number of people earning their livelihood from small-scale manufacturing industries is six times larger than those engaged in the formal sector activities.33 However, micro- and small-scale enterprises have been performing below capacity and their growth has been severely constrained by a number of factors. Lack of purchasing power of the local people is usually cited as the major bottleneck. The main customers of micro-enterprises in small towns are local farmers and urban dwellers. Demand for output and services is also very limited as the bulk of the population is dependent on agriculture that suffers from very low levels of productivity and high degree of uncertainty. As a result, too many operators chase for limited market, creating no incentive for business expansion. Any improvement in the agriculture sector would thus enhance local demand for goods and services. Urban development programs would also have a similar impact. It is partly due to inadequate entrepreneurial capacity that most enterprises produce the same kind of items and competing for the same small local market. They lack the entrepreneurship to identify niche markets and to bring some dynamic qualities such as resilience (to respond to changes in the environment), initiative taking, innovativeness and diversity Access to financial services is limited and partnership and networking are unknown. The major determinant of performance is working capital. Lack of an enabling legal and regulatory framework has given rise to high transaction costs and uncertainties in the market-place. One major outcome of this is the absence of partnership and networking among business operators. Skills in business training and technical knowledge are also lacking making the enterprises less beneficiaries from the innovative capacity of workers and employees. The overall business environment is so weak that human capital and other physical infrastructure do not seem to have significant impact. Lack of effective linkage with the rural and urban sectors is one of the major features of the enterprises. At present, the small towns are not a source of farm inputs or new technologies. Sustainable development requires traders, transporters and processors that closely link and network with producers of crop, livestock, forest products, etc. By way of summary, micro-enterprise development should be viewed as an essential ingredient in the promotion of broad based growth, in improving the well being of the poor and women by providing significant income and employment generating opportunities, and by encouraging indigenous investment. These activities have relatively strong backward linkages with the rest of the economy as they depend on local resources and less so on imported inputs. The fact that they have higher linkages with the rest of the economy (higher than that of large-scale manufacturing activities) implies that they can form the bedrock for sustainable growth in the domestic economy via multiplier effects [see section 6 for details of the linkage analysis]. 33 According to the available evidence, the number of people earning their livelihood from the informal sector activities and small-scale manufacturing industries is eight times larger than those engaged in the medium and large scale industrial establishments (Ministry of Trade and Industry 1997).
66
The contribution of MSE to the national economy has been less than satisfactory owing to policy, structural and institutional related bottlenecks. Although low productivity and return is the main feature of many micro and small-scale enterprises, grain mills, food and beverages, manufacture of metal products and furniture have relatively high average labor productivity. It has also been indicated that the wage structure in these activities is very low and workers cannot meet their basic requirements. The majority of workers (~96%) in grain mills and 89% in food and beverage earn less than birr 300 per month, indicating that the return to labor is extremely low in such activities. Low demand, lack of spare parts and shortage of raw materials have been reported as the major constraints facing small-scale manufacturing industries. The government of Ethiopia has formulated a strategy known as Micro and Small Enterprises Development Strategy with the objective of promoting these enterprises via creating an enabling legal, institutional and other supportive environment for the growth and development of MSEs. Although the policy has given due emphasis to entrepreneurship and appreciation of the sector’s contribution to the economy, constraints related to infrastructure, credit, working premises, extension service, consultancy, information provision, prototype development, preferential treatment, and many others, have yet to be addressed. 8. Employment through Labor-based Approaches in Infrastructure Construction and infrastructure account for a substantial proportion of public investment in an economy like that of Ethiopia. It has been demonstrated that in terms of the choice of technology, the adoption of labor-based approaches in infrastructure can result in much higher employment from a given amount of investment without the need to compromise on quality and efficiency. Infrastructure, e.g., rural roads, irrigation, and other construction works such as land development, protection of environment, etc. can contribute positively to development and poverty reduction by integrating isolated regions and potential markets and economic activities. This section will, therefore, examine the potential for employment creation through the adoption of labor-based approaches in infrastructure and action that is needed (in terms of policies at the national level as well interventions and programs at the project level) to transform the potential into reality. The analysis will include taking stock of construction activities (e.g., roads, irrigation, soil conservation, etc.), identifying the potential for adopting labor-based approaches in such activities, estimating the employment gains likely to be obtained from the adoption of this approach, and actions needed at the policy and project levels to implement the labor-based approach. 8.1. Public expenditure in infrastructure The attention given to the development of the infrastructure sector was minimal in the 1980s. Government expenditure in infrastructure accounted for about 1.5% of GDP only. Expenditure on road construction has increased both in absolute and relative term in the 1990s. In recognition of this, the present Government his significantly increased public expenditure on roads. It has also launched the Road Sector Development Program (RSDP) in 1997 to tackle the shortcomings in the road sector.
67
The first phase (1997-2002) of RSDP has been completed and the second (2002-2007) is now under implementation with significant support from the donor community. Expenditure on roads has increased from 6.8% of the total government expenditure during the period 1980-1991 to 39.6% in 1992-2000 (Table 8.1). The sector has received high priority, attracting the second largest public expenditure (next to education) in the 1990s.
Table 8.1: Comparative Government Expenditure in Roads and Other Sectors Average
Expenditure 1980-1991 1992-2001 1980-2001
As % of GDP Road 0.7 2.1 1.6
Health 0.2 0.4 0.4 Education 0.3 0.9 0.7
As % of Total Expenditure Road 2.5 7.5 5.9
Health 0.8 1.6 1.3 Education 1.0 3.2 2.5
Source: Own computation from MOFED data.
Figure 8.1: Comparison of Trends in Road Expenditure (as % of total
expenditure)
0.00%2.00%4.00%6.00%8.00%
10.00%12.00%14.00%
1980
1982
1984
1986
1988
1990
1992
1994
1996
1998
2000
Agriculture Road Education Health
Although there have been improvements in the size of recurrent expenditure injected into the road sector in the 1990s, the proportion recurrent expenditure has been very small compared to education and health sectors (figure 4.2). For instance, the average annual recurrent expenditure for the sector was birr 0.12 billion during the period spanning 1992-2000, representing only 1.9% of the total recurrent budget, significantly lower than that of defense (birr 2.2 billion or 25% of the total and education (birr 1.05 billion or 14.9% of the total recurrent expenditure).34 This shown that employment in the sector (paid from recurrent budget) has remained relatively low. More importantly, road maintenance and improvement activities, together with
34 Note that capital expenditure has been reduced significantly in all sectors in 1998-99 due to Ethio-Eritrea war in which a significant proportion of government expenditure was allocated to the war.
68
seasonal employment opportunities, are adversely affected by the low recurrent budget.
With regard to capital expenditure on roads, the amount allotted to the sector (similar to the recurrent budget) has been very small in the 1980s, only about 10% of the total capital expenditure. Capital investment on roads has significantly increased both in absolute and relative terms during the 1990s and exceeded other sectors such as health, education and agriculture (figure 8.3). It appears that the potential for labor-based infrastructure development has improved in recent years.
Figure 8.3: Trends in capital expenditure
0.00%5.00%
10.00%15.00%20.00%25.00%30.00%35.00%40.00%45.00%
1980
1982
1984
1986
1988
1990
1992
1994
1996
1998
2000
Agriculture Road Education Health
Ethiopia needs to invest a substantial amount of money to improve the road network, thereby generating a substantial opportunity for employment. Road transport is the dominant mode that carries about 95% of the country’s passenger and freight traffic and is the only form of access to most rural communities. However, road infrastructure in the country is underdeveloped even by African standards. Road network increased from 24,970 kms in 1997 to 33,856 kms in 2003, but road density
69
per thousand inhabitants increased marginally from 0.40 in 1997 to 0.49 in 2003, representing a 2.2% growth rate per annum. With a total land area of 1.1 million sq. km and road network of 33,856 kms, the road density is about 30.8% per 1000 sq. km in 2003. Although improvements have been observed in the sector, most rural areas are inaccessible by commercial transport. About 70% of the total land area of the country is not accessed by all-weather road system (Sisay 2004). The road network is characterized not only by low density but also by poor quality: only 28% of the total road network was found in good condition in 2001 (Table 8.2).
Table 8.2: Conditions of Road Network (in %) Good Fair Poor Road Type 1995 2001 1995 2001 1995 2001 Federal Roads 14 30 50 38 50 43 Regional Roads 25 25 15 30 60 45 Average 18 28 29 28 53 44 Source: MOFED 2002. 8.2. Public work programs and labor-based infrastructure Experiences elsewhere in the world show that public work programs are intended to reduce poverty through providing work opportunities to economically active people who are either unemployed or underemployed. It has been argued that the most productive way to assist the working poor appears to be through creating opportunities for them to earn a living. Public work programs can contribute to poverty alleviation in several ways, but the two most direct routes are through transferring income (in cash or kind), and by creating useful economic infrastructure. Indirect or ‘second round’ effects include income multipliers generated by spending of public works wages. Well-designed public work programs construct much-needed infrastructure and thus minimize the trade-off between public spending on income transfers versus public spending on development. However, the effectiveness of public work programs in alleviating poverty can be compromised in various ways, including: poor targeting, low wages, limited coverage, temporary employment creation, low-quality or poorly maintained infrastructure, and unintended negative impacts (e.g. undermining food security by competing with labor needs in agriculture, nurturing dependency or condoning child labor). These issues have compromised the credibility of claims made by proponents of public work programs which have enormous anti-poverty potential, not only as an ‘employment-based safety net’ but also as a contributor to sustainable poverty reduction. In Ethiopia, public works are implemented in the form of food-for-work (FFW), cash-for-work (CFW) programs or employment generation schemes (EGS). The idea behind FFW is to use food to pay for either public work programs or income generating activities, while CFW involves paying project participants in cash. There exist two distinct and important layers to the effectiveness of public works programs implemented either in the form FFW or EGS/EBSN. First, there is the short-run issue of whether public work programs effectively assist people who suffer transitory income shocks. It is important to establish whether, as a mechanism for emergency relief, such programs provide an effective safety net, mitigating the adverse welfare effects of real income shocks. Public work programs are effective if they can reach those who suffer serious shocks quickly, before serious
70
undernourishment and associated health problems set in. The second issue relates to the longer-run effect of whether public work programs improve livelihoods, either by accelerating recovery from shocks or by fostering income growth and wealth accumulation among the chronically destitute. The point is whether or not public work programs facilitate investment, innovation and access to new, attractive opportunities. In this regard, public works programs can be classified into two types: infrastructure programs aimed mainly at providing safety nets (in the form of employment-based safety nets) and more development-oriented infrastructure where labor-based approaches can be used.
8.2.1. Infrastructure programs as a safety nets
The food aid policy of the country clearly indicates that no able-bodied person should receive aid without working for it. Food aid is given free only to those who are too old or sick to work. In this category included are the employment generation schemes and employment-based safety nets, which are of temporary in nature, i.e. conducted under the emergency (relief) operation. It has been documented that close to 80% of the total food assistance resources are devoted to FFW programs for infrastructure development in Ethiopia and the remaining 20% is used as gratuitous relief (Quisumbing 2003). EGS/EBSN is one of the main means of distributing food aid for the needy population and act as safety nets that mitigate agricultural risk such as drought, flood, crop damage, etc and smooth out food consumption over time. EGS/EBSN cushions people who suffer transitory income shocks. These schemes are commonly practiced in the drought-prone areas of northern Ethiopia. Households participating in the EGS/EBSN programs are the most food insecure and poverty-stricken segments of the population in the country. Soil conservation, rural roads, afforestation, etc. are the major tasks performed by participants during the short period of scheme (i.e., during a disaster such as drought, flood, and war). Afforestation, road construction, soil and water conservation activities are among the most important public work projects in Ethiopia, and are supported by many donors such as WFP’s Project 2488, EC/MoA, Oxfam/UK, etc. In fact, food-for-work program of WFP is said to be the largest in Africa. The long-term objective of these projects is to raise agricultural productivity via land rehabilitation and terracing, and micro-dams for irrigation, while providing relief assistance in the short-term. According to the Disaster Prevention and Preparedness Commission (DPPC), about 691 kms of roads were constructed and 1,126 kms maintained via FFW programs until June 2000 (cumulative). Similarly, about 61,876.01 kms of soil and water conservation activities have been undertaken over the same period (Table 8.3). In 1999/00, DPPC estimates that FFW program benefited some 246,283 and 218,673 male and female participants, respectively35. In terms of regional distribution, close to 79% of the beneficiaries/participants were from Tigray region, followed by Amhara region (~11%) and Southern Nations, Nationalities and Peoples (SNNP) region (~7%) during the same period (Table 8.4). The first two regions are the most food insecure and highly vulnerable regions.
35 These figures are believed to be on the low side. The total number of beneficiaries in any one-year is believed to be much higher.
71
Table 8.3: Rural Infrastructure Development through FFW Program Activities 1. Soil and Water Conservation Unit Cumulative till June, 2000 Farm Land Terrace Fanyajuu construction Km 429.00 Stone bund construction Km 26,386.00 Stone faced soil bund construction Km 4,205.20 Soil bund construction Km 10,936.00 Bench terrace construction Km 164.46 Trench construction Km 10,430.00 Checkdam construction Km 1,644.50 Hill side terrace construction Km 6,823.60 Retaining wall M3 42,266.04 Cut off drain construction Km 694.00 Artificial water way construction Km 163.25 2. Afforestation Activities Nursery activity No 231,000,000.00 Site guard Ha 98,713.00 Pitting and re-pitting No 16,086,676.00 Micro-basin construction No 4,340,964.00 Weeding and Cultivation No 8,709.00 Seed collection Kg 14,553.00 3. Infrastructure Road construction Km 691.00 Road maintenance Km 1,126.00 4. Water Development Spring development No 337.00 Pond construction No 59.00 Irrigation canal clearing Km 1.00 Stream diversion Km 91.50 5. Supplementary Grass seed multiplication Ha 46.00 Compost preparation M3 1,815.00 Stone collection M3 5,568.00 Farmers training No 375.00 6. Maintenance Check dam maintenance Km 79.60 Bund maintenance Km 919.00 Pond maintenance No 49.00 Source: DPPC
72
Table 8.4: Regional Distribution of Beneficiaries in the FFW Program, 1999/00
Region Male Female Total of Female
Beneficiaries Regional Share (%)
Amhara 33,278 17,506 50,783 34 10.9 Tigray 175,076 186,642 361,719 52 77.8 Oromiya 9,655 4,546 14,201 32 3.1 SNNRP 23,177 7,964 31,141 26 6.7 Dire Dawa 5,098 2,014 7,112 28 1.5 Total 246,283 218,673 464,956 47 100.0 Source: DPPC. EGS/EBSN program provides insurance against transitory income shocks to those who are willing to work. But such public work programs are short-lived and do not provide with any permanent source of income for the poor. More importantly, the infrastructural assets created under such programs are not well designed, and are of poor quality. Low rate of payment and delays in payment have contributed to dissatisfaction and low quality of work. Until 2004, the accepted practice has been to set relief distributions at 1300 kcals (12.5 kg), instead of the 2100 kcals recommended by the international community. Activities carried out under EGS/EBSN are not well planned and articulated with the local development objective as they are responses to emergency crisis. They are rarely integrated and incorporated into line departments’ work plans and are not specifically budgeted. For instance, there is no link between the Road Sector Development Plan and public work programs. Food-for-work projects have created extensive soil and water conservation structures, roads, etc. all over the country but maintenance after termination of the projects has proved to be problematic. Often a dilemma arises as to who takes the responsibility for maintenance, especially when there is a wide constituency of beneficiaries (Humphrey, 2000). There has been the possibility of people becoming trapped in the safety net as well. FFW activities often coincide with own farm activities due to poor planning. Prolonged relief activities have also undermined initiative for alternative self-reliant solutions. The DPPC has been making an appeal for emergency food aid every year in the last 27 or so years and the number of victims has been continuously rising, not declining. It is estimated that estimated that on average, US$265 million is ploughed into food aid by donors, a sum equal to 13% of the total public spending of the country36. Traditional safety-net practices have been ‘a missed opportunity’ because they failed to build up and maintain real assets of the people. Recognizing the failure of food-for-work schemes for the past 30 years, the Ethiopian Government has recently initiated a new approach known as the Productive Safety Net Program (PSNP). Five million impoverished farmers are to be targeted under government-led PSNP. The main objectives are to provide transfers to food insecure population in away that prevents asset depletion at the household level and creates assets at the community level. The selection of the public works projects will be driven by the local planning process. Since the major causes of food insecurity in the country are land degradation, recurrent drought, low agricultural productivity and 36 IRINnews.org, UN Office for the Coordination of Humanitarian Affairs, Ethiopia: Focus on new safety-nets scheme for poor farmers, 18 March 2005, http;//www.irinnew.org/report.asp
73
population pressure, the public works activities are intended to address these problems.37 Effective public work programs are believed to help individuals, households and communities in times of stress and also facilitate the desired transition from relief to development.
8.2.2. Development-oriented infrastructure programs Roads are constructed and rehabilitated at high cost in Ethiopia. This is due to the use of equipment-based method in the road sector. Attempts to expand the use of labor-based methods in the infrastructure and construction sectors have been minimal despite the various justifications, including lower unit cost, increased employment generation, higher contribution to GDP, higher multiplier effects, higher levels of household income and consumption, reduced foreign exchange requirements and hence reduced import dependency. Domestic road construction and maintenance capacity is identified as an important ingredient to ensure sustainability of the road network in the RSDP. Measures that facilitate local contractors’ participation have been introduced (e.g. contracting-out works) but it has become very difficult for the private sector to participate effectively due to limited capacity of the Ethiopian Road Authority, ERA, (at central level) and regional road authorities for the smooth implementation the program and the weakness of the domestic construction industry in general (FDRE, 2002). Hence, the road construction under RSDP is largely handled by foreign companies (mainly European, Chinese, Japanese and Korean) using heavy construction equipment. More importantly, employment generation has not been a core objective for the central and regional authorities even when work is contracted to local government or private companies. Klingele and Admassu (1995) observed that asphalt road construction activities from Shashemen to Arba Minch, implemented by the Ethiopian Roads Authority (government agency), and the Sodo-Bale-Chida road, constructed by Salini Construction Company (local private company) in Wolayita and North Omo in the SNNP region did not use labor-intensive approaches, rather their projects were highly capital-intensive, using heavy machinery and little but very specialized labor. The short time given for implementation of the construction projects has been given as the main reason for their choice of capita-intensive work. It is clear that a labor-intensive approach, in a country where there is massive underemployment and unemployment, would have created job opportunities for many thousands of people. The ERA is aware of the advantages of labor-intensive approaches at the local, regional and national levels. It has started, on a trial basis, recruiting laborers to do road maintenance since 1998/99. Recruitment close to place of work reduces costs and logistical problems. Two km segments are allocated to each “length person” and the approach is being launched to cover some 5,000 kms of regional and federal roads through the “length person” maintenance system for the coming five years (MOFED 2003). However, significant progress is constrained by bureaucratic payment
37 The Federal Democratic Republic of Ethiopia, Productive Safety Net Programme: Environmental and Social Management Framework, December 3, 2004, Draft.
74
procedures (often delayed payments) and lack of appropriate contracting arrangements. A national strategy as well as extensive training facilities would be required to introduce labor-intensive approaches to ERA’s overall extensive road construction program. International funding agencies should also support the idea of labor-intensive approaches in order to alleviate chronic poverty and food insecurity in the country. The use of labor-based work methods for constructing and maintaining rural roads can improve access while at the same time increase employment opportunities. In general, the contribution of public work programs and construction activities for employment creation and poverty reduction has been minimal in the Ethiopian context. Employment-based safety-net programs could have been particularly effective in poor and vulnerable areas as chronic poverty and agricultural seasonality make the availability of such schemes an attractive fallback option for the poor. Similarly, although there is room for employment creation through the adoption of labor-based approaches in infrastructure, the actual employment gains via such approaches have been limited. Public work programs can serve as a tool for reducing poverty via creation of durable infrastructure. The recent shift towards productive safety-net programs is believed to have a positive impact provided the management is decentralized and capacity is built at all levels to effectively link relief food assistance to development programs. Evidences from Asia indicate that if well designed and focused, labor-based infrastructure development programs can be used as effective tools for reducing poverty38. Thus, infrastructural development programs of the ERA and other agencies should form an integral part of the overall development program of employment generation or poverty alleviation.
9. Conclusions and Policy Implications The main objective of this study was to examine the role of labor market structure in reducing poverty in the Ethiopian context. In particular, the study assessed, among others, sources of output growth, employment and poverty mobility, attempted to quantify the incidence of poverty by occupation, examined the determinants of off-farm employment and productivity, and considered the potential for employment creation through the adoption of labor-based approaches in infrastructure. One major source of rampant poverty in the country is extremely low labor productivity and low returns to labor, both in the form of formal and informal wage employment in rural and urban areas. An identification of the economic characteristics of poverty groups reveals that relatively high concentration of the poor has been observed in agriculture (small and marginal farmers), informal sector and unpaid family activities which are deemed to be low productivity and low-return sectors.
38 See for instance, ILO ASIST – Asia Pacific, Jobs or machines: Comparative analysis of rural road work in Cambodia, Bangkok, 2003.
75
The results of the labor market analysis also point to the existence of multiple labor-related risks faced by specific groups. A key finding of this analysis is the extreme vulnerability of low-educated people and the farming population in rural and urban areas, who cumulated a high risk of being unemployed, of remaining longer in unemployment, of being discouraged, and if employed, of being low-paid or working in precarious jobs. The multiple aspects of vulnerability in the Ethiopian labor market, in particular the large overlap between work and poverty, have important implications for the design of a comprehensive national poverty reduction strategy. Accordingly, a thorough understanding of who are the groups at risks in the labor market is also essential as to better meet the needs of specific groups and improve the effectiveness of public policies in terms of reducing poverty. It should be noted, however, that a mere shift in sectoral emphasis in terms of resource allocation to rural development will not be sufficient if the benefits of policies aimed at a specific sector such as agriculture are slanted in favor of upper class groups. Policies will have to be designed that specifically favor the target groups in question, i.e. the poor. One explanation for the poor performance of the agricultural sector is lack of any real technological improvement as shown by the stagnation in labor productivity. This points to what must be a major objective of policy in Ethiopia: increased labor productivity through greater technological change, improvement in human capital, access to critical inputs and incentives to producers. Given the country’s extreme climatic variability, stabilizing agricultural production is as important as raising yields. In drought-prone areas, the policy focus should shift away from rain-fed cereal production towards small- and large-scale irrigation technologies and diversification of economic activities. Irrigation potentials must be tapped for farmers to make effective use of new technologies and engage in high value crops. Irrigation would enable farmers to engage in an all year round production system and also reduce under-employment in rural areas. Improved livestock production, tree crops (adapted to dry areas) and non-farm activities should be promoted in areas where the return to irrigation is not very high. Appropriate supportive interventions are required in order to improve the terms-of-trade for agriculture. In the short-term, price support or input subsidy is an important instrument for boosting agricultural production and reducing food insecurity. Input subsidies can be used as a method of maintaining adequate levels of return in farm production in the face of low output prices, which are to the advantage of the urban poor, and net-buyers in rural areas. Output price support is also a common policy instrument to ensure adequate incentive for farmers. Poor farmers would also benefit from employment opportunities generated if surplus producing areas are thriving. In the long run, investment in institutional capacity, irrigation and land improvements, infrastructure, technology development and dissemination will be needed to ensure the profitability of agricultural production on a sustainable basis. The bargaining power of farmers in Ethiopia is extremely weak since they have no national unions or representative associations. Public institutions and democratization cannot be effective without community organizations to ensure people’s participation for provision of services and resources for human development and efficient resource allocation. Thus, support is needed to establish and facilitate access to agrarian
76
institutions such as insurance, producer organizations, and technical assistance to improve their bargaining capacity in the political and economic dialogue. To reverse the severe degradation and asset depletion in rural areas, the development of protective institutions is extremely important. For instance, failure to invest in soil conservation, land improvement and afforestation is attributed to institutional deficiencies. Lack of tenure security, together with the frequent redistribution of land by government authorities, has exacerbated the problem of diminishing farm size, continuous cultivation and soil degradation. This underscores the importance of a well-defined full ownership right in order to instill sense of security among farmers and release local potential to take care of the land. A properly defined tenure system would also facilitate rural labor mobility and transformation of the rural economy. By making access to land contingent upon residence of the individual in the area where the land is located, the current land policy has effectively hindered oscillatory migration and two-way free flow of people and capital.39 A comprehensive framework which focuses on poverty reduction through use of irrigation and smallholder markets (PRISM) is required to get agriculture moving in Ethiopia. The PRISM framework places a high priority on identifying strategies that enable smallholders to access, store and control water for crop irrigation via low cost, household level, micro-irrigation systems which maximize water use efficiency, minimize labor burden and bring high economic returns to poor small farm households. The intervention would ensure sustainable natural resource management, reduce poverty and enhance gender equity if based on access and control of water for crop irrigation. It has become widely accepted that agriculture alone cannot reduce poverty and attain food security unless it is supported by other sectors, one of which is off-farm activities, which tend to augment agricultural income. There are rural non-farm activities that could potentially be used for increasing rural incomes and can help move households out of poverty in the country. But the effort aimed at developing the sub-sector is very minimal and its contribution to employment and livelihood diversification is limited. With little or no presence of input dealers (fertilizer, improved seeds, chemicals), equipment suppliers and renters, service providers (e.g., veterinary, extension), processors, packers and cold transporters in rural areas, it has become impossible to create a productive non-farm employment with strong backward and forward linkages between agriculture and the non-agricultural sector. A concerted effort aimed at rectifying both demand and supply side constraints simultaneously is required to create a viable off-farm employment opportunity to the landless people and to serve as supplementary sources of income for the near landless and the poor. Interventions to improve the sector may include, among others: • Establishing central and regional agencies that specifically cater to the needs of
non-farm activities and ensuring that actors within the sector are properly represented in the governing bodies of these institutions, i.e. involve
39 The Ethiopian Economic Association/ Ethiopian Economic Policy Research Institute, the Role of Ethiopian Agriculture: Study of Positive Roles and Externalities, Roles of Agriculture Project of FAO, Addis Ababa, October 2003.
77
representatives of the different groups, including women groups, in policy formulation and implementation.
• Assisting cooperatives, trade associations, labor unions and interest/solidarity groups to protect members’ interest, improve access to raw materials and markets, etc.;
• Strengthening and streamlining training activities, i.e. coordinating the various training activities given by different organizations (public, NGOs, etc.). Resources are also required to design appropriate material and demand-driven training programs for the sector and to provide business development services.
• Building the capacity for technology development and dissemination of proven technologies;
• Establishing labor market information system such as wage rates, demand for workers in a specific area, etc. This would also encourage employers such as commercial farmers and surplus producers in high potential areas to expand their operation and create more job opportunities; and
• Supporting financial institutions such as micro finance institutions and rural banks to ease the credit constraints of the sector.
The focus of the revival strategy in the manufacturing industry should be to ensure that growth is sufficiently employment friendly and pro-poor. Support should be provided to those manufacturing activities that are relatively employment-intensive and have strong linkages with the rest of the economy such as textiles, food and beverages, tanning and dressing of leather, other non-metallic mineral products, paper products and printing, and wearing apparel that serve as a source of job creation. Currently, these activities operate below capacity (only half of their capacity) owing to a number of supply and demand side problems. Special intervention such as improved access to credit, technological development, protection from unfair competition (from import), market information, other infrastructure, etc. is required in expanding these sectors. Supportive policies and programs to improve competitiveness and absorptive capacity are required for those manufacturing sectors in which labor-intensity has remained unchanged (e.g. basic iron and steel, machinery and equipment, trailers, furniture manufacturing n.e.c). A well-coordinated industrial strategy and an enabling policy environment are also required to create strong linkages between the various sectors of the economy. Government support interventions should also include the establishment of industrial zones and other common facility centers and introduce new technologies and ideas. It should be reiterated that the specific nature of the government support should emerge from consultations with the representatives of the stakeholders in the sector. Any policy that lacks the full support of the different actors is bound to have minimal impact. With regard to Small and Micro Enterprises, vigorous government support is needed to reverse the stagnation and instill dynamic growth. A comprehensive package of support is necessary to address both the supply and demand side problems of the sector. Among critical components of the package are the provision of credit, extension services and information provision, business development services, training as well as research and prototype development. Support is also required in the area of Information and Communication Technologies to enable enterprises to widen their market opportunities. Specifically, interventions should include, among others:
78
• Strengthening Micro and Small Enterprise Development Agencies by involving representatives of the different operators within the sub-sector in the governing board of the agencies in order to provide intuitional and policy support, information and consultancy advices, technical and marketing services, etc. based on felt needs,
• Supporting associations and networks, especially those catering for women entrepreneurs, and promoting the use of ICT wherever possible;
• Encouraging entrepreneurship to exploit niche market and product diversification: One of the ways to overcome the problem of producing the same kind of items and competing for local market is to develop and promote entrepreneurship;
• Enhancing domestic/local demand through improving marketing facilities (e.g. display centers) and agricultural productivity in the hinterland and increase income of town dwellers in order to overcome the weak market demand currently constraining small enterprises. Any improvement in the production, consumption and distribution linkages between small businesses in urban areas and agriculture would help increase income and productivity of both;
• Improving the business environment: and access to infrastructure such as working premises, telephone, water, and electricity, which are commonly cited as the immediate obstacles for small and micro-enterprise businesses. Effective ways must be sought to ensure that small enterprises benefit from the services of formal commercial banks, specialized banks and micro-finance institutions;
It is important to aggressively promote vocational and technical training not only for the small and medium enterprises but also for large- and medium-scale manufacturing activities. A well-trained labor force is necessary to attract FDI. The quality of education at all levels should be improved in order to raise the return to education in the country. It has been shown that the contribution of public work programs and labor-based infrastructural activities to employment and poverty alleviation is minimal. Given the present state of poor infrastructure in the country and widespread food security problems, public work programs in the form of food-for-work or cash-for-work are likely to continue. This would have a considerable impact on improving infrastructure as well as poverty alleviation if properly designed. If properly designed and implemented and with full participation of the beneficiaries, the productive safety-net program of the Government has the potential to effectively link relief with development activities and ultimately enable participants to exit the cycle of dependency on food aid. It is also very important to note that a significant number of households, who are unable to participate in food- or cash-for work (because of old age, sickness, disability, etc.) would require an institutionalized safety-net support programs. The ongoing road construction activities could generate sizeable employment opportunities if serious efforts are made by the ERA to change the existing trend from capital-intensive to labor-based construction approach. With a national strategy and extensive training, labor-based road work has several comparative advantages, including lower unit cost, increased employment generation, higher contribution to GDP, higher multiplier effects, higher levels of household income and consumption, reduced foreign exchange requirements and hence reduced import dependency.
79
Similar large-scale employment and income gains could be achieved from a planned execution of construction projects in irrigation and housing in Ethiopia. A strategy of employment-intensive and pro-poor growth in Ethiopia needs cannot be effective without serious considerations of the terrible HIV/AIDS crisis. With the world’s third largest population of HIV/AIDS patients, the impact of the disease is likely to be more catastrophic than even the worst drought the country has ever faced. High level of poverty, widespread hopelessness among the youth (due to lack of employment) and demobilisation of soldiers (which took place twice between 1991 and 2001) has undermined the effort to control the spread of the disease. The country needs to mobilize all available resources to control and minimize the impact of the disease. Families and orphans affected by HIV/AIDS should be supported through community-based programs with long-term commitments to ensure that orphans are getting education and their food requirements are met. The government should place HIV/AIDS at the center of its activities, along with food security and poverty alleviation programs. Finally, what clearly stands out from this study is that growth as such does not have much impact on poverty reduction in the Ethiopian context. The pattern and employment content of growth, which substantially differs across sectors, has significant implication for poverty reduction since all income classes do not share the fruits of growth equally. The absence of the so-called the “trickle down” effect of growth calls for an identification growth patterns that are more efficient in terms of reducing poverty. Ethiopia requires a more pro-poor growth policies aimed at creating productive employment and at the same addressing the main constraints of the different sectors where the poor are concentrated. Equally important are the appropriate targeting of public expenditure, increased provision of primary education and health so the poor can ascend easily from low-productivity and low-return activities to higher yielding sectors. But the most important starting point for sustainable pro-poor growth in Ethiopia is to put in place an institutional system or good governance that allows full participation of the public in policy formulation, implementation and monitoring. Greater devolution of power and transparency in governance are important from the point of view of mobilizing all available resources and unlocking the potential of Ethiopian farmers and entrepreneurs.
80
81
References
Abay, A. and Assefa, A. (1996): ‘The Impact of Education on Allocative and Technical Efficiency of Farmers: The Case of Ethiopian Smallholder’. Ethiopian Journal of Economics, vol. V. No. 1, April 1996. pp 1- 27.
Adane, T. and Dawit, M. (2001): ‘Quality indicators in initial Primary Teacher Education: Global trends versus the case in Ethiopia.’ In proceedings of the National Conference Held in Adama Ras Hotel, Amare Asgedom, Derebssa Dufera, Nuru Mohammed and Taye Ragassa (eds.), Institute of Educational Research, Addis Ababa University.
Ahmad, A. and Isvilanoda, S. (2003): ‘Rural Poverty and Agricultural Diversification in Thailand’. Paper presented at the Second Annual Swedish School of Advanced Asia and Pacific Studies (SSAAP), Lund, Sweden.
Alemayheu, S. and Tadele, F. (2004): ‘The Structure of the Ethiopian Economy: A SAM-based characterization’. A research report prepared for the World Bank (unpublished), Addis Ababa, Ethiopia.
Arimah, Ben C. (2001): ‘Nature and Determinants of the Linkages between Informal and Formal Sector Enterprises in Nigeria’. African Development Review, vol. 13, no. 1.
Ayele, Kuris (2003): The Ethiopian Economy: Principles and Practice. Berhanena Selam Printing Enterprise, Addis Ababa.
Bane, M. J. and Ellwood, D. T. (1986): ‘Slipping into and out of Poverty: The Dynamics of Spells’, The Journal of Human Resources, no. 1, vol. XXI, p. 2-23.
Barnett, T. and Whiteside, A. (2002): AIDS in the Twenty-First Century: Disease and Globalization. Palgrave Macmillan, Basingstoke, UK.
Barrett, C., Reardon, T. and Webb, P. (2001): ‘Non-farm Income Diversification and Household Livelihood Strategies in Rural Africa: Concepts, Dynamics, and Policy Implications’. Mimeo.
Barrett, C. B. (1998): ‘Food Aid: Is It Development Assistance, Trade Promotion, Both or Neither?’ American Journal of Agricultural Economics 80 (August 1998): 566-571.
Befekadu, D. and Berhanu, N. (2000): Annual Report on the Ethiopian Economy, 1999/2000. Addis Ababa, Ethiopian Economic Association.
Berhanu, G. and Simeon, E. (2003): ‘Land Tenure and Land Management in the Highlands of Northern Ethiopia’. Paper presented at The Second EAF International Symposium on Contemporary Development Issues in Ethiopia, July 11-13, 2003, Addis Ababa, Ethiopia.
Bernabe, S. and Kolev, A. (2003): ‘Identifying Vulnerable Groups in the Kyrgyz Labor Market: Some Implications for the National Poverty Reduction Strategy’. Center for Analysis of Social Exclusion, London School of Economics, CASE paper 71.
Bezuneh, M., Deaton, B. and Norton G. W. (2003): ‘Food Aid impacts in rural Kenya’. American Journal of Agricultural Economics 70: 181-91.
Bezuneh, M., Deaton, B. and Zuhair, S. (2003): ‘Food Aid Disincentives: The Tunisian Experience’. Review of Development Economics, 7(4): 609-621.
BianchiLekha, S. L. and J. R. Kahn (1999): ‘The gender gap in the economic well-being of non-residential fathers and custodial mothers’. Demography, vol. 36, no. 2, pp.195-203.
Bigsten, A., Bereket, K., Abebe, S., and Mekonnen, T. (1999): ‘Poverty and welfare in Ethiopia: Profile and Determinants’. Ethiopian Journal of Economics, vol. 8, no. 1.
Bollinger, L. and Seyoum, E. (1999): The Economic impact of AIDS in Ethiopia. Washington, DC: Futures Group International.
82
Burguess, Propper (1996): ‘Poverty Dynamics among Young Americans’. Discussion Paper no. 1362, Centre for Economic Policy Research. London: CEPR.
Croppenstedt, A., Mulat and Meshi M. (1999): ‘An empirical analysis of demand for fertilizer in Ethiopia’. Ethiopian Journal of Agricultural Economics, vol. 3, no.1, January 1999.
CSA (2000): ‘Analytical Report on the 1999 National Labor Force Survey’. Statistical Bulletin 234, Addis Ababa, Ethiopia.
CSA (2003): ‘Ethiopian Agricultural Sample Enumeration’. Statistical Report on Farm management Practices, Livestock and Farm Implements, Part II, Central Agricultural Census Commission, Addis Ababa, Ethiopia.
Devereux, S. (2000): ‘Food insecurity in Ethiopia: A discussion paper for DFID’. IDS Sussex, UK (unpublished).
Devereux, S. (2002): ‘The Contribution of Public Works and other Labor–Based Infrastructure Programs to Poverty Alleviation’. Discussion Paper 5, Issues in Employment and Poverty, International Labor Office, Geneva.
Devis, B. and Stampini, M. (2002): ‘Pathways towards prosperity in rural Nicaragua; or why households drop in and out of poverty, and some policy suggestions on how to keep them out’. FAO and Scuola Sant’Anna, Pisa.
DSA (2001): ‘Fertilizer Marketing and Credit Study in Ethiopia’. Final Report (Volume I), National Fertilizer Industry Agency, Addis Ababa, December.
Duncan, G. J., Coe, R. D., Corcoran, M. E., Hill, M. S., Hoffman, S. D., Morgan, J. N. (1984): Years of Poverty, Years of Plenty. The Changing Economic Fortunes of American Families. University of Michigan: Institute for Social Research, Ann Arbor, pp. 184.
Duncan, G. J., Gustafson, B., Hauser, R., Schmauss, G., Messinger, H., Muffels, R., Nolan, B., Ray, J. C. (1993): ‘Poverty Dynamics in Eight Countries’. Journal of Population Economics, vol. 6, no. 3.
EPRDF (1995): The Constitution of the Federal Democratic Republic of Ethiopia. The Federal Negarit Gazeta, 1st year no.1, Addis Ababa.
ERA (2001): ‘Road Sector Development Program (RSDP)’. Phase II, draft report, Addis Ababa, Ethiopia.
ERA (2004): ‘A Sector Emerging from crisis: A special report on implementation of EC financed projects.’ Ethiopian Roads Authority, Addis Ababa, Ethiopia.
FAO (2003): ‘Policy Module, Ethiopia, Roles of Agriculture Project International Conference’. 20-22 October, 2003, Rome, Italy.
FASAZ (Farming System Association of Zambia) (2003): ‘Inter-linkages between HIV/AIDS, Agricultural Production, and Food Security’. Integrated Support to Sustainable Development and Food Security Program, Food and Agriculture Organization of the United Nations (FAO), Rome.
FDRE (2003): ‘The New Coalition for Food Security and in Ethiopia’. Food Security Program, Volume I, Addis Ababa.
FDRE (2002): ‘Ethiopia: Sustainable Development and Poverty Reduction Program.’ Ministry of Finance and Economic Development, Addis Ababa, Ethiopia.
Finnie, R (2000): ‘Low Income (Poverty) Dynamics in Canada: Entry, Exit, Spell Durations, and Total Time.’ Applied Research Branch Strategic Policy Human Resources Development Canada Working Paper, no. W-00-7E, 112 p.
Fritzell, Johan, Henz, Ursula (2002): Cradle to Grave. In Jonsson, J.O. & Mills, C (eds), Durham: Sociology Press, pp. 284-210.
83
Gauci, A. (2003): ‘Land and labor productivity in rural areas: A comment.’ Paper presented at the First International Conference on the Ethiopian Economy, United Nations Conference Centre (UNCC), January 3-5, Addis Ababa, Ethiopia
Getahun, Tagfesse (2004): ‘Agricultural growth and poverty reduction in Ethiopia.’ Paper presented at the 2nd International Conference on the Ethiopian Economy, United Nations Conference Centre (UNCC), June 3-5, 2004, Addis Ababa, Ethiopia.
Huff, S. A. (1994): ‘Persistence of Poverty and Welfare: the Dynamics of Poverty Spells: Updating Bane and Ellwood.’ American Economic Review, Papers and Proceedings, vol. 84, pp. 34-37.
Huff, S. A. (1995): ‘Climbing out of Poverty, Falling back in: Measuring the Persistence of Poverty over Multiple Spells’. NBER Working Paper n°5390, Cambridge, MA: National Bureau of Economic Research.
ILO/JASPA (1991): African employment report. Addis Ababa, Ethiopia. Jacques, Charmes (2000): ‘Informal Sector, Poverty and Gender: A review of empirical
evidence’. WDR, 2000, Washington, D.C. Jarvis S., Jenkins S. P. (1999): ‘Marital splits and income changes: Evidence from the
British Household Panel Survey’. Population Studies, vol. 53, pp. 237-254. Jenkins S. P. (1998): ‘Modelling Household Income Dynamics’. ISER Working Paper,
University of Essex, 38 p. Klingele, R. and Admassu H/Yesus (1995): ‘Field Trip Report, Wolayita, North Omo.’
United Nations Emergency Unit for Ethiopia (UN-EUE), Addis Ababa. Lay, J. and Wiebelt, M. (2001): ‘Towards a Dual Education System-A Labor Market
Perspective on Poverty reduction in Bolivia.’ Kiel Institute of World Economics, Kiel Working Paper No. 1073, Germany.
Lewis, W. Arthur (1954): Economic Development with unlimited Supplies of Labor. Manchester School 22.
Maitre, B., Whelan, C. T, Nolan, B. (2003): ‘Female Partner’s Income Contribution to the Household Income in the European Union.’ EPAG Working Papers 2003-43, Colchester: University of Essex.
Marenya, P., Oluoch-Kosura, W., Place, F. and Barrett, C. (2003): ‘Education, Non-farm Income, and Farm Investment in Land-scare Western Kenya’. BASIS Brief 14, Department of Agricultural Economics, University of Wisconsin, Madison.
McManus, P. A. and DiPrete, T. A. (1998): ‘Family Change, Employment Transitions, and the Welfare State: A Comparison of Household Income Dynamics in the U.S. and Germany’. Mimeo, Duke University.
McManus, P. A. and DiPrete T. A. (2001): ‘Losers and Winners: The Financial Consequences of Separation and Divorce for Men’. Mimeo, Duke University.
Ministry of Trade and Industry (1997): Micro and Small Enterprises Development Strategy. Addis Ababa, Ethiopia.
MOE (2002): The Ethiopian Economy. Student text book for the preparatory Class, Addis Ababa, Ethiopia.
MOFED (2003): ‘Ethiopia: Sustainable Development and Poverty Reduction Program (SDPRP)’. Annual Progress Report (2002/03), (Working draft), Addis Ababa, Ethiopia.
Muffels, R., Fouarge, D. and Dekker, R. (1999): ‘Longitudinal Poverty and Income Inequality: A Comparative Panel Study for the Netherlands, Germany and the UK’. EPAG Working Paper, 1, Colchester: University of Essex.
Mulat, Demeke (1995): ‘Rural Non-Farm Activities in Impoverished Agricultural Communities: The Case of North Shoa, Ethiopia, Addis Ababa’. Organization for
84
Social Science Research in Eastern and Southern Africa (OSSREA) / African Studies Centre, ASC Working Paper no. 25, 1997.
Mulat, Demeke (2003): The impact of removing input subsidy on small farmers in Ethiopia: The case of fertilizer. (unpublished).
Mulat, D. and Tsegabrehan, G. (2003): Education and the Labor market. (unpublished), Addis Ababa, Ethiopia.
Mulat, Demeke, and Teferi, R. (1995): ‘Non-farm activities in Ethiopia: The case of North Shewa.’ Paper presented at the Fifth Annual Conference on the Ethiopian Economy, Addis Ababa, November - December 1991.
Mulat, D., Fantu, G. and Tadele, F. (2003): ‘Growth, Employment, Poverty and Policies in Ethiopia: An Empirical Investigation.’ In Issues in Employment and Poverty, Discussion paper 12, Recovery and Reconstruction Department, ILO, Geneva.
Mulat, D., Fantu G. and Tadele F. (2004): ‘Agricultural Development in Ethiopia: Are there alternatives to Food aid?’ A research report prepared for UNFAO (unpublished).
Mushati, P., Gregson, S., Mlilo, M., Lewis, J. and Zvidzai, C. (2003): ‘Adult Mortality and the Economic Sustainability of Households in Towns, Estates, and Villages in AIDS-affected Eastern Zimbabwe.’ Paper presented at the Scientific Meeting on Empirical Evidence for the Demographic and Socio-Economic Impact of AIDS, Durban, South Africa, 26-28 March 2003. University of Durban.
Quisumbing, A. (2003): ‘Food Aid and Child Nutrition in Rural Ethiopia.’ Discussion Paper No. 158, Food Consumption and Nutrition Division, IFPRI, Washington, D.C.
Reardon, T., Crawford, E. and Kelly, V. (1995): ‘Promoting Farm Investment for Sustainable Intensification of Agriculture’. International Development Paper 18, Department of Agricultural Economics, Michigan State University, East Lansing.
Saduolet, E. and A. de Janvry (1995): Quantitative Development Policy Analysis. The Johns Hopkins University Press, Baltimore and London.
Smith, K., Barrett, C. B., and Box, P. W. (2001): ‘Not necessarily in the same boat: Heterogeneous risk assessment among East African Pastoralists’. Journal of Development Studies 37 (5), 1-30.
Srinivasan, T. N. (1989): ‘Food Aid: A cause of Development Failure or an Instrument for Success?’ The World Bank Economic Review 3 (1): 39-65.
Tapio-Biström, M. (2001): ‘Food Aid and the Disincentive Effect in Tanzania’. University of Helsinki, Department of Economics and Management, Publications No. 31, Agricultural Policy, Helsinki.
Tapouzis, D. (1998): ‘The Implications of HIV/AIDS for Rural Development Policy and Programming: Focus on sub-Saharan Africa.’ Paper prepared for HIV and Development Program, UNDP, and the Sustainable Development Department, Rural Development Division, FAO.
Tassew, Woldehanna (2003): ‘The Role of Schooling in the Choice of Activities and Alleviation of Poverty in Rural Ethiopia’. Department of Economics, A.A.U.
Tekie, Alemu (1999): ‘Insecure land tenure regimes and soil conservation: Evidence from Ethiopia’. Ph.D. dissertation, Department of Economics, Gothenborg University, Sweden.
Tesfaye, Z. and Shiferaw, Tesfaye (2001): ‘Determinants of Adoption of Maize Technologies and Inorganic Fertilizer in Southern Ethiopia’. EARO, Research Report No. 39.
Thomas, V., Wang, Y., and Fan, X. (2000): Measuring Education Inequality: Gini Coefficient of Education. Memio, World Bank Institute, Washington, D.C.
Verwimp, P. (1996): ‘Estimating Returns to Education in Off-farm Activities in Rural Ethiopia’. Ethiopian Journal of Economics no. 2, October 1996. Pages 27 – 56.
85
United Nations Sudano-Sahelian Office (UNSO) (1992): Alternative and sustainable systems of production and livelihood in marginal lands. New York: UNSO.
Uunk, W (2003): ‘Welfare State Regimes and the Economic Consequences of Separation – Evidence from the European Household Panel Survey, 1994-1998’. EPAG Working Papers 2003-40, Colchester: University of Essex.
Woldehanna, T. and Oskam, A. (2001): ‘Income Diversification and Entry Barriers: Evidence from the Tigray Region of Northern Ethiopia’. Food Policy 26, 4, 351-365.
Yamano, T. and Jayne, T. S. (2004): ‘Measuring the Impacts of Working Age Adult Mortality among Small-Scale Farm Households in Kenya’. World Development 32 (1), January.
Yaroslav, K. (2003): ‘Food aid: Help or Hindrance? The case of Eastern Europe and newly Industrialized States’. MA thesis, National University of “Kyiv-Mohyla Academy” Economics Education and Research Consortium.
Yeraswork, A., Fantu G., and Asrat A. (2003): ‘Spatial Population Balance and Rural Viability in Ethiopia’. Paper prepared for the Roles of Agriculture International Conference 20-22 October, 2003, Rome, Italy, Agricultural and Development Economics Division (ESA), Food and Agriculture Organization of the United Nations.
Yigremew, Adal (2002): ‘Review of Landholding Systems and Policies in Ethiopia under the Different Regimes.’ EEA/Ethiopian Economic Policy Research Institute, working paper no. 5/2002.
Zerihun, W. (2003): ‘Socio-Economic Baseline Survey of 56 Woreda in Amhara Region’. Amhara National Regional State, Bureau of Rural Development (Research Team Work), Ethiopia.
86
87
Annex Table A4.1: Terms-of-trade Between Crop Prices (teff and maize) and Fertilizer
Prices (1986-2001) Year DAP/Teff UREA/Teff DAP/Maize
Source:* Grain prices for selected sites obtained from the Ethiopian Grain Trade Enterprise (EGTE). The grain price of 2001 are averages for the period January to July. ** Fertilizer prices refer to prices observed at the same or nearby locations of grain price
88
Table A6.1: Inter-sectoral linkages of the manufacturing sector
Table A7.1: Wage distribution by industrial group, 2001/02 Wage Category
Below 100 100-149 150-199 200-249 250-299 300-399 400-499 500-699 700-999 1000* Total Industrial Group Male Female Male Female Male Female Male Female Male Female Male Female Male Female Male Female Male Female Male Female Male Female
Issues in Employment and Poverty Discussion Papers
1. Azizur Rahman Khan: Employment Policies for Poverty Reduction (November 2001) 2. Rizwan Islam: Employment Implications of the Global Economic Slowdown 2001: Responding
with a Social Focus (November 2001) 3. Rohini Nayyar: The Contribution of Public Works and Other Labour-Based Infrastructure to
Poverty Alleviation: The Indian Experience (September 2002) 4. K. Sundaram and Suresh D. Tendulkar: The Working Poor In India: Employment-Poverty
Linkages and Employment Policy Options (September 2002) 5. Stephen Devereux: From Workfare to Fair Work: The Contribution of Public Works and Other
Labour-based Infrastructure Programmes to Poverty Alleviation (November 2002) 6. Mustafa K. Mujeri: Bangladesh: Bringing Poverty Focus in Rural Infrastructure Development
(November 2002) 7. G.K. Chadha: Rural Employment in India: Current Situation, Challenges and Potential for
Expansion (February 2003) 8. Rizwan Islam: Labour Market Policies, Economic Growth and Poverty Reduction: Lessons and
Non-lessons from the Comparative Experience of East, South-East and South Asia (April 2003)
9. Pham Lan Huong, Bui Quang Tuan, Dinh Hien Minh: Employment Poverty Linkages and Policies for Pro-poor growth in Vietnam (May 2003)
10. Rushidan Islam Rahman and K.M. Nabiul Islam: Employment Poverty Linkages: Bangladesh (August 2003)
11. Luis Carlos Jemio and María del carmen Choque: Employment-Poverty Linkages and Policies: The Case of Bolivia (August 2003)
12. Mulat Demeke, Fantu Guta and Tadele Ferede:: Growth, employment, poverty and policies in Ethiopia: an empirical investigation (August 2003)
13. Nina Torm: The Nexus of Economic Growth, Employment and Poverty during Economic Transition: An Analysis of Armenia, Kazakhstan, Kyrgyzstan, Moldova, Tajikistan and Uzbekistan (October 2003)
14. Rizwanul Islam: The Nexus of Economic Growth, Employment and Poverty Reduction: An Empirical Analysis (January 2004)
15. Azizur Rahman Kahn: Growth, Inequality and Poverty: A Comparative Study of China’s Experience in the Periods Before and After the Asian Crisis (March 2004)
16. Kabann I.B. Kabananukye,Adrine E.K. Kabananukye,J.K. Krishnamurty,Daisy Owomugasho: Economic Growth, Employment, Poverty and Pro-Poor Policies in Uganda (April 2004)
17. Rushidan Islam Rahman: Employment Route to Poverty Reduction in Bangladesh: Role of Self-Employment and Wage Employment (November 2004)
18. S.R. Osmani: The role of employment in promoting the Millennium development goals (October 2005)
19. Azizur Rahman Khan: Growth, employment and poverty: An analysis of the vital nexus based on some recent UNDP and ILO/SIDA studies (October 2005)
20. Medhi Krongkaew, Suchittra Chamnivickorn and Isriya Nitithanprapas: Economic growth, employment and poverty reduction: The case of Thailand (January 2006)
21. Tilman Brück and Katleen van den Broeck: Growth, employment and poverty in Mozambique (January 2006)
92
22. Mulat Demeke, Fantu Guta and Tadele Ferede. Towards a more employment-intensive and pro-poor economic growth in Ethiopia: Issues and policies (March 2006)