1 Towards new poverty lines for India 1 Himanshu This paper amplifies on a suggestion made to the committee constituted by the Planning Commission to review the existing methodology for official poverty estimation in India. In brief, the suggestion was to accept the official All-India urban poverty estimate of 25.7% for 2004-05, derive the All-India urban poverty line that corresponds to this using the multiple (MRP) rather than uniform (URP) reference period distribution, and to recalculate from this modified poverty line new state-wise urban and rural poverty lines that reflect actual spatial variations in cost of living during 2004-05. This suggestion is based on six considerations: 1. First, that in light of unnecessary past controversies on the matter, it is essential to clarify that poverty in India is measured purely on the consumption dimension and that all other dimensions, including calorie norms on which present poverty lines were originally constructed, are incidental and only of historical significance. 2. Second, that once it is agreed that what is being measured is consumption poverty, a basic requirement for valid spatial or inter-temporal comparison of this is that poverty lines used across space and time should represent equivalent purchasing power (PPP) at whatever reference consumption level is taken to be the cut-off for basic minimum needs. In particular, once this reference cut-off is chosen, this should apply equally and without discrimination to all locations, rural and urban, with the only location- specific adjustment being for differences in cost of living. 3. Third, in order to maintain continuity of presently accepted notions of the minimum standard of living required to avoid absolute poverty, it is desirable that the reference cut-off be anchored to some aspect of present practice. There are two possible references, the present All-India urban and rural poverty lines, of which only one can be chosen since the other must be determined by actual cost of living differences. 4. Fourth, official rural poverty estimates are widely perceived to be too low and no longer conforming to acceptable basic needs. Since official urban poverty estimates are less controversial, our choice of reference consumption cut-off is the MRP 1 This paper is a modified version of an original paper by Himanshu, Rinku Murgai and Abhijit Sen. Unlike the original paper, which used median prices for the bottom 60% of population, this paper uses median prices for the entire population. Also final cost of living indices reported here involve fewer steps (in particular drops a loop back from rural to urban prices) than suggested in the original paper. These changes were made on suggestion of the Expert Group and all results and diagnostics have correspondingly been recalculated.
Transcript
1
Towards new poverty lines for India1
Himanshu
This paper amplifies on a suggestion made to the committee constituted by the Planning
Commission to review the existing methodology for official poverty estimation in India. In
brief, the suggestion was to accept the official All-India urban poverty estimate of 25.7% for
2004-05, derive the All-India urban poverty line that corresponds to this using the multiple
(MRP) rather than uniform (URP) reference period distribution, and to recalculate from this
modified poverty line new state-wise urban and rural poverty lines that reflect actual spatial
variations in cost of living during 2004-05. This suggestion is based on six considerations:
1. First, that in light of unnecessary past controversies on the matter, it is essential to
clarify that poverty in India is measured purely on the consumption dimension and
that all other dimensions, including calorie norms on which present poverty lines were
originally constructed, are incidental and only of historical significance.
2. Second, that once it is agreed that what is being measured is consumption poverty, a
basic requirement for valid spatial or inter-temporal comparison of this is that poverty
lines used across space and time should represent equivalent purchasing power (PPP)
at whatever reference consumption level is taken to be the cut-off for basic minimum
needs. In particular, once this reference cut-off is chosen, this should apply equally
and without discrimination to all locations, rural and urban, with the only location-
specific adjustment being for differences in cost of living.
3. Third, in order to maintain continuity of presently accepted notions of the minimum
standard of living required to avoid absolute poverty, it is desirable that the reference
cut-off be anchored to some aspect of present practice. There are two possible
references, the present All-India urban and rural poverty lines, of which only one can
be chosen since the other must be determined by actual cost of living differences.
4. Fourth, official rural poverty estimates are widely perceived to be too low and no
longer conforming to acceptable basic needs. Since official urban poverty estimates
are less controversial, our choice of reference consumption cut-off is the MRP
1 This paper is a modified version of an original paper by Himanshu, Rinku Murgai and Abhijit Sen. Unlike the original paper, which used median prices for the bottom 60% of population, this paper uses median prices for the entire population. Also final cost of living indices reported here involve fewer steps (in particular drops a loop back from rural to urban prices) than suggested in the original paper. These changes were made on suggestion of the Expert Group and all results and diagnostics have correspondingly been recalculated.
2
equivalent of the present official All-India urban poverty line, which leaves measured
All-India urban poverty incidence unchanged from its current official estimate.
5. Fifth, the relatively minor matter of choosing the MRP cut-off that gives the same
urban poverty rate as official, rather than taking the present official urban poverty line
directly, is because NSSO now uses the MRP rather than URP in most of its surveys.
It is necessary to have poverty lines that correspond to MRP distributions.
6. Sixth, although the new poverty lines are not based on any particular norm of basic
needs, and are outcome of a purely technical exercise to calculate cost of living
indices relevant around the present All-India urban poverty line, this choice can be
defended normatively. In particular, albeit modest norms of nutrition and of paid-out
education and health costs are adequately met at the All-India level and in most,
although not all, States.
This paper reports state-wise rural and urban poverty lines obtained from a technical exercise
to calculate cost of living indices relevant around this consumption norm. Based mainly on
NSS unit values, this is similar to Deaton (2003) and to earlier work used by the 1993 Expert
Group. However, we cover more items and treat inter-state and rural-urban price differences
somewhat differently. Our new poverty lines correlate very well with Deaton’s across States
but show more urban-rural difference, mainly on account of wider coverage of non-food
items. Nonetheless, we too find that present official poverty lines exaggerate urban-rural
price difference, spuriously place rural poverty as less than urban in as many as 9 major
States, and also correlate poorly with inter-state variations in cost of living. But we differ
with Deaton in suggesting upward revision of existing rural poverty lines and hence of
estimated rural poverty - from 28.3% to 43.6%.
This is because of our choice of present official All-India urban poverty estimate as reference
and the fact that urban-rural price differences are actually much less than those implicit in
official poverty lines. If instead, like Deaton, we had used official All-India rural poverty as
reference, existing urban poverty estimates would be revised down while leaving All-India
rural poverty levels unchanged. Consequently, although we avoid the normative Pandora’s
Box of reconsidering the cost of basic minimum needs and instead peg our new poverty lines
as PPP equivalents of an existing norm, we do make a normative choice different from
Deaton in using existing official estimates of urban, rather than rural, poverty as reference.
3
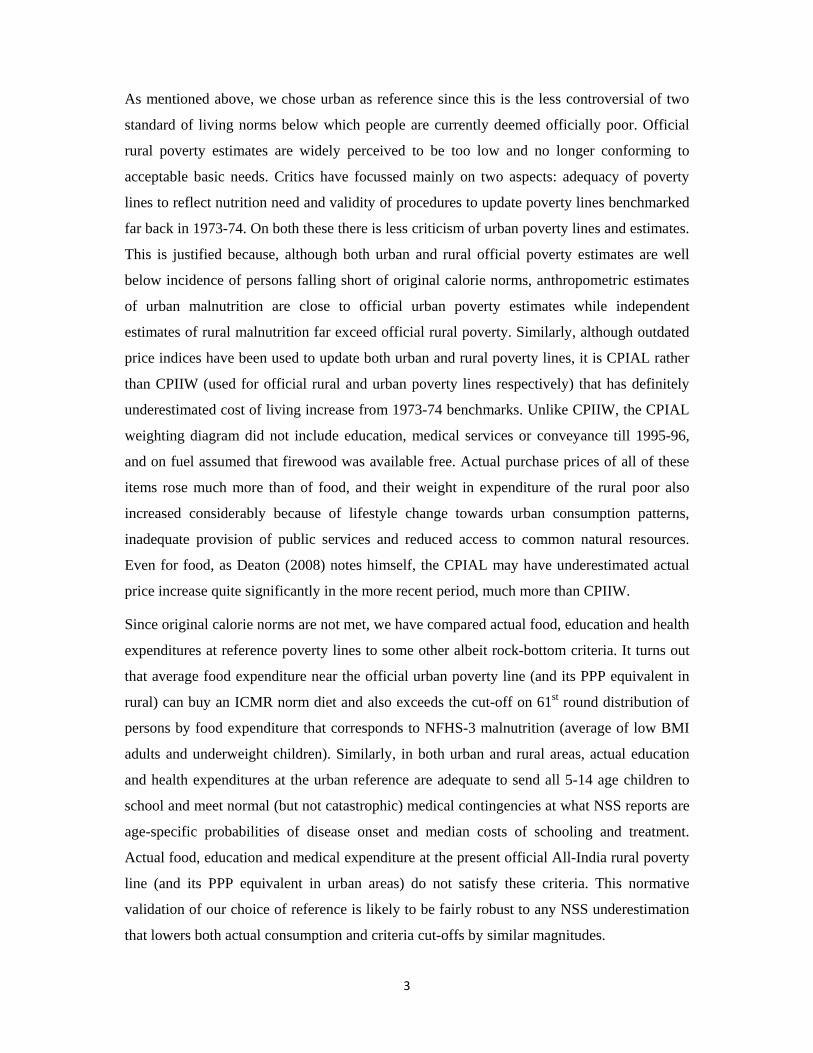
As mentioned above, we chose urban as reference since this is the less controversial of two
standard of living norms below which people are currently deemed officially poor. Official
rural poverty estimates are widely perceived to be too low and no longer conforming to
acceptable basic needs. Critics have focussed mainly on two aspects: adequacy of poverty
lines to reflect nutrition need and validity of procedures to update poverty lines benchmarked
far back in 1973-74. On both these there is less criticism of urban poverty lines and estimates.
This is justified because, although both urban and rural official poverty estimates are well
below incidence of persons falling short of original calorie norms, anthropometric estimates
of urban malnutrition are close to official urban poverty estimates while independent
estimates of rural malnutrition far exceed official rural poverty. Similarly, although outdated
price indices have been used to update both urban and rural poverty lines, it is CPIAL rather
than CPIIW (used for official rural and urban poverty lines respectively) that has definitely
underestimated cost of living increase from 1973-74 benchmarks. Unlike CPIIW, the CPIAL
weighting diagram did not include education, medical services or conveyance till 1995-96,
and on fuel assumed that firewood was available free. Actual purchase prices of all of these
items rose much more than of food, and their weight in expenditure of the rural poor also
increased considerably because of lifestyle change towards urban consumption patterns,
inadequate provision of public services and reduced access to common natural resources.
Even for food, as Deaton (2008) notes himself, the CPIAL may have underestimated actual
price increase quite significantly in the more recent period, much more than CPIIW.
Since original calorie norms are not met, we have compared actual food, education and health
expenditures at reference poverty lines to some other albeit rock-bottom criteria. It turns out
that average food expenditure near the official urban poverty line (and its PPP equivalent in
rural) can buy an ICMR norm diet and also exceeds the cut-off on 61st round distribution of
persons by food expenditure that corresponds to NFHS-3 malnutrition (average of low BMI
adults and underweight children). Similarly, in both urban and rural areas, actual education
and health expenditures at the urban reference are adequate to send all 5-14 age children to
school and meet normal (but not catastrophic) medical contingencies at what NSS reports are
age-specific probabilities of disease onset and median costs of schooling and treatment.
Actual food, education and medical expenditure at the present official All-India rural poverty
line (and its PPP equivalent in urban areas) do not satisfy these criteria. This normative
validation of our choice of reference is likely to be fairly robust to any NSS underestimation
that lowers both actual consumption and criteria cut-offs by similar magnitudes.
4
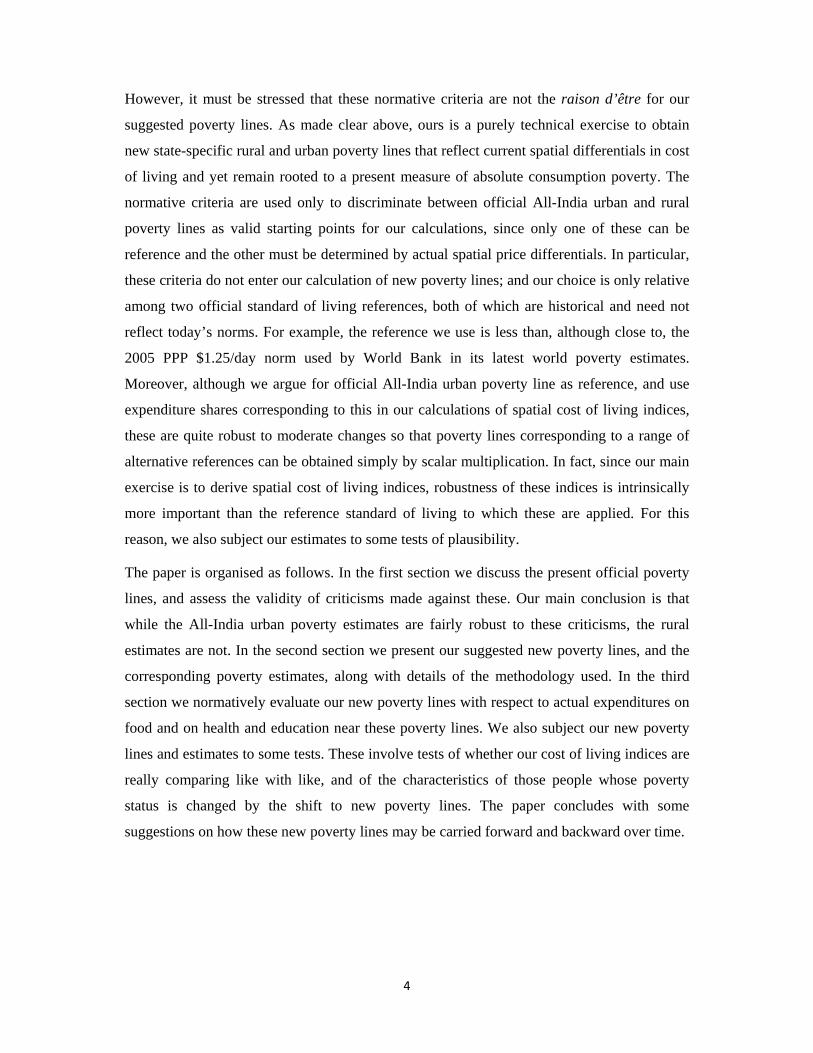
However, it must be stressed that these normative criteria are not the raison d’être for our
suggested poverty lines. As made clear above, ours is a purely technical exercise to obtain
new state-specific rural and urban poverty lines that reflect current spatial differentials in cost
of living and yet remain rooted to a present measure of absolute consumption poverty. The
normative criteria are used only to discriminate between official All-India urban and rural
poverty lines as valid starting points for our calculations, since only one of these can be
reference and the other must be determined by actual spatial price differentials. In particular,
these criteria do not enter our calculation of new poverty lines; and our choice is only relative
among two official standard of living references, both of which are historical and need not
reflect today’s norms. For example, the reference we use is less than, although close to, the
2005 PPP $1.25/day norm used by World Bank in its latest world poverty estimates.
Moreover, although we argue for official All-India urban poverty line as reference, and use
expenditure shares corresponding to this in our calculations of spatial cost of living indices,
these are quite robust to moderate changes so that poverty lines corresponding to a range of
alternative references can be obtained simply by scalar multiplication. In fact, since our main
exercise is to derive spatial cost of living indices, robustness of these indices is intrinsically
more important than the reference standard of living to which these are applied. For this
reason, we also subject our estimates to some tests of plausibility.
The paper is organised as follows. In the first section we discuss the present official poverty
lines, and assess the validity of criticisms made against these. Our main conclusion is that
while the All-India urban poverty estimates are fairly robust to these criticisms, the rural
estimates are not. In the second section we present our suggested new poverty lines, and the
corresponding poverty estimates, along with details of the methodology used. In the third
section we normatively evaluate our new poverty lines with respect to actual expenditures on
food and on health and education near these poverty lines. We also subject our new poverty
lines and estimates to some tests. These involve tests of whether our cost of living indices are
really comparing like with like, and of the characteristics of those people whose poverty
status is changed by the shift to new poverty lines. The paper concludes with some
suggestions on how these new poverty lines may be carried forward and backward over time.
5
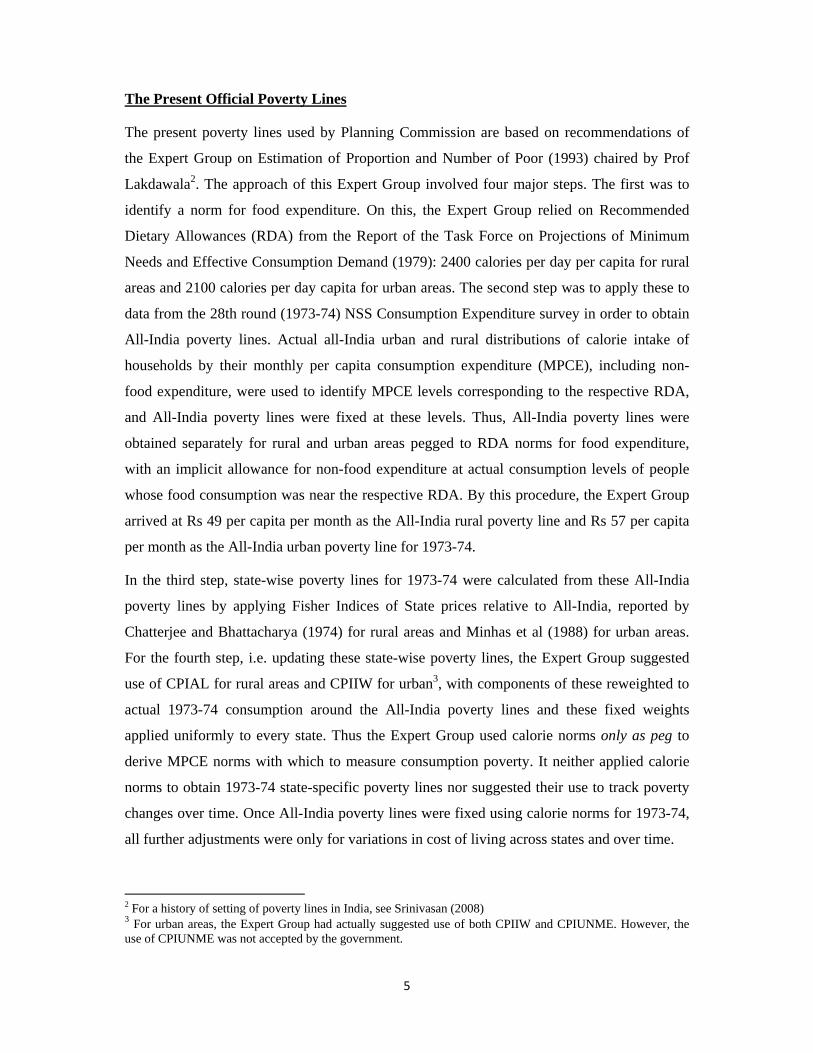
The Present Official Poverty Lines
The present poverty lines used by Planning Commission are based on recommendations of
the Expert Group on Estimation of Proportion and Number of Poor (1993) chaired by Prof
Lakdawala2. The approach of this Expert Group involved four major steps. The first was to
identify a norm for food expenditure. On this, the Expert Group relied on Recommended
Dietary Allowances (RDA) from the Report of the Task Force on Projections of Minimum
Needs and Effective Consumption Demand (1979): 2400 calories per day per capita for rural
areas and 2100 calories per day capita for urban areas. The second step was to apply these to
data from the 28th round (1973-74) NSS Consumption Expenditure survey in order to obtain
All-India poverty lines. Actual all-India urban and rural distributions of calorie intake of
households by their monthly per capita consumption expenditure (MPCE), including non-
food expenditure, were used to identify MPCE levels corresponding to the respective RDA,
and All-India poverty lines were fixed at these levels. Thus, All-India poverty lines were
obtained separately for rural and urban areas pegged to RDA norms for food expenditure,
with an implicit allowance for non-food expenditure at actual consumption levels of people
whose food consumption was near the respective RDA. By this procedure, the Expert Group
arrived at Rs 49 per capita per month as the All-India rural poverty line and Rs 57 per capita
per month as the All-India urban poverty line for 1973-74.
In the third step, state-wise poverty lines for 1973-74 were calculated from these All-India
poverty lines by applying Fisher Indices of State prices relative to All-India, reported by
Chatterjee and Bhattacharya (1974) for rural areas and Minhas et al (1988) for urban areas.
For the fourth step, i.e. updating these state-wise poverty lines, the Expert Group suggested
use of CPIAL for rural areas and CPIIW for urban3, with components of these reweighted to
actual 1973-74 consumption around the All-India poverty lines and these fixed weights
applied uniformly to every state. Thus the Expert Group used calorie norms only as peg to
derive MPCE norms with which to measure consumption poverty. It neither applied calorie
norms to obtain 1973-74 state-specific poverty lines nor suggested their use to track poverty
changes over time. Once All-India poverty lines were fixed using calorie norms for 1973-74,
all further adjustments were only for variations in cost of living across states and over time.
2 For a history of setting of poverty lines in India, see Srinivasan (2008) 3 For urban areas, the Expert Group had actually suggested use of both CPIIW and CPIUNME. However, the use of CPIUNME was not accepted by the government.
6
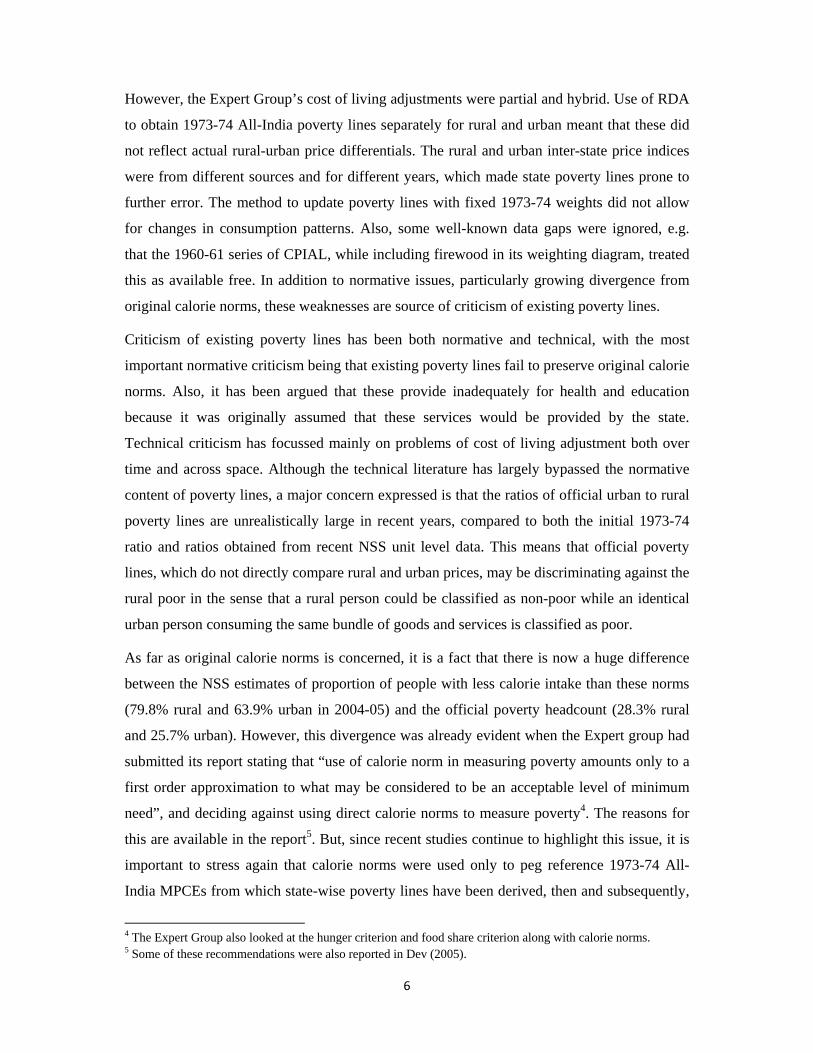
However, the Expert Group’s cost of living adjustments were partial and hybrid. Use of RDA
to obtain 1973-74 All-India poverty lines separately for rural and urban meant that these did
not reflect actual rural-urban price differentials. The rural and urban inter-state price indices
were from different sources and for different years, which made state poverty lines prone to
further error. The method to update poverty lines with fixed 1973-74 weights did not allow
for changes in consumption patterns. Also, some well-known data gaps were ignored, e.g.
that the 1960-61 series of CPIAL, while including firewood in its weighting diagram, treated
this as available free. In addition to normative issues, particularly growing divergence from
original calorie norms, these weaknesses are source of criticism of existing poverty lines.
Criticism of existing poverty lines has been both normative and technical, with the most
important normative criticism being that existing poverty lines fail to preserve original calorie
norms. Also, it has been argued that these provide inadequately for health and education
because it was originally assumed that these services would be provided by the state.
Technical criticism has focussed mainly on problems of cost of living adjustment both over
time and across space. Although the technical literature has largely bypassed the normative
content of poverty lines, a major concern expressed is that the ratios of official urban to rural
poverty lines are unrealistically large in recent years, compared to both the initial 1973-74
ratio and ratios obtained from recent NSS unit level data. This means that official poverty
lines, which do not directly compare rural and urban prices, may be discriminating against the
rural poor in the sense that a rural person could be classified as non-poor while an identical
urban person consuming the same bundle of goods and services is classified as poor.
As far as original calorie norms is concerned, it is a fact that there is now a huge difference
between the NSS estimates of proportion of people with less calorie intake than these norms
(79.8% rural and 63.9% urban in 2004-05) and the official poverty headcount (28.3% rural
and 25.7% urban). However, this divergence was already evident when the Expert group had
submitted its report stating that “use of calorie norm in measuring poverty amounts only to a
first order approximation to what may be considered to be an acceptable level of minimum
need”, and deciding against using direct calorie norms to measure poverty4. The reasons for
this are available in the report5. But, since recent studies continue to highlight this issue, it is
important to stress again that calorie norms were used only to peg reference 1973-74 All-
India MPCEs from which state-wise poverty lines have been derived, then and subsequently,
4 The Expert Group also looked at the hunger criterion and food share criterion along with calorie norms. 5 Some of these recommendations were also reported in Dev (2005).
7
by applying cost of living adjustments. What was being measured was consumption poverty,
not calorie deficiency.
In other words, while deficiencies in calorie intake are certainly important, this was not the
dimension that either the Expert Group or previous Indian literature had used to measure
poverty. On the dimension of consumption expenditure that was chosen, actual calorie intake
is immaterial so long as norm intakes are affordable. Poverty lines, even in 1973-74, assured
at best the affordability of a consumption bundle that contained food items with norm calorie
content and did not classify as poor all those with less than norm calorie intake. Whether this
remains true is part of the technical issues concerning subsequent cost of living adjustment.
But as Pronab Sen (2005) showed, although actual calorie intake around the poverty line was
well below norm in 1999-00, calorie norms could have been met in most states without
reducing non-food expenditures if those around the poverty line had spent the same amount
on food but consumed the more cereals intensive diet of the average poor. Moreover, recent
research shows that a similar conclusion continues to hold in urban areas, although not in
rural, even if intake norms are expressed in terms of culturally palatable minimum cost diets
that adequately meet ICMR norms of all nutrients, not just calories6.
The implication of the above is that the actual calorie shortfall now observed at the poverty
line may be because of preference for a more varied and expensive diet and, at least in case of
urban areas, is not because of lack of affordability. Nonetheless, since adequate nutrition is
the most basic minimum need that poverty lines should satisfy, mere affordability of norms
cannot be a convincing defence of official poverty counts if actual hunger and malnutrition at
present were anything like the incidence of people with calorie intake below these norms7.
But this is unlikely, not only because the NSS reports negligible incidence of subjectively felt
hunger, but also because the original Task Force calorie norms were almost certainly too
high. For example, FAO’s minimum calorie norm for India is currently around 1800 calories
per capita per day8, which is very close to average 61st round calorie intake of those near
6 Mahal and Karan (2007) calculate “culturally palatable” minimum cost diets that meet ICMR RDAs on energy, proteins, fats and eight micronutrients for 16 major Indian states in 1993-94 and 1999-00, and report the percentage of population who are poor by this dietary adequacy measure if food share in total expenditure is maintained at actual levels. They find that dietary poverty by this definition is marginally lower than official poverty at the level of All-India urban, with states roughly equally divided on which urban poverty measure is higher. On the other hand, they report that dietary poverty exceeds official poverty in rural areas of almost all states in both years and the excess averages 8-10 percentage points at All-India level. 7 See Utsa Patnaik (2007) for an influential critique of the present methodology. 8 The norm used by FAO for India in its State of Food Insecurity Report (SOFI) 2008 is 1770 calories per day, down from 1820 calories per day used in SOFI 2006. These current FAO norms follow from an ongoing joint WHO/FAO consultation. In 1985, FAO shifted from its then current RDA for calories to Estimated Average
8
official poverty lines in both rural and urban areas. Although the sedentary activity levels
assumed are questionable for rural areas, the fact that actual intake at the cut-off is close to
the FAO norm does provide a defence at least for the official All-India urban poverty line.
However, the real lesson from all this is that calorie needs vary widely and All-India calorie
norms are not the best way to define minimum nutritional need9. The best indication of this is
that the incidence of calorie deficiency from any All-India norm, whether original or FAO,
correlate very poorly with direct anthropometric measures of malnutrition from National
Nutrition Monitoring Bureau (NNMB) and National Family Health Survey (NFHS). This is
true over time (while calorie intake has declined, nutrition outcome indicators have
improved); across states (e.g. Kerala and Tamil Nadu have both lower calorie intake and
lower malnutrition than Bihar and Uttar Pradesh); and also between rural and urban. If
incidence of inadequate nutrition is judged by the average of low BMI adults and
underweight children, this was about 25% in urban areas and 40% in rural during 2005-06
(NFHS-3). On this basis, the 2004-05 official All-India rural poverty count of 28.3% does
appear to be too low, but the All-India urban poverty count of 25.7% is again defensible.
Our main conclusion from this discussion of criticisms of the nutritional adequacy of present
official poverty lines is that it is confusing and also probably misleading to continue to rely
on the original calorie norms. The critics are correct in questioning the present official
estimates of rural poverty since there is sufficient prima facie evidence to suggest that this
underestimates nutritional inadequacy, but this evidence also lends fairly strong support to
official estimates of All-India urban poverty. Since calorie intakes correlate poorly with other
indicators, and nutritional adequacy needs to be judged in a holistic manner, it is probably
better to move directly to a consumption expenditure norm and judge the nutritional
adequacy of this norm against data from nutrition outcome indicators. On this basis, the
Requirements (EAR). The earlier RDA had sought to ensure that, given normal variation across individuals, requirements were met for at least 95% of population. Since this overestimates requirements for most of the population and in case of calories could exceed desirable maximum levels for many, EAR is based on the requirement at the median of the distribution. In 2004, WHO/FAO reduced the EAR further based on new data. These revisions apply to all countries not just India. For example, FAO’s norm for China is now 1900 calories, which is higher than the India norm only because its demographic composition has more adults. 9 Calorie requirement depends on age, sex, weight, height, activity pattern, climate, water quality and various other factors, and RDA norms are available by the first four of these. The 1979 Task Force took average All-India data from 1971 census, but the resultant need not be RDA for any state. For example, calorie intake in Kerala and Tamil Nadu are lowest in every NSS survey, but independent data on health status and nutrition from NFHS/NNMB repeatedly show these states to be among the best states. The expert group recognized that RDA exercise was best done at state level but, since they were not recommending calorie based poverty lines, accepted All-India RDAs from the Task Force as reference for consumption poverty.
9
present All-India official urban poverty line is certainly preferable as the consumption
poverty cut-off than the present official All-India rural poverty line.
This conclusion is supported by three other normative considerations:
1 Education: In 2004-05, NSS reports that as against only about 75% of 5-14 year rural
children in the official rural poverty line class attending school, nearly 90% of urban
5-14 year old children in the urban official poverty line class were attending school.
In terms of expenditure, average actual expenditure on education was adequate to
send all these children to school at the median cost of schooling per child.
2 Health: In terms of expenditure on health in 2004-05, average actual expenditure on
non-institutional medical care incurred by those at the urban poverty line class was
slightly more than required to meet a probability of disease onset of 9% per month at
the median cost of treatment per disease episode as reported in NSS 60th round. As
against this, actual average expenditure on non-institutional medical care by those
around the official rural poverty line was lower than required. For institutional
medical care, actual expenditure by both the urban and rural poverty classes was less
than required to meet a 2.5% probability of hospitalisation at the median cost of
hospitalisation. However, taking both institutional and non-institutional medical care,
actual expenditure of the urban poverty line class was adequate while that of the rural
poverty line class was substantially less required than to meet the above probabilities
at median cost.
3 Treatment of similar households: Considering two groups of poorest households,
those in the casual labour household type and those where the household head is
illiterate, the official urban poverty line classified 58% and 53% of persons in such
urban households as poor in 2004-05. However, the official rural poverty line
classifies as poor only 46%, 34% and 38% respectively of those in rural agricultural
labour households, non-agricultural labour households and households with illiterate
heads. Clearly, similar household types in urban and rural areas are being classified
differently by the two poverty lines. The urban poverty lines appear more appropriate
since it classifies as poor the majority of people in what are acknowledged to be the
poorest groups. By the same token, the present rural official poverty lines are
somewhat suspect especially since it is difficult to believe that poverty is higher
among urban casual labourers than their rural counterparts, most of who are currently
classified as non-poor.
10
These observations lead into the set of technical criticisms that have primarily focussed on
the problem with price deflators, at inter-state level, rural-urban and over time. The primary
reason for the criticism has been some obvious anomalies in poverty estimates using existing
poverty lines. For majority of the states, urban poverty in 2004-05 turns out to be higher than
rural poverty. This is the case in some of the major states such as Andhra Pradesh, Haryana,
Karnataka, Kerala, Chhatisgarh, Jammu and Kashmir, Madhya Pradesh, Maharashtra,
Rajasthan and Tamilnadu by URP poverty estimates. Orissa, Uttar Pradesh and Uttarakhand
get added to the list of these states if MRP estimates are used. That is, among major states
only Assam, Bihar, Jharkhand, Gujarat and West Bengal remain as states where rural poverty
is higher than urban poverty. Even for all India estimate of poverty by MRP, rural HCR is
21.8 compared to 21.7 in urban areas. While this in itself may not be problematic, it appears
so given the fact that urban growth per capita has outpaced rural growth per capita,
particularly in the post-liberalisation period. Similar anomalies appear as far as inter-state
poverty estimates are concerned (for example, urban Assam and rural Andhra Pradesh).
While some of these anomalies have their genesis in the way that the Expert Group of 1993
used the then available indices of inter-state price differentials, these have become acute
because of the deflators used to update these poverty lines. This was pointed out
comprehensively by Deaton and Tarrozi (2000) and Deaton (2008). As Deaton points out,
part of the reason that the CPI indices have failed to capture the true extent of inflation has
been the use of outdated weights. While the share of food in consumption basket of the
people around the poverty line has fallen to less than 65% in 2004-05, the poverty lines
deflators still use the weights implicit in the 1973-74 distribution which is around 80%; and
while 75% of rural children in the poverty line class went to school in 2004-05, this
proportion in the 1970s was only around 40%. The second problem has been the movement
of CPI indices for certain groups over time, e.g. firewood in CPIAL in rural areas, and the
fact that health and education costs which have increased faster than all other costs according
to PFCE deflators from NAS were not even monitored by the CPIAL till the mid 1990s. Even
within food, cereals prices have increased much less than non-cereals prices between 1973-74
and 2004-05 so that it is not surprising that Deaton (2008) finds underestimation also in the
inflation rate of food, particularly in the rural poverty line calculations, compared to inflation
rates obtained using unit values from the NSSO consumption expenditure surveys. The
combination of these errors which crept in over time appears to have led to serious distortions
11
in official poverty lines. These distortions are, moreover, much more serious in the rural
poverty lines than urban, essentially because the CPIAL had more gaps and also because
rural consumption patterns have shifted more than those of the urban poor.
Most of these issues with the existing poverty lines are already in public domain and there
have been efforts to correct the poverty line of these mistakes. Two important efforts in this
regard are by Martin Ravallion & Gaurav Datt at the World Bank and Angus Deaton.
However, these corrections differ in how they correct the existing poverty lines. The
Ravallion-Datt corrections are limited to 1) correction of some distortions created due to the
use of inter-state price differential for wrong years by the 1993 Expert Group and 2)
correction for the index of fuel and firewood in the CPIAL using price data from labour
bureau. In particular, Ravallion-Datt follow the Expert Group in starting with the same two
different All-India poverty lines for 1973-74 and use the same price indices, i.e. the CPIAL
and CPIIW.
Deaton’s approach to correcting the poverty line is, on the other hand, substantially different
from the methodology adopted by the Expert Group. Not only does Deaton use price data
from the consumption expenditure surveys of NSSO but he also uses fisher’s index for both
inter-state price differential and rural-urban price differential. The notable point with
Deaton’s exercise is that he uses the rural-urban price differential to correct imbalances in
poverty lines across rural and urban areas of each state. His starting point of this exercise is
the 1987-88 consumption expenditure survey. But with any such exercise which uses rural-
urban indices as well as inter-state indices, his starting poverty line is pegged to any one
poverty line. In the case of Deaton’s exercise, he takes the 1987-88 all India rural poverty line
as the starting point of his calculations. This is a departure from the Expert group method
which uses normative bundles separately for rural and urban areas. Since his method involves
use of rural-urban indices along with inter-state price indices, there can be only one
normative bundle in this kind of exercise. However, the real problem with Deaton’s exercise
is that his indices are based on unit values from the NSSO consumption expenditure surveys
and therefore limited to only food items. This limitation is a crucial factor especially when
the share of food in total expenditure has been declining secularly over the years. One of the
important findings from Deatons’s exercise was that rural-urban price differential obtained
using unit values from NSS consumption expenditure surveys was only 15% (higher for
urban areas) compared to roughly 40% implicit in the existing poverty lines (in 1999-00).
12
However, both these corrections have avoided the issue of MRP-URP differences in
consumption basket. At the same time, both these exercises are limited to correcting for the
anomalies in price indices without looking at the normative aspect of the poverty line,
particularly its anchoring with the calorie norm. While Ravallion’s starting point is the
normative poverty line taken by the Expert Group for 1973-74, Deaton’s starting point is the
rural all India official poverty line. In that sense, both these corrections do not reject the
normative poverty line suggested by the Expert group.
New Poverty Lines for India
In light of the above criticisms and the apparent problems with the existing poverty lines, this
paper proposes a new set of poverty lines. The basic approach of setting the new poverty line
is similar to the exercise attempted by Deaton. The last year for which Deaton’s exercise is
reported is 1999-00. However, for all calculations in this paper we have used the
consumption expenditure survey of 2004-05. Apart from the fact that 61st round is free from
all the problems of contamination (which even though does not affect unit values, is not the
right survey year because of the problems inherent in budget shares), it is also the most recent
quinquennial round for which the consumption expenditure data is available.
The second point of departure is that the inter-state and rural-urban price indices used in
calculation of the new price indices are much more comprehensive than the indices used by
Deaton which were primarily based on food prices. However, we follow the essential
suggestion of Deaton of using price data from NSS surveys rather than the CPI price data.
This is possible for food, fuel, clothing and footwear, which together account 75-80% of the
consumption of poor. For those items and item-groups for which price data was not available
or was not suitable for use in a price index we have also used the Employment-
Unemployment survey of NSSO. This has been used for creating a price index for education
expenditure. For index of health expenditure we have used the 60th round NSSO survey
which was focussed on health expenditure. We use CPI indices available from Saluja-Yadav
for remaining items (miscellaneous goods and services and durable) which have a budget
share of 10% for the poor. That is, more than 85% of our indices are based on unit level data
from the NSS. We do not use any index for rent and conveyance for construction of indices.
Excluding rent and conveyance, our NSS unit based indices cover 90% of the consumption
basket of the poor.
13
The third point of departure is that we use the all India urban poverty line of 2004-05 as our
starting point of other state poverty lines in urban areas and also in rural areas. However, this
is not a matter of choice, but is based on evidence which we present the following section.
While there is no attempt in this paper to decide new normative poverty lines either rooted in
a nutritional norm or any other objective criterion and we like others takes the official
poverty line as our starting point, we do cross-check the suitability of the existing poverty
line in capturing the poor using external indicators.
The fourth point of departure is that the budget shares used in our calculation of price indices
are based on mixed recall period. This is justified in light of the fact that NSSO has already
moved to MRP reference period in its annual rounds after 1999-00. This is likely to continue
in the future and therefore any new poverty line should be based on MRP estimates of
consumption expenditure rather than URP estimates which has been the practice so far.
As with Deaton’s exercise, our poverty line relies on the indices created using price data from
the NSSO consumption expenditure survey, but with the 2004-05 round of consumption
expenditure data. We use the price data obtained from the consumption expenditure survey
for food, intoxicants, fuel, clothing and footwear. For all these items price data can be
obtained from the consumption survey. However, unlike Deaton, we use median prices of
each item in each state and sector. For PDS items (Rice, wheat, sugar and kerosene), the
prices are obtained after aggregating the PDS and non-PDS items together. For, clothing and
footwear we have used the prices obtained from the 365 day estimates of these commodities.
Some items, which are insignificant in terms of their consumption share, have been dropped.
The cut-off for selecting these items is Rs 0.15 per month (Rs 1.8 per year for 365 day items).
If these items have lower than this consumption in six or more states out of a possible
combination of 70 values (35 states and union territories for rural and urban areas each) they
have been dropped. Implementation of this procedure has led to 11 items being dropped. For
those states and sector where the item has been consumed by less than 5 households, it has
been treated as not being consumed in that state.
The all India prices are not calculated directly from the unit data but are derived from the
state prices. Using state quantity shares and prices, the all India price of each item is the
weighted average of state prices. The weights used in this case are the population weights
from the census. These state wise price and quantity data are used to obtain a Paasche index
and Laspeyre index for each state relative to all India. The geometric mean of these gives us
14
the Fisher’s index for each state relative to all India. We repeat the same procedure to obtain
urban to rural fisher index for each state. These indices were obtained for all states including
north-eastern states. However, we have dropped union territories from the calculation at this
stage.
This procedure has been used for food, fuel, clothing and footwear. For all these items and
item groups, the unit values can be obtained from the NSS consumption expenditure surveys.
For education, there are no such unit values that can be used. Therefore, we have used the
employment and unemployment survey of NSSO for obtaining the index of cost of education.
For this purpose, we have calculated the cost of education per school going child in each state
for rural and urban areas for children in the age-group of 5-15. For index of health
expenditure we have used the 60th round (January-June 2004) which focuses on health
expenditure. For construction of index, we have calculated health expenditure per treatment
in case of non-institutional medical care and health expenditure per case of hospitalisation for
institutional medical care.
While these items together (food, fuel, clothing, footwear, education and health) cover around
85% of the consumption basket of the poor, we still require an index for the remaining items
of expenditure. Major heads of expenditure for which the index cannot be computed from the
NSS surveys are conveyance, rent, durables, entertainment and miscellaneous goods and
services.
However, no firm price data is available for these item groups. Although price data for some
of these items is collected for the purpose of construction of CPI indices, a closer look at the
data suggests that these may not be free from errors on account of non-standardisation of the
items of expenditure. Nonetheless, in the absence of alternative price data we use the price
indices calculated using the CPI price data for these items except rent and conveyance. Using
these Saluja-Yadav indices and our unit value based indices; we create an aggregate index
using all items except rent and conveyance for state relative to all India as well as urban
relative to rural for each state. In all, we use 23 commodity group indices and these are
aggregated using the budget shares of population around poverty line class in an iterative
manner to obtain a fisher aggregate index. Table 1 gives the final index numbers used in our
calculation of poverty lines.
15
With these final fisher price indices across states relative to all India for urban areas and
rural-urban indices for each state, the poverty line for each state in each sector has been
arrived as follows.
a) We start with the existing urban poverty estimate at all India as our starting point. The
existing urban poverty line is first adjusted for URP-MRP difference. However, since
our aggregate indices exclude rent and conveyance, we calculate the poverty line
corresponding to MRP distribution by obtaining the urban poverty line which gives us
the same headcount ratio using MRP distribution as one would obtain using the URP
poverty line of Rs 538.60 with the URP poverty line, which is 25.7%. The poverty
line which gives a poverty headcount of 25.7% in urban areas using MRP distribution
is Rs 579.80. The share of rent and conveyance in total MPCE of this poverty line
class is 5.3%. Excluding this share, the MRP poverty line is {578.8*(1-0.053)} Rs
548.
b) With this poverty line we arrive at the state urban poverty lines using state relative to
all-India index numbers. Since these urban poverty lines are excluding rent and
conveyance, we adjust these urban state poverty lines with actual share of rent and
conveyance around the poverty line class. The all India poverty headcount ratio is the
population weighted poverty headcount ratio of all states.
c) We use the final all India Urban poverty lines excluding rent and conveyance to
obtain rural poverty lines in each state using the rural to urban fisher indices. These
are then adjusted upwards using the actual share of rent and conveyance around the
poverty line class to obtain the final rural poverty line for each state.
Note that we make extensive use of the fisher index properties for obtaining final index
numbers at state level. Also, the procedure outlined above primarily deals with construction
of price indices across rural-urban within each state and for each state relative to all India. It
is in this sense conceptually similar to the exercise attempted by Deaton. However, the major
point of departure is the choice of starting poverty line which in our case is the All India
urban poverty line unlike Deaton who started with the All-India rural poverty line.
16
Table1: Poverty lines and Final poverty estimates for 2004-05
Since our methodology is substantially the same as Deaton’s, it is useful to begin by
identifying where we differ with him and how we defend these differences. First, the purely
technical point that, unlike Deaton, we incorporate items for which CES unit values are not
available. Does this make any difference? The answer is not much if separately for rural or
urban. Across-states correlation between our poverty lines and state relative to All-India
indices constructed only from items with CES unit values are 0.97 rural and 0.92 urban, and
these also correlate well with Deaton’s earlier results. However, our All-India urban-rural
price ratio is 1.27 against 1.15 using CES unit values only, and our state-level ratios correlate
less well with corresponding ratios using only unit value data (0.64). This is because cost of
services (e.g. education, health, conveyance and rent) are relatively much higher in urban
than rural areas, but sometimes (e.g. health costs in Kerala and Goa) cheaper in richer states
with better public provision than in poorer ones. We feel that our attempt to incorporate these
in a plausible manner has improved upon using only CES unit values.
Second, the substantial normative point on which we differ with Deaton, i.e. to use the urban
rather than rural All India poverty line as the starting reference. Table 2 compares actual food
and health and education expenditure near the poverty line with some norms. We do this not
only with our poverty line but also with what would be obtained if we had used the rural
reference like Deaton. The norm against which actual food expenditures are judged is the
actual state-wise food expenditure from 61st round NSS when persons are ranked by their
food expenditure and cut-off taken at the state-specific malnutrition rate from NFHS. For
both rural and urban the actual food expenditure is 6% higher than norm at the All-India level
at our poverty lines. These would have been 8 and 6% lower in rural and urban areas if we
had followed Deaton in using the rural reference. For education our norm is the expenditure
required at state specific median cost of education per school going child aged 5-14 of
sending all such children to school. For health we calculate the age-weighted probabilities of
disease onset and hospitalisation from the age-specific data for urban areas in 60th round and
multiply these by the state-specific median cost per treatment and per hospitalisation10. For
10 We use the age‐specific PAP (persons reporting ailment) in the last fifteen days for non‐institutional medical expenditure hospitalisation by state from the 60th round (January‐June 2004). Weighted by the age specific population distribution these give us the probabilities of disease onset and hospitalisation by state and sector. To arrive at the norm, we multiply these by the median cost of expenditure assuming everybody is treated. That is, our norm is the expected expenditure of treating all persons given the probabilities of disease onset and hospitalisation.
18
all the three norms, the all-India norm is the population weighted average of states. Taken
together, the All-India actual expenditure is 14 and 22% higher than the norm in rural and
urban All-India with our poverty lines. These would be 15% and 21% lower than norm if we
had like Deaton used the rural reference. As far as calorie intake is concerned, the All -India
averages are 1999 and 1766 cals/day in rural and urban areas near our poverty line and would
be 1840 and 1691 cals/day with the rural reference. Although calorie intake is substantially
lower than the existing norms, it is interesting that the intake of those near our urban poverty
line is almost exactly the same as the present FAO norm for India, with as expected a higher
intake in rural areas because of higher activity. The calorie intakes near the rural reference are
obviously too low to be defended. However, our poverty lines provide enough expenditure to
undertake a nutritionally balanced diet suggested by the National Institute of Nutrition for
Indians11. As far as the state-wise pattern is concerned, in 17 out of 20 major states actual
food expenditure near our poverty lines is higher or equal to 95% of our norms in rural areas
at and this so for 19 out of 20 major states in urban areas. For health and education, actual
expenditure is 95% of norm in 11 and 12 of the 20 major states in rural and urban areas. The
shortfall in almost all other cases is on hospitalisation, not education or non-institutional
treatment.
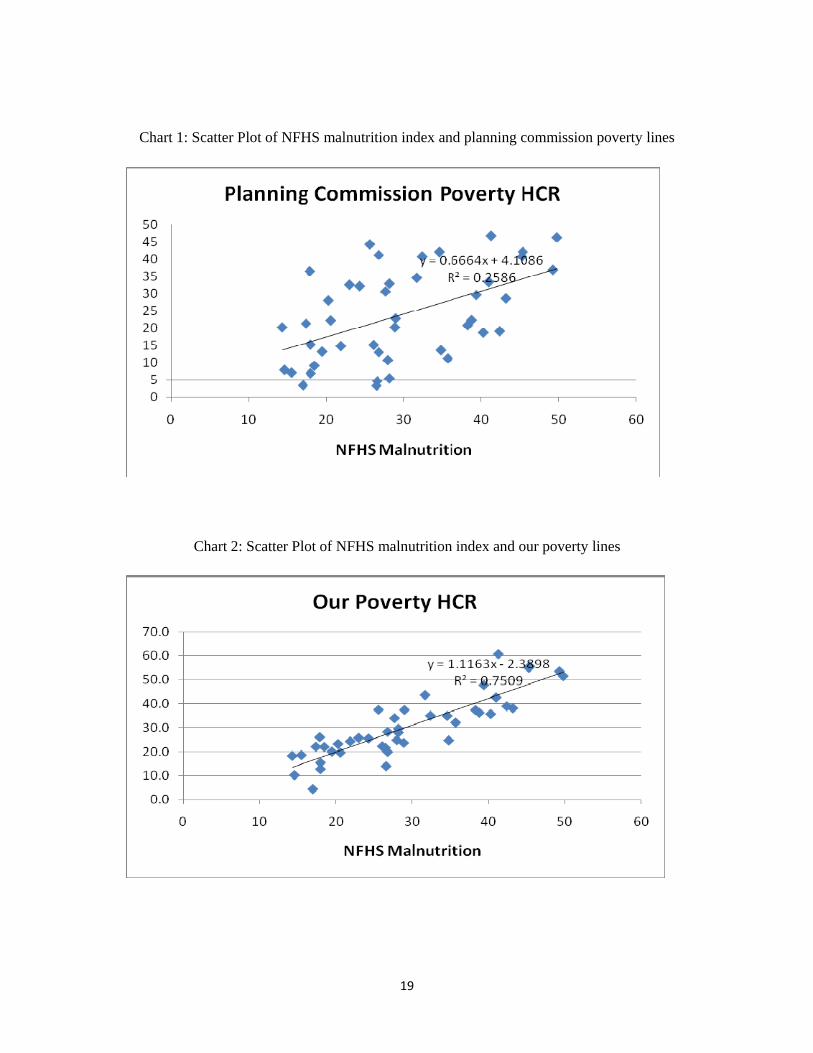
Further, even though our poverty lines fail to meet the existing calorie norms, they meet the
FAO calorie norms in both rural and urban areas. While this may not be the justification as
far as intake indicators of nutrition are concerned, our poverty lines are clearly better suited
and in line with the outcome indicators from the NFHS on malnutrition across states and
sectors12. Our poverty lines correlate better than the existing planning commission poverty
lines as far as malnutrition indicators are concerned. The correlation between NFHS
malnutrition indicators and official planning commission poverty lines is only 0.50. The same
correlation with our poverty lines is 0.87. Chart 1 presents the scatter plot of official poverty
lines against the NFHS malnutrition indicators. Chart 2 presents the scatter of our poverty
line against the malnutrition indicators.
11 National Institute of Nutrition recommends dietary intakes by age‐sex and activity status for Indians. This diet weighted by actual age‐sex composition for a person doing moderate work is met by our poverty lines for majority states as well as in all India.
12 NFHS malnutrition indicators referred here is the simple average of three indicators; percentage of children under age 3 who are underweight, percentage of men with low BMI and percentage of women with low BMI.
19
Chart 1: Scatter Plot of NFHS malnutrition index and planning commission poverty lines
Chart 2: Scatter Plot of NFHS malnutrition index and our poverty lines
20
Table 2: Comparison of Actual Expenditure around Poverty Line against Normative Expenditure
Thus our choice of the all India urban reference rather than the all India rural reference used
by Deaton is normatively justified, except possibly that it still does not meet catastrophic
21
medical contingencies leading to hospitalisation. To have used the all India rural poverty line
as reference would have meant falling below norm on food health and education in the vast
majority of states. Moreover, it may be noticed that the norms we use are also immune to the
criticism made (for example, Surjit Bhalla) that poverty is overestimated because of NSS
underestimation of consumption. Since, our food norm is the cut-off on NSS food distribution
corresponding to NFHS malnutrition; this would itself be an underestimate if the NSS food
consumption is underestimated. Similarly, our health and education norms accept NSS
expenditure per treatment and per school going child and simply impose hundred percent
school attendances and the ability to meet some probabilities of disease onset. Again, any
underestimation in NSS would lead to an underestimation of norms. For this reason, our
estimates appear to be normatively superior to Deaton’s and also immune to the charge of
NSS underestimation.
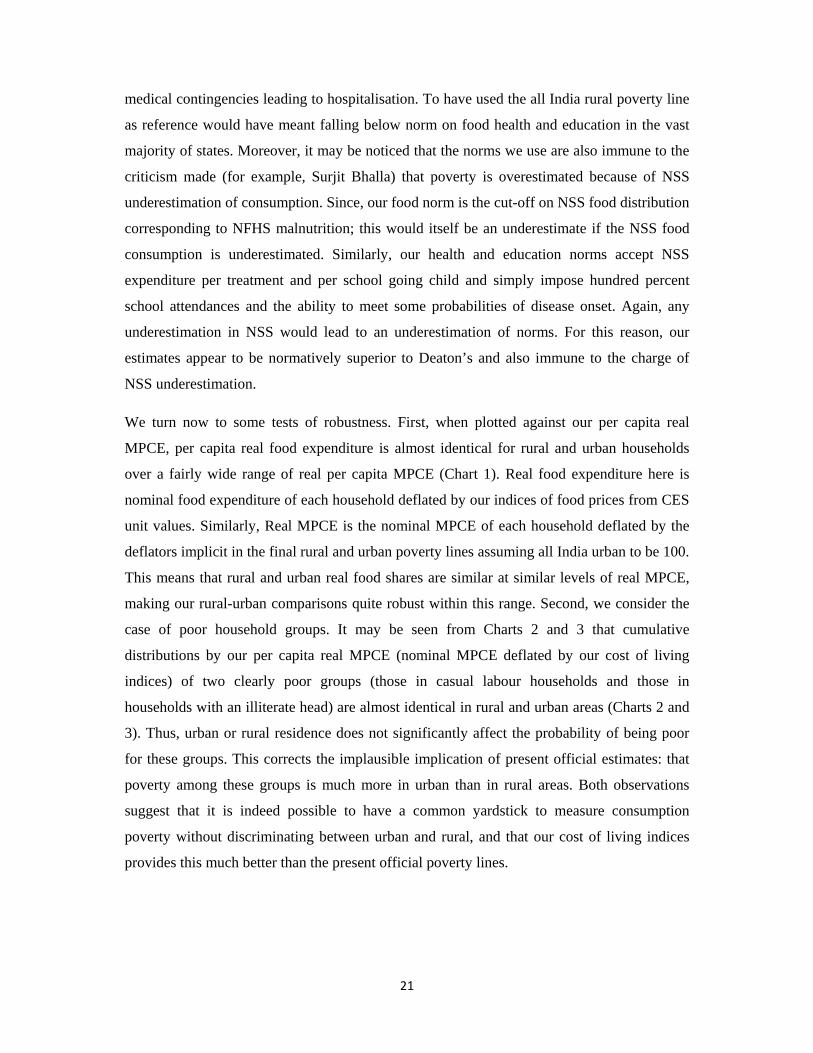
We turn now to some tests of robustness. First, when plotted against our per capita real
MPCE, per capita real food expenditure is almost identical for rural and urban households
over a fairly wide range of real per capita MPCE (Chart 1). Real food expenditure here is
nominal food expenditure of each household deflated by our indices of food prices from CES
unit values. Similarly, Real MPCE is the nominal MPCE of each household deflated by the
deflators implicit in the final rural and urban poverty lines assuming all India urban to be 100.
This means that rural and urban real food shares are similar at similar levels of real MPCE,
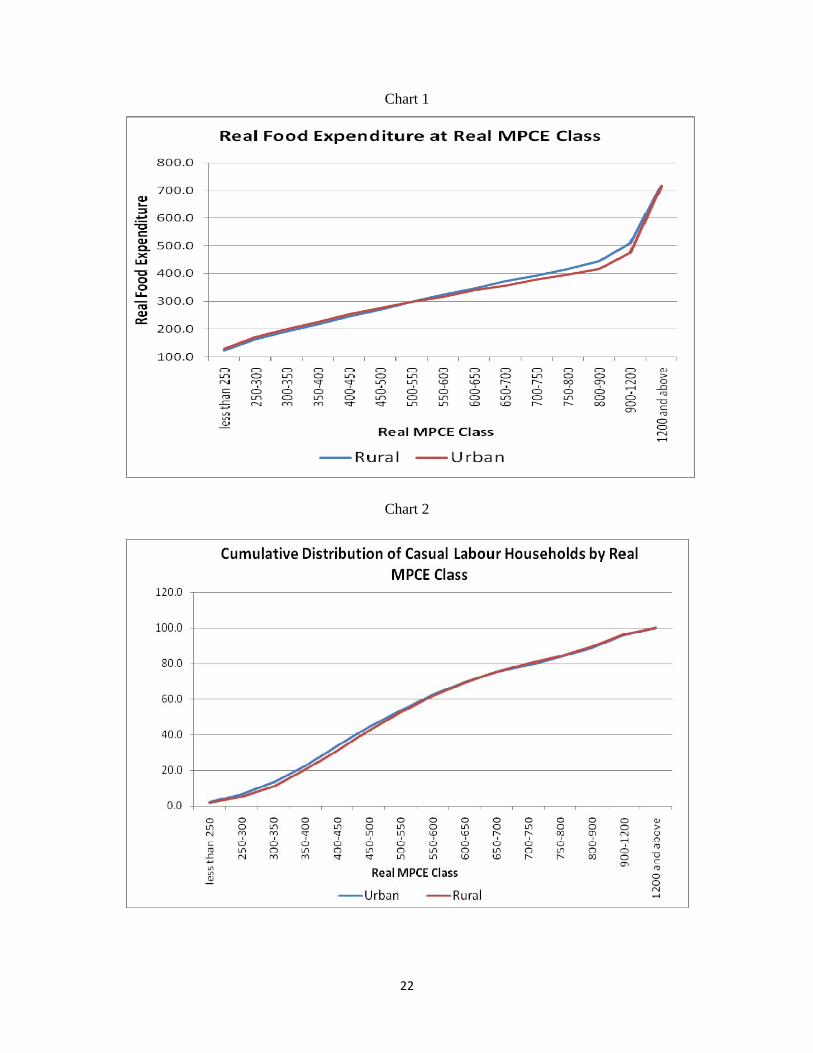
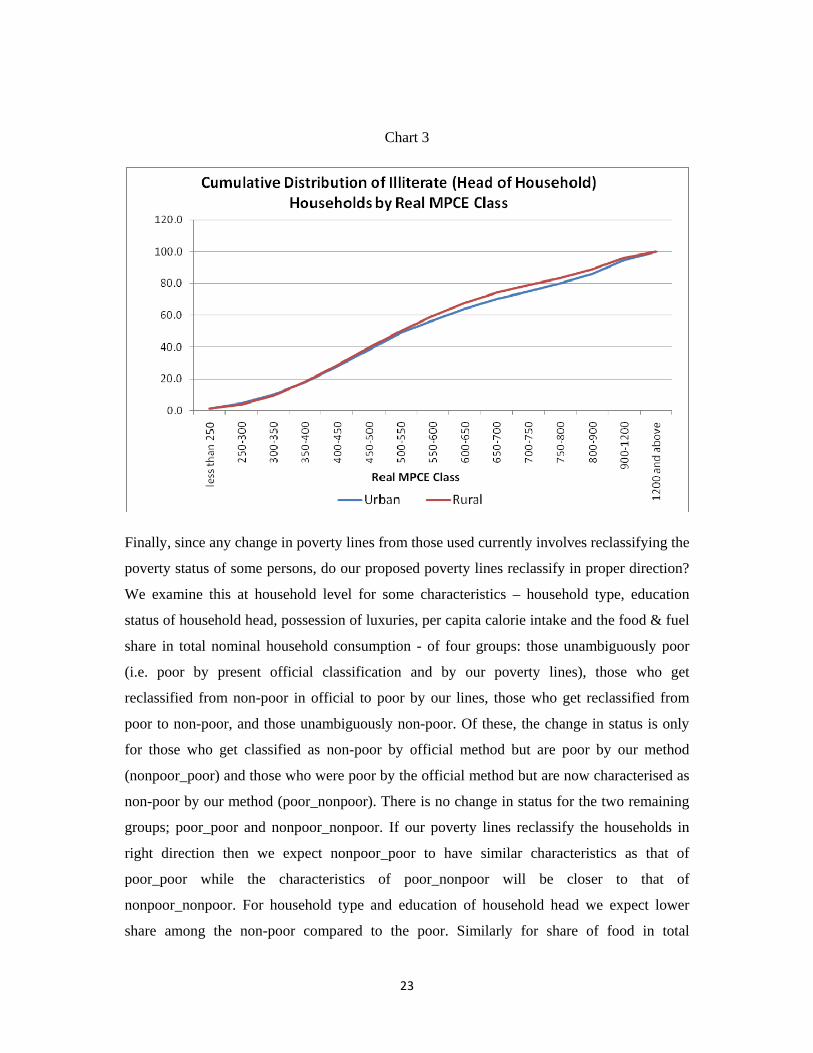
making our rural-urban comparisons quite robust within this range. Second, we consider the
case of poor household groups. It may be seen from Charts 2 and 3 that cumulative
distributions by our per capita real MPCE (nominal MPCE deflated by our cost of living
indices) of two clearly poor groups (those in casual labour households and those in
households with an illiterate head) are almost identical in rural and urban areas (Charts 2 and
3). Thus, urban or rural residence does not significantly affect the probability of being poor
for these groups. This corrects the implausible implication of present official estimates: that
poverty among these groups is much more in urban than in rural areas. Both observations
suggest that it is indeed possible to have a common yardstick to measure consumption
poverty without discriminating between urban and rural, and that our cost of living indices
provides this much better than the present official poverty lines.
22
Chart 1
Chart 2
23
Chart 3
Finally, since any change in poverty lines from those used currently involves reclassifying the
poverty status of some persons, do our proposed poverty lines reclassify in proper direction?
We examine this at household level for some characteristics – household type, education
status of household head, possession of luxuries, per capita calorie intake and the food & fuel
share in total nominal household consumption - of four groups: those unambiguously poor
(i.e. poor by present official classification and by our poverty lines), those who get
reclassified from non-poor in official to poor by our lines, those who get reclassified from
poor to non-poor, and those unambiguously non-poor. Of these, the change in status is only
for those who get classified as non-poor by official method but are poor by our method
(nonpoor_poor) and those who were poor by the official method but are now characterised as
non-poor by our method (poor_nonpoor). There is no change in status for the two remaining
groups; poor_poor and nonpoor_nonpoor. If our poverty lines reclassify the households in
right direction then we expect nonpoor_poor to have similar characteristics as that of
poor_poor while the characteristics of poor_nonpoor will be closer to that of
nonpoor_nonpoor. For household type and education of household head we expect lower
share among the non-poor compared to the poor. Similarly for share of food in total
24
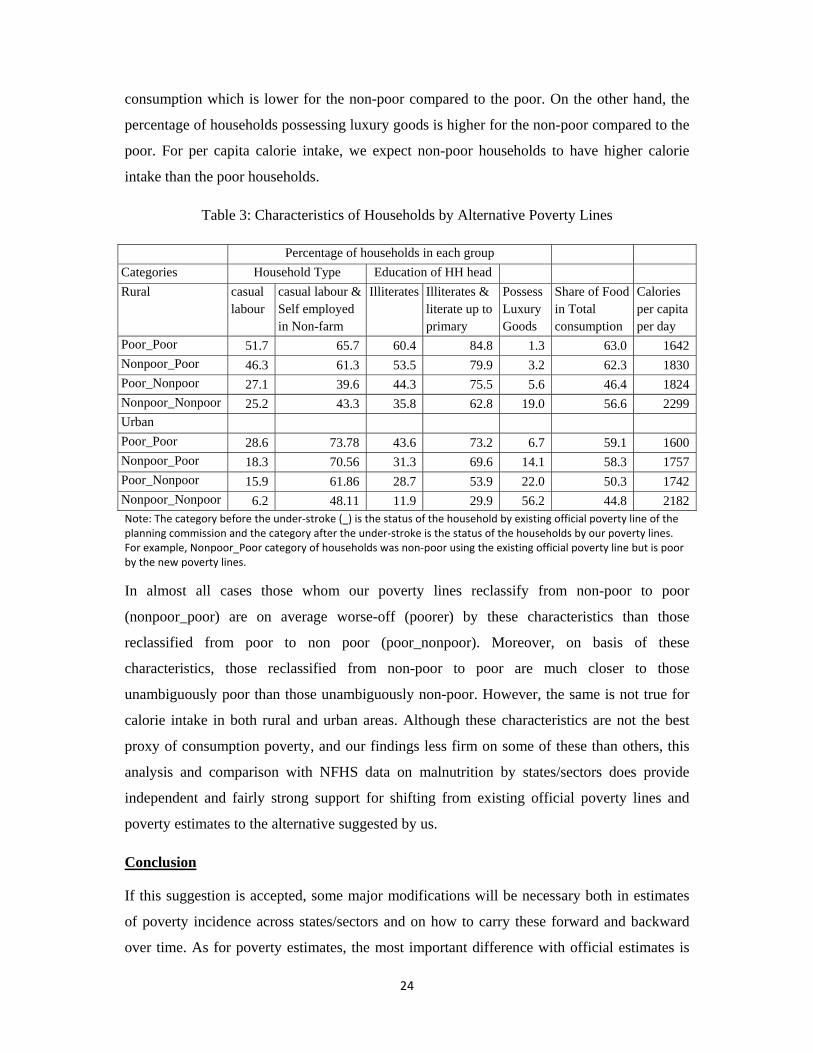
consumption which is lower for the non-poor compared to the poor. On the other hand, the
percentage of households possessing luxury goods is higher for the non-poor compared to the
poor. For per capita calorie intake, we expect non-poor households to have higher calorie
intake than the poor households.
Table 3: Characteristics of Households by Alternative Poverty Lines
Percentage of households in each group Categories Household Type Education of HH head Rural casual
labour casual labour & Self employed in Non-farm
Illiterates Illiterates & literate up to primary
Possess Luxury Goods
Share of Food in Total consumption
Calories per capita per day
Poor_Poor 51.7 65.7 60.4 84.8 1.3 63.0 1642Nonpoor_Poor 46.3 61.3 53.5 79.9 3.2 62.3 1830Poor_Nonpoor 27.1 39.6 44.3 75.5 5.6 46.4 1824Nonpoor_Nonpoor 25.2 43.3 35.8 62.8 19.0 56.6 2299Urban Poor_Poor 28.6 73.78 43.6 73.2 6.7 59.1 1600Nonpoor_Poor 18.3 70.56 31.3 69.6 14.1 58.3 1757Poor_Nonpoor 15.9 61.86 28.7 53.9 22.0 50.3 1742Nonpoor_Nonpoor 6.2 48.11 11.9 29.9 56.2 44.8 2182Note: The category before the under‐stroke (_) is the status of the household by existing official poverty line of the planning commission and the category after the under‐stroke is the status of the households by our poverty lines. For example, Nonpoor_Poor category of households was non‐poor using the existing official poverty line but is poor by the new poverty lines.
In almost all cases those whom our poverty lines reclassify from non-poor to poor
(nonpoor_poor) are on average worse-off (poorer) by these characteristics than those
reclassified from poor to non poor (poor_nonpoor). Moreover, on basis of these
characteristics, those reclassified from non-poor to poor are much closer to those
unambiguously poor than those unambiguously non-poor. However, the same is not true for
calorie intake in both rural and urban areas. Although these characteristics are not the best
proxy of consumption poverty, and our findings less firm on some of these than others, this
analysis and comparison with NFHS data on malnutrition by states/sectors does provide
independent and fairly strong support for shifting from existing official poverty lines and
poverty estimates to the alternative suggested by us.
Conclusion
If this suggestion is accepted, some major modifications will be necessary both in estimates
of poverty incidence across states/sectors and on how to carry these forward and backward
over time. As for poverty estimates, the most important difference with official estimates is
25
that, like Deaton’s earlier, our estimates show much larger rural-urban difference but less
concentration of either rural or urban poverty in a few states. Although construction of our
new poverty lines preserves the official estimate of All-India urban poverty incidence in
2004-05, there are significant changes at state level. Andhra Pradesh, Chattisgarh, Delhi,
Karnataka, Kerala, Madhya Pradesh, Maharashtra, Orissa, Rajasthan, Tamilnadu and
Uttarakhand (accounting for 69% of urban poor by official estimates) show less poverty with
our poverty lines while other states, particularly North-East states, show more. As result, the
interstate coefficient of variation in urban poverty falls from 0.75 by official estimates to 0.41
with our poverty lines. Our rural poverty estimates are higher than official in almost every
major state; and again interstate coefficient of variation in this is lower, mainly because our
estimates are more than double in eight states (Andhra Pradesh, Gujarat, Delhi, Himachal
Pradesh, Jammu & Kashmir, Karnataka, Punjab and Rajasthan) all with relatively low official
poverty. An important consequence of this is that we report no case of a state having higher
urban poverty incidence than rural, unlike official estimates that show higher urban poverty
than rural in a number of states. However, the broad clustering of states by high poverty
(Bihar, Chattisgarh, Jharkhand, Madhya Pradesh and Orissa), low poverty (Haryana,
Himachal Pradesh, Jammu & Kashmir, Kerala and Punjab) and the rest remains unchanged.
On how to carry these new poverty lines forward, there are two alternatives consistent with
the method used here. The first is to carry forward the new state/sector specific poverty lines
with state/sector specific inflation indices derived as far as possible from NSS unit values,
and using CPIAL/CPIIW only for commodity groups where unit values are not available. The
state/sector specific commodity group weights could either be those from the actual
consumption pattern near each poverty line group from the previous NSS large sample or
Fisher indices could be used to combine weights from both the previous and current NSS
round. The second method would be to carry forward only the All-India urban poverty line in
this manner, and then derive state/sector specific poverty lines corresponding to this by using
current commodity group weights and spatial indices, as is done for 2004-05 in calculations
for this paper. The advantage of the first method is that this would preserve the current
practice of deriving All-India lines from state-specific lines obtained by updating these
independently. The second method does not do this, so inflation factors could differ, but has
the advantage that spatial differences in poverty lines would be based entirely on current
prices and weights, and thus be more up to date. The second method would be closer to the
approach followed in this paper. These alternatives can also be used to carry poverty lines
26
backward, although additional complications would arise since NSS unit values are available
only from 1983 and URP and MRP measures in earlier rounds involve different weights. This
paper does not provide past estimates, but actual past decline in rural consumption poverty
was clearly less than official, in part because of deficiencies of CPIAL and in part because
the present method has not captured actual changes in consumption patterns over time.
References:
Chatterjee G S and N Bhattacharya (1974), “Between State Variations in Consumer Prices and Per Capita Household Consumption in Rural India”, in T N Srinivasan and Pranab Bardhan (eds), Poverty and Income Distribution in India, Statistical Publishing Society, Calcutta
Deaton (2003), “Prices and Poverty in India, 1987-2000”, Economic and Political Weekly, January 25
Deaton (2008), “Price Trends in India and Their Implications for Measuring Poverty”, Economic and Political Weekly, 9 February,
Deaton Angus and Jean Dreze (2009), “Food and Nutrition in India: Facts and Interpretation” Economic and Political Weekly, February 14
Deaton and Tarrozi (2000), “Prices and Poverty in India” Research Programme in Development Studies, Princeton University, Processed
Dev, Mahendra (2005), “Calorie Norms and poverty”, Economic and Political Weekly, February 19
FAO (2008), “The State of Food Insecurity in the World”, Food and Agriculture Organisation, Rome
Gaurav Datt and Martin Ravallion, "Why Have Some Indian States Done Better Than Others at Reducing Rural Poverty?", Economica, Vol. 65, No. 257, Feb., 1998, pp.17-38.
Government of India (1979), “Report of the Task Force on Projections of Minimum Needs and Effective Consumption Demand”, Perspective Planning Division, Planning Commission
Government of India (1993), “Report of the Expert Group on Estimation of Proportion and Number of Poor”, Perspective Planning Division, Planning Commission
Mahal, A., Karan, A.K. (2007), “Adequacy of dietary intakes and poverty in India: Trends in the 1990s”, Economics and Human Biology (2007), doi:10.1016/j.ehb.2007.10.001
Minhas B S, L R Jain, S M Kansal and M R Saluja (1988), “Measurement of General Cost of Living for Urban India-All India and Different States”, Sarvekshana, 12
International Institute for Population Sciences (IIPS) and Macro International (2007), “National Family Health Survey (NFHS-3), 2005–06” Mumbai: IIPS.
Patnaik Utsa (2007), “Neoliberalism and Rural Poverty in India”, Economic and Political Weekly, July 28
27
Saluja M R and Bhupesh Yadav (2008), “Construction of Rural and Urban Consumer Price Indices for India”, India Development Foundation
Sen Pronab (2005), “Of Calories and Things: Reflections on Nutritional Norms, Poverty Lines and Consumption Behaviour in India” Economic and Political Weekly, October 22
Srinivasan T N (2007), “Poverty Lines in India: Reflections After the Patna Conference”, Economic and Political Weekly, October 13