Prepard by: Fleet Technology Limited 311 Legget Drive Kanata, ON K2K 1Z8 In Association with: Operational Dynamics TP XXXXXE FLOODING PROTECTION OF RO-RO FERRIES PHASE IV Prepared for: Transportation Development Centre Transport Canada March, 1999
Transcript
Prepard by:
Fleet Technology Limited 311 Legget Drive
Kanata, ON K2K 1Z8
In Association with:
Operational Dynamics
TP XXXXXE
FLOODING PROTECTION OF RO-RO FERRIES PHASE IV
Prepared for: Transportation Development Centre
Transport Canada
March, 1999
ii
The views expressed in this report are those of Fleet Technology Limited, and are not necessarily representative of those of the Transportation Development Centre of Transport Canada. Fleet Technology Limited does not endorse any of the products or manufacturers named in this report. Trade names or manufacturers’ names appear only because they are required to document the study described in this report. Un sommaire français se trouve avant la table des matières.
iii
PDF English
iv
PDF French
v
EXECUTIVE SUMMARY This report presents the results of a project which has drawn together two strands of research into the capsize safety of Canadian ferries. The first of these conducted analyses of a set of specific vessel designs against the current SOLAS criteria. The second used experiments on a range of idealized ship configurations, initially to explore the limitations of these criteria and subsequently to identify a more promising analytical method for future safety evaluations. This Static Equivalent Method (SEM) has now been applied to the set of real designs, to confirm its potential applicability and act as the basis for a “risk index” for each ferry service. The first important conclusion of this project has been that the inherent assumptions involved in using of the SEM are valid for most “real” critical damage stability conditions. Although ferry accidents resulting in capsizes have been relatively rare, the resulting loss of life is always heavy. Reducing capsize risk will therefore make a significant contribution to public safety, real and perceived. On the other hand, excessive standards can lead to costs which are for new vessels, and even more so when modification or replacement of existing ships is required. It is important to select appropriate requirements, based on generally accepted risk management approaches. The project has outlined the type of factors that should be included in ferry risk assessment. As ferries operate on specific routes, consistent levels of safety (or risk) will only be attained if their safety requirements are also route-specific. In principle, consideration should be given to both the probability of an accident and the severity of its consequences, but a full analysis of all the factors involved fell outside the scope of this study. Instead, attention was focused on two key factors of wave climate and ship loading, and their combined influence on relative risk.
Table 1 – Risk Index for Capsize under SOLAS 90 Damage Assumptions
Table 1 summarizes the results of the analyses. Under the SOLAS 90 loading and damage assumptions, the critical wave heights for capsize are as shown; these relate to the survival probabilities shown as a risk index in the third column. It can be seen that significantly different levels of risk exist within the Canadian fleet. Further, it was found that risk varies considerably according to the time of year, due to differences in many of the input parameters; while actual loadings for the ferries studied are even more important, and their statistical distribution differs considerably from IMO/SOLAS assumptions. This study does not draw any conclusions regarding an acceptable risk index for Ro-Ro ferries when analyzed in this manner, as this should only be done as part of a more comprehensive study. However, it does provide a number of recommendations as to how this could be done in the future. Potential tie-ins to IMO’s work on revising the SOLAS criteria are noted, and directions for future stability researches are proposed.
2. REVIEW OF PREVIOUS WORK ....................................................................................2
2.1 Overview........................................................................................................................2 2.2 Requirements of SOLAS 90. ..........................................................................................2 2.3 Results of Residual Stability (Phase 1) study...................................................................4 2.5 Overview of the Static Equivalent Method......................................................................5 2.6 Validation of the Static Equivalent Method....................................................................7 2.7 Application to present project.........................................................................................8
3. CALCULATION AND REVIEW OF BASIC HYDROSTATIC DATA .......................12
4. CALCULATION OF SEM PREDICTIONS...................................................................14
4.1 Application of Methodology ......................................................................................14 4.2 Summary of Results...................................................................................................14 4.3 Discussion of Prediction Accuracy .............................................................................15
5. DEVELOPMENT OF RISK ASSESSMENT APPROACH...........................................16
5.1 Principles of Risk Assessment ....................................................................................16 5.2 Probability of occurrence of collision .........................................................................16 5.3 Severity of collision damage.......................................................................................17 5.4 Probability of Capsize ................................................................................................18 5.5 Consequences of Capsize...........................................................................................19 5.6 IMO Future Approach ...............................................................................................19
6. COMPILATION OF OPERATIONAL AND ENVIRONMENTAL DATA.................20
6.1 General......................................................................................................................20 6.2 Wave Data.................................................................................................................20 6.2 Operational Data .......................................................................................................22
7.1 Components of Risk Index ...........................................................................................26 7.2 Relative Risk Levels from SEM Approach....................................................................27 7.3 Comparisons with Other Criteria ..................................................................................30
7.3.1 SOLAS Calculations...........................................................................................30 7.3.2 Stockholm Agreement Calculations ....................................................................32
viii
CONTENTS (CONTINUED)
8. CONCLUSIONS AND RECOMMENDATIONS ...........................................................33
8.1 Summary and Conclusions............................................................................................33 8.2 Recommendations ........................................................................................................34
LIST OF FIGURES Figure 2.1: Illustration of SOLAS 90 Damaged Stability Criteria. ...............................................3 Figure 2.2: SEM Calculation Principles ......................................................................................6 Figure 2.3: Predicted and Measured Capsize Wave Heights, All Phase I Data .............................7 Figure 2.4: Predicted and Measured Capsize Wave Heights, Phase II..........................................8 Figure 6.1: Wave Heights – Bay of Fundy ................................................................................21 Figure 6.2: Average Monthly Loadings for Ship 1 ....................................................................23 Figure 6.3: Average Monthly Loadings for Ship 2 ....................................................................23 Figure 6.4: Average Monthly Loadings for Ship 4 ....................................................................23 Figure 6.5: Average Monthly Loadings for Ship 6 ....................................................................24 Figure 6.6: Average Monthly Loadings for Ship 9 ....................................................................24 Figure 6.7: Occurrences of Cargo Deadweight Levels for Month of April, Ship 4 .....................24 Figure 6.8: Effect of Loading on Critical Ht/Probability of Exceedence.....................................25 LIST OF TABLES Table 2.1: Damaged Stability Summary ......................................................................................4 Table 2.2: Ship Characteristics ...................................................................................................9 Table 2.3: Damaged Stability Summary ....................................................................................10 Table 3.1: Comparisons of Basic Hydrostatics ..........................................................................12 Table 4.1: Summary of SEM Results for Worst SOLAS Condition............................................14 Table 4.2: Checks of Worst Damage Condition .........................................................................15 Table 6.1: Probabilities of Exceedence – Critical Wave Heights ................................................21 Table 7.1: SEM Measures of Risk .............................................................................................27 Table 7.2: Variation of Risk with Season for Ship 4...................................................................28 Table 7.3: SEM Risk Index .......................................................................................................28 Table 7.4: Relative Rankings [Refs. 1, 2]...................................................................................30 Table 7.5: Comparative Indications of Risk ...............................................................................31 Table 7.6: Stockholm Agreement (SOLAS 90+50) Requirements vs SEM................................32 Table 7.7: Comparative Wave Heights, Stockholm Agreement and SEM...................................33
x
GLOSSARY ACRONYMS: IMD Institute for Marine Dynamics IMO International Maritime Organization LL Load Line MSC Marine Safety Committee of the IMO SLF Stability and Load Lines, and Safety of Fishing Vessels, Sub-Committee of MSC RO-RO Roll On-Roll Off SEM Static Equivalent Method SNAME Society of Naval Architects and Marine Engineers SOLAS Safety of Life at Sea SSB Ship Safety Branch TDC Transportation Development Centre U.K. United Kingdom TERMINOLOGY ∇ Displaced Volume of the ship AWL Area of the waterline B Centre of Buoyancy Cel Centre of gravity D Displacement (weight) of the ship dT Sinkage of the ship Fad Centroid of the undamaged waterplane FWLD Centre of flotation of the damaged waterline G Centre of gravity GM Metacentric Height GZ Righting arm calculated by constant displacement method GZArea Area under righting arm curve h Elevation of water on deck above the mean damaged waterline after sinkage, WL h′ Elevation of water on deck above the static waterline, WLo HS Significant wave height lad Heeling lever due to the total water on deck lel Heeling lever due to elevated water on deck M Righting moment pad Total weight of additional water on deck pel Weight of water elevated above mean sea level � Heel Angle � max, � crit Heel Angle associated with maximum GZ vad Volume of additional water on deck above the waterline WLo vel Volume of water elevated above sea level WLo Static damaged waterline (before sinkage) WL Mean damaged waterline (after sinkage)
1
1. INTRODUCTION Phase IV of the program of work classified under the general heading “Flooding Protection of Ro-Ro Ferries” represents a consolidation of previous research in this program, with other work analyzing the compliance of Canadian ferries with SOLAS 90 damaged stability criteria. The overall objective has been to develop a stability analysis methodology that offers a more appropriate measure of the true safety of such vessels, taking into account both their inherent stability characteristics, and also their operating profile, including the environmental conditions along the route(s) travelled. The project has consisted of seven tasks, listed below: (1) Review of previous work; (2) Development of risk assessment approach; (3) Calculation and review of basic hydrostatic data; (4) Calculation of Static Equivalent Method predictions; (5) Compilation of environmental and operational data; (6) Comparative safety/risk assessment; (7) Report preparation. The report presents the work accomplished in each area, and provides key supporting data in a set of appendices. In order to make the approach somewhat easier to follow, risk assessment is discussed at Section 5, following the description of the basic analyses undertaken using the Static Equivalent Method (SEM).
2
2. REVIEW OF PREVIOUS WORK 2.1 Overview. The two previous programs noted in the Introduction were both sponsored by Transport Canada (TC) with support from the Canadian Ferry Operators Association (CFOA). They can be summarized as follows: • Residual Stability of Ro-Ro ferries. This program of research was commenced in
1989 to examine the compliance of eight Canadian ferry designs with the damaged stability requirements that were incorporated in SOLAS 90. This was a multi-phased program, which included both deterministic and probabilistic approaches to the rule applications. Only one of the vessels had been designed to these standards, and as was expected, the degree of compliance varied, with some ships failing to meet one or more of the criteria. In the present investigation, it is principally the deterministic results covered by the first phase of the above program which are taken into account, though probabilistic approaches are also reviewed. Results are provided in references [1, 2
• Flooding Protection of Ro-Ro ferries. This program of research was commenced in
1991 to further examine the destabilizing effect of water on the vehicle decks of Ro-Ro ferries designed to meet the damaged stability rules of SOLAS 90. The program started with model tests of “idealized” large and small ferries to determine the limit of their capsize survivability in waves when damaged and open to the sea amidships (Phases I, Iext, and II). The results, which are presented in full in Refs. 3–6, were applied in Phase III to test the validity of an analytical method for determining such survivability originally developed by Strathclyde University, which is known as the Static Equivalent Method (SEM). Good correlation was found between the model and analytical results (ref [7]).
Following on from the reasonable validation of the static equivalent method (SEM) found in Phase III, the next step has been to apply this technique to the ferry designs originally investigated in the first program, to determine whether the SEM approach provides a better basis than SOLAS 90 compliance for judging the survivability of a damaged Ro-Ro vessel in a seaway. This has been the main objective of the present study.
2.2 Requirements of SOLAS 90. The passenger ship damaged stability requirements contained in SOLAS 90 were adopted from IMO Resolution MSC.12(56) and came into force on April 29, 1990, applicable to new ships on international voyages - Convention vessels. These same standards were later adopted by Transport Canada for domestic voyages, and came into force on April 1, 1991. Again, they are applicable only to new (non-Convention) domestic ships. In summary, SOLAS 90 addresses the residual stability requirements of the GZ diagram in the damaged
3
condition and includes minimum requirements for; the residual righting lever, positive range of stability and area under the righting arm curve. These are defined in the following Figure 2.1, taken from [1], which illustrates the requirements of a typical righting arm curve for a compliant ship in the final condition after damage.
Figure 2.1: Illustration of SOLAS 90 Damaged Stability Criteria.
4
2.3 Results of Residual Stability (Phase 1) study. Phase 1 of the Residual Stability Program investigated the degree of compliance of eight Canadian ferry designs against the deterministic criteria defined above. In all cases, pre-1990 designs were chosen for this investigation, spanning the full range of vessel sizes in service in Canadian waters, and having up to three compartment floodable subdivision. The standard SOLAS damage criterion was used, and worst case conditions for the extent of flooding were found by extensive analyses. The worst loading condition was chosen for the determination of residual stability – this was generally the Full Load Departure condition, but for Ships 6 and 8 Full Load Arrival was worse. The results of the study and the comparisons with the SOLAS 90 criteria are provided in the following Table 2.1 derived from [1].
Table 2.1: Damaged Stability Summary Ship Max Heel Act. Heel Req. Range Act. Range Req. GZa Act. GZa Req. GZmax Act. GZmax
Note: Non-compliant results are bolded The table shows that, of the eight designs investigated, three failed to meet the full range of SOLAS 90 criteria. In the case of the five compliant designs, there was considerable variability in the degree to which each of the criteria was met. For example, in the case of GZ area, the “best” ship had twelve times the required area under the GZ curve, while none of the others were as much as four times better. It should be mentioned that the above investigations also studied intermediate stages of flooding, as required by SOLAS 90; and multiple free surfaces, where SOLAS requires consideration of only a single free-surface. The compliant vessels remained compliant during intermediate stages, except in the case of Ship 6, which demonstrated a slight transitional intermediate stability problem. 2.4 Overview of the Flooding Protection Program The SOLAS 90 criteria provides for residual stability after damage to the hull but does not address specifically the destabilizing effect of water ingress onto the vehicle deck. It was this phenomenon which is considered to have caused the loss of the “Herald of Free Enterprise” and the “European Gateway”, and which may have contributed to the “Estonia” disaster. Several international programs were undertaken to explore this particular concern. Transport Canada initiated the Flooding Protection Program in 1991 to investigate the effects of water entry onto the car deck, and means of mitigation.
5
In this multi-phased program, tank tests were carried out using simplified models of two sizes of ferries, as follows: • Phase I Length 160m Displacement 11,650 t • Phase II Length 85m Displacement 4,450 t
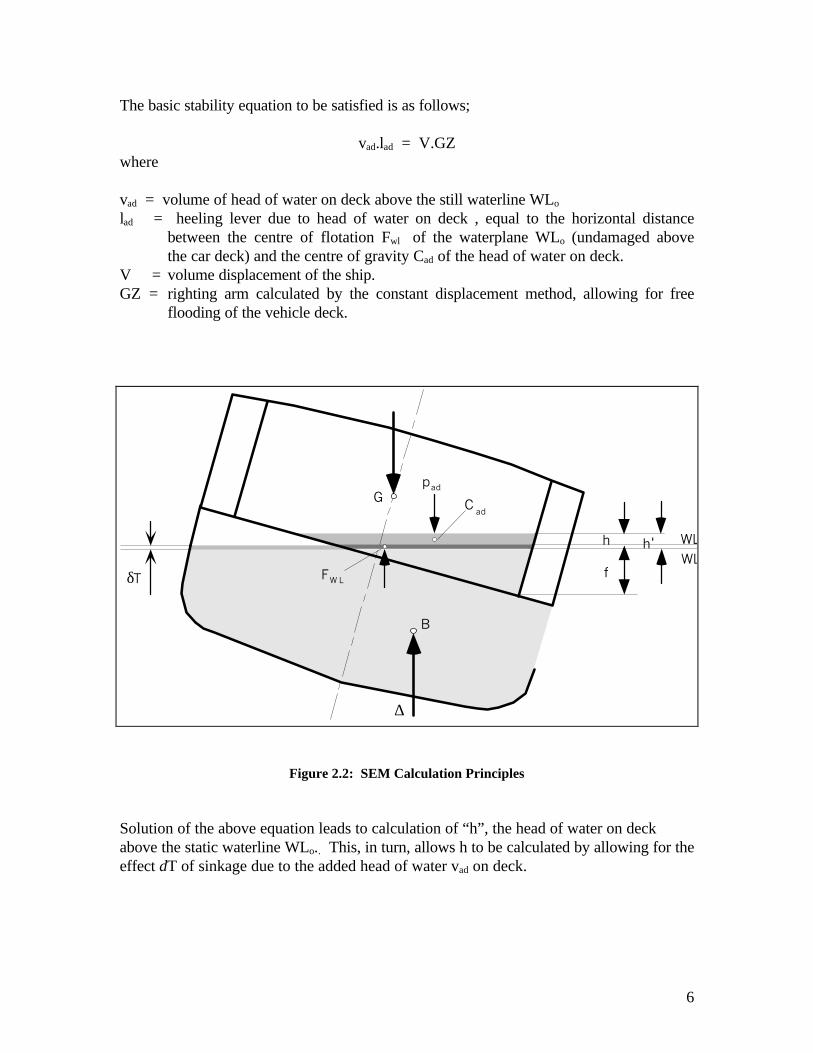
The models were subjected to an extensive program of tank testing, in irregular waves up to 7m, with varying degrees of midship flooding damage resulting in varying residual freeboards down to the margin line. The principal factors under investigation were, • Effect of water on deck; • Influence of centreline casing; • Effect of freeing ports; The test results showed that there was a clearly defined boundary between safe and capsize conditions, dictated by the volume of water accumulated on the deck. Capsize also seemed to be a hydrostatic process. It was also found that survivability was usually enhanced by the removal of the centreline casing, and by the use of non-return freeing ports. These results prompted a search for an analytical expression of damaged survivability of a Ro-Ro in a seaway, which could take into account configuration differences between ferry designs. The outcome is covered in the next sub-section. Meanwhile, results from similar programs of work elsewhere led a number of European nations to introduce additional regional requirements for safety, related to the possibility of water entering the vehicle deck. Often referred to as SOLAS 90+50, this requires vessels either to meet the SOLAS 90 criteria with a nominal 50cm of water on the vehicle deck (reduced with increasing residual freeboard), or else to use model tests in a representative sea state to show that the damaged ship would be expected to survive. Canada (and the US) have not adopted similar requirements, due to concerns that they may be (a) unnecessarily stringent, and (b) equally unrepresentative of “true” safety levels. 2.5 Overview of the Static Equivalent Method In its present form, the Static Equivalent Method (SEM) of predicting the brink of capsize due to water on the car deck was reported in Ref. 8. The method postulates that the condition of capsize can be predicted in hydrostatic terms as being the volume of water on the deck which would create an upsetting moment equal to the maximum righting lever moment as defined by GZmax in the vessel’s residual stability diagram. The SEM method completes the predictive process by providing an explicit relationship between the head of the volume of water on the deck and the exterior wave height. Diagrammatic representation of the forces at work is provided in Figure 2.2, taken from Ref. 7.
6
The basic stability equation to be satisfied is as follows;
vad.lad = V.GZ where vad = volume of head of water on deck above the still waterline WLo lad = heeling lever due to head of water on deck , equal to the horizontal distance between the centre of flotation Fwl of the waterplane WLo (undamaged above the car deck) and the centre of gravity Cad of the head of water on deck. V = volume displacement of the ship. GZ = righting arm calculated by the constant displacement method, allowing for free flooding of the vehicle deck.
G
f
h
δT
Cad
FW L
WL
WL
B
pad
∆
h'
Figure 2.2: SEM Calculation Principles Solution of the above equation leads to calculation of “h”, the head of water on deck above the static waterline WLo.. This, in turn, allows h to be calculated by allowing for the effect dT of sinkage due to the added head of water vad on deck.
7
In order to provide a prediction of the capsize condition, it is necessary to relate the elevation of the internal water surface above mean sea level in terms of the sea state that will generate this. The SEM provides a connecting equation of the following form:
h = C.Hsx
where C is a coefficient (determined experimentally at 0.085) and Hs is the significant wave height which is raised by the exponent x (determined experimentally at 1.3. 2.6 Validation of the Static Equivalent Method The results obtained from the model tests conducted in Phases I and II of the Flooding Protection Program, as described in Section 2.4, were used to validate the Static Equivalent Method. To that end, the SEM was utilized to predict the capsize wave-height corresponding to particular capsize tests conducted with the models. The predicted and measured wave-heights were then compared as shown in the following Figures 2.3 and 2.4, taken from Ref 7.
Phase I and Ix Data Set
0
1
2
3
4
5
6
7
0 0.5 1 1.5 2 2.5 3 3.5 4 4.5 5
Predicted Wave Height (metres)
Mea
sure
d W
ave
Hei
gh
t (m
etre
s)
Lowest Capsize
Highest Safe
Predicted Line
Figure 2.3: Predicted and Measured Capsize Wave Heights, All Phase I Data
8
0
1
2
3
4
5
6
7
0 0 .5 1 1 .5 2 2 .5 3 3 .5 4
Predicted Wave Height (metres)
Mea
sure
d W
ave
Hei
gh
t (m
etre
s)
L o w e s t C a p s ize
H ighes t Sa f e
P red i c t ed L i ne
Figure 2.4: Predicted and Measured Capsize Wave Heights, Phase II
It should be noted that the experimental program gave low and high wave heights which straddled the actual capsize condition. These low and high test results are plotted as vertical bars on the figures, with the actual capsize point being located somewhere within each bar. As can be seen in the above two figures, almost all the measurements bracket the predicted value for both the models tested, with only few exceptions. This correspondence between prediction and measurement validates the SEM method and its ability to account for a range of ship design variables in providing a single, simple approach to capsize prediction due to water on deck. 2.7 Application to Present Project The confidence established in the ability of the Static Equivalent Method to predict capsize within the boundaries of the investigated scenarios, suggested that the SEM approach would provide a systematic means of evaluating the survivability of a damaged Ro-Ro ferry. Accordingly, the decision was taken to apply the SEM method to re-evaluate the eight designs originally examined for compliance with the SOLAS 90 criteria as described in Section 2.3 above. It was believed that this would provide a more systematic picture of the relative safety of these designs than that which SOLAS 90 suggests. Stability data for all the ships was available in electronic format from Transport Canada. These data files were used as the basis for the subsequent analysis, to ensure that results would be truly comparable. Checks of the “old” and “new” hydrostatics derived from the files were conducted to provide further assurance of this.
9
2.7.1 Configuration Issues It was recognized immediately that applying the SEM to real, rather than idealized ships would raise a set of applicability issues that would need to be addressed. The first of these was basic ship configuration. Table 2.2 below summarizes the characteristics of the set of vessels.
Table 2.2: Ship Characteristics SHIP VEHICLE DECK
CONFIGURATION CASING CONFIGURATION
1 Open, full-height bulwarks Centre 2 Open, full-height bulwarks Centre 3 Closed Centre 4 Closed Side 5 Cargo hold n/a 6 Closed Centre 7 Closed Centre 8 Closed Centre 9 (see below) Closed Centre The ninth ship was added to the original set for two reasons. Firstly, it represents an important new class, introduced since the earlier evaluations, which will be in use for many years to come. Secondly, a highly idealized version of the hull was used in the physical model testing during Phase I of this program, and it was, therefore, expected to provide some interesting comparative data. It can be noted that the basic SEM is not intended to handle open decks, however, it was considered that the results of the Phase 1 and II work suggested that this might still be reasonably valid. These ship configurations can be approximated to a closed deck with permanently open freeing ports. Work in Phases I and II showed that the damaged stability for a ship with permanently open freeing ports is roughly the same as a closed ship with no freeing ports. The analysis results were thus expected to be indicative of survivability with water on deck, and of the sea state required to develop a critical condition. It was recognized that in the event that the critical condition (see below) implies waves overtopping the bulwarks, the correctness of the results would diminish considerably. However, given that the ships in question operate on fairly sheltered routes, it is considered worthwhile to proceed with their analysis. Ship 5 is unlike the other ships, having no continuous vehicle deck but rather a part-length superstructure with no watertight subdivision. In principle, this could be analyzed using the SEM, however, in looking at the damaged stability data it appeared unlikely that any useful information would be produced. After discussion with the Scientific Authority is was decided to remove this ship from the subsequent analyses.
10
2.7.2 Damaged Stability Characteristics Table 2.1 is repeated below with the addition of ship 9 and of some other information that was also expected to be of some importance to the SEM analyses. For ship 9, the case selected for analysis was chosen from the trim and stability book on the basis of having the worst combination of GZ area and residual freeboard, as explained below. For ship 3, the 2-compartment condition used as the base case in the earlier analyses was considered to be too unstable to provide results of any interest. The worst 1-compartment case was therefore selected instead. As can be seen from the table, this was still non-compliant with the SOLAS residual stability criteria. The important quantities for the successful application of the basic SEM are the trim, freeboard, and to a much lesser extent the heel. None of the ships has significant damaged heel angles.
Table 2.3: Damaged Stability Summary
SHIP Trim (degrees)
Heel (degrees)
Range (degrees)
GZArea (mrad)
GZmax (m)
Freeb'd*
(m) 1 0.06a 2.76 23.9 0.1796 0.684 0.64 2 0.00a 0.05 15.0 0.0551 0.337 1.23 3 1-compt 0.72f 0 12.5 0.009^ 0.07 1.07 4 0.42a 0.00 7.1 0.0065 0.081 0.41 6 0.01f 0.24 19.8 0.0269 0.156 1.61 7 1.28a 2.41 6.9 0.0026 0.033 0.27 8 0.92a 0.41 23.9 0.0383 0.189 1.60 9 1.13a 2.6 20.3 0.072 0.399 0.42 Notes: ^ - Non-compliant results are bolded * -Freeboard is the approximate distance from the equilibrium waterline to the centre of the damage opening at the main (vehicle) deck. The freeboard and trim need to be considered together to assess their likely significance. The SEM relates the critical point for capsize to a build-up of water on deck and the resulting sinkage and heel. If the significant wave height is insufficient to build up this critical volume, then the ship will be safe. The basic build-up equation (the elevation of the internal water surface above the mean external surface) assumes level trim , but in theory should hold for any condition where the bottom of damage opening is wholly or partly below the internal waterline on a continuous basis, and below the external waterline over part or all of a wave cycle.
11
If the ship can be capsized by a volume concentrated only at one end of the ship due to extreme trim, then this approach may not be valid. If the damage gives a residual freeboard at the opening greater than the significant wave height, the approach becomes highly questionable. These situations become more likely for a ship with high residual freeboard or large trim and either high or low stability. In the event, it proved (see Section 4) that neither situation applies for any ship in the sample. It can be noted that most of the ships have their worst damaged stability (as reported above) with their double bottoms intact. It was considered possible that the worst case for the SEM could be with the double bottoms flooded, as the loss of freeboard might outweigh the gain in stability. It was, therefore, intended to check this for at least one ship, as discussed below.
12
3. CALCULATION AND REVIEW OF BASIC HYDROSTATIC DATA As noted at Section 2, electronic format stability data was provided for all the ships to be analyzed. The great majority of the previous analysis was done using the Creative Systems programs BHS/GHS, which was also to be used for the new analyses. However, older versions of the software can give somewhat different results; and, in some cases it appeared that other programs had been used to produce some of the data. Checks were therefore undertaken to ensure that the basic stability data corresponded to the results from previous projects. In most cases, all the basic results were within 1% of the values quoted in previous reports or in the vessel’s Trim and Stability books. This was always true for displacement and KG, while the percentage differences in the stability parameters tended to be larger, given their small relative magnitudes. A few somewhat larger discrepancies were identified, which, in some cases, resulted from errors in the previous analysis (for example using salt water to flood a vessel which operates in the Great Lakes) or from less accurate analytical procedures (using fewer and wider steps in developing the righting arm curves). Some instances were also found where differences arise purely from the software. In many cases, new results were within 0.1% of the old calculations, and frequently they were identical. Some small discrepancies were in the upright (and equilibrium) heel angles, where minor asymmetries in the lightship appeared to have been ignored in the previous analyses, i.e., the initial condition is always assumed upright. None of the discrepancies identified would have affected the conclusions of the previous study or the relative ranking of the ships using either SOLAS approach. A summary of the values produced by the previous and current analyses is provided in Table 3.1.
NOTES:Ship #1) No significant differences.Ship #2) Source of GM difference unidentified.Ship #3) Minor differences in GM (software), lead to larger changes in small criteria values.Ship #4) Data file believed to be a modification of the original.Ship #6) Damage values change due to incorrect water density in original.Ship #7) Difference in GM software generated (free surface).Ship #8) No significant differences.Ship #9) No significant differences.
Θvanishing∆ GM GZmax GZarea
13
While it would have been possible in almost all cases to use the identical stability information quoted in the previous project, the study has generally preferred to use the most up-to-date version of the analyses. Although this introduces minor divergences from the earlier results, it prevents discrepancies from arising when the study has moved on to explore other options, as discussed in the next sections. The set of stability data that has actually been used in the subsequent analyses is outlined at Appendix A, and electronic versions of the complete data files form another of the project deliverables.
14
4. CALCULATION OF SEM PREDICTIONS 4.1 Application of Methodology The Static Equivalent Method (SEM) is described in full in [7], the final report of the Phase III project, and has been summarized in Section 2. To recapitulate, the method assumes that a vessel will capsize when the moment due to the accumulated weight of water on deck is sufficient to equal the maximum residual righting moment in the damaged condition; i.e., any increase in the weight of water will cause capsize. The key quantities required by the SEM include: • angle of maximum righting arm in the damaged condition; • volume (weight) of water on deck causing loss of stability at this angle; • elevation of internal water surface above mean sea level associated with the above. The second and third of these are not standard direct outputs from stability analysis programs, and so all must be derived from a set of iterative operations on the stability data, in which the ship is heeled to the angle corresponding to its maximum righting arm (damaged) and progressively loaded. The elevation of the water surface is then linked to the significant wave height through an empirical equation, allowing the critical wave height for the capsize condition to be derived. The SEM outputs thus characterize the “stability boundary” in terms of the wave conditions and the ship draft, heel, and trim just prior to capsize. 4.2 Summary of Results The eight ships were all analyzed using the approach outlined above, and the key output data is summarized in Table 4.1. It can be seen that there is a wide variation in the results, with the survivable wave height for the worst ship (Ship 4) being only 7% of that for the best.
Table 4.1: Summary of SEM Results for Worst SOLAS Condition Ship #1 Ship #2 Ship #3 Ship #4 Ship #6 Ship #7 Ship #8 Ship #9
There was some question as to whether the worst damaged condition for SOLAS would also be the worst for the SEM. The SOLAS conditions were mainly for double bottoms remaining intact, which provided smaller righting arms (GZmax and, generally, area) but larger freeboards than the equivalent condition with double bottom flooded. The way in which both quantities combine in the SEM is somewhat different. Therefore, Ships 7 and 8 were reanalyzed with double bottom flooded. The resulting values are as shown in Table 4.2, and it can be seen that the worst SOLAS and SEM cases remain the same. However, this will not necessarily always be true and any future SEM analyses should ensure that they properly identify the worst case.
Table 4.2: Checks of Worst Damage Condition
Ship # Compartments Flooded h (m) Hs (m) h (m) Hs (m)7 Engine Room + Stbd. D.B. 0.0730 0.890
Engine Room + Port & Stbd. D.B. 0.1125 1.24035.1% 28.2%
4.3 Discussion of Prediction Accuracy It is known from previous work (on physical and numerical models) that the SEM predictions are most accurate for ships with centre casings, and for moderate capsize wave heights (refs 7, 8). For higher waves the predictions are generally conservative, probably due in part to the non-linearities in ship response to the waves, and in part to oversimplification of the internal water build-up equation. For the ships with side casings (only Ship 4), SEM predictions are again known to be conservative, though the level of conservatism is likely to be much less for real ships than for models. A combination of these reasons means that the spread of survivable wave heights from worst to best ship is likely to be somewhat greater than that shown in Table 4.1.
The results for Ships 1 and 2 are not considered to be very meaningful. As noted in 2.7.1, these ships have bulwarks rather than a fully-enclosed cardeck, and the elevation of the water presumed trapped on deck significantly exceeds the height of these bulwarks. A different set of inflow and outflow relationships are thus likely to apply. By inspection, it would be more rather than less difficult to build up the water, and the SEM prediction is thus likely to be conservative. The practical significance of the prediction inaccuracy is limited, given that this ship already displays a very high level of safety when compared to its operating wave climate (see Section 6). No account has been taken in any of the analyses of whether the ships have freeing ports, or of whether these are flapped or permanently open. Phases I and II confirmed that flapped freeing ports can improve capsize performance significantly (assuming they function correctly) while open ports have no real safety benefit. Phase III attempted to include freeing port effects in the SEM methodology, but was unable to develop a satisfactory prediction capability.
16
5. DEVELOPMENT OF RISK ASSESSMENT APPROACH 5.1 Principles of Risk Assessment The SOLAS 90 criteria are effectively ‘one size fits all’ requirements. Any Convention ship must meet the same performance levels, irrespective of most design or operational specifics. On of the attractions of the Static Equivalent Method is that it offers an understandable basis for treating safety (or risk) on a more ship- and route-specific basis. Risk can be defined in many ways, but one of the most useful definitions for engineering projects is:
Risk = Probability of occurrence of an event x severity of its consequences In the context of ferry safety, overall risk can be built up from a variety of components, as outlined below: • Probability of occurrence of collision:
= function of (traffic density, navigation control, environmental conditions, human factors)
• Severity of collision damage:
= function of (relative energy of striking ship, structure in way of impact) • Outcome:
(a) probability of capsize = function of (location of impact, loading condition of ship, relative
environmental conditions) (b) loss of life
= function of (time to capsize, lifesaving equipment, human factors)
Some consideration was therefore given as to how each of these components could or should be treated with the information likely to be available. Collision followed by capsize is, of course, only one of a variety of catastrophes which could befall a ferry. However, research following the European disasters suggested that it is the scenario with the highest fatality risk for the passengers. As reported in Ref. 9, over 40% of the fatality probability for a ‘typical’ ferry comes from collision/capsize, with the next most probable scenario, vehicle deck fire, contributing only 12%. 5.2 Probability of Occurrence of Collision
17
As indicated previously, the probability of occurrence of a collision involving a ferry (or other vessel) is a function of the traffic density, navigation control systems, and environmental conditions along its route, and of human factors, such as the level of training of its bridge crew. None of these is accounted for in any versions of the SOLAS criteria; collision probability is effectively assumed to be equal for all Convention ships. The same applies under the Canada Shipping Act for domestic vessels, except that less severe criteria may continue to be accepted for such vessels (though this is believed to have had more to do with climate issues). In principle, it would be possible to include collision probability in an overall risk index either using actual accident statistics for the route, or (more probably) using simulation techniques. Fortunately, serious accidents are sufficiently rare that statistics for any given route are extremely unreliable. Recently, simulation techniques have provided an alternative means of assessing at least relative probability [Ref. 10], though they cannot yet be considered “state-of-the-practice” and probably require further development and validation before becoming so. If it is desired to include collision probability in any current relative safety assessments, this could be done using general traffic statistics; comparing ship passings/crossings numbers with (for example) those in the North Sea or Baltic on an order of magnitude basis. A still more qualitative basis has been employed in the current study, as noted at Section 6. 5.3 Severity of collision damage The severity of the damage resulting from any collision will be related to the relative energy of the striking ship (i.e., kinetic energy in the direction of impact). Thus, both the numbers of ship movements and their relative sizes become important. A ferry operating out of a major fishing port, or in a popular recreational area, may have a relatively high collision probability but a low severity index, the small craft being the ones really at risk. The structure that is impacted and the shape of both ships will also be of importance, as was seen in the “European Gateway” collision where the bulbous bow and raked stem above the waterline created two separate holes [Ref. 11]. Current standards, including SOLAS 90, assume that a damage opening in a larger ship will be bigger than that in a smaller one. Whether or not this is justified for world-wide trade, it may be less so on a specific ferry route where for the same collision the heavier structure of a larger shipmight be expected to have greater robustness than the lighter scantlings of a small one.
18
The “crashworthiness” of different ship structural configurations is an extremely complex area, in which research is still at a very preliminary level. In the current study, no attempt has been made to differentiate between any of the ships analyzed, and they have been assumed to have “SOLAS damage” throughout (as was also done in all previous projects, refs [1-6]). In future, the types of simulation noted at 5.2 could be extended to cover at least the 'input' side of the severity question. 5.4 Probability of Capsize Any collision will have economic costs, but the critical accident scenario from a regulatory standpoint is that which will put large numbers of lives in danger through the loss of the stricken ship. The probability of capsize (or foundering) will be determined by the location of the damage, the loading condition of the ship, and the prevailing environmental conditions. None of these factors is considered in SOLAS 90 (using the deterministic approach). Although location and loading condition are factors in the SOLAS probabilistic method (IMO A.265), this is done in a crude form and based on data for of limited, or at least unproven, validity for ferries. Environmental conditions can be taken into account in the Stockholm Agreement model test option (the North West European regional approach to SOLAS), and many existing ferries have been checked against their nominal design wave using this option. The design wave is either 4m, or the wave height exceeded no more than 10% of the time, whichever is less for the service in question. The SEM treats wave climate explicitly, providing a prediction of the significant wave height which will be associated with a 50% probability of capsize in a given damage condition. The approach could be combined with the standard SOLAS probabilistic method if desired, and proposals have been made to IMO to do this [Refs. 12, 8]. However, in this project it has been decided to treat two of the important variables, ship loading and wave climate, in a more rigorous fashion while leaving the damage location as part of the overall collision challenge (probability, location, severity) for consideration elsewhere. These elements of the study are discussed at Section 6. It can, of course, be noted that many ships have several load lines, which are assigned on a seasonal basis nominally related to the variation in environmental conditions. In principle, the SEM could be used to check whether the traditional spread of permissible draughts produces roughly comparable levels of risk in the damaged condition. A final point regarding the probability of capsize is that the build-up of water on deck occurs much more rapidly for the case when the ship is beam-on to the waves, with the hole facing the oncoming wave train. This is both the SEM and “Stockholm Agreement” condition, but will obviously only be found in a certain percentage of accidents. More research would be required to develop a complete picture of the sensitivity of overall risk to this effect.
19
5.5 Consequences of Capsize If a damage event is such that loss of the ship may ensue, the resulting loss of life will be related to the time to capsize, the nature of the lifesaving equipment available, the environmental conditions, and a range of human factors. The current international regulatory regime requires that the lifesaving equipment should be able to evacuate those on board within 30 minutes. The very limited number of exercises which have been undertaken suggest that this is based on a very optimistic view of how rapidly the crew and passengers could be mobilized under the best of circumstances, and with insignificant wave heights. Some efforts have been made to use the SEM to predict probable time to capsize under different wave climates [13], with the implication being that the risk index could be extended to include this. However, since the required evacuation time will also be a function of wave height, and since the uncertainties in all aspects of this issues are so great, this seems to represent a less promising line of approach for the time being. In this study, it has been assumed that, if the combination of circumstances is likely to produce a capsize, then there will be a very large number of casualties. No attempt has been made to differentiate between the sample ships on this basis. 5.6 IMO Future Approach Some of the issues discussed may, in future, be incorporated in revisions to the SOLAS probabilistic damaged stability criteria which is currently under development. Some of the relevant working papers have been reviewed; for example [Ref. 14] and [Ref. 15]. It appears from these that limited account is being taken of the specifics of the Ro-Ro problem, the underlying data being that used in the original development of IMO Resolution A.265 (which mainly included cargo vessels). Limited validation on ferries (or any passenger vessels) has yet been undertaken.
20
COMPILATION OF OPERATIONAL AND ENVIRONMENTAL DATA 6.1 General As noted in Section 5, it was decided to explore the influence of risk on two of the parameters expected to be of most importance, namely, wave conditions along the route and expected vessel loadings. These two parameters raise quite separate questions for safety analysis, since the former can be expected to remain relatively consistent over the life of a given service, while the latter may alter radically as a result of economic and infrastructure changes. For example, Ship 3 has now been replaced altogether by a bridge, but during its construction carried unprecedented volumes of heavy truck traffic associated with the construction activities. Thus, in assessing the acceptability of the risk level for any ship on a given service, some assumptions regarding through-life traffic volume may be necessary, and their validity will need to be tracked over the life of the ship. However, regardless of how loading is treated in future, it is necessary to use historical data in assessing what levels of risk have been present (and presumably accepted) in the past. Introducing any new measure of safety should only be done if the new metric can be calibrated against past practice. 6.2 Wave Data One of the key pieces of information for a relative risk analysis is the wave statistical data for the routes of each of the ferries under evaluation. A smaller cumulative probability of occurrence (or longer return period) for the critical wave height implies a lower risk of capsize. The Canadian wave climate atlases [Ref. 16] have been used to construct some of the necessary statistical distributions for some of the routes on which the sample of ships operate. An example is shown in Figure 6.1, and a full set for all the routes is provided in Appendix B. Data has been shown both on an annualized and a seasonal basis. For some areas of operation, it was found that wave information was not readily available in this level of detail. This is true for the routes between Vancouver Island and the mainland, where only summary data could be accessed [Ref. 17]. This data was manipulated on the assumption that the shape of the distribution for the routes in question was similar to that found in other coastal areas; as can be seen in Appendix B these are quite similar to each other in the majority of cases. The data available for the Gulf of St. Lawrence was for a somewhat more exposed location than the ferry route under investigation, and so the results will be somewhat conservative.
Table 6.1 shows the annualized, summer, and winter cumulative probabilities of exceedence of the critical wave heights for capsize for each of the ships in its worst damaged condition. (Ship 6 does not operate in winter and this season has been excluded from further analysis). It can immediately be seen: (a) that there are very considerable differences between the ships, and (b) there is considerable variability between seasons.
Table 6.1: Probabilities of Exceedence – Critical Wave Heights
Ship # Area of Operation Hs (m) Spring Summer Fall Winter Annual1 Strait of Georgia 3.863 0 0 0 0 02 Strait of Georgia 2.834 0.07 0 0.19 0.15 0.073 Northumberland Strait 3.469 0 0 0.06 n/a * 0.264 Cabot Strait 0.422 95.4 80 90.8 92.8 83.66 Lake Huron - Georgian Bay 3.192 1.7 0.05 3.9 3.1 1.77 Gulf of St.Lawrence 0.890 51.8 39.9 72.1 70.3 52.58 Bay of Fundy 5.810 0 0 0 0 09 Strait of Georgia 5.456 0 0 0 0 0
* Insufficient data due to sea ice.
% Probability Exceedance
22
6.2 Operational Data The operators of each of the ferries in the set were requested to provide data on the actual loading conditions of their vessels, and a number of sets were provided. The information was not in a completely consistent format, some operators providing information on the numbers of vehicles and passengers, while, in other cases, draught mark data was supplied. Certain assumptions had to be made in order to use either type. Where the traffic data was supplied, it has been assumed that, in other respects, the ship would be operating with the loads of fuel, water, etc., as defined for the original Full Load Departure (or Arrival) condition. This would be expected to provide reasonably conservative stability results. Weights were assumed for standard vehicles, using the same values as the earlier analyses and/or stability books. It should be noted that there is no such thing as a truly standard car, truck, or bus. Values used for each design are (different) estimates, sometimes based on historical data for the route and at other times being drawn from other sources. For vessels which have multiple decks (all of those presented), it was assumed that the trucks would be carried on the lowest whenever possible. This is believed to be standard practice on all of the routes in question. Where draught mark data was provided, the same “ship deadweight” approach has been taken, and vehicle/passenger weights have been derived and applied at conservative centres of gravity. Histograms of the load data for each of the ships are shown in Figures 6.2–6.6. For Ships 4 and 6, the average load for each voyage in every month could be calculated. For the other ships, only “snapshots” of loading conditions were provided so that only the broad seasonal trends can be seen. The “fixed deadweight”, consisting of fuel, consumables, crew etc., is kept at the constant value drawn from the earlier stability analyses. As noted at Section 2, this is normally for a deep departure condition, but for ship 6 is a deep arrival, i.e., light tankage. The vehicle weights are drawn from the load data. All load data is plotted as a percentage of maximum deadweight, which is taken from the ships’ load line limit. It can be noted that the peak months for deadweight are not necessarily the peaks for overall capacity utilization. Commercial (truck) traffic varies less than private (cars), and so with a reduced sailing frequency (or fewer ships) operating during the off-season, higher absolute numbers of the much heavier trucks may be carried. A further view of the variability within the averages is shown for Ship 4 for a single month in Figure 6.7. Frequency is the absolute number of voyages at a given cargo load level. The peak cargo deadweight (for the vehicles and passengers only) represented approximately 56% of the total available deadweight, compared with 78% if the ship is carrying a maximum possible load of trucks, etc. It can be seen that there is relatively little fluctuation around the average value of 46% for the month in question.
23
D is tr ib u tio n o f m o n th ly a v e r a g e o f d e a d w e ig h t p e r tr ip fo r s h ip # 1
0 %
2 0 %
4 0 %
6 0 %
8 0 %
1 0 0 %
FebApr
ilJu
ne
Augus
tOct
Dec
Wei
gh
t (%
)
C a r g o w e i g h t
" fix e d d e a d w e i g h t "
M a x d e a d w e i g h t
Figure 6.2: Average Monthly Loadings for Ship 1
D is tr ib u tio n o f m o n th ly a v e r a g e o f d e a d w e ig h t
p e r trip f o r s h ip # 2
0 %2 0 %4 0 %6 0 %8 0 %
1 0 0 %
FebApr
ilJu
ne
Augus
tOct
Feb
Wei
gh
t (%
)
Cargo we igh t
" fixed deadwe igh t "
M a x d e a d w e i g h t
Figure 6.3: Average Monthly Loadings for Ship 2
D is tr ib u tio n o f m o n th ly a v e r a g e o f d e a d w e ig h t p e r tr ip fo r s h ip # 4
0 %
2 0 %
4 0 %
6 0 %
8 0 %
1 0 0 %
Febru
ary
April
June
Augus
t
Octobe
r
Decem
ber
Wei
gh
t (%
) C a r g o w e i g h t
" fix e d d e a d w e i g h t "
M a x d e a d w e i g h t
Figure 6.4: Average Monthly Loadings for Ship 4
24
D i s t r ib u t i o n o f m o n t h l y a v e r a g e o f d e a d w e ig h t p e r t r i p f o r s h ip # 6
0 %
2 0 %
4 0 %
6 0 %
8 0 %
1 0 0 %
May
June
July
Aug
ust
Sep
tem
ber
Oct
ober
Wei
gh
t (%
)
C a r g o w e ig h t
" f ix e d d e a d w e i g h t "
M a x d e a d w e ig h t
Figure 6.5: Average Monthly Loadings for Ship 6
D is tr ibut ion of monthly average of d e a d w e ight per tr ip for ship #9
0 %
20%
40%
60%
80%
100%
Feb
April
June
Augus
tOct
Dec
Wei
gh
t (%
)
Cargo weight
" fixed deadweight"
Max deadweight
Figure 6.6: Average Monthly Loadings for Ship 9
D is t r i b u t i o n o f C a r g o W e ig h tf o r t h e m o n t h o f A p r il o n s h ip # 4
0
5
1 0
1 5
2 0
2 5
3 0
3 5
u p to1 0 %
u p to2 0 %
u p to3 0 %
u p to4 0 %
u p to5 0 %
u p to6 0 %
u p to7 0 %
M o re
% o f d e a d w e ig h t
Fre
qu
ency
Figure 6.7: Occurrences of Cargo Deadweight Levels for Month of April, Ship 4
25
Figure 6.8 has been developed to highlight the importance of the loading condition for the survivability of the ship, using ship 4 as the example. The curve represents a straightforward percentage reduction of the cargo (vehicle plus passenger) deadweight, keeping the same centre of gravity, while the points show predictions based on the actual loading data, using the assumptions described above. The former approach is somewhat more conservative, due to the higher assumed cargo KG. It can be seen that the survivable wave height increases rapidly in part load cases. At full load, the critical height is just over 0.4m (close to 90% probability of exceedence), while at 50% load, this increases to 3m (less than 5%). Thisresult is discussed in more detail in the Section 7.
Figure 6.8: Effect of Loading on Critical Ht/Probability of Exceedence
26
7. COMPARATIVE SAFETY/RISK ASSESSMENT The final technical task in this project has involved combining the results of the previous tasks to produce a partial relative risk index for each vessel, assuming equal probabilities of damage. These indices have been matched against those that can be constructed using the current SOLAS criteria. 7.1 Components of Risk Index As discussed in Section 5, it has only been feasible within the scope of this study to construct a partial risk index. This assumes:
• standard ‘SOLAS’ damage; • worst damage location; and, in general • equal probability of collision. though this last factor is discussed qualitatively based on relevant traffic densities. In terms of outcome, the capsize of any of the ships is taken to be equally unacceptable. No additional weighting has been applied to account for the different numbers of people who may be on board, or (numerically) for the different probabilities of rescue along different routes at different times of year. The risk index using the Static Equivalent Method can thus account quantitatively for: • the inherent survivability of the damaged ship, as predicted by the SEM critical wave
height; • the probability of exceedence of any wave height for the route in question; and, • the variability in ship loading, which can be used to create a joint distribution of critical
capsize wave height, taking both loading and waves into account. As noted earlier, the last of these is the most challenging to handle in a completely defensible way; on the other hand, in many cases the design loading conditions for ferries are somewhat arbitrary. As an example, that for Ship 4 in this study involves a full load of trucks, no cars, and maximum passengers; and approximately 60% fuel and 30% fresh water in the tanks. This is a highly artificial condition that combines maximum deadweight with the highest possible KG. Referring to Figures 6.4 and 6.7, the annual average cargo deadweight is roughly 40% of total available deadweight, and the maximum during the sample month was 56% of capacity. To this should be added the “ship” deadweight (fuel, etc.), assumed here to be roughly 22% of total capacity, but in practice, varying between a maximum of 35% and a minimum of less than 10% between voyages. A 10% probability of exceedence of loading for this ship would thus fall at around 70% of total deadweight, with a KG somewhat lower than that used in the earlier SOLAS calculations.
27
Assessments of current or historical risk levels can quite justifiably use actual loading data to produce the most realistic picture of the situation, but for new designs and for regulation development, a different approach is more likely to be needed. Some account should be taken of the probable distribution of load factors, to avoid the use of unrealistic assumptions. In principle, actual load factors could be reviewed on a regular basis to check that the design assumptions remain on the conservative side of reality. Operators and their designers could then decide how aggressively to use the flexibility this allows. Under the proposed revised SOLAS probabilistic method [Ref. 14], three loading cases representing load line, lightest operating, and 60% of the difference between these, are to be treated as “standard” values. While this may be reasonable for cargo vessels (or cruise ships) it may not provide a very realistic fit to ferry operations. 7.2 Relative Risk Levels from SEM Approach Table 7.1 presents measures of relative risk in several different ways: (a) on the basis of inherent survivability (capsize wave height); (b) on a route-specific probabilistic basis, taking account of annualized wave climate; (c) as (b), but adding annualized load data, where available.
Since the available loading data is not complete, and a real statistical profile covering weight, centre of gravity, and internal free surface effects would be needed to treat loading effects rigorously through a joint probability with wave height, a simpler approach has been taken. The performance of the ship has just been calculated at a single, averaged load, for any of the conditions considered. For ship 4, the load-related measure has also been calculated for four additional cases, namely: worst wave month (February), highest passenger load month (August), peak deadweight month (October), and for an approximate annualized 10% probability of deadweight exceedence (as discussed at 6.2). Table 7.2 presents the comparative results, some of which are also included on Figure 6.8. As noted in Section 2, the SEM critical Hs corresponds to a 50% probability of capsize, and therefore all probability of exceedence values need to be halved to give capsize probability.
28
Table 7.2: Variation of Risk with Season for Ship 4
February 56 3.85 11.95August 50 4.01 0October 68 3.23 5.67
Figure 7.1 presents the data in a somewhat different way, with the critical wave heights for two nominal loading conditions plotted against the monthly wave height statistics for 10% probability of exceedence. Since the nominal capsize probability incorporates a variety of assumptions, as discussed above, it is more appropriate to re-label it as a measure of risk, or risk/safety index, as has been done in Table 7.3 using the wave probability measure (i.e., excluding consideration of load fluctuations). A value of 1 implies no risk of capsize under this given scenario (worst SOLAS damage), while fractional values provide the probability of survival.
It can be seen from Tables 7.1-7.3 that the relative values of risk change radically depending on whether the first or second approach is adopted, while the absolute values are affected considerably under the third (and variants thereof). Ship 4 shows the highest risk under any of the approaches, and its own risk index changes considerably over the course of the year. As Figure 6.8 shows, although the survivable wave height is higher in February than in October (for representative loading conditions in each month), the probablity of exceeding the critical capsize height is also higher, due to the more severe sea conditions. None of these values can necessarily be considered acceptable or unacceptable, and all should be considered in the context of accident probability, as discussed earlier. The traffic volume and types experienced on each route would, in general, lead to ships 6, 3, 8 and 9 seeing less relative risk (roughly in that order) and 1, 2, 4, and 7 seeing more. Of
29
course, the vessel traffic is also quite dependent on season, particularly in those waters affected by ice directly or indirectly.
30
An additional factor which influences the results shown is the fact that certain analyses were undertaken for two-compartment cases, and the balance for one-compartment (ships 3, 7, and 8). It has been reported [Ref. 18] that 70% of collisions involve breaching at least one major transverse bulkhead, which would make the relative risk for the one compartment ships much higher (though the validity of the underlying assumptions has also been strongly criticized, e.g., in [Ref. 19]). As an example, with two-compartment damage at roughly the same location for ship 3, there is essentially a 100% probability of capsize; while with one compartment there is almost zero (for the route in question). Combining just these two cases on a weighted basis would thus give 70% probability of capsize. To establish a target risk level for ferry services in general, or for a given route in particular, it would be necessary to review historical accident statistics and the characteristics of the ships (and overall fleets) involved. There are relatively few first world ferry losses and not an enormous number of lesser incidents, but work which has been undertaken in this area by the North-West European R&D Project [Ref. 18, etc.] may provide some guidance on a possible approach. 7.3 Comparisons with Other Criteria 7.3.1 SOLAS Calculations The two phases of the initial project ranked the stability of the eight ships as shown in Table 7.4 [Refs. 1, 2]. The addition of ship 9 alters the relative positions as shown for the deterministic case; no calculations have been performed for ship 9 using the probabilistic option. Rankings against the A. 265 criteria are based on the ratios of achieved to required index, which are shown in parentheses.
No attempt has been made to develop a relative risk index for the SOLAS probabilistic results, which would require considerable “reverse engineering” of the criteria. Of the deterministic SOLAS criteria, the ones which seem most likely to predict survivability are the maximum GZ value and total GZ area to the point of vanishing stability, the first being somewhat related to static and the second to dynamic stability. Research has shown, however, that neither factor is a very good predictor of capsize. Table 7.5 shows the SEM capsize wave height as an initial index of survivability, effectively normalized to a wave height of 1m. Three separate representations of the SOLAS criteria are also shown: (a) with GZ max normalized against the SOLAS requirement; (b) with GZ area normalized against the SOLAS requirement; and, (c) with both combined, using the approach proposed for the latest revision to the
calculation of the factor “sI” in the SOLAS probabilistic approach [14]. The last of these combines both GZ measures, range, and heel using the formula below: si = ((2max - 2o )/8)0.5 . ((GZmax /GZreq ).(Range/Rangereq).(GZarea/GZAreareq)
0.25
where 2max = 15 degrees 2o = actual equilibrium heel angle and the GZ, GZArea, and Range required and actual are calculated as in SOLAS 90. In normal use, this factor cannot exceed 1 (for each of the many damaged conditions which have to be analyzed), but the tabulated values have removed this limit to show how all of the components of safety might be combined in a single value incorporating all the criteria.
Table 7.5: Comparative Indications of Risk Ship SEM wave ht. SEM prob. SOLAS SOLAS SOLAS SOLAS SEM prob. SEM Risk Index
It can be seen that none of these measures provides a very good match against the SEM predictions on an absolute basis. On a route specific basis, there is, not surprisingly, even less correspondence between the approaches. The two measures that should give the closest match are the si (with limits) and the SEM index, both of which are treating “safe” ships as equally safe. They both treat ships 1,2, 8, and 9 as “safe”, and are close for ship 6. For the other vessels, although the values for ship 4 are close to each other, this is coincidental, and ships 3 and 7 look quite different under the two approaches.
32
7.3.2 Stockholm Agreement Calculations A further assessment has been performed to identify how each of the ships might be expected to be assessed against the Stockholm Agreement (SOLAS 90+50). The results are intended to be indicative rather than absolute, as Canada is not a party to this agreement or to any clarifications related to interpretations of its requirements. The Stockholm Agreement, which is based on the IMO “Panel of Experts” recommendations [Ref. 20], selected a nominal 10% probability of exceedence wave height as an element of a suitable survivability criterion, but did not take any variability in loading into account. Table 7.6 shows for each ship the residual freeboard, the annual (10% significant) wave height, the resulting mean depth of water which the ship would be required to withstand (expressed as m3/m2), and the total volume of water which this represents. This is compared with the SEM predicted total volume for the capsize case; ships where capsize volume is less than the Agreement volume are presumed to fail.
Table 7.6: Stockholm Agreement (SOLAS 90+50) Requirements vs SEM Residual Annual S.A. factor S.A. SEM
Ship # Freeboard (m) Hs (m) (m3/m2) Reason volume (m3) crit. vol.(m3)1 0.654 0.92 0 Hs < 1.5 m 0.02 0.752 0.92 0 Hs < 1.5 m 0.03 1.071 1.10 0 Hs < 1.5 m 0.04 0.416 2.30 0.16 1.5 m < Hs < 4.0 m 615.2 195.56 1.703 1.80 0.06 1.5 m < Hs < 4.0 m 95.4 96.47 0.386 2.30 0.16 1.5 m < Hs < 4.0 m 224.3 112.88 1.611 1.25 0 Hs < 1.5 m 0.09 1.668 0.92 0 Hs < 1.5 m 0.0
Several noteworthy features can be highlighted; first, only three of the ships would be required to meet any water on deck criterion, as the 10% wave heights for the others fall below the 1.5m threshold. For the three remaining ships, ship 6 is just compliant, and ships 4 and 7 fail by wide margins. If the Stockholm procedure is re-used to establish the wave exceedence probabilities associated with the SEM critical volumes, then the results are as summarized in Table 7.7. It can be seen that the wave heights associated with the same water build-up are quite different under the two approaches, and so, in consequence, are their probabilities of exceedence. Perhaps most tellingly, if Ship 4 is evaluated against its summer wave climate, it would be considered safe under the Stockholm procedure while having an 40% probability of capsize (80% probability of exceedence) using the SEM under the same accident scenario.
33
Table 7.7: Comparative Wave Heights, Stockholm Agreement and SEM
SEM crit ht SEM prob ex S.A. eq ht S.A. prob exShip # (m) % (m) %
Therefore, while the Stockholm procedure reaches quite similar conclusions to the SEM approach for this sample of ships, it may not work as well in all cases. It approach has been less fully justified than the SEM approach, and does not provide the same degree of physical explanation for the capsize phenomenon. This is, presumably, why work in Europe has continued to further the development of the SEM as the basis for future revisions to criteria. 8. CONCLUSIONS AND RECOMMENDATIONS 8.1 Summary and Conclusions
This project has established that the Static Equivalent Method can be applied with relatively few problems to the majority of a sample of Canadian ferry designs. SEM results can be combined with route-specific environmental and loading data to construct risk indices, which illustrate relative safety levels much more meaningfully than do existing SOLAS criteria. For a given (SOLAS) type and extent of damage, the worst ship in the Canadian sample would be at risk of capsize on roughly 40% of its voyages, while the best would always be safe. The levels of risk for different ships change considerably over the course of the year, due to loading and wave condition variability. The approach in this study is comparable in a number of ways to the methodologies available under the Stockholm agreement, where survival criteria can be linked to expected wave climate and to residual freeboard. However, using SEM provides a considerably more rigorous and rational way of dealing with the water on deck than the Agreement’s simple relationships or its model test alternative. Many concerns have been raised over the use of limited model test data to ‘prove’ adequate safety. More work is required to develop this work to a point where it could be used to develop new stability criteria, as the risk indices are not absolute or (yet) adequately tied to any desirable level of risk. It must also be noted that the SEM itself still has some deficiencies and unanswered questions in such areas as its treatment of freeing ports, validity for highly stable ships, and applicability to a broad range of ship conditions.
34
8.2 Recommendations Recommendations for future work thus fall into two main categories: (a) work aimed at developing a risk-based criterion which could be applied to Canadian
(and international) Ro-Ro ferries; (b) work aimed at refining the capsize prediction methodology. 8.2.1 Regulatory Criteria
The approach used in this study should be extended to allow selection of appropriate levels of risk, and to allow the criteria for ferries to be integrated into future general SOLAS probabilistic methods.
This could involve exchanging information with those administrations that have applied the Stockholm Agreement, and, in particular, focussing on the safety assessments of existing ships using the model testing approach. Although the accuracy of some of this data may be limited, the results represent the largest available data set of semi-rigorous risk assessments using a partially probabilistic approach.
Domestically, for non-Convention ships, it would be desirable to identify criteria that could be used to evaluate both new and existing vessels. For the latter, a target risk level could be attained by loading or weather-related service limits. On the more general SOLAS front, the desire of administrations (and others) to develop a single approach covering all ship types is understandable. However, the very specific nature of (Ro-Ro) ferry services means that these should be considered somewhat differently than ships intended for unrestricted worldwide service. Expanding the types of analyses described at Section 3 would identify where and how more targeted criteria should be envisaged. It is notable that several criticisms have been leveled at the use of the A.265 database to establish the probable severity of impact damage; this is a very important issue, particularly for one-compartment ships. 8.2.2 Method Refinement
As noted in [Ref. 7] and above, the SEM is not currently capable of dealing with some ferry configurations (e.g., with flapped freeing ports), its results may be over-conservative for certain scenarios, and elements of the method lack a firm physical basis. It would be desirable to improve the situation. This could be done by extending the theoretical and experimental work undertaken by Canada, in collaboration with the method originators in Europe. Potential areas for investigation would include: • refining the freeing port analyses reported in [Ref. 7], and validating the results against
the model test data from Phases I and II; • exploring the behaviour of water on deck when vehicles are present, for various casing
configurations;
35
• investigating the relationship between internal water surface elevation and external significant wave height more systematically;
• conducting additional investigations with incident waves at arbitrary angles to the damage opening.
REFERENCES [1] “The Residual Stability of Selected Canadian Passenger Ferries as Assessed
Against Resolution MSC.12(56)” TP 10775E, November 1991. [2] “The Residual Stability of Selected Canadian Passenger Ferries as Assessed
Against Resolution A265” TP 11339, 1992. [3a,b] “Flooding Protection of Ro-Ro Ferries, Phase I”, (Volumes 1 and 2), TP12310E,
March 1995. [4a,b] “Flooding Protection of Ro-Ro Ferries, Phase I extension”, (Volumes 1 and 2),
TP12581E, October 1995. [5] “Flooding Protection of Ro-Ro Ferries, Phase II” TP12991E, March 1997. [6] "Ro-Ro Ferry Passenger Vessel Capsize Safety Investigation: Physical Model
Experiments, Phase II", W.D. .Molyneux and D. Cumming, IMD TR-1997-01, April 1997.
[7] “Flooding Protection of Ro-Ro Ferries, Phase III” TP13216, March 1998. [8] “Dynamic Stability Assessment of Damaged Passenger/Ro-Ro Ships and Proposal
of Rational Stability Criteria”; Vassalos et.al., Marine Technology Oct.97. [9] “Safety of Passenger/Ro-Ro Vessels: Lessons Learned from the North-West
European R&D Project” T.Svensen and D.Vassalos, Marine Technology, October 1998.
[10] “Risk Assessment – Navigation Aids for Shipping in Canso Strait” TP 13042, June 1997.
[11] "The Technical Investigation of the Sinking of the Ro-Ro Ferry European Gateway" J.R.Spouge, The Naval Architect, March 1986.
[12] IMO SLF 41: Polish submission. [13] “Time-based Survival Criteria for Ro-Ro Vessels”, D.Vassalos and T.Allan, Trans
RINA, 1998. [14] “Development of Revised SOLAS Chapter II-1 Parts A, B, and B-1” Report of
the Working Group on Subdivision and Damage Stability SLF 42/3, 16 June 1998. [15] “Harmonization of Damage Stability Provisions in IMO Instruments – Report from
Validation Group” internal SLF working paper, 4 February, 1999. [16] Canadian Wind and Wave Climate Atlas, TP10820E vols 1-4, 1991. [17] Communication from BC Ferries, January 1999. [18] “Safety of Passenger/Ro-Ro Vessels – Summary Report” Joint North-West
European Research Project report DNV REP-T00-001, 1997.05.07. [19] “On Probabilistic Damage Stability” A.Bjorkman, The Naval Architect, September
1995. [20] “Report of the Panel of Experts on Ro-Ro Ferry Safety to the Steering Committee