17
TPA-TTF: Pioneering a Results-Based Management (RBM) Approach Andrea Lemgruber Advisor/Senior Budget Manager Institute for Capacity Development

TPA-TTF:Pioneering a Results-Based
Management (RBM) ApproachAndrea Lemgruber
Advisor/Senior Budget ManagerInstitute for Capacity Development

2
1) Introduction to Results-Based Management (RBM)2) RBM in the TPA-TTF3) Summary and Q&A
Outline

Stakeholder participation at
all stages
• Improved planning, monitoring and evaluation enhanced risk assessment
• Stakeholder engagement• 3 core principles:
o Accountabilityo National ownershipo Inclusiveness
31) Introduction to RBM
Results-Based Management:A common language to define and measure results, outputs and impact
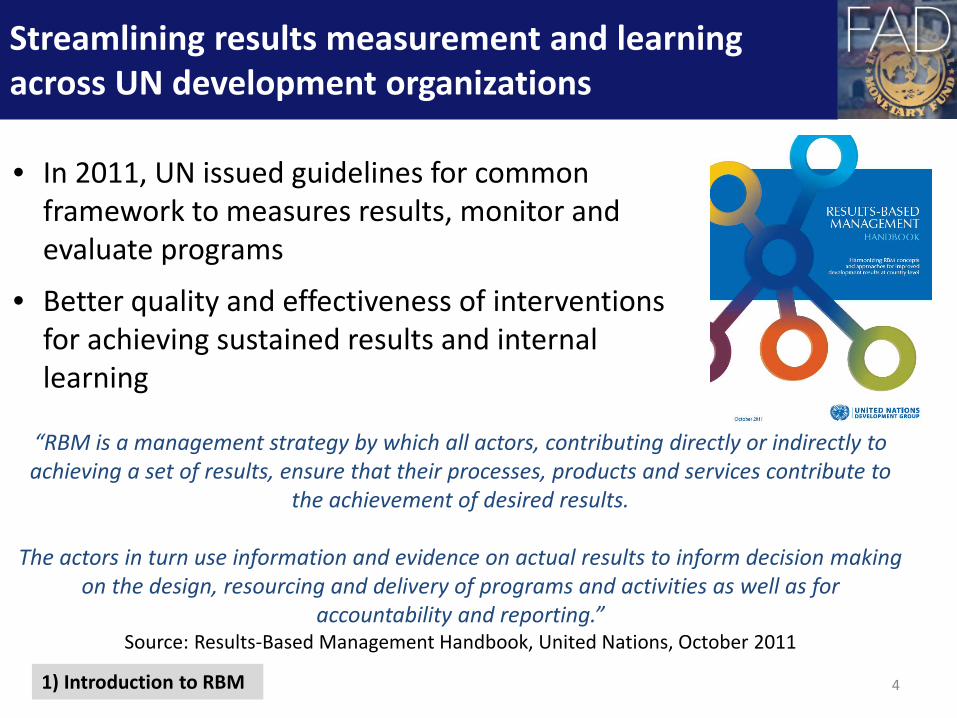
• In 2011, UN issued guidelines for common framework to measures results, monitor and evaluate programs
• Better quality and effectiveness of interventions for achieving sustained results and internal learning
41) Introduction to RBM
“RBM is a management strategy by which all actors, contributing directly or indirectly to achieving a set of results, ensure that their processes, products and services contribute to
the achievement of desired results.
The actors in turn use information and evidence on actual results to inform decision making on the design, resourcing and delivery of programs and activities as well as for
accountability and reporting.” Source: Results-Based Management Handbook, United Nations, October 2011
Streamlining results measurement and learning across UN development organizations

Donors IMF
Authorities Other Stakeholders
RBM
5
• Efficient allocation of funds –leverage to maximize impact
• Improve decision taking• Accountability
• Monitoring of project activities• Risk assessment and identifying
early warning signs• Learning to inform future projects• Accountability
• Maximize impact for development results
• Learning for future reform/public programs
• Risk assessment and identifying early warning signs
• Accountability• Ensuring inclusiveness• Coordinate work with other partners• Transparency
1) Introduction to RBM
RBM speaks to the increasing demand for performance measurement of TA activities

62) RBM in the TPA-TTF
• Framework discussed with TPA donors in Brussels in 2014
• Gradual and collaborative approach
• Quantitative and qualitative information assessed against project objectives
• Progress is currently measured through a numerical scoring system to evaluate outcomes:
o 1 (not achieved)o 2 (partially achieved)o 3 (largely achieved)o 4 (fully achieved)
Clear linkage between country strategies and specific TA projects to
maximize effectiveness and increase prospects
of sustainability
Indicators at module/project level to
track progress and identify results
Use of performance management tools to track and report on
results
Use of performance information for
accountability and decision-making
through feedback to the TPA TTF’s Steering
Committee and integration into
successive work plans
Four core RBM principles have been integrated into the design and operation of FAD’s tax
administration reform programs under the TTF
RBM is a key pillar of the TPA-TTF management
72) RBM in the TPA-TTF
C. AggregatedPerformance
B. Capturing
Scores
A. Catalog Outcomes
Strong PerformersGood/Satisfactory Performers
Slow ProgressPerf
orm
ance
ca
tego
ries:
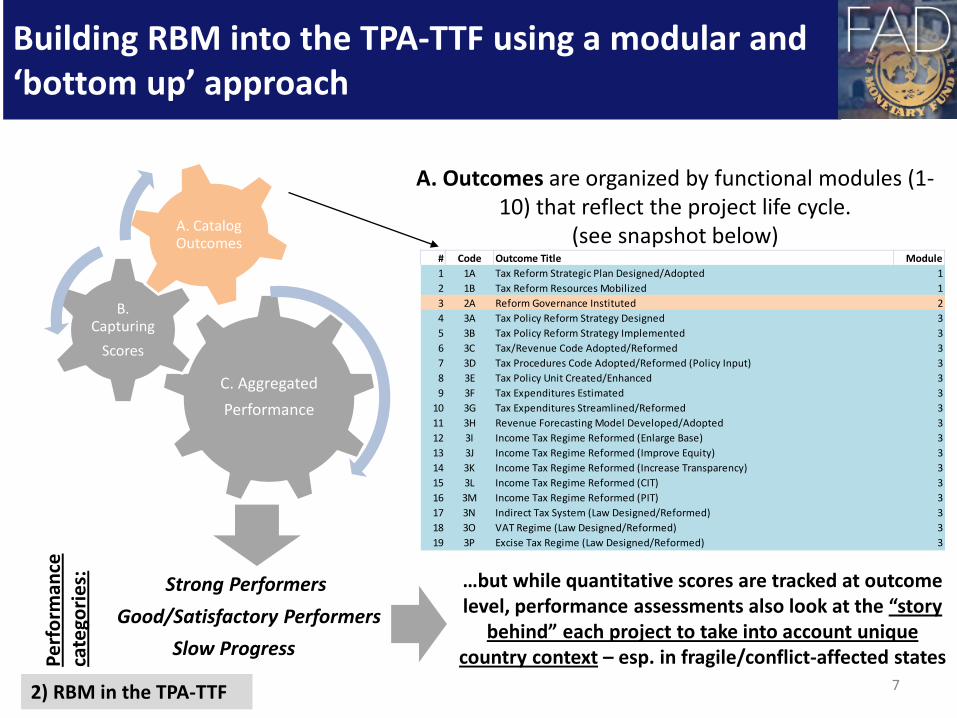
A. Outcomes are organized by functional modules (1-10) that reflect the project life cycle.
(see snapshot below)# Code Outcome Title Module1 1A Tax Reform Strategic Plan Designed/Adopted 12 1B Tax Reform Resources Mobilized 13 2A Reform Governance Instituted 24 3A Tax Policy Reform Strategy Designed 35 3B Tax Policy Reform Strategy Implemented 36 3C Tax/Revenue Code Adopted/Reformed 37 3D Tax Procedures Code Adopted/Reformed (Policy Input) 38 3E Tax Policy Unit Created/Enhanced 39 3F Tax Expenditures Estimated 3
10 3G Tax Expenditures Streamlined/Reformed 311 3H Revenue Forecasting Model Developed/Adopted 312 3I Income Tax Regime Reformed (Enlarge Base) 313 3J Income Tax Regime Reformed (Improve Equity) 314 3K Income Tax Regime Reformed (Increase Transparency) 315 3L Income Tax Regime Reformed (CIT) 316 3M Income Tax Regime Reformed (PIT) 317 3N Indirect Tax System (Law Designed/Reformed) 318 3O VAT Regime (Law Designed/Reformed) 319 3P Excise Tax Regime (Law Designed/Reformed) 3
…but while quantitative scores are tracked at outcome level, performance assessments also look at the “story
behind” each project to take into account unique country context – esp. in fragile/conflict-affected states
Building RBM into the TPA-TTF using a modular and ‘bottom up’ approach
82) RBM in the TPA-TTF
C. AggregatedPerformance
B. Capturing
Scores
A. Catalog Outcomes
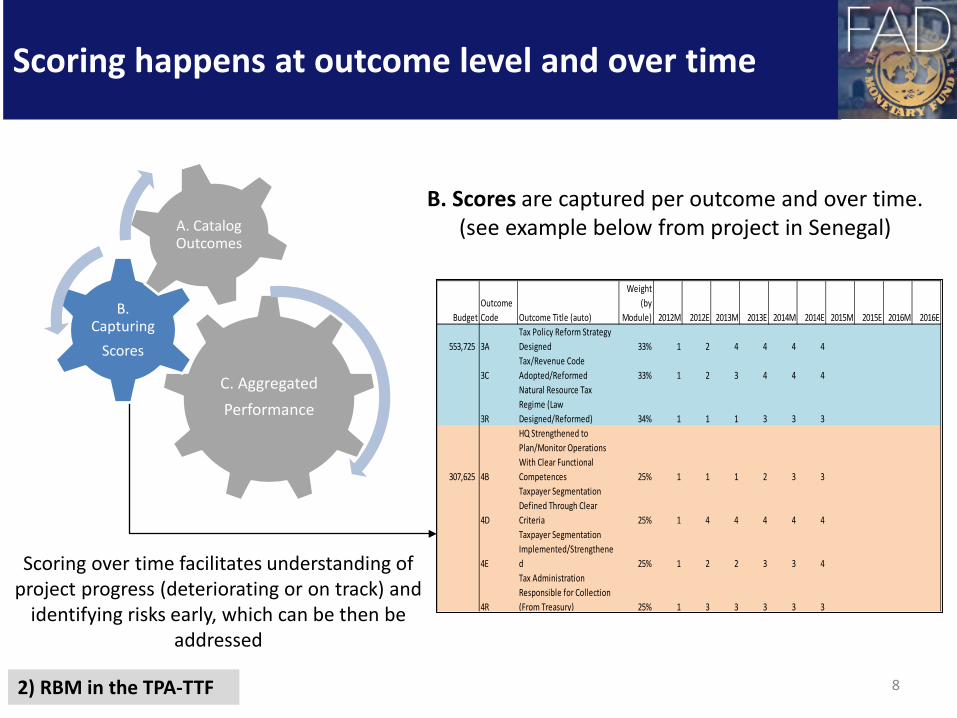
B. Scores are captured per outcome and over time.(see example below from project in Senegal)
BudgetOutcome Code Outcome Title (auto)
Weight (by
Module) 2012M 2012E 2013M 2013E 2014M 2014E 2015M 2015E 2016M 2016E
553,725 3ATax Policy Reform Strategy Designed 33% 1 2 4 4 4 4
3CTax/Revenue Code Adopted/Reformed 33% 1 2 3 4 4 4
3R
Natural Resource Tax Regime (Law Designed/Reformed) 34% 1 1 1 3 3 3
307,625 4B
HQ Strengthened to Plan/Monitor Operations With Clear Functional Competences 25% 1 1 1 2 3 3
4D
Taxpayer Segmentation Defined Through Clear Criteria 25% 1 4 4 4 4 4
4E
Taxpayer Segmentation Implemented/Strengthened 25% 1 2 2 3 3 4
4R
Tax Administration Responsible for Collection (From Treasury) 25% 1 3 3 3 3 3
Scoring over time facilitates understanding of project progress (deteriorating or on track) and
identifying risks early, which can be then be addressed
Scoring happens at outcome level and over time
92) RBM in the TPA-TTF
C. AggregatedPerformance
B. Capturing
Scores
A. Catalog Outcomes
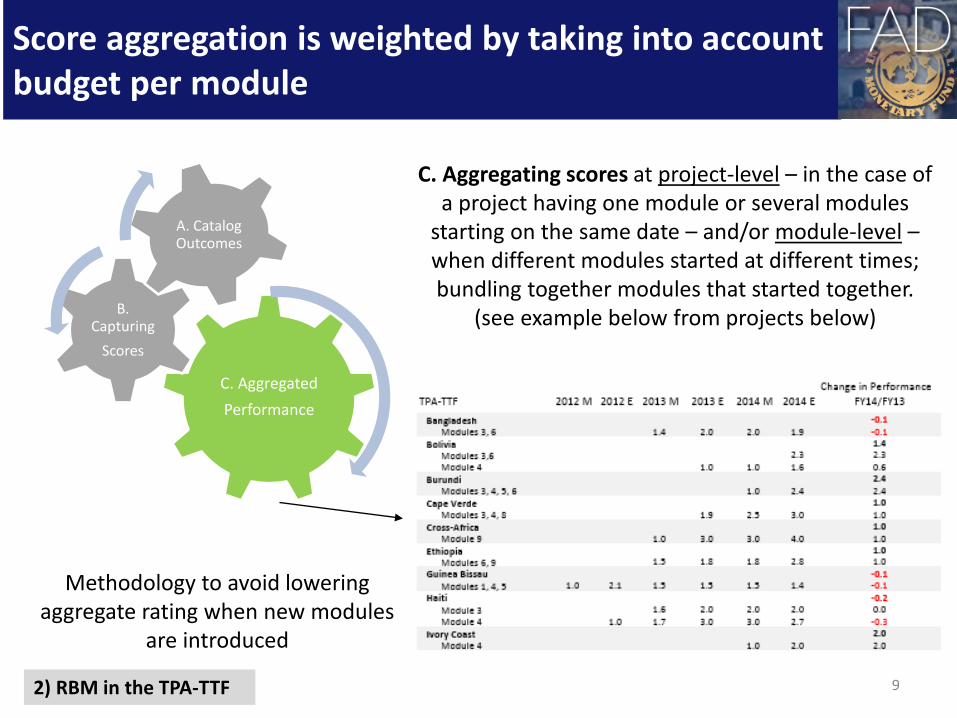
C. Aggregating scores at project-level – in the case of a project having one module or several modules
starting on the same date – and/or module-level –when different modules started at different times; bundling together modules that started together.
(see example below from projects below)
Methodology to avoid lowering aggregate rating when new modules
are introduced
Score aggregation is weighted by taking into account budget per module

102) RBM in the TPA-TTF
0
20
40
60
80
100
120
140
160
0
5
10
15
20
25
30
35
40
45
50
FY12 FY13 FY14 FY15 FY16 M FY16 E
Tota
l Num
ber o
f Out
com
es
Perc
ent o
f Out
com
es (%
)
Evolution of Active Outcomes
Score 1 Score 2 Score 3 Score 4 Total (RHS)
RBM tracks aggregate performance over time (1)

112) RBM in the TPA-TTF
0.0
1.0
2.0
3.0
4.0
M1 M2 M3 M4 M5 M6 M7 M8 M9 M10
Mod
ule
Scor
e
Average Module Scores
FY12 FY13 FY14 FY15 FY16 M FY16 E
*Includes active and complete modules. Excludes modules that were halted.
RBM tracks aggregate performance over time (2)

RBM tracks aggregate performance over time (3)
122) RBM in the TPA-TTF
The result of aggregation is the construction of a “Heat map” to inform project monitoring, risks assessment and can help to harness buy-in from relevant stakeholders
BGD
BEN
BOL (M3,6)BOL (M4)
BDI
CPV (M3) CPV (M4)
CPV (M8)
EAC
ETH (M6)
ETH (M7)
ETH (M9)
GNBHTI (M3)
CIV
LBR (M4)
LBR (M5,6,7)
MLI
MRT (M4,5)
MRT (M6)
MRT (M8)
MMR (M1)
MMR (M2,3,4,5)
MNG
NPL
PRY
SEN1
SEN2 (M4,5,6)
SEN2 (M8)
WAEMU (M1)WAEMU (M3)
SWZ (M4)
SWZ (M5)
SWZ (M6)
1.0
2.0
3.0
4.0
6 12 18 24 30 36 42 48 54 60
Proj
ect S
core
Project Age In Months*
Classification of projects by perfomance and age
* Project age as of end of FY16 for active projects; age at completion for completed projects/ modulesSEN 1: 2012 - 2015; SEN2: 2015 - 2017
Source: FAD project managers/TPA report; takes into account TPA practice (track record) on average timing to achieve a particular score.
RBM tracks aggregate performance over time (3)

132) RBM in the TPA-TTF
• Logframe identifies key high-level indicators to monitor overall impact of the TPA TTF as a whole
• Sources are: project managers, country economist , and databases (e.g., WEO, RA-FIT)
• Attribution is more difficult at this level, but still very important to be monitored
Building RBM into the TPA-TTF using a modular and ‘top down’ approach

143) Summary and Q&A
• RBM as a strategic management tool strengthened focus on outcomes
• RBM’s standardized results framework increased consistency and clarity in reporting, saved time and facilitated SC oversight
• RBM’s focus on better project management makes it easier to track progress and costs
• RBM’s linkages across information systems improved coordination and allowed teams to focus on delivering project
• RBM monitoring facilitates risk assessments and identification of early warning signs
Lots of progress has been made in operationalizing RBM, and the TPA-TTF greatly benefitted

153) Summary and Q&A
Challenges and lessons learned:• Collaboration between key stakeholders (country officials, IMF, donors, other
partners) is critical to improve/operationalize RBM• Standardizing outcomes supports comparisons across projects but having project-
specific milestones is also important. Striking the right balance is a challenge moving ahead.
• There is a need to keep refining the log frame: under the new RMTF, the log frame will support better diagnostics and risk assessment.
• Integration between top-down and bottom-up approaches is not straightforward and needs to be strengthened.
• There is a need to build robust RBM baselines based on solid data (e.g. RA-FIT) • Measuring performance is a cultural change that can add significant value to the
CD work—engagement with authorities is crucial
But RBM remains a ‘work in progress’: continuous opportunity to learn and improve

163) Summary and Q&A
• IMF close to implementing RBM system for ALL capacity development (CD) activities
• RBM System built and starting to be used (CD-Port)• Catalog of outcomes and indicators ready for all CD
– Revenue Administration TTF catalog to be merged into Fund-wide system
• Rating scheme to be applied to all outcomes and milestones
• Results reporting and analysis to be standardized across the Fund
Fund-wide RBM effort: what’s the status?

Thank you!
Questions?
173) Summary and Q&A
The end…


