HAL Id: hal-00328343 https://hal.archives-ouvertes.fr/hal-00328343 Submitted on 11 Sep 2003 HAL is a multi-disciplinary open access archive for the deposit and dissemination of sci- entific research documents, whether they are pub- lished or not. The documents may come from teaching and research institutions in France or abroad, or from public or private research centers. L’archive ouverte pluridisciplinaire HAL, est destinée au dépôt et à la diffusion de documents scientifiques de niveau recherche, publiés ou non, émanant des établissements d’enseignement et de recherche français ou étrangers, des laboratoires publics ou privés. Trace elements in South America aerosol during 20th century inferred from a Nevado Illimani ice core, Eastern Bolivian Andes (6350 m asl) A. Correia, R. Freydier, Robert Delmas, J. C. Simões, J.-D. Taupin, B. Dupré, P. Artaxo To cite this version: A. Correia, R. Freydier, Robert Delmas, J. C. Simões, J.-D. Taupin, et al.. Trace elements in South America aerosol during 20th century inferred from a Nevado Illimani ice core, Eastern Bolivian Andes (6350 m asl). Atmospheric Chemistry and Physics, European Geosciences Union, 2003, 3 (5), pp.1352. hal-00328343
Transcript
HAL Id: hal-00328343https://hal.archives-ouvertes.fr/hal-00328343
Submitted on 11 Sep 2003
HAL is a multi-disciplinary open accessarchive for the deposit and dissemination of sci-entific research documents, whether they are pub-lished or not. The documents may come fromteaching and research institutions in France orabroad, or from public or private research centers.
L’archive ouverte pluridisciplinaire HAL, estdestinée au dépôt et à la diffusion de documentsscientifiques de niveau recherche, publiés ou non,émanant des établissements d’enseignement et derecherche français ou étrangers, des laboratoirespublics ou privés.
Trace elements in South America aerosol during 20thcentury inferred from a Nevado Illimani ice core,
Eastern Bolivian Andes (6350 m asl)A. Correia, R. Freydier, Robert Delmas, J. C. Simões, J.-D. Taupin, B.
Dupré, P. Artaxo
To cite this version:A. Correia, R. Freydier, Robert Delmas, J. C. Simões, J.-D. Taupin, et al.. Trace elements in SouthAmerica aerosol during 20th century inferred from a Nevado Illimani ice core, Eastern Bolivian Andes(6350 m asl). Atmospheric Chemistry and Physics, European Geosciences Union, 2003, 3 (5), pp.1352.�hal-00328343�
Trace elements in South America aerosol during 20th centuryinferred from a Nevado Illimani ice core, Eastern Bolivian Andes(6350 m asl)
A. Correia1,2, R. Freydier3, R. J. Delmas2, J. C. Simoes4, J.-D. Taupin5, B. Dupre3, and P. Artaxo1
1Institute of Physics, University of Sao Paulo, Sao Paulo, Brazil2LGGE, CNRS and Universite Joseph Fourier, Grenoble, France3UMR5563, LMTG, CNRS and Universite Paul Sabatier, Toulouse, France4Institute of Geosciences, Federal University of Rio Grande do Sul, Brazil5LGGE, IRD, Grenoble, France
Received: 31 January 2003 – Published in Atmos. Chem. Phys. Discuss.: 7 May 2003Revised: 6 August 2003 – Accepted: 26 August 2003 – Published: 11 September 2003
Abstract. A 137 m ice core drilled in 1999 from EasternBolivian Andes at the summit of Nevado Illimani (16◦37’ S,67◦46’ W, 6350 m asl) was analyzed at high temporal reso-lution, allowing a characterization of trace elements in An-dean aerosol trapped in the ice during the 20th century. Theupper 50 m of the ice core were dated by multi-proxy analy-sis of stable isotopes (δ18O andδ2H), 137Cs and Ca+2 con-tent, electrical conductivity, and insoluble microparticle con-tent, together with reference historical horizons from atmo-spheric nuclear tests and known volcanic eruptions. This50 m section corresponds to a record of environmental vari-ations spanning about 80 years from 1919 to 1999. It wascut in 744 sub-samples under laminar flow in a clean bench,which were analyzed by Ion Chromatography for major ionicconcentration, by a particle counter for insoluble aerosol con-tent, and by Inductively Coupled Plasma Mass Spectrometry(ICP-MS) for the concentration of 45 chemical species fromLi to U. This paper focuses on results of trace element con-centrations measured by ICP-MS. The high temporal reso-lution used in the analyses allowed classifying samples asbelonging to dry or wet seasons. During wet season ele-mental concentrations are low and samples show high crustalenrichment factors. During dry seasons the situation is op-posite, with high elemental concentrations and low crustalenrichments. For example, with salt lakes as main sourcesin the region, average Li concentration during the 20th cen-tury is 0.035 and 0.90 ng g−1 for wet and dry seasons, re-spectively. Illimani average seasonal concentration rangescover the spectrum of elemental concentration measurementsat another Andean ice core site (Sajama) for most soil-relatedelements. Regional crustal dust load in the deposits was
found to be overwhelming during dry season, obfuscatingthe contribution of biomass burning material. Marked tem-poral trends from the onset of 20th century to more recentyears were identified for the concentrations of several tracespecies of anthropic origin, especially for Cu, As, Zn, Cd,Co, Ni and Cr. Among these elements, Cu shows averagewet season crustal enrichment factors above 103, while theothers range between 102 to about 5×10². P and K showmoderate average wet season enrichment factors, suggestingan impact of natural biogenic emissions from the AmazonBasin. Pb has multiple anthropic sources in the region, frommining activities in the beginning of 20th century to auto-motive fuel after 1950s. From the large number of samplesanalyzed from Illimani, it was possible to derive an effectivechemical characterization of the deposited background An-dean soil dust aerosol during 20th century.
1 Introduction
Ice core records represent important tools for reconstructingpast environmental conditions, from climatic variations to at-mospheric chemistry. Several snow and ice cores from polarregions were studied in last decades, especially from Green-land and Antarctica (Wolff and Peel, 1985; Clausen andLangway, 1989; Lorius et al., 1989; Delmas, 1992). A lim-ited number of Alpine ice cores studies have also been per-formed (Wagenbach, 1989). Pioneering work by Thompsonand co-workers (e.g. Thompson, et al., 1985, 1988; Thomp-son, 2000) showed the importance of high-altitude tropicalice cores, with different features and challenges compared topolar ice cores. As with glaciochemical studies of snow andice layers at other latitudes, it can be expected that chemical
1338 A. Correia et al.: Trace elements in South America aerosol during 20th century
composition of snow impurities deposited at high elevationsites in the tropics reflects the free tropospheric aerosol com-position on the regional scale. In general, tropical ice coressites are closer to continental aerosol sources than polar ones,thus making their aerosol load much higher than in polar re-gions. Also moisture sources are typically closer to tropi-cal ice cores, resulting in higher average snow accumulationrates and higher temporal resolution for the records repre-senting environmental changes. Measured impurities maycome from a variety of sources, either natural or anthropic inorigin, with high spatial and temporal variability of the atmo-spheric concentrations and physicochemical climate-relatedcharacteristics. Most Andean ice core studies aimed at pale-oclimate reconstructions. This is partly explained by the dif-ficulties involved in the recovering of tropical ice cores un-der suitable conditions (no melting before analytical work,in particular) for glaciochemical analyses. The knowledgeof the chemical composition of aerosol trapped by snow de-posited in the Andes is limited to a few studies (e.g. Thomp-son et al., 1998), where the focus rests over a wide time scalecovering several millennia or over a few elemental concentra-tion profiles. This work addresses this issue, exploring a hightemporal resolution (i.e. sub-seasonal) ice core record ex-tracted from the Andes covering about 80 years during 20thcentury, which was analyzed for the concentration profilesof 45 chemical elements ranging from Li to U by InductivelyCoupled Plasma-Mass Spectrometry (ICP-MS). The study ofmajor ionic species by Ion Chromatography and the volcaniceruptions recorded at Illimani will be reported elsewhere (DeAngelis et al., 2003a, 2003b).
2 Ice core extraction and sample handling
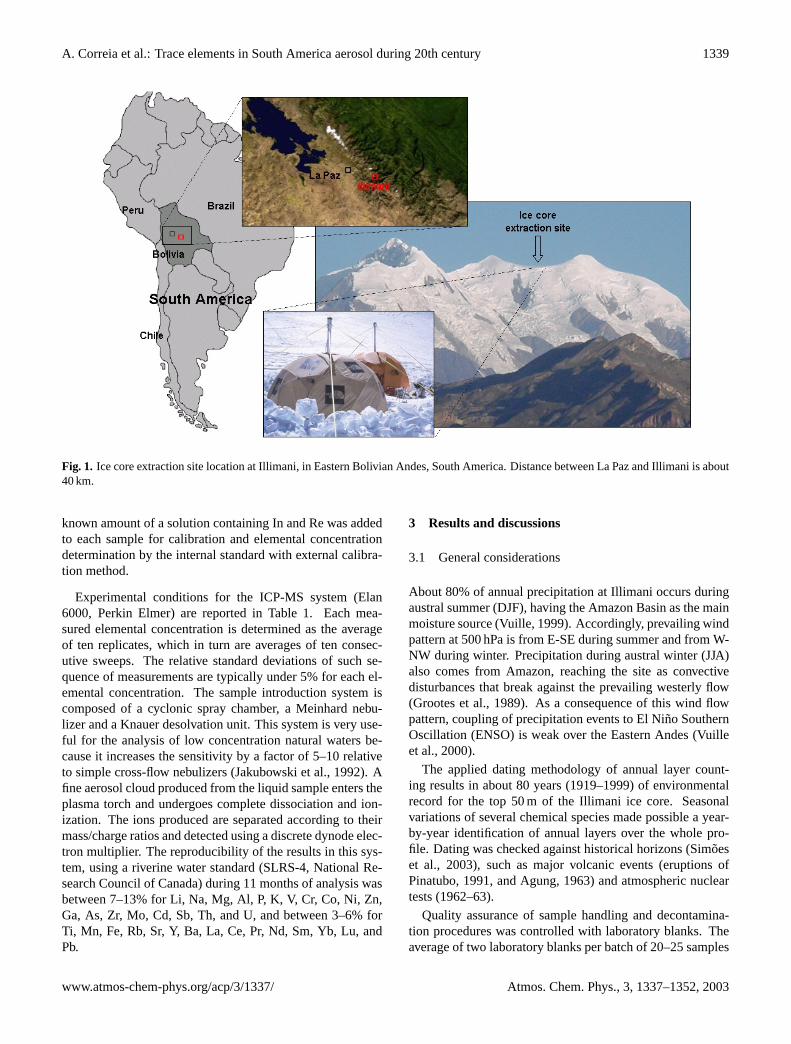
Two ice cores were drilled in 1999 by a French-Swissteam at the summit of Nevado Illimani (16◦37’ S, 67◦46’ W,6350 m asl, about 40 km SE from La Paz). Figure 1 showsthe location of the extraction site over Eastern Bolivian An-des (Cordillera Real). The two cores were separated by about50 m, and presented total lengths of 137 m (French core) and139 m (Swiss core). Further details about glaciological fea-tures of the drilling site are given by Simoes et al. (2003).This work discusses results of analyses performed on theFrench ice core.
Ice core sections drilled at Illimani, measuring about onemeter in length and eight centimeters in diameter, were trans-ported in cold conditions from the drilling site to La Pazand then to cold chambers in European laboratories, be-ing kept frozen at all times. This constraining procedureadopted for ice core handling makes the core suitable for acomprehensive glaciochemical study. In the cold chambers(−15◦C) of the Laboratoire de Glaciologie et Geophysiquede l’Environnement (LGGE) in Grenoble, France, the icecore sections were weighed and had their lengths measured,then cut in halves which were saved for eventual future anal-
Table 1. ICP-MS setup conditions during analyses
Dwell time 20 msSweeps/Reading 10Readings/Replicates 1Replicates 10Acquisition time 1 m 57 sWash delay 1 mFlush delay 1 m 40 sTotal scan time per sample 4 m 37 sNebulizer gas flow 0.86–0.88 l min−1
Auxiliary argon gas flow 1 l min−1
Plasma gas flow 15 l min−1
Power 1200 WScanning mode Peak hopping
Tuning solution sensitivity (counts per second per ppb)Mg 94 000Rh 560 000Pb 700 000
ysis. The electrical conductivity in the remaining halves wasmeasured along the profile. About 50 m of the ice core werecut in 744 sub-samples measuring from 6 to 10 cm in length.These sub-samples were decontaminated by removing theirexternal layer with a stainless steel plane under a laminar-flow clean bench. The external debris was used to mea-sure 137Cs content to check dating (Simoes et al., 2003).Sub-samples consisting of the inner part of the core werethen taken in double-sealed pre-cleaned plastic vessels to aclass 100 clean room and allowed to melt at about 25◦C ina laminar-flow bench. After melting, sub-samples were ho-mogenized by gentle shaking and then split in three parts inpre-cleaned plastic vessels, for analyses of insoluble aerosolcontent (Simoes et al., 2003), major ionic content by IonChromatography (De Angelis et al., 2003a) and trace ele-ment content by ICP-MS (this work). Sub-samples not beingimmediately analyzed were wrapped in moisture-proof tape(Parafilm M, Structure Probe) to minimize exchanges withthe atmosphere, and then they were frozen in cold chambersin double-sealed plastic bags.
2.1 Sample preparation and analysis by ICP-MS
Sub-samples to be analyzed by ICP-MS were allowed to meltand acid-digested before analysis to assure complete disso-lution of insoluble aerosol particles. These procedures werecarried out at the Laboratoire des Mecanismes et Transfertsen Geologie (LMTG), in Toulouse, France. Each sub-sample(5–10 ml) was evaporated in pre-cleaned Teflon beakers in alaminar-flow bench at 50◦C. The dry residues were dissolvedfor 24 h at 50◦C in a mixture of 1:1 HF:HNO3. The acid so-lution was then evaporated and the dry residues were dilutedin about 7 ml milli-Q water with 2% HNO3 (Sholkovitz et al.,1993; Freydier et al., 1998). Immediately before analysis a
A. Correia et al.: Trace elements in South America aerosol during 20th century 1339
Fig. 1. Ice core extraction site location at Illimani, in Eastern Bolivian Andes, South America. Distance between La Paz and Illimani is about40 km.
known amount of a solution containing In and Re was addedto each sample for calibration and elemental concentrationdetermination by the internal standard with external calibra-tion method.
Experimental conditions for the ICP-MS system (Elan6000, Perkin Elmer) are reported in Table 1. Each mea-sured elemental concentration is determined as the averageof ten replicates, which in turn are averages of ten consec-utive sweeps. The relative standard deviations of such se-quence of measurements are typically under 5% for each el-emental concentration. The sample introduction system iscomposed of a cyclonic spray chamber, a Meinhard nebu-lizer and a Knauer desolvation unit. This system is very use-ful for the analysis of low concentration natural waters be-cause it increases the sensitivity by a factor of 5–10 relativeto simple cross-flow nebulizers (Jakubowski et al., 1992). Afine aerosol cloud produced from the liquid sample enters theplasma torch and undergoes complete dissociation and ion-ization. The ions produced are separated according to theirmass/charge ratios and detected using a discrete dynode elec-tron multiplier. The reproducibility of the results in this sys-tem, using a riverine water standard (SLRS-4, National Re-search Council of Canada) during 11 months of analysis wasbetween 7–13% for Li, Na, Mg, Al, P, K, V, Cr, Co, Ni, Zn,Ga, As, Zr, Mo, Cd, Sb, Th, and U, and between 3–6% forTi, Mn, Fe, Rb, Sr, Y, Ba, La, Ce, Pr, Nd, Sm, Yb, Lu, andPb.
3 Results and discussions
3.1 General considerations
About 80% of annual precipitation at Illimani occurs duringaustral summer (DJF), having the Amazon Basin as the mainmoisture source (Vuille, 1999). Accordingly, prevailing windpattern at 500 hPa is from E-SE during summer and from W-NW during winter. Precipitation during austral winter (JJA)also comes from Amazon, reaching the site as convectivedisturbances that break against the prevailing westerly flow(Grootes et al., 1989). As a consequence of this wind flowpattern, coupling of precipitation events to El Nino SouthernOscillation (ENSO) is weak over the Eastern Andes (Vuilleet al., 2000).
The applied dating methodology of annual layer count-ing results in about 80 years (1919–1999) of environmentalrecord for the top 50 m of the Illimani ice core. Seasonalvariations of several chemical species made possible a year-by-year identification of annual layers over the whole pro-file. Dating was checked against historical horizons (Simoeset al., 2003), such as major volcanic events (eruptions ofPinatubo, 1991, and Agung, 1963) and atmospheric nucleartests (1962–63).
Quality assurance of sample handling and decontamina-tion procedures was controlled with laboratory blanks. Theaverage of two laboratory blanks per batch of 20–25 samples
1340 A. Correia et al.: Trace elements in South America aerosol during 20th century
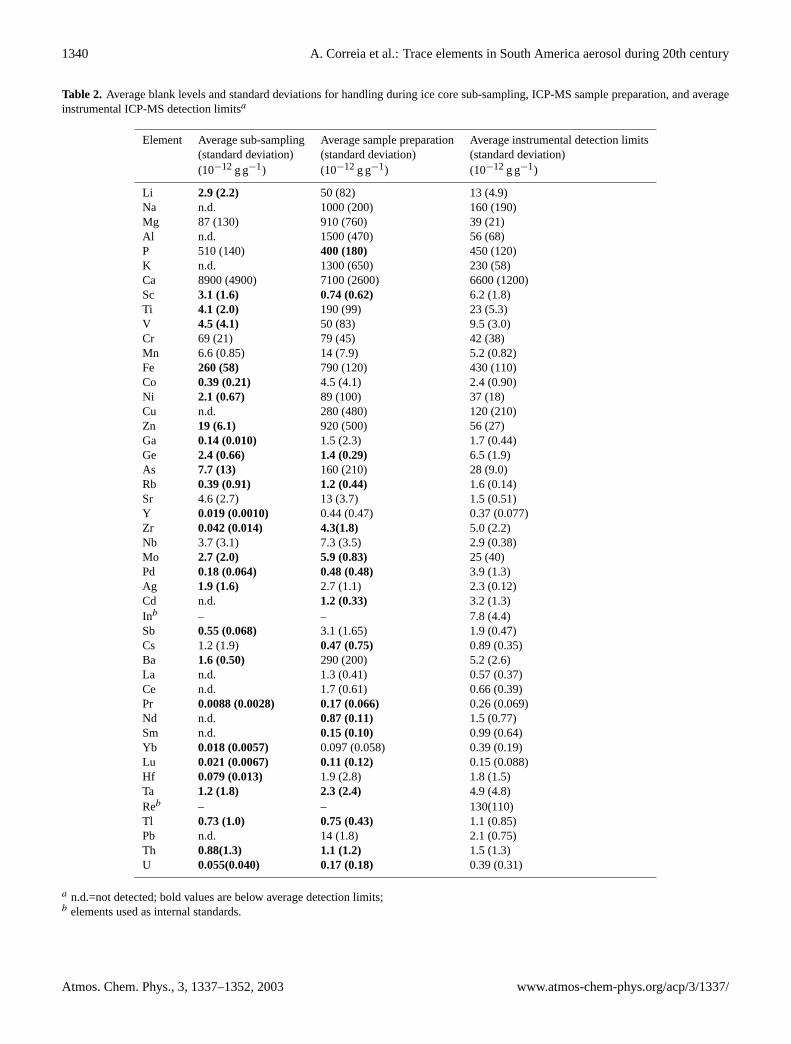
Table 2. Average blank levels and standard deviations for handling during ice core sub-sampling, ICP-MS sample preparation, and averageinstrumental ICP-MS detection limitsa
Element Average sub-sampling Average sample preparation Average instrumental detection limits(standard deviation) (standard deviation) (standard deviation)(10−12 g g−1) (10−12g g−1) (10−12 g g−1)
A. Correia et al.: Trace elements in South America aerosol during 20th century 1341
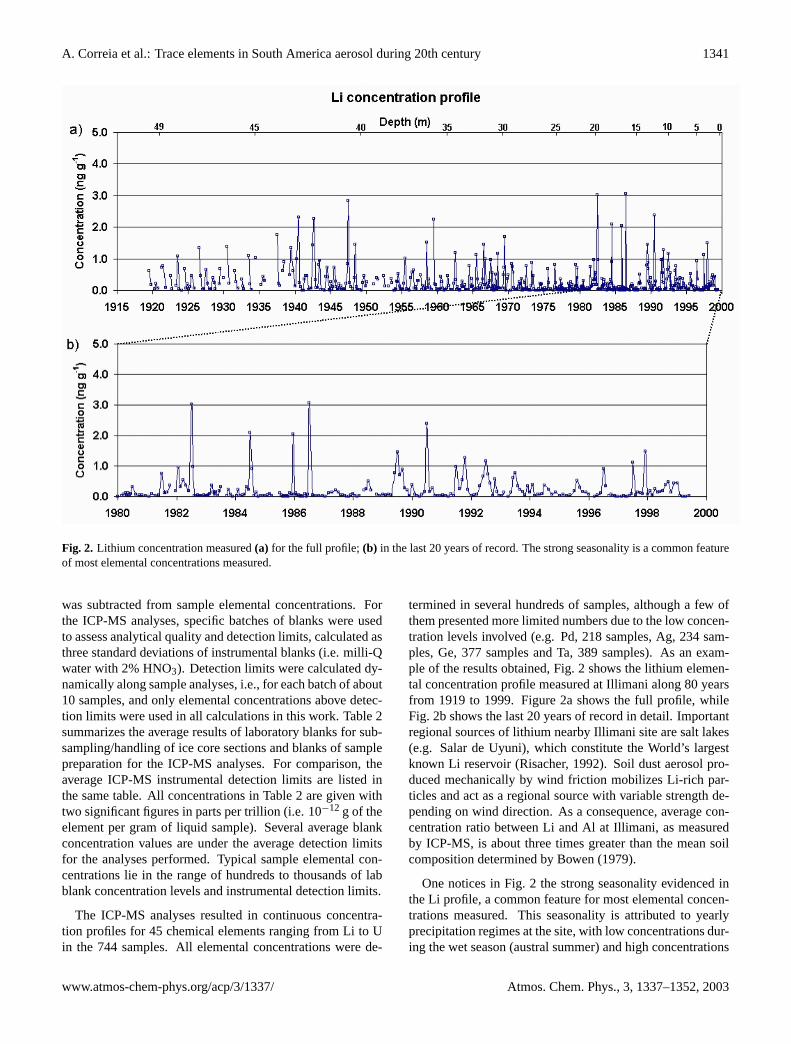
Fig. 2. Lithium concentration measured(a) for the full profile;(b) in the last 20 years of record. The strong seasonality is a common featureof most elemental concentrations measured.
was subtracted from sample elemental concentrations. Forthe ICP-MS analyses, specific batches of blanks were usedto assess analytical quality and detection limits, calculated asthree standard deviations of instrumental blanks (i.e. milli-Qwater with 2% HNO3). Detection limits were calculated dy-namically along sample analyses, i.e., for each batch of about10 samples, and only elemental concentrations above detec-tion limits were used in all calculations in this work. Table 2summarizes the average results of laboratory blanks for sub-sampling/handling of ice core sections and blanks of samplepreparation for the ICP-MS analyses. For comparison, theaverage ICP-MS instrumental detection limits are listed inthe same table. All concentrations in Table 2 are given withtwo significant figures in parts per trillion (i.e. 10−12 g of theelement per gram of liquid sample). Several average blankconcentration values are under the average detection limitsfor the analyses performed. Typical sample elemental con-centrations lie in the range of hundreds to thousands of labblank concentration levels and instrumental detection limits.
The ICP-MS analyses resulted in continuous concentra-tion profiles for 45 chemical elements ranging from Li to Uin the 744 samples. All elemental concentrations were de-
termined in several hundreds of samples, although a few ofthem presented more limited numbers due to the low concen-tration levels involved (e.g. Pd, 218 samples, Ag, 234 sam-ples, Ge, 377 samples and Ta, 389 samples). As an exam-ple of the results obtained, Fig. 2 shows the lithium elemen-tal concentration profile measured at Illimani along 80 yearsfrom 1919 to 1999. Figure 2a shows the full profile, whileFig. 2b shows the last 20 years of record in detail. Importantregional sources of lithium nearby Illimani site are salt lakes(e.g. Salar de Uyuni), which constitute the World’s largestknown Li reservoir (Risacher, 1992). Soil dust aerosol pro-duced mechanically by wind friction mobilizes Li-rich par-ticles and act as a regional source with variable strength de-pending on wind direction. As a consequence, average con-centration ratio between Li and Al at Illimani, as measuredby ICP-MS, is about three times greater than the mean soilcomposition determined by Bowen (1979).
One notices in Fig. 2 the strong seasonality evidenced inthe Li profile, a common feature for most elemental concen-trations measured. This seasonality is attributed to yearlyprecipitation regimes at the site, with low concentrations dur-ing the wet season (austral summer) and high concentrations
1342 A. Correia et al.: Trace elements in South America aerosol during 20th century
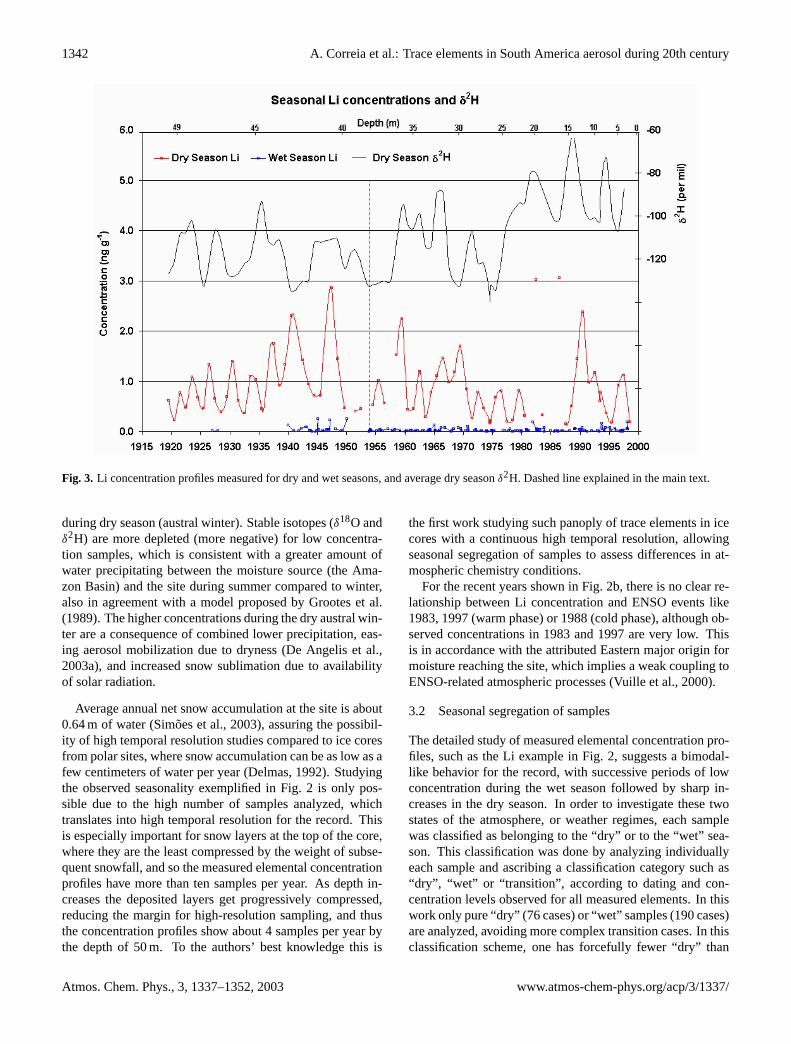
Fig. 3. Li concentration profiles measured for dry and wet seasons, and average dry seasonδ2H. Dashed line explained in the main text.
during dry season (austral winter). Stable isotopes (δ18O andδ2H) are more depleted (more negative) for low concentra-tion samples, which is consistent with a greater amount ofwater precipitating between the moisture source (the Ama-zon Basin) and the site during summer compared to winter,also in agreement with a model proposed by Grootes et al.(1989). The higher concentrations during the dry austral win-ter are a consequence of combined lower precipitation, eas-ing aerosol mobilization due to dryness (De Angelis et al.,2003a), and increased snow sublimation due to availabilityof solar radiation.
Average annual net snow accumulation at the site is about0.64 m of water (Simoes et al., 2003), assuring the possibil-ity of high temporal resolution studies compared to ice coresfrom polar sites, where snow accumulation can be as low as afew centimeters of water per year (Delmas, 1992). Studyingthe observed seasonality exemplified in Fig. 2 is only pos-sible due to the high number of samples analyzed, whichtranslates into high temporal resolution for the record. Thisis especially important for snow layers at the top of the core,where they are the least compressed by the weight of subse-quent snowfall, and so the measured elemental concentrationprofiles have more than ten samples per year. As depth in-creases the deposited layers get progressively compressed,reducing the margin for high-resolution sampling, and thusthe concentration profiles show about 4 samples per year bythe depth of 50 m. To the authors’ best knowledge this is
the first work studying such panoply of trace elements in icecores with a continuous high temporal resolution, allowingseasonal segregation of samples to assess differences in at-mospheric chemistry conditions.
For the recent years shown in Fig. 2b, there is no clear re-lationship between Li concentration and ENSO events like1983, 1997 (warm phase) or 1988 (cold phase), although ob-served concentrations in 1983 and 1997 are very low. Thisis in accordance with the attributed Eastern major origin formoisture reaching the site, which implies a weak coupling toENSO-related atmospheric processes (Vuille et al., 2000).
3.2 Seasonal segregation of samples
The detailed study of measured elemental concentration pro-files, such as the Li example in Fig. 2, suggests a bimodal-like behavior for the record, with successive periods of lowconcentration during the wet season followed by sharp in-creases in the dry season. In order to investigate these twostates of the atmosphere, or weather regimes, each samplewas classified as belonging to the “dry” or to the “wet” sea-son. This classification was done by analyzing individuallyeach sample and ascribing a classification category such as“dry”, “wet” or “transition”, according to dating and con-centration levels observed for all measured elements. In thiswork only pure “dry” (76 cases) or “wet” samples (190 cases)are analyzed, avoiding more complex transition cases. In thisclassification scheme, one has forcefully fewer “dry” than
A. Correia et al.: Trace elements in South America aerosol during 20th century 1343
Fig. 4. Ti concentration profile for wet season samples, and average wet seasonδ2H. Dashed lines explained in the main text.
“wet” samples, as they correspond to periods with less pre-cipitation along the years.
Figure 3 shows the resulting dry and wet season concen-tration profiles for lithium. Wet season concentrations arevery low compared to dry season ones, as expected from thediscussion before. There is an oscillatory pattern for the con-centrations during dry seasons in the beginning of 20th cen-tury, with a period ranging from 2 to 5 years, superimposedon an increasing trend. This is a common feature for mostelements measured as well as for insoluble aerosol particles,and suggests a relationship to the total amount of solar radi-ation and precipitation reaching the site, modulating the ob-served concentrations. The pattern gets more complex afterthe dashed line by mid-50’s, when the amplitude of dry sea-son concentrations suddenly changes. Accordingly, there aredistinct patterns for dry seasonδ2H in the two halves of thecentury, especially after 1955, as shown in Fig. 3. Theδ2Hseries represents measurements ofδ2H made at the Labora-toire des Sciences du Climat et de l’Environnement (LSCE,Gif-sur-Yvette, France), averaged over the same dry seasonsamples. The full analysis of stable isotopic content in Il-limani ice core is given by Ramirez et al. (2003). Stableisotopes in the Andes are inversely related to temperatureand precipitation history for short-term fluctuations, but re-main positively related to temperature in long-term variations(Thompson, 2000). In this case theδ2H series in Fig. 3 indi-cates a shift towards warmer temperatures during wintertime(dry season), starting by mid-70s. This suggests a threat tothe perspective of future research on Andean ice cores since
low wintertime temperatures are key to preserve ice-sheet in-tegrity.
Another important element, Ti, gives more clues about wetseason concentrations that do not appear in Li profile, be-cause of the low concentration values involved. Ti is a typi-cal element associated with regional soil dust aerosol, and re-produces well the behavior of other elements from that samesource. Figure 4 shows the wet season concentration profilefor Ti, together with the corresponding averages of wet sea-sonδ2H. There are pronounced local Ti concentration min-ima around 1930, 1950, 1960 and 1975 assigned by verticaldashed lines, which coincide with minima in theδ2H series.For the mostδ2H depleted wet seasons one has wetter condi-tions and largest amounts of precipitation, and then the mea-sured concentrations get to their lowest values. The afore-mentioned years mark roughly five multi-year periods whichcan more easily be identified in theδ2H series in Fig. 4: fromthe beginning of the record up to 1930, 1930–50, 1950–60,1960–75, and then from 1975 to the end at 1999. For allbut the last of these periods, concentration values during thewet season experience cycles during which they grow froma minimum value to a maximum value, and then start dimin-ishing towards the next minimum, as roughly indicated bythe curved dashed lines. Theδ2H record after 1975 is dif-ferent from the years before, but there is no clear trend as itwas the case for dry seasons, implying roughly stable aver-age temperatures during summer, but maybe with a differentperiodicity compared to the years before 1975.
1344 A. Correia et al.: Trace elements in South America aerosol during 20th century
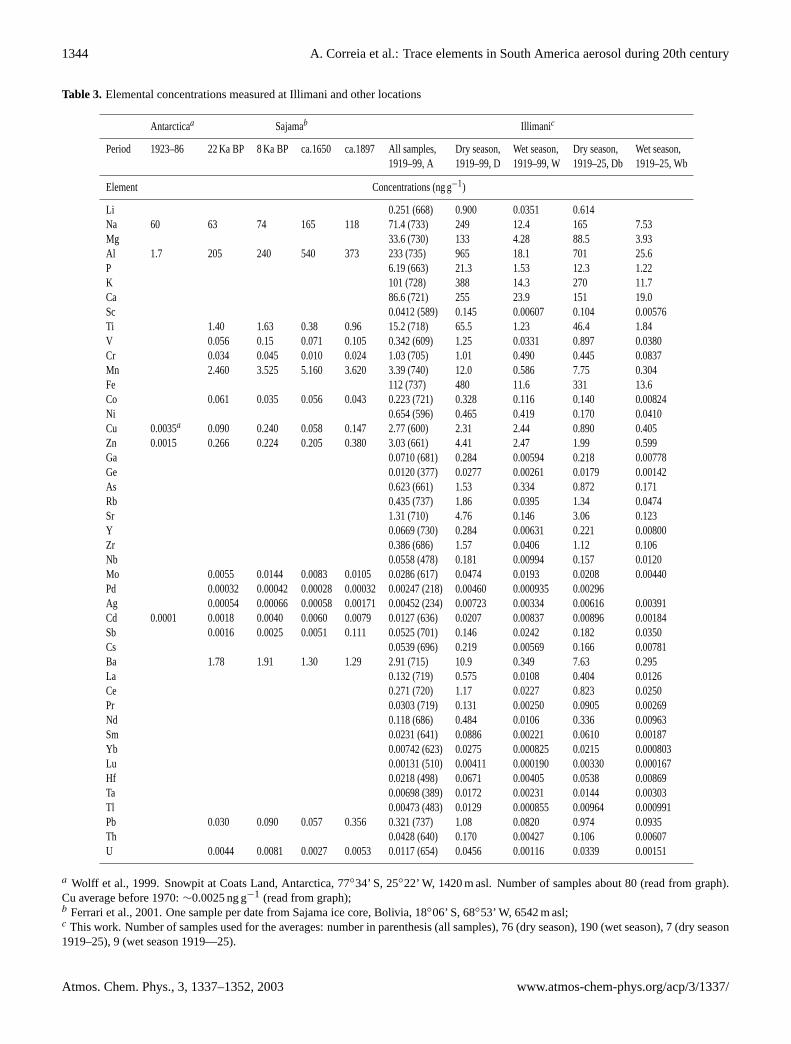
Table 3. Elemental concentrations measured at Illimani and other locations
Antarcticaa Sajamab Illimanic
Period 1923–86 22 Ka BP 8 Ka BP ca.1650 ca.1897 All samples, Dry season, Wet season, Dry season, Wet season,1919–99, A 1919–99, D 1919–99, W 1919–25, Db 1919–25, Wb
a Wolff et al., 1999. Snowpit at Coats Land, Antarctica, 77◦34’ S, 25◦22’ W, 1420 m asl. Number of samples about 80 (read from graph).Cu average before 1970:∼0.0025 ng g−1 (read from graph);b Ferrari et al., 2001. One sample per date from Sajama ice core, Bolivia, 18◦06’ S, 68◦53’ W, 6542 m asl;c This work. Number of samples used for the averages: number in parenthesis (all samples), 76 (dry season), 190 (wet season), 7 (dry season1919–25), 9 (wet season 1919—25).
A. Correia et al.: Trace elements in South America aerosol during 20th century 1345
3.3 Comparison with other works
Comparison of measured elemental concentrations with val-ues registered in other locations is important, although diffi-cult. Most elements presented here are often not measuredin ice core related works, either for a matter of adequacy ofthe measuring system or due to a more restrictive scientificapproach designed to address a specific question. Anotherproblem is the statistical robustness of available data, sincequite frequently one has few measured data points, thus com-promising the significance or reliability of the results. In Ta-ble 3 averages of elemental concentrations in this work arecompared to measurements at other locations in Antarctica(Wolff et al., 1999) and in the Western Andes (Ferrari et al.,2001). Samples from these sites were not acid-digested be-fore analysis, which may be a problem for the detection ofinsoluble elements, especially in the case of heavy aerosol-loaded Andean samples. For the site in Coats Land, Antarc-tica (200 km from sea shore), one has averages of about 80samples (as read from graph) of elemental concentrationsmeasured from a snowpit representing a time series from1923 to 1986. In Western Andes the measurements were per-formed on four samples from an ice core extracted at Sajamaice cap, Bolivia (about 200 km SW of Illimani), representingdifferent ages before the 20th century. Although the Sajamaice core site is located in the Bolivian Andes, precipitationand weather regimes are quite different from the conditionsat Illimani: while the main source of moisture reaching Il-limani is located to its East (Amazon Basin, and ultimately,the Atlantic Ocean), Sajama is impacted by moisture comingfrom the Pacific Ocean. Also Sajama presents a lower av-erage snow accumulation rate (0.40 m H2O/year) (Ferrari etal., 2001) compared to Illimani (0.64 m H2O/year) (Simoeset al., 2003).
The elemental concentrations at Illimani were averagedfollowing different methodologies in order to encompass di-verse possibilities for comparison with the results in Table 3.First, a global average of all 744 samples was computed, cor-responding to the time period from 1919 to 1999 (referredin the text as A). Then, the corresponding seasonal averagesfor the same period were computed using 76 samples for thedry seasons (marked as D) and 190 for the wet seasons (W).As discussed before, dry season samples give average up-per range limits for the measured concentrations, while wetseason averages correspond to lower range limits. Also, av-erages for dry and wet season concentrations (referred as Dband Wb) were calculated for the years at the beginning of therecord (7 and 9 samples respectively), from 1919 to 1925, toestimate elemental concentration ranges at the onset of the20th century.
In Table 3 one notices that several elemental concentra-tions measured at Sajama ice cap are compatible with the val-ues recorded at Illimani. For Na, the range covered by W to Dsamples brackets the values measured for Sajama. Althoughthis element is usually associated with sea salt aerosol, Fer-
rari et al. (2001) show that crustal enrichment factors for thiselement are close to unity at Sajama, and it can be associatedto soil dust. In Antarctica the measured Na is well withinthe range measured at Illimani and Sajama, but in this casethe origin should be coastal sea salt aerosol, since the frac-tion of exposed soil and the overall aerosol loading are smallcompared to the Andean sites. This is also reflected in thelow Al concentration recorded in Antarctica, compared to Il-limani and Sajama. The concentration range defined by Wto D averages at Illimani also encompasses the values at Sa-jama for Mn, Mo, Ba and U, especially when one considersthe natural environmental variability expressed as the samplestandard deviations (not shown) of the averages calculatedfor Illimani.
In general Ti, V and Cr measured at Illimani are abovethe measured values at Sajama. This could be related todifferent sensitivities of each site to the impact of soil dustaerosol sources, but one may not preclude differences in sam-ple preparation (acidic digestion) discussed before as a possi-ble explanation, since partial ionization of insoluble aerosolparticles may result in decreased or unstable measurementsof concentrations for some elements (Freydier, 1997). In thecase of Cr, one notices at Illimani an increase of seasonalconcentration ranges along 20th century, probably due to an-thropogenic emissions, since this element shows an averagewet season enrichment factor of about 102 (cf. Fig. 5 discus-sion below).
For Co, the concentration ranges Wb to Db, from the be-ginning of the 20th century at Illimani explain the valuesrecorded at Sajama. The Co average range W to D for thefull record suggests a higher level of this element present inthe atmosphere for the subsequent years. For Pb the situationis similar, with Wb to Db ranges covering the measurementsat Sajama, but also W to D. Remarkably, both ranges arequite similar, i.e., the average ranges of Pb concentration be-tween wet and dry seasons at the beginning of the century areclose to the average for the whole record. This could be re-lated to the impact of different sources along the record, likeAg mining (where Pb is rejected openly in the atmosphere)and Pb addition to automotive fuel in the second half of 20thcentury.
Cd measured at Sajama also corresponds to the range ob-served at Illimani at the beginning of the century (Wb to Db),but the average of all samples in the profile, A, is about oneorder of magnitude greater than top Db values, evidencingthe increase in Cd atmospheric concentrations along the cen-tury. This century-average is nearly two orders of magnitudegreater than the average concentration in Antarctica for aboutthe same period (1923–1986).
The Sajama sample dated ca. 1897 has Sb concentrationconsiderably higher than the values measured at the same sitefor the other three samples. This value is within the W toD and Wb to Db concentration ranges measured at Illimani.The low Sb concentration values for the three oldest sam-ples at Sajama may be due to a limited source strength over
1346 A. Correia et al.: Trace elements in South America aerosol during 20th century
Fig. 5. Average enrichment factors for the measured elements during dry and wet seasons:(a) heavily and moderately enriched elements;(b) lightly enriched elements.
the site, which could indicate a growing impact trend overthe Andes, but sample preparation methodology could alsoaccount for part of these differences.
The Zn average concentration in Antarctica is about 2000times below Zn average for the whole record at Illimani,while average Cu concentration in Antarctica before the1970s is about three orders of magnitude below century-average at Illimani. In the case of Ag, Pd, Cu and Zn, theconcentration values at Illimani are always higher than thoseregistered at Sajama. This could be due to a greater impactof mining activities upon Illimani than Sajama. Notice thatCu D and W averages are very similar, in accordance witha mining, rather non-seasonal, origin for this element. Fur-ther discussion on heavy metals measured at Illimani will begiven elsewhere.
3.4 Enrichment factors
The concentration profiles for Li (Fig. 3) and Ti (Fig. 4) showgeneral features of the record, which are echoed by most ofthe measured elements related to regional aerosol sources.An important tool used to estimate the contribution of othersources are enrichment factors, calculated from some refer-ence source. Enrichment factors (EF ) were calculated usingthe conventional equation:
EF =[X/Ref ]sample
[X/Ref ]ref erence
(1)
whereX is the concentration of the element one wants to cal-culate the enrichment factor for, andRef is the concentrationof the reference element to be used. After a careful study ofseveral possible choices, Al was assumed as the referenceelement for soil dust aerosol in this work.
Here the reference concentration ratios correspond to theaverage soil composition determined by Bowen (1979). Thischoice poses some difficulties, since there are fractionationprocesses occurring at the interface between the soil and theatmosphere when the aerosol is produced. Another disad-vantage arises from the fact that one deals with the mean soilcomposition, which may be different from regional soil con-ditions, such as the presence of the Li-rich salars. Nonethe-less, using this source allows other researchers to comparetheir results with the ones presented in this work, and so thisprocedure was adopted.
Figure 5 shows the averages of enrichment factors calcu-lated for all the measured elements, for dry and wet seasons.While wet season elemental concentrations are lower thandry season concentrations, their enrichment factors are al-ways more elevated for all measured elements. This indicatesthat during the dry winter season the aerosol reaching the sitetends to be closer to soil dust, maybe because of enhancedproduction of regional aerosol due to soil dryness, while dur-ing wet summer the regional coarse soil dust aerosol is moreefficiently removed by wet deposition processes than fineremotely-transported aerosol from other sources. Certainly
A. Correia et al.: Trace elements in South America aerosol during 20th century 1347
Fig. 6. Crustal enrichment factors and soil dust tracer concentration during dry (76 samples) and wet (190 samples) seasons for(a) La and(b) Cu.
this adds another perspective for the relevance of wet sea-son samples, with moisture coming from Amazon Basin tothe East, as one considers evaluating the impact of remotesources to the site.
Considering wet season enrichments, one can distinguishat least three groups of elements:
(a) heavily enriched elements, withEF>100: Cu, Ag (fewsamples), As, Sb, Zn, Cd, Mo, Co, Ni and Cr;
(b) moderately enriched elements, with 100<EF<10 ap-proximately: Tl, Na, Pb, P, Ge, Ca, Li, K and Ba;
(c) lightly enriched elements, withEF<10: Ta, Nb, Mg,Cs, Mn, Sr, Sc, V, Hf, Ce, U, Fe, Th, Pr, Sm, La, Rb,Nd, Ti, Lu, Ga, Yb, Y, Zr.
Heavily enriched elements are the most prone to originatefrom other sources than soil dust. Several elements in thisgroup, like Cu, As and Cd for example, are often associ-ated with pollution sources generated by human economicactivities. Hong et al. (1996) list Chile, to the Southwest ofIllimani, as the world’s largest Cu producer. Together withPeru to the North, the two countries (Fig. 1) are among thetop 5 main producers of Cu today (Hong et al., 1996), whichcan explain this element’s high average enrichment. In thegroup of moderately enriched elements one may have natu-ral species that come from other sources than purely from soil
dust, like Na, Ca and Li (from salars). P and K are elementsthat take part in natural biogeochemical cycles in Amazonia,upwind from the site. Zn is also present in natural biogenicemissions, but the high enrichment factors observed suggestrather an anthropic influence. Pb frequently has anthropicorigins, and a possible explanation for the observed enrich-ments could be mining activities at Chacaltaya to the Northof Illimani or leaded automotive gasoline still in use in LaPaz (R. Gallaire, personal communication, 2002). Elementswith enrichments close to one, like Fe, La and Ti, are as-sociated with the soil dust source, but clearly these valuesrepresent averages of all cases, so there may occur specialsituations where samples deviate from the mean value due tothe influence of other sources.
3.5 Characterization of regional soil dust aerosol
In order to investigate the influence of different sources uponthe measured elemental concentrations, one may examine therelationship betweenEF and Al concentration, as shown inFig. 6 for La (a) and Cu (b). La is a rare-earth element origi-nating from soil dust and with no known other sources in theregion, while Cu may originate from mining activities. InFig. 6a theEF for La show a stable pattern around unity, forboth dry and wet seasons, across four orders of magnitude ofAl concentration. In other words, the measured La/Al con-centration ratios are near the average soil dust composition,
1348 A. Correia et al.: Trace elements in South America aerosol during 20th century
Fig. 7. Crustal enrichment factors and soil dust tracer concentration during dry (76 samples) and wet (190 samples) seasons for(a) Li and(b) K.
irrespective of the soil dust tracer concentration. Wet seasonLa EF are noisier than the dry season’s, but there are morewet season samples, so this may be a mere statistical fluctu-ation effect. In contrast, Fig. 6b shows four orders of mag-nitude of Cu enrichment across the same range of Al con-centrations. As the samples get more heavily loaded withaerosol (i.e. high Al concentration), Cu/Al concentration ra-tios in dry and wet season samples tend toward mean soildust values, as the regional aerosol outweighs the influenceof other sources.
The pattern shown in Fig. 6b is a clear indication of theexistence of other sources, which grow in importance as theaerosol loading decreases in the samples. The same relation-ship betweenEF and Al concentration was investigated forall other measured elements. Figure 7 shows theEF acrossAl concentrations for Li and K. As discussed before, possi-ble sources for enriched Li are salars present in the region,while K has a variety of possibilities, among which includebiomass burning products coming from the Amazon Basin.The patterns for Li and K in Fig. 7 lie intermediate betweenthe ones for La and Cu shown in Fig. 6. Accordingly, theywere classified as belonging to the moderately enriched el-ements in Fig. 5a, due to their average enrichment factors.For both Li and K in Fig. 7 the wet season samples showEF
value ranges of about two orders of magnitude, implying thatmost impact from remote aerosol sources occur during thesummer season in the region. The biomass burning season
in Amazon Basin corresponds to the dry season, when thickhaze plumes leave the region yearly (Longo et al., 1999).This implies that the greatest KEF peaks during the wetseason must come from other sources, as this element partic-ipates in biogeochemical cycles in Amazonia. Statistically, ifany signal from biomass burning plumes during the dry sea-son gets to Illimani, it must be at least partly obscured by thestronger winter regional aerosol source, which forces theEF
to their lowest values.
In Fig. 7 the lowestEF during the dry season for both Liand K are clearly situated above one. As they form a plateauof EF at high aerosol loadings (i.e. high Al concentrations),one may consider this ratio as the “true” (or effective) char-acteristic ratio for the precipitating aerosol at Illimani, whichmay be different from the mean soil composition ratio due todifferences in the local soil composition and due to fractiona-tion during aerosol mobilization. The hypothesis behind thisassumption is that at the highest values of aerosol loadingsthe only source acting upon the site is the regional soil dustaerosol, and thus the conclusions drawn from it may be con-sidered valid as long as this hypothesis holds.
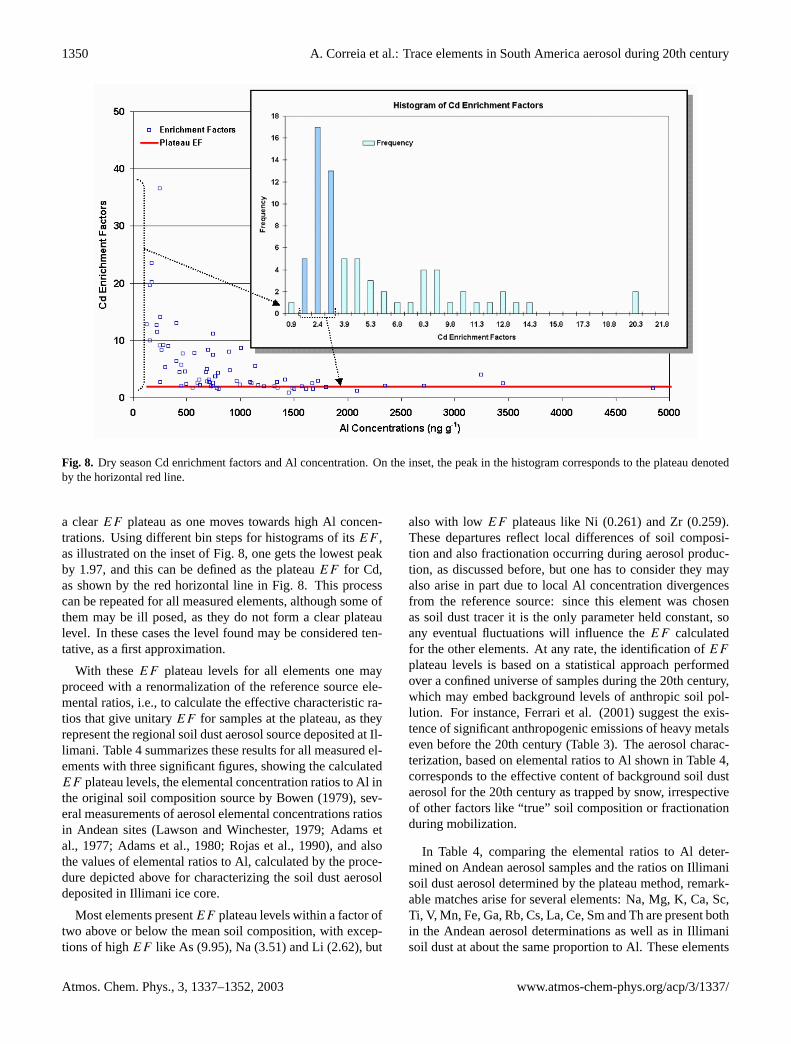
Most measured elements show the plateau ofEF for highAl concentrations in the dry season. By studying in detaileach element and plotting histograms of theirEF , one candefine the plateau levels as they peak in the lowest bins ofthe histograms. Figure 8 outlines this procedure for Cd en-richment factors during the dry season. This element shows
A. Correia et al.: Trace elements in South America aerosol during 20th century 1349
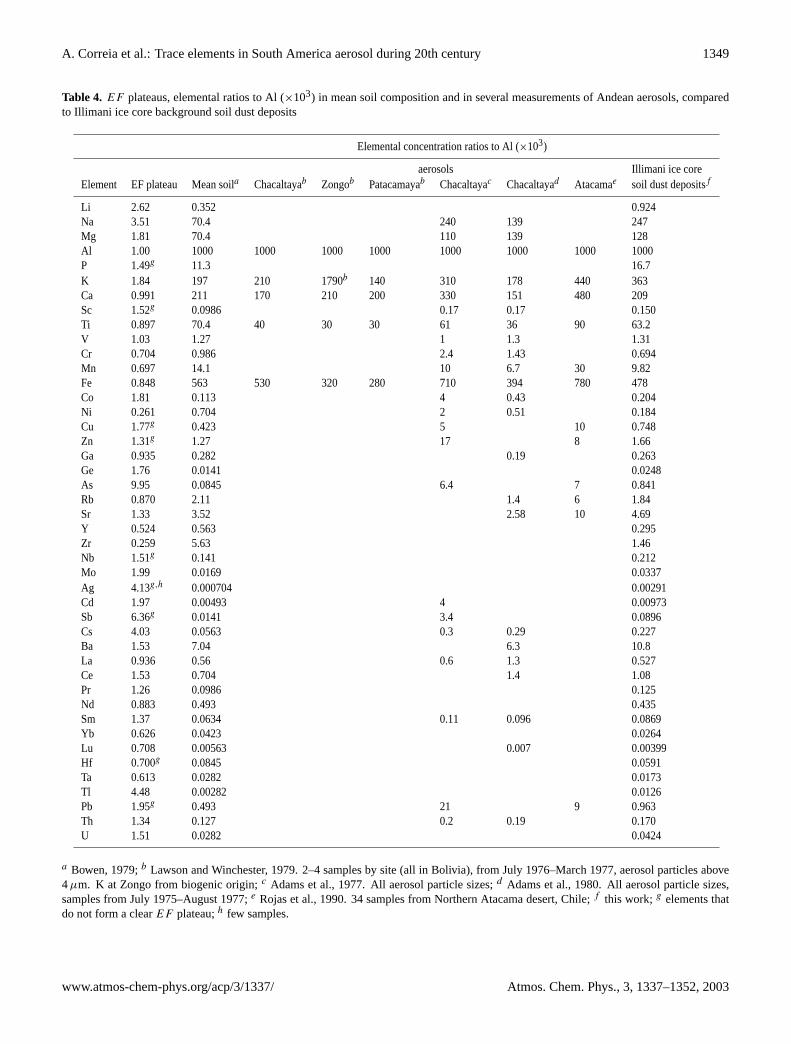
Table 4. EF plateaus, elemental ratios to Al (×103) in mean soil composition and in several measurements of Andean aerosols, comparedto Illimani ice core background soil dust deposits
Elemental concentration ratios to Al (×103)
aerosols Illimani ice coreElement EF plateau Mean soila Chacaltayab Zongob Patacamayab Chacaltayac Chacaltayad Atacamae soil dust depositsf
a Bowen, 1979;b Lawson and Winchester, 1979. 2–4 samples by site (all in Bolivia), from July 1976–March 1977, aerosol particles above4µm. K at Zongo from biogenic origin;c Adams et al., 1977. All aerosol particle sizes;d Adams et al., 1980. All aerosol particle sizes,samples from July 1975–August 1977;e Rojas et al., 1990. 34 samples from Northern Atacama desert, Chile;f this work;g elements thatdo not form a clearEF plateau;h few samples.
1350 A. Correia et al.: Trace elements in South America aerosol during 20th century
Fig. 8. Dry season Cd enrichment factors and Al concentration. On the inset, the peak in the histogram corresponds to the plateau denotedby the horizontal red line.
a clearEF plateau as one moves towards high Al concen-trations. Using different bin steps for histograms of itsEF ,as illustrated on the inset of Fig. 8, one gets the lowest peakby 1.97, and this can be defined as the plateauEF for Cd,as shown by the red horizontal line in Fig. 8. This processcan be repeated for all measured elements, although some ofthem may be ill posed, as they do not form a clear plateaulevel. In these cases the level found may be considered ten-tative, as a first approximation.
With theseEF plateau levels for all elements one mayproceed with a renormalization of the reference source ele-mental ratios, i.e., to calculate the effective characteristic ra-tios that give unitaryEF for samples at the plateau, as theyrepresent the regional soil dust aerosol source deposited at Il-limani. Table 4 summarizes these results for all measured el-ements with three significant figures, showing the calculatedEF plateau levels, the elemental concentration ratios to Al inthe original soil composition source by Bowen (1979), sev-eral measurements of aerosol elemental concentrations ratiosin Andean sites (Lawson and Winchester, 1979; Adams etal., 1977; Adams et al., 1980; Rojas et al., 1990), and alsothe values of elemental ratios to Al, calculated by the proce-dure depicted above for characterizing the soil dust aerosoldeposited in Illimani ice core.
Most elements presentEF plateau levels within a factor oftwo above or below the mean soil composition, with excep-tions of highEF like As (9.95), Na (3.51) and Li (2.62), but
also with lowEF plateaus like Ni (0.261) and Zr (0.259).These departures reflect local differences of soil composi-tion and also fractionation occurring during aerosol produc-tion, as discussed before, but one has to consider they mayalso arise in part due to local Al concentration divergencesfrom the reference source: since this element was chosenas soil dust tracer it is the only parameter held constant, soany eventual fluctuations will influence theEF calculatedfor the other elements. At any rate, the identification ofEF
plateau levels is based on a statistical approach performedover a confined universe of samples during the 20th century,which may embed background levels of anthropic soil pol-lution. For instance, Ferrari et al. (2001) suggest the exis-tence of significant anthropogenic emissions of heavy metalseven before the 20th century (Table 3). The aerosol charac-terization, based on elemental ratios to Al shown in Table 4,corresponds to the effective content of background soil dustaerosol for the 20th century as trapped by snow, irrespectiveof other factors like “true” soil composition or fractionationduring mobilization.
In Table 4, comparing the elemental ratios to Al deter-mined on Andean aerosol samples and the ratios on Illimanisoil dust aerosol determined by the plateau method, remark-able matches arise for several elements: Na, Mg, K, Ca, Sc,Ti, V, Mn, Fe, Ga, Rb, Cs, La, Ce, Sm and Th are present bothin the Andean aerosol determinations as well as in Illimanisoil dust at about the same proportion to Al. These elements
A. Correia et al.: Trace elements in South America aerosol during 20th century 1351
are most likely related to natural soil dust produced region-ally. However, as atmospheric aerosols correspond to a mix-ture of several natural and anthropic sources, one does notexpect identical concentration ratios to Al for all elementspresent in aerosol samples and at Illimani soil dust. In fact,anthropogenic pollution-related elements present higher con-centration ratios to Al in atmospheric aerosols than at soildust derived from Illimani: Cr, Co, Ni, Cu, Zn, As, Cd, Sband Pb. Notice, in particular, the high ratios for Cu/Al inChile (Atacama) and Pb/Al in Bolivia (Chacaltaya), due toanthropogenic activities in the region. Almost all measuredelements at Atacama desert by Rojas et al. (1990), exceptfor Pb and Zn, present higher concentrations relative to Althan Bolivian determinations, due to the existence of a signif-icant source of heavy metals in Chile linked to Cu production(Hong et al., 1996).
4 Conclusions
The measurement of concentrations for 45 elements in Il-limani ice core by ICP-MS continuously during the 20thcentury allowed studying elemental profiles at high tempo-ral, mostly sub-seasonal, resolution. With seasonal segrega-tion of samples thus made possible, one observes during dryaustral winter high elemental concentrations and low crustalenrichment factors. During this dry season regime, remotesources get obscured by regional soil dust aerosol, whichmay render difficult the identification of aerosol sources likebiomass burning from the Amazon Basin. The regional Il-limani soil dust aerosol is more easily produced during drywinter in comparison to wet season conditions due to dimin-ishing of wet deposition removal processes and parallel en-hancement of soil dryness. For wet austral summer the situ-ation is the opposite, with low elemental concentrations andsamples often showing high crustal enrichment factors. Dur-ing the wet season, aerosol deposition processes limit the im-pact of regional soil dust aerosol, allowing the identificationof elements with high crustal enrichments associated withanthropic sources, as well as moderately enriched elementsfrom other possible sources of long-range transported aerosol(e.g. salars, Amazonia).
The stable isotopic record, also analyzed under the sea-sonal segregation scheme, indicates a warming of winter-time average temperatures after the 1970s, but with no cleartrend for summer. The elemental concentrations record forwet seasons show a degree of modulation together with thestable isotopic record, as long-term, multi-year intervals. Inthese intervals most isotopic depleted years correspond togreatest amounts of precipitation and consequently to low-est recorded elemental concentrations.
Comparison of Illimani record to a few samples from an-other ice core in the Andes (Sajama, Western Bolivian An-des), shows that the ranges of average elemental concentra-tions between dry and wet seasons at Illimani correspond in
general to the values at Sajama. Differences arise mostlyfor species of anthropic origin, as indicated in Table 3, andare related to the proximity of Illimani to significant localsources. Mining-related species are more enriched at Illi-mani than Sajama even in the beginning of 20th century.
A detailed chemical characterization for the backgroundsoil dust aerosol deposited in the Andes was derived. Thiseffective characterization, shown in Table 4 as concentrationratios to aluminum, was only made possible by followinga research paradigm focused on the statistical robustness ofelemental concentration measurements, performed over Illi-mani samples covering 80 years during 20th century.
Acknowledgements.A. Correia thanks the IRD fieldwork team forextraction and transportation of the ice cores, the LGGE personnelfor fully supporting this work, Dr. Michel Valladon from LMTG formaking lab work possible for all those 744 samples and E. Ramirezfrom LSCE for measurements of stable isotopes content. This workwas supported by CNPq grant 142.683/98-1 and CAPES grant BEX0458/99-6. Ice core drilling expedition photos by Bernard Pouyaud.
References
Adams, F., Dams, R., Guzman, L., and Winchester, J. W.: Back-ground aerosol composition on Chacaltaya mountain, Bolivia,Atm. Env., 11, 629–634, 1977.
Adams, F., Van Craen, M., Van Espen, P., and Andreuzzi, D.: Theelemental composition of atmospheric aerosol particles at Cha-caltaya, Bolivia, Atm. Env., 14, 879–893, 1980.
Bowen, H. J. M.: Environmental Chemistry of the Elements, Aca-demic Press, London, 1979.
Clausen, H. B. and Langway Jr., C. C.: The ionic deposits in po-lar ice cores, in: The Environmental Record in Glaciers and IceSheets, Oeschger, H. and Langway Jr., C. C. (Eds), John Wileyand Sons, 225–247 1989.
De Angelis, M., Bonnaveira, H., Taupin, J.-D., Correia, A.,Ramirez, E., and Delmas, R. J.: Aerosol chemistry (major ions)in the Bolivian Andes from the Illimani ice core, Atm. Chem.Phys., in preparation, 2003a.
De Angelis, M., Simoes, J. C., Bonnaveira, H., Taupin, J.-D., andDelmas, R. J.: Volcanic eruptions recorded in the Illimani icecore (Bolivia): 1918–98 and Tambora periods, Atm. Chem. Phys.Discuss., 3, 2427–2463, 2003b.
Delmas, R. J.: Environmental information from ice cores, Rev. Geo-phys., 30, 1–21, 1992.
Ferrari, C. P., Clotteau, T., Thompson, L. G., Barbante, C., Cozzi,G., Cescon, P., Hong, S., Maurice-Bourgoin, L., Francou, B.,and Boutron, C. F.: Heavy metals in ancient tropical ice: initialresults, Atm. Env., 35, 5809–5815, 2001.
Freydier, R.: Chimie des precipitations en Afrique intertropicale:anions et cations majeurs,elements traces et acides organiques,Ph.D. Thesis, Universite Paul Sabatier, Toulouse, 1997.
Freydier, R., Dupre, B., and Lacaux, J. P.: Precipitation chemistryin Intertropical Africa, Atm. Env., 32, 749–765, 1998.
Grootes, P. M., Stuiver, M., Thompson, L. G., and Mosley-Thompson, E.: Oxygen isotope changes in tropical ice, Quelc-caya, Peru, J. Geophys. Res., 94, 1187–1194, 1989.
1352 A. Correia et al.: Trace elements in South America aerosol during 20th century
Hong, S., Candelone, J.-P., Soutif, M., and Boutron, C. F.: A recon-struction of changes in copper production and copper emissionsto the atmosphere during the past 7000 years, Sci. Total Env.,188, 183–193, 1996.
Jakubowski, N., Feldmann, I., and Stuewer, D.: Analytical im-provement of pneumatic nebulization in ICP-MS by desolvation,Spectrochim. Acta, 47B, 107–118, 1992.
Lawson, D. R. and Winchester, J. W.: A standard crustal aerosolas a reference for elemental enrichment factors, Atm. Env., 13,925–930, 1979.
Longo, K. M., Thompson, A. M., Kirchhoff, V. W. J. H., Remer, L.A., de Freitas, S. R., Dias, M. A. F. S., Artaxo, P., Hart, W., Spin-hirne, J. D., and Yamasoe, M. A.: Correlation between smokeand tropospheric ozone concentration in Cuiaba during Smoke,Clouds, and Radiation-Brazil (SCAR-B), J. Geophys. Res., 104,12 113–12 129, 1999.
Lorius, C., Raisbeck, G., Jouzel, J., and Raynaud, D.: Long-termenvironmental records from Antarctic ice cores, in The Envi-ronmental Record in Glaciers and Ice Sheets, Oeschger, H. andLangway Jr., C.C. (Eds), John Wiley and Sons, 343–361, 1989.
Ramirez, E., Hofmann, G., Taupin, J.-D., Francou, B., Ribstein,P., Caillon, N., Ferron, F. A., Landais, A., Petit, J.-R., Pouyaud,B., Schotterer, U., Simoes, J. C., and Stievenard, M.: A newAndean deep ice core from Nevado Illimani (6350 m), Bolivia,Earth. Plan. Sci. Let., 212, 337–350, 2003.
Risacher, F.: Geochimie des lacs sales et croutes de sel del’Altiplano Bolivien, Sci. Geol., Bull., 45, 3-4, 135–214, 1992.
Rojas, C. M., Figueroa, L., Janssens, K. H., Van Espen, P. E.,Adams, F. C., and Van Grieken, R. E.: The elemental compo-sition of airborne particulate matter in the Atacama desert, Chile,Sci. Total Env., 91, 251–267, 1990.
Sholkovitz, E., Church, T. M., and Arimoto, R.: Rare earth elementcomposition of precipitation particles and aerosols, J. Geophys.Res., 98, 20 587–20 599, 1993.
Simoes, J. C., Taupin, J.-D., Ribstein, P., Petit, J.-R., De Ange-lis, M., Ramirez, E., Hoffmann, G., Correia, A., Delmas, R. J.,Dupre, B., Ginot, P., and Francou, B.: Forty years of environ-mental record from the Nevado Illimani ice core, Central-EasternAndes, J. Geophys. Res., in preparation, 2003.
Thompson, L. G., Mosley-Thompson, E., Bolzan, J. F., and Koci,B. R.: A 1500-Year Record of Tropical Precipitation in Ice Coresfrom the Quelccaya Ice Cap, Peru, Science, 229, 971–973, 1985.
Thompson, L. G., Davis, M. E., Mosley-Thompson, E., Sowers, T.A., Henderson, K. A., Zagorodnov, V. S., Lin, P.-N., Mikhalenko,V. N., Campen, R. K., Bolzan, J. F., Cole-Dai, J., and Francou,B.: A 25 000-Year Tropical Climate History from Bolivian IceCores, Science, 282, 1858–1864, 1998.
Thompson, L. G.: Ice core evidence for climate change in the Trop-ics: implications for our future, Quat. Sci. Rev., 19, 19–35, 2000.
Vuille, M.: Atmospheric circulation over the Bolivian Altiplanoduring dry and wet periods and extreme phases of the SouthernOscillation, Int. J. Climatol., 19, 1579–1600, 1999.
Vuille, M., Bradley, R. S., and Keimig, F.: Interannual climate vari-ability in the Central Andes and its relation to tropical Pacific andAtlantic forcing, J. Geophys. Res., 105, 12 447–12 460, 2000.
Wagenbach, D.: Environmental records in Alpine glaciers, in TheEnvironmental Record in Glaciers and Ice Sheets, Oeschger, H.and Langway Jr., C.C. (Eds), John Wiley and Sons, 69–83, 1989.
Wolff, E. and Peel, D.: The record of global pollution in polar snowand ice, Nature, 313, 535–540, 1985.
Wolff, E. W., Suttie, E. D., and Peel, D. A.: Antarctic snow record ofcadmium, copper, and zinc content during the twentieth century,Atm. Env., 33, 1535–1541, 1999.