1 Tracing Integration of Text and Pictures in Newspaper Reading Jana Holsanova a , Nils Holmberg b & Kenneth Holmqvist b a Lund University Cognitive Science Kunsghuset, Lundagård S-222 22 Lund Sweden b Humanist laboratory, Lund University SOL centrum Helgonabacken 12 223 62 Lund Sweden [email protected]Keywords: information graphic, text-picture integration, referential links, eye tracking methodology, reading behavior, attentional guidance, cognitive load, spatial contiguity principle, dual scripting principle, radial and serial graphics, separated and integrated graphics, entry points and reading paths, integrative saccades, comprehension, information processing, newspaper design, information design, user-friendly instructional materials, metacognition Abstract. Newspapers and net papers are complex multimodal documents consisting of texts, pictures and graphics. Although we encounter such documents in our everyday life, there is still little empirical evidence about how these formats are processed. The question is how readers interact with these formats, combine information from all of the available sources and create coherence. In a naturalistic newspaper reading study, we measured eye movements during newspaper reading in order to track the integration of text and illustration in information graphics. Two pairs of information graphics have been designed to study the effects of a) the spatial contiguity principle and b) the dual scripting principle by means of eye tracking measurements. Our data clearly show that different spatial layouts have a significant effect on readers’ eye movement behavior. An integrated format with spatial contiguity between text and illustrations facilitates integration and prolongs reading. Reading of information graphic is significantly enhanced by a serial format, resulting from dual attentional guidance. The dual scripting principle is associated with a bottom-up guidance through the spatial layout of the presentation, suggesting a specific reading path, and with a top-down guidance through the conceptual pre-processing of the contents, facilitating information processing and semantic integration of the material. The integrated and serial formats not only attract readers’ initial attention, but also sustain the readers’ interest, thereby promoting a longer and deeper processing of the complex material. The results are an important contribution to the study of the cognitive processes involved in text-picture integration and offer relevant insights about attentional guidance in printed media, instructional materials and textbook design.
Transcript
1
Tracing Integration of Text and Pictures in
Newspaper Reading
Jana Holsanovaa, Nils Holmberg b & Kenneth Holmqvistb
Keywords: information graphic, text-picture integration, referential links, eye tracking methodology, reading behavior, attentional guidance, cognitive load, spatial contiguity principle, dual scripting principle, radial and serial graphics, separated and integrated graphics, entry points and reading paths, integrative saccades, comprehension, information processing, newspaper design, information design, user-friendly instructional materials, metacognition
Abstract. Newspapers and net papers are complex multimodal documents consisting of texts, pictures and graphics. Although we encounter such documents in our everyday life, there is still little empirical evidence about how these formats are processed. The question is how readers interact with these formats, combine information from all of the available sources and create coherence. In a naturalistic newspaper reading study, we measured eye movements during newspaper reading in order to track the integration of text and illustration in information graphics. Two pairs of information graphics have been designed to study the effects of a) the spatial contiguity principle and b) the dual scripting principle by means of eye tracking measurements. Our data clearly show that different spatial layouts have a significant effect on readers’ eye movement behavior. An integrated format with spatial contiguity between text and illustrations facilitates integration and prolongs reading. Reading of information graphic is significantly enhanced by a serial format, resulting from dual attentional guidance. The dual scripting principle is associated with a bottom-up guidance through the spatial layout of the presentation, suggesting a specific reading path, and with a top-down guidance through the conceptual pre-processing of the contents, facilitating information processing and semantic integration of the material. The integrated and serial formats not only attract readers’ initial attention, but also sustain the readers’ interest, thereby promoting a longer and deeper processing of the complex material. The results are an important contribution to the study of the cognitive processes involved in text-picture integration and offer relevant insights about attentional guidance in printed media, instructional materials and textbook design.
2
Although we frequently encounter complex documents in our everyday life, there is still very little empirical evidence about how these formats are processed. Newspaper layout, for instance, contains text articles, headlines, photos, captions, tickers, drop quotes, fact boxes, maps, diagrams, tables etc. The question is how do readers interact with this format to combine information from all of the available information sources and to create coherence. Jacob and Karn (2003) express this concern in the following way: “While there is a wealth of literature dealing with fixation patterns both in reading and in picture perception, little data exists on the viewing of pictures and text in combination as they often occur in instructional materials, news media, advertising, multimedia content, etc.” (p. 587). The aim of our paper is to make a contribution to the study of the cognitive processes involved in text-picture integration and offer relevant insights about attentional guidance in printed media. First, we introduce information graphics as a complex genre in newspapers and show examples of how readers interact with it. Second, we discuss text-picture integration and the use of various referential links. Third, we focus on three important principles steming from the cognitive load theory and cognitive theory of multimedia learning that are relevant for our empirical study. Fourth, we present the method, data analysis and results from our naturalistic eye tracking studies on reading information graphics with two embedded control conditions. Finally, in the discussion of results, we focus on the role of attentional guidance, comprehension and metacognition.
1 INFORMATION GRAPHIC
In our naturalistic study with experimental conditions, we use eye tracking measurements to investigate authentic reading of information graphic, a complex genre used frequently in newspapers, brochures, textbooks and scientific articles. Eye movements provide “an unobtrusive, sensitive, real-time behavioral index of ongoing visual and cognitive processing” (Henderson & Ferreira 2004:18), and give us insight in the allocation of attention. Eye-tracking methodology can be used to examine how readers choose entry points and reading paths (Holsanova et al. 2006), and how they integrate text and pictures. A study of authentic newspaper reading behavior enables us to investigate in detail how the human mind works when making sense of complex instructional materials. The information graphic (or infographic) is a visual
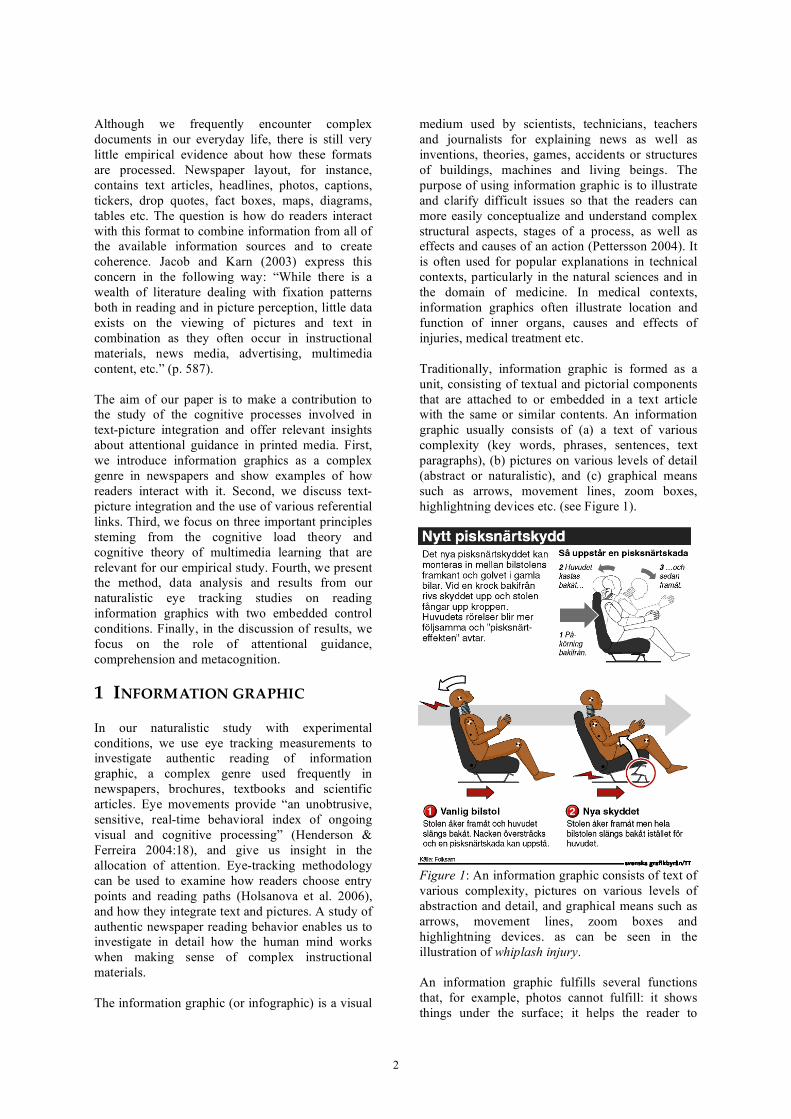
medium used by scientists, technicians, teachers and journalists for explaining news as well as inventions, theories, games, accidents or structures of buildings, machines and living beings. The purpose of using information graphic is to illustrate and clarify difficult issues so that the readers can more easily conceptualize and understand complex structural aspects, stages of a process, as well as effects and causes of an action (Pettersson 2004). It is often used for popular explanations in technical contexts, particularly in the natural sciences and in the domain of medicine. In medical contexts, information graphics often illustrate location and function of inner organs, causes and effects of injuries, medical treatment etc. Traditionally, information graphic is formed as a unit, consisting of textual and pictorial components that are attached to or embedded in a text article with the same or similar contents. An information graphic usually consists of (a) a text of various complexity (key words, phrases, sentences, text paragraphs), (b) pictures on various levels of detail (abstract or naturalistic), and (c) graphical means such as arrows, movement lines, zoom boxes, highlightning devices etc. (see Figure 1).
Figure 1: An information graphic consists of text of various complexity, pictures on various levels of abstraction and detail, and graphical means such as arrows, movement lines, zoom boxes and highlightning devices. as can be seen in the illustration of whiplash injury. An information graphic fulfills several functions that, for example, photos cannot fulfill: it shows things under the surface; it helps the reader to
3
conceptualize how something is constructed or how something functions; it explains dynamic processes step by step; it creates a coupling between parts of the whole while depicting several perspectives at once. Infographic also makes use of graphs, diagrams, statistics and other visual representations. An information graphic contains a specialized form of (partly abstract) depictions that require a certain level of graphicacy from the reader and have to be learned (Scheiter et al., forthc). In addition, the process relations between the components are often made explicit with the help of multiple depictions, arrows, or movement lines. (Hegarty & Just 1993). According to Nigel Holmes – one of the world’s leading infographic experts and manager of Time Magazine – information graphics “makes numbers, processes and facts understandable” (Errea 2005:x).
1.1 A step aside to the history … Apart from cave paintings and old maps, the history of information graphics goes back to Leonardo da Vinci’s explicative drawings from around 1500 and to William Playfair’s economic charts and diagrams in the end of the 18th and beginning of the 19th century. A well known infographic containing a combination of text and graphics was published in Time in 1806 and described a crime from a plan view of a house where the owner had been murdered. The best statistical infographic ever created is the graphic of Napoleon’s march to Moscow, designed by Charles-Joseph Minard in 1861. It contains a map, and it captures four different variables: the army’s march direction, the location of the troups, the decreasing size of the army, and the falling air temperature. According to Edward Tufte, “Graphical excellence is that which gives the viewer the greatest number of ideas in the shortest time with the least ink in the smallest place.” In the 1920’s and 1930’s, the Austrian economist and sociologist Otto Neurath created a system of pictorial symbols (Isotype) to be used as a universal visual language. Later on, information graphics played an important role in explaining events during the 2nd World War when photographs were not available. Its role then expanded during the Falklands War, Chernobyl, and, finally, the Gulf War. Peter Sullivan, who worked in the 1970’s-1990’s, is considered to be the father of modern graphical journalism. Today’s best known graphical artists and designers in the newspaper business are Nigel Holmes, John Grimwalde, and Duncan Mill. To the classical works on information graphics belong Bertin’s book on Semiology of Graphs from 1983 and Tufte’s book on The Visual Display of Quantitative Information from 2001. The ’first revolution’ in the use of infographics is often attributed to the use of computers and powerful software, while the ‘second revolution’ is attributed
to the arrival of Internet and animations. Currently, text, pictures, films, animations, sounds, and interactive diagrams are a part of the new generation of information graphics. More details about the history of infographics can be found in Kieper (1995: 9-46).
2 TEXT-PICTURE INTEGRATION AND REFERENTIAL LINKS
With this sufficient historical background in mind, let us now return to the form and content of information graphic. The information graphic is usually attached to or embedded in an article text with the same or similar contents. Unlike encyclopedia entries, there usually is no explicit reference or link in the main article text advising the reader to look for an accompanying illustration. In fact, in most complex materials, there are no explicit connections between text and illustration that would instruct the reader. When the eyes reach a certain point in the text, it is the reader who has to discover the semantic referential links between the text and the graphics which are usually placed far from each other. Three issues are relevant to discuss at this point: a) how text and pictures are semantically related to each other in complex materials, b) how connections between relevant pieces of textual and pictorial information are marked for the readers, and c) how readers integrate information in complex materials consisting of unmarked relations between text and pictures.
2.1 Text-picture relations The analysis of text and pictures has a long tradition within semiotics and socio-semiotics (Barthes, 1964; 1980; Eco, 1971; 1976; Kress & van Leeuwen, 1996), in interface design (Bernsen, 1994; Mullet & Sano, 1995), in human–computer interaction (Maybury, 1995, Preece 1994), and in textlinguistics (Teleman 1989, 1994). The perspectives in these works differ (Holsanova, 1999), whereby some stress the differences between text and pictures with regard to their suitability for expressing specific information (Bernsen, 1994; Mulet & Sano 1995, Nöth 2003), others stress the similarities between text and pictures, based on the assumption that both verbal and graphic elements are rule-based signs that derived from a common underlying conceptual structure, have similar expression capabilities and can be analysed by same analytic tools (Kress & van Leeuwen 1996, Tversky 2003), while yet others are more interested in the interplay between text and pictures (Barthes, 1964). In the Swedish context, a special narrative format called ’lexivision’ was created in the 1950ies, (Pettersson, 2000). Lexivision was used in encyclopedia works and focused on the interplay between text and pictures, as well as on the unity of
4
the overarching visual form and thematic content of the entry. Also, the relation between text and picture has been discussed in different genres. Winfried Nöth (2003) mentions semantic and syntactic congruity in photo captions, and distinguishes various relations between text and photos: discrepancy, incompatibility, contradiction, redundancy, and dominance. Picture annotations have also been studied in social science textbooks (Melin 1990), history textbooks (Sandqvist 1995) and encyclopedias (Pettersson (2000). According to these authors, picture captions fulfill a labeling function, they repeat the information given in the text, give additional information that is not known from the text, enlighten the reader about the picture or the artist, instruct the reader, or create a certain emotional mood. In his analysis of advertisements, Roland Barthes (1964, 1980) introduces the concepts of ancrage and relais. Ancrage means that the text constrains the reading of the image (e.g. as in advertisement annotations). Relais means that textual and pictorial elements are complementary, and thus, both necessary for the interpretation of the message (e.g. as in the comic series). The most prominent analysis of the instructional functions associated with the use of visualizations as text-adjuncts in the education literature has been conducted by Levin et al. (1987). In their review, the authors describe five functions of visualizations as text adjuncts: decorative, representational, organizational, interpretational, and transformational function. A similar classification has been provided by Pozzer and Roth (2003), who looked at functions of photographs in textbooks. In these works, individual pieces of text are usually connected with individual image elements somewhere else on the page. However, when applying these functions to complex materials, finding the relevant connections and rhetorical clusters becomes a very complex task (Bateman 2008). In the present study on reading information graphic, we will focus on the interplay between text and illustrations by testing layouts supporting their integration.
2.2 Referential links between text and illustrations
The extent of marking semantically relevant pieces of textual and pictorial information for the readers differs. It seems obvious that it is easier for the reader to integrate information of a complex document if there are explicit links showing how text and illustrations should be used in conjunction. The linkage between text and pictures can be unidirectional or bidirectional, made through a variety of explicit markers or implicit indicators (for a detailed analysis of co-reference in
multimodal documents see Habel & Acartürk, to appear). First, the linkage can be indexical by using different kinds of markers: typographical markers, numerical markers (numbers) or alphabetical markers (letters) placed next to the elements that should be linked together. Second, the linkage can be expressed explicitly by a verbal (metatextual) reference to the picture. Third, text and pictures can be linked by graphical markers (e.g. using arrows and/or lines between elements) which indicate the parts belonging to each other. Or, fourth, text and picture can stand alone without any explicit linking markers while still being treated as a unit because their relation is marked by the compositional closeness or spatial proximity (Nord forthc, Holsanova et al. 2005, Holsanova et al., forthc). The principle of physical closeness builds upon the Gestalt principle of proximity (Köhler 1947): those parts of the layout that are spatially contingent are perceived as one unit or cluster. In connection to this implicit spatial linkage, Schriver (1997) talks about rhetorical clusters: ”By rhetorical cluster, I mean a group of text elements designed to work together as a functional unit within a document. Rhetorical clusters act as reader-oriented modules of purposeful and related content. They are comprised of visual and/or verbal elements that need to be grouped (or put in proximal relation) because they help the reader interpret the content in a certain way.” (Schriver 1997:343). Examples of such clusters are illustrations with annotations and explanations, body text with footnotes, or procedural instructions with visual examples. Nord (forthc), who has analyzed 18 illustrated Swedish gardening handbooks from 1600 to 2005, looked closely at a) the semantic relation between text and picture (direct, thematic coupling on paragraph or sentence level or indirect, associative coupling on the basis of an overarching general topic); b) the closeness of text and picture in the layout (picture and the related text being placed either directly next to each other, or on the same spread but not immediately next to each other or on another spread); and c) the linkage between picture and text. When looking at the development of text-graphic relations over time, Nord found that between 1600-1831, corresponding picture and text typically was not placed on the same spread, but rather connected by an explicit metatextual linkage (’see the picture on the next page’). Later on, between 1800-1900, – in part due to technology – picture and text typically were placed directly next to each other – the picture sometimes even intruding the text space – and connected by a bidirectional linkage with numerical markers, promoting a linear reading. After 1910, picture and the related text often were
5
on the same spread but not immediately next to each other. A unidirectional linkage was used occasionally (between 1900 and 1948). However, in the most recent handbooks (1900-2005), the prevailing pattern is a missing linkage and an implicit coupling of text and pictures. On the basis of his analysis, Nord (forthc) has identified a clear tendency towards less guidance along one linear reading path and more openness for a varied way of reading. He draws the conclusion that today’s gardening handbooks fulfill different functions for different purposes: They can be read in depth for comprehensive information, seek for a specific piece of advice, or scanned and browsed for inspiration. Since the producers of the handbook do not know what information will be the relevant focus in the moment of reading, the text structure has to offer the reader a possibility for making his or her own choice, deciding about entry points and reading paths, and thereby becoming an active creator of the handbook ’text’. In our present study, we will consider the ’normal’ case for information graphic where the relation between text and illustrations is not explicitly marked by links but is rather implicit, achieved by spatial proximity.
2.3 Readers’ integration of the material The third aspect under discussion concerns readers’ interaction with a complex material consisting of text and pictures. Not only does information graphic appear in many different types of materials, but – as empirical studies have shown – it also has an important effect on reading behavior since it catches readers’ attention and prolongs reading. In a comprehensive eye tracking study of seventeen
Scandinavian newspapers, Holmqvist and Wartenberg (2005) showed that information graphic increases reading time of an associated text more than any other graphical or photographic element. The average time spent looking at a photo is less than a second, while information graphic can be studied for up to several minutes. Thus, if we want to increase the reading time of an article text, adding information graphic will have a significantly better effect than adding a map, a drawing, or a photo. Some previous empirical eye tracking studies show evidence for text-picture integration. Eye movement studies by Hegarty and Just (1993) have shown that students switch between a portion of text and a corresponding portion of the diagram, although the relations between them are not explicitly marked. Integrative behavior was observed at specific parts of the text where readers interrupted their reading process and switched to the diagrams. The fact that these transitions occurred between the semantically related parts of text and diagrams shows that the readers were constructing referential connections between text and graphics as well as integrating information during several local and global inspections. Holmberg and Holmqvist (2004) found instances of reading behavior where information graphics was typically read in close conjunction with the text. What happens is that the readers move their eyes between text and graphics to integrate the two types of information. This movement seems to occur especially when the text or the graphics require the other modality for a full understanding. An example of such integration of text and information graphics can be seen in Figure 2.
6
Figure 2: Information graphics about groin injury embedded in the article text. The reader reads the heading, the summary and the article text to a certain point in the text where he switches to the graphics. At this point, the text reads: ”Doctor Ericsson has no short simple explanation to offer, because it is tricky. The problems may have different causes and can be felt differently”. The vague statement in the main article text to “different causes” spurs this reader to look for clarifications in the graphics. He is examining the different components of the information graphics and then returning to the same place where he stopped reading. The integration of text and pictures, however, is not an easy matter and can cause problems for certain group of readers. Hannus and Hyönä (1999), who conducted a study involving 10-year old pupils integrating illustrations and texts in biology books, found that the high-ability students were significantly better at making the correct gaze movements between main text and graphics than the low-ability students. This is an indication that graphically unmarked connections between text and graphics may be difficult to follow for some readers. The question is then, how we can make it cognitively easier for the readers to integrate information from different sources? Different design principles have been suggested in the literature, one of them being the spatial contiguity design where verbal and visual information is
placed physically close to each other and thus can be easily processed by the readers without split attention effects (for details see next section; cf also Cierniak, Scheiter & Gerjets, forthc; Schmidt-Weigand, forthc). Further, in materials containing both text and illustrations, attention alocation to relevant parts of the presentation has been directed by textual reference to the illustration, by a keyword or label, by graphical means such as arrows, pointers, and speech bubbles, by color coding in printed documents (as in Folker & Ritter 2003, Folker, Sichelschmidt & Ritter 2005), or by spreading color effect in animations (Lowe & Boucheix, forthc). Finally, as we will show in the following, spatial layout and a coherent, conceptually pre-processed format, can guide the readers and contribute to easier processing of complex materials.
7
3 ATTENTIONAL GUIDANCE AND COGNITIVE LOAD
In the following section, we will discuss the attentional guidance of readers and focus on three theoretical principles that are relevant for our empirical eye tracking study of reading information graphics. There are several methods how to improve readers’ orientation and navigation in the layout. Readers can be guided either by the rhetorical organization of the material, by metatextual means, or by graphical means (headings, subheadings, key words, bold style etc.). Melin (2000) discusses how a combination of language use and functional graphic design can guide readers’ attention, affect reading speed, support memory and influence appreciation of the text. Melin also asks whether the readers always need a ’leading hand’, or whether they prefer to find their own way through the text. He suggests that there are two groups of readers in print media: the ’metatext-lovers’ who want the writer to present the outline of the text with the help of metatextual means and the ’paratext-lovers’ who want to choose their own paths through the text and appreciate when the text structure is signalled by graphical means. In connection to attentional guidance through a visual layout, we have to mention two notions: the notion of affordances and the notion of metacognition (cf also Holsanova forthc.). According to the proponent of ecological psychology, J. J. Gibson (1979), the artefacts in our environment contain functional attributes, so called affordances, that can be perceived and acted upon by humans (for instance perceiving a door handle as graspable or as turnable invites us to different interaction). The notion of affordances can be even applied to a complex newspaper layout. We can view the newspaper layout as a tool using various cultural-specific communicative resources to invite the reader for certain kind of interaction. The reader recognizes the functional patterns and principles behind the layout structure, knows where to look for specific things, how to find entry points and possible reading paths, how to recognize information hierarchies etc. Thus, the structure of the newspaper layout offers the reader certain directions and shows possible ways of exploration and guides the reader towards interesting or promising items. Metacognition is associated with planning, monitoring, evaluating and repairing performance (Kirsh 2005). It concerns readers’ awareness about their own thinking, e.g. their knowledge of how to acquire information, how to interpret a complex text, how to use this knowledge to support memory
and learning etc. In terms of situated and distributed cognition, the reader is interacting with the materials that contain various kinds of cue structures, revealing the affordances for the use of the materials. These cue structures (headings, italics, key words, lists, summaries, diagrams) play an important role for the interaction with the documents. They structure the contents, guide readers’ attention and navigation, orient the reader on the page, train the readers to expect and subsequently find helpful reference materials spatially distributed at certain locations, and help the readers in their planning process. Kirsh alludes to Vygotsky’s zones of proximal development when stating that ”Interaction can be designed to improve ‘the proximal zone of planning’ – the look ahead and apprehension of what is nearby in activity space that facilitates decisions.” (Kirsh 2005:147). Thus, functional visual design with an effective cue structure can control user behavior, affect workflow, support the learning process and contribute to better comprehension and performance. Principles for readers’ guidance leading to reduction of cognitive processing load are formulated in the theory of multimedia learning (Mayer, 2001, 2005) and cognitive load theory (Chandler & Sweller, 1991; Sweller et al. 1998). According to these theories, instructional materials should be designed to prime the integration of pictorial and verbal representations into a coherent mental representation. Cognitive load theory (Sweller et al. 1998) provides guidelines for instructional design with the aim to encourage learner activities and optimize performance. The cognitive load is either determined by the nature of the material being learned and the expertise of the learner (intrinsic cognitive load) or by instructional design, organization and presentation of information (extraneous cognitive load). According to this theory, presentation of information should reduce working memory load and encourage schema construction. Cognitive theory of multimedia learning (Mayer 2001, 2005) specifies which cognitive processes that learners are actively engaged in when constructing a coherent mental representation of their experiences. Instructional materials should be designed to prime these processes. Cognitive theory of multimedia learning formulates principles for reducing cognitive processing and extraneous overload. The nature of mental representations in multimedia learning is described in detail in Schnotz & Bannert’s (2003) model of text and picture integration. Other theoretical accounts have also considered coherence of complex presentations to be central
8
for reading and comprehension. It has been focused on in the rhetoric tradition, and in this line of research, attempts have been done to apply it to illustrated documents (Bateman, forthc). The structure of complex multimodal documents and the process of meaning-making has been discussed in the (socio)semiotic tradition (Kress & van Leeuwen, 1996). However, few empirical studies of authentic reading behavior have been conducted in order to reveal these ongoing cognitive processes. Recent studies of Van Gog, Paas & Merrienboer (2005) and Van Gog, Kester, Nielvelstein, Giesbers & Paas (forthc) stress the importance of using eye-tracking and other process-tracing techniques to uncover exactly how and why well-known cognitive load theory effects occur. Three principles from multimedia learning theories are relevant for the current study. The first of them is the spatial contiguity principle stating that “people learn more deeply from a multimedia message when corresponding words and pictures are presented near rather than far from each other on the page or screen” (Mayer 2005: 183, cf also Chandler & Sweller 1991, 1994; Sweller et al. 1998, Moreno & Mayer 1999). When readers interact with complex messages, they have to read the text and scan the illustration, process both to derive meaning, search for referents and mentally integrate the contents. This process can be cognitively demanding if the two sources of information are placed far from each other (so called split attention format, Sweller et al. 1998). The theory suggests that extraneous cognitive load can be reduced and schema construction facilitated by physically integrating the two sources of information. The second one is the signalling principle stating that “people learn more deeply from a multimedia message when cues are added that highlight the organization of the essential material” (Mayer 2005:183). Several signalling techniques can be used to guide the learner's attention, such as providing headings, lists of the main steps, and a spoken emphasis on key words. In the present paper, we will apply a parallel attentional guidance through form and content of the material that we call the dual scripting principle. The dual scripting principle states: “People will read a complex message more deeply when attentional guidance is provided both through the spatial layout (supporting optimal navigation) and through a conceptual pre-processing of the contents (supporting optimal semantic integration)”. In a broader sense, the new serial layout is associated with the signalling principle in multimodal learning. In our approach, however, we
do not only highlight relevant parts of the message, but also re-structure the message in order to assist the reader in finding a natural reading path and semantically processing the message. On the level of message surface, attentional guidance of the reader is provided by a suggested reading path. In addition, on the level of the message content, the material is rhetorically organized and conceptually pre-processed (from known information, over expert information to practical information). We suggest that the dual scripting principle is an extension of the signalling principle in multimedia learning (Mayer 2005). Finally, the redundancy effect (Sweller et al. 1998, cf also Mayer 2005) will be considered. It occurs when multiple sources of information are self-contained and can be used without reference to each other. Instructional design should eliminate redundancy or allow learners to ignore material in order to reduce working memory load and enhance schema construction.
4 NATURALISTIC STUDY WITH EMBEDDED EXPERIMENTAL CONDITIONS
In what follows, we present results of an eye-tracking study on reading information graphic, including method, materials, procedure and data analysis. In our naturalistic newspaper reading study with experimental conditions, we will address the issue of minimizing extraneous cognitive load by testing two principles of attentional guidance. Two pairs of information graphic have been designed to study the effect of a) spatial contiguity principle in layout 1 (separated versus integrated graphics) and b) dual scripting principle in layout 2 (radial versus serial graphics). The first aim of the study is to test whether a complex text-graphic integration will be supported by a format with spatial contiguity between text and illustrations. The second aim of the study is to test whether a complex information graphic will facilitate reading when organized and presented in a coherent and sequential way, with dual attentional guidance.
4.1 Method Participants and Design. Thirty-one participants (18 females, 13 males; age M = 26.61, SD = 7.13) were recruited from the readership of Norrköpings Tidningar (a Swedish newspaper). All participants were native Swedish speakers with normal vision. Participants were randomly assigned to one of two conditions: a) reading a newspaper with the serial version of information graphic (n = 16) or b) reading a newspaper with the radial version of information graphic (n = 15).
9
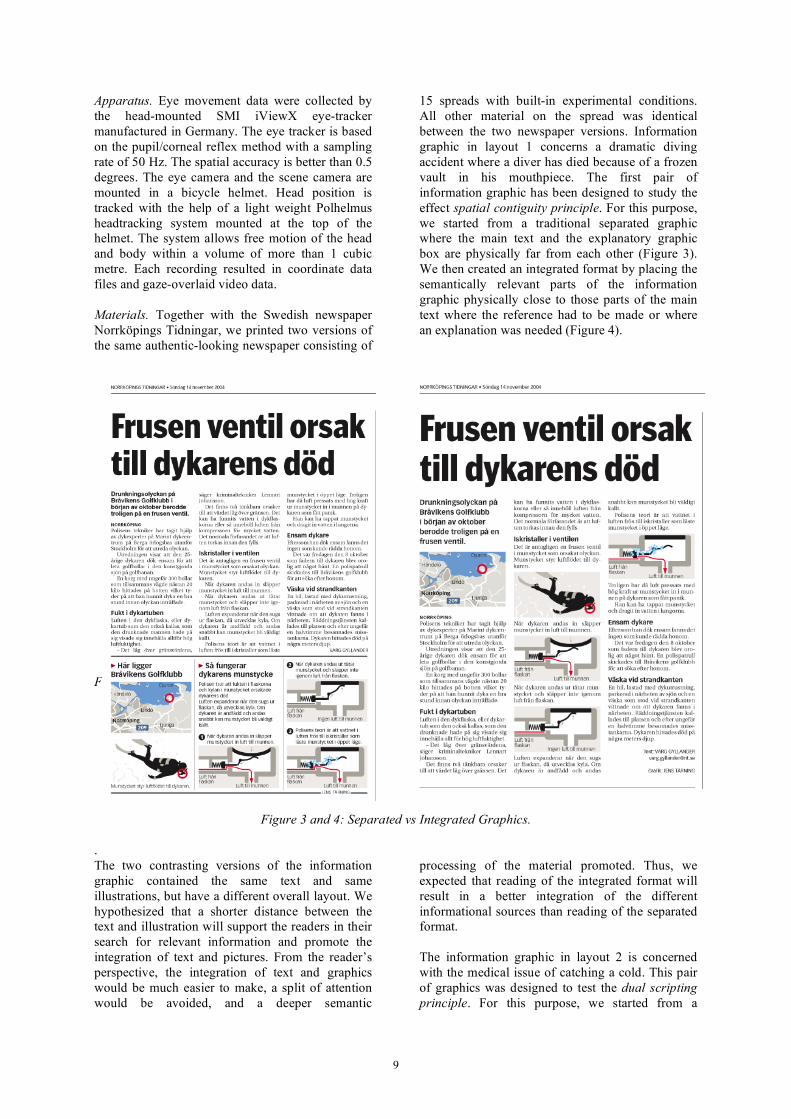
Apparatus. Eye movement data were collected by the head-mounted SMI iViewX eye-tracker manufactured in Germany. The eye tracker is based on the pupil/corneal reflex method with a sampling rate of 50 Hz. The spatial accuracy is better than 0.5 degrees. The eye camera and the scene camera are mounted in a bicycle helmet. Head position is tracked with the help of a light weight Polhelmus headtracking system mounted at the top of the helmet. The system allows free motion of the head and body within a volume of more than 1 cubic metre. Each recording resulted in coordinate data files and gaze-overlaid video data. Materials. Together with the Swedish newspaper Norrköpings Tidningar, we printed two versions of the same authentic-looking newspaper consisting of
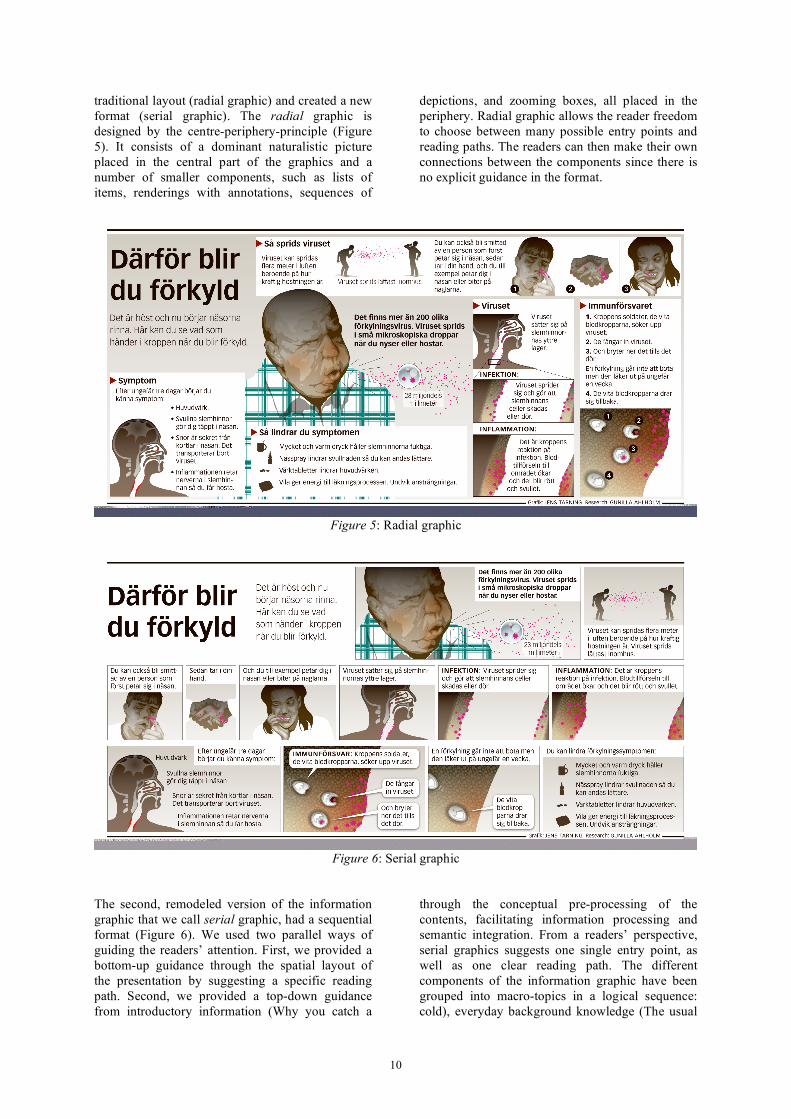
15 spreads with built-in experimental conditions. All other material on the spread was identical between the two newspaper versions. Information graphic in layout 1 concerns a dramatic diving accident where a diver has died because of a frozen vault in his mouthpiece. The first pair of information graphic has been designed to study the effect spatial contiguity principle. For this purpose, we started from a traditional separated graphic where the main text and the explanatory graphic box are physically far from each other (Figure 3). We then created an integrated format by placing the semantically relevant parts of the information graphic physically close to those parts of the main text where the reference had to be made or where an explanation was needed (Figure 4).
Figure 3: Separated graphic.
Figure 3 and 4: Separated vs Integrated Graphics.
.The two contrasting versions of the information graphic contained the same text and same illustrations, but have a different overall layout. We hypothesized that a shorter distance between the text and illustration will support the readers in their search for relevant information and promote the integration of text and pictures. From the reader’s perspective, the integration of text and graphics would be much easier to make, a split of attention would be avoided, and a deeper semantic
processing of the material promoted. Thus, we expected that reading of the integrated format will result in a better integration of the different informational sources than reading of the separated format. The information graphic in layout 2 is concerned with the medical issue of catching a cold. This pair of graphics was designed to test the dual scripting principle. For this purpose, we started from a
10
traditional layout (radial graphic) and created a new format (serial graphic). The radial graphic is designed by the centre-periphery-principle (Figure 5). It consists of a dominant naturalistic picture placed in the central part of the graphics and a number of smaller components, such as lists of items, renderings with annotations, sequences of
depictions, and zooming boxes, all placed in the periphery. Radial graphic allows the reader freedom to choose between many possible entry points and reading paths. The readers can then make their own connections between the components since there is no explicit guidance in the format.
Figure 5: Radial graphic
Figure 6: Serial graphic The second, remodeled version of the information graphic that we call serial graphic, had a sequential format (Figure 6). We used two parallel ways of guiding the readers’ attention. First, we provided a bottom-up guidance through the spatial layout of the presentation by suggesting a specific reading path. Second, we provided a top-down guidance
through the conceptual pre-processing of the contents, facilitating information processing and semantic integration. From a readers’ perspective, serial graphics suggests one single entry point, as well as one clear reading path. The different components of the information graphic have been grouped into macro-topics in a logical sequence:
from introductory information (Why you catch a cold), everyday background knowledge (The usual
11
ways of catching a cold), expert knowledge (What happens in the body) to practical information (How you can soothe the symptoms) (see Figure 7). By enhancing the temporal, semantic, spatial, logical and thematic arrangement of components, we created an overall coherent presentation that supports the message. We hypothesized that such a coherent format that is
spatially and conceptually organized and ‘pre-processed’ will guide the readers’ navigation and prolong reading. We expected that the readers of the serial layout will navigate in the suggested way, spend more time reading, and integrate text and pictures to a larger extent than in the original radial layout.
Figure 7: The thematic macrostructure of the remodeled, serial information graphic (see below).
Procedure. On arrival, participants were randomly assigned to one of two groups and seated 70 cm in front of a table. The newspaper was attached to the table in the middle of the spread, but was covered with a white sheet of paper. Before the experiment, each participant was calibrated. Thirteen calibration points were placed on the covering sheet of paper. Before reading, the participants were presented with a realistic scenario: “Imagine that you are sitting at Norrköping central station waiting for your train and you find this newspaper. You have 20 minutes until your trains leaves. Read the newspaper as you would do in such a situation.” After the instruction, the covering sheet was taken away. The participants were free to read anything they wish from the paper in any order they wish. Participants could move freely, turn pages at their own pace, and go forward or backward in the newspaper as they desired (Figure 8). Figure 8: Participant showing the experimental set-up.
4.2 Data analysis For all participants and both types of graphics, we compared three important measures of on-line reader behavior: reading order, reading time, and text-graphic integration. The order in which separate parts of the graphics are read is presumed to reflect navigation and information seeking; the time spent on the information graphic (in seconds or in percentage of the spread time) is presumed to reflect cognitive interest in the material; the proportion of integrative saccades is presumed to reflect semantic integration of text and illustration. Integrative saccades are transitions between semantically related pieces of verbal and pictorial information made by the reader (Figure 9). Figure 9: Integrative saccades between related pieces of verbal and pictorial information within a graphics box, for example, a fixation on the words ‘white blood cell’ followed by a fixation on the depiction of a white blood cell. The lines in the scanpath represent saccades, the rings represent fixations. The sizes of the rings are directly proportional to the fixation durations.
Integrative saccades are suggested to indicate the process of readers’ construction of referential
Expert information "How you can soothe the symptoms"
Practical information
Information graphics
Serial version
12
connections between text and illustration. The number of integrative saccades (measured as the proportion of all saccades in the information graphic) is suggested to indicate the degree of semantic text-picture integration.
4.3 Results and discussion Results (layout 1)
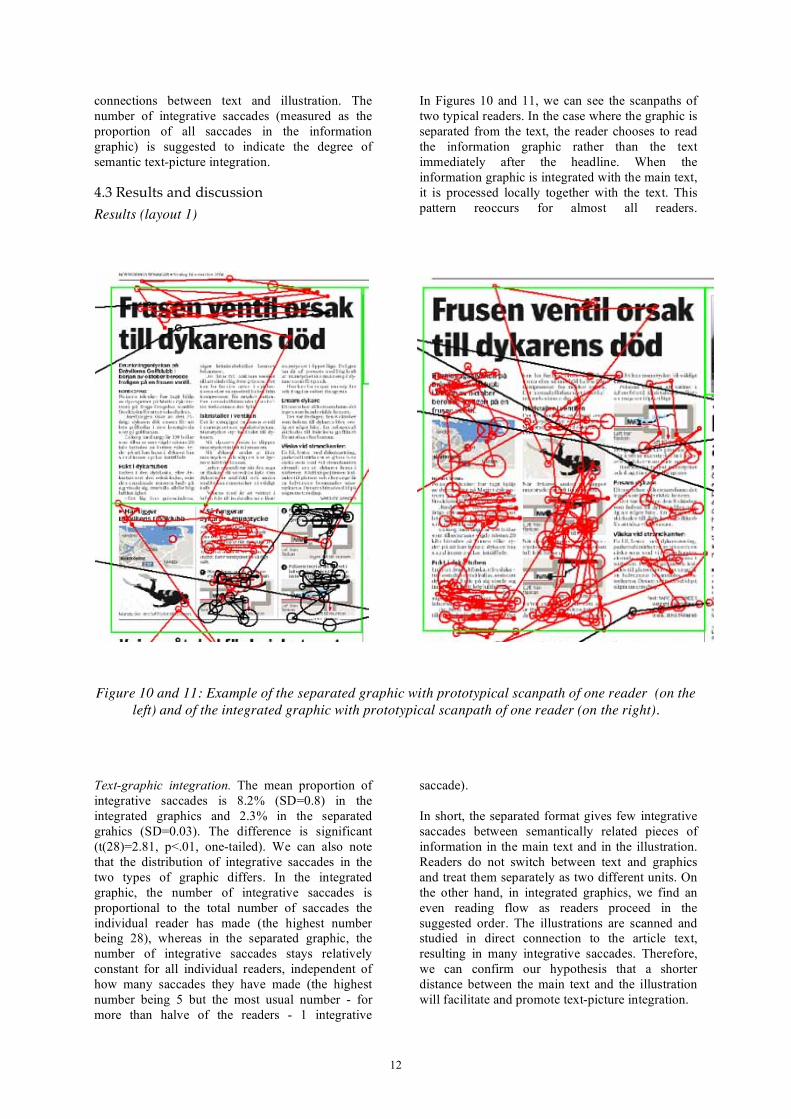
In Figures 10 and 11, we can see the scanpaths of two typical readers. In the case where the graphic is separated from the text, the reader chooses to read the information graphic rather than the text immediately after the headline. When the information graphic is integrated with the main text, it is processed locally together with the text. This pattern reoccurs for almost all readers.
Figure 10 and 11: Example of the separated graphic with prototypical scanpath of one reader (on the
left) and of the integrated graphic with prototypical scanpath of one reader (on the right).
Text-graphic integration. The mean proportion of integrative saccades is 8.2% (SD=0.8) in the integrated graphics and 2.3% in the separated grahics (SD=0.03). The difference is significant (t(28)=2.81, p<.01, one-tailed). We can also note that the distribution of integrative saccades in the two types of graphic differs. In the integrated graphic, the number of integrative saccades is proportional to the total number of saccades the individual reader has made (the highest number being 28), whereas in the separated graphic, the number of integrative saccades stays relatively constant for all individual readers, independent of how many saccades they have made (the highest number being 5 but the most usual number - for more than halve of the readers - 1 integrative
saccade). In short, the separated format gives few integrative saccades between semantically related pieces of information in the main text and in the illustration. Readers do not switch between text and graphics and treat them separately as two different units. On the other hand, in integrated graphics, we find an even reading flow as readers proceed in the suggested order. The illustrations are scanned and studied in direct connection to the article text, resulting in many integrative saccades. Therefore, we can confirm our hypothesis that a shorter distance between the main text and the illustration will facilitate and promote text-picture integration.
13
Discussion (layout 1) The integrated format makes it easier for the reader to find the correspondences between referents in the text and in the illustration, and to mentally integrate information from the two different sources. On the semantic microlevel of the integrated message, text and illustrations are complementary. The format suggests that the reader should inspect the illustration in connection to a particular piece of text – and follow this ’instruction’. In contrast, in the separated layout, the text and the illustrations are far from each other. It is much more difficult for the readers to move back and forth between text and graphic in order to search for referents. Thus, the text and the information graphic box are treated as two independent units by the readers and almost no integration occurs. One explanation could be that due to the layout of the message readers interpret these two sources of information as self-contained. Accordingly, they choose one of them (the information graphic) and ignore the other one (the text). This interpretation is in line with Chandler & Sweller’s (1991) redundancy effect and with Sweller et al.’s (1998:284) statement that it is easier for the readers
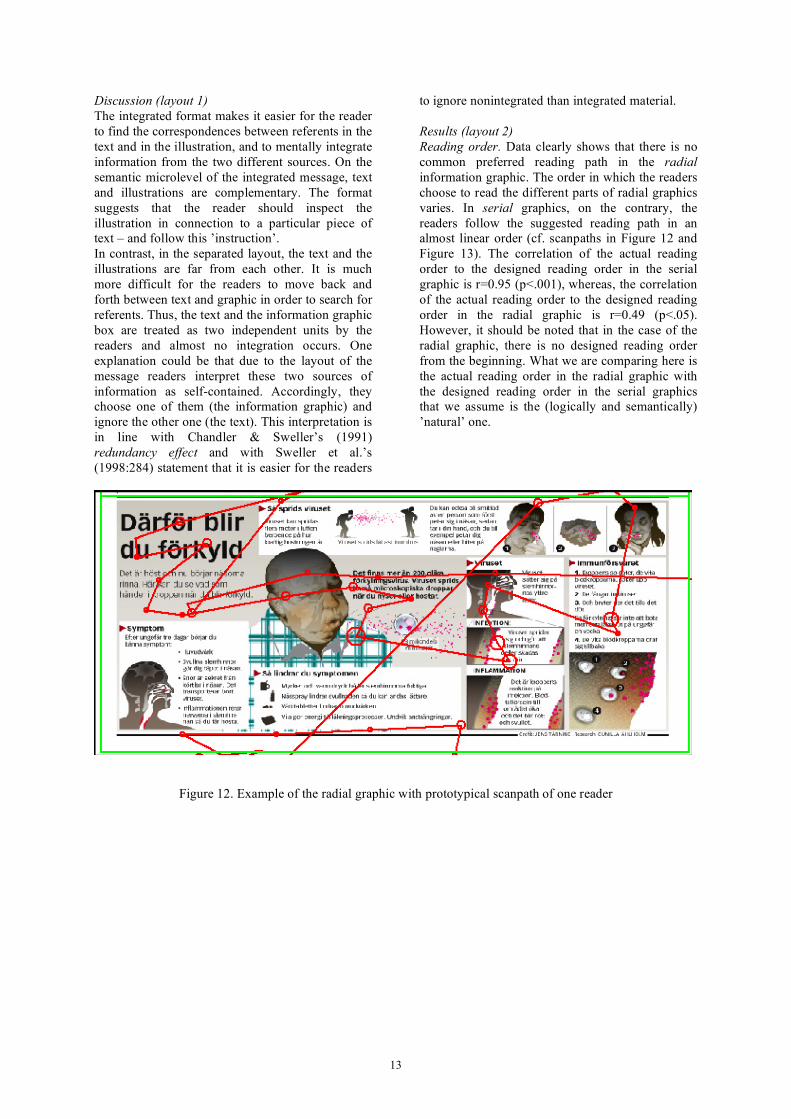
to ignore nonintegrated than integrated material. Results (layout 2) Reading order. Data clearly shows that there is no common preferred reading path in the radial information graphic. The order in which the readers choose to read the different parts of radial graphics varies. In serial graphics, on the contrary, the readers follow the suggested reading path in an almost linear order (cf. scanpaths in Figure 12 and Figure 13). The correlation of the actual reading order to the designed reading order in the serial graphic is r=0.95 (p<.001), whereas, the correlation of the actual reading order to the designed reading order in the radial graphic is r=0.49 (p<.05). However, it should be noted that in the case of the radial graphic, there is no designed reading order from the beginning. What we are comparing here is the actual reading order in the radial graphic with the designed reading order in the serial graphics that we assume is the (logically and semantically) ’natural’ one.
Figure 12. Example of the radial graphic with prototypical scanpath of one reader
14
Figure 13. Example of the serial graphic with prototypical scanpath of one reader.
Reading time. Our data show that serial graphics is read more than twice as much as radial graphics – in spite of the fact that the content and the position in the newspaper were exactly the same. The proportion of total spread time spent on the serial graphics was 30,3 % (SD=8.23) compared to 18,1% on the radial graphics (SD=6.41), which is significant when calculated over the two groups of readers (serial and radial) (t(9)= -4.90, p <.001, one tailed). Measured in absolute time, readers spent on average 22,3 seconds on the serial graphics (SD=8.67) compared to 8,9 seconds on the radial graphics (SD=4.49). Even this result is significant (t(9)= 3.28, p < .01, one tailed). Text-graphics integration. Integrative saccades were almost twice as common in the serial graphics compared to the radial graphics. The number of integrative saccades, measured as a percentage of all saccades in the information graphic, was 14,1 % in the serial version (SD=0.03) compared to 7,9 % in the radial version (SD=0.05), which is a significant difference (t(9)= 2.56, p<.05, one tailed). This suggests that the serial arrangement enhances readers’ integration of text and graphics within the graphic box. Discussion (layout 2) The results show that the radial layout, which allows for a variety of different reading orders, leads to initial reader interest followed by much shorter reading times indicating a later disinterest in the content. Since the readers have several decisions to make on their way through the material – to choose the entry point, to decide the reading path, to find relevant pieces of information, to create a connection between them and to integrated them mentally – the material might be judged as difficult to grasp and not worth deeper processing.
This further suggests that the freedom of choosing entry points and reading paths is not an optimal strategy for attracting readers to stay with the complex material, continue reading and get a deeper understanding of the contents. On the other hand, our results indicate that the serial layout providing a dual attentional guidance, that is being spatially structured and conceptually pre-digested, is probably associated with ease of reading and comprehension. Since this format supports optimal navigation and semantic processing of the contents, it not only leads to an initial interest of catching the readers’ attention, but also to sustaining their interest in the material and thereby promoting longer reading times and a better text-picture integration. An interesting question is what factors effect comprehension of information graphics. In Holmberg, Holsanova & Holmqvist (2006), we presented a study on readers’ comprehension of information graphic. Seventy-nine participants were given authentic-looking newspapers with experimental conditions (serial and radial graphic, layout 2). We measured reading time, reading order, text-graphic integration, number of fixations, and total fold time. After the reading session, all participants were encouraged to fill in a multiple choice comprehension test on information graphic consisting of four forced multiple-choice questions (two for factual comprehension, two requiring conclusions to be drawn) and two instances of graphic boxes with deleted text, which the readers were asked to fill in from memory (see Figure 14). A regression analysis was performed to see which factors of the viewing behavior explain the results on the subsequent reader comprehension test. Our
15
results show that reading time on the information graphic and the fold both correlate significantly with comprehension, as does reading order and the
number of fixations. Surprisingly, the number of integrative saccades does not.
Table 1: Results of the regression analysis. Six different eye movement measures were then calculated: Reading time in seconds of the information graphics. (ABSTIME), reading time spent on the fold where the graphics is located (FOLDTIME), reading time on the infographics relative to the time on the current fold (RELTIME), the number of fixations (threshold 150 ms) on the infographics of 150 ms (FIXATIONS), correlation coefficient between actual and expected reading sequence (ORDER) and the number of integrative saccades in the infographics (INTSAC). Comprehension was tested with multiple choice questions, and was measured as scores on a six-level scale.
Figure 14: Multiple choice comprehension test on information graphic consisting of four forced multiple-choice questions (two for factual comprehension, two requiring conclusions to be drawn) and two instances of graphic boxes with deleted text, which the readers were asked to fill in from memory.
The paper focused on text-picture integration and attentional guidance of the readers in complex documents. Information graphic has been chosen as an example of a complex multimodal genre that readers interact with in newspaper reading. We present a naturalistic eye tracking study and address the question whether the overall design of information graphic influences reading behavior. Two pairs of information graphic have been designed to study the effect of a) spatial contiguity principle (separated versus integrated graphics) and b) dual scripting principle (radial versus serial graphics). The first pair of information graphic tested whether a complex text-graphic integration will be supported by a format with spatial contiguity between text and illustrations. The second pair of information graphic tested whether a complex information graphic that is organized and presented in a coherent and sequential way under dual attentional guidance will facilitate reading. In result, our data show a difference in the spatial layout of elements has a significant effect on readers’ eye movement behavior. An integrated format with shorter physical distance between text and graphics facilitates integration and prolongs reading. Reading of information graphic and the text-picture integration can be significantly enhanced by a serial layout that is spatially structured and conceptually pre-processed employing the dual scripting principle of attentional guidance. We take this as a strong indication that in newspaper reading, readers prefer to be guided through information graphic. The newly suggested formats, serial and integrated graphics, not only attract the readers’ initial attention, but sustain the readers’ interest and promote a longer and deeper processing of the material, including text-picture integration. The presented study provides a contribution to the exact tracing of the readers’ interaction with complex material in the framework of cognitive load theory. Our results are in line with the spatial contiguity principle in multimedia learning theory and cognitive load theory. We also suggest a dual scripting principle as an expansion of the signalling principle (Mayer 2005). Results from our study of newspaper reading behavior with experimental conditions contribute to the examination of the cognitive processes involved in text-picture integration, and offer relevant insights for applications in printed and digital media and for the design of user-friendly instructional materials and textbooks. Apart from that, the results are relevant for metacognition (i.e. for planning, monitoring and evaluating users’ performance).
Concerning applications in instructional materials, one important question is whether longer reading of the material also results in better understanding. There is a strong support for the spatial contiguity principle in the literature showing that groups studying integrated formats perform much better than groups studying separated formats (Mayer 2005). As we have shown in Holmberg, Holsanova & Holmqvist (2006), increased reading time on information graphics correlated with increased comprehension. Surprisingly, the number of integrative saccades could not alone explain text-picture integration and comprehension of the information graphics. How could this latter result be interpreted? Obviously, without integrative saccades, there cannot be any text-graphic integration. However, it seems, that a few well-placed and well-timed movements between relevant text and graphics are more important than making as many saccades as possible. We have to bear in mind that frequent switches (sometimes called oscillation rates) between text and graphics can be caused by different cognitive processes. This overt gaze behavior can reflect either a successful integration of the material or difficulties integrating the information. Therefore, it is important to study not only the frequency of transitions between text and illustrations, but also to look more closely into the qualitative aspects of integration. As was already underlined by Hegarty & Just (1993), it matters whether relevant and semantically related parts of the text and illustration have been connected by the readers. Also, the combination of eye tracking with other methodology such as concurrent verbal protocols (Van Gog et al. 2005, forthc; Holsanova forthc.) or retrospective verbal protocols (Holsanova & Holmqvist 2004) might elucidate these covert mental processes. There is a growing body of research on text-picture integration with the help of eye tracking in different genres: visual processing of advertisements (Rayner, Rotello, Steward, Keir & Duffy 2001, Radach, Lemmer, Vorstius, Heller & Radach 2003, Rayner, Miller & Rotello, forthc), cartoons (Caroll, Young & Guertin 1992), newspapers and netpapers (Holmqvist, Holsanova, Barthelson & Lundqvist 2003; Holmberg et al., 2006, Holsanova & Holmqvist 2004), as well as textbooks and instruction materials (Cierniak Scheiter & Gerjets 2007; Folker & Ritter 2003, 2005; Hegarty & Just, 1993; Hannus & Hyönä, 1999; Schmidt-Weigand, Kohnert & Glowalla, forthc). We suggest that future research should focus more extensively on the guidance of attention allocation (where to look and when), on instructional aspects of learning with visualizations (Scheiter, Wiebe & Holsanova forthc) and on the role of integrative saccades.
17
6 ACKNOWLEDGEMENTS
The research reported in this article was supported by Helge Ax:son Johnsons Foundation and by a post-doctoral fellowship grant (VR 2002-6308) from Swedish Research Council to the first author. We would also like to thank colleagues at Norrköpings Tidningar and Sydsvenska Dagbladet for their collaboration and support. Many thanks to Cristin McCormick Reichle for proof reading the manuscript.
REFERENCES Acartürk, Cangiz (forthc): Cross Modal Integration in
Multimodal Documents. CINACS – Cross-modal Interactions in natural and Artificial Cognitive Systems.
Acarturk, Cengiz, Habel Christopher, Cagiltay Kursat, Alacam Ozge (submitted): Multimodal Comprehension of Language and Graphics: Graphs with and without annotations. Journal of Eye Movement Research.
Barthes, Roland (1964). Rhétorique de l’image. Communications, 4, 40–51.
Barthes, Roland (1980): Billedets retorik, In: Visuel kommunikation 1. Fausing, B. og B. Larsen (red.), København: Medusa, s. 42-57. Översättning efter Rhétorique de límage, in: Communication, no. 4, (1964).
Bateman, J. (forthc). Multimodality and genre: A foundation for the systematic analysis of multimodal documents. London, England: Palgrave Macmillan.
Bernsen, N.O. (1994): Foundations of multimodal representations. A taxonomy of representational modalities. Interacting with Computers Vol. 6 No. 4/1994, 347-71.
Carroll, P. J., Young, R. J., & Guertin, M. S. (1992). Visual analysis of cartoons: A view from the far side. In K. Rayner (Ed.), Eye movements and visual cognition: Scene perception and reading (pp. 444-461). New York: Springer.
Chandler, P., & Sweller, J. (1991). Cognitive load theory and the format of instruction. Cognition and Instruction, 8, 293-332.
Cierniak G., Scheiter, K. & Gerjets, P. (forthc). Eye movements of differently knowledgeble learners during learning with split – source or integrated format. Paper presented at the 12th EARLI conference, Budapest, Hungary.
Eco, U. (1976). A theory of semiotics. Bloomington, IN: Indiana University Press.
Folker S., Sichelschmidt L. & Ritter, H. (2005): Processing and Integrating Multimodal Material - The Influence of Color-Coding. In: B. G. Bara and L. Barsalou and M. Bucciarelli (Eds.), Proceedings of the 27th Annual Conference of the Cognitive Science Society (CogSci'2005) (pp. 690-695). Mahwah, NJ: Erlbaum.
Folker, S., & Ritter, H. (2003). Integration of multimodal information: An eye-tracking study. In: F. Schmalhofer, R. Young, and G. Katz (Eds.), Proceedings of the European Cognitive Science
Conference (p. 384). Mahwah, NJ: Lawrence Erlbaum Associates.
Garcia, M. R., & Stark, P. A. (1991). Eyes on the News. St. Petersburg, FL: The Poynter Institute.
Gibson, James J. (1979): The Ecological Approach to Visual Perception. Boston.
Habel, C. & Acartürk, C. (to appear): On reciprocical improvement in multimodal generation. Co-reference by text and information graphics. In: Ielka van der Sluis, Mari¨et Theune, Ehud Reiter and Emiel Krahmer (eds.), MOG 2007, CTIT Proceedings of the Workshop on Multimodal Output Generation, pp. 69–80.
Hannus, M., & Hyönä, J. (1999). Utilization of illustrations during learning of science textbook passages among low- and high-ability children. Contemporary Educational Psychology, 24, 95-123.
Hegarty, M., & Just, M. A. (1993). Constructing mental models of machines from text and diagrams. Journal of Memory and Language, 32, 717-742.
Henderson, J. M., & Ferreira, F. (2004). Scene perception for psycholinguists. In J. M. Henderson & F. Ferreira (Eds.), The interface of language, vision, and action: Eye movements and the visual world (pp. 1-58). New York: Psychology Press.
Holmberg, N. (2004): Eye movement papperns and newspaper design factors. An experimental approach. Master’s thesis. Cognitive Science Dept. Lund university.
Holmberg, N., Holsanova, J., & Holmqvist, K. (2006). Using eye movement measures to analyse reading and comprehension of information graphic. Paper presented at the biannual meeting of EARLI SIG 2, Text and Graphics Comprehension, University of Nottingham, UK.
Holmqvist, K. & Wartenberg, C. (2005): The Role of local Design Factors for Newspaper Reading Behavior – An Eye Tracking Perspective. Lund University Cognitive Studies 127. http://www.lucs.lu.se (Papers 2005)
Holmqvist, K., Holmberg, N., Holsanova, J., Tärning, J. & Engwall, B. (forthc): Reading Information Graphics - Eyetracking studies with Experimental Conditions. In: J. Errea, (ed.) Malofiej Yearbook of Infographics, Society for News Design (SND-E). Navarra University, Pamplona, Spain, pp. 54-61.
Holmqvist, K., Holsanova, J., Barthelson, M., & Lundqvist, D. (2003). Reading or scanning? A study of newspaper and net paper reading. In: J. Hyonä, R. Radach and H. Deubel (Eds.) The mind’s eye: Cognitive and applied aspects of eye movement research (pp. 657–670). Amsterdam: Elsevier Science.
Holsanova, J. & Holmqvist, K. (2004): Med blick pa nätnyheter. Ögonrörelsestudier av läsning i nätbaserade tidningar. (Looking at the net news. Eye tracking study of net paper reading) In: Holmberg, Claes-Göran & Svensson, Jan (red.), Mediekulturer, Hybrider och Förvandlingar. (pp. 217-248) Stockholm: Carlsson bokförlag AB, 216-248. ISBN: 91 7203 630 3.
Holsanova, J. (1996). När säger en bild mer än tusen ord? Om samspelet mellan text och bild i gränssnitt. In: Löwgren, J. (red.) Teman i människa-datorinteraktion. (pp. 65-76). Institution för Informatik, Lunds universitet.
18
Holsanova, J. (1999). Olika perspektiv pa språk, bild och deras samspel. Metodologiska reflexioner. (Different perspectives on multimodality. Methodological considerations) In: Inger Haskå & Carin Sandqvist (eds.): Alla tiders språk. Lundastudier i nordisk språkvetenskap A 55. (pp. 117 - 126). Lund University Press, Lund. ISSN: 0347-8971, ISBN: 91-630-8712-X
Holsanova, J. (2001). Picture viewing and picture description: Two windows on the mind. Doctoral dissertation, Lund University Cognitive Studies 83. ISSN 1101-8453. ISBN 91-856843-76.
Holsanova, J. (2007): Användares interaktion med multimodala texter. I: Gunnarsson, B.-L. & Karlsson, A.-M. (utg.) Ett vidgat textbegrepp. TeFa rapport 46, s. 41-58. Uppsala universitet: Uppsala. ISSN 1102-9633.
Holsanova, J., Holmqvist, K. & Holmberg, N. (submitted): Reading Information Graphics: The Role of Spatial Contiguity and Dual Attentional Guidance. Special issue of Cognitive Psychology Applied.
Holsanova, J. (2008): Discourse, vision, and cognition. John Benjamins Publishing Company: Amsterdam. ISBN 978 90 272 23777.
Holsanova, J., Rahm, H. & Holmqvist, K. (2006): Entry points and reading paths on the newspaper spread: Comparing semiotic analysis with eye-tracking measurements. In: Visual communication 5 (1), 65-93. Sage publications. ISSN 1470-3572
Jacob, R. J. K., & Karn, K. S. (2003). Eye tracking in human-computer interaction and usability research: Ready to deliver the promises. In: J. Hyonä, R. Radach and H. Deubel (Eds.), The mind’s eye: Cognitive and applied aspects of eye movement research (pp. 573-605). Amsterdam: Elsevier Science.
Kirsh, David (2005): Metacognition, distributed cognition and visual design. I: Johansson, Petter & Gärdenfors, Peter (ed.). Cognition, Education and Communication Technology. Lawrence Erlbaum Associates. S. 147–179.
Knieper, Thomas (1995): Infographiken: Das visuelle Informationspotential der Tageszeitung. Verlag Reinhard Fischer: München.
Kress, G. & van Leeuwen, T. (1996). Reading images. The grammar of visual design. London: Routledge.
Levin, J. R., Anglin, G. J., & Carney, R. N. (1987). On empirically validating functions of pictures in prose. In D. M. Willows & H. A. Houghton (Eds.), The psychology of illustration (Vol. 1, pp. 51-85). New York: Springer.
Lowe, Richard & Jean-Michel Boucheix (forthc): Eye tracking as a basis for improving animation design. Paper at the symposium ”Eye tracking as a means for detailed analyses of multimedia learning processes" - Part II, EARLI 2007: Developing Potentials for Learning. Budapest.
Maybury, M.T. (1996): Research in Multimedia and Multimodal Parsing nad Generation. To appear in Journal of Artificial Intelligence Review: Special Issue on the Integration of Natural language and Vision Processing.
Mayer (2005): Principles for Managing Essential Processing in Multimedia Learning: Coherence, Signalling, Redundancy, Spatial contiguity and Temporal Contiguity Principles. In: Mayer (ed.)
Cambridge Handbook of Multimedia Learning (pp. 183-200). New York: Cambridge University Press.
Mayer, R. E. (2001). Multimedia learning. Cambridge: UK: Cambridge University Press.
Melin (1999): Gör illustrationerna vad vi tror? I: Nordicom-Information nr 1-2.99 (vol.21). Nordiskt informationscenter för medie- och kommunikations-forskning. Göteborgs universitet, s. 52–60.
Melin, Lars (1990): Text, bild, lexivision. En studie i text-bildsamverkan i en lärobok. Nordiska språk. Stockholms universitet.
Melin, Lars (1995): Grafisk pyttipanna. Om text och grafisk form i läroböcker. I: Läroboksspråk. Ord och Stil. Om språk och layout i svenska läroböcker. Hallgren & Fallgren. Uppsala, s. 77-123.
Melin, Lars. 2000: Språk som syns. Om grafiska formens samspel med verbalt språk. Språkvårdssamfundets skrifter 31 Uppsala: Hallgren & Fallgren.
Moreno, R., & Mayer, R. E. (1999). Cognitive principles of multimedia learning: The role of modality and contiguity. Journal of Educational Psychology, 91, 358-368.
Mullet, K, and Sano, D. (1995): Designing Visual Interfaces. Communication Oriented Techniques. SunSoft Press, kap. 6: Image and Representation.
Nord, Andreas (forthc): Hypertext i trädgården. Skrift, bild och textstruktur i trädgårdshandböcker 1690–2005. I: Lars Wollin, Anna Saarukka och Ulla Stroh-Wollin (utg.) Det moderna genombrottet – också en språkfråga? Studier i svensk språkhistoria 9. Skrifter från svenska institutionen vid Åbo Akademi. 5/2007, s. 189–196.
Nöth, Winfried (2003). Press photos and their captions. In H. Lönnroth (Ed.): Från Närpesdialekt till EU- svenska (pp. 169–188). Tampere: Tampere University Press.
Pettersson, Gertrud (1997): Uppslagsböckerna och världen. Rapport om en pilotundersökning. Svensk sakprosa 11. Lund.
Pettersson, Gertrud (2000): Håller bilden på att ta över? En studie av samspelet mellan text och bild i uppslagsböcker under 1900-talet. Svensk sakprosa. Institutionen för nordiska språk. Lund.
Pettersson, R. (2004): Bild och form för informationsdesign. Studentlitteratur AB: Lund.
Pettersson, R. & Strand, L. (2004): Nyhetsgrafik. Mälardalens Högskola. Institutionen för Innovation, Design och Produktutveckling: Eskilstuna.
Pozzer, L. L., & Roth, W. M. (2003). Prevalence, function, and structure of photographs in high school biology textbooks. Journal of Research in Science Teaching, 40, 1089-1114.
Preece, J. m fl (1994): Human–computer interaction, Addison-Wesley, Wokingham.
Radach R., Lemmer, S., Vorstius, C., Heller, D., & Radach, K. (2003). Eye Movements in the processing of print advertisements. In: J. Hyonä, R. Radach, and H. Deubel (Eds.) The mind’s eye: Cognitive and applied aspects of eye movement research (pp. 609–632). Amsterdam: Elsevier Science.
Rayner, K., Miller, B., & Rotello, C. M. (2008, in press). Eye movements when looking at print advertisements:
19
The goal of the viewer matters. Applied Cognitive Psychology.
Rayner, K., Rotello, C. M., Stewart, A. J., Keir, J., & Duffy, S. A. (2001). Integrating text and pictorial information: Eye movements when looking at print advertisements. Journal of Experimental Psychology: Applied, 7, 219-226.
Sandqvist, Carin (1995): Från 50-tal till 80-tal. Om form och innehåll i historieläroböcker. I: Läroboksspråk. Om språk och layout i svenska läroböcker. Ord och stil 26. Uppsala. s. 124-188.
Scheiter, K., Wiebe, E., & Holsanova, J. (forthc.). Theoretical and Instructional Aspects of Learning with Visualizations. In: R. Zheng, Cognitive Effects of Multimedia Learning. IGI Global, USA. Manuscript submitted for publication.
Schmidt-Weigand, F., Kohnert, A. & Glowalla, U. (forthc). Integrating different sources of information in multimedia learning: An eye tracking study on split attention and the dynamics of visualizations. Manuscript submitted for publication.
Schnotz, W., & Bannert, M. (2003). Construction and interference in learning from multiple representations. Learning and Instruction, 13, 141-156.
Schriver, K. A. (1997) Dynamics in document design: creating texts for readers, John Wiley and Sons, New York.
Sweller, J., & Chandler, P. (1994). Why some material is difficult to learn. Cognition and Instruction, 12, 185-233.
Sweller, John, van Merrienboer, Jeroen J. G., & Paas, Fred G. W. C. (1998): Cognitive Architecture and Instructional Design. Educational Psychology Review, Vol. 10, No. 3, 251-296.
Teleman, Ulf (1989): The World of Words - and Pictures. I: Possible Worlds in Humanities, Arts and Sciences. Proceedings of Nobel symposium 65. Edited by Sture Allén. Walter de Gruyter: Berlin, New York, s. 199-208.
Teleman, Ulf (1994): Ordens och bildernas språk. I: Svenska i skolan 1994:1, 6-15.
Tufte, E. R. (2001). The visual display of quantitative information. Graphics Press.
Tversky, B. (2003). Some ways graphics communicate. In K. Nyiri (Ed.), Mobile communication: Essays on cognition and community (pp. 143-156). Wien: Passagen Verlag.
Van Gog, T., Kester, Nielvelstein F., Giesbers & Paas, F. (forthc): Manuscript submitted for publication.
Van Gog, Tamara, Paas, Fred & Merrienboer, Jeroen J. G. (2005): Uncovering Expertise-Related Differences in Troubleshooting Peerformance: Combining Eye Movement and Concurrent Verbal Data. Applied Cognitive Psychology 19, 205-221.
Wartenberg, C. and Holmqvist, K. (2005) ‘Daily Newspaper Layout – Designers’ Predictions of Readers’ Visual Behavior – A Case Study’, Lund University Cognitive Studies 126, http://www.lucs.lu.se (Papers 2005).