“An Enquiry into the Trade and Finance of Malaysia” Submitted by Sl. no Name ID 01. Farzana Nasreen 15-004 02. Sumaiya Akter 15-018 03. Pramita Saha 15-030 04. Mohammad Nayem Uddin 15-086 05. Fahmina Tasmin Munia 15-144 06. Shanaz parveen 15-134 Department Of Finance B.B.A.( 15 TH Batch),Section-B University Of Dhaka 1 Submitted to MAHBUBA LIMA LecturerDepartment of Finance University of Dhaka Dhaka
“An Enquiry into the Trade and Finance of Malaysia”
Table of Contents
Economy of Malaysia at a Glance ..................................................................................................................7............................................................................................................................................................. 14Malaysian Trade with the U.S............................................................................................................. 14Malaysia’s Top Exports to America ....................................................................................................15Fastest-Growing Malaysian Exports to the U.S..................................................................................15Malaysia’s Top Imports from America .................................................................................... ...... .....16Fastest-Growing Malaysian Imports from the U.S.............................................................................16
Comparative Trade Advantages ..........................................................................................................16Advantages of Fixed Foreign Exchange Rate: ...............................................................................................47Floating Foreign Exchange Rate: .......................................................................................................... ...... ...47Advantages of Floating Foreign Exchange Rate: ...........................................................................................47Disadvantages of Floating Foreign Exchange Rate: .................................................................................... ...48
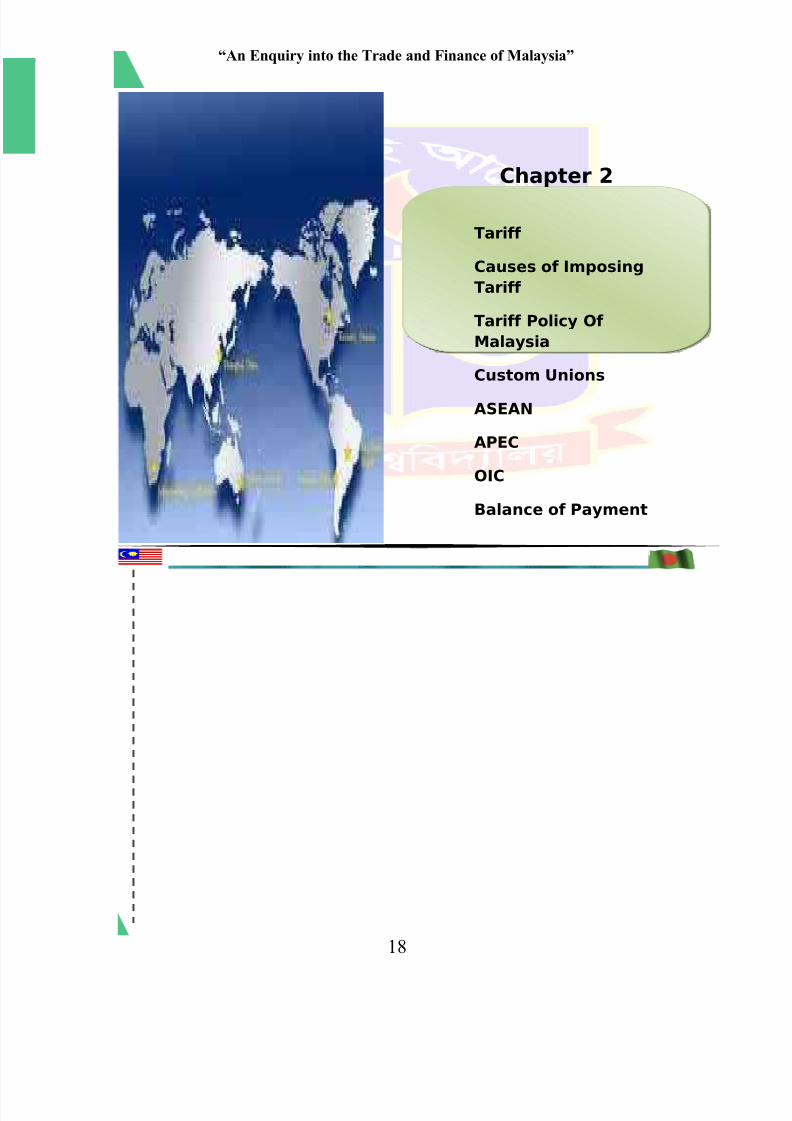
Chapter 3
Factors affecting International Trade Flows………………….
“An Enquiry into the Trade and Finance of Malaysia”
Natural endowment of economic resources
Degree of efficiency with which these factors are employed
Level of technology
Labor skill
Factor abundance
Factors of different demand conditions:
Income level
Taste pattern
Malaysia is well-endowed with natural resources in areas such as:
• Agriculture
• Forestry
• Minerals
It is an exporter of natural and agricultural resources, the most valuable exported resource
being petroleum. At one time, it was the largest producer of tin, rubber and palm oil in
the world. In terms of agriculture, Malaysia is one of the top exporters of
natural rubber and palm oil, which together with sawn logs and sawn
timber, cocoa, pepper, pineapple and tobacco dominate the growth of the sector. Palm oil
is also a major generator of foreign exchange.
Regarding forestry resources, it is noted that logging only began to make a substantial
contribution to the economy during the nineteenth century. Today, an estimated 59% of
Malaysia remains forested. The rapid expansion of the timber industry, particularly after
the 1960s, has brought about a serious erosion problem in the country's forest resources.
However, in line with the Government's commitment to protect the environment and the
ecological system, forestry resources are being managed on a sustainable basis and
accordingly the rate of tree felling has been on the decline.
In addition, substantial areas are being silviculturally treated and reforestation of
degraded forest land is also being carried out. The Malaysian government provide plansfor the enrichment of some 312.30 square kilometres (120.5 sq mi) of land
with rattan under natural forest conditions and in rubber plantations as an inter crop. To
further enrich forest resources, fast-growing timber species such as meranti
tembaga, merawan and sesenduk are also being planted. At the same time, the cultivation
of high-value trees like teak and other trees for pulp and paper are also encouraged.
“An Enquiry into the Trade and Finance of Malaysia”
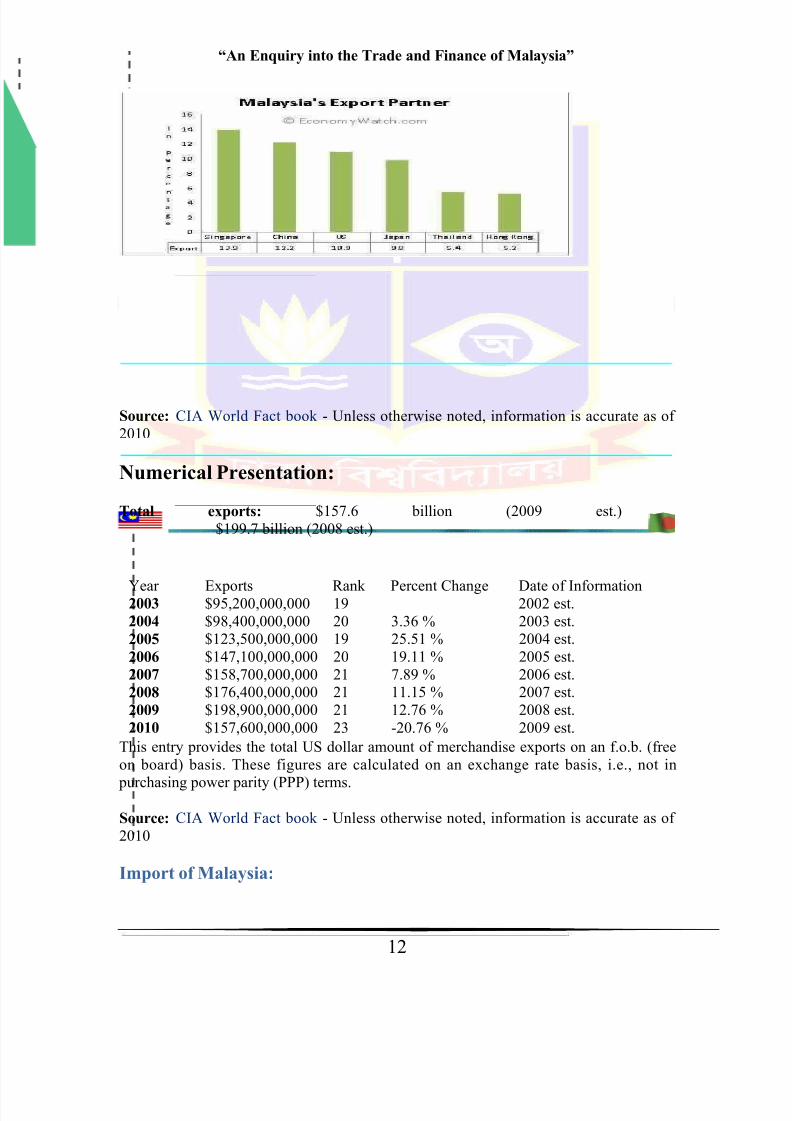
Source: CIA World Fact book - Unless otherwise noted, information is accurate as of 2010
Numerical Presentation:
Total exports: $157.6 billion (2009 est.)$199.7 billion (2008 est.)
This entry provides the total US dollar amount of merchandise exports on an f.o.b. (freeon board) basis. These figures are calculated on an exchange rate basis, i.e., not in
purchasing power parity (PPP) terms.
Source: CIA World Fact book - Unless otherwise noted, information is accurate as of 2010
“An Enquiry into the Trade and Finance of Malaysia”
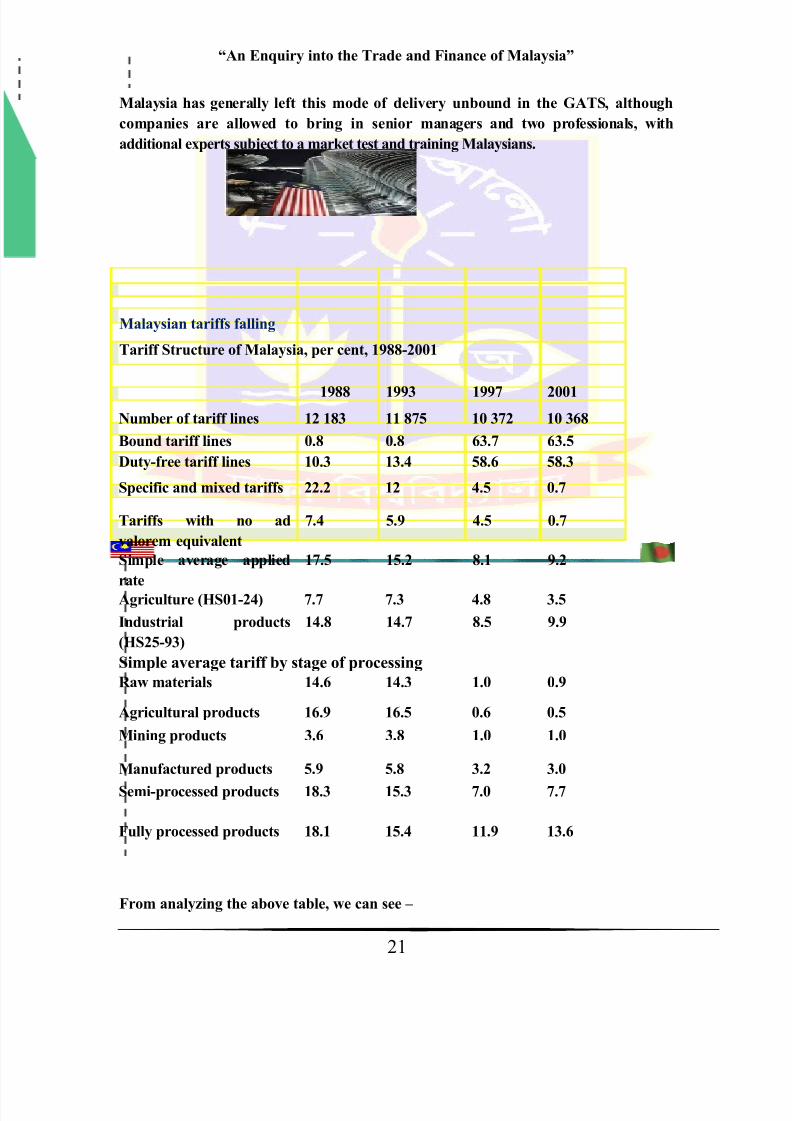
Trade Organization,2001).More than half of all tariff lines are duty free and less than
one per cent attract non-ad valorem rates.
Malaysia’s longstanding commitment to maintaining a relatively open trade and
investment regime has largely been maintained, although various measures were
introduced after the Asian financial crisis. There was an increase in the degree of
dispersion of tariff rates because of high tariff peaks relating to a few product lines,
increased reliance on non-automatic licensing to regulate some imports that directly
compete with domestic production by public sector enterprises, and delays in
meeting commitments under the General Agreement on Trade in Services (GATS)
(Athukorala, 2002).
In January 2004, the Malaysian Government reduced tariffs on cars sourced
within the ASEAN region as part of their requirements under the ASEAN free
trade agreement. However, the Government then increased the excise tax on all cars
- both domestic and international – but gave a 50 percent rebate to domesticallyproduced vehicles (Far Eastern Economic Review, ‘Proton on a slippery slope’),
In effect, higher excise duties replaced the reduced import tariffs to maintain
protection of domestic manufacturers, reducing the incentive for Proton and other
local car makers to improve efficiency.
Malaysia has a wide range of non-tariff measures across many different products
and sectors, although they differ in terms of trade restrictiveness. Import licenses
cover 60 different products ranging from poultry, billets of iron or steel and
magnetic tape webs for video and sound recording (Ministry of International Trade
and Industry, 2004a).Some import licenses are restricted to a few importers with
specific quotas, such as in sugar and rice. Other licenses are easily obtainable, such
as those for meat.
The 50 per cent rebate on domestically produced motor vehicles also is a substantial
non-tariff measure.
Barriers to services in the Malaysian market vary. Restrictions on commercial
presence are a general impediment which applies to a number of areas. For example,
Malaysia is the only market in South East Asia that totally excludes Australian law
firms and lawyers. Foreign education institutions must have each course individually
approved, rather than having an institution-based accreditation. Australian architecture
and engineering firms have difficulty exporting their services to Malaysia.
Malaysia’s GATS Schedule tends to leave commercial presence unbound and notes
that foreign acquisition of a Malaysian corporation requires approval.
There also are restrictions on the movement of services providers into Malaysia.
“An Enquiry into the Trade and Finance of Malaysia”
Thai Department of Foreign Affairs building in Bangkok and signed the ASEAN
Declaration, more commonly known as the Bangkok Declaration.
The association now consists of 10 member states, as successively Brunei Darussalam
(1984), Vietnam (1995), Laos (1997), Myanmar (1997) and Cambodia (1999).
Intra-ASEAN trade integration by Malaysia:
The measure of integration success can be expressed in following relation:
Integration success =Potential Trade/Actual Trade
If the success ratio is higher than 1, intra-ASEAN trade integration would be mentionedto be successful. If the measure is at unity, they have just reached the success level, and
otherwise, ASEAN is yet to reach the level of success.
The potential trade is projected by applying equation to Singapore, Malaysia, Indonesia
and Thailand for the period of 2003 to 2008. Potential trade is estimated from two points
of view.
One is for the impact of regional integration and the other is for the impact of currency
union, by varying the value of currency union dummy.
Here is the information about actual and potential trade between Malaysia and three
“An Enquiry into the Trade and Finance of Malaysia”
The above stated Figure presents the potential trade with regional integration, potential
trade with currency union and actual trade of Malaysia with three selected ASEAN
members. From these figures, three major findings are significant.
Firstly, actual bilateral trade among these four members is higher than the estimated
potential trade throughout the period.
Secondly, for all selected country pairs, increasing rate of actual trade is much higher
than the increasing rate of potential trade.
Thirdly, impact of currency union on potential trade is insignificant.
From ASEAN towards AFTA:
One of the most important RTA (regional trade agreements) in Asia and the Pacific is the
Association of South-East Asian Nations (ASEAN) Free Trade Area, also referred to asAFTA. AFTA was established in 1992 and currently has a membership of 10 countries. It
was expected to become a full free trade area by the year 2008. This should result in
supporting economic cooperation between member countries.
This agreement was aimed at eliminating tariff barriers among member countries and
creating regional market of 500 million people. The Agreement on the Common
“An Enquiry into the Trade and Finance of Malaysia”
Although the ASEAN Secretariat claims that AFTA is now virtually established, this
statement might somewhat disguise the truth. Rice, considered as a highly sensitive
product for the region, is still excluded from the AFTA agreement.
Moreover, several members are still very unresponsive when they have to lower tariffs on
certain other critical product groups. Malaysia refused to comply with the AFTA
deadlines and kept on levying tariffs on completely built up (CBUs) and completely
knocked down (CKDs) automotive units. By doing so, Malaysia undoubtedly wanted to
protect its state-controlled carmaker Proton. Only very recently, automotive CBUs and
CKDs have finally been transferred to Malaysia’s Inclusion List.
Trade Impact of entering into APEC by Malaysia:
APEC is the acronym for the regional grouping Asia-Pacific Economic Cooperation.
Among the 21 member countries Malaysia is one. APEC was established in November 1989. Since 1989, the member countries of the Asia Pacific Economic Cooperation
(APEC) forum have been meeting regularly to discuss measures for greater economic
cooperation. This forum which now has eighteen members from around the Pacific has
been argued to be a potentially important vehicle for significant trade reform in the
region.
Malaysia joined APEC on 6th November, 1989.
The economy-wide impacts of APEC’s free trade
Commitment on Malaysia’s economy:
The extent of gains from APEC depends on the size of the liberalization, the linkage
between sectors within economies, the extent to which goods from certain sectors are
demanded by other economies whose income rise, the reaction of macroeconomic
policies and a range of other channels which are captures through empirical relationships
in the model.
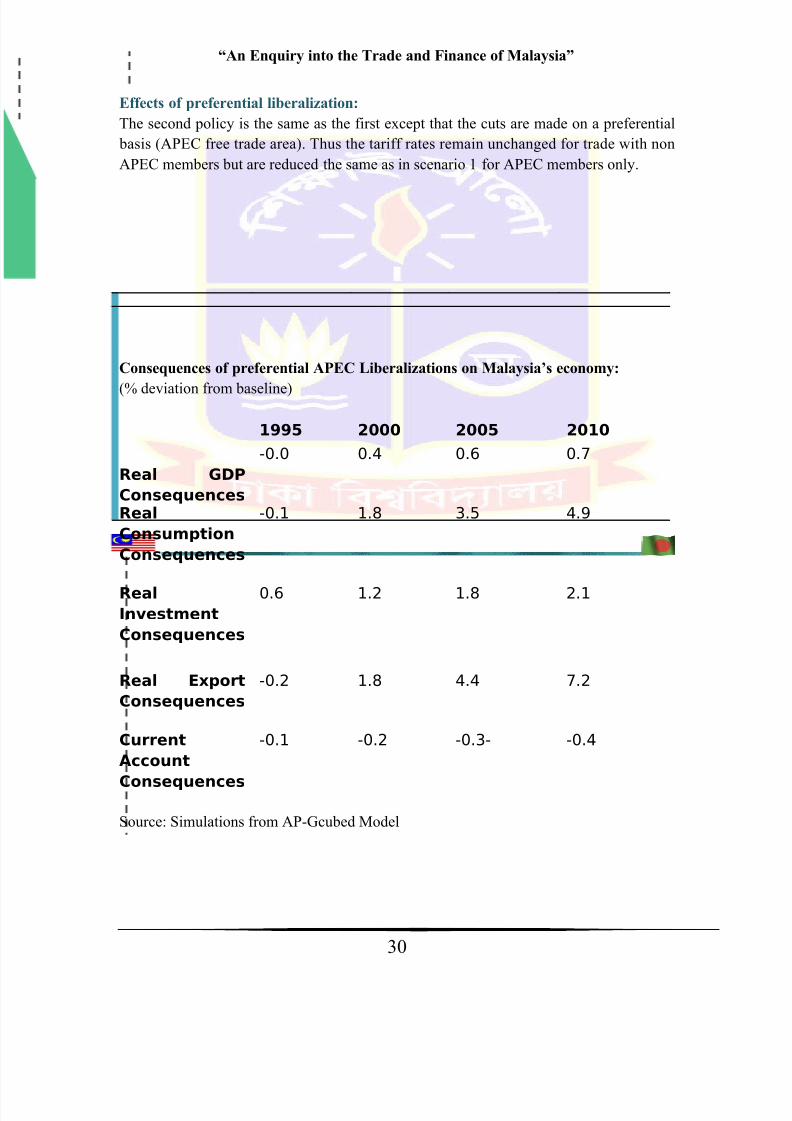
Liberalization:
The economy-wide and broad sectoral impacts of APEC trade liberalisation, covering all
sectors including services and implemented on a non- discriminatory basis are very
important in case of Malaysia.
A key benefit of non-discriminatory trade liberalisation is the opportunity to make use of
the cheapest imports from the best sources, allowing some existing resources in import-
competing industries to be reallocated to better uses domestically. In addition to these
“An Enquiry into the Trade and Finance of Malaysia”
Source: Economic Reports, Ministry of Finance, Malaysia
The link between investment and trade is far more powerful than usually assumed, and
this is particularly pronounced in the case of Malaysia’s trade with industrialised and
newly industrialising economies.
Intra-industry trade in general and intra-firm trade in particular is intimately related to
foreign direct investments in Malaysia’s manufacturing sector. An important policy
implication is that Malaysia has little choice in the direction of its external trade in
manufactures, given the structure of FDI in the country. It would then follow that
Malaysia’s trade policy is heavily influenced by, or dependent on, its foreign investment policy and not the other way around. Malaysia does not trade much with other OIC
members. This is so mainly because its investment links with them are either weak or
totally absent.
Sectoral and Regional Aggregation
In this study, the world economy was modeled to comprise the individual D-8 members,
Rest of OIC (ROIC), and Rest-of-the-World (ROW) aggregate while 8 major economic
“An Enquiry into the Trade and Finance of Malaysia”
Animal 0.02
6
0.05
5
0.91
9 1
F&Fish 0.01
3
0.00
5
0.98
2 1
Food 0.09
0
0.05
7
0.85
2 1
Text 0.10
2
0.03
3
0.86
5 1Manu 0.02
5
0.02
5
0.95
0 1Svcs 0.02
0
0.03
3
0.94
7 1Mineral 0.04
1
0.00
0
0.95
8 1Vegoil 0.15
0
0.16
1
0.68
9 1
Total 0.03
3
0.03
1
0.93
6 1
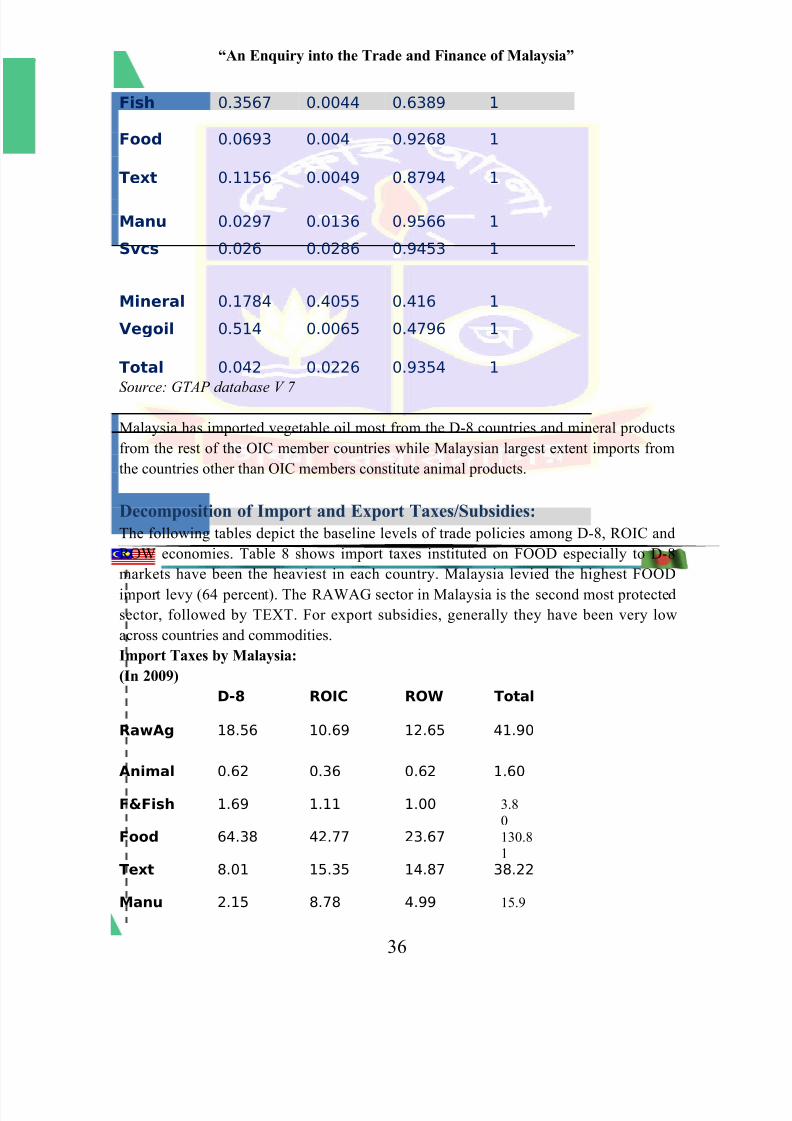
Source: GTAP database V 7
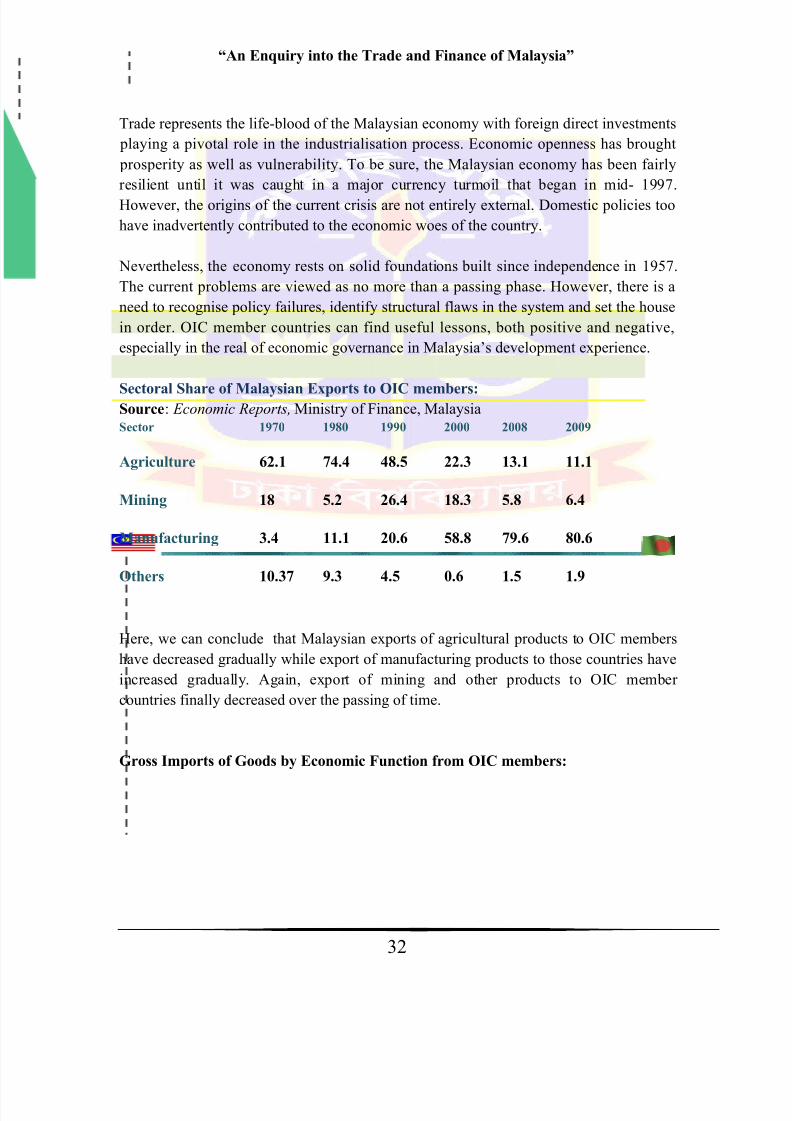
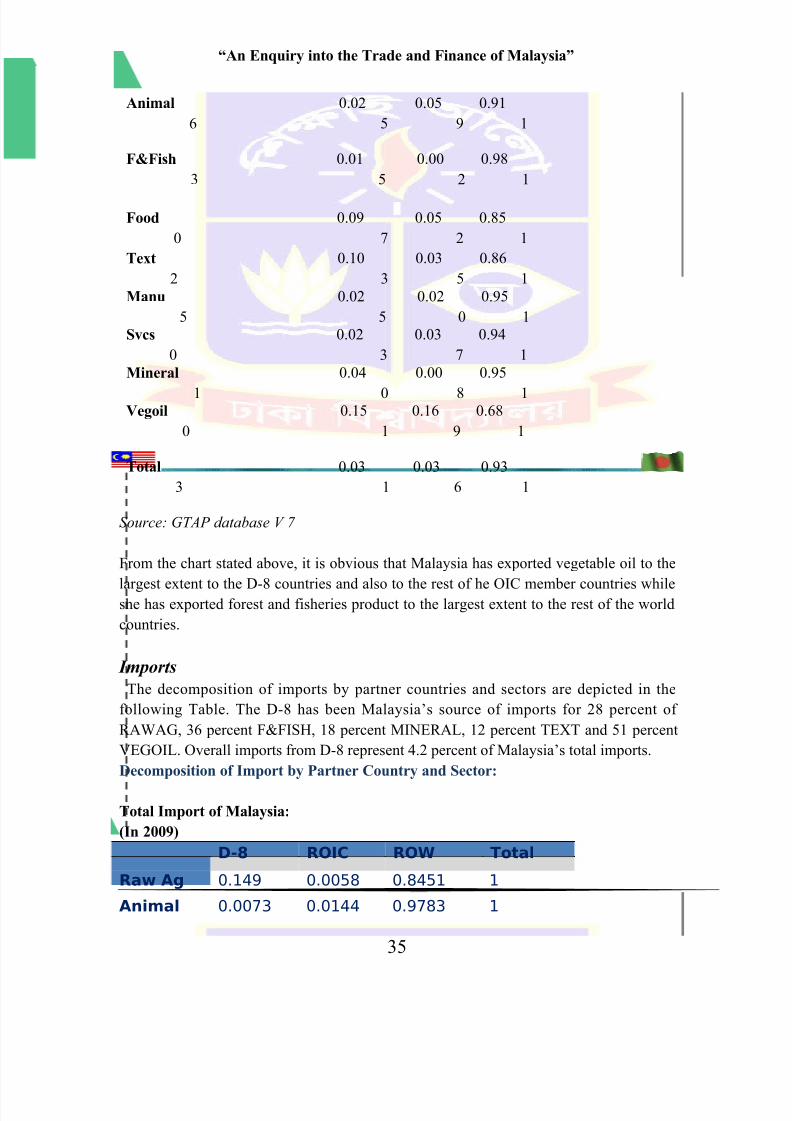
From the chart stated above, it is obvious that Malaysia has exported vegetable oil to the
largest extent to the D-8 countries and also to the rest of he OIC member countries whileshe has exported forest and fisheries product to the largest extent to the rest of the world
countries.
Imports
The decomposition of imports by partner countries and sectors are depicted in the
following Table. The D-8 has been Malaysia’s source of imports for 28 percent of
RAWAG, 36 percent F&FISH, 18 percent MINERAL, 12 percent TEXT and 51 percent
VEGOIL. Overall imports from D-8 represent 4.2 percent of Malaysia’s total imports.
Decomposition of Import by Partner Country and Sector:
“An Enquiry into the Trade and Finance of Malaysia”
Household spending was buoyed by a strong labor market, a hefty (7.5–42%) increase in
public sector salaries from July 2007, low interest rates, and the wealth effect felt by
individuals from stock market gains. Rural incomes benefited from high global prices for
agricultural commodities. Public consumption also grew, by 6.4%.Gross fixed capital
formation increased robustly by 10.2% last year, the highest rate since 2000, supported
by both stronger public and private investment.
The former was bolstered by development projects implemented under the Ninth
Malaysian Plan 2006–2010, and the latter by the solid economic growth, low interest
rates, and improvements to the investment climate.
Among policy changes in 2007 that helped private investment, the Government cut the
corporate tax rate by 2 percentage points over 2 years to 26%; approved a 10-year tax
exemption for venture capital; and eased foreign exchange restrictions somewhat. In
addition, investment incentives were introduced for domestic and foreign investors in the
Iskander Development Region, one of three economic development regions being
developed under the Ninth Plan.
Government Restrictions:
Government policy during this early post-independence period is perhaps best described
as a “holding” program, designed to suppress simmering inter-communal rivalries. The
policy thrust was to continue with the colonial open-door approach relating to trade and
industry policy, while addressing ethnic and regional economic imbalances through rural
development schemes and the provision of social and physical infrastructure. Like inmany other developing countries, import-substitution industrialization was on the policy
agenda in Malaysia during this period. However, unlike in other countries, attempts were
not made to achieve “forced” industrialization through direct import restrictions and the
establishment of state-owned industrial enterprises. The industrialization strategy of the
Malaysian government at the time was largely a “promotional effort, geared to the
provision of an investment climate favorable to private enterprise, especially to foreign
private enterprise” (Wheelwright, 1993).
Very few industries enjoyed nominal tariffs of more than 30% and non-tariff barriers
were almost non-existent Low average tariffs, modest inter-industry tariff dispersion and
limited incidence of non-tariff barriers characterize Malaysia’s trade regime and have
assisted Malaysia’s industrial development. Malaysia is the fourth most open economy in
the world, measured by trade as a share of GDP. In the economy of Malaysia exports
have played a crucial role in sustaining rapid economic growth.
“An Enquiry into the Trade and Finance of Malaysia”
• job training & employment subsidies
• infrastructure subsidies
• R&D support
• derogation from regulations (usually for very large projects)
The counterpart to a liberal trade regime was a receptive environment for foreign direct
investment (FDI). Even in the 1950s and 1960s, when distrust of FDI and multinational
corporations held strong sway in the developing world, Malaysia had a relatively open
and welcoming policy (Athukorala and Menon, 1995). Nevertheless, even in the non-FDI
sphere, Malaysia’s policy regime throughout the post-war period was much more liberal
than in most other developing countries (Williamson and Mahar, 1998). In terms of
monetary policy, this period was typical of the general approach taken by the Central
Bank, the Bank Negara Malaysia (BNM), which is one of minimal intervention. For the
most part, BNM has been mainly focused on ensuring stable interest rates and has notoften used its instruments to conduct counter-cyclical policy (Ariff, 1991).
By the late 1960s, there was growing recognition that the so-called easy stage of import
substitution industrialization was coming to an end, and that future prospects for
industrial development would require the expansion of export-oriented industries.
Through the enactment of the Investment Incentives Act in 1968, policy shifted to
promoting export-oriented activities, especially through FDI.
Foreign direct investment (FDI) net inflows rose by 54.4% to $9.4 billion in 2007, with
manufacturing, particularly the electrical and electronics subsector, attracting more than
half the total in Malaysia. Gross fixed capital formation added 2.3 percentage points to
GDP growth (although this was more than offset by a decline in inventories). On the
external front, real exports and imports each grew by about 4%, the weakest performance
for several years, largely reflecting soft global demand for electrical products, and net
exports did not make a significant contribution to GDP growth.
Malaysia received RM46.1 billion foreign direct investment (FDI), which was all time
high, for the whole of 2008. The foreign investments accounted for 73.4 percent of the
total investments of RM62.8 billion approved for 2008.The Minister of International
Trade and Industry, Datuk Mustapa Mohamed announced that there was a sharp
reduction in FDI and Malaysia only received RM4.2 billion FDI, about 78% reduction,
for the first five months of 2009.
Determination of Foreign Exchange Rate
Prior to the 1997 Asian Financial Crisis, the Malaysian ringgit was an internationalized
currency, which was freely traded around the world. Just before the crisis, the Ringgit
“An Enquiry into the Trade and Finance of Malaysia”
Disadvantages of Floating Foreign Exchange Rate:
Speculator group can create artificial demand and supply.
Findings:
The impact of international trade and FDI on Malaysia’s economy is very muchimportant being Malaysia as a country of multi-racial society comprises of many ethnicgroups.Here are some findings regarding Malaysia’s economy and the factors affectingMalaysia’s economy:
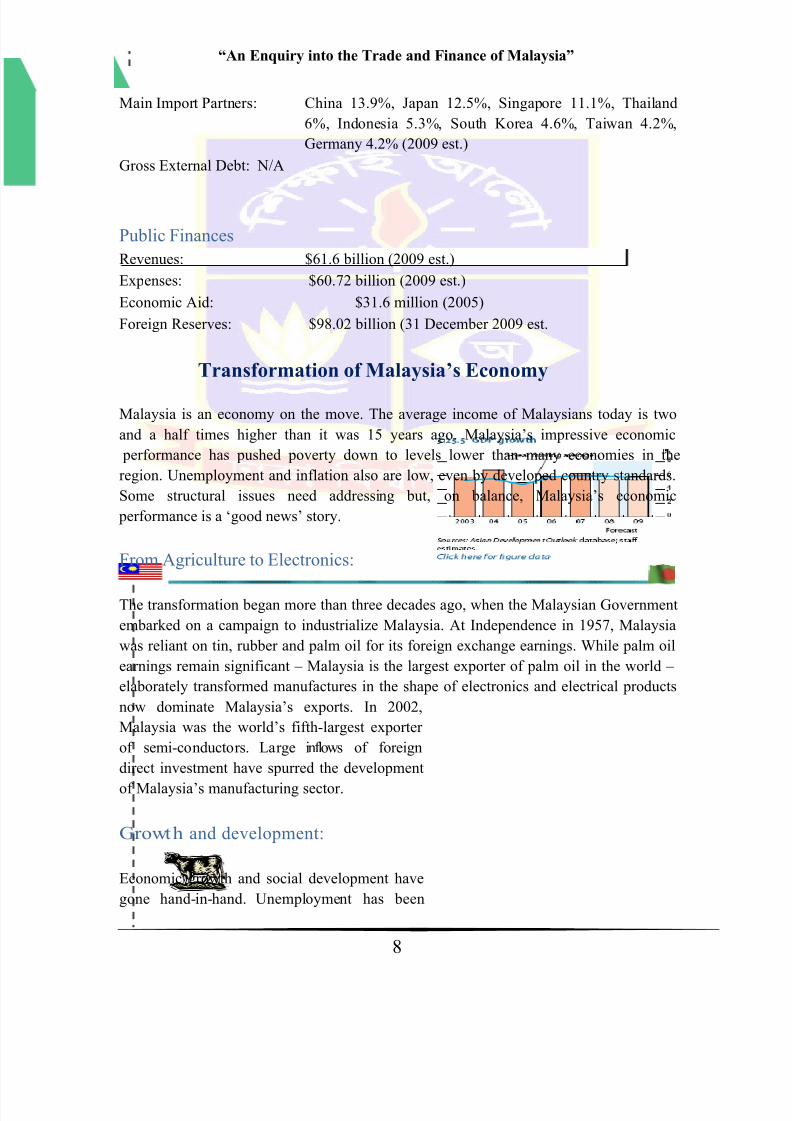
Malaysia now is a high middle-income, export-oriented economy
underlying resilience in the economy and timely responses
from government, Malaysia coped with the Asian financial crisis
better than most other economies in the region.
Malaysia’s GDP and overall economy have improved at a faster
rate during the courses of time.
Malaysia’s impressive economic performance has pushed
poverty down to levels lower than many economies in the
region. Unemployment and inflation also are low, even by
developed country standards.
Large inflows of foreign direct investment have spurred the
development of Malaysia’s manufacturing sector.
International relation between Malaysia and other countries
entered into different customs unions with Malaysia with
possibility of establishing a virtual but powerful network have
brought mutual benefit to all participating countries.
The economy of the country has, traditionally, been fuelled by its
natural resources, but is now also expanding in the sectors of
science, tourism, commerce and medical tourism.
Some structural issues need addressing but, on balance,
Malaysia’s economic performance is a ‘good news’ story.