POLICY RESEARCH WORKING PAPER 1492 Trade Policies, Trade policies cannotresolw current account problems. Macroeconomic Adjustment, Their effect on the current and Manufactured Exports account disappears after and Manutacture( exports ~~~~~~~~~three years. The Latin American Experience Sarath Rajapatirana The World Bank Latin America and the Caribbean Technical Department Advisory Group August 1995 Public Disclosure Authorized Public Disclosure Authorized Public Disclosure Authorized Public Disclosure Authorized
Macroeconomic Adjustment, Their effect on the current
and Manufactured Exports account disappears afterand Manutacture( exports ~~~~~~~~~three years.
The Latin American Experience
Sarath Rajapatirana
The World BankLatin America and the CaribbeanTechnical Department
Advisory Group
August 1995
Pub
lic D
iscl
osur
e A
utho
rized
Pub
lic D
iscl
osur
e A
utho
rized
Pub
lic D
iscl
osur
e A
utho
rized
Pub
lic D
iscl
osur
e A
utho
rized
POLICY RESEARCH WORKING PAPER 1492
Summary findings
Rajapatirana examines the relationship between trade * For trade liberalization to work, there must be realpolicies and macroeconomic adjustment in six Latin devaluation either before or during liberalization.American countries: Argentina, Brazil, Chile, Colombia, Reluctance to devalue, for one reason or another, mayCosta Rica, and Mexico. lead to trade restrictions. There is evidence that trade
For the period 1965-94, the six countries experienced restrictions were used in lieu of devaluations during26 trade policy episodes: 11 of tightening, and 15 of 1965-83. In 1984-94, however, the reluctance toloosening trade policies. devalue was overcome.
For the analysis, Rajapatirana worked with four * Growth in manufactured exports helps maintainperiods that coincided with different prevailing exchange trade reform and release the economy from foreignrate regimes: 1965-73, 1974-79, 1980-83, and 1984- exchange constraints. As expected, trade liberalization94. Using a probit model, he examined the relationship improved exports (liberalization reduces the bias againstbetween tightening and loosening trade policies and the exports) while trade tightening hurt them.current account balance, the exchange rate, and the * The impact of trade reform on the fiscal systemgrowth in manufacturing exports. His main conclusions: cannot be predicted because tax revenues can go in either
- Experience in these six countries for 1965-94 direction depending on initial conditions, the elasticity ofconfirmed the hypothesis that trade restrictions cannot supply in importable and exportable sectors, and thesolve current accounr problems. economy's growth rate.
This paper-a product of the Advisory Group, Latin America and the Caribbean Technical Department-is part of a larger effortin the department to disseminate lessons about policy and institutional reform that are relevant to the region. Copies of the paperare available free from the World Bank, 1818 H Street NW, Washington, DC 20433. Please contact Joy Troncoso, room 18-314,telephone 202-473-7826, fax 202-676-0239, Internet address [email protected] (34 pages). August 1995.
The Policy Research Working Paper Series disseminates the findings of work in progress to encourage the exchange of ideas aboutdevelopment issues. An objective of the series is to get the findings out quickly, even if the presentations are less than fully polished. Thepapers carry the names of the authors and should be used and cited accordingly. The findings, interpretations, and conclusions are theauthors' oun and should not be attributed to the World Bank, its Executive Board of Directors, or any of its member countries.
Produced by the Policy Research Dissemination Center
Trade Policies, Macroeconomic Adjustment, and Manufactured Exports:The Latin American Experience
Sarath Rajapatirana
The research assistance of Cherian Samuel, the editorial assistance of Charles Dade and the secretarial assistanceof Joy Troncoso is gratefully acknovwedged by the author. An earlier version of the paper was presented at aseminar at the Instituto Torcuato di Te.,d, Buenos Aires. Julio Berlinski's comments at the seminar were extremelyhelpful.
Trade Policies, Macroeconomic Adjustment, and Manufactured Exports:The Latin American Experience
Table of Contents
I. Introduction ............................. 1
II. Evolution of Trade Policies in the Six Countries .4
III. Trade and Exchange Rate Policies ............................ 12
IV. The Effects of Trade Policy Episodes ........................... 13A. Effects on Current Accounts ............................ 14B. Effects on Fiscal Balances ............................. 15C. Effects on Imports and Outputs ........................... 17D. Effects on Manufactured Exports ............................ 18
V. Conclusions ............................ 21
References .. 24
Table 1: Trade Policy Episodes by Analytical Periods and Exchange Rate RegimesTable 2: Trade Policy Episodes, Trade Regime Changes and the Exchange Rate, 1965-92Table 3: Trade Policies and Ratio of Current Account Balance (CAB) to GDP (percent)Table 4: Current Account and Trade Policies: Panel Data RegressionsTable 5: Trade Policies and Trade Tax Revenues (percent)Table 6: Trade Policies and Import Growth (%)Table 7: Trade Policies and Output Growth (%)Table 8: Trade Policies and Growth of Manufactured Exports (%)Table 9: Export Regressions
I. Introduction
The principal question in the literature on the relationship between trade policies and
macroeconomic adjustment is how macroeconomic adjustment impinges upon trade policy
making. Most of the research on the sequencing of trade policies postulates that macroeconomic
stabilization and adjustment should precede trade policy reforms. This is based on the argument
that macroeconomic disequilibrium--which appears as inflation or current account deficits-- leads
to overvalued exchange rates and undermine trade policy reforms."' Many studies have
analyzed the relationship between macroeconomic policy changes and trade regimes.'
However, little research has been done about the reverse relationship of how trade policies
affect macroeconomic adjustment. Countries experiencing macroeconomic imbalance, such as
a current account deficit that cannot be financed, have used and continue to use trade policies
to deal with the imbalance. Thus, countries experiencing rising current account deficits have
attempted to tighten trade policies while those experiencing rising current account surpluses that
lead to inordinate reserve accumulation have attempted to loosen or liberalize their trade policies.
In this sense, trade policies have been used as instruments for macroeconomic adjustment, either
by reducing expenditures on imports through import restrictions, or by inducing increased
expenditures on imports by liberalizing the import regime. Raising the domestic price of imports
through quantitative restrictions (QRs) or through import tariffs induces a switch in expenditures
from imports to the domestic market. This switch could raise the price of non-tradables.
Exports are also affected to the extent that they use imported inputs and the existing bias against
exports is increased because their profitability relative to import substitutes and other non-
tradables falls. Unless the import restrictions are accompanied by export subsides of one type
or another, exports are adversely affected.
1/ See Edwards (1984) for instance.
2/ See Corden (1990) for a detailed discussion.
2
The analytical basis for macroeconomic adjustment is well summarized by Corden (1990).
A small open economy has a current account deficit which needs to be removed. The less
foreign credits are available the more speedily this has to be done. The standard analysis is that
total expenditure by government and the private sector has to fall. This is the reduction in
'absorption' which reduces demand for both tradables and nontradables. In addition, there has
to be a real devaluation which shifts both the pattern of domestic demand from tradables towards
nontradables and the output pattern from tradables towards nontradables. This is a 'switching'
policy which ensures that the process of 'external balance' takes place while 'internal balance'--
overall employment--is being maintained. Without such a switching, the reduction in domestic
demand required to improve the current account would result in excess supply and
unemployment in the nontradable sectors of the economy.3'
If the policy instrument to bring about switching is to be exchange rate adjustment, it is
necessary that a real devaluation does take place as a result of nominal devaluation. If wages
rise when the price of imports and the cost of living rise, or if there has not been an adequate
expenditure reduction so that the devaluation-induced rise in demand for nontradables creates
excess demand and then some inflation of nontradable prices (or, more broadly, of prices of
home-produced goods), a real devaluation will not be achieved. It is common that initially a
nominal devaluation does bring about a real devaluation, but that its effects are gradually eroded
at least to a partial extent. A great deal hinges on whether monetary policies are accommodating
or not. Here, the experiences of developing countries have varied greatly.
Given this framework, it is clear that the recourse to trade policy instruments to deal with
a current account deficit or a surplus is related to a government's reluctance to use the exchange
rate to switch expenditures or to cut expenditures through absorption policies. Here again, trade
policies are used as surrogates for macroeconomic policies. In the face of rising and monetized
current account surpluses, inflation and an appreciation of the exchange rate will result, if fiscal
3/ See ch. I of Corden (1985) for a diagrammatic exposition of this standard analysis. The basic theoryoriginated with Meade (1951) and th concept of switching with Johnson (1958).
3
and monetary macroeconomic policies are not used to deal with an accumulation of reserves.
While such an appreciation is at times warranted, an over-shooting of the exchange rate must
be avoided.'
Many countries in Latin America have resorted to trade policies to deal with
macroeconomic imbalances. This paper examines the use of trade policies as instruments of
macroeconomic adjustment in six Latin American countries--Argentina, Brazil, Chile, Colombia,
Costa Rica, and Mexico. These six countries provide a rich collection of experiences given their
past large macroeconomic imbalances. Both liberalization and tightening trade policy episodes
are reviewed to evaluate their effectiveness. The general conclusion that emerges is that trade
policies have no effect on the current account balance beyond their immediate effect in the
presence of other relevant variables such as the real exchange rate, demand in importing
countries, the fiscal deficit and the terms of trade. This may be one reason why the six
countries have not used trade policies for macroeconomic purposes after 1991. However, it
should be noted that in the wake of the Mexican peso crisis in December 1994, Argentina,
Brazil, and Mexico increased tariffs marginally. These measures have been adopted mainly for
revenue reasons and therefore should not really be viewed as departures from the commitment
to liberalization and an open trade regime. At one level, this recourse to trade policies for
macroeconomic purposes was necessary for these countries since they were operating in a
virtually fixed exchange rate environment.
In particular, it is interesting to consider these issues in the context of manufactured
exports. Manufactured exports play an important role in macroeconomic adjustment. For one,
an increase in manufacturing exports removes foreign exchange constraints, gives greater
confidence to policy makers to sustain trade reforms, and creates a lobby that would support
fuller trade reforms. In the case of the East Asian countries for instance, manufactured exports
played a critical role in sustaining macroeconomic adjustment and indeed became the foundation
4/ See Dornbusch (1980) for an elabeoation of this result.
4
for high output growth. In the case of the six countries studied here, though the growth in
manufacturing exports has been modest, it has helped the process of overall liberalization.
The rest of the paper is divided into five sections: II. Evolution of trade policies for
macroeconomic adjustment in the six countries; III. Trade and exchange rate policies; IV.
Effects of trade policy episodes; and V. Conclusions.
II. Evolution of Trade Policies for Macroeconomic Adjustment
in the Six Countries
Since the mid- 1 960s the six Latin American countries, Argentina, Brazil, Chile, Colombia,
Costa Rica, and Mexico, have used some sort of trade policies for macroeconomic adjustment.
In particular, an increase in import restrictions has been the normal response to a balance of
payments deficit. Also, there have been many episodes of liberalization of trade policies
associated with improving balance of payments positions.
The most common and effective trade policy instrument used to deal with current account
deficits has been quantitative restrictions (QRs). This method has usually consisted of shifting
import items from a free list to a QR list. Conversely, trade policies were liberalized by
increasing the number of items on the free list. At times QRs have been applied to all imports.
Some countries have subjected all imports to QRs unless they are included in a positive list.
Others have freely admitted all imports unless included in a negative list. A switch from a
positive list system to a negative list system could represent a substantial liberalization.
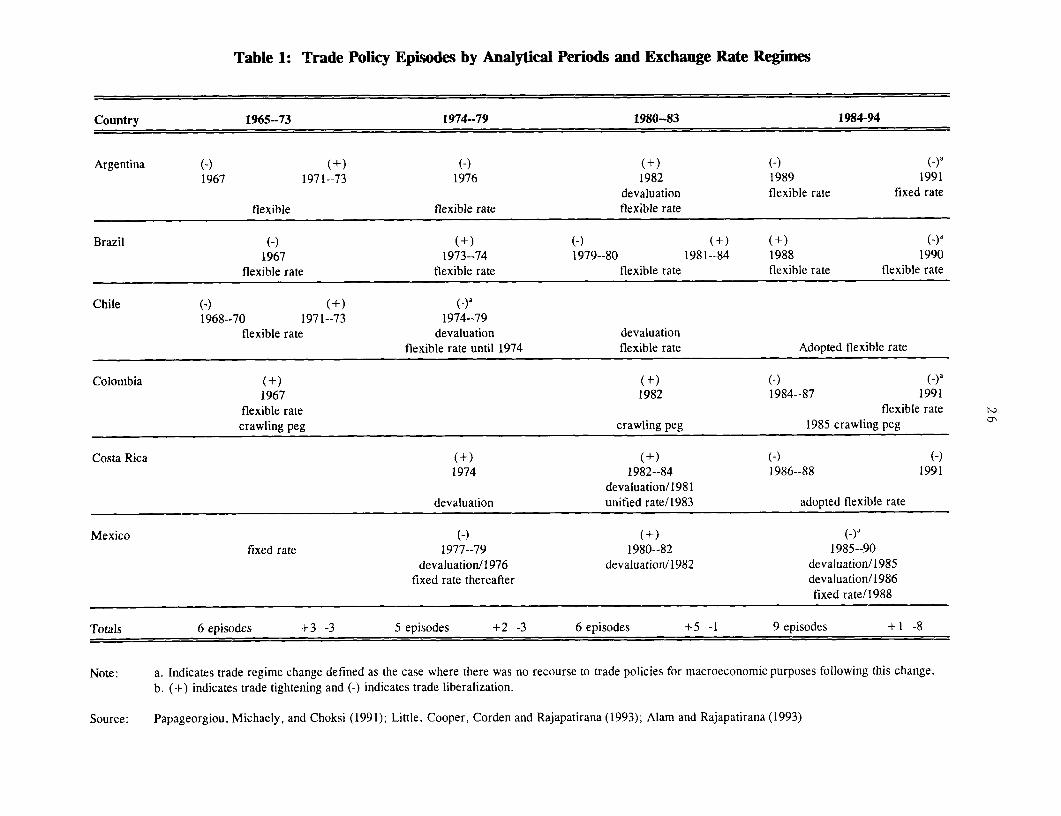
Since 1965 there have been twenty six trade episodes with eleven trade policy tightenings
and fifteen liberalizing episodes in the six countries (table 1). These episodes are identified on
the basis of changes in import quotas, tariffs, export taxes, and subsidies in each country. QRs
were the most common tool. Tariffs, export subsidies, and taxes played a minor role in these
5
episodes. In most instances, tariffs were imposed mainly for revenue purposes. At times,
export taxes were raised simultaneously with a devaluation to siphon off the higher export
revenues in domestic currency resulting from a devaluation. Sometimes export subsidies were
used to offset the bias against exports arising from an increase in the items subject to quotas or
an accompanying increase in tariffs.
What is of interest in analyzing the use of trade policies for macroeconomic adjustment
purposes are the changes in the direction and extent of trade policy, and the duration of the
policy episode. The duration of each trade policy episode was measured as the period the policy
was maintained from the time it was introduced. The episodes have been further identified on
the basis of detailed information obtained from Little, Cooper, Corden, and Rajapatirana (1993),
Papageorgiou, Michaely, and Choksi (1991) and, Alam and Rajapatirana (1993).
Within the period 1965-94, there are four distinguishable subperiods coinciding with
changes in the exchange rate regimes. Table 1 distinguishes these periods (1965-73, 1974-79,
1980-83, and 1984-94) related to changes in exchange rate regimes in these countries and indeed
for the whole world. Argentina, for example, had six episodes over the whole period--three
trade liberalizing episodes and three trade tightening episodes. Argentina and Brazil have had
the largest number of policy episodes over the whole period; this is not surprising given the
large and persistent macroeconomic imbalances they experienced during the 1970s and 1980s.
These countries changed their trade regimes fundamentally after 1991. Chile, on the other hand,
had only three episodes with a fundamental trade reform or regime change in 1974. Mexico also
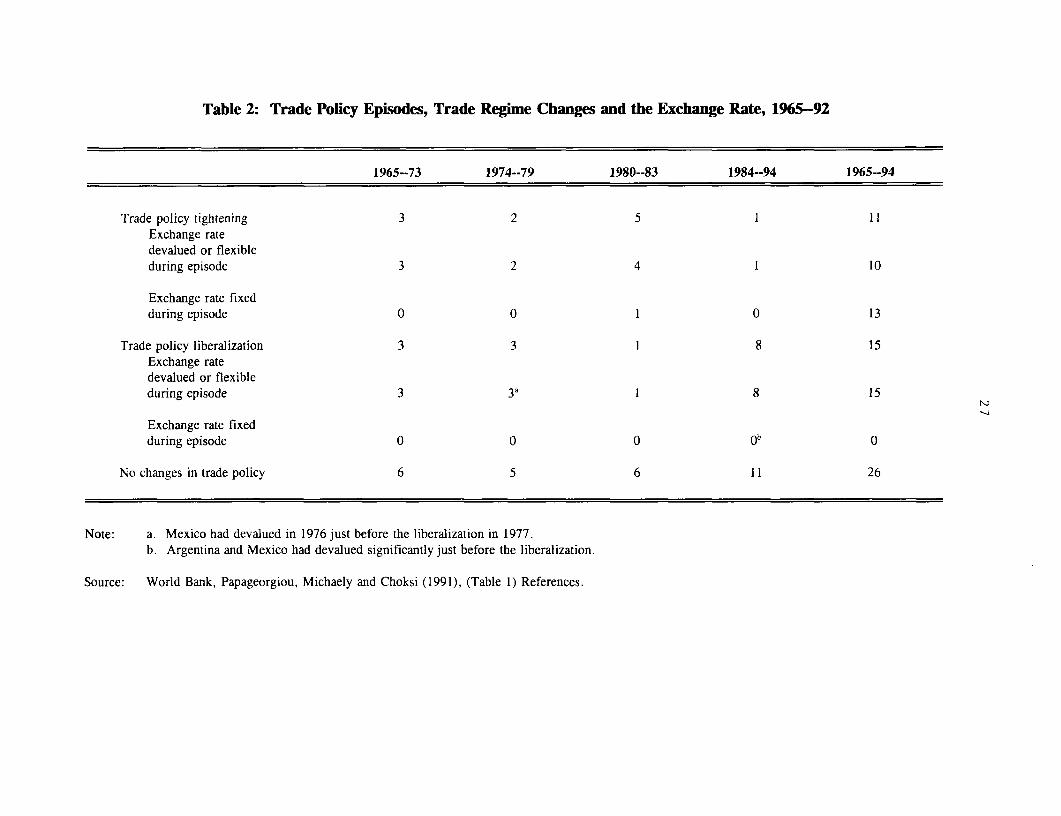
had three episodes while Colombia and Costa Rica had four episodes each. Table 2 shows that
in the first period (1965-73), there were six trade tightenings and nine liberalizations. As might
be expected, the second and the third periods (1974-79 and 1980-83) which coincided with the
first and the second oil shocks (1973 and 1980) and the debt shock (1982) were mainly
characterized by tightening, while the last period (1984-94) was one of liberalizing trade
policies. The increases in tariffs in Argentina, Brazil, and Mexico in early 1995 is avowedly a
temporary measure in the wake of the Mexican Peso crisis and therefore should not be viewed
as fundamental departure from the liberalization process. However, it is indeed a case of using
6
trade policies for macroeconomic purposes and the results of the past efforts become
immediately germane in judging the potential effects of these trade measures. It is too early to
examine the effects of these early 1995 trade policy changes. But, the experiences of the past
become even more important in visualizing the outcome of these trade policy episodes beyond
the immediate effects.
The evolution of trade policies shows a number of characteristics. First, when a current
account problem developed during the first three periods--1965-73, 1974-79, and 1980-83--the
tendency was to tighten QRs. The trade tightening was usually done by shifting items from a
free to a restricted list. The change in trade policy was an important instrument of
macroeconomic adjustment policy in each case with the sole exception of Chile in 1974. In the
case of Chile, there was a large current account deficit following the Allende government. The
new government liberalized the trade regime and in doing so departed from the then standard
response to a current deficit. Although trade tightenings were usually preceded by current
account deteriorations, this was not always the case. Countries that had access to external funds
tended to finance the deficit rather than attempt to adjust. This of course was the right policy
response, if the deficit was expected to be temporary and if it could be financed without
difficulty. That was pretty much the case for nearly all the six countries before 1982.
In any case, a current account deficit could not be addressed by import restrictions alone
because there is no reduction in excess demand that had created the current account deficit in
the first place. On the other hand, the import restrictions switch expenditure to the domestic
market including non-tradables and, at the same time, create a bias against exports. If the latter
is not corrected, the balance of payments problems will persist. If the import restrictions have
been in place before, this could create a phenomenon known as import starvation which will lead
to a reduction in output including exports. Exports are handicapped by the difficulty of
obtaining imported components and inputs and sometimes through a real appreciation. As a
reaction to the country's previous bad experience with protection itself, it becomes easy to find
support for liberalization. The worse the previous experience, the more drastic the change is
7
likely to be. Liberalization in such cases must always be preceded by, or associated with, big
devaluations.
Second, during the fourth period (1984-94), worsening of the macroeconomic situation did
not lead to trade tightening but rather to trade liberalizations. As noted before, this relationship
has been modified somewhat in the wake of the Mexican economic crisis in December 1994.
Only one trade tightening took place during that period---Brazil's in 1988. This could be readily
explained by the balance of payments situation though it was also reversed in 1990. In five
other cases, deterioration of the current account led to a package of crisis policies that included
trade liberalization--referred in the recent literature as "the new liberalization ".5' Therefore,
the earlier relationship between current account deficits and trade policies was broken.
The extreme case here is that of oil exporter, Mexico, which faced an adverse price shock
in 1985. At this point the government saw that imposing import restrictions was not a good
policy for all the familiar reasons. Hence, contrary to earlier practice, Mexico instituted a trade
liberalization program and other measures associated with structural adjustment, such as
devaluation, tight fiscal policies, and increases in public enterprise prices and privatization.
Third, the responses to current account deficits have been asymmetric. While
improvements in the current account were less likely to lead to liberalizing episodes,
deteriorations in the current account were more likely to lead to tightenings. For example,
Colombia did not liberalize with the coffee boom of 1976-78. There is of course less of an
urgency to adjust to a surplus compared to a balance of payments deficit. In other words,
countries were more prepared to live with an appreciation of the exchange rate arising from a
surplus that was monetized, than accept the need to devalue the currency and cut absorption.
There were two political economy reasons for this asymmetry: (i) except for Chile in 1974, these
countries were ideologically committed to trade restrictions as a means of promoting domestic
industry; and (ii) interest groups that were supporting import restrictions were more powerful
5/ See Little, Cooper, Corden and R 3patirana (1993) for a more detailed discussion.
8
because of the long tenure of the import substitution regime, compared to consumers and
exporters, who had to pay for the import restrictions in terms of higher prices and a bias against
the production of exportables.
Fourth, the various trade policy episodes were only mildly related to external shocks. The
first period (1965-73) brought no significant external shocks other than the commodity boom at
the end of the period. Trade tightenings resulted from current account problems which in turn
resulted from domestic policy shocks. In the second and third periods (1974-78, 1980-83),
external shocks--the first and second oil shocks and the debt shock--did play a significant role
but they did not always have the expected effects. For example, Colombia did not liberalize
with the coffee boom. As noted, favorable current account effects did not always lead to
liberalization while unfavorable effects did not always lead to trade tightening. In the fourth
period (1984-94) the principal external shock was the 1986 collapse of oil prices. However, the
oil exporters, Mexico and Colombia, did not tighten their trade policies.
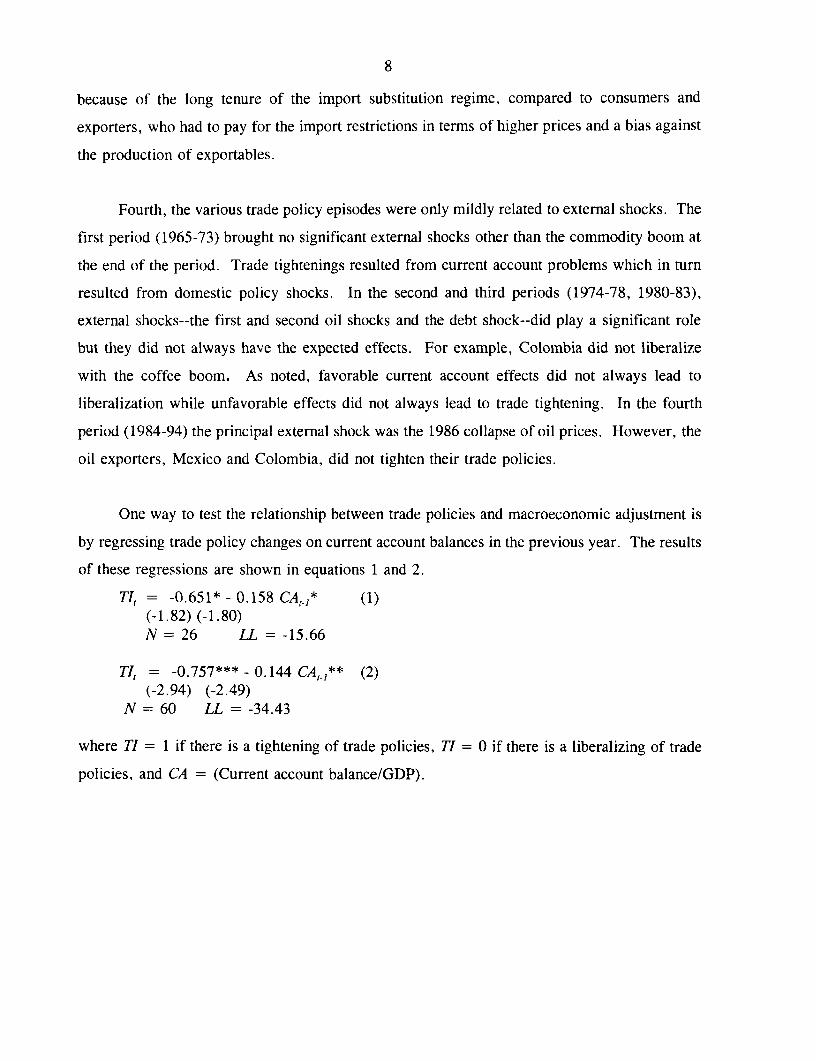
One way to test the relationship between trade policies and macroeconomic adjustment is
by regressing trade policy changes on current account balances in the previous year. The results
of these regressions are shown in equations 1 and 2.
where TI = 1 if there is a tightening of trade policies, TI = 0 if there is a liberalizing of trade
policies, and CA = (Current account balance/GDP).
9
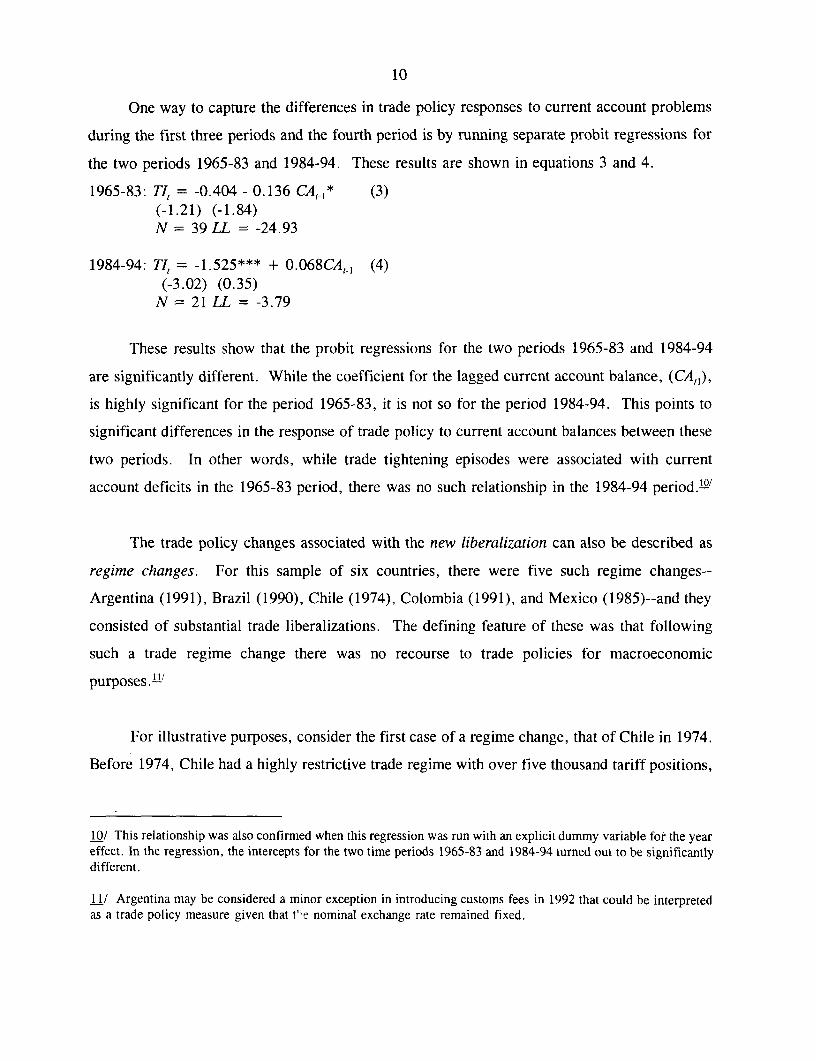
There are 60 events of trade policy tightening and liberalizing where the duration of each
episode is enumerated.6' When the data are restricted to the first year of each episode, there
are 26 trade policy episodes.
The results of the probit7' analysis shows that it is more likely to encounter tightening in
the trade policies when the countries experienced a deficit in the current account in the previous
year."' The results indicate that there is a higher probability that tightening episodes are
associated with current account deficits. Of course, not all current account deficits are followed
by tightening.
As indicated by these regressions, the attempt to use tightening and liberalizing trade
polices to affect macroeconomic adjustments have been a feature of these countries for the past
thirty years. However, Latin American countries are not unique in this respect; many other
countries have adopted similar responses when faced with macroeconomic imbalances. What
is unique about Latin America though is the frequency and extent of the imbalances.2'
6/ The 60 events are the sum of all episodes when the duration of each episode is counted as one for each year.
7/ Given that the dependent variable takes values 0 and 1, the OLS model will give biased estimators for anysample size. The alternative is to use (binary choice) probit or logit models. These models take the form:
P[Y, = I/X,] = F(X,B).While the probit model uses a normal function, logit uses a logistic function for the error term. Since the twofunctions are very similar and since the use of the standard normal cumulative density function is less contested inthe literature, we use the probit model to test our hypotheses.
8/ Here and in the subsequent equations, the t-statistic appears in parentheses. Superscript * indicates significanceat the 10% level, superscript ** indicates significance at the 5% level, and superscript *** indicates significanceat the 1 % level. N indicates the number of observations, and LL the log-likelihood function.
9/ In a larger sample of eighteen countries to which this group of six countries belongs, there have been fifty ninetrade policy episodes, while the six countries have had twenty six episodes. Thus,these six countries, which werea third of the larger sample account for nearly half of the trade episodes. See Little, Cooper, Corden andRajapatirana (1993) for details.
10
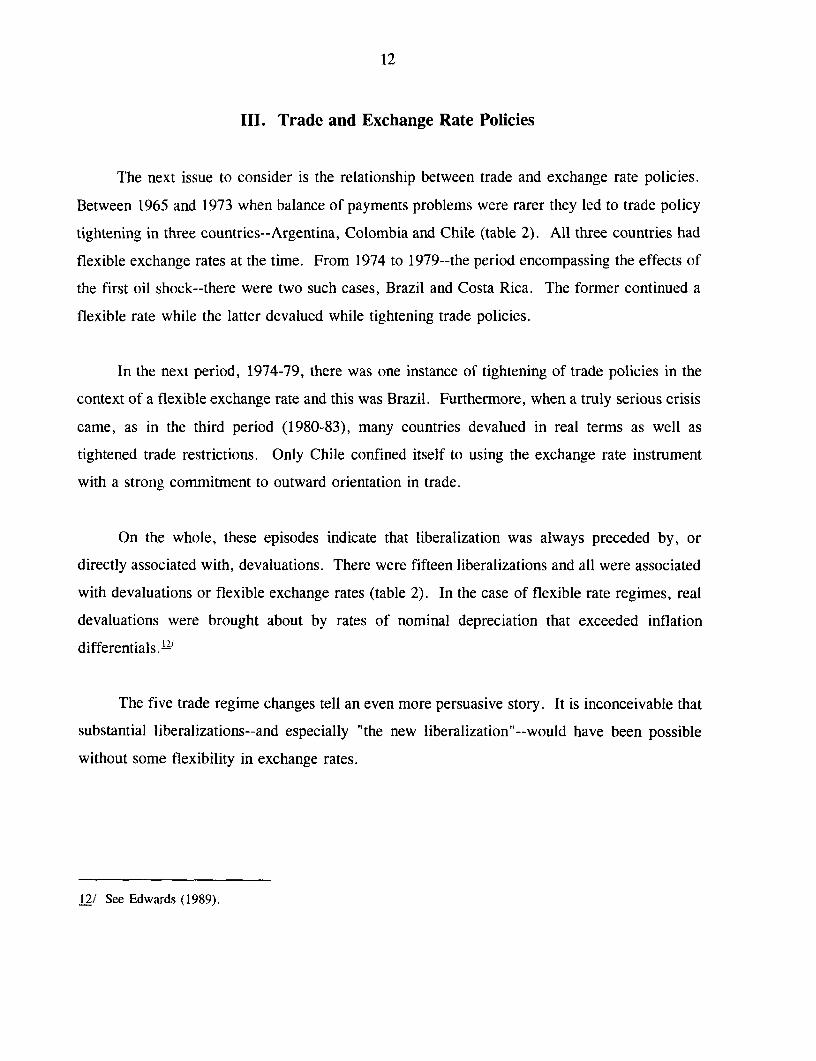
One way to capture the differences in trade policy responses to current account problems
during the first three periods and the fourth period is by running separate probit regressions for
the two periods 1965-83 and 1984-94. These results are shown in equations 3 and 4.
These results show that the probit regressions for the two periods 1965-83 and 1984-94
are significantly different. While the coefficient for the lagged current account balance, (CA,,),
is highly significant for the period 1965-83, it is not so for the period 1984-94. This points to
significant differences in the response of trade policy to current account balances between these
two periods. In other words, while trade tightening episodes were associated with current
account deficits in the 1965-83 period, there was no such relationship in the 1984-94 period.'"'
The trade policy changes associated with the new liberalization can also be described as
regime changes. For this sample of six countries, there were five such regime changes--
Argentina (1991), Brazil (1990), Chile (1974), Colombia (1991), and Mexico (1985)--and they
consisted of substantial trade liberalizations. The defining feature of these was that following
such a trade regime change there was no recourse to trade policies for macroeconomic
purposes. l'
For illustrative purposes, consider the first case of a regime change, that of Chile in 1974.
Before 1974, Chile had a highly restrictive trade regime with over five thousand tariff positions,
10/ This relationship was also confirmed when this regression was run with an explicit dummy variable for the yeareffect. In the regression, the intercepts for the two time periods 1965-83 and 1984-94 turned out to be significantlydifferent.
11/ Argentina may be considered a minor exception in introducing customs fees in 1992 that could be interpretedas a trade policy measure given that t'e nominal exchange rate remained fixed.
11
63 percent of which were subject to QRs. Some two hundred of these positions were completely
banned while nearly two thousand were subject to a prohibitive ninety-day advance deposit
requirement. Between 1974 and 1976, all QRs, except six minor items, were abolished. Tariff
rates which, at up to 750 percent, had been very high were reduced in three stages to a uniform
10 percent by 1979--except for automobiles and other vehicles. Tariffs were increased in 1983
and reduced again in 1988, but the entire fourth period was one of openness.
While the balance of payments crisis created the shock environment in which trade
liberalization and other radical policy changes became possible, there was also an intellectual
shift in the 1980s toward outward-oriented policies because of the new research that emphasized
their beneficial impact compared to inward-oriented policies. Furthermore, the recommendations
and conditionalities of the international financial institutions also played a decidedly major role.
Countries with balance of payments problems needed the support of these institutions, and their
support was only forthcoming if some credible steps toward liberalization were taken. A
worldwide ideological pro-market trend brought on by the success of East Asia and the patent
failures of state-centered development strategies elsewhere made the intellectual case for
liberalization that much easier. These countries felt that there was no other way out of the crises
since there were no external funds available after the debt crisis. The deficits could no longer
be financed, leaving adjustment as the only choice.
In 1990 and 1991, two of the most protectionist countries, Argentina and Brazil, embarked
on liberalization programs. Argentina's measures were quite drastic. The hyperinflation of
1989 and a new reformist government made drastic reforms acceptable. By 1990 Brazil also
greatly reduced the coverage of QRs. Costa Rica provides a good example of liberalization with
support from the international financial institutions. Owing to excessive fiscal expansion for the
first time in many years a serious balance of payments problem emerged in 1986. This required
support from the international institutions and also emphasized the need for drastic stabilization
and adjustment. However, Costa Rica is unique among the six countries for not undertaking a
regime change in trade policy.
12
III. Trade and Exchange Rate Policies
The next issue to consider is the relationship between trade and exchange rate policies.
Between 1965 and 1973 when balance of payments problems were rarer they led to trade policy
tightening in three countries--Argentina, Colombia and Chile (table 2). All three countries had
flexible exchange rates at the time. From 1974 to 1979--the period encompassing the effects of
the first oil shock--there were two such cases, Brazil and Costa Rica. The former continued a
flexible rate while the latter devalued while tightening trade policies.
In the next period, 1974-79, there was one instance of tightening of trade policies in the
context of a flexible exchange rate and this was Brazil. Furthermore, when a truly serious crisis
came, as in the third period (1980-83), many countries devalued in real terms as well as
tightened trade restrictions. Only Chile confined itself to using the exchange rate instrument
with a strong commitment to outward orientation in trade.
On the whole, these episodes indicate that liberalization was always preceded by, or
directly associated with, devaluations. There were fifteen liberalizations and all were associated
with devaluations or flexible exchange rates (table 2). In the case of flexible rate regimes, real
devaluations were brought about by rates of nominal depreciation that exceeded inflation
differentials. 't
The five trade regime changes tell an even more persuasive story. It is inconceivable that
substantial liberalizations--and especially "the new liberalization"--would have been possible
without some flexibility in exchange rates.
12/ See Edwards (1989).
13
The hypothesis that trade policy changes and devaluations have been used as substitute
instruments for balance-of-payments policy is confirmed by the regression of trade policies on
devaluations, shown in equation 5.
Dev, = -0.465*** -0.446 TI,** (5)(-4.55) (-2.30)
N = 168 LL =-101.80
where Dev = 1 if there is a step wise nominal devaluation over 10 percent, and Dev = 0
otherwise. TI = 1 if there is a tightening of trade policies, TI = 0 if there is no change of trade
policies, and TI = -1 if there is a liberalizing of trade policies.
The regression results supports the hypothesis that liberalizing--and not tightening--of trade
policies has a greater probability of going together with devaluations of the nominal exchange
rate. In other words, trade policy has been used in lieu of devaluation when countries have been
reluctant to devalue their currencies in the face of a balance of payments problem.
IV. The Effects of Trade Policy Episodes
The various trade policy measures had important microeconomic and long-term effects that
have been studied in detail."3' The view of most economists and, since the mid-1980s, of most
policymakers in these countries is that intervention, especially when it takes the form of
quantitative import restrictions and fosters an inward-looking orientation, has had an adverse
effect on real incomes and growth."-4 / The spread of this belief explains in part the
liberalization trend of the 1980s and early 1990s in these countries.
13/ See Bhagwati (1989), Krueger (1978), and Little, Scitovsky, and Scott (1970) for details.
14/ See Edwards (1991) for instance
14
A. Effects on Current Accounts
The short-term effects of trade policy episodes on outputs, exports, and imports are
difficult to measure in a comprehensive way. But these episodes are related to subsequent
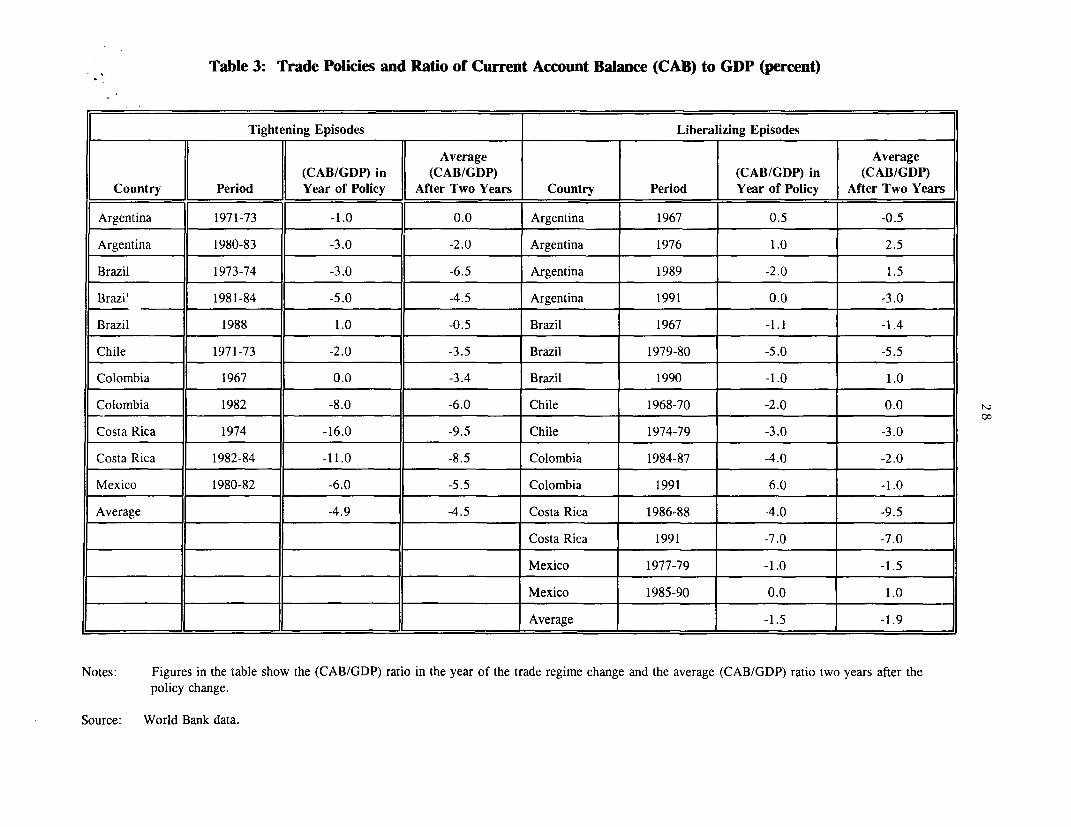
current account developments as shown in table 3. An important point to remember here is that
a trade policy episode never happens on its own. It is often associated with expenditure changes
and exchange rate changes. If the current account improves after a tightening episode and if this
is associated with a devaluation in which a fiscal contraction has also taken place, then the
subsequent current account development is the result of the whole policy package. Furthermore,
subsequent exogenous shocks, such as changes in export prices, will affect the result.
In the 1980s and early 1990s, the new liberalizations were always associated with real
devaluations and often with crisis measures that involved fiscal and monetary contraction.
Hence, the reform package did not necessarily worsen the current account. The stabilization and
structural adjustment packages involved both real devaluation and liberalization. They also
brought with them added financial support from international financial institutions, governments,
and eventually, as in the case of Mexico in 1991, from the private sector. Continued, and
possibly greater, current account deficits were thus made possible. In the final analysis, a
country can only sustain a current account that can be financed. It is the availability of finance--
including financing obtained through rescheduling--that will determine the current account
position. If sufficient financing is not available, trade restrictions, exchange rate adjustment,
and expenditure reductions will have to be used to improve the current account. In practice, this
is the context in which trade policies come to be used as surrogates for macroeconomic policies.
To summarize, the evidence in table 3 shows that on average the current accounts
worsened marginally following trade liberalization and improved marginally following trade
tightening. Improvements following tightenings did not last beyond a year. It is therefore not
surprising that the extent of the needed adjustment increased over time. This is another reason
why the liberalizations were taking place in the late 1980s and the early 1990s. Also by 1990,
15
new capital had begun to flow to these countries that prevented further deterioration in balance
of payments positions.
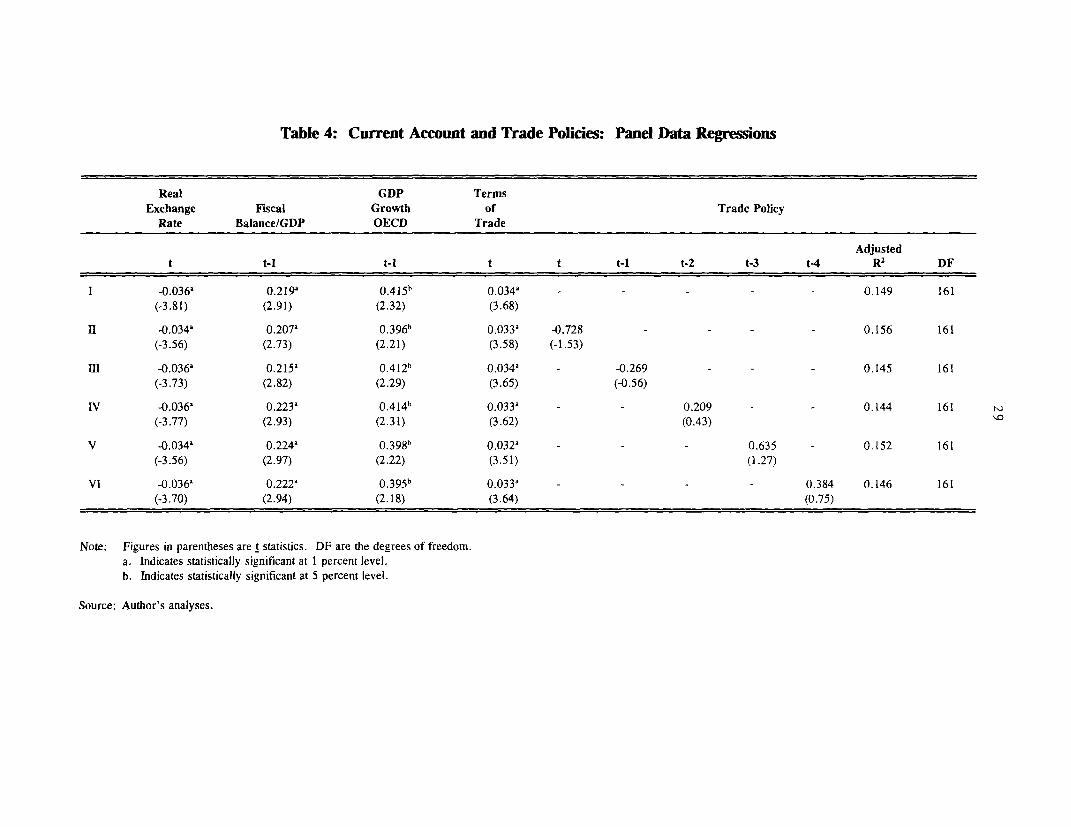
Table 4 presents the results of the panel data regressions of the current account balance
for the sample countries. The independent variables are the real exchange rate, fiscal balance
as a share of GDP, OECD growth rate, the terms of trade and trade policy changes. As shown
in the table, all the variables emerge statistically significant and with the expected signs. The
results suggest that, a one percent drop in last year's output of the OECD countries will imply
a deterioration of the current account by roughly half a percent.
Regressions II to VI also include the trade policy variable (TI).'' These regressions
show that trade policies have no effect on current account in the presence of other variables like
real exchange rate, fiscal balance, GDP growth of OECD countries, and terms of trade. These
results also imply that current account improvements following tightenings do not last for more
than three years.
B. Effects on Fiscal Balances
A common assumption is that a reduction in import tariffs and export subsidies would
reduce fiscal revenues while an increase would raise revenues. By extension, while trade
liberalization is expected to produce lower trade tax revenues, tightenings should raise trade tax
revenues; a further assumption here is that tariffs and subsidies are the only or the more
dominant trade instruments. However, the dynamic (growth) effects of trade policy episodes
are ignored here.
The principal method these countries used to tighten and liberalize trade policies was to
vary QRs. Thus, a trade tightening based on an increase in QR coverage--at constant tariffs and
15/ TI = 1 if there is a tightening of trade policies, TI = 0 if there is no change of trade policies, and TI = -1if there is a liberalizing of trade polici R.
16
subsidy rates--would lead to a decline in trade tax revenues. Conversely, a liberalization would
raise revenues. These effects could be stronger or weaker depending on growth effects,
devaluations, QR coverage, and of course, the initial conditions and the relevant elasticity of
import and export demands.
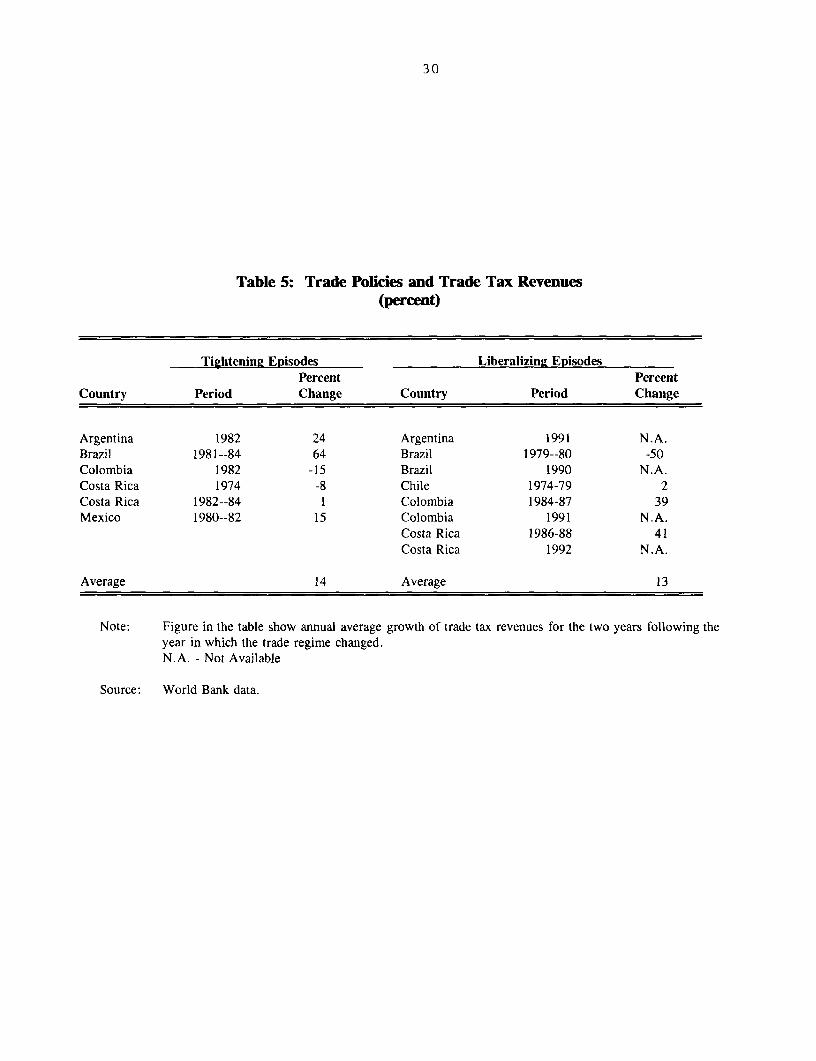
In practice, trade policy liberalizations were followed by reduced trade tax revenues in
some instances and increased revenues in others. Similarly, tightening trade policies raised trade
tax revenues in some instances and reduced them in others (table 5). The country experiences
suggest that both kinds of episodes may be followed by increases in trade tax revenues. Trade
liberalization might be expected to increase trade tax revenues for several reasons. First, as QRs
are reduced more is imported, even at lower tariffs and higher export subsidy rates, and trade
tax revenues could increase. Second, since devaluations usually accompany liberalizations the
valuation basis of exports and imports rises. This leads to higher trade tax revenues even at the
same tax and subsidy rates. Also, since most trade liberalizations take place with some balance
of payments support, the increase in imports especially designed to alleviate import starvation
situations also leads to increased trade tax revenues.
Since the trade tax responses reviewed in table 5 are for over an interval of only two years
following the trade policy episodes, they may in fact have a downward bias since export supply
responds more slowly to trade liberalizations than imports. Trade tax revenues are likely to go
up because of export growth over time.
In short, it is impossible to predict the extent, and indeed the direction of the change in
trade tax revenues resulting from trade policy changes and therefore, the impact of these
episodes on the fiscal balance. This is the main conclusion arising from the inquiry into the
relationship between trade policy episodes and the fiscal effects for these six countries.16 '
16/ See also Nogues and Gulati (1992) and Pritchett and Sethi (1994). In addition, when trade tax revenues wereregressed on trade policy episodes, th trade policy term turned out to be insignificant.
17
C. Effects on Imports and Outputs
Import restrictions are widely thought to increase domestic output by protecting import-
competing production and diverting domestic spending away from imports toward domestically
produced goods and services. This is the demand side effect of trade tightening and its
disadvantage in relation to devaluation is that it only fosters import-competing production, and
not exports. On the other hand, there is the supply-side import starvation effect that results in
decline in output in the wake of trade tightenings.
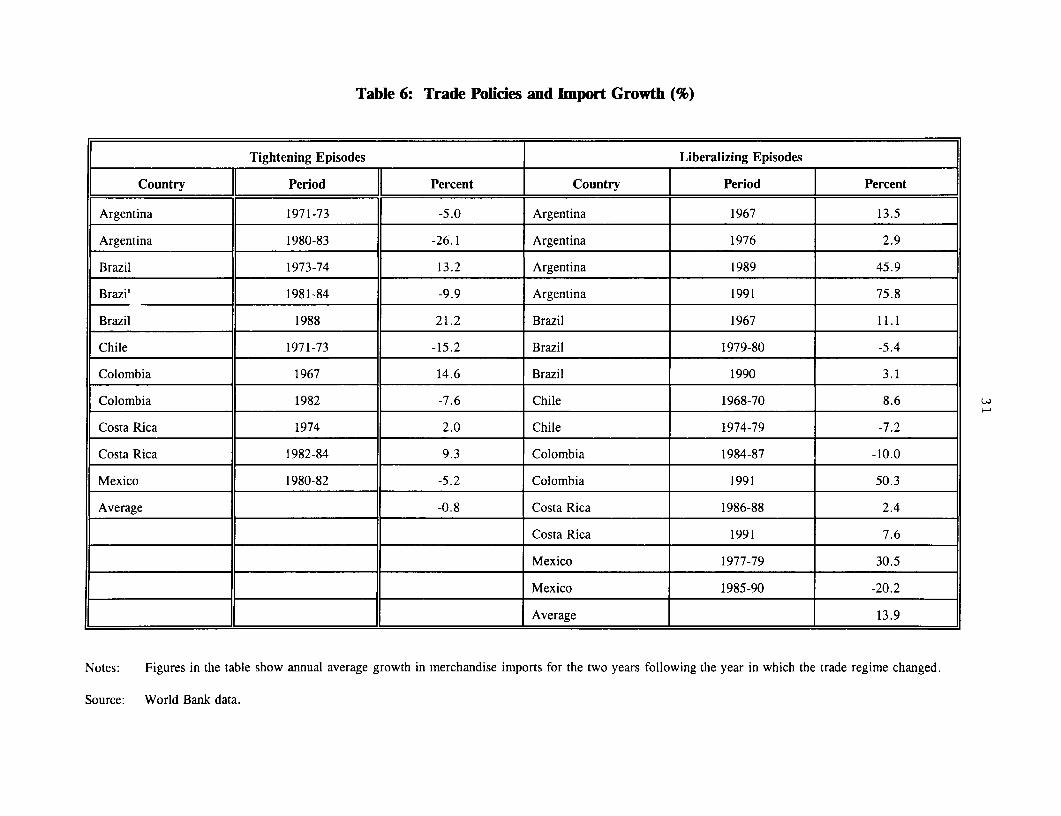
Of the eleven trade tightenings, import growth was negative within two years in six cases
(table 6). In the other five cases, a few fortuitous circumstances raised imports despite the
tightening. Thus, although Colombia tightened trade policies in 1967, imports increased in the
1967-69 period because of improved terms of trade. This was also the case of Brazil in 1988
in response to a rather mild trade tightening episode."-2
The import-starvation phenomenon arises from stringent import restrictions that are
associated with QR regimes. The QR regime robs the country of essential inputs and spare parts
to run factories or maintain crop yields. This obviously has an adverse effect on output.
Although direct evidence of import starvation is rare there is adequate anecdotal material to
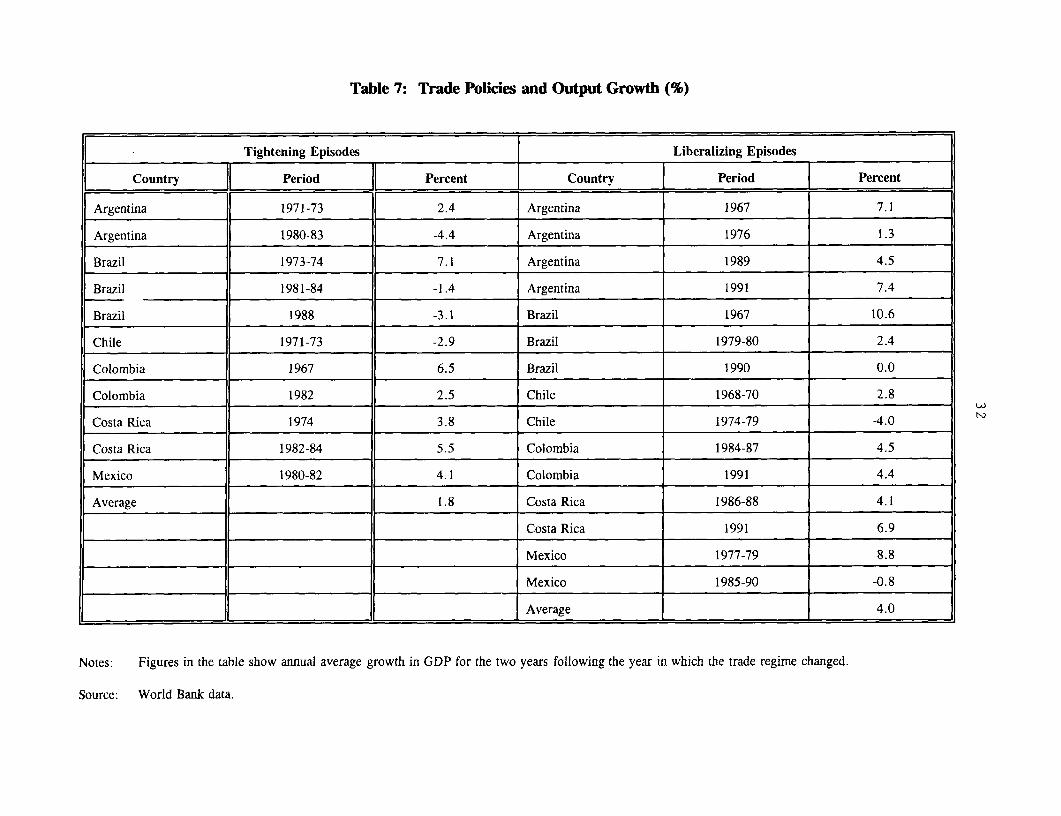
suggest that the phenomenon is real. The evidence presented in table 7 shows that output growth
was negative within two years for four of the eleven trade tightening episodes."-'
17/ In addition, when import growth was regressed on trade policy episode with a dummny variable of I for tradetightening and 0 for trade liberalization, the trade policy term turned out to be negative and significant. In otherwords, trade tightenings had a negative effect on import growth, while trade liberalizations had a positive effect.This is consistent with the notion that trade tightening is done by moving items from a free list to a QR list, so thattrade tightenings reduce imports directly.
18/ In addition, when output growth was regressed on trade policy episodes with a dummy variable of I for tradetightening and 0 for trade liberalization, the trade policy term turned out to be negative and significant. In otherwords, trade tightenings had a negative effect on output growth, while trade liberalizations had a positive effect.This evidence together with the evidence from imports(foot note # 17) implies that trade tightening reduces imports,and has an adverse effect on output gr' wth.
18
Of course, domestic output and imports could also decline simultaneously because of a
contraction of aggregate demand and in crises situations this has clearly been a factor. But in
many cases, output has declined because of tighter import restrictions rather than because of a
decline in the demand for output.
D. Effects on Manufactured Exports
The response of exports in general and manufactured exports in particular to trade policy
episodes is expected to be slower than the response of imports, since production for exports
takes time while imports respond almost immediately. Trade policy could influence manufactured
exports in at least two ways: (i) trade policies change the regime of incentives facing producers
and exporters and alter the profitability of tradables vis-a-vis non-tradables, for instance through
changes in real exchange rates;"' (ii) trade policies bring about changes in the availability of
imports that may be critical to the export production of manufactures.
In practice, this latter effect is likely to be more important than the former effect.
Therefore, the impact of trade tightenings on manufactured exports is likely to work through the
effect on imports and the role of imported inputs in export production. Policies of trade
tightenings usually do not influence exports directly. It is not often that trade tightening policies
restrain exports, unless it is in the form of withdrawal of some existing export incentives.
Additionally, analysis of trade policies in these six countries suggest that trade policy changes
in most cases were brought about by changes in the QR regime--specifically by adding or
removing items from the QR list. Also in some cases, trade policy tightenings have been
accompanied by raising export incentives.
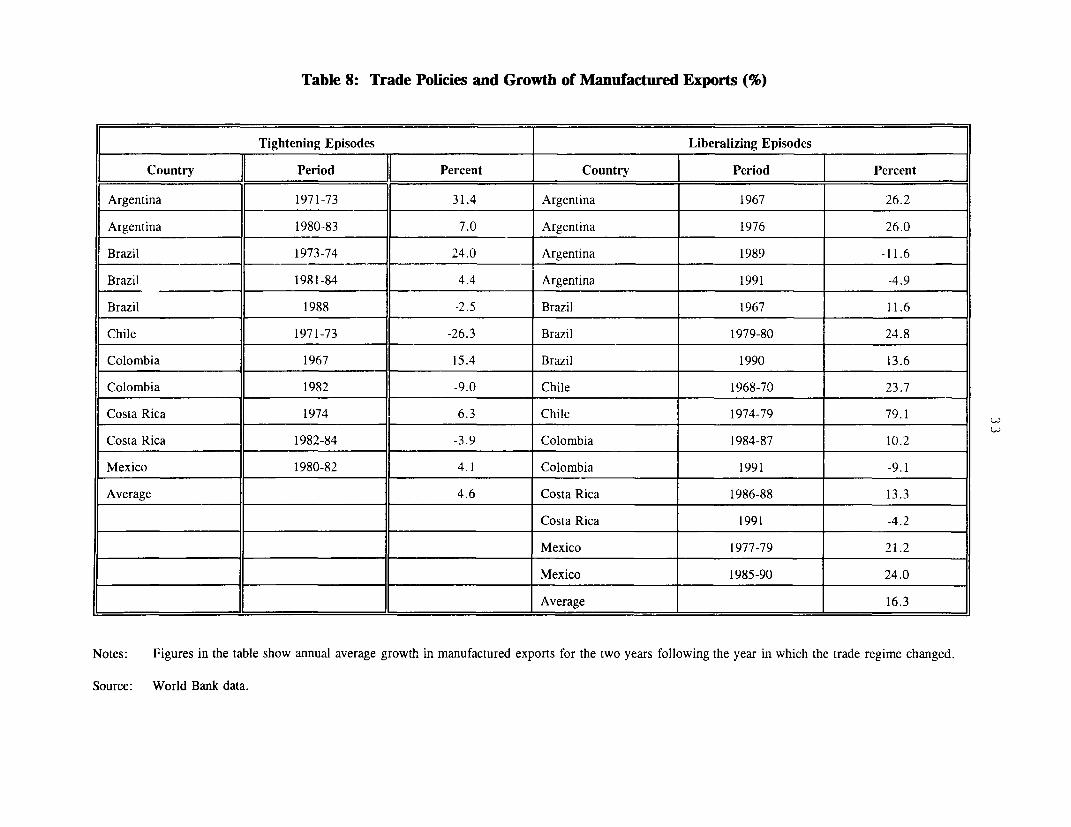
Of the total eleven trade tightening episodes, there were four instances where trade
tightenings led to declines in manufactured exports in the two years following changes in trade
policies (table 8). In the other eleven cases, manufactured exports increased following trade
19/ Equation 5 in fact shows that trad liberalizations are associated with devaluations.
19
tightenings. Of the fifteen trade liberalizing episodes, exports increased in eleven cases, and
declined in the other four cases. This evidence seems to suggest that overall, trade policy
changes have had a positive influence on manufactured exports.2 "'
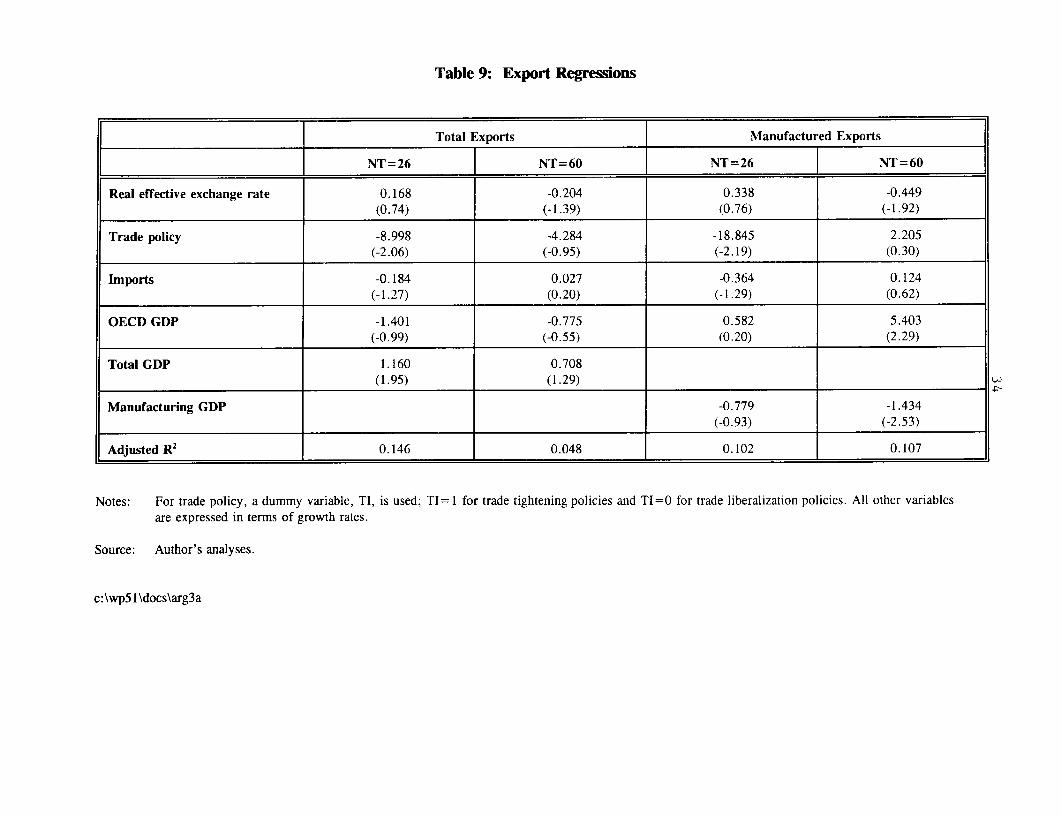
Regression results presented in table 9 suggest that trade tightenings do have a negative
impact upon both total and manufactured exports, though this evidence does not hold up when
the sample is expanded from 26 to 60 trade policy episodes by considering the duration of each
trade policy episode. The results also suggest that, manufactured exports respond positively to
trade liberalizations. One reason for this is that liberalizations are accompanied by devaluations
which improve the incentives for exports--including manufactures; the other factor is the greater
availability of imported inputs following liberalization that are usually more important for
manufactured exports compared to other exports.
Table 9 also presents the results of the regressions for total and manufactured exports
separately. Interestingly, the regression results are quite different for the two samples of 26 and
60 trade policy episodes. As noted before, trade tightenings have a negative impact on total
exports as well as manufactured exports in the case of the 26 trade policy episodes; they have
no effect when the sample size is expanded to 60 episodes. One way to explain the negative
relationship between trade tightenings and manufactured exports is to note that since trade
tightening is done primarily by way of moving items from a free list to a QR list, it starves the
industry of critical imported inputs needed for export production and hence have a negative
impact on exports. Therefore, this result can also be construed as providing indirect support for
the import starvation hypothesis presented elsewhere in the paper. More generally, the trade-
tightening episodes could be viewed as increasing the anti-export bias of the trade regimes in
these countries. Also, the influence of import growth on exports turns out to be negative in
these regressions. This negative role of imports implies that the imports have been primarily
20/ However, when growth in manufactured exports was regressed on trade policy episodes with a dummy variableof I for trade tightening and 0 for trade liberalization, the trade policy term turned out to be negative andsignificant. In other words, trade tightenings had a negative effect on manufactured exports, while tradeliberalizations had a positive effect.
20
used in the production of import-substitutes for the domestic market rather than exports. This
result is therefore consistent with the earlier evidence regarding the overall inward-orientation
of these economies. The proxy for external demand--OECD GDP--turns out to be insignificant
in these regressions. This implies that the constraints on exports were primarily due to supply
rather than demand factors. The proxy for domestic demand--GDP--is significant in the total
exports regression only; this effect is positive. This may simply reflect the fact, ceteris paribus,
exports and GDP tend to move in the same direction, given the GNP (national income) identity.
The other implication of this result could be that exports are not a residual activity in these
economies. If exports were indeed a residual activity, the effect of domestic demand on exports
would be negative, since higher domestic demand would induce firms to shift from exports to
the domestic market. 2ti Finally, the real effective exchange rate variable is not significant in
these regressions involving 26 trade policy episodes.
When the sample size is expanded from 26 to 60 trade policy episodes by considering the
duration of each policy episode, the results are somewhat different. Based on adjusted r2, while
there is a deterioration in the fit for total exports, there is a marginal improvement for
manufactured exports, when the sample size is expanded from 26 to 60. The trade policy
variable and the import growth variable now turn out to be insignificant. In other words, trade
policies have no effect on exports--total as well as manufactured--in the presence of other
variables like real exchange rate, imports, OECD GDP, and domestic (manufacturing) GDP.
This result with regard to trade policy in the expanded sample of 60 trade policy episodes also
implies that it is more meaningful to analyze the impact of trade policies by considering the
episodes as a continuous process rather than as discrete episodes. The real effective exchange
rate term is negative and significant for both total exports and manufactured exports. This is
consistent with the expectation that exchange rate devaluations boost exports. 22' While the
external demand term is insignificant in the case of total exports, it is positive and significant
21/ The implicit assumption here is that what is produced for domestic and export market are similar goods.
22/ This is also consistent with the results of equation 5 which shows that trade liberalizations are associated withdevaluations.
21
in the case of manufactured exports. This implies that demand factors do play a role in
determining manufactured exports from these countries. Finally, while the influence of domestic
demand is positive for total exports, it turns out to be negative for manufactured exports. The
negative role of domestic demand with regard to manufactured exports could be indicative of the
residual nature of exports in the case of manufactured goods. In other words, both supply and
demand factors are important ingredients of manufactured exports when the duration of each
policy episode is taken into account.
V. Conclusions
Changes in trade policy--especially in quantitative import restrictions--have played an
important role in the macroeconomic adjustment in all six countries. For long periods, trade
policy tightenings and occasional liberalizations were the main instruments of balance of
payments policy. Most tightenings were preceded by a deterioration in the current account.
In several cases tight import restrictions had adverse effects on output and, hence, on investment
and growth. Since changes in trade policies were usually part of a policy package, it is difficult
to isolate the effects of the episodes themselves. Sometimes they have been followed by current
account improvements and other times by deteriorations.
The six countries had various episodes of trade liberalization, particularly in the 1980s.
There have been five regime changes where generalized trade liberalization by a country brought
about a break with the past use of QRs for balance of payments purposes and trade became much
freer. The 1980s and early 1990s brought a new liberalization wherein balance of payments
problems triggered liberalization rather than tightening.
The tightening of trade restrictions alone will not suffice to improve the current account.
This is confirmed by the experience of the six countries. In the final analysis, an improvement
in the current account requires an increase in national savings or a fall in investment, or both,
22
and a tightening would not necessarily bring this about. Where tighter import restrictions shift
demand toward home-produced goods and output is initially demand-constrained, higher incomes
would indeed result and then savings would normally increase, at least in the short run. At the
same time, in an environment of import starvation, as was present in Argentina (1980-83) and
Chile (1971-73), incomes might fall as a result of tighter restrictions, and so savings might
actually decline. A fall in imports would then be more than matched by a decline in exports.
The case for tighter import restrictions or devaluation when the current account has to be
improved is that both measures divert demand away from imports toward home-produced goods
and increase the profitability of import-competing industries. In addition, devaluation increases
the profitability of exports. Thus, these policy instruments compensate for the reduction in
demand for home-produced goods resulting from the decline in real expenditures that is usually
necessary to bring about a current account improvement. They switch demand toward nontraded
goods and output toward traded goods. This simple generalization is subject to qualifications.
In particular, import restrictions may reduce the competitiveness of export industries when they
use imported or import-competing inputs. Leaving this aside, there is a case for switching
policies even though a reduction in real expenditures (absorption) is--in the absence of initial
excess capacity--the essential requirement for a current account improvement. Yet, the
fundamental question is whether to use import restrictions or devaluation as the switching device.
This choice raises issues discussed at length in the literature. Here the consensus appears to be
that import restrictions should be avoided, except perhaps temporary restrictions in extreme
situations. The current recourse to such measures by Argentina, Brazil, and Mexico should be
viewed in this perspective.
Three policy conclusions emerge from the analysis. The first is the confirmation of the
consensus view that import restrictions cannot solve current account problems, as seen from the
experience of the six countries. Import restrictions, even when they lead to a short term
improvement, cannot be relied upon to restore macroeconomic balance. The imbalance will not
go away but could be exacerbated when exports continue to be adversely effected and the
23
phenomenon of import starvation introduces additional costs to the economy arising from the
attempt to cure the original problem.
Second, trade liberalization requires real devaluation either at the same time or
beforehand. Real devaluation is brought about by nominal devaluation. The evidence for such
a connection between exchange rate policy and trade policy is clear. A flexible exchange rate
regime does not ensure that trade policy tightening will be avoided. This is apparent from the
policies of Argentina, Brazil, Chile, and Colombia in the first period (1965-73) and those of
Argentina in the third period (1980-83); but a fixed rate regime that rules out the possibility of
devaluation makes significant liberalization improbable or even impossible. If a country has
significant import restrictions over a range of goods (or high tariffs), and desires to liberalize
eventually, then the government must not make a fixed exchange rate commitment. The nominal
anchor argument can provide some justification for a fixed exchange rate policy, but given that
continued import restrictions are not desirable, such a policy should only be implemented--if at
all--after a large devaluation and the required liberalization have taken place as seen from the
cases of Argentina and Mexico.
Finally, with regard to manufactured exports, their growth helps to maintain trade reforms
and release the economy from foreign exchange constraints; also, manufactured exports respond
more to trade liberalizations than tightenings because liberalizations reduce the bias against
exports.
24
References
Alam, Asad and Sarath Rajapatirana. 1993. "Trade Policy Reforms in Latin America and theCaribbean During the 1980s" Latin America and the Caribbean Technical Dept., WorldBank, WPS 1104. Washington D.C.
Bhagwati, Jagdish. 1989. Anatomy and Consequences of Exchange Control RegimesCambridge, Mass.: Ballinger Pub. Co.
Corden, W. Max. 1990. Macroeconomic Adjustment in Developing Countries. In M. Scottand D. Lal (eds.) Public Policy and Economic Development: Essays in Honor of I. M.D. Little. Oxford: Clarendon Press.
Corden, W. Max. 1985. Inflation, Exchange Rates, and the World Economy: Lectures inInternational Monetary Economics. Oxford: Oxford University Press.
Dornbusch, Rudiger. 1980. Open Economy Macroeconomics. Oxford: Basil Blackwell.
Edwards, Sebastian. 1984. "The Order of Liberalization of the External Sector in DevelopingCountries." Princeton Essavs in International Finance, December (156):20-24.
Edwards, Sebastian. 1989. Real Exchange Rates, Devaluation and Adjustment: Exchange RatePolicy in Developing Countries. Cambridge, Mass.: MIT Press.
Edwards, Sebastian. 1991. Trade Orientation, Distortions and Growth, Cambridge, Mass.:Natural Bureau of Economic Research.
Johnson, H.G. 1958. Towards a General Theory of Balance of Payments. In H. G. Johnson.International Trade and Economic Growth. London: Allen and Unwin.
Krueger, Anne 0. 1978. Liberalization Attempts and Consequence. Cambridge, Mass.:Ballinger Pub. Co.
Little, I. M. D., Tibor Scitovsky, and Maurice Scott. 1970. Industry and Trade in someDeveloping Countries: A Comparative Study. New York: Oxford University Press.
Little, I. M. D., Richard Cooper, W. Max Corden, and Sarath Rajapatirana. 1993. Boom,Crisis, and Adjustment: The Macroeconomic Experience of Developing Countries. NewYork: Oxford University Press.
Meade, J. E. 1951. The Balance of Payments. London: Oxford University Press.
25
Nogues, Julio and Sunil Gulati. 1992. Economic Policies and Performance Under AlternativeTrade Regimes: Latin America During the 1980s. Latin America and the CaribbeanTechnical Dept., Report Number 10652, World Bank, Washington D.C.
Papageorgiou, Demetris, Armeane Choksi, and Michael Michaely. 1991. Liberalizing ForeignTrade in Developing Countries: The Lessons of Experience. Oxford: Basil Blackwell.
Pritchett, Lant and Geeta Sethi. 1994. Tariff rates, tariff revenue, and tariff reform: some newfacts. World Bank Economic Review 8: 1-16.
Table 1: Trade Policy Episodes by Analytical Periods and Exchange Rate Regimes
Note: a. Indicates trade regime change defined as the case where there was no recourse to trade policies for macroeconomic purposes following this change.
b. (+) indicates trade tightening and (-) indicates trade liberalization.
Source: Papageorgiou, Michaely, and Choksi (1991); Little. Cooper, Corden and Rajapatirana (1993); Alam and Rajapatirana (1993)
Table 2: Trade Policy Episodes, Trade Regime Changes and the Exchange Rate, 1965-92
Note: a. Mexico had devalued in 1976 just before the liberalization in 1977.b. Argentina and Mexico had devalued significantly just before the liberalization.
Source: World Bank, Papageorgiou, Michaely and Choksi (1991), (Table 1) References.
Table 3: Trade Policies and Ratio of Current Account Balance (CAB) to GDP (percent)
Tightening Episodes Liberalizing Episodes
. . ~~~~~~Average Average
(CAB/GDP) in (CAB/GDP) (CAB/GDP) in (CAB/GDP)
Country Period Year of Policy After Two Years Country Period Year of Policy After Two Years
Argentina 1971-73 -1.0 0.0 Argentina 1967 0.5 -0.5
Argentina 1980-83 -3.0 -2.0 Argentina 1976 1.0 2.5
Brazil 1973-74 -3.0 -6.5 Argentina 1989 -2.0 1.5
Brazi' 1981-84 -5.0 -4.5 Argentina 1991 0.0 -3.0
Brazil 1988 1.0 -0.5 Brazil 1967 -1.1 -1.4
Chile 1971-73 -2.0 -3.5 Brazil 1979-80 -5.0 -5.5
Colombia 1967 0.0 -3.4 Brazil 1990 -1.0 1.0
Colombia 1982 -8.0 -6.0 Chile 1968-70 -2.0 0.0
Costa Rica 1974 -16.0 -9.5 Chile 1974-79 -3.0 -3.0
Costa Rica 1982-84 -11.0 -8.5 Colombia 1984-87 -4.0 -2.0
Mexico 1980-82 -6.0 -5.5 Colombia 1991 6.0 -1.0
Average -4.9 -4.5 Costa Rica 1986-88 -4.0 -9.5
Costa Rica 1991 -7.0 -7.0
Mexico 1977-79 -1.0 -1.5
Mexico 1985-90 0.0 1.0
Average -1.5 -1.9
Notes: Figures in the table show the (CAB/GDP) ratio in the year of the trade regime change and the average (CAB/GDP) ratio two years after the
policy change.
Source: World Bank data.
Table 4: Current Account and Trade Policies: Panel Data Regressions
Real GDP TermsExchange Fiscal Growth of Trade Policy
Note: Figures in parentheses are t statistics. DF are the degrees of freedom.a. Indicates statistically significant at I percent level.b. Indicates statistically significant at 5 percent level.
Source: Author's analyses.
30
Table 5: Trade Policies and Trade Tax Revenues(percent)
Argentina 1982 24 Argentina 1991 N.A.Brazil 1981--84 64 Brazil 1979--80 -50Colombia 1982 -15 Brazil 1990 N.A.Costa Rica 1974 -8 Chile 1974-79 2Costa Rica 1982--84 1 Colombia 1984-87 39Mexico 1980-82 15 Colombia 1991 N.A.
Costa Rica 1986-88 41Costa Rica 1992 N.A.
Average 14 Average 13
Note: Figure in the table show annual average growth of trade tax revenues for the two years following theyear in which the trade regime changed.N.A. - Not Available
Source: World Bank data.
Table 6: Trade Policies and Import Growth (%)
Tightening Episodes | Liberalizing Episodes
Country Period Percent Country Period Percent
Argentina 1971-73 -5.0 Argentina 1967 13.5
Argentina 1980-83 -26.1 Argentina 1976 2.9
Brazil 1973-74 13.2 Argentina 1989 45.9
Brazil 1981-84 -9.9 Argentina 1991 75.8
Brazil 1988 21.2 Brazil 1967 11.1
Chile 1971-73 -15.2 Brazil 1979-80 -5.4
Colombia 1967 14.6 Brazil 1990 3.1
Colombia 1982 -7.6 Chile 1968-70 8.6
Costa Rica 1974 2.0 Chile 1974-79 -7.2
Costa Rica 1982-84 9.3 Colombia 1984-87 -10.0
Mexico 1980-82 -5.2 Colombia 1991 50.3
Average -0.8 Costa Rica 1986-88 2.4
Costa Rica 1991 7.6
Mexico 1977-79 30.5
Mexico 1985-90 -20.2
Average 13.9
Notes: Figures in the table show annual average growth in merchandise imports for the two years following the year in which the trade regime changed.
Source: World Bank data.
Table 7: Trade Policies and Output Growth (%)
Tightening Episodes Liberalizing Episodes
Country Period Percent Country Period Percent
Argentina 1971-73 2.4 Argentina 1967 7.1
Argentina 1980-83 -4.4 Argentina 1976 1.3
Brazil 1973-74 7.1 Argentina 1989 4.5
Brazil 1981-84 -1.4 Argentina 1991 7.4
Brazil 1988 -3.1 Brazil 1967 10.6
Chile 1971-73 -2.9 Brazil 1979-80 2.4
Colombia 1967 6.5 Brazil 1990 0.0
Colombia 1982 2.5 Chile 1968-70 2.8
Costa Rica 1974 3.8 Chile 1974-79 -4.0
Costa Rica 1982-84 5.5 Colombia 1984-87 4.5
Mexico 1980-82 4.1 Colombia 1991 4.4
Average 1.8 Costa Rica 1986-88 4.1
Costa Rica 1991 6.9
Mexico 1977-79 8.8
Mexico 1985-90 -0.8
Average 4.0
Notes: Figures in the table show annual average growth in GDP for the two years following the year in which the trade regime changed.
Source: World Bank data.
Table 8: Trade Policies and Growth of Manufactured Exports (%)
Tightening Episodes Liberalizing Episodes
Country Period Percent Country 1 Period | Percent
Argentina 1971-73 31.4 Argentina 1967 26.2
Argentina 1980-83 7.0 Argentina 1976 26.0
Brazil 1973-74 24.0 Argentina 1989 -11.6
Brazil 1981-84 4.4 Argentina 1991 -4.9
Brazil 1988 -2.5 Brazil 1967 11.6
Chile 1971-73 -26.3 Brazil 1979-80 24.8
Colombia 1967 15.4 Brazil 1990 13.6
Colombia 1982 -9.0 Chile 1968-70 23.7
Costa Rica 1974 6.3 Chile 1974-79 79.1
Costa Rica 1982-84 -3.9 Colombia 1984-87 10.2
Mexico 1980-82 4. Colombia 1991 -9.1
Average 4.6 Costa Rica 1986-88 13.3
Costa Rica 1991 -4.2
Mexico 1977-79 21.2
Mexico 1985-90 24.0
. ____________________ . _____________________ A verage 16.3
Notes: Figures in the table show annual average growth in manufactured exports for the two years following the year in which the trade regime changed.
OECD GDP -1.401 -0.775 0.582 5.403(-0.99) (-0.55) (0.20) (2.29)
Total GDP 1.160 0.708(1.95) (1.29) _
Manufacturing GDP -0.779 -1.434
(-0.93) (-2.53)
Adjusted R2 0.146 0.048 0.102 0.107
Notes: For trade policy, a dummy variable, TI, is used; TI= 1 for trade tightening policies and Tl=0 for trade liberalization policies. All other variablesare expressed in terms of growth rates.
Source: Author's analyses.
c:\wp5l\docs\arg3a
Policy Research Working Paper Series
ContactTitle Author Date for paper
WPS1478 Promoting Growth in Sri Lanka: Sadiq Ahmed June 1995 A. BhallaLessons from East Asia Priya Ranjan 82168
WPS1479 Is There a Commercial Case for Panayotis N. Varangis June 1995 J. JacobsonTropical Timber Certification? Rachel Crossley 33710
Carlos A. Primo Braga
WPS1480 Debt as a Control Device in Herbert L. Baer June 1995 G. EvansTransitional Economies: The Cheryl W. Gray 85783Experiences of Hungary and Poland
WPS1481 Corporate Control in Central Europe Peter Dittus June 1995 G. Evansand Russia: Should Banks Own Stephen Prowse 85783Shares?
WPS1482 A Measure of Stock Market Robert A. Korajczyk June 1995 P. Sintim-AboagyeIntegration for Developed and 38526Emerging Markets
WPS1483 Costa Rican Pension System: Asli Demirgu9-Kunt June 1995 P. Sintim-AboagyeOptions for Reform Anita Schwarz 38526
WPS1484 The Uruguay Round and South Asia: Nader Majd July 1995 J. NgaineAn Overview of the Impact and 37947Opportunities
WPS1485 Aggregate Agricultural Supply Maurice Schiff July 1995 J. NgaineResponse in Developing Countries: Claudio E. Montenegro 37947A Survey of Selected Issues
WPS1486 The Emerging Legal Framework for Pham van Thuyet July 1995 G. EvansPrivate Sector Development in 85783Viet Nam's Transitional Economy
WPS1487 Decomposing Social Indicators Using Benu Bidani July 1995 P. SaderDistributional Data Martin Ravallion 33902
WPS1488 Estimating the World at Work Deon Filmer July 1995 M. Geller31393
WPS1489 Educational Attainment in Developing Vinod Ahuja July 1995 M. GellerCountries: New Estimates and Deon Filmer 31393Projections Disaggregated by Gender
WPS1490 Trade Reform Design as a Signal to Eric Bond July 1995 A. EstacheForeign Investors: Lessons for Steve Chiu 81442Economies in Transition Antonio Estache
WPS1491 Equilibrium Incentives for Adopting Peter W. Kennedy August 1995 E. SchaperCleaner Technology Under Emissions Benoit Laplante 33457Pricing
Policy Research Working Paper Series
Contact
Title Author Date for paper
WPS1492 Trade Policies, Macroeconomic Sarath Rajapatirana August 1995 J. TroncosoAdjustment, and Manufactured 37826Exports: The Latin American Experience