25
Trade with China and skill upgrading: Evidence from Belgium Firm-Level Data G. Mion, H. Vandenbussche, L. Zhu
| Date post: | 30-Dec-2015 |
| Category: |
Documents |
| Upload: | kristin-mccarthy |
| View: | 214 times |
| Download: | 0 times |

Trade with China and skill upgrading: Evidence from Belgium Firm-Level Data
G. Mion, H. Vandenbussche, L. Zhu

Outline
• Motivation• Stylized facts• Research questions• Literature• Data• Results: Trade and employment change Trade and skill upgrading Trade and firm death• Conclusions

Motivation
• The possibility that trade with low-wage countries may reduce the demand for unskilled workers in developed countries has raised concern both in the public and in the acdecmic. Yet the results in the literature are still inconclusive
• The special characteristics of Chinese exports are noticed by many economicsts (e.g., Schott, 2008), but almost nothing is known about whether Chinese exports also have special effects on firms and workers in developed countries
• Most of the research only used industry-level data. We use both industry- and firm-level trade data to study their impacts on firm-level skill upgrading and employment change

Stylized facts: (1) Declining manufacturing employment
600
700
800
900
1000
1100
Em
ploy
me
nt
1970 1980 1990 2000 2010Year
Source: EU-KLEMS
Number of employees of Belgian manufacturing 1970-2005

Stylized facts: (2) Increasing share of non-production workers

Stylized facts: (3) More skilled labour force in manufacturing
.16
.18
.2.2
2.2
4S
hare
of s
kille
d w
orke
rs in
full
time
ente
rs/q
uite
rs
1996 1998 2000 2002 2004 2006Year
Source: calculated from BEL-FIRST; the upper line represents enters
Skill share of full time enters/quiters for Belgian manufacturing 1997-2006

Stylized facts: (4) Rising manufacturing imports from China and other low-wage countries
.01
.02
.03
.04
.05
Imp
ort p
enet
ratio
n
1994 1996 1998 2000 2002 2004Year
Note: The upper line is import penetration of China; mlanufacturing except sector 23
Import penetration of China and other low wage countries: Belgium 1995-2004

Research questions
• Are those employment declining and skill upgrading in Belgian manufacturing (partly) driven by increased imports from China and other low-wage countries?
• What are the different effects of industry-level import competition and firm-level outsourcing on firm outcomes?
• Dose Chinese imports affect firms differently from imports from other low-wage countries?

Literature: (1) Trade and employment
• Bernard et al. (2006), Biscourp&Kramarz(2007), Gorg et al.(2008), Helpman et al. (2008), Revenga (1992) etc.
• Most works found a negative effect of imports on employment
• While distinction between imports from low-wage and non-low-wage countries is made by a few papers, the distinction between imports from China and other low-wage countries are almost never made
• Biscourp and Kramarz (2007) is the paper that is closest to ours in terms of the firm-level trade data used, but their paper is more of a descriptive one

Literature: (2)Trade and skill upgrading
• Berman et al. (1994), Wood(1994), Feenstra&Hanson(1999), Bernard & Jensen(1997), Biscourp&Kramarz(2007), Schott (2007), Falvay(2008) etc.
• Most works found trade and technology to be both responsible for skill upgrading, but technology-based explanation is more favoured
• Monfort et al.(2008): China entering WTO and skill upgrading in
Belgian textiles

Literature: (3)Chinese exports
• Schott (2008) showed that China’s export similarity with OECD countries is higher than that of other non-OECD countries and this similarity is growing much faster than any other countries.
• This finding highlights that firms in developed countries are much likely to face competition from Chinese exports rather than that from other low-wage countries' exports, since the later have much less similarity with their productions.

Our contributions
• Both industry- and firm-level trade data are used. Skill upgrading is also measured at firm-level, so we can focus on within firm skill upgrading
• The first time in the literature to instrument firm-level outsourcing
• We find Chinese imports to be much more important than other low-wage countries imports
• More recent data: 1996-2006
• Education as measure for skill

Data: sources
• Firm-level data: Balance Sheet Data from National Bank of Belgium
• Industry-level : ComExt Intra- and Extra-European Trade data by
Eurostat • Instrumental variables:
-Exchange rate: IFS database from IMF
-Ad valorem tariff: TARIC database from EU Commission

Data: main variables
• Trade: -Industry-levl import share
-Firm-level outsourcing of finished goods
-Firm-level outsourcing of intermediate goods (similarly defined)
• Firm characteristics:
-Size (log empl.)
-Average wage (wage bill/empl.)
-Labor productivity(value added/empl.)
-Capital intensity (tfa/empl.)
-Intangible capital intensity (itfa/empl.)

Import penetation. 1995 Import penetration 2004Employment change Different measures of skill upgrading: 97-01 vs.
02-07
Nace Industry China All LW China All LW 95-01 01-04 Measure1 Measur2 Measure3
15 Food 0.002 0.007 0.004 0.015 0 -0.011 0.095 -0.012 0.082
16 Tobacco 0.000 0.000 0.000 0.000 0 -0.33 2.327 0.331 1.824
17 Textile 0.027 0.114 0.084 0.191 -0.13 -0.146 0.347 0.219 0.300
18 Apparel 0.045 0.083 0.384 0.627 -0.42 -0.182 0.224 -0.331 0.153
19 Leather product&footwear 0.168 0.197 -145 -239.6 -0.5 0 1.128 0.349 0.844
20 Wood products 0.007 0.010 0.033 0.043 0.07 -0.067 1.152 0.036 0.962
21 Paper 0.000 0.000 0.005 0.005 0 -0.062 0.312 0.068 0.259
22 Publishing 0.001 0.001 0.005 0.005 0 -0.111 0.255 0.003 0.162
24 Chemical 0.009 0.012 0.019 0.024 0.028 -0.041 0.129 0.063 0.073
25 Rubber&plastic 0.009 0.009 0.050 0.054 0.125 -0.037 0.453 0.071 0.358
26 Non-metallic mineral 0.004 0.005 0.023 0.033 -0.028 -0.086 -0.036 -0.054 -0.031
27 Basic metal 0.005 0.014 0.007 0.050 -0.217 -0.028 0.084 0.010 0.067
28 Fabricated metal 0.006 0.007 0.022 0.024 0.08 0 1.249 0.266 1.044
29 Machinery&equipment 0.008 0.009 0.066 0.069 0.023 -0.09 0.163 0.219 0.125
30Office
machinery&computers
0.062 0.062 0.660 0.661 0 0-0.483 -0.237 -0.294
31 Electrical machinery 0.019 0.020 0.089 0.096 -0.033 -0.21 0.160 0.120 0.121
32 Radio, TV&Comm. Equip. 0.049 0.049 0.134 0.137 0.056 -0.316 0.222 0.203 0.100
33 Medical&optical instr. 0.038 0.039 0.062 0.066 0 0 0.110 0.032 0.072
34 Motor vehicles 0.000 0.000 0.001 0.002 0 -0.13 -0.035 -0.037 -0.031
35 Other transp. Equip. 0.006 0.009 0.037 0.041 0.22 -0.18 0.543 0.476 0.380
36 Furniture 0.085 0.269 0.327 0.642 -0.094 -0.138 0.476 0.133 0.410
Table 1: Import penetration, employment change and skill upgrading in Belgium manufacturing industries
Measure1=skilled_enters/unskilled_enters; Measure2=(skilled_enters/skilled_quiters)/(unskilled_enters/unskilled_quiters); measure3=skilled_enters/total_enters

Trade and employment change (BJS, 2006)
• Econometric model:
=firm characteristics: size, labor productivity, capital intensity, intangible capital
intensity and average wage
=industry-level import share of different country groups
=firm-level outsourcing to different country groups (finished and intermediate)
=time fixed effects
=firm fixed effects
t
i
jtT
itT
itV
: 1 ' ' 'lnit
t ti jt it t i itemp c V T T

Table 2: trade and employment

Trade and skill upgrading• The model:
• is the share of skilled workers in total employment, which is unobservable in our data set, but
• Where skill is the number of skilled workers in the total employment and
is the net inflow (i.e., inflow minus outflow) of skilled workers between year 0 and year t. The only thing that is unobservable in our data is , which is the initial number of skilled workers in firm i. We used the initial number of non-production workers as a proxy for it.
' ' '
itit jt it t i itS c V T T
0:0 _ _ t
it i iit
it it it
skill skill skill net flowS
empl empl empl
itS
0iskill
0:_ _ tiskill net flow

Table 3: trade and share of production workers

Table 4: trade and skilled workers
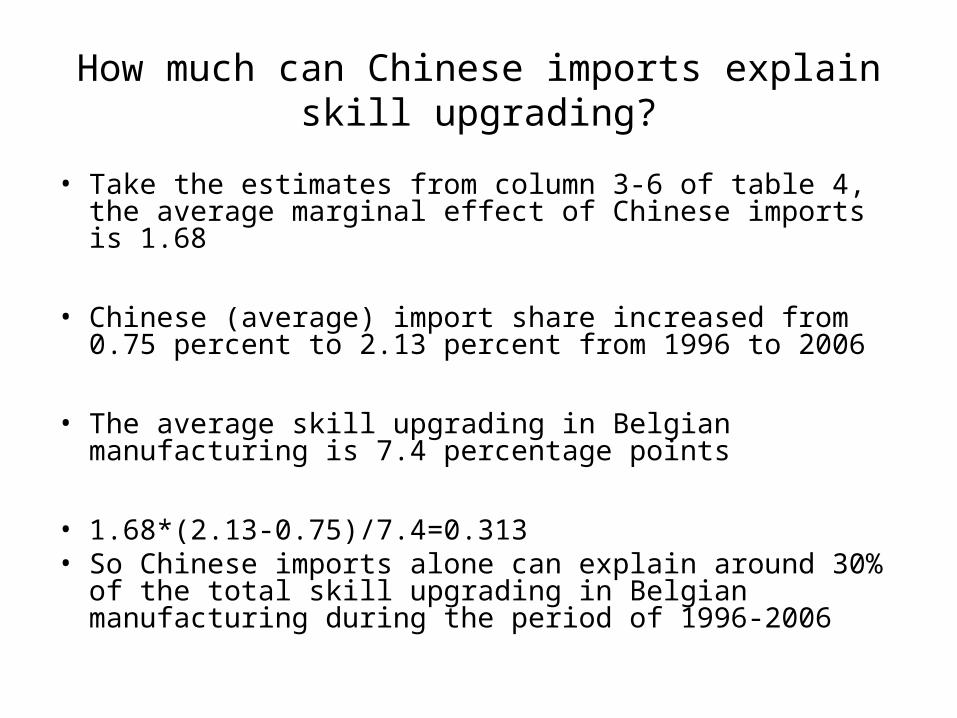
How much can Chinese imports explain skill upgrading?
• Take the estimates from column 3-6 of table 4, the average marginal effect of Chinese imports is 1.68
• Chinese (average) import share increased from 0.75 percent to 2.13 percent from 1996 to 2006
• The average skill upgrading in Belgian manufacturing is 7.4 percentage points
• 1.68*(2.13-0.75)/7.4=0.313• So Chinese imports alone can explain around 30% of the
total skill upgrading in Belgian manufacturing during the period of 1996-2006

Trade and firm death
• We estimate a linear probability model:
• Whear Death is a dummy variable denoting firm death. We defined a firm as dead if it disappears from the data set in the next year or for the next two years.
' ' '
itit jt it t i itDeath c V T T

Table 5: Trade and firm death (1)

Table 6: Trade and firm death (2)

Conclusions• We find that trade with low-wage countries is important in explaining within
firm employment structure change in Belgian manufacturing, with imports from China playing a much more important role than that from other low-wage countries.
• Firm-level outsourcing to China will lead firms to upgrade their occupational composition of employment, although it will not affect the level of employment significantly.
• Import competition from low-wage countries only has weak impact on firm death
• Overall, the results of this paper are consistent with the 'moving up the quality ladder' story of Schott (2008), which said that manufacturing firms in developed countries can manage to survive by specializing in producing high quality goods.


