274
2015 Traffic Collision Statistics Report Published: September 19, 2016

2015Traffi c Collision Statistics Report
Published: September 19, 2016


Executive Summary


iii
2015 Traffic Collision Statistics Report – Executive Summary Motor vehicle collisions resulting in a fatality, injury or property damage only are required by law to be reported to either a law enforcement agency and/or to Manitoba Public Insurance. Subsequently, a Traffic Accident Report (TAR) for the collision is created. The Traffic Collision Statistics Report deals with these reportable collisions and the TARs arising from them. The Traffic Collision Statistics Report is the official report of traffic collision statistics in Manitoba. It reports the details surrounding traffic collisions in Manitoba, allowing users to analyze the reasons why collisions occur. Knowing more about collisions helps policy makers, traffic safety experts, public safety programmers and legislators to pinpoint areas for review and create targeted approaches to preventing and reducing traffic collisions. Due to amendments to the Highway Traffic Act that took effect in 2011, this report uses two sources for Traffic Accident Reports (TARs); TARs completed by a law enforcement agency and TARs completed when a collision claim is registered with Manitoba Public Insurance. When comparing 2015 to the five year average from 2010 to 2014, there will be an increase in collision counts that is partially a result of this change to two reporting sources. This change resulted in an increase in minimal injury and property damage only (PDO) collisions in the Traffic Accident Report Database that had previously been underreported. The following is a presentation of the key highlights of this report for 2015. Licensed Drivers and Vehicle Registrations There are 881,338 licensed drivers in Manitoba in 2015, an increase of 1% compared to 2014. Overall, there are 1,052,376 vehicles registered in Manitoba (commercial and non-commercial, combined) in 2015, a 2% increase from 2014. Traffic Collisions In 2015, there are a total of 41,548 traffic collisions reported to Manitoba Public Insurance and law enforcement agencies in Manitoba that conform to the reportable collision requirement for Traffic Accident Reports. Of these:
69 involve a fatality (0.2% of all collisions);
9,127 involve an injury, but not a fatality (22% of all collisions); and,
32,352 involve property damage only (78% of all collisions). Overall traffic collisions in Manitoba in 2015 increased compared to 2014 and to the previous five year (2010 to 2014) annual average. There are 41,548 collisions in 2015, up from 40,672 collisions in 2014 and from 36,587 on average in the five year period 2010 to 2014. The increase in the total number of collisions in 2015 compared to 2014 is attributable to increases in collisions by all severity types. There are 5 more fatal collisions, 104 more injury collisions, and 767 more PDO collisions reported in 2015 than in 2014 (representing proportional changes of 8%, 1%, and 2%, respectively). People Killed and Injured in Collisions In 2015, there are 12,017 victims (or casualties) of traffic collisions. Of these:
78 are killed (fewer than the average in the previous five years, 89);
415 are seriously injured (more than the average in the previous five years, 320);
1,947 sustain minor injuries (fewer than the average in the previous five years, 2,282);
9,014 sustain minimal injuries (more than the average in the previous five years, 6,606); and,
563 sustain injuries that are undefined in terms of severity (more than the average in the previous five years, 503).

Executive Summary
iv
The victim involvement rate (per 100,000 people in the general population) in traffic collisions in 2015 (910.1) has increased by 2% compared to 2014 (893.8) and by 18% compared to the previous five years (2010 to 2014) annual average (769.4). Victim involvement rates in traffic collisions in 2015 where the person:
Is killed (5.9 in 2015) is nearly 14% higher than in 2014, but 16% lower than in the previous five years; and,
Is injured, including all levels of severity (but excluding killed; 904.2 in 2015), is 2% higher than in 2014 and 19% higher than in the previous five years.
Traffic collisions in urban locations account for the majority of casualties overall while rural locations account for the majority of people killed and seriously injured. In 2015, 86% of all casualties result from traffic collisions in urban areas. Traffic collisions in rural locations, however, account for 72% of people killed and 44% of people seriously injured. In the previous five year (2010 to 2014) annual average, 83% of all victims are from traffic collisions in urban locations, while 67% of people killed and 48% of people seriously injured are from traffic collisions in rural locations. Victims in 2015 appear to follow a fairly typical distribution compared to past years in terms of month of occurrence. The winter months (January, February, and December) stand out as the months accounting for a disproportionate number of traffic collision victims overall, both in 2015 (32% of all victims) and in the previous five year (2010 to 2014) annual average (31%). In 2015 (and very similar to the previous five years), the count of victims is lowest in the late spring and summer months (ranging from 6% to 7% of all victims in each month from March to August) and is highest in late fall, winter and early spring (ranging from 9% to 11% of all victims in each month from October to February). Considering people killed and seriously injured in Manitoba traffic collisions in 2015:
Drivers account for the largest proportion of people killed (63%) and seriously injured (62%);
Passengers account for 17% of people killed and 25% of people seriously injured;
Pedestrians account for nearly 12% of people killed and 4% of people seriously injured;
Bicyclists account for 1% of people killed and 1% of people seriously injured; and,
Motorcyclists (including mopeds riders) account for 8% of people killed and 7% of people seriously injured.
In 2015, most vehicle occupant victims (including drivers, passengers and motorcyclists/moped riders) were using safety equipment at the time of the collision (99% of all victims where use is known). However, 29% of the people killed and 7% of the people seriously injured in traffic collisions are recorded as not wearing or using the available safety equipment at the time of the collision. In 2015, 98% of driver and passenger victims were using the available safety equipment (seatbelts and child safety seats) and were not ejected from the vehicle. However, 80% of people ejected and killed were not using the available safety equipment at the time of the collision. Drivers and Vehicles Involved in Collisions In 2015, there are 59,716 drivers involved in traffic collisions. Of these:
103 are involved in fatal collisions;
16,088 are involved in injury collisions; and,
43,525 are involved in PDO collisions. The driver involvement rate (per 10,000 licensed drivers) in traffic collisions in 2015 is 677.6, a decrease of 4% compared to the rate in 2014 (705.1), but an increase of 2% from the previous five year (2010 to 2014) annual average (663.0). In 2015, driver involvement in:
Fatal collisions (1.2) increased by 13% from 2014, but decreased by 12% compared to the previous five years;
Injury collisions (182.5) decreased by 2% from 2014, but increased by 16% compared to the previous five years; and,
PDO collisions (493.9) decreased by 5% from 2014, and by 2% compared to the previous five years.

Executive Summary
v
Young drivers have a much higher rate of involvement in traffic collisions than older drivers. In 2015, drivers aged 16 to 24 years old have an involvement rate (per 10,000 licensed drivers) in traffic collisions of 1,009.4. This is:
1.2 times that of drivers aged 25 to 34 (rate of 826.0);
1.4 times that of drivers aged 35 to 44 (rate of 736.8);
1.5 times that of drivers aged 45 to 54 (rate of 652.7);
1.9 times that of drivers aged 55 to 64 (rate of 519.3); and,
More than two-and-a-half times that of drivers aged 65 and older (rate of 381.3). The reader should note that neither the count of drivers involved in collisions nor the calculated rate of involvement takes into account exposure to risk in terms of hours of driving, kilometres driven or driving situations. In 2015, there are 61,711 vehicles involved in traffic collisions. Of these:
106 are involved in fatal collisions;
16,184 are involved in injury collisions; and,
45,421 are involved in PDO collisions. Vehicle involvement in traffic collisions per 10,000 registered vehicles (vehicle involvement rate) has decreased in 2015 compared to 2014, but has increased relative to the previous five year (2010 to 2014) annual average. The vehicle involvement rate in collisions in 2015 for:
Total collisions is 700.2 – decreased by nearly 3% from 2014, but increased by 3% from the previous five years;
Fatal collisions is 1.2 – increased by 10% from 2014, but decreased by 14% from the previous five years;
Injury collisions is 183.6 – decreased by 2% from 2014, but increased by 15% from the previous five years; and,
PDO collisions is 515.4 – decreased by 3% from 2014, and decreased by 1% from the previous five years.
Contributing Factors to Collisions In 2015, 69% of all collisions have some at-fault contributing factor recorded (87% of fatal collisions; 75% of injury collisions). In 2015:
A driver action is a contributing factor in 62% of all collisions (81% of fatal collisions; 72% of injury collisions; 59% of PDO collisions);
A human condition is a contributing factor in 1% of all collisions (25% of fatal collisions; nearly 2% of injury collisions; less than 1% of PDO collisions); and,
Environmental conditions are contributing factors in 10% of all collisions (nearly 15% of fatal collisions; 6% of injury collisions; 11% of PDO collisions).
The most prevalent contributing factors recorded for collisions in 2015 include:
Distracted driving – 23% of all collisions (36% fatal; 25% injury; 22% PDO);
“Following too closely” – 17% of all collisions (3% fatal; 28% injury; 14% PDO);
Speed – 7% of all collisions (19% fatal; 8% injury; 7% PDO);
“Backing unsafely” – 7% of all collisions (none fatal; 2% injury; 9% PDO);
“Turning improperly” – 6% of all collisions (6% fatal; 8% injury; nearly 6% PDO);
“Fail to yield right-of-way” – nearly 6% of all collisions (12% fatal; 9% injury; 5% PDO);
“Changing lanes improperly” –5% of all collisions (none fatal; 4% injury; 5% PDO);
The actions of a wild animal – 5% of all collisions (1% fatal; 1% injury; nearly 6% PDO);
“Lost control/Drive off the road” – 4% of all collisions (13% fatal; 4% injury; 4% PDO); and,
“Slippery road surface” – 3% of all collisions (6% fatal; 3% injury; 3% PDO).

Executive Summary
vi
The most prevalent contributing factors recorded for collisions where people are killed or seriously injured in 2015 include:
Distracted driving – 36% of people killed and 32% of people seriously injured;
Speed –17% of people killed and nearly 15% of people seriously injured;
“Lost control/Drive off the road” – 13% of people killed and 13% of people seriously injured;
“Turning improperly” – 5% of people killed and 11% of people seriously injured;
“Fail to yield right-of-way” – nearly 12% of people killed and 10% of people seriously injured;
Impaired – nearly 21% of people killed and 6% of people seriously injured;
“Following too closely” – 3% of the people killed and 8% of people seriously injured;
“Leave stop sign before safe to do so” – 6% of people killed and nearly 7% of people seriously injured;
“Disobey traffic control” – 8% of people killed and 6% of people seriously injured; and,
“Slippery road surface” – 5% of the people killed and 6% of people seriously injured. Off-Road Vehicle (ORV) Collisions In 2015, there are 269 off-road vehicle collisions, involving 67 victims, 303 vehicles and 300 drivers. Of the total off-road vehicle collisions:
7 are fatal collisions;
53 are injury collisions; and,
209 are PDO collisions. Alcohol-related Criminal Code Convictions In 2014
1, there are a total of 3,017 alcohol-related Criminal Code offence convictions, including:
1,845 convictions for driving with a blood alcohol concentration (BAC) over .08;
1,026 convictions for impaired driving; and,
146 convictions for refusing to provide a breath or blood sample. In the 20-year period from 1995 to 2014, total alcohol-related Criminal Code convictions declined by 5%, from 3,175 in 1995 to 3,017 in 2014. Total convictions in 2014 (3,017 convictions) increased by 57% (1,095 more convictions) compared to 2013 (1,922 convictions) and was up as well by 48% compared to the previous five year (2009 to 2013) annual average (2,037 convictions). Over the past twenty years, alcohol-related Criminal Code convictions have declined by 5% in Manitoba. Comparing the total number of convictions in 2014 to 1995 among drivers:
Under 16 years of age, convictions increased by a count of 9
16 to 24 years of age, convictions declined by 15%;
25 to 44 years of age, convictions declined by 12%;
45 to 64 years of age, convictions increased by 41%; and,
65 years of age and older, convictions increased by 21%. Licensed drivers up to the age of 44 are overrepresented in alcohol-related Criminal Code convictions.
Drivers under age 25 represented 14% of the licensed drivers in 2014, but accounted for 26% of convictions.
Drivers aged 25 to 44 represented 34% of the licensed drivers in 2014, but accounted for 51% of convictions.
Over the past 10 years, from 2004 to 2014, there was a notable 36% increase in the rate of first offences. Rates of recidivism, indicated by second, and third and subsequent offences, increased at a marginal rate of 12% in second alcohol-related Criminal Code offences in 2014. In comparison, there was a 34% reduction in third and subsequent offences in 2014 compared to 2004.
1 There is a one-year lag in the statistics reported to allow for court processing time. Therefore, 2014 is the most current year for which these statistics are available.

vii
Preface Motor vehicle collisions resulting in a fatality, injury or property damage are required by law to be reported to either a law enforcement agency and/or to Manitoba Public Insurance. Subsequently, a Traffic Accident Report (TAR) for the collision is created. The Traffic Collision Statistics Report deals with these reportable collisions and the TARs arising from them. The Traffic Collision Statistics Report is the official report of traffic collision statistics in Manitoba. It reports the details surrounding traffic collisions in Manitoba, allowing users to analyze the reasons why collisions occur. Knowing more about collisions helps policy makers, traffic safety experts, public safety programmers and legislators to pinpoint areas for review and create targeted approaches to preventing and reducing traffic collisions. Annual collision statistics, such as those contained in the Traffic Collision Statistics Report, are used to:
Indicate trends;
Identify driver and vehicle factors in accidents;
Evaluate current programs and new provincial road safety initiatives;
Monitor commercial vehicle collisions in accordance with the National Safety Code; and,
Guide development of new policies and programs to reduce the frequency and severity of traffic collisions in the province.
A brief Synopsis of each section of this Report can be found below. Section 1 – Drivers, Vehicle and Collision Rates: Historical Trends This section calculates involvement rates for total collisions as well as for fatal, injury, and property damage only (PDO) collisions using licensed drivers and vehicles registered for the years 2005 to 2015, inclusive. This section also deals with relative involvement rates of drivers by specific age groups. Section 2 – Licensed Drivers This section deals with Active and Suspended Drivers by specific Age Groups, Gender and Manitoba Licence Class. Section 3 – Vehicle Registrations This section deals with vehicle registrations and examines these by three major categories: Commercial; Non-commercial; and, Snowmobiles (Recreational). Section 4 – Traffic Collisions This section counts the number of collisions in Manitoba and provides detail for collisions of different severity; fatal, injury and property damage only (PDO). Historical information regarding the number of collisions, victims, vehicles and drivers involved in collisions over the ten year period 2005 to 2014 is presented and compared to 2015. Details are provided for 2014 traffic collisions in terms of the month of occurrence, day of the week, time of day, weather and road conditions, location and type of collision. Section 5 – Collision Victims This section counts the number of victims killed and injured in traffic collisions and examines the severity of the injury received by the victim. Month, time and day of occurrences are examined, as well as the age of the victim. Victim involvement rates in traffic collisions per 100,000 people in the general population are also calculated. Section 6 – Pedestrian Victims This section counts the number of pedestrian victims killed and injured in traffic collisions and examines the severity of the injury received by the pedestrian victim. Month, time and day of occurrence are examined and breaks are provided for the age of the pedestrian. The specific pedestrian actions taken immediately prior to the collision are also presented. Pedestrian involvement rates in traffic collisions per 100,000 people in the general population are also calculated.

Preface
viii
Section 7 – Vehicle Involvement This section counts the number of vehicles involved in traffic collisions. Vehicle involvement in a collision is calculated for each vehicle type (such as passenger vehicles, vans, pick-up trucks, types of emergency vehicles). Vehicle involvement rates in traffic collisions per 10,000 registered vehicles are also calculated. Section 8 – Driver Involvement This section counts the number of drivers involved in traffic collisions and breaks this down by age and gender of the driver. Driver involvement rates in traffic collisions per 10,000 licensed drivers are also detailed. Section 9 – Contributing Factors This section examines the contributing factors to traffic collisions as reported on the Traffic Accident Report (TAR). Detail is provided at the collision level and for collision severity, at the victim level and for victims of each casualty type, and at the driver level by collision severity. Driver involvement rates (per 10,000 licensed drivers) in collisions with specific contributing factors are calculated and discussed. Section 10 – National Safety Code Monitoring Report This section counts the number of commercial vehicles involved in collisions, the severity of those collisions and the victims killed and injured in those collisions. Section 11 – Off-Road Vehicle Collisions This section counts the number of off-road vehicle (ORV) collisions in Manitoba and provides detail for collisions of different severity: fatal, injury and property damage only (PDO). Information regarding the number of ORV collisions, victims, vehicles, and drivers involved over the four year period 2012 to 2015 is presented. Details are provided for 2015 ORV collisions in terms of the month of occurrence, day of the week, time of day, weather and road conditions, location, and type of collision. Section 12 – Alcohol-Related Criminal Code Convictions This section counts the number of drivers convicted of alcohol-related Criminal Code offences for the year 2014 by age at the time of the offence and includes historical statistics for the period 1995 to 2013. Details are provided for ‘first’, ‘second’ and ‘third and subsequent’ (i.e., third, fourth, fifth, etc. combined) offences and whether or not a youth was present in the vehicle at the time of the offence.

ix
Table of Contents Executive Summary ....................................................................................................................................... i
Preface ......................................................................................................................................................... vii
Table of Contents ......................................................................................................................................... ix
SECTION 1 – Drivers, Vehicle and Collision Rates: Historical Trends ........................................................ 1
Introduction ............................................................................................................................................... 3
Table 1-1 Fatal, Injury and Property Damage Collisions by Total Licensed Drivers ................................ 5
Table 1-2 Percentage Change Year-over-Year in Involvement (per 10,000 Licensed Drivers) in Fatal, Injury, and Property Damage Only Collisions ........................................................................................... 6
Table 1-3 Fatal, Injury and Property Damage Collisions by Vehicles Registered .................................... 7
Figure 1-1 Involvement in Total Collisions by Licensed Drivers and Vehicles Registered ....................... 8
Figure 1-2 Involvement in Fatal Collisions by Licensed Drivers and Vehicles Registered ....................... 8
Figure 1-3 Involvement in Injury Collisions by Licensed Drivers and Vehicles Registered ...................... 9
Figure 1-4 Involvement in Property Damage Only (PDO) Collisions by Licensed Drivers and Vehicles Registered ................................................................................................................................................. 9
Table 1-4 Involvement (Total Collisions) per 10,000 Licensed Drivers by Age Group ........................... 10
Figure 1-5 Involvement (per 10,000 Licensed Drivers) in Total Collisions by Age Group...................... 11
SECTION 2 – Licensed Drivers .................................................................................................................. 13
Introduction ............................................................................................................................................. 15
Chart 2-1 Class Licence System Quick Reference Chart ...................................................................... 16
Table 2-1 Class 1-5 Licensed Drivers by Year and Driver Status .......................................................... 17
Table 2-2 Class 1-5 Licensed Drivers by Age Group, Gender and Driver Status .................................. 18
Table 2-3 Class 1-5 Licensed Drivers by License Class, Driver Status and Gender ............................. 19
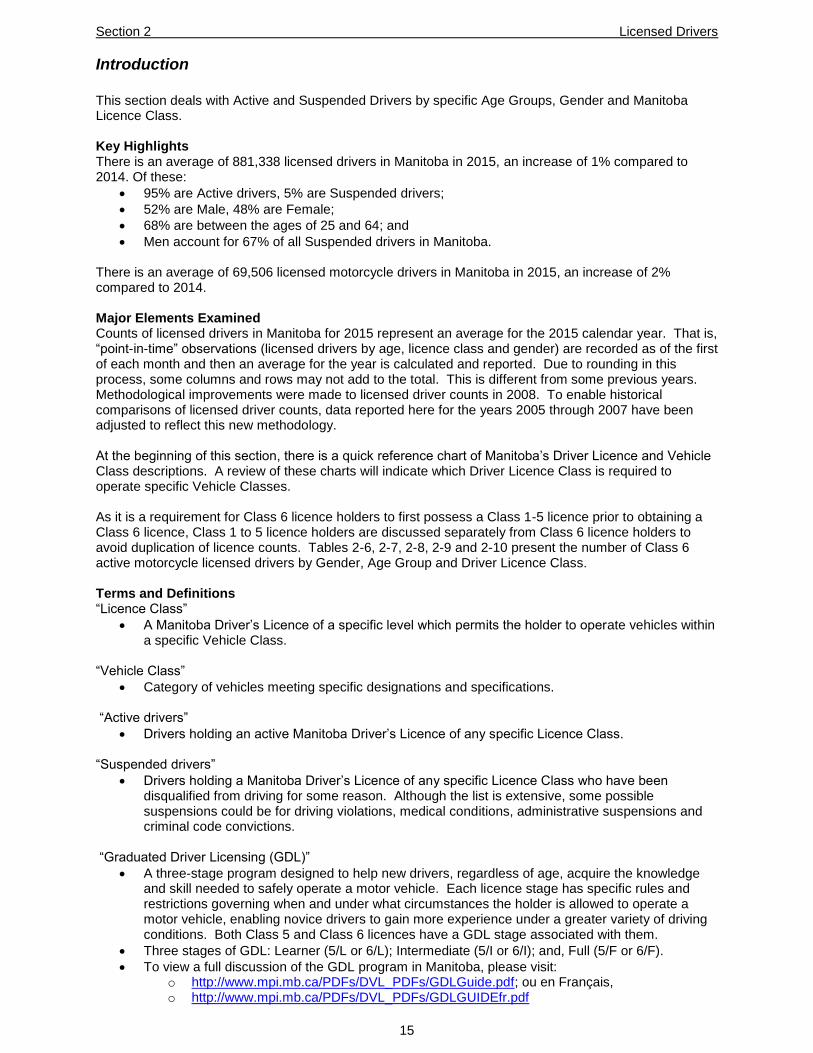
Table 2-4 Class 1-5 Male Drivers by Age Group, Driver Status and License Class .............................. 20
Table 2-5 Class 1-5 Female Drivers by Age Group, Driver Status and License Class .......................... 21
Table 2-6 Total Class 6 Active Licensed Drivers by Year ...................................................................... 22
Table 2-7 Class 6 Active Licensed Drivers by Age Group, Gender and Driver Status .......................... 23
Table 2-8 Class 6 Active Licensed Drivers by License Class, Driver Status and Gender ..................... 24
Table 2-9 Active Class 6 Male Drivers by Age Group and License Class ............................................. 25
Table 2-10 Active Class 6 Female Drivers by Age Group and License Class ....................................... 25
SECTION 3 – Vehicle Registrations ........................................................................................................... 27
Introduction ............................................................................................................................................. 29
Table 3-1 Non Commercial Vehicle Class .............................................................................................. 30
Table 3-2 Commercial Vehicle Class ..................................................................................................... 30
Table 3-3 Vehicle Registration Summary ............................................................................................... 31

x
SECTION 4 – Traffic Collisions ................................................................................................................... 33
Introduction ............................................................................................................................................. 35
Table 4-1 Historical Summary of Traffic Collisions ................................................................................. 37
Figure 4-1 Historical Summary – Count of Traffic Collisions, Victims, Vehicles and Drivers ................. 38
Table 4-2 Traffic Collisions by Month of Occurrence and Collision Severity .......................................... 39
Figure 4-2 Traffic Collisions by Month of Occurrence and Collision Severity ........................................ 40
Table 4-3 Traffic Collisions by Day of Occurrence and Collision Severity ............................................. 41
Figure 4-3 Traffic Collisions by Day of Occurrence and Collision Severity ............................................ 42
Table 4-4 Traffic Collisions by Time of Occurrence and Collision Severity ............................................ 43
Figure 4-4 Traffic Collisions by Time of Occurrence and Collision Severity .......................................... 44
Table 4-5 Traffic Collisions by Provincial Location and Collision Severity ............................................. 45
Table 4-6 Collision Type by Urban/Rural Location ................................................................................. 47
Table 4-7 Traffic Collisions by Road Surface Condition and Collision Severity ..................................... 49
Figure 4-5 Traffic Collisions by Road Surface Condition and Collision Severity .................................... 50
Table 4-8 Traffic Collisions by Weather Condition and Collision Severity ............................................. 51
Figure 4-6 Traffic Collisions by Weather Condition and Collision Severity ............................................ 52
Table 4-9 Accident Configuration and Collision Severity ....................................................................... 53
Figure 4-7 Distribution of Collisions by Accident Configuration and Collision Severity .......................... 54
SECTION 5 – Collision Victims ................................................................................................................... 55
Introduction ............................................................................................................................................. 57
Table 5-1 Historical Summary of Victims in Traffic Collisions ................................................................ 59
Table 5-2 Historical Summary of Victim Involvement Rate (per 100,000 People) in Traffic Collisions .. 61
Figure 5-1 Historical Summary of Victim Involvement Rate in Traffic Collisions .................................... 62
Table 5-3 Collision Victims by Month of Occurrence and Casualty Type............................................... 63
Table 5-3a Collision Victims by Month of Occurrence and Casualty Type for Previous Five Years ...... 64
Figure 5-2 Proportion of People Killed and Injured by Month of Occurrence ......................................... 65
Table 5-4 Collision Victims by Day of Occurrence and Casualty Type .................................................. 66
Table 5-4a Collision Victims by Day of Occurrence and Casualty Type for Previous Five Years ......... 67
Figure 5-3 Proportion of People Killed and Injured by Day of Occurrence ............................................ 67
Table 5-5 Collision Victims by Time of Occurrence and Casualty Type................................................. 68
Table 5-5a Collision Victims by Time of Occurrence and Casualty Type for Previous Five Years ........ 69
Figure 5-4 Proportion of People Killed and Injured by Time of Occurrence ........................................... 70
Table 5-6 Collision Victims by Gender and Casualty Type .................................................................... 71
Table 5-6a Collision Victims by Gender and Casualty Type for Previous Five Years ............................ 71
Figure 5-5 Proportion of People Killed and Injured by Gender and Casualty Type ............................... 72
Table 5-7 Collision Victims by Age Group and Casualty Type ............................................................... 73
Table 5-7a Collision Victims by Age Group and Casualty Type for Previous Five Years ...................... 74
Figure 5-6 Proportion of People Killed and Injured by Age Group and Casualty Type .......................... 75
Table 5-8 Collision Victims by Age Group, Casualty Type, and Gender ................................................ 76
Table 5-8a Collision Victims by Age Group, Casualty Type, and Gender for Previous Five Years ....... 77
Table 5-9 Victim Involvement Rate (per 100,000 people) by Gender and Age Group and Casualty Type ................................................................................................................................................................ 78

xi
Table 5-10 Collision Victims by Road User Class and Age Group ......................................................... 80
Table 5-10a Victims by Road User Class and Age Group and Casualty Type for Previous Five Years 83
Figure 5-7 Proportion of People Killed and Injured by Road User Class ............................................... 85
Table 5-11 Collision Victims by Collision Type and Casualty Type ........................................................ 86
Table 5-11a Collision Victims by Collision Type and Casualty Type for Previous Five Years ............... 87
Table 5-12 Collision Victims by Accident Configuration and Casualty Type .......................................... 88
Table 5-12a Collision Victims by Accident Configuration and Casualty Type for Previous Five Years . 89
Table 5-13 Collision Victims by Provincial Location and Casualty Type ................................................ 90
Table 5-13a Collision Victims by Provincial Location and Casualty Type for Previous Five Years ....... 91
Table 5-14 Collision Victims by Safety Equipment Use and Casualty Type .......................................... 92
Table 5-14a Collision Victims by Safety Equipment Use and Casualty Type for Previous Five Years .. 93
Table 5-15 Safety Equipment Effectiveness ........................................................................................... 94
Figure 5-8 Safety Equipment Effectiveness: Ratio of “Not Using Equipment” to “Using Equipment” .... 94
Table 5-16 Vehicle Occupant Victim Ejections in Traffic Collision ......................................................... 95
Table 5-16a Vehicle Occupant Victim Ejections in Traffic Collision for Previous Five Years................. 96
SECTION 6 – Pedestrian Victims ............................................................................................................... 97
Introduction ............................................................................................................................................. 99
Table 6-1 Historical Summary of Pedestrians Killed and Injured in Traffic Collisions .......................... 101
Table 6-2 Historical Summary of Pedestrian Involvement Rate (per 100,000 people) in Traffic Collisions ............................................................................................................................................... 103
Figure 6-1 Pedestrian Involvement Rate (per 100,000 People) in Traffic Collisions ............................ 104
Table 6-3 Pedestrians Killed and Injured by Month of Occurrence and Casualty Type ....................... 105
Table 6-3a Pedestrians Killed and Injured by Month of Occurrence and Casualty Type for Previous Five Years ............................................................................................................................................. 106
Figure 6-2 Proportion of Pedestrians Killed and Injured by Month of Occurrence ............................... 106
Table 6-4 Total Pedestrians Killed and Injured by Day of Occurrence and Casualty Type ................. 107
Table 6-4a Pedestrians Killed and Injured by Day of Occurrence and Casualty Type for Previous Five Years ..................................................................................................................................................... 108
Figure 6-3 Proportion of Pedestrians Killed and Injured by Day of Occurrence ................................... 108
Table 6-5 Total Pedestrians Killed and Injured by Time of Occurrence and Casualty Type ................ 109
Table 6-5a Pedestrian Victims by Time of Occurrence and Casualty Type for the Previous Five Years .............................................................................................................................................................. 110
Figure 6-4 Proportion of Pedestrians Killed and Injured by Time of Occurrence ................................. 110
Table 6-6 Total Pedestrians Killed and Injured by Age Group and Casualty Type .............................. 111
Table 6-6a Pedestrians Killed and Injured by Age and Casualty Type for Previous Five Years ......... 112
Figure 6-5 Proportion of Pedestrians Killed and Injured by Age Group ............................................... 113
Table 6-7 Pedestrian Involvement Rate (per 100,000 People) in Traffic Collisions by Age Group ..... 114
Table 6-8 Pedestrian Action and Casualty Type .................................................................................. 115
Table 6-8a Pedestrian Action and Casualty Type for the Previous Five Years ................................... 116

xii
SECTION 7 – Vehicle Involvement ........................................................................................................... 117
Introduction ........................................................................................................................................... 119
Table 7-1 Historical Summary of Vehicles Involved in Traffic Collisions .............................................. 121
Table 7-2 Historical Summary of Vehicle Involvement Rate (per 10,000 Registered Vehicles) in Traffic Collisions ............................................................................................................................................... 122
Figure 7-1 Vehicle Involvement Rate (per 10,000 Registered Vehicles) in Fatal, Injury and PDO Collisions ............................................................................................................................................... 123
Table 7-3 Vehicle Types (as defined in TAR) Involved in Traffic Collisions and Collision Severity ..... 124
Table 7-4 Combined Select Vehicle Categories Involved in Traffic Collisions by Collision Severity ... 125
Table 7-5 Vehicle Involvement (per 10,000 Registered Vehicles) in Traffic Collision by Combined Vehicle Types and Collision Severity ................................................................................................... 125
SECTION 8 – Driver Involvement ............................................................................................................. 127
Introduction ........................................................................................................................................... 129
Table 8-1 Historical Summary of Drivers Involved in Traffic Collisions ................................................ 131
Table 8-2 Historical Summary of Driver Involvement Rate (per 10,000 Licensed Drivers) in Traffic Collisions ............................................................................................................................................... 132
Figure 8-1 Driver Involvement Rate (per 10,000 Licensed Drivers) in Traffic Collisions by Severity ... 133
Table 8-3 Drivers Involved in Traffic Collisions by Age Group and Collision Severity ......................... 134
Figure 8-2 Proportion of Traffic Collisions by Driver Age and Collision Severity ................................. 135
Table 8-4 Driver Involvement Rate (per 10,000 Licensed Drivers) in Traffic Collisions by Age Group and Collision Severity ........................................................................................................................... 136
Table 8-5 Drivers Involved in Traffic Collisions by Gender and Age Group and Collision Severity ..... 137
Figure 8-3 Proportion of Drivers Involved in Traffic Collisions by Gender and Collision Severity ........ 138
Table 8-6 Drivers Involved in Traffic Collisions by Age Group and Gender and Collision Severity ..... 139
Table 8-7 Driver Involvement Rate (per 10,000 Licensed Drivers) in Traffic Collisions by Gender and Age Group and Collision Severity ......................................................................................................... 140
SECTION 9 – Contributing Factors ........................................................................................................... 141
Introduction ........................................................................................................................................... 143
Table 9-1 Contributing Factors to a Collision by Collision Severity ...................................................... 147
Table 9-1a Contributing Factors to a Collision by Collision Severity for Previous Five Years ............. 150
Table 9-2 Contributing Factors for Victims of a Collision by Casualty Type ........................................ 153
Table 9-2a Contributing Factors for Victims of a Collision by Casualty Type for Previous Five Years 156
Table 9-3 Drivers Involved in Traffic Collisions by Contributing Factor and Collision Severity ............ 159
Table 9-3a Drivers Involved in Traffic Collisions by Contributing Factor and Collision Severity for Previous Five Years .............................................................................................................................. 162
Figure 9-1 Select Contributing Factors for Drivers Involved in Collisions by Collision Severity ........... 165
Table 9-4 Involvement Rate (per 10,000 Licensed Drivers) in Collisions by Contributing Factors and Collisions Severity ................................................................................................................................ 166
Table 9-5 Driver Involvement Rate (per 10,000 Licensed Drivers) in Collisions by Contributing Factors and Age ................................................................................................................................................. 170
Table 9-5a Driver Involvement Rate (per 10,000 Licensed Drivers) in Collisions by Contributing Factors and Age for Previous Five Years .......................................................................................................... 172
Table 9-6 Historical Summary of Contributing Factors to a Collision Overall ...................................... 175
Table 9-7 Historical Summary of Contributing Factors Recorded for Victims of Collisions.................. 178

xiii
Table 9-8 Historical Summary of Contributing Factors Recorded for Drivers Involved in Collisions ... 181
Table 9-9 Summary of ‘Speed’, ‘Distracted driving’ and ‘Impaired’ as Contributing Factors ............... 184
SECTION 10 - National Safety Code Monitoring Report .......................................................................... 185
Introduction ........................................................................................................................................... 187
Table 10-1 NSC Commercial Vehicles Involved in Traffic Collisions by Vehicle Type and Collision Severity ................................................................................................................................................. 190
Figure 10-1 Proportion of NSC Commercial Vehicles by Vehicle Type and Collision Severity ........... 191
Table 10-2 Traffic Collision Victims by NSC Commercial Vehicle Type and Casualty Type ............... 192
Table 10-2a Traffic Collision Victims by NSC Commercial Vehicle Type and Casualty Type for Previous Five Years ............................................................................................................................................. 193
Figure 10-2 Proportion of Victims Involved in Collisions with NSC Commercial Vehicles by Vehicle Type and Casualty Type ....................................................................................................................... 194
Table 10-3 Commercial Vehicle Involvement in Traffic Collisions by Pre-Collision Activity and Collision Severity ................................................................................................................................................. 195
Table 10-4 NSC Commercial Vehicles Involved in Traffic Collisions by Contributing Factors and Collision Severity .................................................................................................................................. 197
Table 10-4a NSC Commercial Vehicles Involved in Traffic Collisions by Contributing Factors and Collision Severity for the Previous Five Years ...................................................................................... 200
Figure 10-3 Select At-fault Contributing Factors for Commercial Vehicles and Drivers by Collision Severity ................................................................................................................................................. 202
Table 10-5 Historical Summary of NSC Commercial Vehicles Involved in Traffic Collisions by Vehicle Type ...................................................................................................................................................... 203
Table 10-6 Historical Summary of Traffic Collision Victims by NSC Commercial Vehicle Type .......... 204
SECTION 11 – Off-Road Vehicle Collisions ............................................................................................. 205
Introduction ........................................................................................................................................... 207
Table 11-1 Historical Summary of Off-Road Vehicle Collisions ........................................................... 210
Figure 11-1 Historical Summary of ORV Collisions .............................................................................. 211
Table 11-2 Victims, Vehicles and Drivers Involved in Off-Road Vehicle Collisions by ORV Type ....... 212
Figure 11-2 Proportion of ORV Collisions by Victims, Vehicle Type and Drivers ................................ 213
Table 11-3 Off-Road Vehicle Collisions by Month of Occurrence and Collision Severity .................... 214
Table 11-4 Off-Road Vehicle Collisions by Day of Occurrence and Collision Severity ........................ 215
Figure 11-3 Proportion of ORV Collisions by Collision Severity and Day of Occurrence ..................... 215
Table 11-5 Off-Road Vehicle Collisions by Time of Occurrence and Collision Severity ...................... 216
Figure 11-4 Proportion of Total ORV Collisions by Collision Severity and Time of Occurrence .......... 217
Table 11-6 Off-Road Vehicle Collisions by Light Condition and Collision Severity .............................. 218
Table 11-7 ORV Collisions by Weather Condition and Collision Severity ............................................ 218
Table 11-8 ORV Collisions by MIT Regions and Collision Severity ..................................................... 220
Figure 11-5 Proportion of ORV Collisions by Collision Severity and MIT Regions .............................. 220
Table 11-9 Off-Road Vehicle Collisions by Location and Collision Severity ........................................ 221
Table 11-10 ORV Collision Victims by Age Group and Casualty Type ................................................ 222
Table 11-11 ORV Collision Victims by Gender and Casualty Type ..................................................... 223
Table 11-12 ORV Collision Victims by Safety Equipment Use and Casualty Type ............................. 223
Table 11-13 ORV Victims Killed vs. Injured for Helmeted and Non-helmeted ORV Occupants .......... 224
Table 11-14 Drivers Involved in ORV Collisions by Age Group and Collision Severity ....................... 224

xiv
Table 11-15 ORV Collisions by Contributing Factors and Collision Severity ....................................... 225
Table 11-16 Historical Summary of ORV Collisions by Month of Occurrence ..................................... 229
Table 11-17 Historical Summary of ORV Collisions by Location ......................................................... 230
Table 11-18 Historical Summary of ORV Collision Victims by Age Group ........................................... 231
Table 11-19 Historical Summary of ORV Collisions by Contributing Factors ...................................... 232
SECTION 12 - Alcohol-Related Criminal Code Convictions ..................................................................... 235
Introduction ........................................................................................................................................... 237
Table 12-1: Total Alcohol-Related Criminal Code Convictions ............................................................ 240
Table 12-2: Total Alcohol-Related Criminal Code Convictions by Age Group ..................................... 242
Figure 12-1: Percentage Change in Alcohol-Related Criminal Code Convictions by Age Group ........ 243
Table 12-3: Total Alcohol-Related Criminal Code Offences by Age Group and Conviction Type ....... 244
Table 12-4: Alcohol-Related Criminal Code Convictions by Active Licensed Drivers and Age Group 245
Table 12-5: Driver Involvement in “First”, “Second”, and “Third and Subsequent” Alcohol-Related Criminal Code Convictions by Age Group ............................................................................................ 246
GLOSSARY – Terms & Definitions ........................................................................................................... 249
Terms and Definitions ........................................................................................................................... 251
SECTION 1 – Drivers, Vehicle and Collision
Rates: Historical Trends


Section 1 Historical Trends
3
Introduction
This section calculates involvement rates for total collisions as well as for fatal, injury and property damage only (PDO) collisions using licensed drivers and vehicles registered for the years 2005 to 2015. This section also presents involvement rates for drivers by specific age groups. Key Highlights In 2015, there are a total of 41,548 traffic collisions reported to Manitoba Public Insurance and law enforcement agencies in Manitoba that conform to the reportable collision requirement for Traffic Accident Reports. Of these:
69 involve a fatality (0.2% of all collisions);
9,127 involve an injury, but not a fatality (22% of all collisions); and,
32,352 involve property damage only (78% of all collisions). In 2015, overall traffic collisions in Manitoba increased compared to 2014 and compared to the previous five year (2010 to 2014) annual average. There are:
41,548 collisions in 2015;
40,672 collisions in 2014; and,
36,587 collisions on average in the five year period 2010 to 2014. Involvement in traffic collisions in Manitoba increased from 2014 and from the previous five year (2010 to 2014) annual average. Involvement in collisions (per 10,000 licensed drivers) is:
471.4 in 2015;
467.9 in 2014; and,
437.3 on average in the five year period 2010 to 2014. The increase in the total number of collisions in 2015 compared to 2014 is attributable to increases in collisions by all severity types. There are 5 more fatal collisions, 104 more injury collisions, and 767 more PDO collisions reported in 2015 than in 2014 (representing proportional changes of 8%, 1%, and 2%, respectively). Major Elements Examined Counts of collisions in Manitoba for 2015 and previous years are taken from Traffic Accident Reports (TARs) generated by Manitoba Public Insurance and law enforcement agencies, and compiled by Manitoba Public Insurance. These counts are presented for all reportable collisions, fatal collisions, injury collisions, and property damage only (PDO) collisions. To be included in the Traffic Accident Database, these reportable collisions must occur on a public roadway. Involvement in collisions is calculated for total collisions and for collisions of different severity (fatal, injury and PDO). It is calculated both for licensed drivers and for vehicles registered. Involvement per 10,000 licensed drivers by different age groups is also examined. Due to the small numbers of fatal collisions, fluctuations year-over-year could be dramatic; a small change in the total count of these types of collisions could have a significant effect on statistics such as percentage change to previous years and involvement rates. Therefore, the reader is strongly cautioned when interpreting results regarding fatal collisions.

Section 1 Historical Trends
4
Terms and Definitions “Reportable Collision”
Prior to a change in the Highway Traffic Act (which took effect in October of 2011), motor vehicle collisions resulting in a fatality, injury or property damage in excess of $1,000 were required by law to be reported to a law enforcement agency. Subsequently, the law enforcement agency completed a Traffic Accident Report for the collision.
Amendments to the Highway Traffic Act (which received Royal Ascent in June 2011 and took effect in October of 2011) changed the definition of a reportable collision to require a police report be made if the driver is aware, has reason to believe, or is later made aware, that a collision involves: a fatality; an injury requiring admittance to hospital for observation or treatment; another driver not having a valid driver’s licence; another vehicle not validly registered; the driver of another vehicle not providing the required particulars; the driver of another vehicle not stopping at the scene of the accident; or, alcohol or another intoxicating substance as a factor in the accident.
As of October 2011, all accidents occurring on a public roadway where the above conditions are not met are reported through the claim registration process with Manitoba Public Insurance.
As of 2012 and consistent with other jurisdictions in Canada, it is a requirement that a minimum of $2,000 damage (all vehicles combined) is necessary for property damage only (PDO) collisions to be included in this report.
This report deals with these reportable collisions and the TARs arising from them, regardless of whether the TAR is generated by law enforcement agencies or by Manitoba Public Insurance.
“Public Roadway”
A public roadway in Manitoba is considered to be any provincial road (PR), provincial trunk highway (PTH) or municipal road, including the entrances to and exits from these roadways. This excludes all off-road areas, parking lots, private property and First Nation Reserve roads (unless the road is a PR or PTH running through, across or on Reserve lands).
“Fatal Collision”
A motor vehicle collision in which at least one person is killed as a result of the collision. The death must have occurred within thirty days of the collision occurrence. Fatal collisions resulting from suicide, where the fatality occurs because of a medical condition and collisions that do not occur on public roadways are excluded.
“Injury Collision”
A motor vehicle collision in which at least one person has been recorded as sustaining some level of personal injury, but in which no one is fatally injured or killed. Levels of injury include: ‘major’ (admitted to hospital); ‘minor’ (treated and released from hospital); and, ‘minimal’ (no hospital treatment required).
“Property Damage Only (PDO) Collision”
A motor vehicle collision in which no injury or fatality is sustained and only property damage is the result.
“Involvement”
A calculation of the number of collisions per specific unit of licensed drivers or registered vehicles. For the purposes of this report, involvement is calculated per 10,000 licensed drivers or registered vehicles.
“Licensed drivers”
A count of all Manitobans aged 16 and older who hold a valid licence within the licensing year including active and suspended drivers. (See Section 2 Licensed Drivers for more information)

Section 1 Historical Trends
5
Table 1-1 Fatal, Injury and Property Damage Collisions by Total Licensed Drivers
Table 1-1
Fatal, Injury, and Property Damage Collisions by Total Licensed Drivers: 2005 to 2015
Year Licensed Drivers
Total Collisions
Collisions /10,000 Drivers
Total Fatal
Fatal /10,000 Drivers
Total Injury
Injury /10,000 Drivers
Total PDO PDO
/10,000 Drivers
2005 716,169 33,164 463.1 88 1.2 6,482 90.5 26,594 371.3
2006 724,330 31,738 438.2 104 1.4 6,503 89.8 25,131 347.0
2007 752,398 29,494 392.0 96 1.3 6,415 85.3 22,983 305.5
2008 765,014 27,092 354.1 85 1.1 5,974 78.1 21,033 274.9
2009 776,209 26,578 342.4 83 1.1 5,396 69.5 21,099 271.8
2010 790,330 27,172 343.8 78 1.0 5,386 68.1 21,708 274.7
2011 813,691 34,302 421.6 94 1.2 6,309 77.5 27,899 342.9
2012 838,481 38,972 464.8 89 1.1 8,280 98.8 30,603 365.0
2013 855,791 41,819 488.7 69 0.8 8,729 102.0 33,021 385.9
2014 869,239 40,672 467.9 64 0.7 9,023 103.8 31,585 363.4
2015 881,338 41,548 471.4 69 0.8 9,127 103.6 32,352 367.1
2010-2014 Average 833,506 36,587 437.3 79 0.9 7,545 90.0 28,963 346.3
Relative to ten years ago, the total number of collisions in 2015 has increased by 25% (41,548 in 2015 compared to 33,164 in 2005). However, crash involvement per 10,000 licensed drivers has increased by only 2% in the same time period (471.4 in 2015 compared to 463.1 in 2005). Compared to 2014, total collisions have increased by 2% (up from a total of 40,672) and involvement has increased by 1%. Compared to the previous five year (2010 to 2014) annual average, total collisions have increased 14% and involvement has increased by 8%. Compared to recent historical figures, in 2015:
Fatal collisions have decreased by 22% compared to 2005, increased by 8% compared to 2014, and decreased by 12% compared to the previous five year (2010 to 2014) annual average.
Injury collisions have increased by 41% compared to 2005, by 1% compared to 2014 and by 21% compared to the previous five year (2010 to 2014) annual average.
PDO collisions have increased by 22% compared to 2005, by 2% compared to 2014 and by 12% compared to the previous five year (2010 to 2014) annual average.
Differences in the crash counts and rates in 2015 compared to the previous five year (2010 to 2014) annual average are at least somewhat affected by the reporting change that took effect late in 2011. Please see the definition of “Reportable Collision” for detail regarding this change.

Section 1 Historical Trends
6
Table 1-2 Percentage Change Year-over-Year in Involvement (per 10,000 Licensed Drivers) in Fatal, Injury, and Property Damage Only Collisions
Table 1-2
Percentage Change Year-Over-Year in Relative Involvement Rate (per 10,000 Licensed Drivers) in Fatal, Injury, and PDO Collisions: 2005 to 2015
Year Collisions /10,000 Drivers
% change to previous
year
Fatal /10,000 Drivers
% change to
previous year
Injury /10,000 Drivers
% change to
previous year
PDO /10,000 Drivers
% change to
previous year
2005 463.1 - 1.2 - 90.5 - 371.3 -
2006 438.2 -5.4% 1.4 16.9% 89.8 -0.8% 347.0 -6.6%
2007 392.0 -10.5% 1.3 -11.1% 85.3 -5.0% 305.5 -12.0%
2008 354.1 -9.7% 1.1 -12.9% 78.1 -8.4% 274.9 -10.0%
2009 342.4 -3.3% 1.1 -3.8% 69.5 -11.0% 271.8 -1.1%
2010 343.8 0.4% 1.0 -7.7% 68.1 -2.0% 274.7 1.0%
2011 421.6 22.6% 1.2 17.1% 77.5 13.8% 342.9 24.8%
2012 464.8 10.3% 1.1 -8.1% 98.8 27.4% 365.0 6.4%
2013 488.7 5.1% 0.8 -24.0% 102.0 3.3% 385.9 5.7%
2014 467.9 -4.2% 0.7 -8.7% 103.8 1.8% 363.4 -5.8%
2015 471.4 0.8% 0.8 6.3% 103.6 -0.2% 367.1 1.0%
2010-2014 Average* 437.3 6.8% 0.9 -6.3% 90.0 8.8% 346.3 6.4%
*The '% change to previous year' for '2010-2014 Average' is an average rate of change for the time period 2010 to 2014.
Recognizing that collision counts could be impacted either positively or negatively by changing population statistics, involvement rates per 10,000 licensed drivers are examined to provide a standardized collision rate comparison. This eliminates the effect of changing population size and focuses on how many drivers are being involved in collisions instead of simply a raw count of collisions overall. The involvement in collisions per 10,000 drivers in 2015 is:
471.4 for all collisions, up 1% from 2014 and up by 8% compared to the previous five year (2010 to 2014) annual average;
0.8 for fatal collisions, up 6% from 2014 and decreased by nearly 18% compared to the previous five year (2010 to 2014) annual average;
103.6 for injury collisions, down slightly from 103.8 in 2014 and up by 15% from the previous five year (2010 to 2014) annual average; and,
367.1 for PDO collisions, up 1% from 2014 and by 6% compared to the previous five year (2010 to 2014) annual average.

Section 1 Historical Trends
7
Table 1-3 Fatal, Injury and Property Damage Collisions by Vehicles Registered
Table 1-3
Fatal, Injury, and Property Damage Collisions by Vehicles Registered: 2005 to 2015
Year
Vehicles Registered*
Total Collisions
Collisions /10,000 Vehicles
Total Fatal Fatal
/10,000 Vehicles
Total Injury
Injury /10,000 Vehicles
Total PDO PDO
/10,000 Vehicles
2005 730,838 33,164 453.8 88 1.2 6,482 88.7 26,594 363.9
2006 740,636 31,738 428.5 104 1.4 6,503 87.8 25,131 339.3
2007 753,705 29,494 391.3 96 1.3 6,415 85.1 22,983 304.9
2008 773,596 27,092 350.2 85 1.1 5,974 77.2 21,033 271.9
2009 783,426 26,578 339.3 83 1.1 5,396 68.9 21,099 269.3
2010 799,327 27,172 339.9 78 1.0 5,386 67.4 21,708 271.6
2011 814,808 34,302 421.0 94 1.2 6,309 77.4 27,899 342.4
2012 838,553 38,972 464.8 89 1.1 8,280 98.7 30,603 364.9
2013 852,105 41,819 490.8 69 0.8 8,729 102.4 33,021 387.5
2014 867,326 40,672 468.9 64 0.7 9,023 104.0 31,585 364.2
2015 881,345 41,548 471.4 69 0.8 9,127 103.6 32,352 367.1
2010-2014 Average 834,424 36,587 437.1 79 0.9 7,545 90.0 28,963 346.1
*Vehicles registered exclude off-road vehicles, non-commercial snow vehicles, non-commercial trailers, non-farm tractors and PSV trailers.
Involvement in collisions per 10,000 vehicles registered is another way to view collision rates in a standardized format. It attempts to account for fluctuations in the total number of vehicles registered for use on Manitoba roadways. In 2015, there are 471.4 collisions for every 10,000 vehicles registered in Manitoba, up nearly 1% compared to the rate in 2014 (468.9) and by 8% compared to the rate in the previous five year (2010 to 2014) annual average (437.1). The changes in rate of involvement in collisions at each level of severity in 2015 vary compared to recent years. In 2015, there are 0.8 fatal collisions for every 10,000 vehicles, up 6% from 2014 (rate of 0.7), but down by 17% from the previous five year (2010 to 2014) annual average (rate of 0.9). The involvement rate for injury collisions (103.6 in 2015) is down nearly 1% compared to 2014 (rate of 104.0) and up 15% from the previous five year (2010 to 2014) annual average (rate of 90.0). Involvement in PDO collisions (367.1 in 2015) is up 1% compared to 2014 (rate of 364.2) and up 6% compared to the previous five year (2010 to 2014) annual average (rate of 346.1). Involvement rates between 2005 and 2015 for collisions in Manitoba, both per 10,000 licensed drivers and per 10,000 registered vehicles, are noted in Figures 1-1, 1-2, 1-3 and 1-4 on the following pages. The spike in rates for overall collisions, injury collisions, and PDO collisions in 2011 and 2012 is attributable to a change in the reporting requirements, discussed under the “Reportable Collisions” definition. Year over year changes in the 2015 collision rates, however, cannot be attributed to changes in what constitutes a reportable collision.

Section 1 Historical Trends
8
Figure 1-1 Involvement in Total Collisions by Licensed Drivers and Vehicles Registered
Figure 1-2 Involvement in Fatal Collisions by Licensed Drivers and Vehicles Registered
300.0
350.0
400.0
450.0
500.0
550.0
2005 2006 2007 2008 2009 2010 2011 2012 2013 2014 2015
Rat
e/1
0,0
00
Total Collisions
per 10,000 Licensed Drivers and Vehicles Registered 2005 - 2015
Collisions /10,000 Drivers Collisions /10,000 Vehicles
0.5
1.0
1.5
2.0
2005 2006 2007 2008 2009 2010 2011 2012 2013 2014 2015
Rat
e/1
0,0
00
Fatal Collisions per 10,000 Licensed Drivers and Vehicles Registered
2005 - 2015
Fatal /10,000 Drivers Fatal /10,000 Vehicles

Section 1 Historical Trends
9
Figure 1-3 Involvement in Injury Collisions by Licensed Drivers and Vehicles Registered
Figure 1-4 Involvement in Property Damage Only (PDO) Collisions by Licensed Drivers and Vehicles Registered
60.0
80.0
100.0
120.0
2005 2006 2007 2008 2009 2010 2011 2012 2013 2014 2015
Rat
e/1
0,0
00
Injury Collisions
per 10,000 Licensed Drivers and Vehicles Registered 2005 - 2015
Injury /10,000 Drivers Injury /10,000 Vehicles
200.0
250.0
300.0
350.0
400.0
2005 2006 2007 2008 2009 2010 2011 2012 2013 2014 2015
Rat
e/1
0,0
00
PDO Collisions per 10,000 Licensed Drivers and Vehicles Registered
2005 - 2015
PDO /10,000 Drivers PDO /10,000 Vehicles

Section 1 Historical Trends
10
Table 1-4 Involvement (Total Collisions) per 10,000 Licensed Drivers by Age Group
Table 1-4
Involvement (Total Collisions) /10,000 Licensed Drivers by Age Group: 2005 to 2015
Age Group
Year 2010-2014
Average 2005 2006 2007 2008 2009 2010 2011 2012 2013 2014 2015
16-19 973.8 937.9 838.7 771.7 756.1 737.3 890.8 1,095.7 1,068.3 982.5 969.1 957.0
20-24 786.1 747.6 706.2 673.8 648.8 630.4 851.6 1,114.4 1,121.0 1,059.8 1,035.3 964.3
25-34 578.3 541.9 511.6 493.2 460.6 470.5 671.8 860.0 920.8 871.5 826.0 767.0
35-44 545.3 498.9 466.1 450.5 444.0 432.1 586.9 741.6 811.3 777.2 736.8 673.0
45-54 484.2 452.5 429.1 402.9 393.0 397.9 524.2 645.0 698.4 668.6 652.7 586.5
55-64 426.8 397.1 378.6 347.6 340.4 353.0 441.6 529.8 554.4 540.4 519.3 486.6
65-74 359.0 342.6 310.0 296.9 289.8 285.0 366.9 416.9 458.1 441.2 414.2 398.1
75> 318.6 321.2 276.5 237.4 235.2 254.9 292.5 342.7 353.4 331.7 332.2 316.6
In 2015, the youngest driver age groups in Manitoba continue to have the highest rates of involvement in collisions. At 969.1, the involvement rate of drivers aged 16 to 19 is:
6% lower than the rate of those aged 20 to 24;
17% higher than those aged 25 to 34;
Nearly 32% higher than those aged 35 to 44;
Nearly 49% higher than those aged 45 to 54;
87% higher than those aged 55 to 64; and,
More than two and a half times the rate of those aged 65 and older. Manitobans aged 20 to 24 have the highest rate of involvement in collisions in 2015. At 1,035.3, the involvement rate of drivers aged 20 to 24 is:
25% higher than those aged 25 to 34;
Nearly 41% higher than those aged 35 to 44;
59% higher than those aged 45 to 54;
Double those aged 55 to 64; and,
Nearly triple those aged 65 and older. Manitobans aged 25 to 34, while having a lower involvement rate than younger drivers, have a higher involvement rate than drivers in older age groups. At 826.0 in 2015, the involvement rate of drivers aged 25 to 34 is:
12% higher than those aged 35 to 44;
Nearly 27% higher than those aged 45 to 54;
59% higher than those aged 55 to 64; and,
More than double those aged 65 and older. The involvement rate for drivers in each successive age group beginning at age 35 drops off consistently.

Section 1 Historical Trends
11
Collision involvement rates for drivers under the age of 75 have decreased in 2015 compared to 2014 but increased compared to the previous five year (2010 to 2014) annual average. Involvement per 10,000 licensed drivers in 2015 by age group:
Age 16 to 19 – 969.1 in 2015, down 1% compared to 2014 but up 1% compared to the previous five year annual average.
Age 20 to 24 – 1,035.3 in 2015, down 2% compared to 2014 but up 7% compared to the previous five year annual average.
Age 25 to 34 – 826.0 in 2015, down 5% compared to 2014 but up 8% compared to the previous five year annual average.
Age 35 to 44 – 736.8 in 2015, down 5% compared to 2014 but up nearly 10% compared to the previous five year annual average.
Age 45 to 54 – 652.7 in 2015, down 2% compared to 2014 but up 11% compared to the previous five year annual average.
Age 55 to 64 – 519.3 in 2015, down 4% compared to 2014 but up 7% compared to the previous five year annual average.
Age 65 to 74 – 414.2 in 2015, down 6% compared to 2014 but up 4% compared to the previous five year annual average.
Age 75 and over – 332.2 in 2015, up slightly from 331.7 in 2014 and up 5% compared to the previous five year annual average.
Figure 1-5 Involvement (per 10,000 Licensed Drivers) in Total Collisions by Age Group
200.0
300.0
400.0
500.0
600.0
700.0
800.0
900.0
1,000.0
1,100.0
1,200.0
2005 2006 2007 2008 2009 2010 2011 2012 2013 2014 2015
Rel
ativ
e In
volv
emen
t/1
0,0
00
Dri
vers
Relative Involvement per 10,000 Drivers by Age Group 2005 - 2015
16-19
20-24
25-34
35-44
45-54
55-64
65-74
75>


SECTION 2 – Licensed Drivers

Section 2 Licensed Drivers
15
Introduction
This section deals with Active and Suspended Drivers by specific Age Groups, Gender and Manitoba Licence Class. Key Highlights There is an average of 881,338 licensed drivers in Manitoba in 2015, an increase of 1% compared to 2014. Of these:
95% are Active drivers, 5% are Suspended drivers;
52% are Male, 48% are Female;
68% are between the ages of 25 and 64; and
Men account for 67% of all Suspended drivers in Manitoba. There is an average of 69,506 licensed motorcycle drivers in Manitoba in 2015, an increase of 2% compared to 2014. Major Elements Examined Counts of licensed drivers in Manitoba for 2015 represent an average for the 2015 calendar year. That is, “point-in-time” observations (licensed drivers by age, licence class and gender) are recorded as of the first of each month and then an average for the year is calculated and reported. Due to rounding in this process, some columns and rows may not add to the total. This is different from some previous years. Methodological improvements were made to licensed driver counts in 2008. To enable historical comparisons of licensed driver counts, data reported here for the years 2005 through 2007 have been adjusted to reflect this new methodology. At the beginning of this section, there is a quick reference chart of Manitoba’s Driver Licence and Vehicle Class descriptions. A review of these charts will indicate which Driver Licence Class is required to operate specific Vehicle Classes. As it is a requirement for Class 6 licence holders to first possess a Class 1-5 licence prior to obtaining a Class 6 licence, Class 1 to 5 licence holders are discussed separately from Class 6 licence holders to avoid duplication of licence counts. Tables 2-6, 2-7, 2-8, 2-9 and 2-10 present the number of Class 6 active motorcycle licensed drivers by Gender, Age Group and Driver Licence Class. Terms and Definitions “Licence Class”
A Manitoba Driver’s Licence of a specific level which permits the holder to operate vehicles within a specific Vehicle Class.
“Vehicle Class”
Category of vehicles meeting specific designations and specifications. “Active drivers”
Drivers holding an active Manitoba Driver’s Licence of any specific Licence Class. “Suspended drivers”
Drivers holding a Manitoba Driver’s Licence of any specific Licence Class who have been disqualified from driving for some reason. Although the list is extensive, some possible suspensions could be for driving violations, medical conditions, administrative suspensions and criminal code convictions.
“Graduated Driver Licensing (GDL)”
A three-stage program designed to help new drivers, regardless of age, acquire the knowledge and skill needed to safely operate a motor vehicle. Each licence stage has specific rules and restrictions governing when and under what circumstances the holder is allowed to operate a motor vehicle, enabling novice drivers to gain more experience under a greater variety of driving conditions. Both Class 5 and Class 6 licences have a GDL stage associated with them.
Three stages of GDL: Learner (5/L or 6/L); Intermediate (5/I or 6/I); and, Full (5/F or 6/F).
To view a full discussion of the GDL program in Manitoba, please visit: o http://www.mpi.mb.ca/PDFs/DVL_PDFs/GDLGuide.pdf; ou en Français, o http://www.mpi.mb.ca/PDFs/DVL_PDFs/GDLGUIDEfr.pdf

Section 2 Licensed Drivers
16
Chart 2-1 Class Licence System Quick Reference Chart
Manitoba Licence Class Allows the Licence Holder to Operate Minimum
Age Requirements
1
Semi-trailer trucks including all vehicles in Classes 2, 3, 4, and 5.
18
Must hold a minimum Class 5 Intermediate or Class 5 Authorized Instruction licence to obtain authorized instruction in Classes 1–4.
Must pass written or oral knowledge test.
Requires supervising driver for Authorized Instruction.
Must pass road test. For Classes 1, 2, 3 or 4 (buses and trucks only), the test includes a pre-trip inspection of vehicle (and air brake system if applicable) by the applicant.
2 Buses1 having a seating capacity of over 24 passengers (while carrying passengers), school buses2 having a seating capacity over 36 passengers (while carrying passengers). Includes all vehicles in Classes 3, 4 and 5.
3
Trucks with more than two axles, including any combination of vehicles, OR a truck with two axles towing a vehicle with a registered gross vehicle weight of more than 4,540 kg (but does not include a semi-trailer truck). Includes all vehicles in Classes 4 and 5.
4
Taxis, ambulances, and other emergency vehicles, buses1 with a seating capacity between 10 and 24 passengers (while carrying passengers) and school buses2 with a seating capacity between 10 and 36 passengers (while carrying passengers). Includes all vehicles in Class 5.
5
Passenger cars, a bus while not carrying passengers, trucks with two axles, and any combination of vehicles consisting of a truck with two axles and a towed vehicle with a registered gross vehicle weight of up to 4,540 kg. May operate Class 3 vehicles if registered as a farm truck and the driver holds a Class 5 Intermediate or Full Stage Licence. May operate a Moped3, if 16 years of age or older. Note: A person must hold a valid minimum Class 5 Intermediate Stage driver’s
licence to operate a special mobile machine, implement of husbandry or tractor on a provincial highway, or a highway within the municipal boundaries of a city, town, village or urban municipality. For further information please call 204-985–7000 or toll-free 1 800-665-2410.
16 or
15½ if enrolled
in high school driver
education course
Must pass written or oral knowledge and sign tests for Class 5 Learner licence (minimum nine- month Learner Stage). (Must wait seven days for re-tests.)
Requires supervising driver for a Class 5 Learner Stage or Authorized Instruction.
Requires supervising driver for a Class 5 Intermediate if carrying more than one passenger between the hours of 12 midnight and 5 a.m.
Must pass road test to advance to the Intermediate Stage (minimum 15-month Intermediate Stage). (Must wait 14 days for re-test).
6
Motorcycles.
16
Driver must hold a valid licence of any class and stage.
Must pass written or oral knowledge test. (Must wait seven days for re-tests.)
Must obtain Class 6 M Stage licence in order to complete motorcycle training course. The course is required before Learner Stage Licence is issued. (Contact Manitoba Safety Council for motorcycle course charges.)
Minimum nine-month Learner Stage.
Must pass road test to advance to the Intermediate Stage (minimum 15–months Intermediate Stage). (Must wait 14 days for re-test.)
Air
Bra
ke
En
do
rsem
en
t
Air Brake Endorsement—permits the holder to drive vehicles equipped with Air Brakes in the class of vehicle for which the person is licenced. Drivers of a Class 3 truck registered as a farm truck equipped with air brakes are exempt from this requirement.
Must pass written or oral test.
Must pass Air Brake practical test for “A” (Authorized) endorsement.
Must pass adjustment of the manual slack adjusters for “S” (Slack Adjuster) endorsement.
There is no additional charge for the Air Brake practical test if it is completed at the same time you are road-tested for a higher class of licence.
1. A bus is any vehicle with a seating capacity of at least 11 persons (including the driver) used primarily to carry passengers. It excludes vehicles used for personal transportation by the owner or with the owner’s permission. 2. School bus certificate is required. For further information contact the Manitoba Education, Training and Youth, Pupil Transportation at 204-945–6900. 3. Mopeds are not allowed to be driven on highways with a speed limit exceeding 80 km/h, but may cross these highways.

Section 2 Licensed Drivers
17
Table 2-1 Class 1-5 Licensed Drivers by Year and Driver Status
Table 2-1
Class 1-5 Licensed Drivers by Year and Driver Status: 2005-2015
Licensing Year Active Drivers Suspended Drivers Total Drivers
% Change to Previous Year
2005 695,091 21,077 716,169
2006 703,051 21,279 724,330 -1.1%
2007* 728,047 24,351 752,398 3.9%
2008 744,049 20,965 765,014 1.7%
2009 754,485 21,724 776,209 1.5%
2010 767,222 23,108 790,330 1.8%
2011 788,046 25,645 813,691 3.0%
2012 805,519 32,962 838,481 3.0%
2013 818,303 37,487 855,791 2.1%
2014 828,928 40,311 869,239 1.6%
2015 839,036 42,302 881,338 1.4%
Average 2010-2014** 801,604 31,903 833,506 2.3%
*The count of "Suspended Drivers" in 2007 is artificially high due to a system error that was later corrected to recode licences displayed as suspended, but not actually suspended. **The "% Change to Previous Year" for "Average 2010-2014" is an average rate of change for the time period 2010 to 2014.
Compared to 2014, the total number of licensed drivers in Manitoba in 2015 increased by 1% to 881,338. This is in line with historical increases seen in recent years; the rate of change over the past five years (2010-2014) was a 2% increase on average each year. The proportion of suspended drivers increased by 5% in 2015 compared to 2014, up to 42,302 from 40,311, respectively. The count of suspended drivers in 2015 is 33% higher than the previous 5 year average (2010-2014), up to 42,302 from 31,903.

Section 2 Licensed Drivers
18
Table 2-2 Class 1-5 Licensed Drivers by Age Group, Gender and Driver Status
Table 2-2
Class 1-5 Licensed Drivers by Age Group, Gender and Driver Status: 2015
Age Group Gender Active Drivers
Suspended Drivers
Total Drivers % of "All Ages"
% Suspended in Category
16-17 Male 10,773 118 10,892 2.4 1.1
Female 10,152 86 10,238 2.4 0.8
Total 20,925 205 21,130 2.4 1.0
18-19 Male 13,288 525 13,813 3.0 3.8
Female 12,341 349 12,690 3.0 2.8
Total 25,629 874 26,502 3.0 3.3
20-24 Male 36,025 2,442 38,467 8.4 6.3
Female 34,201 1,498 35,698 8.4 4.2
Total 70,226 3,939 74,165 8.4 5.3
25-34 Male 73,602 5,105 78,706 17.2 6.5
Female 71,425 2,787 74,212 17.5 3.8
Total 145,027 7,891 152,918 17.4 5.2
35-44 Male 70,874 4,043 74,917 16.4 5.4
Female 69,166 1,955 71,121 16.7 2.7
Total 140,040 5,999 146,038 16.6 4.1
45-54 Male 77,319 4,005 81,324 17.8 4.9
Female 74,047 1,494 75,541 17.8 2.0
Total 151,366 5,499 156,865 17.8 3.5
55-64 Male 72,614 3,123 75,737 16.6 4.1
Female 69,586 1,057 70,644 16.6 1.5
Total 142,200 4,180 146,380 16.6 2.9
65-74 Male 46,401 2,293 48,694 10.7 4.7
Female 44,480 979 45,458 10.7 2.2
Total 90,880 3,272 94,152 10.7 3.5
75-84 Male 21,224 2,593 23,817 5.2 10.9
Female 20,546 1,354 21,900 5.2 6.2
Total 41,770 3,947 45,717 5.2 8.6
85+ Male 5,742 4,275 10,017 2.2 42.7
Female 5,232 2,221 7,453 1.8 29.8
Total 10,973 6,496 17,470 2.0 37.2
All Ages Male 427,861 28,522 456,383 100.0 6.2
Female 411,175 13,780 424,955 100.0 3.2
Total 839,036 42,302 881,338 100.0 4.8
In 2015, the proportion of suspended drivers aged 75 or older is four times the proportion of suspended drivers under age 75 (nearly 17% of drivers aged 75 or older are suspended; 4% of drivers aged 16 to 74 are suspended).

Section 2 Licensed Drivers
19
Table 2-3 Class 1-5 Licensed Drivers by License Class, Driver Status and Gender
Table 2-3
Class 1-5 Licensed Drivers by License Class, Driver Status and Gender: 2015
License Class
Active Drivers Suspended Drivers Total %
Male Female Subtotal % Male Female Subtotal %
1 38,079 1,486 39,566 4.7 1,041 33 1,073 2.5 40,639 4.6
2 4,691 1,644 6,335 0.8 89 23 112 0.3 6,447 0.7
3 11,128 355 11,482 1.4 271 5 276 0.7 11,758 1.3
4 12,761 4,204 16,965 2.0 451 64 515 1.2 17,480 2.0
5/F 334,114 365,281 699,395 83.4 22,221 9,891 32,112 75.9 731,507 83.0
5/I 9,650 9,548 19,199 2.3 578 232 810 1.9 20,009 2.3
5/L 14,539 23,094 37,632 4.5 2,337 2,543 4,880 11.5 42,513 4.8
5/A 2,888 5,563 8,452 1.0 844 703 1,547 3.7 9,999 1.1
Other 11 0 11 <0.1 690 286 976 2.3 987 0.1
Total 427,861 411,175 839,036 100.0 28,522 13,780 42,302 100.0 881,338 100.0
Manitoba Class 5 Driver's Licence Stages:
5/F Full Class 5 licence (including Full Stage Class 5 under Graduated Driver Licensing)
5/I Intermediate Stage under Graduated Driver Licensing
5/L Learner Stage under Graduated Driver Licensing
5/A Learner drivers who are not in Graduated Driver Licensing
Other Unlicensed drivers assigned a licence number The vast majority of Manitobans with a licence hold a Full Class 5 (83%). Novice drivers, holding either Learner (5/L) or an Intermediate (5/I) Stage licence, account for the next largest group (7% of all licensed drivers in Manitoba), followed by Class 1 licensed drivers (5%). Very little has changed in the proportion of licence holders by class when comparing 2014 to 2015.
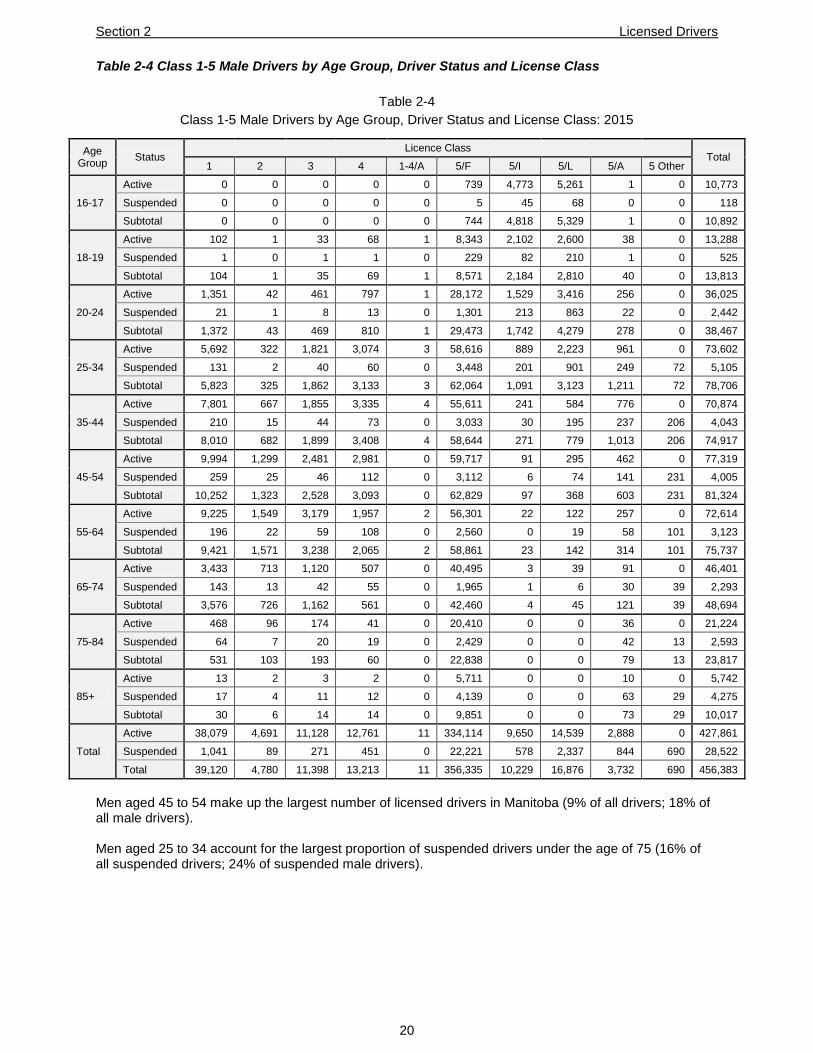
Section 2 Licensed Drivers
20
Table 2-4 Class 1-5 Male Drivers by Age Group, Driver Status and License Class
Table 2-4
Class 1-5 Male Drivers by Age Group, Driver Status and License Class: 2015
Age Group
Status Licence Class
Total 1 2 3 4 1-4/A 5/F 5/I 5/L 5/A 5 Other
16-17
Active 0 0 0 0 0 739 4,773 5,261 1 0 10,773
Suspended 0 0 0 0 0 5 45 68 0 0 118
Subtotal 0 0 0 0 0 744 4,818 5,329 1 0 10,892
18-19
Active 102 1 33 68 1 8,343 2,102 2,600 38 0 13,288
Suspended 1 0 1 1 0 229 82 210 1 0 525
Subtotal 104 1 35 69 1 8,571 2,184 2,810 40 0 13,813
20-24
Active 1,351 42 461 797 1 28,172 1,529 3,416 256 0 36,025
Suspended 21 1 8 13 0 1,301 213 863 22 0 2,442
Subtotal 1,372 43 469 810 1 29,473 1,742 4,279 278 0 38,467
25-34
Active 5,692 322 1,821 3,074 3 58,616 889 2,223 961 0 73,602
Suspended 131 2 40 60 0 3,448 201 901 249 72 5,105
Subtotal 5,823 325 1,862 3,133 3 62,064 1,091 3,123 1,211 72 78,706
35-44
Active 7,801 667 1,855 3,335 4 55,611 241 584 776 0 70,874
Suspended 210 15 44 73 0 3,033 30 195 237 206 4,043
Subtotal 8,010 682 1,899 3,408 4 58,644 271 779 1,013 206 74,917
45-54
Active 9,994 1,299 2,481 2,981 0 59,717 91 295 462 0 77,319
Suspended 259 25 46 112 0 3,112 6 74 141 231 4,005
Subtotal 10,252 1,323 2,528 3,093 0 62,829 97 368 603 231 81,324
55-64
Active 9,225 1,549 3,179 1,957 2 56,301 22 122 257 0 72,614
Suspended 196 22 59 108 0 2,560 0 19 58 101 3,123
Subtotal 9,421 1,571 3,238 2,065 2 58,861 23 142 314 101 75,737
65-74
Active 3,433 713 1,120 507 0 40,495 3 39 91 0 46,401
Suspended 143 13 42 55 0 1,965 1 6 30 39 2,293
Subtotal 3,576 726 1,162 561 0 42,460 4 45 121 39 48,694
75-84
Active 468 96 174 41 0 20,410 0 0 36 0 21,224
Suspended 64 7 20 19 0 2,429 0 0 42 13 2,593
Subtotal 531 103 193 60 0 22,838 0 0 79 13 23,817
85+
Active 13 2 3 2 0 5,711 0 0 10 0 5,742
Suspended 17 4 11 12 0 4,139 0 0 63 29 4,275
Subtotal 30 6 14 14 0 9,851 0 0 73 29 10,017
Total
Active 38,079 4,691 11,128 12,761 11 334,114 9,650 14,539 2,888 0 427,861
Suspended 1,041 89 271 451 0 22,221 578 2,337 844 690 28,522
Total 39,120 4,780 11,398 13,213 11 356,335 10,229 16,876 3,732 690 456,383
Men aged 45 to 54 make up the largest number of licensed drivers in Manitoba (9% of all drivers; 18% of all male drivers). Men aged 25 to 34 account for the largest proportion of suspended drivers under the age of 75 (16% of all suspended drivers; 24% of suspended male drivers).

Section 2 Licensed Drivers
21
Table 2-5 Class 1-5 Female Drivers by Age Group, Driver Status and License Class
Table 2-5
Class 1-5 Female Drivers by Age Group, Driver Status and License Class: 2015
Age Group
Status License Class
Total 1 2 3 4 1-4/A 5/F 5/I 5/L 5/A 5 Other
16-17
Active 0 0 0 0 0 611 4,186 5,355 0 0 10,152
Suspended 0 0 0 0 0 2 16 69 0 0 86
Subtotal 0 0 0 0 0 612 4,202 5,423 0 0 10,238
18-19
Active 1 0 3 28 0 7,627 1,744 2,923 15 0 12,341
Suspended 0 0 0 0 0 89 30 229 1 0 349
Subtotal 1 0 3 28 0 7,717 1,774 3,153 15 0 12,690
20-24
Active 32 4 33 341 0 27,025 1,629 4,917 219 0 34,201
Suspended 0 0 0 3 0 523 91 873 8 0 1,498
Subtotal 32 4 33 344 0 27,548 1,720 5,790 227 0 35,698
25-34
Active 155 104 79 1,100 0 61,544 1,318 5,143 1,983 0 71,425
Suspended 5 1 1 9 0 1,483 77 967 227 18 2,787
Subtotal 160 105 80 1,109 0 63,026 1,395 6,110 2,210 18 74,212
35-44
Active 345 328 59 1,153 0 62,240 499 2,833 1,708 0 69,166
Suspended 9 3 0 15 1 1,322 14 275 234 82 1,955
Subtotal 354 331 60 1,168 1 63,562 513 3,108 1,942 82 71,121
45-54
Active 527 582 67 1,004 0 69,191 143 1,448 1,084 0 74,047
Suspended 10 9 2 18 0 1,143 4 104 119 86 1,494
Subtotal 537 592 69 1,022 0 70,334 147 1,552 1,203 86 75,541
55-64
Active 353 506 82 503 0 67,288 25 399 431 0 69,586
Suspended 5 8 1 9 0 924 0 21 41 48 1,057
Subtotal 358 514 83 512 0 68,212 25 420 472 48 70,644
65-74
Active 72 113 29 72 0 44,029 5 69 92 0 44,480
Suspended 3 1 1 4 0 926 0 5 14 24 979
Subtotal 75 114 30 76 0 44,955 5 74 106 24 45,458
75-84
Active 2 5 3 3 0 20,504 0 6 22 0 20,546
Suspended 0 0 0 3 0 1,305 0 1 31 14 1,354
Subtotal 2 5 3 6 0 21,809 0 7 53 14 21,900
85+
Active 0 0 1 0 0 5,222 0 1 8 0 5,232
Suspended 0 1 0 3 0 2,173 0 0 30 14 2,221
Subtotal 0 1 1 3 0 7,395 0 1 38 14 7,453
Total
Active 1,486 1,644 355 4,204 0 365,281 9,548 23,094 5,563 0 411,175
Suspended 33 23 5 64 1 9,891 232 2,543 703 285 13,780
Total 1,519 1,667 360 4,267 1 375,172 9,780 25,637 6,267 285 424,955
Women aged 45 to 54 make up the largest number of licensed female drivers in Manitoba (9% of all drivers; 18% of all female drivers). Even though women account for almost half (48%) of all licensed drivers, they only account for 33% of suspended drivers in Manitoba. Women aged 25 to 34 account for the highest proportion of suspended female drivers under the age of 75 (27%).

Section 2 Licensed Drivers
22
Table 2-6 Total Class 6 Active Licensed Drivers by Year
Table 2-6
Total Class 6 Active Licensed Drivers by Year: 2005 to 2015
Licensing Year Active Drivers % Change to Previous Year
2005 54,005 -
2006 54,642 1.2%
2007* 56,825 4.0%
2008 58,486 2.9%
2009 60,105 2.8%
2010 61,572 2.4%
2011 63,385 2.9%
2012 65,305 3.0%
2013 66,908 2.5%
2014 68,180 1.9%
2015 69,506 1.9%
Average 2010-2014* 65,070 2.6%
*The "% Change to Previous Year" for "2010-14 Average" is an average rate of change for the time period 2010 to 2014.
In 2015, the number of motorcycle licence holders increased by 2% compared to 2014, in line with the annual average rate of change from 2010 through 2014 (3%). As discussed in the introduction of this section, Class 6 Motorcycle licence holders in Manitoba also hold a Class 1-5 licence due to a requirement for those wishing to obtain a Class 6 licence to first obtain a licence in any other class (1-5). Because of this, Class 6 licence holders are counted separately to avoid any duplication of counts with Class 1-5 licence holders. This means Class 6 licence holders cannot be added to Class 1-5 licence holders. Also, a licence suspension is applicable to all licence classes held by a suspended driver. Therefore, suspended Class 6 licences are not counted or addressed in the following discussion; they have been covered in the previous discussions of suspended Class 1-5 licence holders.

Section 2 Licensed Drivers
23
Table 2-7 Class 6 Active Licensed Drivers by Age Group, Gender and Driver Status
Table 2-7
Class 6 Active Licensed Drivers by Age Group and Gender: 2015
Age Group Gender Active Drivers %
16-17
Male 126
Female 12
Total 138 0.2
18-19
Male 354
Female 35
Total 389 0.6
20-24
Male 2,278
Female 323
Total 2,601 3.7
25-34
Male 7,508
Female 1,250
Total 8,758 12.6
35-44
Male 8,222
Female 1,543
Total 9,766 14.0
45-54
Male 15,422
Female 2,450
Total 17,872 25.7
55-64
Male 18,478
Female 2,494
Total 20,972 30.2
65-74
Male 6,812
Female 717
Total 7,530 10.8
75-84
Male 1,168
Female 97
Total 1,265 1.8
85+
Male 197
Female 17
Total 214 0.3
All Ages
Male 60,565
Female 8,940
Total 69,506 100.0
Men account for the majority of Class 6 licence holders (87% overall). Most Class 6 licence holders are between the ages 35 and 64 (70%). Men aged 35 to 64 make up 61% of all Class 6 licence holders. Women in the same age group (aged 35 to 64) make up 9% of all Class 6 licence holders.

Section 2 Licensed Drivers
24
Table 2-8 Class 6 Active Licensed Drivers by License Class, Driver Status and Gender
Table 2-8
Class 6 Active Licensed Drivers by License Class and Gender: 2015
License Class
Active Drivers
Male Female Total %
6/F 46,790 5,048 51,838 74.6
6/I 6 0 7 <0.1
6/L 8,140 2,437 10,578 15.2
6/A 2,627 382 3,008 4.3
6/M 3,002 1,074 4,075 5.9
Total 60,565 8,940 69,506 100.0
Manitoba Class 6 Driver's Licence Stages 6/F Full Class 6 licence (including Full Stage Class 6 under Graduated Driver Licensing) 6/I Intermediate Stage under Graduated Driver Licensing 6/L Learner Stage under Graduated Driver Licensing 6/A Learner drivers who are not in Graduated Driver Licensing 6/M Licence received after passing written test, entitling holder to take the Motorcycle Training Course Under Manitoba’s Graduated Driver Licensing (GDL) program, novice drivers are only required to complete the Intermediate Stage once. Credit for time served in the Intermediate Stage in Class 5 is given for the Intermediate Stage in Class 6. That is, if a novice driver completes the Intermediate stage of the GDL program for a Class 5 licence, they do not need to repeat the Intermediate Stage in order to obtain a Class 6 licence. In 2015, Full Class 6 licence holders account for 75% of all Manitoba Class 6 licence holders and Learners account for 15%. This distribution is similar to 2014.

Section 2 Licensed Drivers
25
Table 2-9 Active Class 6 Male Drivers by Age Group and License Class
Table 2-9
Active Class 6 Male Drivers by Age Group and License Class: 2015
Age Group
License Class Total % of Total
6/F 6/I 6/L 6/A 6/M
16-17 2 4 79 0 41 126 0.2
18-19 37 0 184 1 131 354 0.6
20-24 481 1 1,192 22 582 2,278 3.8
25-34 2,618 1 3,276 366 1,248 7,508 12.4
35-44 5,003 0 1,665 1,039 515 8,222 13.6
45-54 13,339 0 1,011 794 278 15,422 25.5
55-64 17,480 0 542 319 138 18,478 30.5
65-74 6,519 0 171 69 53 6,812 11.2
75-84 1,118 0 20 15 14 1,168 1.9
85+ 192 0 2 2 1 197 0.3
Total 46,790 6 8,140 2,627 3,002 60,565
Table 2-10 Active Class 6 Female Drivers by Age Group and License Class
Table 2-10
Active Class 6 Female Drivers by Age Group and License Class: 2015
Age Group
License Class Total % of Total
6/F 6/I 6/L 6/A 6/M
16-17 0 0 9 0 3 12 0.1
18-19 2 0 20 0 12 35 0.4
20-24 29 0 171 1 122 323 3.6
25-34 237 0 674 32 307 1,250 14.0
35-44 568 0 636 120 220 1,543 17.3
45-54 1,453 0 625 138 234 2,450 27.4
55-64 1,984 0 284 77 149 2,494 27.9
65-74 662 0 18 12 26 717 8.0
75-84 96 0 0 1 0 97 1.1
85+ 16 0 0 1 0 17 0.2
Total 5,048 0 2,437 382 1,074 8,940


SECTION 3 – Vehicle Registrations


Section 3 Vehicle Registrations
29
Introduction
This section deals with vehicle registrations and examines these by three major categories: Commercial; Non-commercial; and, Snowmobiles (Recreational). Key Highlights There are a total of 944,469 Non-commercial vehicles registered in Manitoba in 2015.
This is a 2% increase over 2014 and a 25% increase from 2005.
This is a 6% increase over the average registrations for the period 2010-2014. There are a total of 107,907 Commercial vehicles registered in Manitoba in 2015.
This is a slight 1% increase over 2014 and a 46% increase from 2005.
This is a 11% increase over the average registrations for the period 2010-2014. Overall, there is a 2% increase in the total vehicle registrations (commercial and non-commercial, combined) in Manitoba from 1,033,058 in 2014 to 1,052,376 in 2015. There are a total of 33,735 Snowmobiles registered in Manitoba in 2015.
There are 545 less registered snowmobiles in 2015 than in 2014 (a 2% decrease); a 70% increase from 2005.
This is an 8% increase over the average registrations for the period 2010-2014. Major Elements Examined Counts for each Commercial and Non-commercial registration types represent an average registration over the twelve-month period January through December 2015. That is, active vehicle registrations as of the first of each month are recorded for each vehicle category and then an average for the year is calculated and reported. Counts for Snowmobiles use a similar “point-in-time” average calculation, but include December 2014 through to and including April 2015 to cover the snowmobile riding season. Terms and Definitions “Vehicle Class”
Category of vehicles meeting specific designations and specifications
Non-commercial vehicle classes are vehicles registered for private use and include: o Passenger o Antique o Motorcycle/Moped o Truck o Farm Truck o Snow Vehicle o Trailer o Tractor (non-farm)
Commercial vehicle classes are those involving vehicles registered to or for the use of a business and include:
o Truck o Public Service Vehicles (PSV) Truck o Dealer/Repairer o Taxi/Livery o PSV Bus o Trailers o PSV Trailers
A detailed description of each class noted above can be found in the “Glossary” of the Report

Section 3 Vehicle Registrations
30
Table 3-1 Non Commercial Vehicle Class
Table 3-1
Non-Commercial Vehicle Class: 2015
Vehicle Class* Total %
Passenger 559,606 59.3
Antique 136 <0.1
Motorcycle/Moped 13,732 1.5
Truck 156,302 16.5
Farm Truck 43,749 4.6
Snow Vehicle 49 <0.1
Trailer 170,778 18.1
Tractor (Other than Farm-type) 117 <0.1
Total Non-Commercial Vehicles Registered 944,469 100
Snowmobiles (Recreational)
Snowmobiles 33,735
*For definition of these motor vehicle classes refer to the “Terms and Definitions” of this Section and “Glossary” of this Report.
Table 3-2 Commercial Vehicle Class
Table 3-2
Commercial Vehicle Class: 2015
Vehicle Class* Total %
Commercial Truck 33,521 31.1
Public Service Vehicle (PSV) Truck 12,447 11.5
Dealer and Repairer 6,439 6.0
Taxi/Livery/Limousine 903 0.8
Public Service Vehicle (PSV) Bus 168 0.2
Commercial Trailer 54,342 50.4
Public Service Vehicle (PSV) Trailer 87 <0.1
Total Commercial Vehicles Registered 107,907 100
*For definition of these motor vehicle classes refer to the “Terms and Definitions” of this Section and “Glossary” of this Report.

Section 3 Vehicle Registrations
31
Table 3-3 Vehicle Registration Summary
Table 3-3
Vehicle Registrations Summary: 2005 to 2015
Registration Class 2005 2006 2007 2008 2009 2010 2011 2012 2013 2014
5-year (2010-2014)
Average 2015
% Change 2015 vs.
2014
% Change
(2015 vs. 2010-2014
average)
Non-Commercial Vehicle Class
Passenger 487,158 491,363 499,078 509,856 516,185 521,894 529,406 539,384 545,723 551,113 537,504 559,606 1.5 4.1
Antique** 74 80 82 84 77 95 103 131 134 133 119 136 2.6 14.3
Motorcycle/Moped 7,605 8,357 9,143 10,059 10,413 10,732 11,229 12,329 12,658 13,042 11,998 13,732 5.3 14.5
Truck 115,755 117,278 120,217 123,766 127,154 133,057 139,530 145,405 149,295 153,077 144,073 156,302 2.1 8.5
Farm Truck 46,512 45,083 44,477 44,073 43,746 43,517 42,942 43,384 43,361 43,517 43,344 43,749 0.5 0.9
Snow Vehicle** 49 48 49 47 49 50 48 46 43 45 46 49 8.7 5.5
Trailer 97,684 103,840 111,630 120,891 127,080 134,358 143,249 154,603 160,451 165,492 151,630 170,778 3.2 12.6
Tractor (non-farm) 122 125 120 117 122 123 120 117 116 113 118 117 3.7 -0.4
Subtotal 754,959 766,174 784,796 808,892 824,824 843,825 866,628 895,400 911,781 926,533 888,833 944,469 1.9 6.3
Commercial Vehicle Class
Truck 23,833 24,305 24,987 26,123 26,851 27,690 28,928 30,391 31,407 32,227 30,129 33,521 4.0 11.3
PSV Truck 8,988 9,526 10,115 9,863 9,818 9,849 10,244 10,934 11,337 11,813 10,835 12,447 5.4 14.9
Dealer/Repairer 6,561 6,512 6,511 6,546 6,347 6,229 6,185 6,178 6,210 6,354 6,231 6,439 1.3 3.3
Taxi/Livery 764 772 769 778 834 854 871 885 892 893 879 903 1.1 2.8
PSV Bus** 135 134 143 146 155 161 150 143 153 156 152 168 8.1 10.3
Trailers* 33,453 37,226 38,183 42,304 41,846 45,249 45,221 49,389 50,936 55,000 49,159 54,342 -1.2 10.5
PSV Trailers** 54 58 56 51 57 57 57 71 78 82 69 87 6.1 26.1
Subtotal 73,788 78,533 80,764 85,811 85,909 90,089 91,655 97,991 101,012 106,525 97,454 107,907 1.3 10.7
Total Registrations - Non-Commercial and Commercial Vehicle Classes
Total Registrations
828,747 844,707 865,560 894,703 910,732 933,914 958,283 993,390 1,012,793 1,033,058 986,288 1,052,376 1.9 6.7
Snowmobiles***
Total 19,852 20,832 23,401 26,359 27,664 28,064 30,421 30,650 32,851 34,280 31,253 33,735 -1.6 7.9
Off-Road Vehicle Dealer Plates
Total 398 446 429 473 464 454 471 469 505 518 484 529 2.2 9.4
*Commercial trailers include semi-trailers. **Due to small numbers, percentage change figures are expected to be somewhat erratic year-over-year and should be interpreted with extreme caution. ***Snowmobile registration count reflects the average number of active policies at a point in time during the riding season, from December to April (e.g., for 2015, December 2014 through April 2015, inclusive).

Section 3 Vehicle Registrations
32
Over the previous five years (2010 to 2014), total vehicle registrations (excluding snowmobiles and ORV dealer plates) have increased by an average of 3% each year. In 2015, the increase in total vehicle registrations is consistent with this rate of change, increasing by 2% each year since 2013. The total increase in overall vehicle registrations in 2015 comes from an increase in both non-commercial and commercial vehicle registrations. Non-commercial vehicle registrations increased by 2% in 2015 compared to 2014. Commercial vehicle registrations increased by 1% in 2015 compared to 2014. Snowmobile registrations decreased by 2% in 2015 over 2014 (a total count of 33,735 snowmobiles in 2015), but increased by 8% compared to the 5-year (2010-2014) average registrations.

SECTION 4 – Traffic Collisions


Section 4 Traffic Collisions
35
Introduction
This section counts the number of collisions in Manitoba and provides detail for collisions of different severity; fatal, injury and property damage only (PDO). Historical information regarding the number of collisions, the number of victims, the number of vehicles and the number of drivers involved in collisions over the ten year period 2005 to 2014 is presented and compared to 2015. Details are provided for 2015 traffic collisions in terms of the month of occurrence, day of the week, time of day, weather and road conditions, location and type of collision. Key Highlights In 2015, there are 12,017 victims from 41,548 collisions involving 61,711 vehicles and 59,716 drivers. Of the 41,548 collisions:
69 are fatal collisions involving 106 vehicles and 103 drivers, resulting in 78 people killed and 48 people injured;
9,127 are injury collisions involving 16,184 vehicles and 16,088 drivers, resulting in 11,891 people injured; and,
32,352 are PDO collisions involving 45,421 vehicles and 43,525 drivers. Collisions on public roadways in Manitoba in 2015 most frequently occur:
In Winnipeg (63% of all collisions; 19% of fatal, 77% of injury and 60% of PDO collisions) and in rural locations (20% of all collisions, 68% of fatal, 13% of injury and nearly 22% of PDO collisions);
In the winter months (January, February, and December) – 32% of all collisions; 16% of fatal, 33% of injury and 32% of PDO collisions;
On weekdays (Monday through Friday) with Friday specifically accounting for 17% of all collisions; 23% of fatal, 17% of injury and 17% of PDO collisions; and,
Between the hours of 3 and 6 p.m. (15:00 to 17:59) – nearly 25% of all collisions; 13% of fatal, 29% of injury and 23% of PDO collisions.
Collisions on public roadways in Manitoba in 2015 are most frequently:
“Motor vehicle to motor vehicle” in nature – 64% of all collisions; 64% of fatal, 82% of injury and 59% of PDO collisions; and,
“Rear end” collisions (37% of all collisions), collisions occurring at 90° intersections (17% of all collisions), collisions involving a fixed object (12% of all collisions), side-swipe collisions (12% of all collisions), collisions resulting from leaving the road (6% of all collisions), collisions associated with turning (5% of all collisions), and head-on collisions (2% of all collisions).
Major Elements Examined Counts of collisions in Manitoba for 2015 and previous years are taken from Traffic Accident Reports (TARs) completed by Manitoba Public Insurance and law enforcement agencies, and compiled by Manitoba Public Insurance. These counts are presented for all reportable collisions, fatal collisions, injury collisions, and property damage only (PDO) collisions. Collisions, victims, vehicles and drivers are presented separately at the beginning of this section with counts provided for the years 2005 through 2015. Following that, the majority of this section explores traffic collisions occurring in 2015 and provides comparisons to annual average counts of collisions for the time period 2010 to 2014. It is important to note that the number of collisions is not equal to the number of victims as each collision can result in multiple victims. Likewise, the number of vehicles involved is not equal to the number of drivers involved as a driverless vehicle (e.g., a parked car; vehicles that do not have a licensed driver) could be involved in a collision. “Drivers” in this section refers to the number of drivers involved in collisions. It excludes pedestrians, bicyclists, snowmobiles, off-road vehicles, farm and construction equipment, trains and parked vehicles. The terms ‘crash’, ‘collision’, and ‘accident’ are used interchangeably in this report.

Section 4 Traffic Collisions
36
The terms ‘fatally injured’ and ‘killed’ are used interchangeably in this report. The reader is cautioned that not all percentages and calculations in the following tables will add to 100% of the total noted. Rounding error will often produce a difference of one or two percentage points. Likewise, average calculations are presented for historical data from the years 2010 to 2014. Rounding error in these calculations will cause individual average counts not to add to total average counts in some cases. Due to the small numbers of fatal collisions, fluctuations year-over-year could be dramatic; a small change in the total count of these types of collisions can have a significant effect on statistics such as percentage change to previous years and involvement rates. Therefore, the reader is strongly cautioned when interpreting results regarding fatal collisions. Terms and Definitions “Collision severity”
A classification of a collision based on the most severe result of the collision, i.e., whether someone was killed (fatal), injured (injury) or property damage only (PDO) occurred.
“Fatal Collision”
A motor vehicle collision in which at least one person is killed as a result of the collision. The death must have occurred within thirty days of the collision occurrence.
“Injury Collision”
A motor vehicle collision in which at least one person has been recorded as sustaining some level of personal injury, but in which no one is fatally injured or killed. Levels of injury include: ‘major’ (admitted to hospital); ‘minor’ (treated and released from hospital); and, ‘minimal’ (no hospital treatment required).
“Property Damage Only (PDO) Collision”
A motor vehicle collision in which no injury or fatality is sustained and only property damage is the result.
“Collision Type”
Refers to the object struck by a motor vehicle during a collision (including: a pedestrian, another motor vehicle, a train, a motorcycle, a bicycle, an animal, and fixed objects) or to what happened to the vehicle in a single-vehicle collision (including: overturned on roadway and ran off roadway).
“Urban Location”
Collisions occurring within the municipal boundaries of urban locations, including Winnipeg, Brandon, Portage la Prairie, Flin Flon, Dauphin, Thompson, The Pas, Selkirk and others.
“Rural Location”
Collisions occurring on primary highways, secondary highways and local roadways, including the Trans Canada Highway and excluding those that occur within the municipal boundaries of an urban area.
“Accident Configuration”
Briefly describes the action taken by a vehicle immediately prior to or at the start of the collision, including such events as rear-ending another vehicle, side-swiping another vehicle, turning into (the path of) another vehicle, parking, meeting another vehicle at an intersection and/or leaving the roadway.
“Other” in terms of accident configuration includes collisions involving more than one configuration or sequence of events.

Section 4 Traffic Collisions
37
Table 4-1 Historical Summary of Traffic Collisions
Table 4-1
Historical Summary of Traffic Collisions: 2005 to 2015
2005 2006 2007 2008 2009 2010 2011 2012 2013 2014 2015 2010-2014
Average
Total Collisions 33,164 31,738 29,494 27,092 26,578 27,172 34,302 38,972 41,819 40,672 41,548 36,587
Fatal 88 104 96 85 83 78 94 89 69 64 69 79
Injury 6,482 6,503 6,415 5,974 5,396 5,386 6,309 8,280 8,729 9,023 9,127 7,545
PDO 26,594 25,131 22,983 21,033 21,099 21,708 27,899 30,603 33,021 31,585 32,352 28,963
Total Victims 8,753 8,825 8,632 7,924 7,302 7,130 8,337 10,623 11,234 11,676 12,017 9,800
Killed 113 119 109 92 86 87 110 96 85 68 78 89
Injured 8,640 8,706 8,523 7,832 7,216 7,043 8,227 10,527 11,149 11,608 11,939 9,711
Total Vehicles Involved 54,343 51,620 48,491 44,555 43,610 44,979 53,516 59,556 64,316 62,277 61,711 56,929
Fatal 135 151 141 141 126 110 141 126 111 95 106 117
Injury 11,489 11,312 11,099 10,219 9,268 9,358 10,956 14,802 15,663 16,233 16,184 13,402
PDO 42,719 40,157 37,251 34,195 34,216 35,511 42,419 44,628 48,542 45,949 45,421 43,410
Total Drivers Involved 48,898 46,380 44,814 42,120 41,097 42,310 51,279 58,877 63,501 61,294 59,716 55,452
Fatal 126 145 135 121 120 105 130 119 106 90 103 110
Injury 11,044 10,827 10,696 9,854 8,938 8,969 10,644 14,696 15,539 16,120 16,088 13,194
PDO 37,728 35,408 33,983 32,145 32,039 33,236 40,505 44,062 47,856 45,084 43,525 42,149

Section 4 Traffic Collisions
38
In 2015, there are 12,017 victims from 41,548 collisions involving 61,711 vehicles and 59,716 drivers. Of the 41,548 collisions:
69 are fatal collisions involving 106 vehicles and 103 drivers, resulting in 78 people killed and 48 people injured;
9,127 are injury collisions involving 16,184 vehicles and 16,088 drivers, resulting in 11,891 people injured; and,
32,352 are PDO collisions involving 45,421 vehicles and 43,525 drivers. Total collisions in 2015 are up 2% compared to 2014 and by 14% compared to the number of collisions in the previous five year (2010 to 2014) annual average.
Fatal collisions increased by 8% compared to 2014 but decreased by 12% compared to the previous five years.
Injury collisions increased by 1% compared to 2014 and by 21% compared to the previous five years.
PDO collisions increased by 2% compared to 2014 and by 12% compared to the previous five years.
The total number of collision victims in 2015 increased by 3% compared to 2014 and by 23% compared to the previous five year (2010 to 2014) annual average. The number of people killed in collisions in 2015 increased by 15% compared to 2014, but decreased by 13% compared to the previous five years. While the number of people killed in fatal collisions had been on a decline since 2011, in 2015 that number increased to 78 from 68 (in 2014). The total number of drivers involved in collisions in 2015 is down 3% compared to 2014 but is up 8% compared to the previous five year (2010 to 2014) annual average. The number of vehicles involved in collisions in 2015 is down 1% from 2014, but up 8% compared to the previous five years.
Figure 4-1 Historical Summary – Count of Traffic Collisions, Victims, Vehicles and Drivers
0
10,000
20,000
30,000
40,000
50,000
60,000
70,000
2005 2006 2007 2008 2009 2010 2011 2012 2013 2014 2015
Co
un
t
Historical Summary of Traffic Collisions 2005 - 2015
Total Collisions Total Victims Total Vehicles Involved Total Drivers Involved

Section 4 Traffic Collisions
39
Table 4-2 Traffic Collisions by Month of Occurrence and Collision Severity
Table 4-2
Traffic Collisions by Month of Occurrence and Collision Severity: 2015, 2010-2014 Average
Month
2015 Collision Severity
2015 Total
% of 2015 Total
2010-2014 Average Count of Collisions
Fatal % of Total Fatal
Injury % of Total Injury
PDO % of Total PDO
Fatal Injury PDO Total % of Total
January 3 4.3% 1,015 11.1% 3,440 10.6% 4,458 10.7% 5 894 3,589 4,488 12.3%
February 2 2.9% 950 10.4% 3,105 9.6% 4,057 9.8% 5 657 2,546 3,207 8.8%
March 3 4.3% 674 7.4% 2,427 7.5% 3,104 7.5% 3 644 2,387 3,034 8.3%
April 4 5.8% 580 6.4% 2,024 6.3% 2,608 6.3% 6 457 1,700 2,163 5.9%
May 6 8.7% 649 7.1% 2,134 6.6% 2,789 6.7% 6 507 1,721 2,235 6.1%
June 3 4.3% 657 7.2% 2,254 7.0% 2,914 7.0% 9 505 1,881 2,396 6.5%
July 7 10.1% 590 6.5% 2,247 6.9% 2,844 6.8% 10 501 1,769 2,280 6.2%
August 6 8.7% 651 7.1% 2,174 6.7% 2,831 6.8% 8 514 1,696 2,218 6.1%
September 11 15.9% 681 7.5% 2,425 7.5% 3,117 7.5% 9 563 1,901 2,473 6.8%
October 9 13.0% 774 8.5% 2,663 8.2% 3,446 8.3% 7 647 2,579 3,233 8.8%
November 9 13.0% 869 9.5% 3,568 11.0% 4,446 10.7% 5 826 3,611 4,442 12.1%
December 6 8.7% 1,037 11.4% 3,891 12.0% 4,934 11.9% 6 830 3,583 4,419 12.1%
Total 69 100% 9,127 100% 32,352 100% 41,548 100% 79 7,545 28,963 36,587 100%
Note: Counts of collisions in the 2010-2014 average may not add to the total due to rounding.

Section 4 Traffic Collisions
40
The winter months of January, February and December continue to account for a high proportion of collisions in Manitoba, with one-third (32%) of all collisions happening in these months in 2015. In the previous five year period (2010 to 2014), these months also accounted for an average of one-third (33%) of all collisions. In 2015, January, February and December (combined), account for:
16% of all fatal collisions;
33% of all injury collisions; and,
32% of all PDO collisions. Fatal collisions in 2015 occur most often in September, October, and November (42% of fatal crashes combined), compared to 27% in 2010 to 2014. The spring months of March, April and May account for the same proportion of fatal collisions relative to the previous five years (2015 – 19% of fatal crashes; 2010-2014 annual average – 19% of fatal crashes).
Figure 4-2 Traffic Collisions by Month of Occurrence and Collision Severity
In 2015, injury collisions and PDO collisions occur most frequently in the months of November through February (42% of injury collisions and 43% of PDO collisions). In the previous five year period (2010 to 2014), these months account for nearly 43% of injury collisions and 46% of PDO collisions.
0%
5%
10%
15%
20%
Pro
po
rtio
n o
f C
olli
sio
ns
Comparison of Collisions by Month of Occurence 2015
Fatal Injury PDO Total Collisions

Section 4 Traffic Collisions
41
Table 4-3 Traffic Collisions by Day of Occurrence and Collision Severity
Table 4-3
Traffic Collisions by Day of Week of Occurrence and Collision Severity: 2015, 2010-2014 Average
Day of Week
2015 Collision Severity
2015 Total
% of 2015 Total
2010-2014 Average Count of Collisions
Fatal % of Total Fatal
Injury % of Total Injury
PDO % of Total PDO
Fatal Injury PDO Total % of Total
Sunday 6 8.7% 799 8.8% 3,427 10.6% 4,232 10.2% 12 700 3,069 3,781 10.3%
Monday 13 18.8% 1,255 13.8% 4,299 13.3% 5,567 13.4% 10 1,087 4,002 5,100 13.9%
Tuesday 11 15.9% 1,406 15.4% 4,816 14.9% 6,233 15.0% 6 1,167 4,171 5,344 14.6%
Wednesday 9 13.0% 1,508 16.5% 4,960 15.3% 6,477 15.6% 12 1,199 4,360 5,571 15.2%
Thursday 7 10.1% 1,493 16.4% 5,150 15.9% 6,650 16.0% 11 1,185 4,367 5,563 15.2%
Friday 16 23.2% 1,582 17.3% 5,487 17.0% 7,085 17.1% 12 1,280 5,078 6,371 17.4%
Saturday 7 10.1% 1,084 11.9% 4,213 13.0% 5,304 12.8% 15 926 3,916 4,857 13.3%
Total 69 100% 9,127 100% 32,352 100% 41,548 100% 79 7,545 28,963 36,587 100%
Note: Counts of collisions in the 2010-2014 average may not add to the total due to rounding.

Section 4 Traffic Collisions
42
Collisions in 2015 most frequently occur on weekdays, especially on Friday. Monday through Friday combined account for 77% of all collisions, 81% of fatal collisions, 79% of injury collisions and 76% of PDO collisions. In the previous five year (2010 to 2014) annual average, weekdays account for virtually the same proportions (76% of all collisions; 66% fatal; 78% injury; 76% PDO). Overall, Friday accounts for the single largest proportion of collisions in 2015; this is also the case in the previous five year (2010 to 2014) annual average. Friday accounts for:
17% of all collisions in 2015 and in the previous five years;
23% of fatal collisions in 2015 and 16% in the previous five years;
17% of injury collisions in 2015 and in the previous five years; and,
17% of PDO collisions in 2015 and nearly 18% in the previous five years. Weekends, including Friday, Saturday and Sunday combined, account for:
40% of all collisions in 2015 and 41% in the previous five years (2010 to 2014);
42% of fatal collisions in 2015 and 50% in the previous five years;
38% of injury collisions in 2015 and nearly 39% in the previous five years; and,
41% of PDO collisions in 2015 and 42% in the previous five years.
Figure 4-3 Traffic Collisions by Day of Occurrence and Collision Severity
In 2015, fatal collisions occur most often on Friday (count of 16 or 23% of fatal collisions). In the previous five year (2010 to 2014) annual average, Saturdays account for the highest number of fatal crashes (15), but are closely followed by Fridays (12), Wednesdays (12), Sundays (12) and Thursdays (11).
0%
5%
10%
15%
20%
25%
Sunday Monday Tuesday Wednesday Thursday Friday Saturday
Pro
po
rtio
n o
f C
olli
sio
ns
Comparison of Collisions by Day of Occurrence 2015
Fatal Injury PDO Total Collisions

Section 4 Traffic Collisions
43
Table 4-4 Traffic Collisions by Time of Occurrence and Collision Severity
Table 4-4
Traffic Collisions by Time of Occurrence and Collision Severity: 2015, 2010-2014 Average
Time
2015 Collision Severity
2015 Total
% of 2015 Total
2010-2014 Average Count of Collisions
Fatal % of Total Fatal
Injury % of Total Injury
PDO % of Total PDO
Fatal Injury PDO Total % of Total
00:00 - 02:59 0 - 190 2.1% 1021 3.2% 1,211 2.9% 7 186 888 1,080 3.0%
03:00 - 05:59 1 1.4% 120 1.3% 768 2.4% 889 2.1% 7 133 727 868 2.4%
06:00 - 08:59 9 13.0% 1,239 13.6% 4,378 13.5% 5,626 13.5% 6 997 3,625 4,628 12.6%
09:00 - 11:59 13 18.8% 1,278 14.0% 4,477 13.8% 5,768 13.9% 8 1,046 3,838 4,892 13.4%
12:00 - 14:59 6 8.7% 1,781 19.5% 5,589 17.3% 7,376 17.8% 11 1,480 5,028 6,518 17.8%
15:00 - 17:59 9 13.0% 2,648 29.0% 7,502 23.2% 10,159 24.5% 11 2,097 6,823 8,931 24.4%
18:00 - 20:59 10 14.5% 1,225 13.4% 4,738 14.6% 5,973 14.4% 12 966 4,365 5,343 14.6%
21:00 - 23:59 13 18.8% 620 6.8% 3,696 11.4% 4,329 10.4% 11 534 3,264 3,809 10.4%
Not Stated 8 11.6% 26 0.3% 183 0.6% 217 0.5% 7 105 407 519 1.4%
Total 69 100% 9,127 100% 32,352 100% 41,548 100% 79 7,545 28,963 36,587 100%
Note: Counts of collisions in the 2010-2014 average may not add to the total due to rounding.
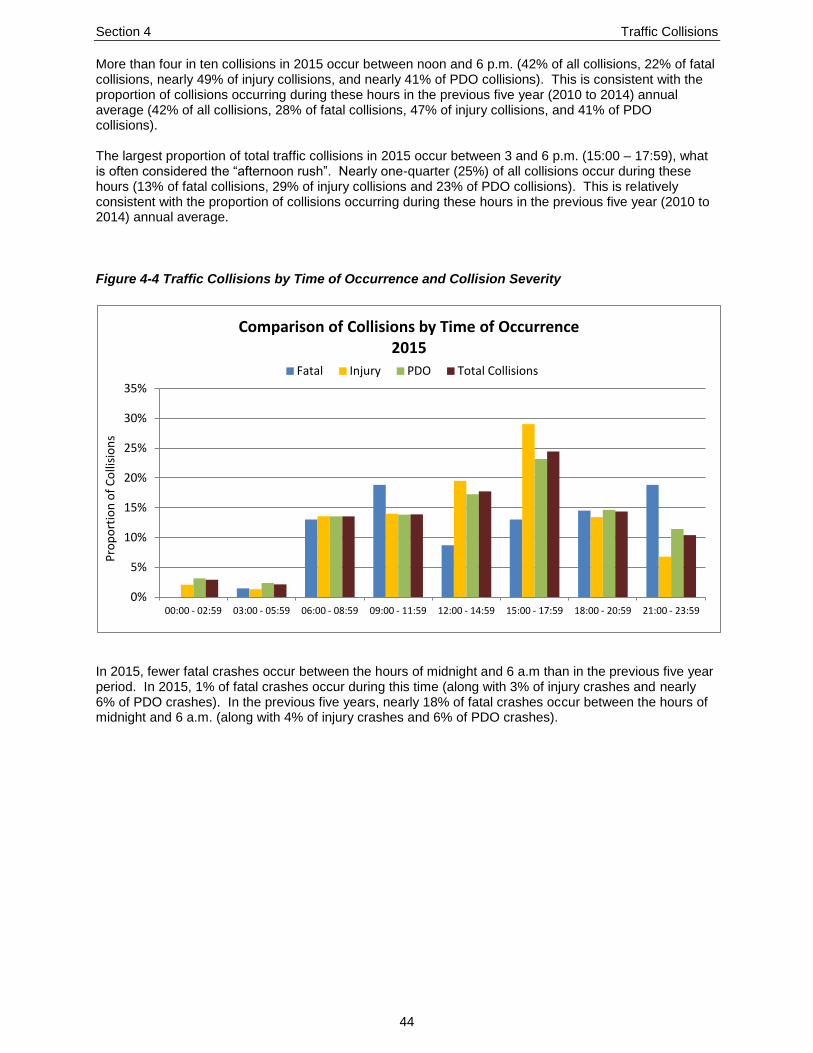
Section 4 Traffic Collisions
44
More than four in ten collisions in 2015 occur between noon and 6 p.m. (42% of all collisions, 22% of fatal collisions, nearly 49% of injury collisions, and nearly 41% of PDO collisions). This is consistent with the proportion of collisions occurring during these hours in the previous five year (2010 to 2014) annual average (42% of all collisions, 28% of fatal collisions, 47% of injury collisions, and 41% of PDO collisions). The largest proportion of total traffic collisions in 2015 occur between 3 and 6 p.m. (15:00 – 17:59), what is often considered the “afternoon rush”. Nearly one-quarter (25%) of all collisions occur during these hours (13% of fatal collisions, 29% of injury collisions and 23% of PDO collisions). This is relatively consistent with the proportion of collisions occurring during these hours in the previous five year (2010 to 2014) annual average.
Figure 4-4 Traffic Collisions by Time of Occurrence and Collision Severity
In 2015, fewer fatal crashes occur between the hours of midnight and 6 a.m than in the previous five year period. In 2015, 1% of fatal crashes occur during this time (along with 3% of injury crashes and nearly 6% of PDO crashes). In the previous five years, nearly 18% of fatal crashes occur between the hours of midnight and 6 a.m. (along with 4% of injury crashes and 6% of PDO crashes).
0%
5%
10%
15%
20%
25%
30%
35%
00:00 - 02:59 03:00 - 05:59 06:00 - 08:59 09:00 - 11:59 12:00 - 14:59 15:00 - 17:59 18:00 - 20:59 21:00 - 23:59
Pro
po
rtio
n o
f C
olli
sio
ns
Comparison of Collisions by Time of Occurrence 2015
Fatal Injury PDO Total Collisions

Section 4 Traffic Collisions
45
Table 4-5 Traffic Collisions by Provincial Location and Collision Severity
Table 4-5
Traffic Collisions by Provincial Location and Collision Severity: 2015, 2010-2014 Average
Location
2015 Collision Severity 2015 Total
% of 2015 Total
2010-2014 Average Count of Collisions
Fatal % of Total
Fatal Injury
% of Total Injury
PDO % of Total
PDO Fatal Injury PDO Total % of Total
Winnipeg 13 18.8% 7,024 77.0% 19,284 59.6% 26,321 63.4% 15 5,536 17,204 22,755 62.2%
Brandon 0 - 218 2.4% 1,022 3.2% 1,240 3.0% <1 203 1,053 1,257 3.4%
Portage 1 1.4% 45 0.5% 276 0.9% 322 0.8% - 50 271 322 0.9%
Flin Flon 0 - 4 <0.1% 78 0.2% 82 0.2% <1 6 82 89 0.2%
Dauphin 0 - 33 0.4% 157 0.5% 190 0.5% 1 31 162 193 0.5%
Thompson 0 - 31 0.3% 218 0.7% 249 0.6% <1 29 211 241 0.7%
The Pas 0 - 17 0.2% 134 0.4% 151 0.4% <1 15 130 145 0.4%
Selkirk 0 - 67 0.7% 237 0.7% 304 0.7% <1 57 239 297 0.8%
Other Urban 8 11.6% 520 5.7% 3,995 12.3% 4,523 10.9% 9 517 3,527 4,054 11.1%
All Rural 47 68.1% 1,168 12.8% 6,951 21.5% 8,166 19.7% 51 1,100 6,084 7,236 19.8%
Total 69 100% 9,127 100% 32,352 100% 41,548 100% 79 7,545 28,963 36,587 100%
Note: Counts of collisions in the 2010-2014 average may not add to the total due to rounding.

Section 4 Traffic Collisions
46
Urban locations account for four of five (80%) collisions in Manitoba, but only one-third of fatal collisions (32%) in 2015 (87% of injury collisions and nearly 79% of PDO collisions). Rural locations account for one-fifth of all collisions (20%), but more than two-thirds of fatal collisions (68%). This is consistent with historical results. In the previous five year period (2010 to 2014), urban locations accounted for an average of 80% of all collisions, one-third (32%) of fatal collisions, 85% of injury collisions, and 79% of PDO collisions. In 2015, 63% of traffic collisions occur in Winnipeg while other urban locations (including Brandon, Portage, Flin Flon, Dauphin, Thompson, The Pas, Selkirk and “Other urban”) account for 17% of all collisions. In the previous five year (2010 to 2014) annual average, 62% of all collisions occur in Winnipeg and 18% occur in other urban locations. This pattern holds when we consider both injury and PDO collisions. In 2015:
77% of injury collisions occur in Winnipeg, 10% occur in other urban locations and 13% occur in rural locations.
60% of PDO collisions occur in Winnipeg, 19% occur in other urban locations and nearly 22% occur in rural locations.
Fatal collisions are different from the distribution of total crashes when it comes to the urban-rural split. In 2015, more than two-thirds of fatal collisions (68%) occur in rural locations, while 19% occur in Winnipeg and 13% occur in other urban locations. The over-representation of rural locations for fatal collisions in 2015 is consistent with the previous five year (2010 to 2014) annual average, where 65% of fatal collisions occur in rural locations, 19% occur in Winnipeg and nearly 17% occur in other urban locations.

Section 4 Traffic Collisions
47
Table 4-6 Collision Type by Urban/Rural Location
Table 4-6
Collision Type by Urban/Rural Location: 2015, 2010-2014 Average
Collision Type
Location 2010-2014 Average Count of Total Collisions
2015 Urban 2015 Rural 2015 Provincial Total 2015 Provincial Total as
% of Total
Fatal Injury PDO Total Fatal Injury PDO Total Fatal Injury PDO Total Fatal Injury PDO Total % of Total
Collision with pedestrian
1 37 61 99 0 0 1 1 1 37 62 100 0.2% 8 153 32 193 0.5%
Collision with other motor vehicle
12 7,021 18,404 25,437 32 451 760 1,243 44 7,472 19,164 26,680 64.2% 30 5,666 17,412 23,108 63.2%
Collisions with train
0 2 3 5 1 0 0 1 1 2 3 6 <0.1% <1 2 7 10 <0.1%
Collision with motorcycle
1 6 3 10 0 3 0 3 1 9 3 13 <0.1% 2 44 21 67 0.2%
Collision with animal drawn vehicle
0 0 0 0 0 0 0 0 0 0 0 0 - - - - - <0.1%
Collision with bicycle
0 6 61 67 0 0 4 4 0 6 65 71 0.2% 3 99 37 139 0.4%
Collision with animal
0 55 991 1,046 1 233 4,599 4,833 1 288 5,590 5,879 14.1% <1 219 4,526 4,745 13.0%
Collision with fixed object
7 392 3,596 3,995 11 369 1,031 1,411 18 761 4,627 5,406 13.0% 10 597 3,806 4,413 12.1%
Collision with other object
0 390 2,132 2,522 2 82 475 559 2 472 2,607 3,081 7.4% 6 398 2,300 2,704 7.4%
Overturned in roadway
0 5 5 10 0 4 5 9 0 9 10 19 <0.1% 3 62 91 156 0.4%
Ran off roadway 1 6 14 21 0 9 8 17 1 15 22 38 <0.1% 16 209 417 641 1.8%
Collision with moped
0 0 2 2 0 0 1 1 0 0 3 3 <0.1% - <1 1 1 <0.1%
Other non-collision
0 39 129 168 0 17 67 84 0 56 196 252 0.6% <1 74 314 388 1.1%
Total 22 7,959 25,401 33,382 47 1,168 6,951 8,166 69 9,127 32,352 41,548 100% 79 7,524 28,963 36,566 100%
Note: Counts of collisions in the 2010-2014 average may not add to the total due to rounding.

Section 4 Traffic Collisions
48
The majority of crashes on public roadways in Manitoba are “motor vehicle to motor vehicle” collisions, both in 2015 and in the previous five year (2010 to 2014) annual average. In 2015, “motor vehicle to motor vehicle” collisions account for:
64% of all collisions;
64% of fatal collisions;
82% of injury collisions; and,
59% of PDO collisions. Collisions occurring in urban locations are also predominantly “motor vehicle to motor vehicle” in nature. In urban locations in 2015, “motor vehicle to motor vehicle” collisions account for:
76% of all collisions;
Nearly 55% of fatal collisions;
88% of injury collisions; and,
Nearly 73% of PDO collisions. Collisions occurring in rural locations are predominantly “motor vehicle to animal” in nature, with “motor vehicle to fixed object” the second most common configuration, and “motor vehicle to motor vehicle” as the third most common. In rural locations in 2015:
59% of all collisions are “motor vehicle to animal” in nature (2% of fatal collisions; 20% of injury collisions; and 66% of PDO collisions);
17% of all collisions are “motor vehicle to fixed object” in nature (23% of fatal collisions; 32% of injury collisions; and 15% of PDO collisions); and,
15% of all collisions are “motor vehicle to motor vehicle” in nature (68% of fatal collisions; 39% of injury collisions; and 11% of PDO collisions).
Collisions with pedestrians (accounting for less than half a percent of all collisions in 2015) account for a high proportion of fatal collisions occurring in urban locations. In 2015, 1% of fatal collisions in the province were “motor vehicle to pedestrian”; but in urban locations, nearly 5% of fatal collisions involve a motor vehicle hitting a pedestrian.

Section 4 Traffic Collisions
49
Table 4-7 Traffic Collisions by Road Surface Condition and Collision Severity
Table 4-7
Traffic Collisions by Road Surface Condition and Collision Severity: 2015, 2010-2014 Average
Road Surface Condition
2015 Collision Severity
2015 Total
% of 2015 Total
2010-2014 Average Count of Collisions
Fatal % of Total Fatal
Injury % of Total Injury
PDO % of Total PDO
Fatal Injury PDO Total % of Total
Dry 42 60.9% 5,224 57.2% 17,943 55.5% 23,209 55.9% 53 3,979 14,724 18,756 51.3%
Wet 2 2.9% 1,069 11.7% 3,366 10.4% 4,437 10.7% 7 821 2,666 3,493 9.5%
Mud 0 - 5 <0.1% 76 0.2% 81 0.2% - 7 63 70 0.2%
Snow 5 7.2% 765 8.4% 3,602 11.1% 4,372 10.5% 4 668 3,456 4,128 11.3%
Ice 5 7.2% 1,519 16.6% 5,295 16.4% 6,819 16.4% 7 1,609 6,324 7,940 21.7%
Slush 0 - 202 2.2% 568 1.8% 770 1.9% <1 178 532 710 1.9%
Loose Sand/ Gravel/ Dirt
5 7.2% 80 0.9% 219 0.7% 304 0.7% 2 70 253 325 0.9%
Fresh Oil 0 - 2 <0.1% 7 <0.1% 9 <0.1% - 4 12 16 <0.1%
Other 0 - 18 0.2% 99 0.3% 117 0.3% <1 13 88 101 0.3%
Not Applicable 0 - 124 1.4% 343 1.1% 467 1.1% 2 133 520 656 1.8%
Unknown 10 14.5% 119 1.3% 834 2.6% 963 2.3% 2 62 327 391 1.1%
Total 69 100% 9,127 100% 32,352 100% 41,548 100% 79 7,542 28,963 36,584 100%
Note: Counts of collisions in the 2010-2014 average may not add to the total due to rounding.

Section 4 Traffic Collisions
50
The collisions in Manitoba occur most often under “dry” road conditions. More than half (56%) of all collisions in 2015 and 51% in the previous five year (2010 to 2014) annual average occur on “dry” roads. In 2015, 61% of fatal collisions occur on “dry” roads. This is relatively consistent with the previous five year (2010 to 2014) annual average where more than two-thirds of fatal collisions (nearly 68%) occur on “dry” roads. Icy road conditions account for 16% of all collisions in 2015, including 7% of fatal collisions, 17% of injury collisions and 16% of PDO collisions. This is similar to the previous five year (2010 to 2014) annual average where icy roads account for 22% of all collisions, 9% of fatal collisions, 21% of injury collisions and 22% of PDO collisions. “Snow” covered and “wet” roads account for the next highest proportions of all collisions in 2015, at nearly 11% and 11% respectively. These proportions are similar to the previous five year (2010 to 2014) annual average (11% and nearly 10% respectively).
Figure 4-5 Traffic Collisions by Road Surface Condition and Collision Severity
0%
20%
40%
60%
80%
Dry Wet Snow Ice Slush Loose Sand/ Gravel/ Dirt
Pro
po
tio
n o
f C
olli
sio
ns
Proportion of Collisions by Road Surface Condition and Collision Severity: 2015
Fatal Injury PDO Total Collisions

Section 4 Traffic Collisions
51
Table 4-8 Traffic Collisions by Weather Condition and Collision Severity
Table 4-8
Traffic Collisions by Weather Condition and Collision Severity: 2015, 2010-2014 Average
Weather Condition
2015 Collision Severity
2015 Total
% of 2015 Total
2010-2014 Average Count of Collisions
Fatal % of Total Fatal
Injury % of Total Injury
PDO % of Total PDO
Fatal Injury PDO Total % of Total
Clear 47 68.1% 6,082 66.6% 21,045 65.1% 27,174 65.4% 54 5,102 19,011 24,168 66.1%
Cloudy 6 8.7% 1,274 14.0% 4,235 13.1% 5,515 13.3% 8 1,112 4,195 5,315 14.5%
Raining 0 - 460 5.0% 1,512 4.7% 1,972 4.7% 3 336 1,173 1,513 4.1%
Snowing 0 - 650 7.1% 2,257 7.0% 2,907 7.0% 2 471 2,069 2,542 6.9%
Fog or Mist 1 1.4% 119 1.3% 580 1.8% 700 1.7% 1 72 378 452 1.2%
Smoke or Dust 0 - 25 0.3% 80 0.2% 105 0.3% <1 5 19 24 <0.1%
Freezing Rain/ Sleet/ Hail
0 - 22 0.2% 129 0.4% 151 0.4% <1 40 144 183 0.5%
Drifting Snow 5 7.2% 76 0.8% 349 1.1% 430 1.0% 2 101 433 536 1.5%
Strong Winds 0 - 62 0.7% 253 0.8% 315 0.8% 2 55 219 276 0.8%
Other 0 - 8 <0.1% 58 0.2% 66 0.2% <1 7 56 63 0.2%
Not Applicable 1 1.4% 150 1.6% 507 1.6% 658 1.6% 3 150 666 819 2.2%
Unknown 9 13.0% 199 2.2% 1,347 4.2% 1,555 3.7% 2 90 601 694 1.9%
Total 69 100% 9,127 100% 32,352 100% 41,548 100% 79 7,542 28,963 36,584 100%
Note: Counts of collisions in the 2010-2014 average may not add to the total due to rounding.

Section 4 Traffic Collisions
52
Most collisions in Manitoba occur during “clear” weather conditions. Around two-thirds (65%) of all collisions in 2015 and 66% in the previous five year (2010 to 2014) annual average occur in “clear” weather. This holds for all collisions regardless of severity. Other weather conditions when collisions occur in 2015 include:
“Cloudy” – 13% of all collisions (9% of fatal collisions; 14% of injury collisions; 13% of PDO collisions);
“Snowing” – 7% of all collisions (no fatal collisions; 7% of injury collisions; 7% of PDO collisions); and,
“Raining” – 5% of all collisions (no fatal collisions; 5% of injury collisions; 5% of PDO collisions).
Figure 4-6 Traffic Collisions by Weather Condition and Collision Severity
0%
20%
40%
60%
80%
Clear Cloudy Raining Snowing Fog or Mist Smoke or Dust
Freezing Rain/ Sleet/
Hail
Drifting Snow
Strong Winds
Pro
po
rtio
n o
f C
olli
sio
ns
Comparison of Collisions by Weather Condition 2015
Fatal Injury PDO Total Collisions

Section 4 Traffic Collisions
53
Table 4-9 Accident Configuration and Collision Severity
Table 4-9
Accident Configuration and Collision Severity: 2015, 2010-2014 Average
Accident Configuration
2015 Collision Severity
2015 Total
% of 2015 Total
2010-2014 Average Count of Collisions
Fatal % of Total Fatal
Injury % of Total Injury
PDO % of Total PDO
Fatal Injury PDO Total % of Total
Rear End 4 6.9% 3,951 51.2% 6,362 32.1% 10,317 37.4% 1 2,905 6,138 9,045 35.2%
Head On 17 29.3% 111 1.4% 383 1.9% 511 1.9% 10 175 1,161 1,347 5.2%
Side Swipe Opposing 0 - 51 0.7% 217 1.1% 268 1.0% 1 65 306 372 1.4%
Side Swipe Same Direction 0 - 394 5.1% 2,724 13.7% 3,118 11.3% <1 275 2,295 2,571 10.0%
Overtaking 1 1.7% 23 0.3% 137 0.7% 161 0.6% 1 46 309 356 1.4%
Right Turn - Same direction 0 - 23 0.3% 196 1.0% 219 0.8% - 26 204 230 0.9%
Right Turn - Opposing 0 - 11 0.1% 53 0.3% 64 0.2% - 14 74 88 0.3%
Left Turn - Opposing 0 - 224 2.9% 338 1.7% 562 2.0% <1 167 370 537 2.1%
Left Turn - Same direction 0 - 31 0.4% 145 0.7% 176 0.6% - 38 207 245 1.0%
Left Turn - Across 1 1.7% 165 2.1% 314 1.6% 480 1.7% <1 185 523 709 2.8%
Intersection 90° 12 20.7% 1,820 23.6% 2,878 14.5% 4,710 17.1% 9 1,376 2,992 4,376 17.0%
Off Road Right 7 12.1% 238 3.1% 789 4.0% 1,034 3.7% 9 268 866 1,144 4.4%
Off Road Left 2 3.4% 172 2.2% 539 2.7% 713 2.6% 8 201 586 795 3.1%
Fixed Object 5 8.6% 306 4.0% 3,067 15.5% 3,378 12.2% 3 278 2,489 2,770 10.8%
Parking 0 - 142 1.8% 1,578 8.0% 1,720 6.2% - 82 821 903 3.5%
Pedestrian 9 15.5% 58 0.8% 112 0.6% 179 0.6% 11 168 46 225 0.9%
Other 11 - 1,407 - 12,520 - 13,938 - 23 1,273 9,575 10,872 -
Total 69 100% 9,127 100% 32,352 100% 41,548 100% 79 7,542 28,963 36,584 100%
Note: Counts of collisions in the 2010-2014 average may not add to the total due to rounding. Note: 'Other' accident configurations consist primarily of collisions involving more than one configuration or sequence of events. Calculations in '% of Total' exclude the 'Other' category.

Section 4 Traffic Collisions
54
The most common accident configuration (or sequence of events immediately prior to or at the start of a collision) for collisions occurring in Manitoba (excluding “other”) is a “rear end” type. “Rear end” crashes account for 37% of all collisions in 2015 (7% fatal collision; 51% of injury collisions; 32% of PDO collisions) and 35% of all collisions in the previous five year (2010 to 2014) annual average. Following “rear end” collisions, the next most common accident configurations in 2015 (excluding “other”) are:
Collisions occurring at “intersection 90°” – 17% of all collisions, 21% of fatal collisions, 24% of injury collisions, and nearly 15% of PDO collisions;
“Fixed object” collisions – 12% of all collisions, 9% fatal collisions, 4% of injury collisions, and nearly 16% of PDO collisions;
“Side-swipe” collisions, including in the same or opposing direction – 12% of all collisions, no fatal collision, 6% of injury collisions, and 15% of PDO collisions;
Collisions where the vehicle leaves the road (either “off road left” or “off road right”) – 6% of all collisions, nearly 16% of fatal collisions, 5% of injury collisions, and 7% of PDO collisions;
Collisions where at least one vehicle is turning (both “left turn” or “right turn” and including in the “same direction” or “opposing” direction or “across”) – 5% of all collisions, one fatal collision, 6% of injury collisions, and 5% of PDO collisions; and,
“Head on” collisions – 2% of all collisions, 29% of fatal collisions, 1% of injury collisions, and 2% of PDO collisions.
A large proportion of collisions cannot be assigned a single accident configuration or sequence of events. That is, they involve more than one of the possible configuration types. These collisions fall into the “other” category. In 2015, nearly 34% of all collisions (16% fatal; 15% injury; 39% PDO) are recorded as “other”. In the previous five year (2010 to 2014) annual average, 30% of all collisions (30% fatal; 17% injury; 33% PDO) are recorded as “other”.
Figure 4-7 Distribution of Collisions by Accident Configuration and Collision Severity
“Head on” collisions are the highest proportion of fatal collisions in 2015 (29%), followed by collisions occurring at intersections (“intersection 90°” - 21%), collisions as a result of the vehicle leaving the road (“off-road left or right” - nearly 16%), and “pedestrian” collisions (nearly 16%).
0%
10%
20%
30%
40%
50%
60%
Rear End Head On Side Swipe Overtaking Turning Intersection 90°
Off-Road Fixed Object Parking Pedestrian
Pro
po
rtio
n o
f C
olli
sio
ns
Distribution of Collisions by Accident Configuration1
2015 Fatal Injury PDO Total Collisions
1Excludes “other” category, defined as collisions with more than one configuration or sequence of events.

SECTION 5 – Collision Victims


Section 5 Collision Victims
57
Introduction
This section counts the number of people killed and injured in traffic collisions and examines the severity of the injury received by the victim. Month, time and day of occurrences are examined, as well as the age of the victim. Other characteristics of the collision are presented as well. Relative involvement of victims in traffic collisions per 100,000 people in the general population is also calculated. Key Highlights In 2015, there are 12,017 victims (or casualties) of traffic collisions. Of these:
78 are killed;
415 are seriously injured;
1,947 sustain minor injuries;
9,014 sustain minimal injuries; and,
563 sustain injuries that are undefined in terms of severity. The victim involvement rate (per 100,000 people in the general population) in traffic collisions in 2015 (910.1) has increased by 2% compared to 2014 (893.8) and by 18% compared to the previous five years (2010 to 2014) annual average (769.4). Victim involvement rates in traffic collisions in 2015 where the person:
Is killed (5.9 in 2015) is nearly 14% higher than in 2014, but 16% lower than in the previous five years; and,
Is injured, including all levels of severity (but excluding killed; 904.2 in 2015), is 2% higher than in 2014 and 19% higher than in the previous five years.
People aged 35 to 44 have the highest victim involvement rates (per 100,000 people) overall in 2015.
Children under age 15 – rate of 189.9
People aged 15 to 24 – rate of 1,125.4
People aged 25 to 34 – rate of 1,277.2
People aged 35 to 44 – rate of 1,313.1
People aged 45 to 54 – rate of 1,219.3
People aged 55 and older – rate of 677.9 While women account for more than half of all casualties in traffic collisions (60%), men account for the highest proportion of people killed (69%). Men also account for more of the people seriously injured (51% compared to 49% women). “Drivers” account for 77% of all casualties while motor vehicle “Passengers” for nearly 21%. “Motorcyclists” and “Moped” riders (combined) account for just over 1% of all casualties while “Bicyclists” account for less than half a percent and “Pedestrians” account for 1%. In 2015, “Pedestrians” account for nearly 12% of people killed in traffic collisions. In 2015, casualties in traffic collisions most frequently result from crashes occurring:
In Winnipeg – 76% of all victims;
In the late fall, winter and early spring months (including October through March) – 57% of all victims; 50% of people killed and 57% of people injured;
On Wednesday (16%), Thursday (16%), or Friday (17%); and,
Between noon and 6 p.m. (12:00-14:59 – 20% of all victims; 15:00 to 17:59 – 29% of all victims). Major Elements Examined Counts of collisions in Manitoba for 2015 and previous years are taken from Traffic Accident Reports (TARs) generated by Manitoba Public Insurance and law enforcement agencies, and compiled by Manitoba Public Insurance. It is important to note that the number of victims involved in traffic collisions is not equal to the number of collisions that occurred as each collision can result in multiple victims while some collisions result in property damage only (PDO). PDO collisions are not included in this section.

Section 5 Collision Victims
58
The terms ‘crash’, ‘collision’ and ‘accident’ are used interchangeably in this report. As well, the terms ‘victim’ and ‘casualty’, and the terms ‘fatality’ and ‘killed’ are used interchangeably in this report. Due to the small numbers of fatal collisions, fluctuations year-over-year could be dramatic; a small change in the total count of these types of collisions could have a significant effect on statistics such as percentage change to previous years and relative involvement rates. Therefore, the reader is strongly cautioned when interpreting results regarding fatal collisions. The reader is cautioned that not all percentages and calculations in the following tables will add to 100% of the total noted. Rounding error will often produce a difference of one or two percentage points. Likewise, average calculations are presented for historical data from the years 2010 to 2014. Rounding error in these calculations will cause individual average counts not to add to total average counts in some cases. Terms and Definitions “Casualty Type”
A classification of the severity of the injury sustained by a victim in a traffic collision, i.e., whether someone was killed or injured. This classification also includes a designation for the severity of each non-fatal injury sustained (i.e., victims sustaining a serious/major, minor or minimal injury).
“Killed”
The casualty type “killed” indicates where the victim involved in the traffic collision died as a result of their injuries within thirty (30) days of the collision occurrence.
“Injured”
The casualty type “injured” indicates where the victim sustained some level of personal injury, but in which they were not killed. Levels of injury include: ‘serious’ or ‘major’ (admitted to hospital); ‘minor’ (treated and released from hospital); and, ‘minimal’ (no hospital treatment required). ‘Other’ injury is noted when the severity of the victim’s injury is not known or recorded in the TAR.
“Road User Class”
A classification based on how a person involved in a collision was using the road at the time of the collision. It includes: Drivers (of motor vehicles), Passengers (in motor vehicles), those Riding/Hanging On (to a motor vehicle), Motorcyclist (drivers and passengers), Moped (drivers and passengers), Bicyclist (drivers and passengers), and Pedestrians.
“Vehicle Occupant”
All those in the “Road User Class” recorded as “Drivers” and “Passengers”. It excludes “Motorcyclist”, “Bicyclist”, “Moped”, those “Riding/Hanging On” to a vehicle, and “Pedestrians”.
“Victim Involvement Rate”
A calculation of the number of victims or casualties involved in traffic collisions for every 100,000 people in the general population in Manitoba. Population statistics are taken from the Provincial government and can be found at the following web address: http://www.gov.mb.ca/health/annstats/index.html
“Collision Type”
Refers to the object struck by a motor vehicle during a collision (including: a pedestrian, another motor vehicle, a train, a motorcycle, a bicycle, an animal, and fixed objects) or to what happened to the vehicle in a single-vehicle collision (including: overturned on roadway and ran off roadway).
“Accident Configuration”
Briefly describes the action taken by a vehicle immediately prior to or at the start of the collision, including such events as rear-ending another vehicle, side-swiping another vehicle, turning into (the path of) another vehicle, parking, meeting another vehicle at an intersection and/or leaving the roadway.
“Other” in terms of accident configuration includes, primarily, collisions involving more than one configuration or sequence of events.

Section 5 Collision Victims
59
Table 5-1 Historical Summary of Victims in Traffic Collisions
Table 5-1
Historical Summary of Victims in Traffic Collisions: 2005 to 2015
Year
Casualty Type
Total Victims
% change
to previous
year
Killed
% change
to previous
year
Serious Injury
% change
to previous
year
Minor Injury
% change
to previous
year
Minimal Injury
% change
to previous
year
Other Injury
% change
to previous
year
Total Injured
% change
to previous
year
2005 113 - 421 - 3,345 - 3,924 - 950 - 8,640 - 8,753 -
2006 119 5.3% 484 15.0% 3,458 3.4% 3,945 0.5% 819 -13.8% 8,706 0.8% 8,825 0.8%
2007 109 -8.4% 426 -12.0% 3,198 -7.5% 3,994 1.2% 905 10.5% 8,523 -2.1% 8,632 -2.2%
2008 92 -15.6% 396 -7.0% 2,968 -7.2% 3,678 -7.9% 790 -12.7% 7,832 -8.1% 7,924 -8.2%
2009 86 -6.5% 384 -3.0% 2,853 -3.9% 3,288 -10.6% 691 -12.5% 7,216 -7.9% 7,302 -7.8%
2010 87 1.2% 312 -18.8% 2,458 -13.8% 3,170 -3.6% 1,103 59.6% 7,043 -2.4% 7,130 -2.4%
2011 110 26.4% 337 8.0% 2,465 0.3% 4,306 35.8% 1,119 1.5% 8,227 16.8% 8,337 16.9%
2012 96 -12.7% 339 0.6% 2,237 -9.2% 7,864 82.6% 87 -92.2% 10,527 28.0% 10,623 27.4%
2013 85 -11.5% 307 -9.4% 2,242 0.2% 8,488 7.9% 112 28.7% 11,149 5.9% 11,234 5.8%
2014 68 -20.0% 303 -1.3% 2,009 -10.4% 9,201 8.4% 95 -15.2% 11,608 4.1% 11,676 3.9%
2015 78 14.7% 415 37.0% 1,947 -3.1% 9,014 -2.0% 563 492.6% 11,939 2.9% 12,017 2.9%
2010-2014 Average* 89 -3.3% 320 -4.2% 2,282 -6.6% 6,606 26.2% 503 -3.5% 9,711 10.5% 9,800 10.3%
*The '% change to previous year' for '2010-2014 Average' is an average rate of change for the time period 2010 to 2014.

Section 5 Collision Victims
60
In 2015, there are 12,017 victims (or casualties) of traffic collisions. Of these:
78 are killed;
415 are seriously injured;
1,947 sustain minor injuries;
9,014 sustain minimal injuries; and,
563 sustain injuries that are undefined in terms of severity. Overall, the total number of casualties in 2015 (12,017) is 3% higher than in 2014 (11,676). This increase is primarily due to increases in the number of people with undefined injuries. In 2015, there are 10 more people killed than in 2014, 112 more people seriously injured, 62 fewer people with minor injuries, 187 fewer people with minimal injuries, and 468 more people with other or undefined injuries. Compared to the previous five year (2010 to 2014) annual average, in 2015:
The number of people killed is down 13%;
The number of people seriously injured is up 30%;
The number of people sustaining minor injuries is down 15%;
The number of people sustaining minimal injuries is up nearly 37%; and,
The number of people sustaining “other” injuries is up 12%.

Section 5 Collision Victims
61
Table 5-2 Historical Summary of Victim Involvement Rate (per 100,000 People) in Traffic Collisions
Table 5-2
Historical Summary of Victim Involvement Rate (per 100,000 People) in Traffic Collisions: 2005 to 2015
Year
Casualty Type
Total Victims
% change
to previous
year
Killed
% change
to previous
year
Serious Injury
% change
to previous
year
Minor Injury
% change
to previous
year
Minimal Injury
% change
to previous
year
Other Injury
% change
to previous
year
Total Injured
% change
to previous
year
2005 9.6 - 35.9 - 285.0 - 334.3 - 80.9 - 736.1 - 745.7 -
2006 10.1 4.9% 41.1 14.5% 293.4 3.0% 334.8 0.1% 69.5 -14.1% 738.8 0.4% 748.9 0.4%
2007 9.2 -9.0% 35.9 -12.6% 269.6 -8.1% 336.7 0.6% 76.3 9.8% 718.4 -2.8% 727.6 -2.8%
2008 7.7 -16.5% 33.0 -8.0% 247.5 -8.2% 306.8 -8.9% 65.9 -13.6% 653.2 -9.1% 660.9 -9.2%
2009 7.1 -7.7% 31.6 -4.3% 234.9 -5.1% 270.8 -11.7% 56.9 -13.6% 594.2 -9.0% 601.3 -9.0%
2010 7.1 -0.1% 25.4 -19.8% 199.8 -15.0% 257.7 -4.8% 89.7 57.6% 572.5 -3.7% 579.5 -3.6%
2011 8.8 24.4% 26.9 6.3% 197.1 -1.3% 344.3 33.6% 89.5 -0.2% 657.9 14.9% 666.7 15.0%
2012 7.6 -14.2% 26.7 -1.1% 175.9 -10.7% 618.5 79.6% 6.8 -92.4% 828.0 25.9% 835.5 25.3%
2013 6.6 -12.7% 23.8 -10.7% 173.9 -1.2% 658.4 6.4% 8.7 27.0% 864.8 4.4% 871.3 4.3%
2014 5.2 -21.0% 23.2 -2.6% 153.8 -11.6% 704.4 7.0% 7.3 -16.3% 888.6 2.8% 893.8 2.6%
2015 5.9 13.5% 31.4 35.5% 147.5 -4.1% 682.7 -3.1% 42.6 486.3% 904.2 1.8% 910.1 1.8%
2010-2014 Average* 7.0 -4.7% 25.2 -5.6% 180.1 -8.0% 516.7 24.4% 40.4 -4.9% 762.3 8.9% 769.4 8.7%
*The '% change to previous year' for '2010-2014 Average' is an average rate of change for the time period 2010 to 2014.

Section 5 Collision Victims
62
Recognizing that counts of victims of collisions could be impacted either positively or negatively by changing population statistics, involvement rates per 100,000 people in the general population in Manitoba is examined (see Table 5-2) to provide a standardized rate comparison. This accounts for changing population size instead of simply a raw count of the number of victims involved overall. The victim involvement rate (per 100,000 people in the general population) in traffic collisions in 2015 (910.1) has increased by 2% compared to 2014 (893.8) and by 18% compared to the previous five years (2010 to 2014 – 769.4) on average. Casualty involvement rates in traffic collisions in 2015 where a person:
Is killed (5.9 in 2015) increased by nearly 14% compared to 2014, but decreased by 16% compared to the previous five years;
Is injured, including all levels of severity (but excluding killed; 904.2 in 2015), increased by 2% compared to 2014 and by 19% compared to the previous five years;
Is seriously injured (31.4 in 2015) increased by nearly 36% compared to 2014 and by 25% compared to the previous five years;
Sustains minor injuries (147.5 in 2015) decreased by 4% compared to 2014 and by 18% compared to the previous five years;
Sustains minimal injuries (682.7 in 2015) decreased by 3% compared to 2014, but increased by 32% compared to the previous five years; and,
Sustains injuries that are unspecified in severity (“other injury”; 42.6 in 2015) is nearly six times the rate in 2014 and increased by 6% compared to the previous five years.
Figure 5-1 Historical Summary of Victim Involvement Rate in Traffic Collisions
5.0
6.0
7.0
8.0
9.0
10.0
11.0
500.0
600.0
700.0
800.0
900.0
1,000.0
1,100.0
2005 2006 2007 2008 2009 2010 2011 2012 2013 2014 2015
Cas
ual
ty R
ate
for
Kill
ed
Cas
ual
ty R
ate
for
Inju
red
Victim Involvement Rate (per 100,000 People) in Traffic Collisions: 2005 - 2015
Injured Killed

Section 5 Collision Victims
63
Table 5-3 Collision Victims by Month of Occurrence and Casualty Type
Table 5-3
Collision Victims by Month of Occurrence and Casualty Type: 2015
Month of Occurrence
2015 Casualty Type
2015 Total
Victims
% of 2015 Total
Victims Killed
% of Total Killed
Serious Injury
% of Total
Serious Injury
Minor Injury
% of Total Minor Injury
Minimal Injury
% of Total Minimal Injury
Other Injury
% of Total Other Injury
Total Injured
% of Total
Injured
January 5 6.4% 23 5.5% 155 8.0% 1,086 12.0% 10 1.8% 1,274 10.7% 1,279 10.6%
February 2 2.6% 30 7.2% 159 8.2% 1,002 11.1% 35 6.2% 1,226 10.3% 1,228 10.2%
March 3 3.8% 21 5.1% 127 6.5% 631 7.0% 66 11.7% 845 7.1% 848 7.1%
April 4 5.1% 24 5.8% 136 7.0% 548 6.1% 34 6.0% 742 6.2% 746 6.2%
May 6 7.7% 31 7.5% 164 8.4% 638 7.1% 30 5.3% 863 7.2% 869 7.2%
June 3 3.8% 29 7.0% 180 9.2% 623 6.9% 47 8.3% 879 7.4% 882 7.3%
July 7 9.0% 27 6.5% 162 8.3% 589 6.5% 40 7.1% 818 6.9% 825 6.9%
August 6 7.7% 36 8.7% 167 8.6% 635 7.0% 44 7.8% 882 7.4% 888 7.4%
September 13 16.7% 42 10.1% 157 8.1% 645 7.2% 56 9.9% 900 7.5% 913 7.6%
October 10 12.8% 56 13.5% 178 9.1% 761 8.4% 44 7.8% 1,039 8.7% 1,049 8.7%
November 13 16.7% 42 10.1% 179 9.2% 839 9.3% 65 11.5% 1,125 9.4% 1,138 9.5%
December 6 7.7% 54 13.0% 183 9.4% 1,017 11.3% 92 16.3% 1,346 11.3% 1,352 11.3%
Total 78 100% 415 100% 1,947 100% 9,014 100% 563 100% 11,939 100% 12,017 100%

Section 5 Collision Victims
64
Table 5-3a Collision Victims by Month of Occurrence and Casualty Type for Previous Five Years
Table 5-3a
Collision Victims by Month of Occurrence and Casualty Type: 2010-2014 Average
Month of Occurrence
2010-2014 Average Count of Victims
Killed Serious Injury
Minor Injury
Minimal Injury
Other Injury
Total Injured
Total Victims
% of Total Victims
January 6 29 234 830 51 1,144 1,150 11.7%
February 6 16 179 589 51 835 841 8.6%
March 3 21 198 568 45 833 836 8.5%
April 6 21 149 369 39 579 584 6.0%
May 8 27 162 420 44 652 659 6.7%
June 10 29 177 418 38 662 672 6.9%
July 12 28 196 398 41 663 675 6.9%
August 9 33 183 424 40 680 689 7.0%
September 9 36 195 462 38 731 740 7.5%
October 9 30 203 552 36 820 829 8.5%
November 6 26 202 775 43 1,047 1,053 10.7%
December 6 24 204 799 38 1,066 1,072 10.9%
Total 89 320 2,282 6,606 503 9,711 9,800 100%
Note: Counts of victims in the 2010-2014 average may not add to the total due to rounding.
Victims in 2015 appear to follow a fairly typical distribution compared to past years in terms of month of
occurrence. The winter months (January, February, and December) stand out as the months accounting
for a disproportionate number of traffic collision victims overall, both in 2015 (32% of all victims) and in the
previous five year (2010 to 2014) annual average (31%). In 2015 (and very similar to the previous five
years), the count of victims is lowest in the late spring and summer months (ranging from 6% to 7% of all
victims in each month from March to August) and is highest in late fall, winter and early spring (ranging
from 9% to 11% of all victims in each month from October to February).

Section 5 Collision Victims
65
Figure 5-2 Proportion of People Killed and Injured by Month of Occurrence
In 2015, September, October, and November account for the highest proportions of people killed (17%, 13%, and 17% of people killed, respectively) by month. This is somewhat different from the previous five year (2010 to 2014) annual average, where the months of June and July account for the highest proportions of deaths.
0%
5%
10%
15%
20%
Pro
po
rtio
n o
f To
tal
Proportion of People Killed and Injured by Month of Occurrence: 2015
Killed Injured Total Victims

Section 5 Collision Victims
66
Table 5-4 Collision Victims by Day of Occurrence and Casualty Type
Table 5-4
Collision Victims by Day of Occurrence and Casualty Type: 2015
Day of the Week
2015 Casualty Type
2015 Total
Victims
% of 2015 Total
Victims Killed
% of Total Killed
Serious Injury
% of Total
Serious Injury
Minor Injury
% of Total Minor Injury
Minimal Injury
% of Total Minimal Injury
Other Injury
% of Total Other Injury
Total Injured
% of Total
Injured
Sunday 7 9.0% 67 16.1% 235 12.1% 763 8.5% 54 9.6% 1,119 9.4% 1,126 9.4%
Monday 17 21.8% 53 12.8% 248 12.7% 1,268 14.1% 81 14.4% 1,650 13.8% 1,667 13.9%
Tuesday 11 14.1% 46 11.1% 293 15.0% 1,343 14.9% 82 14.6% 1,764 14.8% 1,775 14.8%
Wednesday 10 12.8% 70 16.9% 311 16.0% 1,467 16.3% 94 16.7% 1,942 16.3% 1,952 16.2%
Thursday 7 9.0% 62 14.9% 298 15.3% 1,474 16.4% 97 17.2% 1,931 16.2% 1,938 16.1%
Friday 20 25.6% 60 14.5% 312 16.0% 1,598 17.7% 87 15.5% 2,057 17.2% 2,077 17.3%
Saturday 6 7.7% 57 13.7% 250 12.8% 1,101 12.2% 68 12.1% 1,476 12.4% 1,482 12.3%
Total 78 100% 415 100% 1,947 100% 9,014 100% 563 100% 11,939 100% 12,017 100%

Section 5 Collision Victims
67
Table 5-4a Collision Victims by Day of Occurrence and Casualty Type for Previous Five Years
Table 5-4a
Collision Victims by Day of Occurrence and Casualty Type: 2010-2014 Average
Day of the Week
2010-2014 Average Count of Victims
Killed Serious Injury
Minor Injury
Minimal Injury
Other Injury
Total Injured
Total Victims
% of Total Victims
Sunday 14 39 252 621 49 961 975 10.0%
Monday 11 42 322 942 65 1,370 1,381 14.1%
Tuesday 7 41 320 1,029 74 1,463 1,469 15.0%
Wednesday 12 44 327 1,053 81 1,506 1,518 15.5%
Thursday 13 39 333 1,036 87 1,496 1,509 15.4%
Friday 15 57 398 1,108 83 1,647 1,661 17.0%
Saturday 17 57 330 816 65 1,269 1,286 13.1%
Total 89 320 2,282 6,606 503 9,711 9,800 100%
Note: Counts of victims in the 2010-2014 average may not add to the total due to rounding.
In 2015, the victims involved in traffic collisions on Wednesday (16%), Thursday (16%) and Friday (17%) account for 50% of all casualties. This is very similar to the previous five year (2010 to 2014) annual average, where Wednesday, Thursday and Friday account for 48% of all casualties. Nearly half of people killed in crashes in 2015 were killed on a Monday or a Friday (22% Monday; 26% Friday). This is somewhat different from the previous five year (2010 to 2014) annual average, where the weekend (Friday, Saturday, and Sunday) is when most people are killed (52% cumulatively). Figure 5-3 Proportion of People Killed and Injured by Day of Occurrence
0%
5%
10%
15%
20%
25%
30%
Sunday Monday Tuesday Wednesday Thursday Friday Saturday
Pro
po
rtio
n o
f To
tal
Proportion of People Killed and Injured by Day of Occurrence: 2015
Killed Injured Total Victims

Section 5 Collision Victims
68
Table 5-5 Collision Victims by Time of Occurrence and Casualty Type
Table 5-5
Collision Victims by Time of Occurrence and Casualty Type: 2015
Time of the Day
2015 Casualty Type
2015 Total
Victims
% of 2015 Total
Victims Killed
% of Total Killed
Serious Injury
% of Total Serious Injury
Minor Injury
% of Total Minor Injury
Minimal Injury
% of Total Minimal Injury
Other Injury
% of Total Other Injury
Total Injured
% of Total
Injured
00:00 - 02:59 5 6.4% 23 5.5% 56 2.9% 158 1.8% 7 1.2% 244 2.0% 249 2.1%
03:00 - 05:59 1 1.3% 14 3.4% 44 2.3% 84 0.9% 3 0.5% 145 1.2% 146 1.2%
06:00 - 08:59 9 11.5% 47 11.3% 232 11.9% 1,206 13.4% 72 12.8% 1,557 13.0% 1,566 13.0%
09:00 - 11:59 16 20.5% 70 16.9% 284 14.6% 1,258 14.0% 91 16.2% 1,703 14.3% 1,719 14.3%
12:00 - 14:59 12 15.4% 72 17.3% 370 19.0% 1,822 20.2% 109 19.4% 2,373 19.9% 2,385 19.8%
15:00 - 17:59 10 12.8% 96 23.1% 475 24.4% 2,712 30.1% 144 25.6% 3,427 28.7% 3,437 28.6%
18:00 - 20:59 10 12.8% 66 15.9% 291 14.9% 1,205 13.4% 89 15.8% 1,651 13.8% 1,661 13.8%
21:00 - 23:59 14 17.9% 26 6.3% 189 9.7% 555 6.2% 44 7.8% 814 6.8% 828 6.9%
Not Stated 1 1.3% 1 0.2% 6 0.3% 14 0.2% 4 0.7% 25 0.2% 26 0.2%
Total 78 100% 415 100% 1,947 100% 9,014 100% 563 100% 11,939 100% 12,017 100%

Section 5 Collision Victims
69
Table 5-5a Collision Victims by Time of Occurrence and Casualty Type for Previous Five Years
Table 5-5a
Collision Victims by Time of Occurrence and Casualty: 2010-2014 Average
Time of the Day
2010-2014 Average Count of Victims
Killed Serious Injury
Minor Injury
Minimal Injury
Other Injury
Total Injured
Total Victims
% of Total Victims
00:00 - 02:59 7 18 81 136 17 251 257 2.6%
03:00 - 05:59 10 15 58 84 10 166 177 1.8%
06:00 - 08:59 6 34 281 838 60 1,213 1,218 12.4%
09:00 - 11:59 9 36 320 918 62 1,335 1,344 13.7%
12:00 - 14:59 14 51 406 1,348 89 1,894 1,907 19.5%
15:00 - 17:59 13 72 556 1,928 138 2,694 2,707 27.6%
18:00 - 20:59 12 44 324 867 60 1,294 1,307 13.3%
21:00 - 23:59 12 40 201 436 35 712 724 7.4%
Not Stated 6 11 56 52 33 152 158 1.6%
Total 89 320 2,282 6,606 503 9,711 9,800 100%
Note: Counts of victims in the 2010-2014 average may not add to the total due to rounding.
People are most often killed and injured in traffic collisions between noon and 6 p.m. In 2015, 48% of all victims are involved in traffic collisions between 12:00 and 14:59 (20%) and between 15:00 to 17:59 (29%). This is relatively consistent with the previous five year (2010 to 2014) annual average (12:00-14:59 – nearly 20% of all victims; 15:00 to 17:59 – 28% of all victims). In 2015, most people are killed between 9 a.m. and midnight (09:00-11:59 – nearly 21%; 12:00-17:59 – 28% of people killed, 18:00 – 23:59 – 31% killed). This is similar to the previous five year (2010 to 2014) annual average where 30% of people are killed between noon and 6 p.m. and 27% are killed in collisions between 6 p.m. and midnight. Comparing 2015 to the previous five year (2010 to 2014) annual average, there are small differences in the proportional distribution of people killed by time of the day. In 2015:
32% of people are killed between 6 a.m. and noon (06:00-08:59 – nearly 12%; 09:00-11:59 – nearly 21%), compared to 17% in the previous five years;
28% of people are killed between noon and 6 p.m. (12:00-14:59 – 15%; 15:00 to 17:59 – 13%), compared to 30% in the previous five years;
31% of people are killed between 6 p.m. and midnight (18:00-20:59 – 13%; 21:00 to 23:59 –18%), compared to 27% in the previous five years; and,
8% of people are killed between midnight to 6 a.m. (00:00-02:59 – 6%; 03:00-05:59 – 1%), compared to 19% in the previous five years.
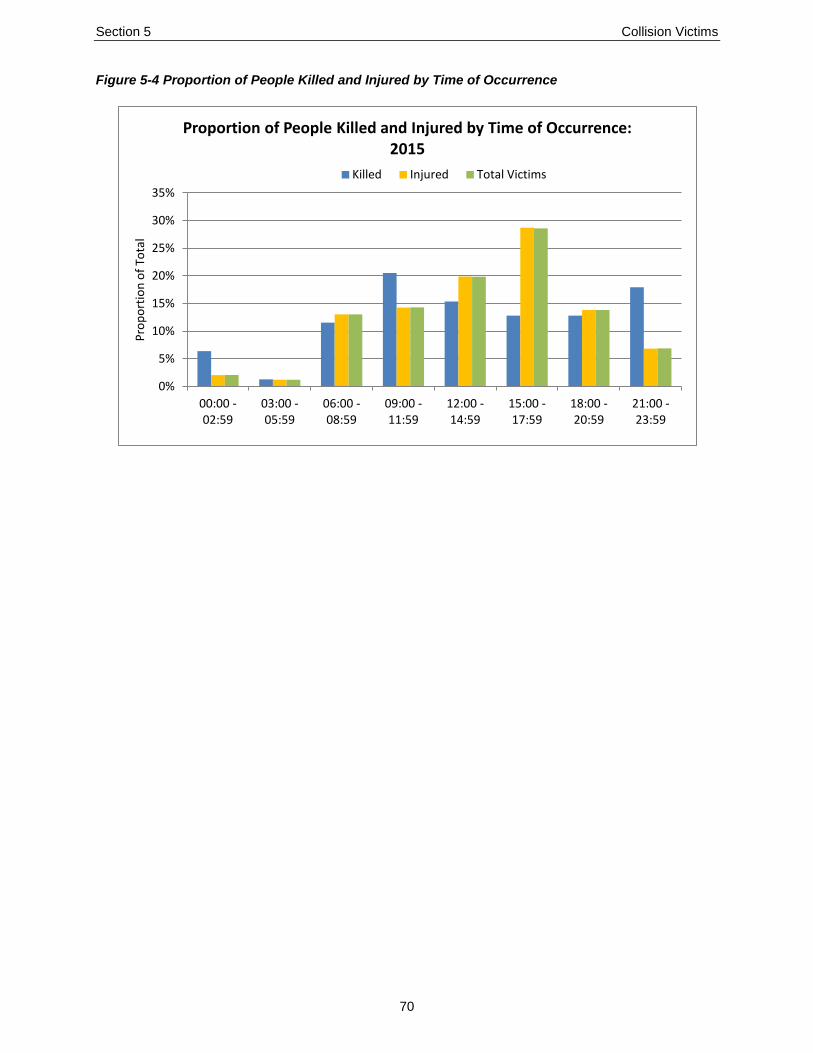
Section 5 Collision Victims
70
Figure 5-4 Proportion of People Killed and Injured by Time of Occurrence
0%
5%
10%
15%
20%
25%
30%
35%
00:00 - 02:59
03:00 - 05:59
06:00 - 08:59
09:00 - 11:59
12:00 - 14:59
15:00 - 17:59
18:00 - 20:59
21:00 - 23:59
Pro
po
rtio
n o
f To
tal
Proportion of People Killed and Injured by Time of Occurrence: 2015
Killed Injured Total Victims

Section 5 Collision Victims
71
Table 5-6 Collision Victims by Gender and Casualty Type
Table 5-6
Collision Victims by Gender and Casualty Type: 2015
Gender
2015 Casualty Type
2015 Total
Victims
% of 2015 Total
Victims Killed % of Total Killed
Serious Injury
% of Total Serious Injury
Minor Injury
% of Total Minor Injury
Minimal Injury
% of Total Minimal Injury
Other Injury
% of Total Other Injury
Total Injured
% of Total
Injured
Female 24 30.8% 202 48.9% 1,090 58.5% 5,344 60.7% 344 61.3% 6,980 60.0% 7,004 59.8%
Male 54 69.2% 211 51.1% 773 41.5% 3,456 39.3% 217 38.7% 4,657 40.0% 4,711 40.2%
Total 78 100% 413 100% 1,863 100% 8,800 100% 561 100% 11,637 100% 11,715 100%
Note: Some victims do not have age and gender recorded and are therefore missing from the table above.
Table 5-6a Collision Victims by Gender and Casualty Type for Previous Five Years
Table 5-6a
Collision Victims by Gender and Casualty Type: 2010-2014 Average
Gender
2010-2014 Average Count of Victims
Killed Serious Injury
Minor Injury
Minimal Injury
Other Injury
Total Injured
Total Victims
% of Total Victims
Female 29 142 1,261 3,841 261 5,505 5,534 58.1%
Male 60 170 945 2,580 236 3,931 3,991 41.9%
Total 89 312 2,206 6,420 498 9,436 9,525 100%
Note: Counts of victims in the 2010-2014 average may not add to the total due to rounding. Note: Some victims do not have age and gender recorded and are therefore missing from the table above.

Section 5 Collision Victims
72
In 2015, women account for 60% of all casualties in traffic collisions, similar to the previous five year (2010 to 2014) annual average (58%). In 2015:
Men account for a higher proportion of people killed (69%) than women, similar to the previous five years when men accounted for 67% of victims killed;
Women account for the majority of people injured (but not killed) overall (60%), similar to the previous five years (58%);
Men account for just over half of people seriously injured (51% compared to 49% women), similar to the previous five years; and,
Women account for more people sustaining minor injuries (nearly 59%) and minimal injuries (61%) than men, similar to the previous five years (minor injuries – 57%; minimal injuries – 60%).
Figure 5-5 Proportion of People Killed and Injured by Gender and Casualty Type
0%
20%
40%
60%
80%
100%
Killed Injured Total Victims
Pro
po
rtio
n o
f To
tal
Proportion of People Killed and Injured by Gender and Casualty Type: 2015
Male Female
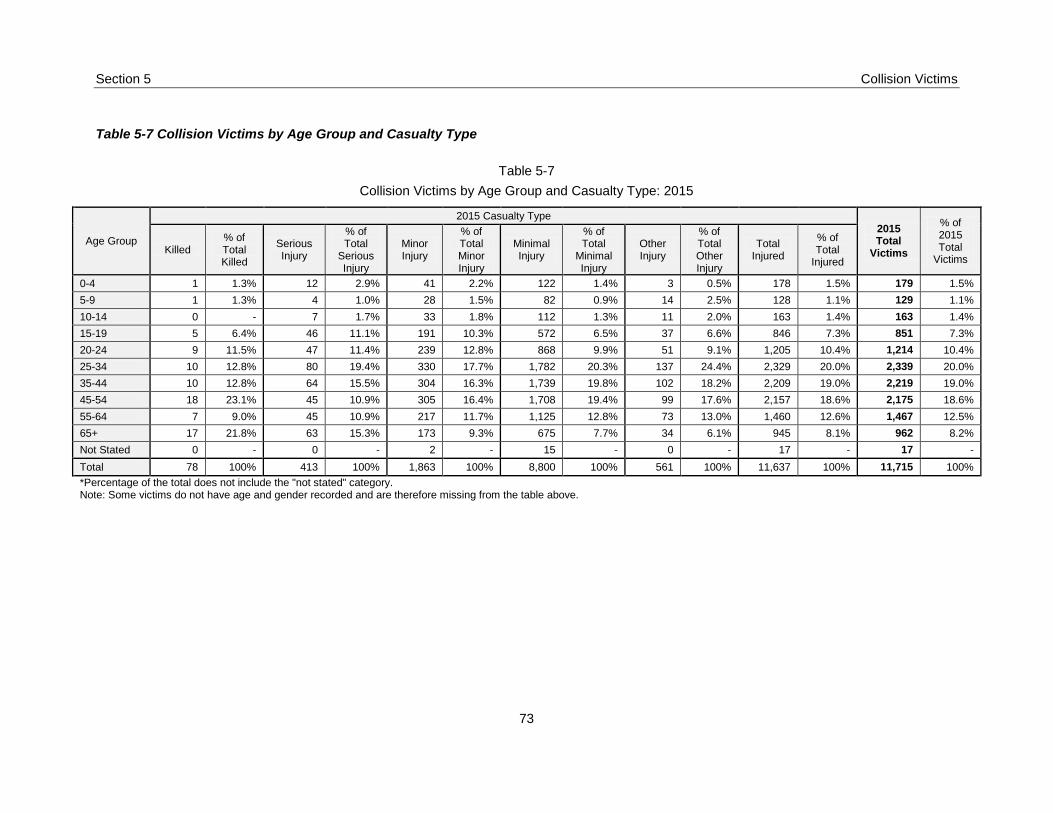
Section 5 Collision Victims
73
Table 5-7 Collision Victims by Age Group and Casualty Type
Table 5-7
Collision Victims by Age Group and Casualty Type: 2015
Age Group
2015 Casualty Type
2015 Total
Victims
% of 2015 Total
Victims Killed
% of Total Killed
Serious Injury
% of Total
Serious Injury
Minor Injury
% of Total Minor Injury
Minimal Injury
% of Total
Minimal Injury
Other Injury
% of Total Other Injury
Total Injured
% of Total
Injured
0-4 1 1.3% 12 2.9% 41 2.2% 122 1.4% 3 0.5% 178 1.5% 179 1.5%
5-9 1 1.3% 4 1.0% 28 1.5% 82 0.9% 14 2.5% 128 1.1% 129 1.1%
10-14 0 - 7 1.7% 33 1.8% 112 1.3% 11 2.0% 163 1.4% 163 1.4%
15-19 5 6.4% 46 11.1% 191 10.3% 572 6.5% 37 6.6% 846 7.3% 851 7.3%
20-24 9 11.5% 47 11.4% 239 12.8% 868 9.9% 51 9.1% 1,205 10.4% 1,214 10.4%
25-34 10 12.8% 80 19.4% 330 17.7% 1,782 20.3% 137 24.4% 2,329 20.0% 2,339 20.0%
35-44 10 12.8% 64 15.5% 304 16.3% 1,739 19.8% 102 18.2% 2,209 19.0% 2,219 19.0%
45-54 18 23.1% 45 10.9% 305 16.4% 1,708 19.4% 99 17.6% 2,157 18.6% 2,175 18.6%
55-64 7 9.0% 45 10.9% 217 11.7% 1,125 12.8% 73 13.0% 1,460 12.6% 1,467 12.5%
65+ 17 21.8% 63 15.3% 173 9.3% 675 7.7% 34 6.1% 945 8.1% 962 8.2%
Not Stated 0 - 0 - 2 - 15 - 0 - 17 - 17 -
Total 78 100% 413 100% 1,863 100% 8,800 100% 561 100% 11,637 100% 11,715 100%
*Percentage of the total does not include the "not stated" category. Note: Some victims do not have age and gender recorded and are therefore missing from the table above.

Section 5 Collision Victims
74
Table 5-7a Collision Victims by Age Group and Casualty Type for Previous Five Years
Table 5-7a
Collision Victims by Age Group and Casualty Type: 2010-2014 Average
Age Group
2010-2014 Average Count of Victims
Killed Serious Injury
Minor Injury
Minimal Injury
Other Injury
Total Injured
Total Victims
% of Total Victims
0-4 1 1 37 61 2 102 103 1.2%
5-9 1 3 47 73 3 127 128 1.5%
10-14 2 6 53 90 4 153 155 1.8%
15-19 12 35 272 433 17 756 768 8.7%
20-24 13 41 276 664 17 998 1,011 11.5%
25-34 13 49 402 1,280 25 1,757 1,770 20.1%
35-44 11 44 327 1,175 25 1,572 1,582 18.0%
45-54 10 44 324 1,170 20 1,557 1,567 17.8%
55-64 6 35 215 743 15 1,008 1,014 11.5%
65+ 19 46 183 451 11 691 710 8.1%
Not Stated <1 8 69 280 360 716 716 -
Total 89 312 2,206 6,420 498 9,436 9,525 100%
*Percentage of the total does not include the "not stated" category. Note: Counts of victims in the 2010-2014 average may not add to the total due to rounding. Note: Some victims do not have age and gender recorded and are therefore missing from the table above.
Victims aged 25 to 34 account for the highest proportion of casualties in 2015 (20% of all casualties; 13% of people killed; 19% of people seriously injured), followed by those aged 35 to 44 (19% of all casualties; 13% of people killed; nearly 16% of people seriously injured) and those age 45 to 54 (19% of all casualties; 23% of people killed; 11% of people seriously injured). Victims aged 15 to 19 account for 7% of all casualties while those aged 20 to 24 account for 10%. The proportion of victims by age group in 2015 is very similar to what it has been in the previous five year (2010 to 2014) annual average. In the previous five years, victims aged 25 to 34 (20% of all victims) and those aged 35 to 44 (18% of all victims) account for the two largest groups, followed by victims aged 45 to 54 (18% of all victims). Victims aged 15 to 19 and 20 to 24 account for 9% and nearly 12% of all victims in the five year period (2010 to 2014), respectively. In 2015, almost one-third of all people killed are aged 15 to 34 (6% aged 15-19; nearly 12% aged 20-24; 13% aged 25-34), 36% are aged 35 to 54, and 31% are aged 55 and older. In the previous five year (2010 to 2014) annual average, 43% of people killed are aged 15 to 34, nearly 24% are aged 35 to 54, and 28% are aged 55 and older.

Section 5 Collision Victims
75
Figure 5-6 Proportion of People Killed and Injured by Age Group and Casualty Type
In 2015, people aged 45 to 54 make up the largest group of people killed in traffic collisions (23%), followed by those aged 65 and older (22%). There are two children under age 10 killed in traffic collisions in 2015. NOTE: For a detailed count of collision victims for 2015 and the previous five year (2010 to 2014) annual average by age and gender combined, please refer to “Table 5-8 Collision Victims by Age Group, Casualty Type, and Gender” and “Table 5-8a Collision Victims by Age Group, Casualty Type, and Gender for Previous Five Years” on the following pages.
0%
5%
10%
15%
20%
25%
0-4 5-9 10-14 15-19 20-24 25-34 35-44 45-54 55-64 65+
Pro
po
rtio
n o
f To
tal
Proportion of People Killed and Injured by Known Age Group and Casualty Type: 2015
Killed Injured Total Victims

Section 5 Collision Victims
76
Table 5-8 Collision Victims by Age Group, Casualty Type, and Gender
Table 5-8
Collision Victims by Gender and Age Group and Casualty Type: 2015
Age Group
2015 Casualty Type
2015 Total
Victims
% of 2015 Total
Victims Killed
% of Total Killed
Serious Injury
% of Total
Serious Injury
Minor Injury
% of Total Minor Injury
Minimal Injury
% of Total Minimal Injury
Other Injury
% of Total Other Injury
Total Injured
% of Total
Injured
Fe
male
0-4 1 4.2% 10 5.0% 22 2.0% 75 1.4% 0 - 107 1.5% 108 1.5%
5-9 0 - 3 1.5% 13 1.2% 44 0.8% 3 0.9% 63 0.9% 63 0.9%
10-14 0 - 3 1.5% 17 1.6% 72 1.3% 7 2.0% 99 1.4% 99 1.4%
15-19 1 4.2% 24 11.9% 125 11.5% 350 6.6% 22 6.4% 521 7.5% 522 7.5%
20-24 4 16.7% 23 11.4% 138 12.7% 546 10.2% 29 8.4% 736 10.6% 740 10.6%
25-34 5 20.8% 39 19.3% 193 17.7% 1,067 20.0% 80 23.3% 1,379 19.8% 1,384 19.8%
35-44 1 4.2% 35 17.3% 171 15.7% 1,062 19.9% 65 18.9% 1,333 19.1% 1,334 19.1%
45-54 5 20.8% 23 11.4% 187 17.2% 1,042 19.5% 59 17.2% 1,311 18.8% 1,316 18.8%
55-64 0 - 18 8.9% 125 11.5% 696 13.0% 58 16.9% 897 12.9% 897 12.8%
65+ 7 29.2% 24 11.9% 98 9.0% 382 7.2% 21 6.1% 525 7.5% 532 7.6%
Not Stated 0 - 0 - 1 - 8 - 0 - 9 - 9 -
Total Female 24 100% 202 100% 1,090 100% 5,344 100% 344 100% 6,980 100% 7,004 100%
Ma
le
0-4 0 - 2 0.9% 19 2.5% 47 1.4% 3 1.4% 71 1.5% 71 1.5%
5-9 1 1.9% 1 0.5% 15 1.9% 38 1.1% 11 5.1% 65 1.4% 66 1.4%
10-14 0 - 4 1.9% 16 2.1% 40 1.2% 4 1.8% 64 1.4% 64 1.4%
15-19 4 7.4% 22 10.4% 66 8.5% 222 6.4% 15 6.9% 325 7.0% 329 7.0%
20-24 5 9.3% 24 11.4% 101 13.1% 322 9.3% 22 10.1% 469 10.1% 474 10.1%
25-34 5 9.3% 41 19.4% 137 17.7% 715 20.7% 57 26.3% 950 20.4% 955 20.3%
35-44 9 16.7% 29 13.7% 133 17.2% 677 19.6% 37 17.1% 876 18.8% 885 18.8%
45-54 13 24.1% 22 10.4% 118 15.3% 666 19.3% 40 18.4% 846 18.2% 859 18.3%
55-64 7 13.0% 27 12.8% 92 11.9% 429 12.4% 15 6.9% 563 12.1% 570 12.1%
65+ 10 18.5% 39 18.5% 75 9.7% 293 8.5% 13 6.0% 420 9.0% 430 9.1%
Not Stated 0 - 0 - 1 - 7 - 0 - 8 - 8 -
Total Male 54 100% 211 100% 773 100% 3,456 100% 217 100% 4,657 100% 4,711 100%
*Percentage of the total does not include the "not stated" category. Note: Some victims do not have age and gender recorded and are therefore missing from the table above.

Section 5 Collision Victims
77
Table 5-8a Collision Victims by Age Group, Casualty Type, and Gender for Previous Five Years
Table 5-8a
Collision Victims by Gender and Age Group and Casualty Type: 2010-2014 Average
Age Group
2010-2014 Average Count of Victims
Killed Serious Injury
Minor Injury
Minimal Injury
Other Injury
Total Injured
Total Victims
% of Total Victims
Fe
male
0-4 1 <1 21 34 <1 56 57 1.1%
5-9 <1 2 23 37 2 63 64 1.2%
10-14 <1 3 25 48 2 77 78 1.5%
15-19 5 16 157 257 7 437 442 8.6%
20-24 5 20 165 404 9 598 602 11.7%
25-34 3 21 240 780 14 1,055 1,059 20.6%
35-44 3 18 190 715 12 935 938 18.2%
45-54 4 21 173 713 9 917 921 17.9%
55-64 1 15 121 446 8 591 592 11.5%
65+ 7 22 107 257 5 391 398 7.7%
Not Stated <1 3 39 150 192 385 385 -
Total Female 29 142 1,261 3,841 261 5,505 5,534 100%
Ma
le
0-4 <1 <1 16 28 1 46 46 1.3%
5-9 1 2 24 36 1 64 65 1.8%
10-14 1 3 28 42 2 75 77 2.1%
15-19 8 18 115 176 9 319 326 8.9%
20-24 8 21 111 260 8 400 408 11.2%
25-34 10 28 163 500 11 701 711 19.4%
35-44 8 27 137 459 13 636 644 17.6%
45-54 6 23 150 457 10 641 647 17.7%
55-64 5 20 94 297 6 417 422 11.5%
65+ 12 24 76 194 6 300 312 8.5%
Not Stated <1 4 30 129 168 331 332 -
Total Male 60 170 945 2,580 236 3,931 3,991 100%
*Percentage of the total does not include the "not stated" category. Note: Counts of victims in the 2010-2014 average may not add to the total due to rounding. Note: Some victims do not have age and gender recorded and are therefore missing from the table above.

Section 5 Collision Victims
78
Table 5-9 Victim Involvement Rate (per 100,000 people) by Gender and Age Group and Casualty Type
Table 5-9
Victim Involvement Rate (per 100,000 people) by Gender and Age Group and Casualty Type: 2015, 2010-2014 Average
Age Group
2015 Casualty Type 2015 Total
Victims
2010-2014 Average Victim Involvement Rate
Killed Serious Injury
Minor Injury
Minimal Injury
Other Injury
Total Injured
Killed Serious Injury
Minor Injury
Minimal Injury
Other Injury
Total Injured
Total Victims
Fe
male
0-4 2.5 24.7 54.3 185.0 - 263.9 266.4 2.5 2.0 51.9 83.8 1.0 138.6 141.1
5-9 - 7.2 31.4 106.2 7.2 152.1 152.1 0.5 4.1 59.9 95.5 4.1 163.6 164.2
10-14 - 7.7 43.8 185.5 18.0 255.0 255.0 1.0 6.6 64.5 120.9 4.6 196.5 197.5
15-19 2.4 57.4 298.7 836.4 52.6 1,245.1 1,247.5 10.6 37.8 361.4 593.1 17.1 1009.5 1020.1
20-24 8.5 48.7 292.2 1,156.1 61.4 1,558.4 1,566.9 10.1 43.6 363.2 890.9 19.4 1317.1 1327.3
25-34 5.5 42.5 210.5 1,163.7 87.3 1,504.0 1,509.4 4.0 24.9 281.7 917.2 16.9 1240.8 1244.8
35-44 1.2 41.3 201.8 1,253.4 76.7 1,573.2 1,574.4 3.4 21.7 231.7 872.0 15.1 1140.5 1143.9
45-54 5.6 25.9 210.4 1,172.6 66.4 1,475.3 1,480.9 4.4 23.0 189.9 780.7 10.3 1003.9 1008.3
55-64 - 21.8 151.6 844.4 70.4 1,088.2 1,088.2 1.3 19.5 156.9 578.7 10.9 765.9 767.2
65+ 6.5 22.4 91.3 355.9 19.6 489.1 495.6 13.8 46.7 223.1 535.0 10.4 815.3 829.1
Total Female 3.6 30.4 163.9 803.7 51.7 1,049.8 1,053.4 4.6 22.2 197.5 601.7 41.0 862.4 867.0
Ma
le
0-4 - 4.6 44.0 108.9 7.0 164.6 164.6 0.5 1.5 39.7 67.3 3.4 111.9 112.4
5-9 2.3 2.3 34.9 88.4 25.6 151.2 153.5 2.5 4.5 60.8 91.5 3.5 160.3 162.9
10-14 - 9.7 38.9 97.2 9.7 155.6 155.6 3.4 7.3 68.0 103.2 5.9 184.5 187.9
15-19 9.0 49.3 147.9 497.6 33.6 728.5 737.5 17.0 41.1 256.7 393.3 20.5 711.7 728.6
20-24 10.0 48.2 202.8 646.5 44.2 941.6 951.7 17.2 46.1 238.9 559.2 17.6 861.8 879.0
25-34 5.5 44.8 149.8 782.0 62.3 1,039.0 1,044.4 11.6 32.6 192.0 589.8 13.0 827.4 839.0
35-44 10.7 34.4 157.9 803.5 43.9 1,039.7 1,050.4 9.8 32.5 168.0 561.6 15.6 777.7 787.4
45-54 14.5 24.6 131.8 743.9 44.7 945.0 959.5 6.8 24.6 163.6 498.3 11.3 697.9 704.6
55-64 8.6 33.1 112.9 526.5 18.4 691.0 699.6 6.8 25.7 123.6 389.8 8.1 547.3 554.1
65+ 11.5 44.8 86.2 336.6 14.9 482.5 494.0 29.7 57.5 182.6 465.4 13.4 719.0 748.7
Total Male 8.2 32.2 117.9 527.3 33.1 710.5 718.8 9.5 26.9 149.7 408.7 37.5 622.8 632.3
Note: Counts of victims in the 2010-2014 average may not add to the total due to rounding. Note: Some victims do not have age and gender recorded and are therefore missing from the table above.

Section 5 Collision Victims
79
Overall, women have higher victim involvement rates than men. The involvement rate for females in all traffic collisions in 2015 is 1,053.4, while for males it is 718.8 (per 100,000 people). Similarly, in the previous five year (2010 to 2014) annual average, women have a higher involvement rate than men (women 867.0; men 632.3). However, men have higher involvement rates than women when it comes to being killed and sustaining serious injuries. People aged 35 to 44 have the highest victim involvement rates (per 100,000 people) overall in 2015.
Children under age 15 – rate of 189.9
People aged 15 to 24 – rate of 1,125.4
People aged 25 to 34 – rate of 1,277.2
People aged 35 to 44 – rate of 1,313.1
People aged 45 to 54 – rate of 1,219.3
People aged 55 and older – rate of 677.9 In 2015, women aged 35 to 44 have the highest victim involvement rate of any age-gender group (1,574.4 per 100,000 people) followed by women aged 20 to 24 (1,566.9) and women aged 25 to 34 (1,509.4). While the victim involvement rates for young men is lower than young women in 2015, men aged 35 to 44 have the highest rate among male age groups (1,050.4 per 100,000 people) followed by men aged 25 to 34 (1,044.4) and men aged 45 to 54 (959.5). The overall victim involvement rates in 2015 are generally higher than the rates in the previous five year (2010 to 2014) annual average.
Compared to the previous five years, victim involvement rates for women increased by nearly 22% overall, but decreased by 21% for women killed. The rate for women seriously injured in 2015 increased by 37% compared to the previous five years.
Compared to the previous five years, victim involvement rates for men increased by 14% overall, but decreased 13% for men killed. The rate for men seriously injured in 2015 increased by 20% compared to the previous five years.
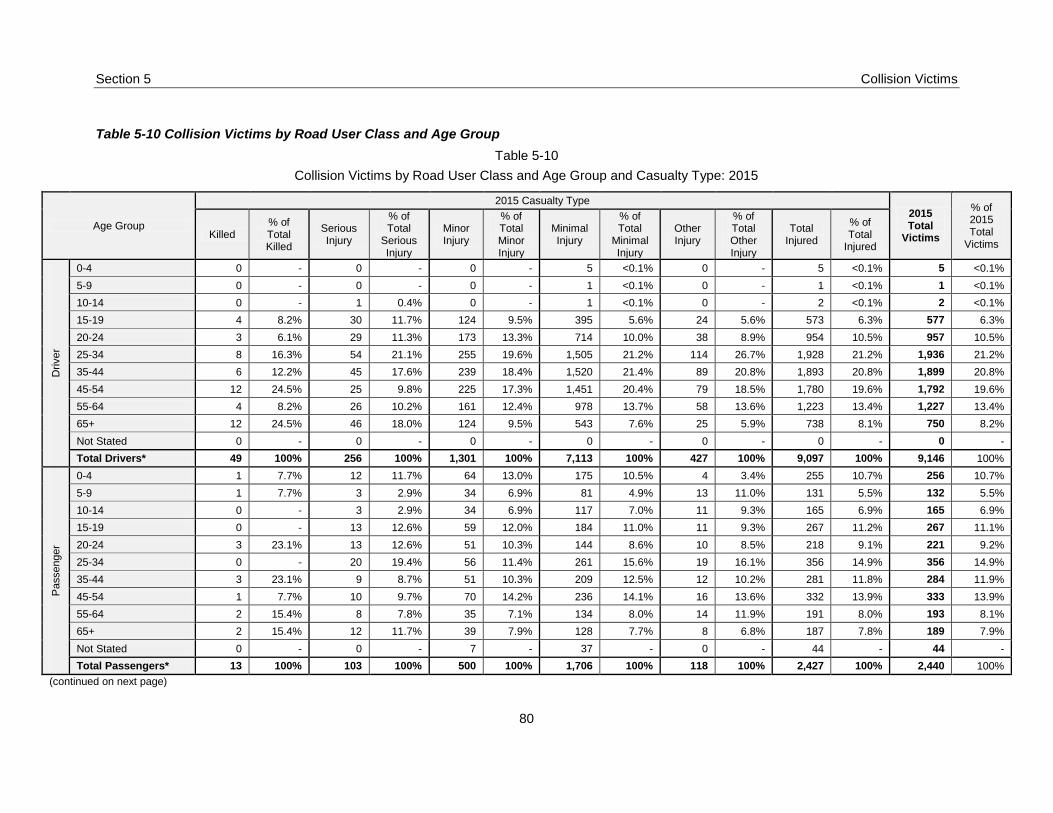
Section 5 Collision Victims
80
Table 5-10 Collision Victims by Road User Class and Age Group
Table 5-10
Collision Victims by Road User Class and Age Group and Casualty Type: 2015
Age Group
2015 Casualty Type
2015 Total
Victims
% of 2015 Total
Victims Killed
% of Total Killed
Serious Injury
% of Total
Serious Injury
Minor Injury
% of Total Minor Injury
Minimal Injury
% of Total
Minimal Injury
Other Injury
% of Total Other Injury
Total Injured
% of Total
Injured
Driver
0-4 0 - 0 - 0 - 5 <0.1% 0 - 5 <0.1% 5 <0.1%
5-9 0 - 0 - 0 - 1 <0.1% 0 - 1 <0.1% 1 <0.1%
10-14 0 - 1 0.4% 0 - 1 <0.1% 0 - 2 <0.1% 2 <0.1%
15-19 4 8.2% 30 11.7% 124 9.5% 395 5.6% 24 5.6% 573 6.3% 577 6.3%
20-24 3 6.1% 29 11.3% 173 13.3% 714 10.0% 38 8.9% 954 10.5% 957 10.5%
25-34 8 16.3% 54 21.1% 255 19.6% 1,505 21.2% 114 26.7% 1,928 21.2% 1,936 21.2%
35-44 6 12.2% 45 17.6% 239 18.4% 1,520 21.4% 89 20.8% 1,893 20.8% 1,899 20.8%
45-54 12 24.5% 25 9.8% 225 17.3% 1,451 20.4% 79 18.5% 1,780 19.6% 1,792 19.6%
55-64 4 8.2% 26 10.2% 161 12.4% 978 13.7% 58 13.6% 1,223 13.4% 1,227 13.4%
65+ 12 24.5% 46 18.0% 124 9.5% 543 7.6% 25 5.9% 738 8.1% 750 8.2%
Not Stated 0 - 0 - 0 - 0 - 0 - 0 - 0 -
Total Drivers* 49 100% 256 100% 1,301 100% 7,113 100% 427 100% 9,097 100% 9,146 100%
Passenger
0-4 1 7.7% 12 11.7% 64 13.0% 175 10.5% 4 3.4% 255 10.7% 256 10.7%
5-9 1 7.7% 3 2.9% 34 6.9% 81 4.9% 13 11.0% 131 5.5% 132 5.5%
10-14 0 - 3 2.9% 34 6.9% 117 7.0% 11 9.3% 165 6.9% 165 6.9%
15-19 0 - 13 12.6% 59 12.0% 184 11.0% 11 9.3% 267 11.2% 267 11.1%
20-24 3 23.1% 13 12.6% 51 10.3% 144 8.6% 10 8.5% 218 9.1% 221 9.2%
25-34 0 - 20 19.4% 56 11.4% 261 15.6% 19 16.1% 356 14.9% 356 14.9%
35-44 3 23.1% 9 8.7% 51 10.3% 209 12.5% 12 10.2% 281 11.8% 284 11.9%
45-54 1 7.7% 10 9.7% 70 14.2% 236 14.1% 16 13.6% 332 13.9% 333 13.9%
55-64 2 15.4% 8 7.8% 35 7.1% 134 8.0% 14 11.9% 191 8.0% 193 8.1%
65+ 2 15.4% 12 11.7% 39 7.9% 128 7.7% 8 6.8% 187 7.8% 189 7.9%
Not Stated 0 - 0 - 7 - 37 - 0 - 44 - 44 -
Total Passengers* 13 100% 103 100% 500 100% 1,706 100% 118 100% 2,427 100% 2,440 100%
(continued on next page)

Section 5 Collision Victims
81
(continued from previous page)
Age Group
2015 Casualty Type
2015 Total
Victims
% of 2015 Total
Victims Killed
% of Total Killed
Serious Injury
% of Total
Serious Injury
Minor Injury
% of Total Minor Injury
Minimal Injury
% of Total
Minimal Injury
Other Injury
% of Total Other Injury
Total Injured
% of Total
Injured
Mo
torc
yclis
t
0-4 0 - 0 - 0 - 0 - 0 - 0 - 0 -
5-9 0 - 0 - 0 - 0 - 0 - 0 - 0 -
10-14 0 - 0 - 0 - 0 - 0 - 0 - 0 -
15-19 1 16.7% 2 7.1% 2 4.9% 2 3.3% 0 - 6 4.6% 7 5.1%
20-24 0 - 2 7.1% 4 9.8% 6 10.0% 1 50.0% 13 9.9% 13 9.5%
25-34 1 16.7% 2 7.1% 9 22.0% 10 16.7% 1 50.0% 22 16.8% 23 16.8%
35-44 0 - 3 10.7% 4 9.8% 8 13.3% 0 - 15 11.5% 15 10.9%
45-54 3 50.0% 8 28.6% 6 14.6% 19 31.7% 0 - 33 25.2% 36 26.3%
55-64 1 16.7% 9 32.1% 11 26.8% 12 20.0% 0 - 32 24.4% 33 24.1%
65+ 0 - 2 7.1% 5 12.2% 3 5.0% 0 - 10 7.6% 10 7.3%
Not Stated 0 - 0 - 0 - 0 - 0 - 0 - 0 -
Total Motorcyclists* 6 100% 28 100% 41 100% 60 100% 2 100% 131 100% 137 100%
Mo
ped
0-4 0 - 0 - 0 - 0 - 0 - 0 - 0 -
5-9 0 - 0 - 0 - 0 - 0 - 0 - 0 -
10-14 0 - 0 - 0 - 0 - 0 - 0 - 0 -
15-19 0 - 0 - 0 - 1 14.3% 0 - 1 7.7% 1 7.7%
20-24 0 - 0 - 0 - 1 14.3% 0 - 1 7.7% 1 7.7%
25-34 0 - 0 - 1 20.0% 3 42.9% 0 - 4 30.8% 4 30.8%
35-44 0 - 1 100.0% 1 20.0% 0 - 0 - 2 15.4% 2 15.4%
45-54 0 - 0 - 3 60.0% 2 28.6% 0 - 5 38.5% 5 38.5%
55-64 0 - 0 - 0 - 0 - 0 - 0 - 0 -
65+ 0 - 0 - 0 - 0 - 0 - 0 - 0 -
Not Stated 0 - 0 - 0 - 0 - 0 - 0 - 0 -
Total Moped* 0 0% 1 100% 5 100% 7 100% 0 0% 13 100% 13 100%
(continued on next page)

Section 5 Collision Victims
82
(continued from previous page)
Age Group
2015 Casualty Type
2015 Total
Victims
% of 2015 Total
Victims Killed
% of Total Killed
Serious Injury
% of Total
Serious Injury
Minor Injury
% of Total Minor Injury
Minimal Injury
% of Total
Minimal Injury
Other Injury
% of Total Other Injury
Total Injured
% of Total
Injured
Bic
yclis
t
0-4 0 - 0 - 0 - 1 7.1% 0 - 1 2.5% 1 2.4%
5-9 0 - 0 - 0 - 0 - 0 - 0 - 0 -
10-14 0 - 1 33.3% 1 5.0% 0 - 0 - 2 5.0% 2 4.9%
15-19 0 - 0 - 3 15.0% 1 7.1% 1 33.3% 5 12.5% 5 12.2%
20-24 0 - 0 - 4 20.0% 2 14.3% 0 - 6 15.0% 6 14.6%
25-34 0 - 0 - 3 15.0% 2 14.3% 0 - 5 12.5% 5 12.2%
35-44 0 - 2 66.7% 3 15.0% 4 28.6% 0 - 9 22.5% 9 22.0%
45-54 1 100.0% 0 - 2 10.0% 3 21.4% 2 66.7% 7 17.5% 8 19.5%
55-64 0 - 0 - 3 15.0% 1 7.1% 0 - 4 10.0% 4 9.8%
65+ 0 - 0 - 1 5.0% 0 - 0 - 1 2.5% 1 2.4%
Not Stated 0 - 0 - 0 - 0 - 0 - 0 - 0 -
Total Bicyclists* 1 100% 3 100% 20 100% 14 100% 3 100% 40 100% 41 100%
Pedestr
ian
0-4 0 - 1 5.6% 3 5.9% 2 5.0% 0 - 6 5.0% 6 4.6%
5-9 0 - 0 - 0 - 0 - 1 8.3% 1 0.8% 1 0.8%
10-14 0 - 2 11.1% 4 7.8% 0 - 0 - 6 5.0% 6 4.6%
15-19 0 - 0 - 3 5.9% 2 5.0% 1 8.3% 6 5.0% 6 4.6%
20-24 3 33.3% 2 11.1% 8 15.7% 4 10.0% 2 16.7% 16 13.2% 19 14.6%
25-34 1 11.1% 2 11.1% 8 15.7% 3 7.5% 3 25.0% 16 13.2% 17 13.1%
35-44 1 11.1% 4 22.2% 8 15.7% 7 17.5% 1 8.3% 20 16.5% 21 16.2%
45-54 1 11.1% 2 11.1% 7 13.7% 6 15.0% 2 16.7% 17 14.0% 18 13.8%
55-64 0 - 2 11.1% 5 9.8% 7 17.5% 1 8.3% 15 12.4% 15 11.5%
65+ 3 33.3% 3 16.7% 5 9.8% 9 22.5% 1 8.3% 18 14.9% 21 16.2%
Not Stated 0 - 0 - 0 - 0 - 0 - 0 - 0 -
Total Pedestrians* 9 100% 18 100% 51 100% 40 100% 12 100% 121 100% 130 100%
*Percentage of the total does not include the "not stated" category. Note: Counts for “Motorcyclist”, “Bicyclist” and “Moped” include passengers on those vehicle types. Note: In 2015, there are 10 victims in the class "Riding/hanging on" (i.e., not in the passenger compartment) who are not included in Table 5-10. This includes 2 people with a serious injury, 2 with minor injuries, and 6 with minimal injuries. Note: Some victims do not have their position in the vehicle recorded and are therefore missing from the table above. This includes 100 injured people (4 serious, 27 minor, 68 minimal injured, 1 ‘other’).

Section 5 Collision Victims
83
Table 5-10a Victims by Road User Class and Age Group and Casualty Type for Previous Five Years
Table 5-10a
Collision Victims by Road User Class and Age Group and Casualty Type: 2010-2014 Average
Age Group
2010-2014 Average Count of Victims
Killed Serious Injury
Minor Injury Minimal Injury
Other Injury
Total Injured Total
Victims % of Total
Victims
Driver
0-4 - <1 <1 <1 - 2 2 <0.1%
5-9 - <1 <1 1 - 2 2 <0.1%
10-14 <1 <1 <1 1 - 2 2 <0.1%
15-19 4 17 165 307 10 499 503 7.4%
20-24 6 23 198 544 10 775 781 11.5%
25-34 7 31 302 1,097 18 1,448 1,455 21.5%
35-44 6 30 250 1,035 20 1,335 1,340 19.8%
45-54 7 28 248 1,024 14 1,314 1,321 19.5%
55-64 4 23 162 631 11 827 831 12.2%
65+ 10 33 130 365 6 534 544 8.0%
Not Stated <1 2 30 152 227 412 412 -
Total Drivers* 45 186 1,487 5,158 318 7,148 7,193 100%
Passenger
0-4 1 1 34 68 2 105 106 6.0%
5-9 <1 2 43 78 2 125 125 7.0%
10-14 <1 3 43 97 3 146 146 8.2%
15-19 6 15 91 128 4 239 245 13.7%
20-24 3 13 61 112 5 190 194 10.9%
25-34 4 10 74 168 5 257 261 14.6%
35-44 3 9 55 132 2 198 200 11.3%
45-54 2 7 53 136 3 198 200 11.3%
55-64 <1 6 38 108 2 154 154 8.7%
65+ 4 9 46 86 3 144 147 8.3%
Not Stated - 6 55 160 58 279 279 -
Total Passengers* 24 79 592 1,275 88 2,035 2,059 100%
Mo
torc
yclis
t
0-4 - - - - - - - -
5-9 - - <1 - - <1 <1 0.2%
10-14 <1 <1 <1 - - <1 <1 0.8%
15-19 <1 <1 2 <1 - 2 3 2.8%
20-24 <1 2 7 5 - 13 14 13.7%
25-34 1 3 6 8 <1 17 18 17.8%
35-44 <1 3 7 7 <1 18 19 18.8%
45-54 <1 6 11 10 <1 27 28 27.3%
55-64 <1 4 7 5 <1 16 17 16.6%
65+ <1 <1 <1 <1 - 2 2 2.0%
Not Stated - <1 1 5 9 15 15 -
Total Motorcyclists* 4 19 42 41 10 112 116 100%
(continued on next page)

Section 5 Collision Victims
84
(continued from previous page)
Age Group
2010-2014 Average Count of Victims
Killed Serious Injury
Minor Injury Minimal Injury
Other Injury
Total Injured Total
Victims % of Total
Victims M
oped
0-4 - - - - - - - -
5-9 - - - - - - - -
10-14 - - <1 - - <1 <1 2.0%
15-19 - - - - - - - -
20-24 - - <1 <1 - <1 <1 7.8%
25-34 - <1 <1 2 - 3 3 31.4%
35-44 - <1 1 <1 - 2 2 17.6%
45-54 - <1 1 1 <1 3 3 27.5%
55-64 - <1 <1 <1 - 1 1 9.8%
65+ - <1 <1 - - <1 <1 3.9%
Not Stated - - <1 <1 1 2 2 -
Total Moped* - 1 4 5 1 12 12 100%
Bic
yclis
t
0-4 - - - - - - - -
5-9 <1 - 3 1 <1 4 4 4.7%
10-14 <1 <1 6 1 <1 9 9 9.8%
15-19 <1 1 7 4 <1 13 13 14.2%
20-24 <1 <1 4 6 <1 11 12 12.5%
25-34 <1 2 10 5 <1 17 18 18.7%
35-44 <1 <1 6 5 <1 12 13 13.4%
45-54 <1 2 6 4 1 13 13 14.0%
55-64 - <1 4 5 - 9 9 9.1%
65+ 1 - 1 1 - 2 3 3.6%
Not Stated <1 <1 5 17 26 49 49 -
Total Bicyclists* 4 7 52 49 31 139 143 100%
Pedestr
ian
0-4 <1 <1 3 - <1 4 4 2.4%
5-9 - 2 3 <1 <1 6 6 3.9%
10-14 <1 1 8 1 <1 11 11 7.0%
15-19 2 2 10 4 1 18 19 11.9%
20-24 2 3 9 4 2 19 20 12.7%
25-34 1 3 13 7 2 24 25 15.5%
35-44 <1 3 11 5 2 21 22 13.5%
45-54 1 2 9 5 1 17 18 11.2%
55-64 <1 2 7 3 2 14 15 9.2%
65+ 4 4 8 3 1 17 21 12.8%
Not Stated <1 2 10 22 40 75 75 -
Total Pedestrians* 12 24 93 55 52 224 236 100%
*Percentage of the total does not include the "not stated" category. Note: Counts for “Motorcyclist”, “Bicyclist” and “Moped” include passengers on those vehicle types. Note: Counts of victims in the 2010-2014 average may not add to the total due to rounding. Note: In 2010-2014, there is an average of 6 victims in the class “Riding/Hanging On”. There is also an average of 35 victims whose Road User Class cannot be determined. None of these people were killed in the five year period. These victims are not included in Table 5-10a.
In 2015, “Drivers” account for 77% of all casualties and motor vehicle “Passengers” for nearly 21%. “Motorcyclists” and “Moped” riders combined account for just over 1% of all casualties while “Bicyclists” account for less than half a percent and “Pedestrians” account for 1%. In 2015, “Pedestrians” account for nearly 12% of people killed in traffic collisions.

Section 5 Collision Victims
85
Figure 5-7 Proportion of People Killed and Injured by Road User Class
Among people killed in traffic collisions in 2015:
“Drivers” account for the largest proportion at 63%;
“Passengers” account for 17%;
“Pedestrians” account for nearly 12%;
“Motorcyclist” and “Moped” riders (combined) account for 8%; and,
“Bicyclists” account for 1%. Vulnerable road users (pedestrians, motorcyclists/moped riders, and bicyclists) account for a much higher proportion of people killed and seriously injured than they do for people sustaining only minor or minimal injuries.
Pedestrians account for nearly 12% of people killed and 4% of people seriously injured, but only 1% of all victims in 2015.
Bicyclists account for 1% of people killed and 1% of people seriously injured, but less than half a percent of all victims in 2015.
Motorcyclists and moped riders account 8% of people killed and 7% of people seriously injured, but only 1% of all victims in 2015.
0%
10%
20%
30%
40%
50%
60%
70%
80%
90%
100%
Killed Serious Injury Total Victims
Pro
po
rtio
n o
f To
tal
Proportion of People Killed and Injured by Road User Class: 2015
Pedestrian
Bicyclist
Motorcyclist/ Moped
Passenger
Driver

Section 5 Collision Victims
86
Table 5-11 Collision Victims by Collision Type and Casualty Type
Table 5-11
Collision Victims by Collision Type and Casualty Type: 2015
Collision Type
2015 Casualty Type
2015 Total
Victims
% of 2015 Total
Victims Killed
% of Total Killed
Serious Injury
% of Total
Serious Injury
Minor Injury
% of Total Minor Injury
Minimal Injury
% of Total
Minimal Injury
Other Injury
% of Total Other Injury
Total Injured
% of Total
Injured
Collision with pedestrian 1 1.3% 9 2.2% 16 0.8% 15 0.2% 3 0.5% 43 0.4% 44 0.4%
Collision with other motor vehicle 53 67.9% 242 58.3% 1,466 75.3% 7,761 86.1% 445 79.0% 9,914 83.0% 9,967 82.9%
Collisions with train 1 1.3% 0 - 0 - 2 <0.1% 0 - 2 <0.1% 3 <0.1%
Collision with motorcycle 1 1.3% 2 0.5% 4 0.2% 3 <0.1% 1 0.2% 10 <0.1% 11 <0.1%
Collision with animal drawn vehicle 0 - 0 - 0 - 0 - 0 - 0 - 0 -
Collision with bicycle 0 - 0 - 2 0.1% 7 <0.1% 0 - 9 <0.1% 9 <0.1%
Collision with animal 1 1.3% 5 1.2% 41 2.1% 267 3.0% 20 3.6% 333 2.8% 334 2.8%
Collision with fixed object 18 23.1% 99 23.9% 247 12.7% 535 5.9% 47 8.3% 928 7.8% 946 7.9%
Collision with other object 2 2.6% 48 11.6% 145 7.4% 373 4.1% 36 6.4% 602 5.0% 604 5.0%
Overturned in roadway 0 - 2 0.5% 2 0.1% 5 <0.1% 0 - 9 <0.1% 9 <0.1%
Ran off roadway 1 1.3% 5 1.2% 8 0.4% 5 <0.1% 3 0.5% 21 0.2% 22 0.2%
Collision with moped 0 - 0 - 0 - 0 - 0 - 0 - 0 -
Other non-collision 0 - 3 0.7% 16 0.8% 41 0.5% 8 1.4% 68 0.6% 68 0.6%
Total 78 100% 415 100% 1,947 100% 9,014 100% 563 100% 11,939 100% 12,017 100%

Section 5 Collision Victims
87
Table 5-11a Collision Victims by Collision Type and Casualty Type for Previous Five Years
Table 5-11a
Collision Victims by Collision Type and Casualty Type: 2010-2014 Average
Collision Type
2010-2014 Average Count of Victims
Killed Serious Injury
Minor Injury
Minimal Injury
Other Injury
Total Injured
Total Victims
% of Total
Victims
Collision with pedestrian 8 15 59 39 50 163 171 1.7%
Collision with other motor vehicle 37 154 1,488 5,416 349 7,407 7,443 76.2%
Collisions with train 1 1 1 <1 - 3 4 <0.1%
Collision with motorcycle 2 7 16 15 11 49 51 0.5%
Collision with animal drawn vehicle - - - - - - - -
Collision with bicycle 3 4 36 37 28 104 107 1.1%
Collision with animal <1 6 48 201 8 262 262 2.7%
Collision with fixed object 12 43 251 394 20 708 720 7.4%
Collision with other object 6 27 134 325 10 496 503 5.1%
Overturned in roadway 3 9 55 24 1 90 93 0.9%
Ran off roadway 17 44 155 80 26 305 322 3.3%
Collision with moped - - <1 - - <1 <1 <0.1%
Other non-collision <1 6 31 56 <1 94 94 1.0%
Total 89 316 2,275 6,588 503 9,681 9,771 100%
Note: Counts of victims in the 2010-2014 average may not add to the total due to rounding. Note: There are several victims in 2014 where collision type was not captured; these are not included in the average calculation.
Motor vehicles colliding with other motor vehicles account for the majority of casualties in Manitoba, both in 2015 and in the previous five year (2010 to 2014) annual average. In 2015, “collision with other motor vehicle” accounts for:
83% of all casualties (76% in the previous five years);
68% of people killed (41% in the previous five years); and,
58% of people seriously injured (49% in the previous five years). “Collision with a pedestrian”, “collision with motorcycle”, “collision with fixed object”, and “ran off roadway” each account for a higher proportion of people killed than of people injured in traffic collisions.

Section 5 Collision Victims
88
Table 5-12 Collision Victims by Accident Configuration and Casualty Type
Table 5-12
Collision Victims by Accident Configuration and Casualty Type: 2015
Accident Configuration
2015 Casualty Type
2015 Total
Victims
% of 2015 Total
Victims Killed
% of Total Killed
Serious Injury
% of Total
Serious Injury
Minor Injury
% of Total Minor Injury
Minimal Injury
% of Total
Minimal Injury
Other Injury
% of Total Other Injury
Total Injured
% of Total
Injured
Rear End 4 6.0% 47 15.1% 394 24.7% 4,449 57.0% 251 52.7% 5,141 50.5% 5,145 50.2%
Head On 23 34.3% 20 6.4% 54 3.4% 84 1.1% 9 1.9% 167 1.6% 190 1.9%
Side Swipe Opposing 0 - 1 0.3% 15 0.9% 46 0.6% 1 0.2% 63 0.6% 63 0.6%
Side Swipe Same Direction 0 - 9 2.9% 47 2.9% 390 5.0% 20 4.2% 466 4.6% 466 4.5%
Overtaking 1 1.5% 0 - 6 0.4% 20 0.3% 2 0.4% 28 0.3% 29 0.3%
Right Turn - Same direction 0 - 0 - 4 0.3% 22 0.3% 0 - 26 0.3% 26 0.3%
Right Turn – Opposing 0 - 0 - 2 0.1% 9 0.1% 0 - 11 0.1% 11 0.1%
Left Turn – Opposing 0 - 15 4.8% 58 3.6% 235 3.0% 13 2.7% 321 3.2% 321 3.1%
Left Turn - Same direction 0 - 0 - 6 0.4% 35 0.4% 3 0.6% 44 0.4% 44 0.4%
Left Turn – Across 1 1.5% 8 2.6% 53 3.3% 166 2.1% 11 2.3% 238 2.3% 239 2.3%
Intersection 90° 15 22.4% 105 33.7% 655 41.1% 1,719 22.0% 116 24.4% 2,595 25.5% 2,610 25.4%
Off Road Right 7 10.4% 55 17.6% 107 6.7% 141 1.8% 13 2.7% 316 3.1% 323 3.1%
Off Road Left 2 3.0% 27 8.7% 76 4.8% 91 1.2% 9 1.9% 203 2.0% 205 2.0%
Fixed Object 5 7.5% 14 4.5% 74 4.6% 242 3.1% 17 3.6% 347 3.4% 352 3.4%
Parking 0 - 3 1.0% 16 1.0% 135 1.7% 5 1.1% 159 1.6% 159 1.6%
Pedestrian 9 13.4% 8 2.6% 28 1.8% 23 0.3% 6 1.3% 65 0.6% 74 0.7%
Other 11 - 103 - 352 - 1,207 - 87 - 1,749 - 1,760 -
Total 78 100% 415 100% 1,947 100% 9,014 100% 563 100% 11,939 100% 12,017 100%
Note: “Other” accident configurations consist primarily of collisions involving more than one configuration or sequence of events. Calculations in "% of Total" exclude the "Other" category.

Section 5 Collision Victims
89
Table 5-12a Collision Victims by Accident Configuration and Casualty Type for Previous Five Years
Table 5-12a
Collision Victims by Accident Configuration and Casualty Type: 2010-2014 Average
Accident Configuration
2010-2014 Average Count of Victims
Killed Serious Injury
Minor Injury
Minimal Injury
Other Injury
Total Injured
Total Victims
% of Total Victims
Rear End 2 27 455 3,060 127 3,669 3,671 44.9%
Head On 14 27 83 142 9 260 274 3.4%
Side Swipe Opposing 1 7 27 60 <1 95 96 1.2%
Side Swipe Same Direction <1 4 51 264 11 330 330 4.0%
Overtaking 1 3 12 37 6 58 59 0.7%
Right Turn - Same direction - <1 5 22 2 30 30 0.4%
Right Turn - Opposing - <1 5 11 2 18 18 0.2%
Left Turn - Opposing <1 5 66 160 5 235 236 2.9%
Left Turn - Same direction - <1 14 29 3 48 48 0.6%
Left Turn - Across <1 6 80 149 19 254 255 3.1%
Intersection 90° 10 67 582 1,184 72 1,905 1,916 23.5%
Off Road Right 10 32 162 144 8 345 355 4.4%
Off Road Left 9 24 128 105 8 265 274 3.3%
Fixed Object 3 17 89 203 11 321 323 4.0%
Parking - <1 8 83 2 93 93 1.1%
Pedestrian 11 17 64 50 50 180 191 2.3%
Other 27 82 450 900 170 1,601 1,628 -
Total 89 319 2,281 6,604 503 9,707 9,797 100%
Note: Counts of victims in the 2010-2014 average may not add to the total due to rounding. Note: “Other” accident configurations consist primarily of collisions involving more than one configuration or sequence of events. Calculations in "% of Total" exclude the "Other" category. Note: There are several victims in 2014 where accident configuration was not captured; these are not included in the average calculation.
“Rear end” collisions and those occurring at “intersections 90°” account for the highest proportions of casualties, followed by collisions where the vehicle leaves the road (either in the right or left), side-wipe collisions, and collisions involving at least one vehicle turning. In 2015:
“Rear end” collisions account for 50% of all victims, 6% of people killed, and 15% of people seriously injured;
“Intersection 90°” collisions account for 25% of all victims, 22% of people killed, and 34% of people seriously injured;
“Off road” (either right or left) collisions account for 5% of all victims, 13% of people killed, and 26% of people seriously injured; and,
“Left turn” (including across, in the same direction, and opposing) collisions account for 6% of all victims, 1 person killed, and 7% of people seriously injured.
In 2015, people are most often killed in traffic collisions where:
A “head on” collision occurs (34% of people killed);
A collision occurs at 90° intersections (22% of people killed);
A vehicle goes “off road” (either right or left; 13% of people killed); or,
A “pedestrian” collision occurs (13% of people killed).
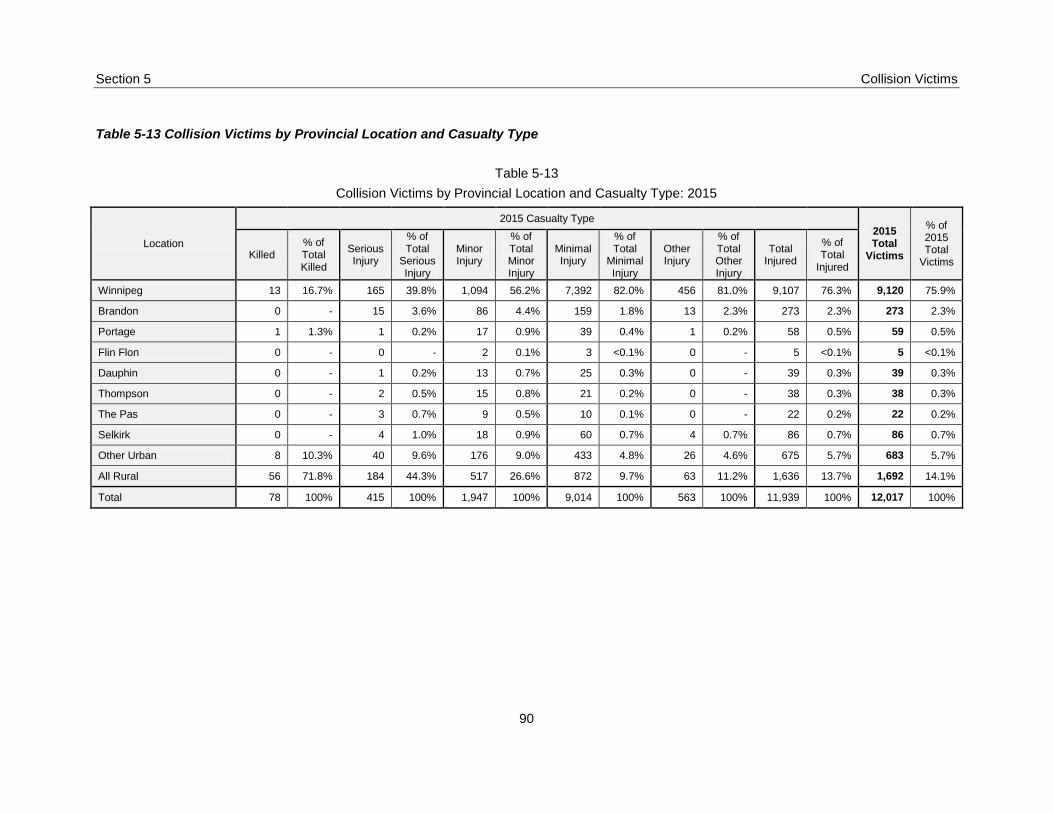
Section 5 Collision Victims
90
Table 5-13 Collision Victims by Provincial Location and Casualty Type
Table 5-13
Collision Victims by Provincial Location and Casualty Type: 2015
Location
2015 Casualty Type
2015 Total
Victims
% of 2015 Total
Victims Killed
% of Total Killed
Serious Injury
% of Total
Serious Injury
Minor Injury
% of Total Minor Injury
Minimal Injury
% of Total
Minimal Injury
Other Injury
% of Total Other Injury
Total Injured
% of Total
Injured
Winnipeg 13 16.7% 165 39.8% 1,094 56.2% 7,392 82.0% 456 81.0% 9,107 76.3% 9,120 75.9%
Brandon 0 - 15 3.6% 86 4.4% 159 1.8% 13 2.3% 273 2.3% 273 2.3%
Portage 1 1.3% 1 0.2% 17 0.9% 39 0.4% 1 0.2% 58 0.5% 59 0.5%
Flin Flon 0 - 0 - 2 0.1% 3 <0.1% 0 - 5 <0.1% 5 <0.1%
Dauphin 0 - 1 0.2% 13 0.7% 25 0.3% 0 - 39 0.3% 39 0.3%
Thompson 0 - 2 0.5% 15 0.8% 21 0.2% 0 - 38 0.3% 38 0.3%
The Pas 0 - 3 0.7% 9 0.5% 10 0.1% 0 - 22 0.2% 22 0.2%
Selkirk 0 - 4 1.0% 18 0.9% 60 0.7% 4 0.7% 86 0.7% 86 0.7%
Other Urban 8 10.3% 40 9.6% 176 9.0% 433 4.8% 26 4.6% 675 5.7% 683 5.7%
All Rural 56 71.8% 184 44.3% 517 26.6% 872 9.7% 63 11.2% 1,636 13.7% 1,692 14.1%
Total 78 100% 415 100% 1,947 100% 9,014 100% 563 100% 11,939 100% 12,017 100%

Section 5 Collision Victims
91
Table 5-13a Collision Victims by Provincial Location and Casualty Type for Previous Five Years
Table 5-13a
Collision Victims by Provincial Location and Casualty: 2010-2014 Average
Location
2010-2014 Average Count of Victims
Killed Serious Injury
Minor Injury
Minimal Injury
Other Injury
Total Injured
Total Victims
% of Total
Victims
Winnipeg 16 108 1,146 5,252 407 6,913 6,929 70.7%
Brandon <1 7 100 145 9 260 261 2.7%
Portage - 3 27 33 2 65 65 0.7%
Flin Flon <1 <1 2 4 <1 8 9 <0.1%
Dauphin 1 1 20 18 <1 40 41 0.4%
Thompson <1 1 13 21 3 38 39 0.4%
The Pas <1 1 8 8 1 19 19 0.2%
Selkirk <1 3 28 44 3 77 78 0.8%
Other Urban 11 40 249 393 19 702 712 7.3%
All Rural 59 155 689 687 57 1,588 1,648 16.8%
Total 89 320 2,282 6,606 503 9,711 9,800 100%
Note: Counts of victims in the 2010-2014 average may not add to the total due to rounding.
While traffic collisions occurring in urban locations account for the majority of casualties overall, traffic collisions in rural locations account for the majority of people killed and seriously injured. In 2015, 86% of all casualties result from traffic collisions in urban areas. Traffic collisions in rural locations, however, account for 72% of people killed and 44% of people seriously injured. In the previous five year (2010 to 2014) annual average, 83% of all victims are from traffic collisions in urban locations, while 67% of people killed and 48% of people seriously injured are from traffic collisions in rural locations.

Section 5 Collision Victims
92
Table 5-14 Collision Victims by Safety Equipment Use and Casualty Type
Table 5-14
Collision Victims by Safety Equipment Use and Casualty Type: 2015
Safety Equipment
2015 Casualty Type
2015 Total
Victims
% of 2015 Total
Victims Killed
% of Total Killed
Serious Injury
% of Total
Serious Injury
Minor Injury
% of Total Minor Injury
Minimal Injury
% of Total
Minimal Injury
Other Injury
% of Total Other Injury
Total Injured
% of Total
Injured
Lap belt only installed - In use 1 1.5% 4 1.0% 17 0.9% 68 0.8% 5 0.9% 94 0.8% 95 0.8%
Lap belt only installed - Not in use 0 - 4 1.0% 9 0.5% 20 0.2% 2 0.4% 35 0.3% 35 0.3%
Shoulder belt only installed - In use 0 - 0 - 12 0.6% 42 0.5% 0 - 54 0.5% 54 0.5%
Shoulder belt only installed - Not in use 1 1.5% 3 0.8% 4 0.2% 13 0.1% 3 0.5% 23 0.2% 24 0.2%
Lap and shoulder belt assembly - In use 12 17.6% 191 49.2% 1,097 59.4% 7,697 86.6% 477 87.2% 9,462 81.1% 9,474 80.7%
Combined belt installed - Not in use 8 11.8% 8 2.1% 20 1.1% 21 0.2% 1 0.2% 50 0.4% 58 0.5%
Only lap part of full assembly in use 0 - 1 0.3% 0 - 20 0.2% 2 0.4% 23 0.2% 23 0.2%
Air bag deployed - Safety belt in use 12 17.6% 108 27.8% 558 30.2% 751 8.5% 38 6.9% 1,455 12.5% 1,467 12.5%
Air bar deployed - Safety belt not use 2 2.9% 5 1.3% 9 0.5% 4 <0.1% 0 - 18 0.2% 20 0.2%
Safety seat properly installed - In use 0 - 10 2.6% 36 1.9% 122 1.4% 13 2.4% 181 1.6% 181 1.5%
Safety seat improperly installed - In use 1 1.5% 0 - 5 0.3% 11 0.1% 2 0.4% 18 0.2% 19 0.2%
Safety seat installed - Not in use 0 - 0 - 0 - 1 <0.1% 0 - 1 <0.1% 1 <0.1%
Safety helmet worn 4 5.9% 26 6.7% 47 2.5% 63 0.7% 2 0.4% 138 1.2% 142 1.2%
Safety helmet not worn 0 - 1 0.3% 0 - 1 <0.1% 0 - 2 <0.1% 2 <0.1%
No safety device available 1 1.5% 5 1.3% 11 0.6% 4 <0.1% 0 - 20 0.2% 21 0.2%
Other 0 - 3 0.8% 6 0.3% 17 0.2% 1 0.2% 27 0.2% 27 0.2%
Not Applicable 3 4.4% 2 0.5% 6 0.3% 20 0.2% 1 0.2% 29 0.2% 32 0.3%
Unknown 23 33.8% 17 4.4% 10 0.5% 11 0.1% 0 - 38 0.3% 61 0.5%
Total 68 100% 388 100% 1,847 100% 8,886 100% 547 100% 11,668 100% 11,736 100%
Note: Vehicle occupants (Road User Class = Driver, Passenger) plus Motorcyclists and Moped riders and their passengers.

Section 5 Collision Victims
93
Table 5-14a Collision Victims by Safety Equipment Use and Casualty Type for Previous Five Years
Table 5-14a
Collision Victims by Safety Equipment Use and Casualty Type: 2010-2014 Average
Safety Equipment
2010-2014 Average Count of Victims
Killed Serious Injury
Minor Injury
Minimal Injury
Other Injury
Total Injured
Total Victims
% of Total
Victims
Lap belt only installed - In use 1 4 54 91 4 153 154 1.6%
Lap belt only installed - Not in use 1 2 9 13 <1 24 25 0.3%
Shoulder belt only installed - In use 1 2 22 32 3 60 61 0.6%
Shoulder belt only installed - Not in use 2 2 8 14 <1 24 26 0.3%
Lap and shoulder belt assembly - In use 20 155 1,502 5,657 117 7,431 7,451 79.4%
Combined belt installed - Not in use 17 14 35 18 1 69 86 0.9%
Only lap part of full assembly in use - 1 4 14 - 19 19 0.2%
Air bag deployed - Safety belt in use 6 48 307 303 8 666 672 7.2%
Air bar deployed - Safety belt not use 3 4 11 8 <1 24 27 0.3%
Safety seat properly installed - In use 1 1 46 107 1 155 156 1.7%
Safety seat improperly installed - In use <1 <1 4 6 - 11 11 0.1%
Safety seat installed - Not in use <1 <1 2 2 - 4 4 <0.1%
Safety helmet worn 2 18 43 38 2 101 104 1.1%
Safety helmet not worn <1 4 1 1 - 6 7 <0.1%
No safety device available <1 <1 3 4 - 8 8 <0.1%
Other 1 2 6 18 2 29 30 0.3%
Not Applicable 1 2 6 11 2 21 22 0.2%
Unknown 13 24 60 141 275 501 515 5.5%
Total 73 286 2,125 6,478 418 9,307 9,380 100%
Note: Counts of victims in the 2010-2014 average may not add to the total due to rounding. Note: Vehicle occupants (Road User Class = Driver, Passenger) plus Motorcyclists and Moped riders and their passengers.
In 2015, most victims in traffic collisions were using safety equipment at the time of the collision (99% of all victims where safety equipment use is known, i.e., excluding “other”, “not applicable” and “unknown”). In 2015, 29% of the people killed in traffic collisions and 7% of the people seriously injured in traffic collisions are recorded as not wearing or using the available safety equipment at the time of the collision.

Section 5 Collision Victims
94
Table 5-15 Safety Equipment Effectiveness
Table 5-15
Safety Equipment Effectiveness - Ratio of Victims Killed and Injured While 'Not Using Safety Equipment' to 'Using Safety Equipment': 2015
Safety Equipment Use
Total Casualties
Killed % of Total Casualties
Serious Injury
% of Total Casualties
Minor/ Minimal Injury
% of Total Casualties
Other Injury
% of Total Casualties
Equipment not in use 161 12 7.5% 26 16.1% 117 72.7% 6 3.7%
Equipment in use 11,455 30 0.3% 340 3.0% 10,546 92.1% 539 4.7%
Safety Equipment Effectiveness* 28.46 5.44 0.79 0.79
*Ratio of % not using equipment over the % using equipment.
As a large majority of vehicle occupants use safety equipment (such as seatbelts, child restraints and helmets), the number of victims in traffic collisions who use safety equipment exceeds the number of victims who did not use safety equipment. Considering this, one might erroneously conclude that using safety equipment contributes to more victims. When considering the effectiveness of safety equipment in a traffic collision, the proportion of victims by casualty type who use safety equipment is compared to the proportion of victims by casualty type not using safety equipment. In this manner, it is possible to determine the effectiveness of the equipment by examining how much more likely the victim is to sustain injuries of a specific severity when using or not using safety equipment. As shown in Table 5-15, in 2015, victims not using safety equipment are twenty-eight times more likely to be killed and five times more likely to be seriously injured in a traffic collision than those who used the equipment. Over the previous five years (2010 to 2014), people not using the available safety equipment are nearly thirty-six times more likely to be killed and five times more likely to be seriously injured in a collision than people using the equipment.
Figure 5-8 Safety Equipment Effectiveness: Ratio of “Not Using Equipment” to “Using Equipment”
0
10
20
30
40
50
60
70
2005 2006 2007 2008 2009 2010 2011 2012 2013 2014 2015
Rat
io (
% n
ot
usi
ng
/ %
usi
ng)
Safety Equipment Effectiveness - Ratio of "Not Using Equipment" to "Using Equipment": 2005 to 2015
Killed Seriously injured Minor/Minimal injury

Section 5 Collision Victims
95
Table 5-16 Vehicle Occupant Victim Ejections in Traffic Collision
Table 5-16
Vehicle Occupant Victims by Ejection From Vehicle and Casualty Type: 2015
Ejection
2015 Casualty Type
2015 Total
Victims
% of 2015 Total
Victims Killed
% of Total Killed
Serious Injury
% of Total
Serious Injury
Minor Injury
% of Total Minor Injury
Minimal Injury
% of Total
Minimal Injury
Other Injury
% of Total Other Injury
Total Injured
% of Total
Injured
Not Ejected 54 87.1% 337 93.9% 1,782 98.9% 8,780 99.6% 542 99.4% 11,441 99.3% 11,495 99.2%
Fully Ejected 5 8.1% 19 5.3% 15 0.8% 21 0.2% 3 0.6% 58 0.5% 63 0.5%
Partially Ejected 3 4.8% 3 0.8% 4 0.2% 18 0.2% 0 - 25 0.2% 28 0.2%
Total 62 100% 359 100% 1,801 100% 8,819 100% 545 100% 11,524 100% 11,586 100%
NOTE: Vehicle occupants (Drivers and Passengers; excluding Motorcyclist, Moped riders and passengers).

96
Table 5-16a Vehicle Occupant Victim Ejections in Traffic Collision for Previous Five Years
Table 5-16a
Vehicle Occupant Victims by Ejection From Vehicle and Casualty: 2010-2014 Average
Ejection
2010-2014 Average Count of Victims
Killed Serious Injury
Minor Injury
Minimal Injury
Other Injury
Total Injured
Total Victims
% of Total
Victims
Not Ejected 50 239 2,052 6,385 404 9,079 9,129 98.7%
Fully Ejected 17 24 22 39 2 87 103 1.1%
Partially Ejected 2 3 5 8 0 17 19 0.2%
Total 69 266 2,079 6,433 406 9,183 9,252 100%
Note: Counts of victims in the 2010-2014 average may not add to the total due to rounding. Note: Vehicle occupants (Drivers and Passengers; excluding Motorcyclist, Moped riders and passengers).
In 2015, people fully or partially ejected from a vehicle and killed during a traffic collision account for 9% of all victims ejected from the vehicle. People killed but not ejected account for 0.5% of all victims not ejected during the collision. This makes people ejected during a collision nineteen times more likely to be killed than people not ejected. Similarly, people ejected and seriously injured during a collision account for 24% of all victims ejected while people seriously injured but not ejected account for only 3% of victims not ejected. This makes people ejected during a collision eight times more likely to be seriously injured than people not ejected. It is not common for a victim to be ejected from a vehicle during a collision while using the available safety equipment. In 2015, 98% of vehicle occupant casualties were using the available safety equipment (seatbelts and child safety seats) and were not ejected from the vehicle. Even though the proportion of casualties ejected from the vehicle is very small, people ejected from a vehicle are much more likely to be killed or seriously injured when they are not using seatbelts and child safety seats. In 2015, 4 of 5 people ejected and killed were not using the available safety equipment at the time of the collision. This compares to only one person ejected and killed who was using the available safety equipment. In the previous five year (2010 to 2014) annual average, people ejected from a vehicle while not using the seatbelts and child safety seats are nearly seven times more likely to be killed than people ejected from a vehicle while using seatbelts and child safety seats.
SECTION 6 – Pedestrian Victims


Section 6 Pedestrian Victims
99
Introduction
This section counts the number of pedestrians killed and injured in traffic collisions and examines the severity of the injury received by the pedestrian. Month, time and day of occurrence are examined and breaks are provided for the age of the pedestrian. The specific pedestrian actions taken immediately prior to the collision are also presented. Involvement rate of pedestrians in traffic collisions per 100,000 people in the general population is also calculated. Key Highlights In 2015, there are 130 pedestrians killed or injured in traffic collisions. Of these:
9 are killed;
18 are seriously injured;
51 sustain minor injuries;
40 sustain minimal injuries; and
12 sustain injuries that are undefined in terms of severity. The involvement rate (per 100,000 people in the general population) of pedestrians in traffic collisions in 2015 (9.8) has decreased by 8% compared to 2014 (10.7) and by 47% compared to the previous five year (2010 to 2014) annual average (18.6). Pedestrian involvement rate in fatal and injury collisions has decreased compared to the five year (2010 to 2014) annual average. Pedestrian involvement rate in traffic collisions in 2015 where a pedestrian:
Is killed (0.7) is less than 2014 (0.8) and has decreased by 26% compared to the previous five year average; and,
Is injured (9.2) has decreased by 7% compared to 2014 (9.9) and by 48% compared to the previous five year average (17.7).
In 2015, collisions involving pedestrians most frequently occur:
In January, February and March (nearly 12% of pedestrian casualties, respectively); however, 6 of 9 pedestrians are killed between July and October;
On Tuesday, Friday and Saturday (19%, 25% and 15% of pedestrian casualties, respectively); 7 of 9 pedestrians are killed between Thursday and Sunday; and,
Between noon and 6 p.m. (12:00-14:59 – 27% of pedestrian casualties; 15:00 to 17:59 – 23% of pedestrian casualties); however, 6 of 9 pedestrians are killed between noon and midnight, and 2 of 9 are killed from 6 a.m. to noon.
Manitobans aged 20 to 24 have the highest involvement rate (per 100,000 people) in traffic collisions at 19.6 in 2015 (21.8 in the previous five years), followed by those aged 35 to 44 at 12.4 (13.3 in the previous five years). Where the actions of the pedestrian immediately prior to the collision are known, most pedestrian casualties in 2015 occur when the pedestrian is:
At an intersection, crossing with the right of way (45% of pedestrian casualties);
Between intersections (7% of pedestrian casualties);
At an intersection with no traffic control (6% of pedestrian casualties); and,
On the sidewalk/median/safety zone (5% of pedestrian casualties). For the 9 pedestrians killed in traffic collisions in 2015, 1 is killed at an intersection while crossing with the right of way, 2 while walking along roadway with traffic, 1 while walking on the sidewalk/median/safety zone, and 1 while running into the roadway. No pedestrian action was recorded for 3 of the 9 pedestrians killed, and 1 was indicated as ‘other’.
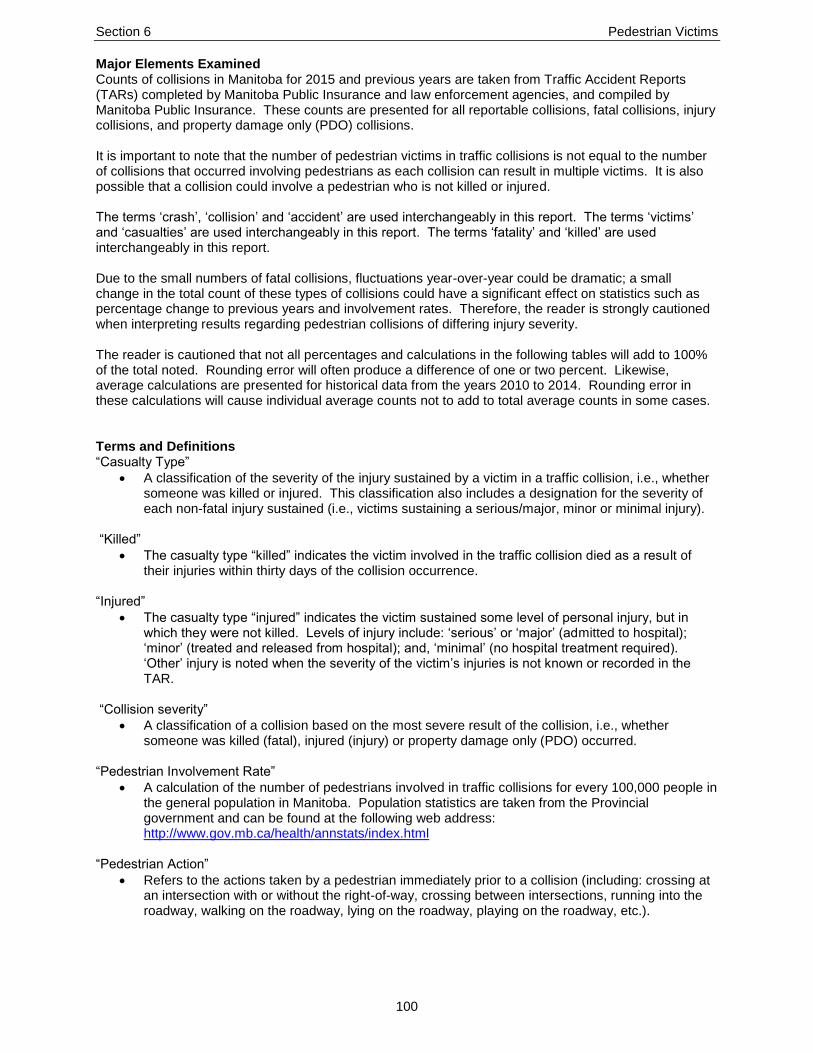
Section 6 Pedestrian Victims
100
Major Elements Examined Counts of collisions in Manitoba for 2015 and previous years are taken from Traffic Accident Reports (TARs) completed by Manitoba Public Insurance and law enforcement agencies, and compiled by Manitoba Public Insurance. These counts are presented for all reportable collisions, fatal collisions, injury collisions, and property damage only (PDO) collisions. It is important to note that the number of pedestrian victims in traffic collisions is not equal to the number of collisions that occurred involving pedestrians as each collision can result in multiple victims. It is also possible that a collision could involve a pedestrian who is not killed or injured. The terms ‘crash’, ‘collision’ and ‘accident’ are used interchangeably in this report. The terms ‘victims’ and ‘casualties’ are used interchangeably in this report. The terms ‘fatality’ and ‘killed’ are used interchangeably in this report. Due to the small numbers of fatal collisions, fluctuations year-over-year could be dramatic; a small change in the total count of these types of collisions could have a significant effect on statistics such as percentage change to previous years and involvement rates. Therefore, the reader is strongly cautioned when interpreting results regarding pedestrian collisions of differing injury severity. The reader is cautioned that not all percentages and calculations in the following tables will add to 100% of the total noted. Rounding error will often produce a difference of one or two percent. Likewise, average calculations are presented for historical data from the years 2010 to 2014. Rounding error in these calculations will cause individual average counts not to add to total average counts in some cases. Terms and Definitions “Casualty Type”
A classification of the severity of the injury sustained by a victim in a traffic collision, i.e., whether someone was killed or injured. This classification also includes a designation for the severity of each non-fatal injury sustained (i.e., victims sustaining a serious/major, minor or minimal injury).
“Killed”
The casualty type “killed” indicates the victim involved in the traffic collision died as a result of their injuries within thirty days of the collision occurrence.
“Injured”
The casualty type “injured” indicates the victim sustained some level of personal injury, but in which they were not killed. Levels of injury include: ‘serious’ or ‘major’ (admitted to hospital); ‘minor’ (treated and released from hospital); and, ‘minimal’ (no hospital treatment required). ‘Other’ injury is noted when the severity of the victim’s injuries is not known or recorded in the TAR.
“Collision severity”
A classification of a collision based on the most severe result of the collision, i.e., whether someone was killed (fatal), injured (injury) or property damage only (PDO) occurred.
“Pedestrian Involvement Rate”
A calculation of the number of pedestrians involved in traffic collisions for every 100,000 people in the general population in Manitoba. Population statistics are taken from the Provincial government and can be found at the following web address: http://www.gov.mb.ca/health/annstats/index.html
“Pedestrian Action”
Refers to the actions taken by a pedestrian immediately prior to a collision (including: crossing at an intersection with or without the right-of-way, crossing between intersections, running into the roadway, walking on the roadway, lying on the roadway, playing on the roadway, etc.).

Section 6 Pedestrian Victims
101
Table 6-1 Historical Summary of Pedestrians Killed and Injured in Traffic Collisions
Table 6-1
Historical Summary of Pedestrians Killed and Injured in Traffic Collisions: 2005 to 2015
Year
Casualty Type
Total Victims
% change
to previous
year
Killed
% change
to previous
year
Serious Injury
% change
to previous
year
Minor Injury
% change
to previous
year
Minimal Injury
% change
to previous
year
Other Injury
% change
to previous
year
Total Injured
% change
to previous
year
2005 11 - 36 - 173 - 152 - 68 - 429 - 440 -
2006 14 27.3% 71 97.2% 207 19.7% 141 -7.2% 83 22.1% 502 17.0% 516 17.3%
2007 16 14.3% 52 -26.8% 161 -22.2% 107 -24.1% 109 31.3% 429 -14.5% 445 -13.8%
2008 15 -6.3% 49 -5.8% 153 -5.0% 133 24.3% 88 -19.3% 423 -1.4% 438 -1.6%
2009 9 -40.0% 37 -24.5% 137 -10.5% 90 -32.3% 95 8.0% 359 -15.1% 368 -16.0%
2010 14 55.6% 32 -13.5% 126 -8.0% 111 23.3% 116 22.1% 385 7.2% 399 8.4%
2011 10 -28.6% 24 -25.0% 130 3.2% 62 -44.1% 114 -1.7% 330 -14.3% 340 -14.8%
2012 13 30.0% 21 -12.5% 90 -30.8% 40 -35.5% 12 -89.5% 163 -50.6% 176 -48.2%
2013 10 -23.1% 22 4.8% 49 -45.6% 25 -37.5% 10 -16.7% 106 -35.0% 116 -34.1%
2014 11 10.0% 21 -4.5% 64 30.6% 35 40.0% 9 -10.0% 129 21.7% 140 20.7%
2015 9 -18.2% 18 -14.3% 51 -20.3% 40 14.3% 12 33.3% 121 -6.2% 130 -7.1%
2010-2014 Average* 12 8.8% 24 -10.2% 92 -10.1% 55 -10.8% 52 -19.2% 223 -14.2% 234 -13.6%
*The '% change to previous year' for '2010-2014 Average' is an average rate of change for the time period 2010-2014.

Section 6 Pedestrian Victims
102
In 2015, there are 130 pedestrians killed or injured in traffic collisions. Of these:
9 are killed;
18 are seriously injured;
51 sustain minor injuries;
40 sustain minimal injuries; and
12 sustain injuries that are undefined in terms of severity. The total number of pedestrians killed and injured in traffic collisions in 2015 has decreased by 7% compared to 2014 and by nearly 45% compared to the previous five year (2010 to 2014) annual average. In 2015, the number of pedestrians:
Killed has decreased by a count of two compared to 2014 and is 3 fewer than the previous five years;
Sustaining serious injuries has decreased by a count of three compared to 2014 and by 25% compared to the previous five years;
Sustaining minor injuries has decreased by 20% compared to 2014 and by 44% compared to the previous five years;
Sustaining minimal injuries has increased by 14% compared to 2014 but has decreased by 27% compared to the previous five years; and,
Sustaining an unspecified injury has increased by 33% compared to 2014 but has decreased by 77% compared to the previous five years.
The number of pedestrians killed in traffic collisions over the past ten years has fluctuated, ranging from a high of 16 in 2007 to a low of 9 in 2009 and 2015. The number of pedestrians killed in 2015 is slightly down compared to 2014 and to the previous five year (2010 to 2014) annual average. Recognizing that counts of pedestrians involved in collisions could be impacted either positively or negatively by changing population statistics, involvement rates per 100,000 people in the general population in Manitoba is examined (see Table 6-2) to provide a standardized rate comparison. This accounts for changing population size instead of simply a raw count of the number of pedestrians involved overall.

Section 6 Pedestrian Victims
103
Table 6-2 Historical Summary of Pedestrian Involvement Rate (per 100,000 people) in Traffic Collisions
Table 6-2
Historical Summary of Pedestrian Involvement Rates (per 100,000 people) in Traffic Collisions: 2005 to 2015
Year
Casualty Type
Total Victims
% change to
previous year
Killed
% change to
previous year
Serious Injury
% change to
previous year
Minor Injury
% change to
previous year
Minimal Injury
% change to
previous year
Other Injury
% change to
previous year
Total Injured
% change to
previous year
2005 0.9 - 3.1 - 14.7 - 12.9 - 5.8 - 36.5 - 37.5 -
2006 1.2 26.8% 6.0 96.4% 17.6 19.2% 12.0 -7.6% 7.0 21.6% 42.6 16.6% 43.8 16.8%
2007 1.3 13.5% 4.4 -27.3% 13.6 -22.7% 9.0 -24.6% 9.2 30.4% 36.2 -15.1% 37.5 -14.3%
2008 1.3 -7.2% 4.1 -6.8% 12.8 -6.0% 11.1 23.0% 7.3 -20.1% 35.3 -2.4% 36.5 -2.6%
2009 0.7 -40.8% 3.0 -25.4% 11.3 -11.6% 7.4 -33.2% 7.8 6.6% 29.6 -16.2% 30.3 -17.0%
2010 1.1 53.5% 2.6 -14.6% 10.2 -9.2% 9.0 21.7% 9.4 20.5% 31.3 5.9% 32.4 7.0%
2011 0.8 -29.7% 1.9 -26.2% 10.4 1.5% 5.0 -45.0% 9.1 -3.3% 26.4 -15.7% 27.2 -16.2%
2012 1.0 27.9% 1.7 -13.9% 7.1 -31.9% 3.1 -36.5% 0.9 -89.6% 12.8 -51.4% 13.8 -49.1%
2013 0.8 -24.1% 1.7 3.3% 3.8 -46.3% 1.9 -38.4% 0.8 -17.8% 8.2 -35.9% 9.0 -35.0%
2014 0.8 8.6% 1.6 -5.8% 4.9 28.9% 2.7 38.2% 0.7 -11.2% 9.9 20.1% 10.7 19.1%
2015 0.7 -19.1% 1.4 -15.2% 3.9 -21.2% 3.0 13.1% 0.9 31.9% 9.2 -7.2% 9.8 -8.1%
2010-2014 Average* 0.9 7.2% 1.9 -11.5% 7.3 -11.4% 4.3 -12.0% 4.2 -20.3% 17.7 -15.4% 18.6 -14.8%
*The '% change to previous year' for '2010-2014 Average' is an average rate of change for the time period 2010-2014.

Section 6 Pedestrian Victims
104
The involvement rate (per 100,000 people in the general population) of pedestrians in traffic collisions in 2015 (9.8) has decreased by 8% compared to 2014 (10.7) and by 47% compared to the previous five year (2010 to 2014) annual average (18.6). The pedestrian involvement rate in fatal and injury collisions has decreased compared to the five year (2010 to 2014) annual average. Pedestrian involvement rate in traffic collisions in 2015 where a pedestrian:
Is killed (0.7) is less than 2014 (0.8) and has decreased by 26% compared to the previous five year average; and,
Is injured (9.2) has decreased by 7% compared to 2014 (9.9) and by 48% compared to the previous five year average (17.7).
Sustains serious injuries (1.4) has decreased by 15% compared to 2014 and by 28% compared to the previous five years;
Sustains minor injuries (3.9) has decreased by 21% compared to 2014 and by 47% compared to the previous five years;
Sustains minimal injuries (3.0) has increased by 13% compared to 2014, but has decreased by 30% compared to the previous five years; and,
Sustains an unspecified injury (0.9) has increased by 32% compared to 2014, but has decreased by 78% compared to the previous five years.
Figure 6-1 Pedestrian Involvement Rate (per 100,000 People) in Traffic Collisions
Over the last eleven years (2005 to 2015), pedestrian injuries resulting from traffic collisions have generally declined. Since 2010, the involvement rate has decreased by an average of 15% each year. Over this same time frame, the involvement rate for pedestrians killed in traffic collisions has fluctuated somewhat, but has consistently been between 0.7 and 1.3. The involvement rate in 2015 is in line with the pedestrian involvement rate for deaths recorded in the past eleven years, although it is one of the lower rates in that time period.
0.0
1.0
2.0
3.0
4.0
5.0
0.0
10.0
20.0
30.0
40.0
50.0
2005 2006 2007 2008 2009 2010 2011 2012 2013 2014 2015
Invo
lvem
ent
Rat
e fo
r K
illed
Invo
lvem
ent
Rat
e fo
r To
tal I
nju
red
Pedestrian Involvement Rate (per 100,000 People) in Traffic Collisions: 2005 - 2015
Injured Killed

Section 6 Pedestrian Victims
105
Table 6-3 Pedestrians Killed and Injured by Month of Occurrence and Casualty Type
Table 6-3
Total Pedestrians Killed and Injured by Month of Occurrence and Casualty Type: 2015
Month of Occurrence
2015 Casualty Type
2015 Total
Victims
% of 2015 Total
Victims Killed
% of Total Killed
Serious Injury
% of Total
Serious Injury
Minor Injury
% of Total Minor Injury
Minimal Injury
% of Total Minimal Injury
Other Injury
% of Total Other Injury
Total Injured
% of Total
Injured
January 0 - 2 11.1% 5 9.8% 7 17.5% 1 8.3% 15 12.4% 15 11.5%
February 0 - 4 22.2% 6 11.8% 3 7.5% 3 25.0% 16 13.2% 16 12.3%
March 0 - 4 22.2% 9 17.6% 1 2.5% 1 8.3% 15 12.4% 15 11.5%
April 2 22.2% 0 - 2 3.9% 0 - 0 - 2 1.7% 4 3.1%
May 1 11.1% 0 - 3 5.9% 5 12.5% 0 - 8 6.6% 9 6.9%
June 0 - 1 5.6% 1 2.0% 6 15.0% 0 - 8 6.6% 8 6.2%
July 3 33.3% 1 5.6% 4 7.8% 3 7.5% 1 8.3% 9 7.4% 12 9.2%
August 1 11.1% 1 5.6% 5 9.8% 1 2.5% 3 25.0% 10 8.3% 11 8.5%
September 1 11.1% 1 5.6% 3 5.9% 1 2.5% 0 - 5 4.1% 6 4.6%
October 1 11.1% 2 11.1% 6 11.8% 4 10.0% 0 - 12 9.9% 13 10.0%
November 0 - 2 11.1% 5 9.8% 4 10.0% 2 16.7% 13 10.7% 13 10.0%
December 0 - 0 - 2 3.9% 5 12.5% 1 8.3% 8 6.6% 8 6.2%
Total 9 100% 18 100% 51 100% 40 100% 12 100% 121 100% 130 100%

Section 6 Pedestrian Victims
106
Table 6-3a Pedestrians Killed and Injured by Month of Occurrence and Casualty Type for Previous Five Years
Table 6-3a
Pedestrians Killed and Injured by Month of Occurrence and Casualty Type: 2010-2014 Average
Month of Occurrence
2010-2014 Average Count of Victims
Killed Serious Injury
Minor Injury
Minimal Injury
Other Injury
Total Injured
Total Victims
% of Total
Victims
January <1 3 11 4 5 23 24 10.1%
February <1 2 6 4 5 16 17 7.3%
March <1 2 9 7 9 27 27 11.7%
April 2 2 7 5 3 17 19 8.0%
May <1 2 7 5 4 19 19 8.2%
June 1 1 6 4 5 17 18 7.6%
July 1 1 7 3 3 14 16 6.7%
August 1 3 7 5 4 19 20 8.6%
September 1 2 10 5 3 20 21 8.9%
October 1 3 8 5 3 19 21 8.8%
November <1 1 8 3 3 15 16 6.7%
December 2 2 7 3 4 16 17 7.4%
Total 12 24 92 55 52 223 234 100%
Note: Counts of pedestrians in the 2010-2014 average may not add to the total due to rounding.
In 2015, 6 of 9 pedestrians killed in collisions on Manitoba roadways are killed between July and October. Pedestrians are most likely to be injured in January (12%), February (12%) and March (12%). During the previous five year (2010 to 2014) annual average, January, March, September and October stand out as the months with the highest involvement of pedestrian casualties in collisions. Figure 6-2 Proportion of Pedestrians Killed and Injured by Month of Occurrence
0%
5%
10%
15%
20%
25%
30%
35%
Pro
po
rtio
n o
f To
tal
Proportion of Pedestrians Killed and Injured by Month of Occurrence: 2015
Killed Injured Total Victims
Note: Due to a small number of pedestrians killed, i.e., 9 deaths, caution is advised when interpreting those results.

Section 6 Pedestrian Victims
107
Table 6-4 Total Pedestrians Killed and Injured by Day of Occurrence and Casualty Type
Table 6-4
Total Pedestrians Killed and Injured by Day of Occurrence and Casualty Type: 2015
Day of the Week
2015 Casualty Type
2015 Total
Victims
% of 2015 Total
Victims Killed
% of Total Killed
Serious Injury
% of Total
Serious Injury
Minor Injury
% of Total Minor Injury
Minimal Injury
% of Total Minimal Injury
Other Injury
% of Total Other Injury
Total Injured
% of Total
Injured
Sunday 1 11.1% 2 11.1% 5 9.8% 4 10.0% 0 - 11 9.1% 12 9.2%
Monday 0 - 0 - 4 7.8% 4 10.0% 2 16.7% 10 8.3% 10 7.7%
Tuesday 2 22.2% 4 22.2% 10 19.6% 8 20.0% 1 8.3% 23 19.0% 25 19.2%
Wednesday 0 - 5 27.8% 7 13.7% 5 12.5% 0 - 17 14.0% 17 13.1%
Thursday 3 33.3% 1 5.6% 2 3.9% 7 17.5% 2 16.7% 12 9.9% 15 11.5%
Friday 1 11.1% 4 22.2% 15 29.4% 6 15.0% 6 50.0% 31 25.6% 32 24.6%
Saturday 2 22.2% 2 11.1% 8 15.7% 6 15.0% 1 8.3% 17 14.0% 19 14.6%
Total 9 100% 18 100% 51 100% 40 100% 12 100% 121 100% 130 100%

Section 6 Pedestrian Victims
108
Table 6-4a Pedestrians Killed and Injured by Day of Occurrence and Casualty Type for Previous Five Years
Table 6-4a
Pedestrians Killed and Injured by Day of Occurrence and Casualty Type: 2010-2014 Average
Day of the Week
2010-2014 Average Count of Victims
Killed Serious Injury
Minor Injury
Minimal Injury
Other Injury
Total Injured
Total Victims
% of Total Victims
Sunday 2 2 6 4 4 16 17 7.4%
Monday 2 3 11 7 5 26 28 12.0%
Tuesday 1 3 15 8 8 34 35 15.0%
Wednesday 1 4 16 9 11 41 42 18.0%
Thursday 2 4 17 11 9 40 42 17.8%
Friday 2 3 17 10 11 41 43 18.4%
Saturday 3 4 9 5 5 24 27 11.4%
Total 12 24 92 55 52 223 234 100%
Note: Counts of pedestrians in the 2010-2014 average may not add to the total due to rounding.
In 2015, more pedestrians are involved in traffic collisions on Tuesday (19% of all pedestrian casualties), Friday (25%), and Saturday (15%) than on other days of the week. In the previous five year (2010 to 2014) annual average, there are more pedestrians involved in traffic collisions on Wednesday (18%), Thursday (18%) and Friday (18%). In 2015, 7 of 9 pedestrians are killed in traffic collisions between Thursday and Sunday. In the previous five year (2010 to 2014) annual average, weekend (including Friday, Saturday and Sunday) collisions account for half of pedestrians killed (50%).
Figure 6-3 Proportion of Pedestrians Killed and Injured by Day of Occurrence
0%
5%
10%
15%
20%
25%
30%
35%
Sunday Monday Tuesday Wednesday Thursday Friday Saturday
Pro
po
rtio
n o
f To
tal
Proportion of Pedestrians Killed and Injured by Day of Occurrence and Casualty Type: 2015
Killed Injured Total Victims
Note: Due to a small number of pedestrians killed, i.e., 9 deaths, caution is advised when interpreting those results.

Section 6 Pedestrian Victims
109
Table 6-5 Total Pedestrians Killed and Injured by Time of Occurrence and Casualty Type
Table 6-5
Total Pedestrians Killed and Injured by Time of Occurrence and Casualty Type: 2015
Time of the Day
2015 Casualty Type
2015 Total
Victims
% of 2015 Total
Victims* Killed % of Total
Killed*
Serious Injury
% of Total
Serious Injury*
Minor Injury
% of Total Minor Injury*
Minimal Injury
% of Total Minimal Injury*
Other Injury
% of Total Other Injury*
Total Injured
% of Total Injured*
00:00 - 02:59 0 - 3 16.7% 3 6.0% 0 - 0 - 6 5.0% 6 4.7%
03:00 - 05:59 0 - 1 5.6% 1 2.0% 1 2.5% 0 - 3 2.5% 3 2.3%
06:00 - 08:59 1 12.5% 1 5.6% 5 10.0% 3 7.5% 2 16.7% 11 9.2% 12 9.4%
09:00 - 11:59 1 12.5% 1 5.6% 5 10.0% 7 17.5% 2 16.7% 15 12.5% 16 12.5%
12:00 - 14:59 0 - 4 22.2% 10 20.0% 14 35.0% 6 50.0% 34 28.3% 34 26.6%
15:00 - 17:59 0 - 6 33.3% 11 22.0% 11 27.5% 2 16.7% 30 25.0% 30 23.4%
18:00 - 20:59 3 37.5% 2 11.1% 11 22.0% 2 5.0% 0 - 15 12.5% 18 14.1%
21:00 - 23:59 3 37.5% 0 - 4 8.0% 2 5.0% 0 - 6 5.0% 9 7.0%
Not Stated 1 - 0 - 1 - 0 - 0 - 1 - 2 -
Total 9 100% 18 100% 51 100% 40 100% 12 100% 121 100% 130 100%
*Percentage of the total does not include the 'not stated' category.

Section 6 Pedestrian Victims
110
Table 6-5a Pedestrian Victims by Time of Occurrence and Casualty Type for the Previous Five Years
Table 6-5a
Pedestrians Killed and Injured by Time of Occurrence and Casualty: 2010-2014 Average
Time of the Day
2010-2014 Average Count of Victims
Killed Serious Injury
Minor Injury
Minimal Injury
Other Injury
Total Injured
Total Victims
% of Total Victims*
00:00 - 02:59 1 1 3 1 2 7 8 3.8%
03:00 - 05:59 2 <1 2 <1 <1 4 6 2.7%
06:00 - 08:59 <1 2 12 7 7 28 29 13.0%
09:00 - 11:59 <1 2 10 8 5 25 26 11.8%
12:00 - 14:59 2 4 16 12 7 39 41 18.7%
15:00 - 17:59 2 5 24 12 15 57 59 26.8%
18:00 - 20:59 2 3 12 6 7 27 29 13.2%
21:00 - 23:59 2 5 8 4 3 19 22 9.9%
Not Stated <1 1 4 4 5 14 15 -
Total 12 24 92 55 52 223 234 100%
Note: Counts of pedestrians in the 2010-2014 average may not add to the total due to rounding. *Percentage of the total does not include the 'not stated' category.
In 2015, 27% of all pedestrian victims are involved in traffic collisions between noon and 3 p.m. (12:00-14:59) while another 23% are involved in traffic collisions between 3 p.m. and 6 p.m. (15:00 to 17:59). This is similar to the previous five year (2010 to 2014) annual average (12:00-14:59 – 19% of all pedestrian victims; 15:00 to 17:59 – 27%). In 2015, 6 of 9 pedestrians are killed between noon and midnight. Another 2 are killed between 6 a.m and noon. This is fairly consistent with the previous five year (2010 to 2014) annual average, where 8 of 12 pedestrians killed are involved in collisions between noon and midnight.
Figure 6-4 Proportion of Pedestrians Killed and Injured by Time of Occurrence
0%
5%
10%
15%
20%
25%
30%
35%
40%
00:00 - 02:59
03:00 - 05:59
06:00 - 08:59
09:00 - 11:59
12:00 - 14:59
15:00 - 17:59
18:00 - 20:59
21:00 - 23:59
Pro
po
rtio
n o
f To
tal
Proportion of Pedestrians Killed and Injured by Time of Occurrence: 2015
Killed Injured Total Victims
NOTE: Due to a small number of pedestrians killed, i.e. 9 deaths, caution is advised when interpreting those results
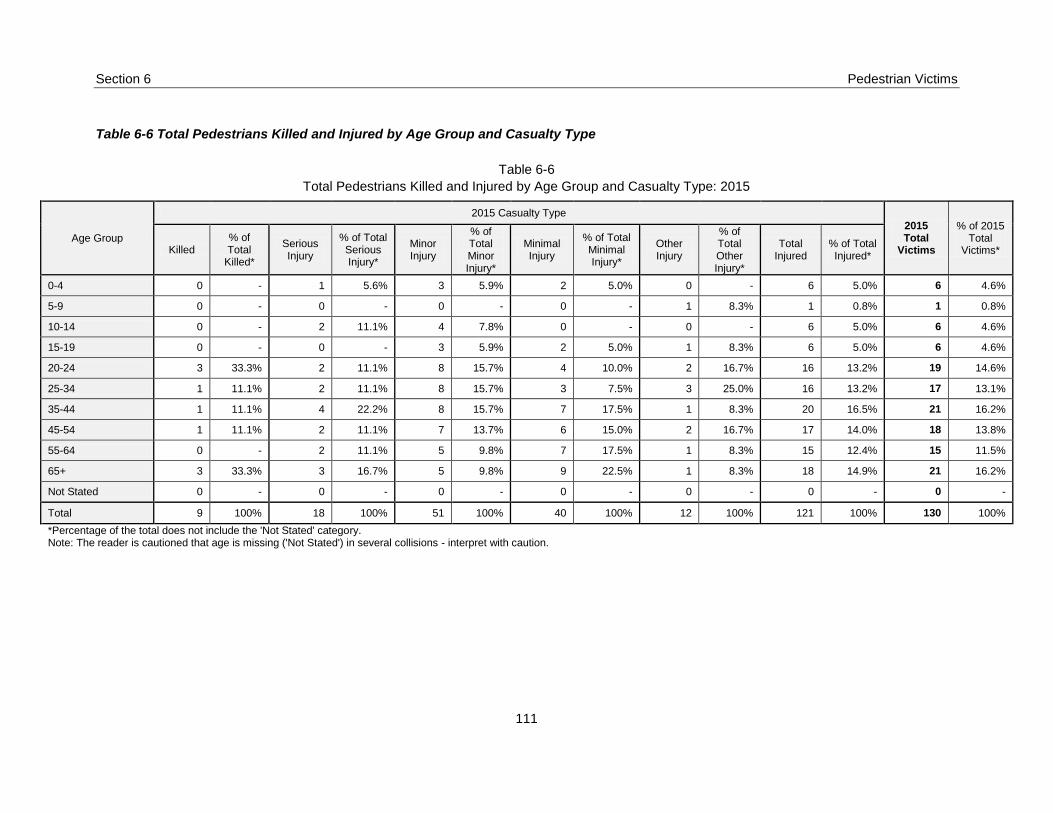
Section 6 Pedestrian Victims
111
Table 6-6 Total Pedestrians Killed and Injured by Age Group and Casualty Type
Table 6-6
Total Pedestrians Killed and Injured by Age Group and Casualty Type: 2015
Age Group
2015 Casualty Type
2015 Total
Victims
% of 2015 Total
Victims* Killed % of Total
Killed*
Serious Injury
% of Total Serious Injury*
Minor Injury
% of Total Minor Injury*
Minimal Injury
% of Total Minimal Injury*
Other Injury
% of Total Other Injury*
Total Injured
% of Total Injured*
0-4 0 - 1 5.6% 3 5.9% 2 5.0% 0 - 6 5.0% 6 4.6%
5-9 0 - 0 - 0 - 0 - 1 8.3% 1 0.8% 1 0.8%
10-14 0 - 2 11.1% 4 7.8% 0 - 0 - 6 5.0% 6 4.6%
15-19 0 - 0 - 3 5.9% 2 5.0% 1 8.3% 6 5.0% 6 4.6%
20-24 3 33.3% 2 11.1% 8 15.7% 4 10.0% 2 16.7% 16 13.2% 19 14.6%
25-34 1 11.1% 2 11.1% 8 15.7% 3 7.5% 3 25.0% 16 13.2% 17 13.1%
35-44 1 11.1% 4 22.2% 8 15.7% 7 17.5% 1 8.3% 20 16.5% 21 16.2%
45-54 1 11.1% 2 11.1% 7 13.7% 6 15.0% 2 16.7% 17 14.0% 18 13.8%
55-64 0 - 2 11.1% 5 9.8% 7 17.5% 1 8.3% 15 12.4% 15 11.5%
65+ 3 33.3% 3 16.7% 5 9.8% 9 22.5% 1 8.3% 18 14.9% 21 16.2%
Not Stated 0 - 0 - 0 - 0 - 0 - 0 - 0 -
Total 9 100% 18 100% 51 100% 40 100% 12 100% 121 100% 130 100%
*Percentage of the total does not include the 'Not Stated' category. Note: The reader is cautioned that age is missing ('Not Stated') in several collisions - interpret with caution.
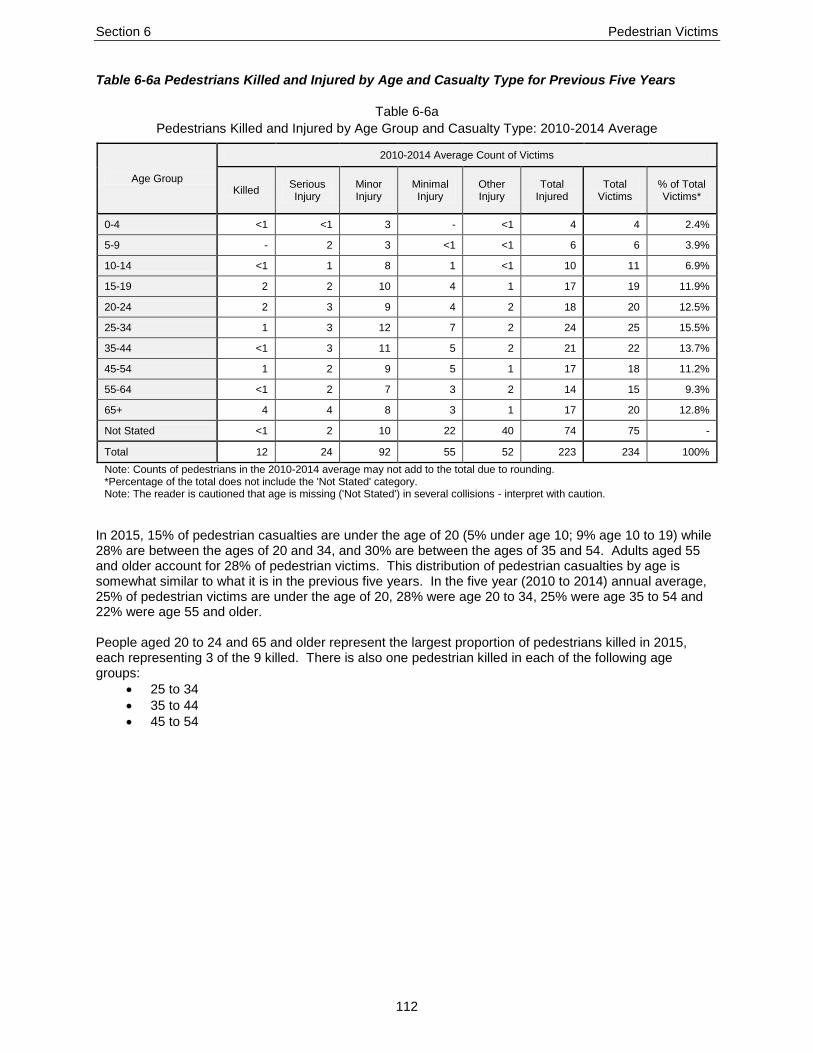
Section 6 Pedestrian Victims
112
Table 6-6a Pedestrians Killed and Injured by Age and Casualty Type for Previous Five Years
Table 6-6a
Pedestrians Killed and Injured by Age Group and Casualty Type: 2010-2014 Average
Age Group
2010-2014 Average Count of Victims
Killed Serious Injury
Minor Injury
Minimal Injury
Other Injury
Total Injured
Total Victims
% of Total Victims*
0-4 <1 <1 3 - <1 4 4 2.4%
5-9 - 2 3 <1 <1 6 6 3.9%
10-14 <1 1 8 1 <1 10 11 6.9%
15-19 2 2 10 4 1 17 19 11.9%
20-24 2 3 9 4 2 18 20 12.5%
25-34 1 3 12 7 2 24 25 15.5%
35-44 <1 3 11 5 2 21 22 13.7%
45-54 1 2 9 5 1 17 18 11.2%
55-64 <1 2 7 3 2 14 15 9.3%
65+ 4 4 8 3 1 17 20 12.8%
Not Stated <1 2 10 22 40 74 75 -
Total 12 24 92 55 52 223 234 100%
Note: Counts of pedestrians in the 2010-2014 average may not add to the total due to rounding. *Percentage of the total does not include the 'Not Stated' category. Note: The reader is cautioned that age is missing ('Not Stated') in several collisions - interpret with caution.
In 2015, 15% of pedestrian casualties are under the age of 20 (5% under age 10; 9% age 10 to 19) while 28% are between the ages of 20 and 34, and 30% are between the ages of 35 and 54. Adults aged 55 and older account for 28% of pedestrian victims. This distribution of pedestrian casualties by age is somewhat similar to what it is in the previous five years. In the five year (2010 to 2014) annual average, 25% of pedestrian victims are under the age of 20, 28% were age 20 to 34, 25% were age 35 to 54 and 22% were age 55 and older. People aged 20 to 24 and 65 and older represent the largest proportion of pedestrians killed in 2015, each representing 3 of the 9 killed. There is also one pedestrian killed in each of the following age groups:
25 to 34
35 to 44
45 to 54

Section 6 Pedestrian Victims
113
Figure 6-5 Proportion of Pedestrians Killed and Injured by Age Group
Note: The minor, minimal, and other injury categories have several casualties with missing age information (“Not stated” on the Traffic Accident Report) affecting the proportion by age group for the “Injured” and “Total Victims” categories in Figure 6-5. Please interpret with caution.
0%
5%
10%
15%
20%
25%
30%
35%
0-4 5-9 10-14 15-19 20-24 25-34 35-44 45-54 55-64 65+
Pro
po
rtio
n o
f To
tal
Proportion of Pedestrians Killed and Injured by Known Age Group: 2015
Killed Injured Total Victims
Note: Due to a small number of pedestrians killed, i.e., 9 deaths, caution is advised when interpreting those results.

Section 6 Pedestrian Victims
114
Table 6-7 Pedestrian Involvement Rate (per 100,000 People) in Traffic Collisions by Age Group
Table 6-7
Pedestrian Involvement Rate (per 100,000 People) in Traffic Collisions by Age Group: 2015, 2010-2014 Average
Age Group
2015 Casualty Type 2015 Total
Victims
2010-2014 Average Involvement Rate
Killed Serious Injury
Minor Injury
Minimal Injury
Other Injury
Total Injured
Killed Injured Total
Victims
0-4 - 1.2 3.6 2.4 - 7.2 7.2 0.2 4.4 4.7
5-9 - - - - 1.2 1.2 1.2 - 7.9 7.9
10-14 - 2.5 5.0 - - 7.5 7.5 0.7 13.0 13.7
15-19 - - 3.5 2.3 1.2 6.9 6.9 1.8 19.7 21.6
20-24 3.1 2.1 8.2 4.1 2.1 16.5 19.6 2.0 19.8 21.8
25-34 0.5 1.1 4.4 1.6 1.6 8.7 9.3 0.6 14.0 14.6
35-44 0.6 2.4 4.7 4.1 0.6 11.8 12.4 0.5 12.8 13.3
45-54 0.6 1.1 3.9 3.4 1.1 9.5 10.1 0.5 9.2 9.7
55-64 - 1.2 3.1 4.3 0.6 9.2 9.2 0.5 9.1 9.7
65+ 1.5 1.5 2.6 4.6 0.5 9.3 10.8 2.0 9.4 11.4
Total 0.7 1.4 3.9 3.0 0.9 9.2 9.8 0.9 5.9 18.4
Younger pedestrians tend to have higher rates of involvement in traffic collisions. Manitobans aged 20 to 24 have the highest pedestrian involvement rate (per 100,000 people) in traffic collisions, at 19.6, in 2015 (21.8 in the previous five years), followed by those aged 35 to 44 at 12.4 (13.3 in the previous five years). Pedestrian involvement rates in traffic collisions have decreased significantly in 2015 compared to the previous five year (2010 to 2014) annual average, down 47% for all pedestrian casualties. The involvement rates for pedestrians in all age groups are down in 2015, except for those aged 45 to 54, compared to the previous five years. Decreases in pedestrian involvement rates for 2015 compared to the previous five years are a direct result of fewer pedestrian victims being captured in the Traffic Collision Statistics Database under the new reporting structure implemented in 2011.

Section 6 Pedestrian Victims
115
Table 6-8 Pedestrian Action and Casualty Type
Table 6-8
Pedestrian Action and Casualty Type: 2015
Pedestrian Action
2015 Casualty Type
2015 Total
Victims
% of 2015 Total
Victims* Killed
% of Total
Killed*
Serious Injury
% of Total
Serious Injury*
Minor Injury
% of Total Minor Injury*
Minimal Injury
% of Total
Minimal Injury*
Other Injury
% of Total Other Injury*
Total Injured
% of Total
Injured*
At intersection, with right of way 1 16.7% 7 53.8% 19 55.9% 12 35.3% 4 50.0% 42 47.2% 43 45.3%
At intersection, without right of way 0 - 0 - 1 2.9% 1 2.9% 0 - 2 2.2% 2 2.1%
At intersection, no traffic control 0 - 2 15.4% 2 5.9% 2 5.9% 0 - 6 6.7% 6 6.3%
Between intersections 0 - 2 15.4% 2 5.9% 2 5.9% 1 12.5% 7 7.9% 7 7.4%
Walking along roadway against traffic 0 - 0 - 1 2.9% 0 - 0 - 1 1.1% 1 1.1%
Walking along roadway with traffic 2 33.3% 0 - 1 2.9% 0 - 0 - 1 1.1% 3 3.2%
On sidewalk/median/safety zone 1 16.7% 0 - 1 2.9% 3 8.8% 0 - 4 4.5% 5 5.3%
Walking on roadway (travelled portion) 0 - 0 - 0 - 0 - 1 12.5% 1 1.1% 1 1.1%
From behind vehicle/object on roadside 0 - 0 - 0 - 2 5.9% 0 - 2 2.2% 2 2.1%
Running into roadway 1 16.7% 0 - 1 2.9% 0 - 0 - 1 1.1% 2 2.1%
Getting on/off vehicle 0 - 0 - 0 - 1 2.9% 0 - 1 1.1% 1 1.1%
Pushing/working on vehicle 0 - 0 - 0 - 0 - 0 - 0 - 0 -
Playing on roadway 0 - 1 7.7% 0 - 0 - 0 - 1 1.1% 1 1.1%
Working on roadway 0 - 0 - 0 - 0 - 0 - 0 - 0 -
Lying on roadway 0 - 0 - 0 - 0 - 0 - 0 - 0 -
Other 1 16.7% 1 7.7% 6 17.6% 11 32.4% 2 25.0% 20 22.5% 21 22.1%
Unknown 3 - 5 - 17 - 6 - 4 - 32 - 35 -
Total 9 100% 18 100% 51 100% 40 100% 12 100% 121 100% 130 100%
*Percentage of the total has been rebased to exclude the 'unknown' category.

Section 6 Pedestrian Victims
116
Table 6-8a Pedestrian Action and Casualty Type for the Previous Five Years
Table 6-8a
Pedestrian Action and Casualty Type: 2010-2014 Average
Pedestrian Action
2010-2014 Average Count of Victims
Killed Serious Injury
Minor Injury
Minimal Injury
Other Injury
Total Injured
Total Victims
% of Total Victims*
At intersection, with right of way 1 2 29 14 12 58 59 39.6%
At intersection, without right of way <1 2 4 3 2 11 12 7.9%
At intersection, no traffic control - <1 2 1 1 5 5 3.5%
Between intersections <1 2 9 3 3 17 17 11.6%
Walking along roadway against traffic <1 <1 2 <1 <1 3 3 2.1%
Walking along roadway with traffic <1 1 2 1 <1 5 5 3.5%
On sidewalk/median/safety zone <1 <1 3 2 <1 6 6 4.0%
Walking on roadway (travelled portion) 1 2 2 2 2 8 9 6.3%
From behind vehicle/object on roadside - <1 2 1 1 5 5 3.3%
Running into roadway <1 2 5 3 4 15 15 10.3%
Getting on/off vehicle - - <1 <1 - 1 1 0.5%
Pushing/working on vehicle - <1 <1 - - 0 0 0.3%
Playing on roadway <1 - <1 <1 - 1 1 0.8%
Working on roadway <1 - - <1 <1 1 1 0.8%
Lying on roadway <1 <1 <1 - <1 1 2 1.5%
Other - <1 3 2 <1 6 6 4.1%
Unknown 5 8 25 20 24 77 82 -
Total 12 23 91 54 52 220 232 100%
Note: Counts of pedestrians in the 2010-2014 average may not add to the total due to rounding. *Percentage of the total has been rebased to exclude the 'unknown' category.
Where the actions of the pedestrian immediately prior to the collision are known, most pedestrian casualties in 2015 occur when the pedestrian is:
At an intersection, crossing with the right of way (45% of pedestrian casualties);
Between intersections (7% of pedestrian casualties);
At an intersection with no traffic control (6% of pedestrian casualties); and,
On the sidewalk/median/safety zone (5% of pedestrian casualties). For the 9 pedestrians killed in traffic collisions in 2015, 1 is killed at an intersection while crossing with the right of way, 2 while walking along roadway with traffic, 1 while walking on the sidewalk/median/safety zone, and 1 while running into the roadway. No pedestrian action was recorded for 3 of the 9 pedestrians killed, and 1 was indicated as ‘other’.
SECTION 7 – Vehicle Involvement


Section 7 Vehicle Involvement
119
Introduction
This section counts the number of vehicles involved in traffic collisions. Vehicle involvement in a collision is calculated for each vehicle type (such as passenger vehicles, vans, pick-up trucks, types of emergency vehicles). Vehicles involved in collisions that were, or were not, transporting hazardous loads and the nature of these loads is also indicated. Key Highlights In 2015, there are 61,711 vehicles involved in traffic collisions. Of these:
106 are involved in fatal collisions;
16,184 are involved in injury collisions; and,
45,421 are involved in PDO collisions. Vehicle involvement in traffic collisions per 10,000 registered vehicles (vehicle involvement rate) has decreased in 2015 compared to 2014, but has increased relative to the previous five year (2010 to 2014) annual average. The vehicle involvement rate in collisions in 2015 for:
Total collisions is 700.2 – decreased by nearly 3% from 2014, but increased by 3% from the previous five years;
Fatal collisions is 1.2 – increased by 10% from 2014, but decreased by 14% from the previous five years;
Injury collisions is 183.6 – decreased by 2% from 2014, but increased by 15% from the previous five years; and,
PDO collisions is 515.4 – decreased by 3% from 2014, and decreased by 1% from the previous five years.
Light duty vehicles, including passenger vehicles, minivans, and light trucks, represent 97% of the vehicles involved in all traffic collisions in 2015, the same as 2014 and similar to the previous five year (2010 to 2014) annual average (95%). Commercial vehicles represent 3% of the vehicles involved (similar to the 5% in the previous five years) while motorcycles, scooters, and mopeds represent 0.3% of the vehicles involved (the same as in the previous five years). Major Elements Examined Counts of vehicles involved in collisions in Manitoba for 2015 and previous years are taken from Traffic Accident Reports (TARs) completed by Manitoba Public Insurance and law enforcement agencies, and compiled by Manitoba Public Insurance. These counts are presented for all reportable collisions, fatal collisions, injury collisions, and property damage only (PDO) collisions. It is important to note that the number of collisions is not equal to the number of vehicles involved in those collisions. All collisions reported involve at least one vehicle, but may involve more than one as well. The reader is cautioned that not all percentages and calculations in the following tables will add to 100% of the total noted. Rounding error will often produce a difference of one or two percentage points. Likewise, average calculations are presented for historical data from the years 2010 to 2014. Rounding error in these calculations will cause individual average counts not to add to total average counts in some cases. Due to the small numbers of fatal collisions, fluctuations year-over-year could be dramatic; a small change in the total count of these types of collisions could have a significant effect on statistics such as percentage change to previous years and vehicle involvement rates. Therefore, the reader is strongly cautioned when interpreting results regarding fatal collisions.

Section 7 Vehicle Involvement
120
Terms and Definitions “Vehicles”
The number of vehicles involved in collisions. It excludes pedestrians, but includes automobiles, trucks, vans, buses, mobility vehicles, motorcycles, scooters, mopeds, bicycles, off-road vehicles, farm and construction equipment, and trains.
“Collision severity”
A classification of a collision based on the most severe result of the collision, i.e., whether someone was killed (fatal), injured (injury) or property damage only (PDO) occurred.
“Fatal Collision”
A motor vehicle collision in which at least one person is killed as a result of the collision. The death must have occurred within thirty days of the collision occurrence.
“Injury Collision”
A motor vehicle collision in which at least one person has been recorded as sustaining some level of personal injury, but in which no one is fatally injured or killed. Levels of injury include: ‘major’ (admitted to hospital); ‘minor’ (treated and released from hospital); and, ‘minimal’ (no hospital treatment required).
“Property Damage Only (PDO) Collision”
A motor vehicle collision in which no injury or fatality is sustained and only property damage is the result.
“Vehicle Involvement Rate”
A calculation of the number of vehicles involved in traffic collisions for every 10,000 vehicles registered in Manitoba. The total number of vehicles registered is based on a point-in-time observation of the number of vehicles registered in specific vehicle classes. More detail regarding the methodology used to count registered vehicles can be found in “Section 3 Vehicle Registrations” of this report.
“Light Duty Vehicles”
A classification of vehicle types including those defined in the Traffic Accident Report (TAR) as: passenger vehicles (automobile), mini/multi-purpose van, van under 4,500 kg, and pick-up under 4,500 kg.
“NSC Commercial Vehicles”
The National Safety Code (NSC) classification of vehicles is a classification of vehicle types including those defined in the Traffic Accident Report (TAR) as: “Truck greater than 4,500 kilograms (unit chassis)”, “Power Unit for Semi-Trailer”, “Truck (Other)” (where the type and size of truck is unknown), “School Bus”, “Transit Bus (Urban)”, “Inter-City Bus”, and “Bus (Other)”. These vehicles bear a National Safety Code Number and are entered onto the National Safety Code Collision Monitoring Report.
“PSV Vehicles”
Also known as ‘public service vehicles’, a classification of vehicle types including those defined in the Traffic Accident Report (TAR) as: “Other school vehicle”, and “Emergency vehicles”, including ambulance, fire and police vehicles.

Section 7 Vehicle Involvement
121
Table 7-1 Historical Summary of Vehicles Involved in Traffic Collisions
Table 7-1
Historical Summary of Vehicles Involved in Traffic Collisions: 2005 to 2015
Year
Collision Severity
Total Collisions
% change to
previous year
Fatal
% change to
previous year
Injury
% change to
previous year
PDO
% change to
previous year
2005 135 - 11,489 - 42,719 - 54,343 -
2006 151 11.9% 11,312 -1.5% 40,157 -6.0% 51,620 -5.0%
2007 141 -6.6% 11,099 -1.9% 37,251 -7.2% 48,491 -6.1%
2008 141 0.0% 10,219 -7.9% 34,195 -8.2% 44,555 -8.1%
2009 126 -10.6% 9,268 -9.3% 34,216 0.1% 43,610 -2.1%
2010 110 -12.7% 9,358 1.0% 35,511 3.8% 44,979 3.1%
2011 141 28.2% 10,956 17.1% 42,419 19.5% 53,516 19.0%
2012 126 -10.6% 14,802 35.1% 44,628 5.2% 59,556 11.3%
2013 111 -11.9% 15,663 5.8% 48,542 8.8% 64,316 8.0%
2014 95 -14.4% 16,233 3.6% 45,949 -5.3% 62,277 -3.2%
2015 106 11.6% 16,184 -0.3% 45,421 -1.1% 61,711 -0.9%
2010-2014 Average* 117 -4.3% 13,402 12.5% 43,410 6.4% 56,929 7.6%
* The '% change to previous year' for '2010-2014 Average' is an average rate of change for the five year period.
In 2015, there are 61,711 vehicles involved in traffic collisions. Of these:
106 are involved in fatal collisions;
16,184 are involved in injury collisions; and,
45,421 are involved in PDO collisions. Overall, there are fewer vehicles involved in traffic collisions in 2015 (61,711) than in 2014 (62,277), but more than in the previous five year (2010 to 2014) annual average (56,929). In 2015, there are:
566 fewer vehicles involved in total collisions than in 2014 (a 1% decrease), but 4,782 more than in the previous five year average (an 8% increase);
11 more vehicles involved in fatal collisions than in 2014 (a 12% increase), but 11 fewer than in the previous five years (a 9% decrease);
49 fewer vehicles involved in injury collisions compared to 2014 (a less than 1% decrease), but 2,782 more than in the previous five years (a 21% increase); and,
528 fewer vehicles involved in PDO collisions compared to 2014 (a 1% decrease), but 2,011 more than in the previous five years (a 5% increase).

Section 7 Vehicle Involvement
122
Table 7-2 Historical Summary of Vehicle Involvement Rate (per 10,000 Registered Vehicles) in Traffic Collisions
Table 7-2
Historical Summary of Vehicle Involvement Rate (per 10,000 Registered Vehicles) in Traffic Collisions: 2005 to 2015
Year
Collision Severity
Total Collisions
% change to previous
year Fatal % change to previous
year Injury
% change to previous
year PDO
% change to previous
year
2005 1.8 - 157.2 - 584.5 - 743.6 -
2006 2.0 10.4% 152.7 -2.8% 542.2 -7.2% 697.0 -6.3%
2007 1.9 -8.2% 147.3 -3.6% 494.2 -8.8% 643.4 -7.7%
2008 1.8 -2.6% 132.1 -10.3% 442.0 -10.6% 575.9 -10.5%
2009 1.6 -11.8% 118.3 -10.4% 436.7 -1.2% 556.7 -3.3%
2010 1.4 -14.4% 117.1 -1.0% 444.3 1.7% 562.7 1.1%
2011 1.7 25.7% 134.5 14.9% 520.6 17.2% 656.8 16.7%
2012 1.5 -13.2% 176.5 31.3% 532.2 2.2% 710.2 8.1%
2013 1.3 -13.3% 183.8 4.1% 569.7 7.0% 754.8 6.3%
2014 1.1 -15.9% 187.2 1.8% 529.8 -7.0% 718.0 -4.9%
2015 1.2 9.8% 183.6 -1.9% 515.4 -2.7% 700.2 -2.5%
2010-2014 Average* 1.4 -6.2% 159.8 10.2% 519.3 4.2% 680.5 5.5%
* The '% change to previous year' for '2010-2014 Average' is an average rate of change for the five year period.
Vehicle involvement in traffic collisions per 10,000 registered vehicles (vehicle involvement rate) has decreased in 2015 compared to 2014, but has increased relative to the previous five year (2010 to 2014) annual average. The vehicle involvement rate in collisions in 2015 for:
Total collisions is 700.2 – decreased by nearly 3% from 2014, but increased by 3% from the previous five years;
Fatal collisions is 1.2 – increased by 10% from 2014, but decreased by 14% from the previous five years;
Injury collisions is 183.6 – decreased by 2% from 2014, but increased by 15% from the previous five years; and,
PDO collisions is 515.4 – decreased by 3% from 2014, and decreased by 1% from the previous five years.

Section 7 Vehicle Involvement
123
Figure 7-1 Vehicle Involvement Rate (per 10,000 Registered Vehicles) in Fatal, Injury and PDO Collisions
As shown in Figure 7-1, the downward trend in vehicle involvement rates in PDO collisions from 2005 to 2009 did not continue in 2010, when the rate increased slightly. With the involvement rates in fatal collisions decreasing compared to the previous five year (2010 to 2014) annual average (see Table 7-2), it becomes clear that the increases in overall involvement from 2011 through 2014 are due to the increased number of vehicles involved in injury and PDO collisions. Even though vehicle involvement in PDO collisions is down in 2015 compared to 2012 through 2014, it is still higher than in 2007 through 2011.
0.0
100.0
200.0
300.0
400.0
500.0
600.0
700.0
0.0
1.0
2.0
3.0
4.0
5.0
6.0
7.0
2005 2006 2007 2008 2009 2010 2011 2012 2013 2014 2015
Inju
ry a
nd
PD
O R
ate
per
10
,00
0 V
ehic
les
Fata
l Rat
e p
er 1
0,0
00
Veh
icle
s
Vehicle Involvement Rate in Traffic Collisions per 10,000 Vehicles Registered: 2005-2015
Fatal Injury PDO
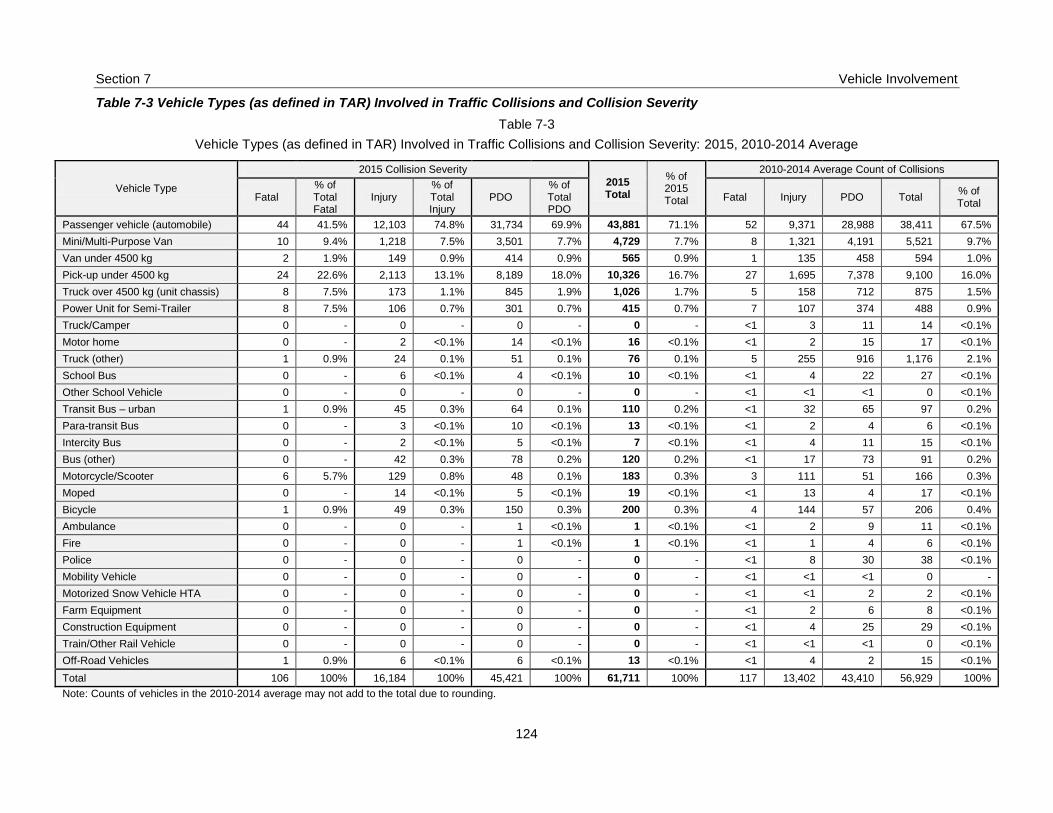
Section 7 Vehicle Involvement
124
Table 7-3 Vehicle Types (as defined in TAR) Involved in Traffic Collisions and Collision Severity
Table 7-3
Vehicle Types (as defined in TAR) Involved in Traffic Collisions and Collision Severity: 2015, 2010-2014 Average
Vehicle Type
2015 Collision Severity
2015 Total
% of 2015 Total
2010-2014 Average Count of Collisions
Fatal % of Total Fatal
Injury % of Total Injury
PDO % of Total PDO
Fatal Injury PDO Total % of Total
Passenger vehicle (automobile) 44 41.5% 12,103 74.8% 31,734 69.9% 43,881 71.1% 52 9,371 28,988 38,411 67.5%
Mini/Multi-Purpose Van 10 9.4% 1,218 7.5% 3,501 7.7% 4,729 7.7% 8 1,321 4,191 5,521 9.7%
Van under 4500 kg 2 1.9% 149 0.9% 414 0.9% 565 0.9% 1 135 458 594 1.0%
Pick-up under 4500 kg 24 22.6% 2,113 13.1% 8,189 18.0% 10,326 16.7% 27 1,695 7,378 9,100 16.0%
Truck over 4500 kg (unit chassis) 8 7.5% 173 1.1% 845 1.9% 1,026 1.7% 5 158 712 875 1.5%
Power Unit for Semi-Trailer 8 7.5% 106 0.7% 301 0.7% 415 0.7% 7 107 374 488 0.9%
Truck/Camper 0 - 0 - 0 - 0 - <1 3 11 14 <0.1%
Motor home 0 - 2 <0.1% 14 <0.1% 16 <0.1% <1 2 15 17 <0.1%
Truck (other) 1 0.9% 24 0.1% 51 0.1% 76 0.1% 5 255 916 1,176 2.1%
School Bus 0 - 6 <0.1% 4 <0.1% 10 <0.1% <1 4 22 27 <0.1%
Other School Vehicle 0 - 0 - 0 - 0 - <1 <1 <1 0 <0.1%
Transit Bus – urban 1 0.9% 45 0.3% 64 0.1% 110 0.2% <1 32 65 97 0.2%
Para-transit Bus 0 - 3 <0.1% 10 <0.1% 13 <0.1% <1 2 4 6 <0.1%
Intercity Bus 0 - 2 <0.1% 5 <0.1% 7 <0.1% <1 4 11 15 <0.1%
Bus (other) 0 - 42 0.3% 78 0.2% 120 0.2% <1 17 73 91 0.2%
Motorcycle/Scooter 6 5.7% 129 0.8% 48 0.1% 183 0.3% 3 111 51 166 0.3%
Moped 0 - 14 <0.1% 5 <0.1% 19 <0.1% <1 13 4 17 <0.1%
Bicycle 1 0.9% 49 0.3% 150 0.3% 200 0.3% 4 144 57 206 0.4%
Ambulance 0 - 0 - 1 <0.1% 1 <0.1% <1 2 9 11 <0.1%
Fire 0 - 0 - 1 <0.1% 1 <0.1% <1 1 4 6 <0.1%
Police 0 - 0 - 0 - 0 - <1 8 30 38 <0.1%
Mobility Vehicle 0 - 0 - 0 - 0 - <1 <1 <1 0 -
Motorized Snow Vehicle HTA 0 - 0 - 0 - 0 - <1 <1 2 2 <0.1%
Farm Equipment 0 - 0 - 0 - 0 - <1 2 6 8 <0.1%
Construction Equipment 0 - 0 - 0 - 0 - <1 4 25 29 <0.1%
Train/Other Rail Vehicle 0 - 0 - 0 - 0 - <1 <1 <1 0 <0.1%
Off-Road Vehicles 1 0.9% 6 <0.1% 6 <0.1% 13 <0.1% <1 4 2 15 <0.1%
Total 106 100% 16,184 100% 45,421 100% 61,711 100% 117 13,402 43,410 56,929 100%
Note: Counts of vehicles in the 2010-2014 average may not add to the total due to rounding.
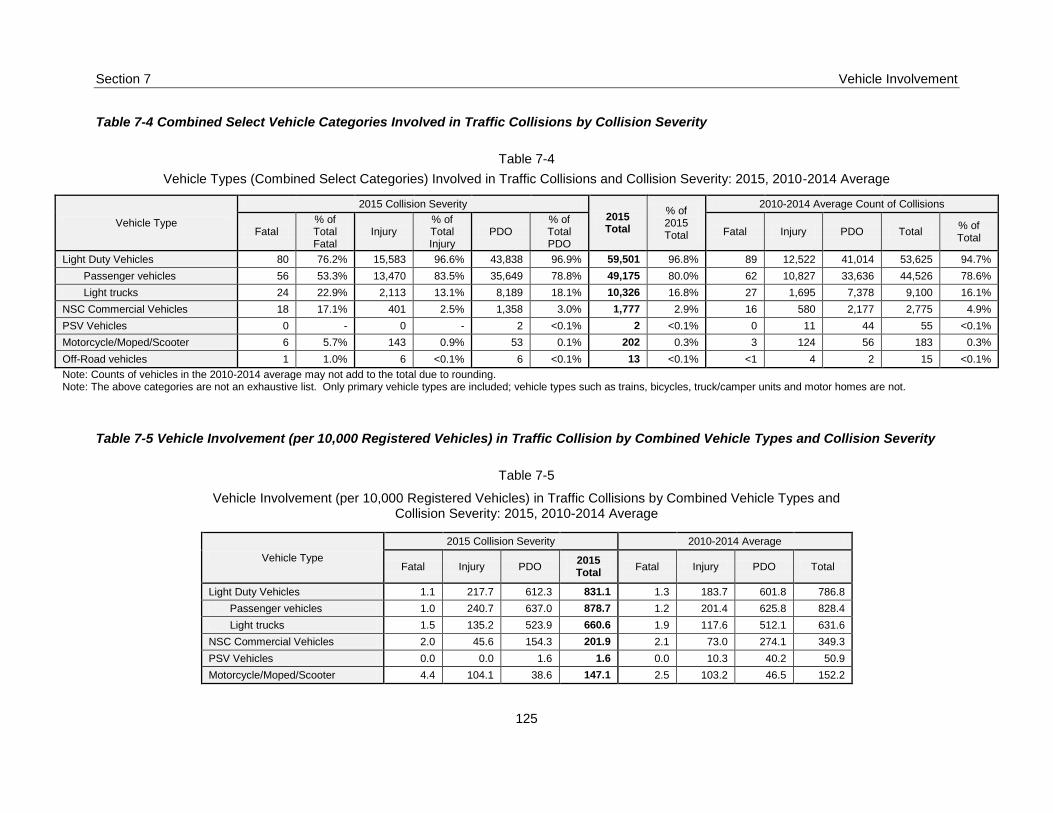
Section 7 Vehicle Involvement
125
Table 7-4 Combined Select Vehicle Categories Involved in Traffic Collisions by Collision Severity
Table 7-4
Vehicle Types (Combined Select Categories) Involved in Traffic Collisions and Collision Severity: 2015, 2010-2014 Average
Vehicle Type
2015 Collision Severity
2015 Total
% of 2015 Total
2010-2014 Average Count of Collisions
Fatal % of Total Fatal
Injury % of Total Injury
PDO % of Total PDO
Fatal Injury PDO Total % of Total
Light Duty Vehicles 80 76.2% 15,583 96.6% 43,838 96.9% 59,501 96.8% 89 12,522 41,014 53,625 94.7%
Passenger vehicles 56 53.3% 13,470 83.5% 35,649 78.8% 49,175 80.0% 62 10,827 33,636 44,526 78.6%
Light trucks 24 22.9% 2,113 13.1% 8,189 18.1% 10,326 16.8% 27 1,695 7,378 9,100 16.1%
NSC Commercial Vehicles 18 17.1% 401 2.5% 1,358 3.0% 1,777 2.9% 16 580 2,177 2,775 4.9%
PSV Vehicles 0 - 0 - 2 <0.1% 2 <0.1% 0 11 44 55 <0.1%
Motorcycle/Moped/Scooter 6 5.7% 143 0.9% 53 0.1% 202 0.3% 3 124 56 183 0.3%
Off-Road vehicles 1 1.0% 6 <0.1% 6 <0.1% 13 <0.1% <1 4 2 15 <0.1%
Note: Counts of vehicles in the 2010-2014 average may not add to the total due to rounding. Note: The above categories are not an exhaustive list. Only primary vehicle types are included; vehicle types such as trains, bicycles, truck/camper units and motor homes are not.
Table 7-5 Vehicle Involvement (per 10,000 Registered Vehicles) in Traffic Collision by Combined Vehicle Types and Collision Severity
Table 7-5
Vehicle Involvement (per 10,000 Registered Vehicles) in Traffic Collisions by Combined Vehicle Types and Collision Severity: 2015, 2010-2014 Average
Vehicle Type
2015 Collision Severity 2010-2014 Average
Fatal Injury PDO 2015 Total
Fatal Injury PDO Total
Light Duty Vehicles 1.1 217.7 612.3 831.1 1.3 183.7 601.8 786.8
Passenger vehicles 1.0 240.7 637.0 878.7 1.2 201.4 625.8 828.4
Light trucks 1.5 135.2 523.9 660.6 1.9 117.6 512.1 631.6
NSC Commercial Vehicles 2.0 45.6 154.3 201.9 2.1 73.0 274.1 349.3
PSV Vehicles 0.0 0.0 1.6 1.6 0.0 10.3 40.2 50.9
Motorcycle/Moped/Scooter 4.4 104.1 38.6 147.1 2.5 103.2 46.5 152.2

Section 7 Vehicle Involvement
126
Light duty vehicles, including passenger vehicles, minivans, and light trucks, represent 97% of the vehicles involved in all traffic collisions in 2015, the same as 2014 and similar to the previous five year (2010 to 2014) annual average (95%). Commercial vehicles represent 3% of the vehicles involved (similar to the 5% in the previous five years) while motorcycles, scooters, and mopeds represent 0.3% of the vehicles involved (the same as in the previous five years). Light duty vehicles have the highest vehicle involvement rate (per 10,000 registered vehicles) among all the vehicle types examined. Light duty vehicles (passenger vehicles and light trucks, combined) have an involvement rate of 831.1 in 2015 and 786.8 in the previous five year (2010 to 2014) annual average. NSC commercial vehicles have an involvement rate of 201.9 in 2014 and 349.3 in the previous five years. Motorcycles (including scooters and mopeds) have the lowest rates of involvement in traffic collisions among all vehicle types examined. Motorcycles have a rate of involvement of 147.1 in 2015 and 152.2 for the previous five year (2010 to 2014) annual average. Only two PSV vehicles were recorded as being involved in traffic collisions in 2015 and none were recorded for 2014; they had an involvement rate of 50.9 in the previous five years. This involvement rate has been falling in recent years due to this vehicle type no longer being captured consistently since the reporting change that took effect in October 2011. Motorcycles (including scooters and mopeds) are much more likely than light duty vehicles to be involved in a fatal collision. In 2015, motorcycles have an involvement rate of 4.4 in fatal collisions, nearly four times the involvement rate of light duty vehicles in fatal collisions (1.1). In the previous five year (2010 to 2014) annual average, motorcycles had a vehicle involvement rate of 2.5 in fatal collisions, nearly double the rate of light duty vehicles. NOTE: No vehicle involvement rate for off-road vehicles (ORV) is calculated due to difficulty in developing a reliable and accurate population count of these vehicles.

SECTION 8 – Driver Involvement

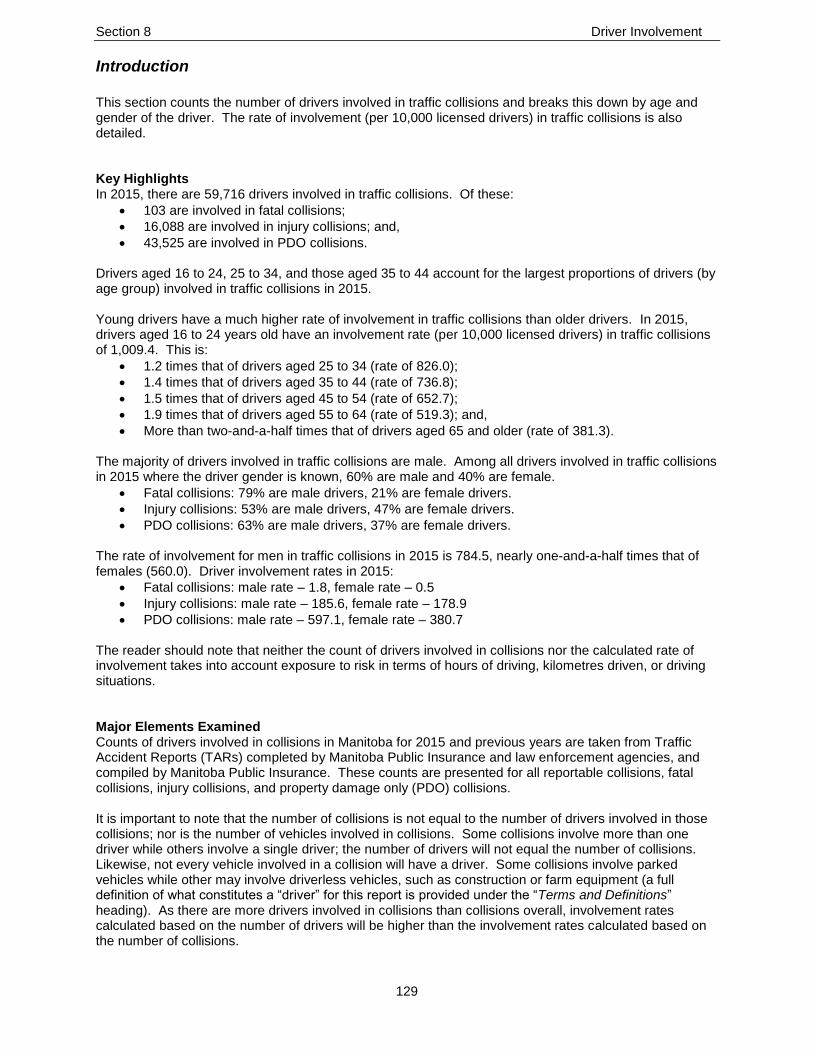
Section 8 Driver Involvement
129
Introduction
This section counts the number of drivers involved in traffic collisions and breaks this down by age and gender of the driver. The rate of involvement (per 10,000 licensed drivers) in traffic collisions is also detailed. Key Highlights In 2015, there are 59,716 drivers involved in traffic collisions. Of these:
103 are involved in fatal collisions;
16,088 are involved in injury collisions; and,
43,525 are involved in PDO collisions. Drivers aged 16 to 24, 25 to 34, and those aged 35 to 44 account for the largest proportions of drivers (by age group) involved in traffic collisions in 2015. Young drivers have a much higher rate of involvement in traffic collisions than older drivers. In 2015, drivers aged 16 to 24 years old have an involvement rate (per 10,000 licensed drivers) in traffic collisions of 1,009.4. This is:
1.2 times that of drivers aged 25 to 34 (rate of 826.0);
1.4 times that of drivers aged 35 to 44 (rate of 736.8);
1.5 times that of drivers aged 45 to 54 (rate of 652.7);
1.9 times that of drivers aged 55 to 64 (rate of 519.3); and,
More than two-and-a-half times that of drivers aged 65 and older (rate of 381.3). The majority of drivers involved in traffic collisions are male. Among all drivers involved in traffic collisions in 2015 where the driver gender is known, 60% are male and 40% are female.
Fatal collisions: 79% are male drivers, 21% are female drivers.
Injury collisions: 53% are male drivers, 47% are female drivers.
PDO collisions: 63% are male drivers, 37% are female drivers. The rate of involvement for men in traffic collisions in 2015 is 784.5, nearly one-and-a-half times that of females (560.0). Driver involvement rates in 2015:
Fatal collisions: male rate – 1.8, female rate – 0.5
Injury collisions: male rate – 185.6, female rate – 178.9
PDO collisions: male rate – 597.1, female rate – 380.7 The reader should note that neither the count of drivers involved in collisions nor the calculated rate of involvement takes into account exposure to risk in terms of hours of driving, kilometres driven, or driving situations. Major Elements Examined Counts of drivers involved in collisions in Manitoba for 2015 and previous years are taken from Traffic Accident Reports (TARs) completed by Manitoba Public Insurance and law enforcement agencies, and compiled by Manitoba Public Insurance. These counts are presented for all reportable collisions, fatal collisions, injury collisions, and property damage only (PDO) collisions. It is important to note that the number of collisions is not equal to the number of drivers involved in those collisions; nor is the number of vehicles involved in collisions. Some collisions involve more than one driver while others involve a single driver; the number of drivers will not equal the number of collisions. Likewise, not every vehicle involved in a collision will have a driver. Some collisions involve parked vehicles while other may involve driverless vehicles, such as construction or farm equipment (a full definition of what constitutes a “driver” for this report is provided under the “Terms and Definitions” heading). As there are more drivers involved in collisions than collisions overall, involvement rates calculated based on the number of drivers will be higher than the involvement rates calculated based on the number of collisions.

Section 8 Driver Involvement
130
When exploring the number of drivers in different age groups involved in traffic collisions, the reader is cautioned that the driver’s age is missing in some collisions. Changes to the reporting structure have resulted in significant improvements; only 0.2% of drivers are not identified by age in 2015 compared to nearly 5% in the five year (2010 to 2014) annual average. Likewise, gender is not always captured for each driver involved in a traffic collision, although improvements have been made here as well. In 2015, only 0.2% of the drivers involved in traffic collisions are not identified by gender compared with 4% in the previous five year (2010 to 2014) annual average. The reader is cautioned that not all percentages and calculations in the following tables will add to 100% of the total noted. Rounding error will often produce a difference of one or two percentage points. Likewise, average calculations are presented for historical data from the years 2010 to 2014. Rounding errors in these calculations will cause individual average counts not to add to total average counts in some cases. Due to the small numbers of fatal collisions, fluctuations year-over-year could be dramatic; a small change in the total count of these types of collisions could have a significant effect on statistics such as percentage change to previous years and involvement rates. Therefore, the reader is strongly cautioned when interpreting results regarding fatal collisions. Terms and Definitions “Drivers”
The number of drivers involved in collisions. It excludes pedestrians, bicyclists, snowmobiles, off-road vehicles, farm and construction equipment, trains and parked vehicles.
“Collision severity”
A classification of a collision based on the most severe result of the collision, i.e., whether someone was killed (fatal), injured (injury) or property damage only (PDO) occurred.
“Fatal Collision”
A motor vehicle collision in which at least one person is killed as a result of the collision. The death must have occurred within thirty days of the collision occurrence.
“Injury Collision”
A motor vehicle collision in which at least one person has been recorded as sustaining some level of personal injury, but in which no one is fatally injured or killed. Levels of injury include: ‘major’ (admitted to hospital); ‘minor’ (treated and released from hospital); and, ‘minimal’ (no hospital treatment required).
“Property Damage Only (PDO) Collision”
A motor vehicle collision in which no injury or fatality is sustained and only property damage is the result.
“Driver Involvement Rate”
A calculation of the number of drivers involved in traffic collisions for every 10,000 drivers licensed in Manitoba. The total number of drivers licensed to drive includes both active and suspended drivers. This involvement rate does not take into account the number of vehicle kilometres driven by each driver group. More detail regarding the methodology used to count licensed drivers can be found in “Section 2 Licensed Drivers” of this report.

Section 8 Driver Involvement
131
Table 8-1 Historical Summary of Drivers Involved in Traffic Collisions
Table 8-1
Historical Summary of Drivers Involved in Traffic Collisions: 2005 to 2015
Year
Collision Severity
Total Collisions
% change to previous
year Fatal % change to previous
year Injury
% change to previous
year PDO
% change to previous
year
2005 126 - 11,044 - 37,728 - 48,898 -
2006 145 15.1% 10,827 -2.0% 35,408 -6.1% 46,380 -5.1%
2007 135 -6.9% 10,696 -1.2% 33,983 -4.0% 44,814 -3.4%
2008 121 -10.4% 9,854 -7.9% 32,145 -5.4% 42,120 -6.0%
2009 120 -0.8% 8,938 -9.3% 32,039 -0.3% 41,097 -2.4%
2010 105 -12.5% 8,969 0.3% 33,236 3.7% 42,310 3.0%
2011 130 23.8% 10,644 18.7% 40,505 21.9% 51,279 21.2%
2012 119 -8.5% 14,696 38.1% 44,062 8.8% 58,877 14.8%
2013 106 -10.9% 15,539 5.7% 47,856 8.6% 63,501 7.9%
2014 90 -15.1% 16,120 3.7% 45,084 -5.8% 61,294 -3.5%
2015 103 14.4% 16,088 -0.2% 43,525 -3.5% 59,716 -2.6%
2010-2014 Average* 110 -4.6% 13,194 13.3% 42,149 7.4% 55,452 8.7%
* The '% change to previous year' for '2010-2014 Average' is an average rate of change for the five year period.
In 2015, there are 59,716 drivers involved in traffic collisions. Of these:
103 are involved in fatal collisions;
16,088 are involved in injury collisions; and,
43,525 are involved in PDO collisions. Overall, the number of drivers involved in traffic collisions in 2015 decreased from 2014 (down 3%), but increased relative to the previous five year (2010 to 2014) annual average (up 8%). In 2015, there are:
1,578 fewer drivers involved in total collisions than in 2014, but 4,264 more than in the previous five years;
13 more drivers involved in fatal collisions than in 2014 (a 14% increase), but 7 fewer than in the previous five years (a 6% decrease);
32 fewer drivers involved in injury collisions compared to 2014 (a very small decrease), but 2,894 more than in the previous five years (a 22% increase); and,
1,559 fewer drivers involved in PDO collisions compared to 2014 (a nearly 4% decrease), but 1,376 more than in the previous five years (a 3% increase).
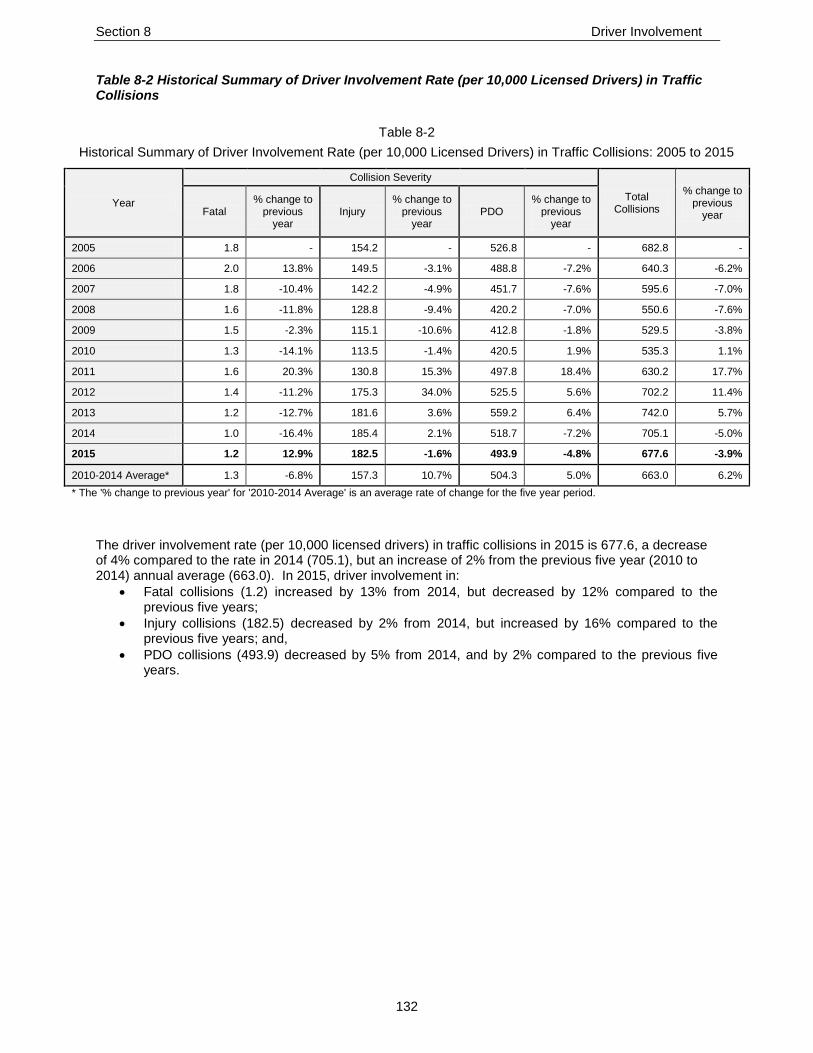
Section 8 Driver Involvement
132
Table 8-2 Historical Summary of Driver Involvement Rate (per 10,000 Licensed Drivers) in Traffic Collisions
Table 8-2
Historical Summary of Driver Involvement Rate (per 10,000 Licensed Drivers) in Traffic Collisions: 2005 to 2015
Year
Collision Severity
Total Collisions
% change to previous
year Fatal % change to
previous year
Injury % change to
previous year
PDO % change to
previous year
2005 1.8 - 154.2 - 526.8 - 682.8 -
2006 2.0 13.8% 149.5 -3.1% 488.8 -7.2% 640.3 -6.2%
2007 1.8 -10.4% 142.2 -4.9% 451.7 -7.6% 595.6 -7.0%
2008 1.6 -11.8% 128.8 -9.4% 420.2 -7.0% 550.6 -7.6%
2009 1.5 -2.3% 115.1 -10.6% 412.8 -1.8% 529.5 -3.8%
2010 1.3 -14.1% 113.5 -1.4% 420.5 1.9% 535.3 1.1%
2011 1.6 20.3% 130.8 15.3% 497.8 18.4% 630.2 17.7%
2012 1.4 -11.2% 175.3 34.0% 525.5 5.6% 702.2 11.4%
2013 1.2 -12.7% 181.6 3.6% 559.2 6.4% 742.0 5.7%
2014 1.0 -16.4% 185.4 2.1% 518.7 -7.2% 705.1 -5.0%
2015 1.2 12.9% 182.5 -1.6% 493.9 -4.8% 677.6 -3.9%
2010-2014 Average* 1.3 -6.8% 157.3 10.7% 504.3 5.0% 663.0 6.2%
* The '% change to previous year' for '2010-2014 Average' is an average rate of change for the five year period.
The driver involvement rate (per 10,000 licensed drivers) in traffic collisions in 2015 is 677.6, a decrease of 4% compared to the rate in 2014 (705.1), but an increase of 2% from the previous five year (2010 to 2014) annual average (663.0). In 2015, driver involvement in:
Fatal collisions (1.2) increased by 13% from 2014, but decreased by 12% compared to the previous five years;
Injury collisions (182.5) decreased by 2% from 2014, but increased by 16% compared to the previous five years; and,
PDO collisions (493.9) decreased by 5% from 2014, and by 2% compared to the previous five years.

Section 8 Driver Involvement
133
Figure 8-1 Driver Involvement Rate (per 10,000 Licensed Drivers) in Traffic Collisions by Severity
The downward trend in the rate of involvement for drivers in PDO collisions had been fairly consistent between 2004 and 2008. Between 2009 and 2010, the rates were relatively stable and appear to have hit a low. The rate increased in 2011, 2012 and 2013, before falling in 2014 and 2015. The increases in driver involvement in PDO collisions in 2011 through 2015 are at least partially attributable to changes in the reporting structure that took effect in 2011. The driver involvement rate for fatal and injury collisions had been steadily decreasing between 2004 and 2010 (the exception being a jump in the fatal collision rate in 2006). The driver involvement rate for injury collisions increased in 2011 through 2015, while the rate for fatal collisions has steadily decreased. The increases in driver involvement in injury collisions in 2011 through 2015 are at least partially attributable to changes in the reporting structure that took effect in 2011. However, changes in driver involvement in fatal collisions cannot be attributed to this reporting structure change.
0
100
200
300
400
500
600
0
1
2
3
4
5
6
2005 2006 2007 2008 2009 2010 2011 2012 2013 2014 2015
Rat
e fo
r In
jury
an
d P
DO
Co
llisi
on
s
Rat
e fo
r Fa
tal C
olli
sio
ns
Driver Involvement Rate (per 10,000 Licensed Drivers) in Traffic Collisions: 2005 to 2015
Fatal Injury PDO

Section 8 Driver Involvement
134
Table 8-3 Drivers Involved in Traffic Collisions by Age Group and Collision Severity
Table 8-3
Drivers Involved in Traffic Collisions by Age Group and Collision Severity: 2015, 2010-2014 Average
Age Group
2015 Collision Severity
2015 Total Collisions
% of 2015 Total
Collisions*
2010-2014 Average Count of Drivers
Fatal % of Total Fatal*
Injury % of Total
Injury* PDO
% of Total PDO*
Fatal Injury PDO Total % of Total Collisions*
<16 1 1.0% 17 0.1% 54 0.1% 72 0.1% 0 7 31 38 <0.1%
16-19 12 11.7% 1,218 7.6% 3,386 7.8% 4,616 7.7% 11 1,046 3,595 4,653 8.8%
20-24 10 9.7% 1,916 11.9% 5,752 13.2% 7,678 12.9% 15 1,580 5,146 6,741 12.8%
25-34 21 20.4% 3,415 21.2% 9,195 21.2% 12,631 21.2% 22 2,664 8,026 10,712 20.3%
35-44 11 10.7% 3,046 18.9% 7,703 17.7% 10,760 18.1% 16 2,406 7,002 9,424 17.9%
45-54 21 20.4% 2,916 18.1% 7,302 16.8% 10,239 17.2% 17 2,347 7,083 9,447 17.9%
55-64 6 5.8% 2,101 13.1% 5,494 12.7% 7,601 12.8% 12 1,536 5,064 6,612 12.6%
65+ 21 20.4% 1,445 9.0% 4,533 10.4% 5,999 10.1% 15 1,108 3,908 5,032 9.6%
Not Stated 0 - 14 - 106 - 120 - 1 500 2,294 2,794 -
Total* 103 100% 16,088 100% 43,525 100% 59,716 100% 110 13,194 42,149 55,452 100%
*Percentage of the total does not include the 'not stated' category. Note: Counts of drivers in the 2010-2014 average may not add to the total due to rounding.
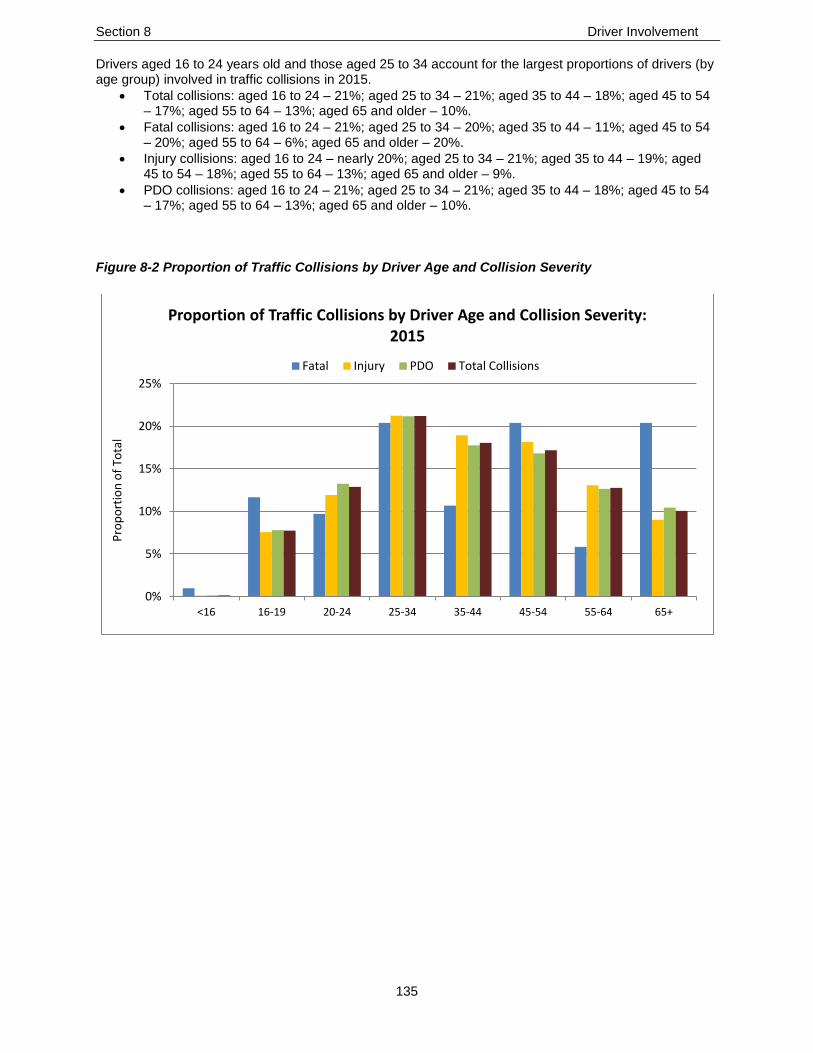
Section 8 Driver Involvement
135
Drivers aged 16 to 24 years old and those aged 25 to 34 account for the largest proportions of drivers (by age group) involved in traffic collisions in 2015.
Total collisions: aged 16 to 24 – 21%; aged 25 to 34 – 21%; aged 35 to 44 – 18%; aged 45 to 54 – 17%; aged 55 to 64 – 13%; aged 65 and older – 10%.
Fatal collisions: aged 16 to 24 – 21%; aged 25 to 34 – 20%; aged 35 to 44 – 11%; aged 45 to 54 – 20%; aged 55 to 64 – 6%; aged 65 and older – 20%.
Injury collisions: aged 16 to 24 – nearly 20%; aged 25 to 34 – 21%; aged 35 to 44 – 19%; aged 45 to 54 – 18%; aged 55 to 64 – 13%; aged 65 and older – 9%.
PDO collisions: aged 16 to 24 – 21%; aged 25 to 34 – 21%; aged 35 to 44 – 18%; aged 45 to 54 – 17%; aged 55 to 64 – 13%; aged 65 and older – 10%.
Figure 8-2 Proportion of Traffic Collisions by Driver Age and Collision Severity
0%
5%
10%
15%
20%
25%
<16 16-19 20-24 25-34 35-44 45-54 55-64 65+
Pro
po
rtio
n o
f To
tal
Proportion of Traffic Collisions by Driver Age and Collision Severity: 2015
Fatal Injury PDO Total Collisions

Section 8 Driver Involvement
136
Table 8-4 Driver Involvement Rate (per 10,000 Licensed Drivers) in Traffic Collisions by Age Group and Collision Severity
Table 8-4
Driver Involvement Rate (per 10,000 Licensed Drivers) in Traffic Collisions by Age Group and Collision Severity: 2015, 2010-2014 Average
Age Group
2015 Collision Severity 2015 Total Collisions
2010-2014 Average
Fatal Injury PDO Fatal Injury PDO Total
<16 - - - - - - - -
16-19 2.5 255.7 710.9 969.1 2.3 215.1 739.2 956.6
20-24 1.3 258.3 775.6 1,035.3 2.1 226.0 735.8 963.9
25-34 1.4 223.3 601.3 826.0 1.6 190.7 574.5 766.8
35-44 0.8 208.6 527.5 736.8 1.1 171.8 499.9 672.8
45-54 1.3 185.9 465.5 652.7 1.1 145.7 439.6 586.3
55-64 0.4 143.5 375.3 519.3 0.9 113.0 372.6 486.5
65+ 1.3 91.8 288.1 381.3 1.1 80.2 282.9 364.3
Recognizing that counts of drivers involved in collisions could be impacted either positively or negatively by changing population statistics, involvement rates per 10,000 licensed drivers are examined to provide a standardized collision rate comparison. This eliminates the effect of changing population size and focuses on how many drivers are involved in collisions instead of simply a raw count of drivers. Further, in the absence of the number of kilometres driven, the driver involvement rate acts as a proxy for exposure to collision risk. Young drivers have a much higher rate of involvement in traffic collisions than older drivers. In 2015, drivers aged 16 to 24 years old have an involvement rate (per 10,000 licensed drivers) in traffic collisions of 1,009.4. This is:
1.2 times that of drivers aged 25 to 34 (rate of 826.0);
1.4 times that of drivers aged 35 to 44 (rate of 736.8);
1.5 times that of drivers aged 45 to 54 (rate of 652.7);
1.9 times that of drivers aged 55 to 64 (rate of 519.3); and,
More than two-and-a-half times that of drivers aged 65 and older (rate of 381.3).

Section 8 Driver Involvement
137
Table 8-5 Drivers Involved in Traffic Collisions by Gender and Age Group and Collision Severity
Table 8-5
Total Drivers Involved in Traffic Collisions by Gender and Age Group and Collision Severity: 2015, 2010-2014 Average
Gender - Age Group
2015 Collision Severity
2015 Total Collisions
% of 2015 Total
Collisions*
2010-2014 Average Count of Drivers
Fatal % of Total Fatal*
Injury % of Total
Injury* PDO
% of Total PDO*
Fatal Injury PDO Total % of Total Collisions*
Fe
male
<16 0 - 7 <0.1% 18 0.1% 25 0.1% <1 3 15 18 <0.1%
16-19 3 13.6% 574 7.6% 1,258 7.8% 1,835 7.7% 4 481 1,394 1,879 9.0%
20-24 2 9.1% 947 12.5% 2,150 13.3% 3,099 13.0% 5 763 1,960 2,728 13.1%
25-34 6 27.3% 1,652 21.7% 3,469 21.5% 5,127 21.6% 5 1,298 3,009 4,312 20.6%
35-44 0 - 1,474 19.4% 2,925 18.1% 4,399 18.5% 4 1,164 2,746 3,914 18.7%
45-54 7 31.8% 1,397 18.4% 2,691 16.6% 4,095 17.2% 5 1,109 2,617 3,731 17.9%
55-64 0 - 967 12.7% 2,032 12.6% 2,999 12.6% 2 698 1,814 2,514 12.0%
65+ 4 18.2% 582 7.7% 1,625 10.1% 2,211 9.3% 4 449 1,338 1,791 8.6%
Not Stated 0 - 1 - 8 - 9 - <1 58 255 313 -
Total Female* 22 100% 7,601 100% 16,176 100% 23,799 100% 28 6,024 15,147 21,199 100%
Ma
le
<16 1 1.2% 10 0.1% 36 0.1% 47 0.1% <1 3 16 19 <0.1%
16-19 9 11.1% 643 7.6% 2,123 7.8% 2,775 7.8% 8 563 2,191 2,762 8.7%
20-24 8 9.9% 969 11.4% 3,595 13.2% 4,572 12.8% 10 814 3,171 3,995 12.6%
25-34 15 18.5% 1,762 20.8% 5,723 21.0% 7,500 21.0% 18 1,359 4,993 6,370 20.1%
35-44 11 13.6% 1,572 18.6% 4,777 17.5% 6,360 17.8% 12 1,238 4,238 5,488 17.3%
45-54 14 17.3% 1,519 17.9% 4,609 16.9% 6,142 17.2% 12 1,234 4,449 5,696 18.0%
55-64 6 7.4% 1,133 13.4% 3,462 12.7% 4,601 12.9% 10 836 3,241 4,087 12.9%
65+ 17 21.0% 862 10.2% 2,907 10.7% 3,786 10.6% 11 657 2,564 3,232 10.2%
Not Stated 0 - 2 - 19 - 21 - <1 99 439 538 -
Total Male* 81 100% 8,472 100% 27,251 100% 35,804 100% 82 6,803 25,302 32,186 100%
*Percentage of the total does not include the 'not stated' category. Note: Counts of drivers in the 2010-2014 average may not add to the total due to rounding. Note: Some drivers do not have age and gender recorded and are therefore missing from the table above.

Section 8 Driver Involvement
138
Figure 8-3 Proportion of Drivers Involved in Traffic Collisions by Gender and Collision Severity
The majority of drivers involved in traffic collisions are male. Among all drivers involved in traffic collisions in 2015 where the driver gender is known, 60% are male and 40% are female.
Fatal collisions: 79% are male drivers, 21% are female drivers.
Injury collisions: 53% are male drivers, 47% are female drivers.
PDO collisions: 63% are male drivers, 37% are female drivers. The reader should note that the count of drivers involved in collisions does not take into account exposure to risk in terms of driving situations, hours driven or kilometres driven. As shown in Table 8-6 (on the following page), young drivers account for the highest proportions of collisions. In particular, young male drivers account for a larger proportion of collisions than any other group of drivers. In 2015:
Male drivers aged 16 to 24 account for 12% of all collisions, nearly 17% of fatal collisions, 10% of injury collisions, and 13% of PDO collisions;
Male drivers aged 25 to 34 account for 13% of all collisions, 15% of fatal collisions, 11% of injury collisions, and 13% of PDO collisions;
Female drivers aged 16 to 24 account for 8% of all collisions, 5% of fatal collisions, nearly 10% of injury collisions and 8% of PDO collisions; and,
Female drivers aged 25 to 34 account for 9% of all collisions, 6% of fatal collisions, 10% of injury collisions and 8% of PDO collisions.
0%
10%
20%
30%
40%
50%
60%
70%
80%
90%
100%
Fatal Injury PDO
Pro
po
rtio
n o
f To
tal
Proportion of Drivers Involved in Traffic Collisions by Gender and Collision Severity: 2015
Female
Male

Section 8 Driver Involvement
139
Table 8-6 Drivers Involved in Traffic Collisions by Age Group and Gender and Collision Severity
Table 8-6
Total Drivers Involved in Traffic Collisions by Age Group and Gender and Collision Severity: 2015, 2010-2014 Average
Age Group - Gender
2015 Collision Severity
2015 Total Collisions
% of 2015 Total
Collisions*
2010-2014 Average Count of Drivers
Fatal % of Total Fatal*
Injury % of Total
Injury* PDO
% of Total PDO*
Fatal Injury PDO Total % of Total Collisions*
<16 Female 0 - 7 <0.1% 18 <0.1% 25 <0.1% <1 3 15 18 <0.1%
Male 1 1.0% 10 <0.1% 36 <0.1% 47 <0.1% <1 3 16 19 <0.1%
16 to 24 Female 5 4.9% 1,521 9.5% 3,408 7.9% 4,934 8.3% 8 1,244 3,354 4,607 8.8%
Male 17 16.5% 1,612 10.0% 5,718 13.2% 7,347 12.3% 18 1,377 5,362 6,757 12.9%
25 to 34 Female 6 5.8% 1,652 10.3% 3,469 8.0% 5,127 8.6% 5 1,298 3,009 4,312 8.2%
Male 15 14.6% 1,762 11.0% 5,723 13.2% 7,500 12.6% 18 1,359 4,993 6,370 12.1%
35 to 44 Female 0 - 1,474 9.2% 2,925 6.7% 4,399 7.4% 4 1,164 2,746 3,914 7.4%
Male 11 10.7% 1,572 9.8% 4,777 11.0% 6,360 10.7% 12 1,238 4,238 5,488 10.4%
45 to 54 Female 7 6.8% 1,397 8.7% 2,691 6.2% 4,095 6.9% 5 1,109 2,617 3,731 7.1%
Male 14 13.6% 1,519 9.5% 4,609 10.6% 6,142 10.3% 12 1,234 4,449 5,696 10.8%
55 to 64 Female 0 - 967 6.0% 2,032 4.7% 2,999 5.0% 2 698 1,814 2,514 4.8%
Male 6 5.8% 1,133 7.1% 3,462 8.0% 4,601 7.7% 10 836 3,241 4,087 7.8%
65 and older Female 4 3.9% 582 3.6% 1,625 3.7% 2,211 3.7% 4 449 1,338 1,791 3.4%
Male 17 16.5% 862 5.4% 2,907 6.7% 3,786 6.4% 11 657 2,564 3,232 6.2%
Not Stated Female 0 - 1 - 8 - 9 - <1 58 255 313 -
Male 0 - 2 - 19 - 21 - <1 99 439 538 -
Total Female 22 21.4% 7,601 47.2% 16,176 37.2% 23,799 39.9% 27 6,024 15,147 21,199 39.7%
Male 81 78.6% 8,472 52.6% 27,251 62.7% 35,804 60.0% 82 6,803 25,302 32,186 60.2%
*Percentage of the total does not include the 'not stated' category. Note: Counts of drivers in the 2010-2014 average may not add to the total due to rounding. Note: Some drivers do not have age and gender recorded and are therefore missing from the table above.
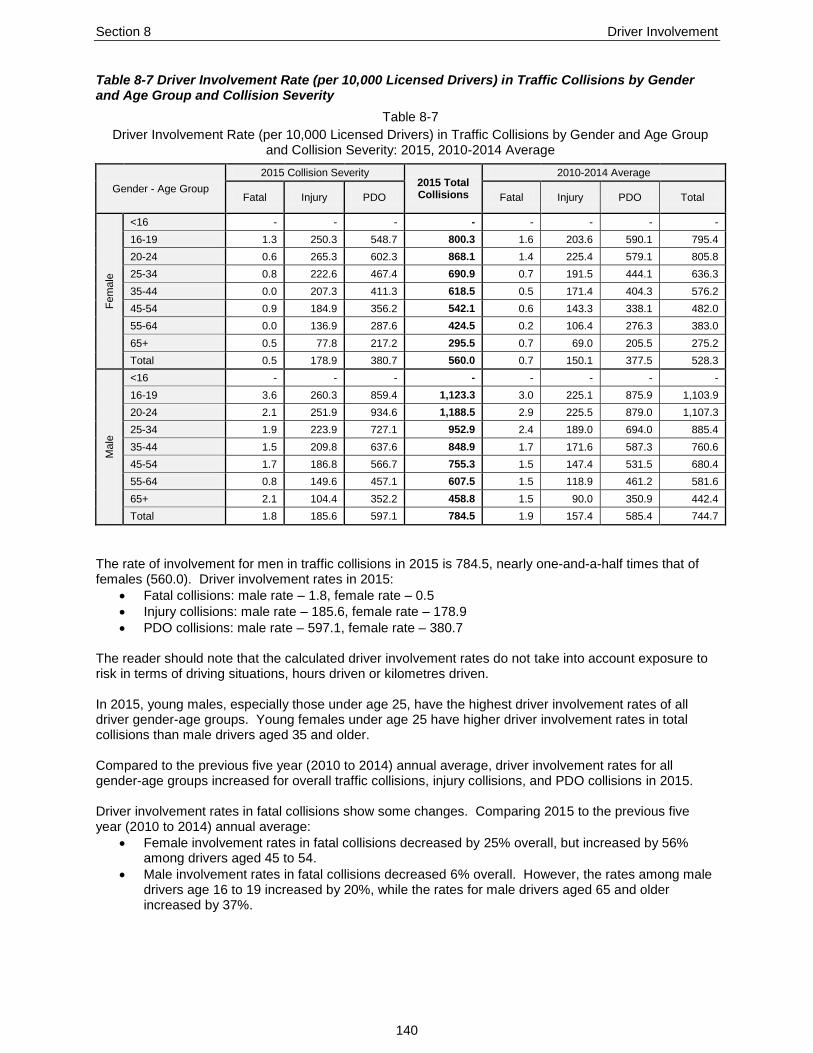
Section 8 Driver Involvement
140
Table 8-7 Driver Involvement Rate (per 10,000 Licensed Drivers) in Traffic Collisions by Gender and Age Group and Collision Severity
Table 8-7
Driver Involvement Rate (per 10,000 Licensed Drivers) in Traffic Collisions by Gender and Age Group and Collision Severity: 2015, 2010-2014 Average
Gender - Age Group
2015 Collision Severity 2015 Total Collisions
2010-2014 Average
Fatal Injury PDO Fatal Injury PDO Total
Fe
male
<16 - - - - - - - -
16-19 1.3 250.3 548.7 800.3 1.6 203.6 590.1 795.4
20-24 0.6 265.3 602.3 868.1 1.4 225.4 579.1 805.8
25-34 0.8 222.6 467.4 690.9 0.7 191.5 444.1 636.3
35-44 0.0 207.3 411.3 618.5 0.5 171.4 404.3 576.2
45-54 0.9 184.9 356.2 542.1 0.6 143.3 338.1 482.0
55-64 0.0 136.9 287.6 424.5 0.2 106.4 276.3 383.0
65+ 0.5 77.8 217.2 295.5 0.7 69.0 205.5 275.2
Total 0.5 178.9 380.7 560.0 0.7 150.1 377.5 528.3
Ma
le
<16 - - - - - - - -
16-19 3.6 260.3 859.4 1,123.3 3.0 225.1 875.9 1,103.9
20-24 2.1 251.9 934.6 1,188.5 2.9 225.5 879.0 1,107.3
25-34 1.9 223.9 727.1 952.9 2.4 189.0 694.0 885.4
35-44 1.5 209.8 637.6 848.9 1.7 171.6 587.3 760.6
45-54 1.7 186.8 566.7 755.3 1.5 147.4 531.5 680.4
55-64 0.8 149.6 457.1 607.5 1.5 118.9 461.2 581.6
65+ 2.1 104.4 352.2 458.8 1.5 90.0 350.9 442.4
Total 1.8 185.6 597.1 784.5 1.9 157.4 585.4 744.7
The rate of involvement for men in traffic collisions in 2015 is 784.5, nearly one-and-a-half times that of females (560.0). Driver involvement rates in 2015:
Fatal collisions: male rate – 1.8, female rate – 0.5
Injury collisions: male rate – 185.6, female rate – 178.9
PDO collisions: male rate – 597.1, female rate – 380.7 The reader should note that the calculated driver involvement rates do not take into account exposure to risk in terms of driving situations, hours driven or kilometres driven. In 2015, young males, especially those under age 25, have the highest driver involvement rates of all driver gender-age groups. Young females under age 25 have higher driver involvement rates in total collisions than male drivers aged 35 and older. Compared to the previous five year (2010 to 2014) annual average, driver involvement rates for all gender-age groups increased for overall traffic collisions, injury collisions, and PDO collisions in 2015. Driver involvement rates in fatal collisions show some changes. Comparing 2015 to the previous five year (2010 to 2014) annual average:
Female involvement rates in fatal collisions decreased by 25% overall, but increased by 56% among drivers aged 45 to 54.
Male involvement rates in fatal collisions decreased 6% overall. However, the rates among male drivers age 16 to 19 increased by 20%, while the rates for male drivers aged 65 and older increased by 37%.

SECTION 9 – Contributing Factors


Section 9 Contributing Factors
143
Introduction
This section examines the contributing factors to traffic collisions as reported on the Traffic Accident Report (TAR). Detail is provided at the collision level, at the victim level and at the driver level. Driver involvement rates (per 10,000 licensed drivers) in collisions with specific contributing factors are also provided and discussed. The reader is cautioned to note that more than one contributing factor can be recorded for each vehicle and/or driver involved in a collision. The total count of contributing factors noted will add to more than the number of collisions, vehicles, drivers, or victims in those crashes. Key Highlights In 2015, 69% of all collisions have some at-fault contributing factor recorded (87% of fatal collisions; 75% of injury collisions). In 2015:
A driver action is a contributing factor in 62% of all collisions (81% of fatal collisions; 72% of injury collisions; 59% of PDO collisions);
A human condition is a contributing factor in 1% of all collisions (25% of fatal collisions; nearly 2% of injury collisions; less than 1% of PDO collisions); and,
Environmental conditions are contributing factors in 10% of all collisions (nearly 15% of fatal collisions; 6% of injury collisions; 11% of PDO collisions).
The most prevalent contributing factors recorded for collisions in 2015 include:
Distracted driving – 23% of all collisions (36% fatal; 25% injury; 22% PDO);
“Following too closely” – 17% of all collisions (3% fatal; 28% injury; 14% PDO);
Speed – 7% of all collisions (19% fatal; 8% injury; 7% PDO);
“Backing unsafely” – 7% of all collisions (none fatal; 2% injury; 9% PDO);
“Turning improperly” – 6% of all collisions (6% fatal; 8% injury; nearly 6% PDO);
“Fail to yield right-of-way” – nearly 6% of all collisions (12% fatal; 9% injury; 5% PDO);
“Changing lanes improperly” –5% of all collisions (none fatal; 4% injury; 5% PDO);
The actions of a wild animal – 5% of all collisions (1% fatal; 1% injury; nearly 6% PDO);
“Lost control/Drive off the road” – 4% of all collisions (13% fatal; 4% injury; 4% PDO); and,
“Slippery road surface” – 3% of all collisions (6% fatal; 3% injury; 3% PDO). Considering the victims from collisions in 2015:
74% of all victims resulted from a collision where at least one driver is noted as having a driver action contributing to the collision (78% of people killed; 78% of people seriously injured);
2% of all victims resulted from a collision where at least one driver is noted as having a human condition contributing to the collision (23% of people killed; 12% of people seriously injured); and,
6% of all victims resulted from a collision where environmental conditions are noted as contributing to the collision (17% of people killed; 12% of people seriously injured).
The most prevalent contributing factors recorded for collisions where people are killed or seriously injured in 2015 include:
Distracted driving – 36% of people killed and 32% of people seriously injured;
Speed –17% of people killed and nearly 15% of people seriously injured;
“Lost control/Drive off the road” – 13% of people killed and 13% of people seriously injured;
“Turning improperly” – 5% of people killed and 11% of people seriously injured;
“Fail to yield right-of-way” – nearly 12% of people killed and 10% of people seriously injured;
Impaired – nearly 21% of people killed and 6% of people seriously injured;
“Following too closely” – 3% of the people killed and 8% of people seriously injured;
“Leave stop sign before safe to do so” – 6% of people killed and nearly 7% of people seriously injured;
“Disobey traffic control” – 8% of people killed and 6% of people seriously injured; and,
“Slippery road surface” – 5% of the people killed and 6% of people seriously injured.

Section 9 Contributing Factors
144
In 2015, 49% of the drivers involved in traffic collisions were recorded as not being at-fault in the collision while 2% did not have any contributing factors identified.
44% of the drivers involved in a fatal collision were noted as not being at-fault.
54% of the drivers in an injury collision were noted as not being at-fault.
48% of the drivers in a PDO collision were noted as not being at-fault. Driver actions were recorded for 44% of the drivers involved in traffic collisions in 2015.
Nearly 52% of the drivers involved in fatal collisions had a driver action recorded.
Nearly 42% of the drivers involved in injury collisions had a driver action recorded.
45% of the drivers involved in PDO collisions had a driver action recorded. Human conditions were recorded as contributing factors for less than 1% of the drivers involved in traffic collisions in 2015.
14% of the drivers involved in fatal collisions had a human condition recorded.
1% of the drivers involved in injury collisions had a human condition recorded.
Less than 1% of the drivers involved in PDO collisions had a human condition recorded. Environmental conditions were recorded as contributing factors for 7% of drivers involved in traffic collisions in 2015.
10% of the drivers involved in fatal collisions had some environmental condition recorded.
Nearly 4% of the drivers involved in injury collisions had some environmental condition recorded.
8% of the drivers involved in PDO collisions had some environmental condition recorded. In 2015, the driver involvement rate (per 10,000 licensed drivers) in traffic collisions where:
Any driver action is a contributing factor is 296.7, increased by 32% from the previous five years (224.8);
Any human condition is a contributing factor is 3.3, decreased by 69% from the previous five years (10.7);
Environmental conditions are a contributing factor is 45.4, decreased by 45% from the previous five years (82.7);
Distracted driving is a contributing factor is 107.4, increased 88% from the previous five years (57.1);
Speed is a contributing factor is 35.1, increased by 45% from the previous five years (24.2); and,
Impaired is a contributing factor is 1.5, decreased by nearly 30% from the previous five years (2.2).
Major Elements Examined Counts of drivers involved in collisions in Manitoba for 2015 and previous years are taken from Traffic Accident Reports (TARs) completed by Manitoba Public Insurance and law enforcement agencies, and compiled by Manitoba Public Insurance. These counts are presented for all reportable collisions, fatal collisions, injury collisions, and property damage only (PDO) collisions. When reviewing the “Contributing Factors” for a traffic collision, the reader is cautioned to note that more than one contributing factor can be recorded for each collision. The total count of contributing factors noted will add to more than the number of collisions, vehicles, drivers or victims in those crashes. For the purposes of this report, speed as a contributing factor is discussed as being a combination of the individual factors “exceeding speed limit”, “driving too fast for conditions” and “unsafe operating speed (too fast or too slow)”. For the purposes of this report, impaired as a contributing factor is discussed as being a combination of the individual factors “ability impaired by alcohol”, “ability impaired by drugs” and “had been drinking/suspected alcohol use”. For the purposes of this report, distracted driving as a contributing factor is discussed as being a combination of the individual factors “careless driving” and “distraction/inattention”.

Section 9 Contributing Factors
145
It is important to note that the number of collisions is not equal to the number of drivers involved in collisions because some collisions involve more than one driver while others involve a single driver. (A full definition of what constitutes a “driver” for this report is provided under the “Terms and Definitions” heading.) Because there are more drivers involved in collisions than collisions overall, relative involvement rates calculated based on the number of drivers will be higher than the relative involvement rates calculated based on the number of collisions. When exploring the number of drivers in different age groups involved in traffic collisions, the reader is cautioned that the driver’s age is missing in some collisions. In 2015, 0.2% of drivers are not identified by age. In the five year annual average (2010 to 2014), 5% of drivers were not identified by age. The reader is cautioned that not all percentages and calculations in the following tables will add to 100% of the total noted. Rounding error will often produce a difference of one or two percentage points. Average annual calculations are presented for historical data from the years 2010 to 2014. Rounding error in these calculations will cause individual average counts not to add to total average counts in some cases. Due to the small numbers of fatal collisions, fluctuations year-over-year could be dramatic; a small change in the total count of these types of collisions could have a significant effect on statistics such as percentage change to previous years and relative involvement rates. Therefore, the reader is strongly cautioned when interpreting results regarding fatal collisions. Terms and Definitions “Contributing Factor”
Those circumstances or factors recorded as having contributed to the collision or its severity. Factors can be selected from four categories: driver action, human condition, vehicle condition, or environmental condition. The TAR allows for up to three contributing factors to be recorded for each driver or vehicle involved in the collision.
“At-fault Contributing Factor”
A contributing factor where some action or condition other than “driving properly” and “apparently normal” has been noted.
“Driver Action”
A category of contributing factors attributed to actions taken or performed by a driver immediately prior to a collision.
“Human Condition”
A category of contributing factors attributed to the physical or mental condition of a driver immediately prior to a collision, most often that limit the driver’s ability to drive safely or properly.
“Vehicle Condition”
A category of contributing factors attributed to the physical condition of a vehicle immediately prior to a collision.
“Environmental Condition”
A category of contributing factors attributed to environmental conditions (i.e., weather, road surface and animal actions) immediately prior to a collision.
“Drivers”
The number of drivers involved in collisions. It excludes pedestrians, bicyclists, snowmobiles, off-road vehicles, farm and construction equipment, trains and parked vehicles.
“Collision severity”
A classification of a collision based on the most severe result of the collision; i.e., whether someone was killed (fatal), injured (injury) or property damage only (PDO) occurred.

Section 9 Contributing Factors
146
“Fatal Collision”
A motor vehicle collision in which at least one person is killed as a result of the collision. The death must have occurred within thirty days of the collision occurrence.
“Injury Collision”
A motor vehicle collision in which at least one person has been recorded as sustaining some level of personal injury, but in which no one is fatally injured or killed. Levels of injury include: ‘major’ (admitted to hospital); ‘minor’ (treated and released from hospital); and, ‘minimal’ (no hospital treatment required).
“Property Damage Only (PDO) Collision”
A motor vehicle collision in which no injury or fatality is sustained and only property damage is the result.
“Driver Involvement Rate”
A calculation of the number of drivers involved in traffic collisions for every 10,000 drivers licensed in Manitoba. The total number of drivers licensed to drive includes both active and suspended drivers. This involvement rate does not take into account the number of vehicle kilometers driven by each driver group.

Section 9 Contributing Factors
147
Table 9-1 Contributing Factors to a Collision by Collision Severity
Table 9-1
Contributing Factors to a Collision by Collision Severity: 2015
Contributing Factor
2015 Collision Severity 2015 Total Collisions
% of 2015 Total
Collisions Fatal % of Total
Fatal Injury
% of Total Injury
PDO % of Total
PDO
Driver Action - Driving Properly and Human Condition - Apparently Normal
40 58.0% 7,510 82.3% 20,766 64.2% 28,316 68.2%
Driver Action - Driving properly 1 1.4% 175 1.9% 354 1.1% 530 1.3%
Any Driver Action 56 81.2% 6,612 72.4% 19,209 59.4% 25,877 62.3%
Follow too closely 2 2.9% 2,523 27.6% 4,433 13.7% 6,958 16.7%
Turning improperly 4 5.8% 768 8.4% 1,792 5.5% 2,564 6.2%
Passing improperly 3 4.3% 25 0.3% 123 0.4% 151 0.4%
Changing lanes improperly 0 - 335 3.7% 1,579 4.9% 1,914 4.6%
Fail to yield right-of-way 8 11.6% 782 8.6% 1,482 4.6% 2,272 5.5%
Disobey traffic control device/officer 6 8.7% 245 2.7% 249 0.8% 500 1.2%
Drive wrong way on roadway 1 1.4% 11 0.1% 16 <0.1% 28 <0.1%
Passing a vehicle at pedestrian X-walk 0 - 0 - 0 - 0 -
Back unsafely 0 - 202 2.2% 2,838 8.8% 3,040 7.3%
Parking improperly 1 1.4% 11 0.1% 140 0.4% 152 0.4%
Lost control/Drive off road 9 13.0% 382 4.2% 1,198 3.7% 1,589 3.8%
Driverless vehicle ran out of control 1 1.4% 6 <0.1% 31 <0.1% 38 <0.1%
Leave stop sign before safe to do so 4 5.8% 310 3.4% 530 1.6% 844 2.0%
Failed to signal 0 - 9 <0.1% 12 <0.1% 21 <0.1%
Take avoiding action 0 - 76 0.8% 412 1.3% 488 1.2%
Driver inexperience 3 4.3% 44 0.5% 129 0.4% 176 0.4%
Pedestrian error/confusion 5 7.2% 16 0.2% 34 0.1% 55 0.1%
NET Speed 13 18.8% 745 8.2% 2,334 7.2% 3,092 7.4%
Exceeding speed limit 3 4.3% 16 0.2% 29 <0.1% 48 0.1%
Driving too fast for conditions 7 10.1% 719 7.9% 2,279 7.0% 3,005 7.2%
Unsafe operating speed (Too fast or too slow) 3 4.3% 17 0.2% 28 <0.1% 48 0.1%
NET Distracted driving 25 36.2% 2,260 24.8% 7,178 22.2% 9,463 22.8%
Careless Driving 20 29.0% 2,095 23.0% 6,828 21.1% 8,943 21.5%
Distraction/Inattention 7 10.1% 232 2.5% 477 1.5% 716 1.7%
(continued on next page)

Section 9 Contributing Factors
148
(continued from previous page)
Contributing Factor
2015 Collision Severity 2015 Total Collisions
% of 2015 Total
Collisions Fatal % of Total
Fatal Injury
% of Total Injury
PDO % of Total
PDO
Human Condition - Apparently Normal 18 26.1% 1,628 17.8% 5,934 18.3% 7,580 18.2%
Any Human Condition 17 24.6% 141 1.5% 139 0.4% 297 0.7%
Loss of consciousness/Blackout prior to collision 0 - 31 0.3% 12 <0.1% 43 0.1%
Extreme fatigue/Fell asleep 0 - 22 0.2% 44 0.1% 66 0.2%
Defective eyesight 0 - 3 <0.1% 2 <0.1% 5 <0.1%
Defective hearing 1 1.4% 0 - 0 - 1 <0.1%
Medical disability 0 - 12 0.1% 8 <0.1% 20 <0.1%
Physical disability 1 1.4% 2 <0.1% 2 <0.1% 5 <0.1%
Mental disability 0 - 3 <0.1% 2 <0.1% 5 <0.1%
Mental confusion/Inability to remember 0 - 20 0.2% 8 <0.1% 28 <0.1%
Sudden illness 1 1.4% 3 <0.1% 4 <0.1% 8 <0.1%
Exceed hours of service (commercial drivers only) 0 - 0 - 0 - 0 -
NET Impaired 15 21.7% 61 0.7% 64 0.2% 140 0.3%
Ability impaired alcohol 12 17.4% 48 0.5% 49 0.2% 109 0.3%
Ability impaired drugs 1 1.4% 5 <0.1% 1 <0.1% 7 <0.1%
Had been drinking/Suspected alcohol use 3 4.3% 15 0.2% 18 <0.1% 36 <0.1%
No Apparent (Vehicle) Defect 47 68.1% 7,884 86.4% 24,352 75.3% 32,283 77.7%
Any Vehicle Defect 2 2.9% 29 0.3% 269 0.8% 300 0.7%
Defective brakes 0 - 6 <0.1% 16 <0.1% 22 <0.1%
Defective steering 0 - 2 <0.1% 13 <0.1% 15 <0.1%
Defective headlights 0 - 0 - 0 - 0 -
Defective brake lights 0 - 0 - 5 <0.1% 5 <0.1%
Defective lighting (unspecified) 0 - 0 - 0 - 0 -
Defective engine controls/drive train 0 - 2 <0.1% 4 <0.1% 6 <0.1%
Defective suspension/wheels 0 - 4 <0.1% 45 0.1% 49 0.1%
Defective tires 1 1.4% 5 <0.1% 68 0.2% 74 0.2%
Tow hitch/yoke defective 0 - 0 - 25 <0.1% 25 <0.1%
Defective exhaust system 0 - 0 - 0 - 0 -
Hood/tailgate/door/covering opened 0 - 1 <0.1% 3 <0.1% 4 <0.1%
Defective glazing (obscured windows) 0 - 0 - 3 <0.1% 3 <0.1%
Vehicle modifications 0 - 0 - 2 <0.1% 2 <0.1%
Fire 0 - 1 <0.1% 0 - 1 <0.1%
Overloaded/oversized 0 - 1 <0.1% 3 <0.1% 4 <0.1%
Load shifted/spilled 0 - 2 <0.1% 21 <0.1% 23 <0.1%
(continued on next page)
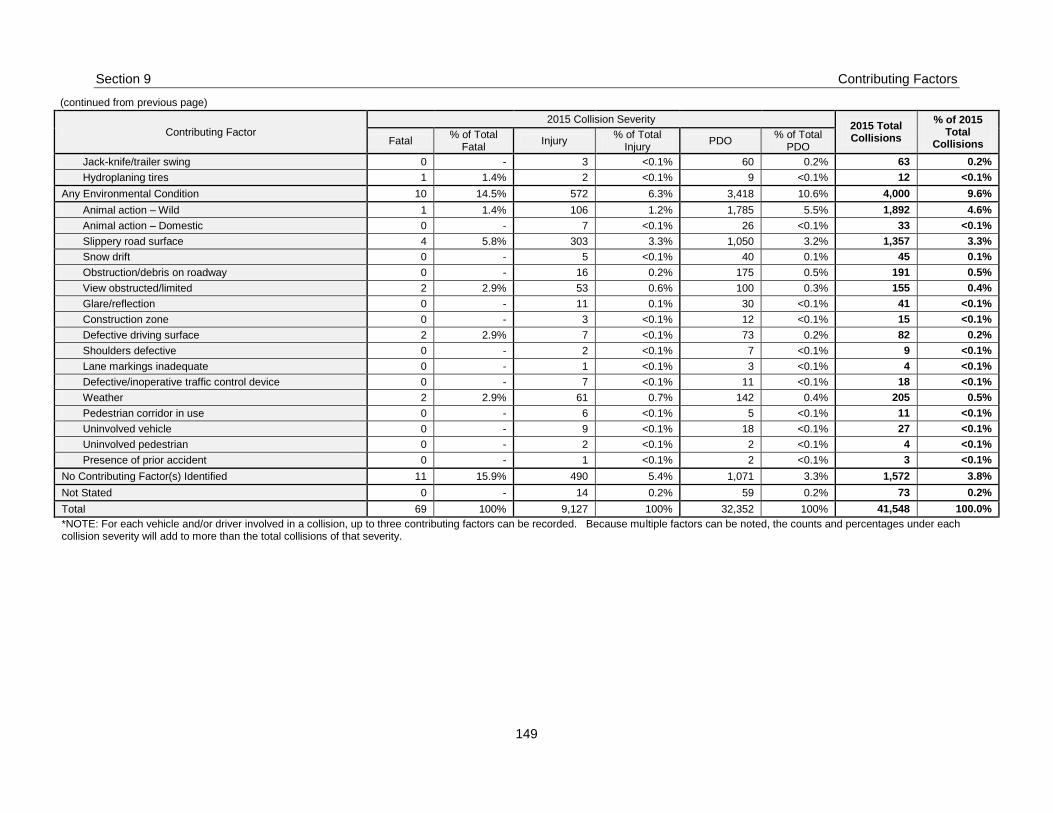
Section 9 Contributing Factors
149
(continued from previous page)
Contributing Factor
2015 Collision Severity 2015 Total Collisions
% of 2015 Total
Collisions Fatal % of Total
Fatal Injury
% of Total Injury
PDO % of Total
PDO
Jack-knife/trailer swing 0 - 3 <0.1% 60 0.2% 63 0.2%
Hydroplaning tires 1 1.4% 2 <0.1% 9 <0.1% 12 <0.1%
Any Environmental Condition 10 14.5% 572 6.3% 3,418 10.6% 4,000 9.6%
Animal action – Wild 1 1.4% 106 1.2% 1,785 5.5% 1,892 4.6%
Animal action – Domestic 0 - 7 <0.1% 26 <0.1% 33 <0.1%
Slippery road surface 4 5.8% 303 3.3% 1,050 3.2% 1,357 3.3%
Snow drift 0 - 5 <0.1% 40 0.1% 45 0.1%
Obstruction/debris on roadway 0 - 16 0.2% 175 0.5% 191 0.5%
View obstructed/limited 2 2.9% 53 0.6% 100 0.3% 155 0.4%
Glare/reflection 0 - 11 0.1% 30 <0.1% 41 <0.1%
Construction zone 0 - 3 <0.1% 12 <0.1% 15 <0.1%
Defective driving surface 2 2.9% 7 <0.1% 73 0.2% 82 0.2%
Shoulders defective 0 - 2 <0.1% 7 <0.1% 9 <0.1%
Lane markings inadequate 0 - 1 <0.1% 3 <0.1% 4 <0.1%
Defective/inoperative traffic control device 0 - 7 <0.1% 11 <0.1% 18 <0.1%
Weather 2 2.9% 61 0.7% 142 0.4% 205 0.5%
Pedestrian corridor in use 0 - 6 <0.1% 5 <0.1% 11 <0.1%
Uninvolved vehicle 0 - 9 <0.1% 18 <0.1% 27 <0.1%
Uninvolved pedestrian 0 - 2 <0.1% 2 <0.1% 4 <0.1%
Presence of prior accident 0 - 1 <0.1% 2 <0.1% 3 <0.1%
No Contributing Factor(s) Identified 11 15.9% 490 5.4% 1,071 3.3% 1,572 3.8%
Not Stated 0 - 14 0.2% 59 0.2% 73 0.2%
Total 69 100% 9,127 100% 32,352 100% 41,548 100.0%
*NOTE: For each vehicle and/or driver involved in a collision, up to three contributing factors can be recorded. Because multiple factors can be noted, the counts and percentages under each collision severity will add to more than the total collisions of that severity.

Section 9 Contributing Factors
150
Table 9-1a Contributing Factors to a Collision by Collision Severity for Previous Five Years
Table 9-1a
Contributing Factors to a Collision by Collision Severity: 2010-2014 Average
Contributing Factor
2010-2014 Average Count
Fatal Injury PDO Total
Collisions % of Total Collisions
Driver Action - Driving Properly and Human Condition - Apparently Normal
31 5,444 15,365 20,840 57.0%
Driver Action - Driving properly 4 314 1,034 1,352 3.7%
Any Driver Action 59 4,306 14,241 18,605 50.9%
Following too closely 1 1,456 3,015 4,473 12.2%
Turning improperly 2 376 1,098 1,476 4.0%
Passing improperly 2 27 115 144 0.4%
Changing lanes improperly <1 175 1,024 1,199 3.3%
Fail to yield right-of-way 8 479 1,134 1,621 4.4%
Disobey traffic control device/officer 5 165 281 450 1.2%
Drive wrong way on roadway 2 9 17 28 <0.1%
Passing a vehicle at pedestrian X-walk <1 <1 <1 1 <0.1%
Back unsafely - 131 1,927 2,058 5.6%
Parking improperly <1 7 94 101 0.3%
Lost control/Drive off road 15 273 842 1,130 3.1%
Driverless vehicle ran out of control - 2 15 17 <0.1%
Leave stop sign before safe to do so 2 193 404 600 1.6%
Failed to signal - 4 11 14 <0.1%
Take avoiding action 2 67 331 401 1.1%
Driver inexperience 2 50 141 192 0.5%
Pedestrian error/confusion 3 37 14 54 0.1%
NET Speed 18 442 1,559 2,018 5.5%
Exceeding speed limit 5 14 24 43 0.1%
Driving too fast for conditions 8 399 1,487 1,895 5.2%
Unsafe operating speed (Too fast or too slow) 4 32 54 90 0.2%
NET Distracted driving 25 1,009 3,748 4,781 13.1%
Careless Driving 16 845 3,325 4,186 11.4%
Distraction/Inattention 10 190 473 674 1.8%
Human Condition - Apparently Normal 17 1,216 3,830 5,063 13.8%
Any Human Condition 33 290 589 913 2.5%
Loss of consciousness/Blackout prior to collision 2 24 14 40 0.1%
Extreme fatigue/Fell asleep 1 29 44 74 0.2%
Defective eyesight <1 2 4 7 <0.1%
Defective hearing - <1 1 2 <0.1%
Medical disability <1 5 6 11 <0.1%
Physical disability <1 3 4 6 <0.1%
Mental disability 1 3 1 5 <0.1%
Mental confusion/Inability to remember <1 7 11 18 <0.1%
Sudden illness <1 4 4 8 <0.1%
Exceed hours of service (commercial drivers only) - - <1 <1 <0.1%
NET Impaired 21 71 100 192 0.5%
Ability impaired alcohol 14 47 68 128 0.4%
Ability impaired drugs <1 2 4 7 <0.1%
Had been drinking/Suspected alcohol use 7 25 34 66 0.2%
No Apparent (Vehicle) Defect 47 5,688 15,984 21,720 59.4%
Any Vehicle Defect 2 37 178 217 0.6%
Defective brakes <1 9 23 32 <0.1%
Defective steering - 2 7 9 <0.1%
Defective headlights <1 <1 1 2 <0.1%
Defective brake lights - <1 2 3 <0.1%
Defective lighting (unspecified) <1 1 2 4 <0.1%
(continued on next page)

Section 9 Contributing Factors
151
(continued from previous page)
Contributing Factor
2010-2014 Average Count
Fatal Injury PDO Total
Collisions % of Total Collisions
Defective engine controls/drive train - 3 8 11 <0.1%
Defective suspension/wheels - 3 25 28 <0.1%
Defective tires <1 7 39 46 0.1%
Tow hitch/yoke defective - 1 13 14 <0.1%
Defective exhaust system <1 <1 <1 <1 <0.1%
Hood/tailgate/door/covering opened - <1 3 4 <0.1%
Defective glazing (obscured windows) - 1 2 3 <0.1%
Vehicle modifications - <1 <1 1 <0.1%
Fire - <1 2 2 <0.1%
Overloaded/oversized - <1 2 2 <0.1%
Load shifted/spilled - 2 14 16 <0.1%
Jack-knife/trailer swing <1 1 33 34 <0.1%
Hydroplaning tires - 3 3 6 <0.1%
Any Environmental Condition 10 716 6,103 6,830 18.7%
Animal action - Wild <1 209 4,107 4,316 11.8%
Animal action - Domestic <1 12 95 107 0.3%
Slippery road surface 4 321 1,289 1,614 4.4%
Snow drift - 16 109 126 0.3%
Obstruction/debris on roadway <1 14 133 147 0.4%
View obstructed/limited 1 44 129 174 0.5%
Glare/reflection - 16 31 47 0.1%
Construction zone - 6 21 26 <0.1%
Defective driving surface <1 26 86 112 0.3%
Shoulders defective <1 5 9 14 <0.1%
Lane markings inadequate - 1 6 8 <0.1%
Defective/inoperative traffic control device <1 3 6 10 <0.1%
Weather 3 58 166 227 0.6%
Pedestrian corridor in use <1 8 5 13 <0.1%
Uninvolved vehicle <1 6 25 32 <0.1%
Uninvolved pedestrian - 3 6 9 <0.1%
Presence of prior accident - 4 6 10 <0.1%
No Contributing Factor(s) Identified 11 1,471 4,510 5,992 16.4%
Not Stated - 29 89 118 0.3%
Total 79 7,545 28,963 36,587 100%
Note: Counts of collisions in the 2010-2014 average may not add to the total due to rounding. *NOTE: For each vehicle and/or driver involved in a collision, up to three contributing factors can be recorded. Because multiple factors can be noted, the counts and percentages under each collision severity will add to more than the total collisions of that severity.

Section 9 Contributing Factors
152
While contributing factors are recorded for each vehicle and/or driver involved in a collision, examining contributing factors at the driver level does not reveal the full detail of what may have caused the collision overall. To understand the contributing factors to a collision, contributing factors recorded for each vehicle and/or driver involved in the collision are examined at the collision level, that is, rather than at the individual driver level. In this analysis (presented in Table 9-1 and Table 9-1a), all factors noted as contributing to the collision overall are examined. In 2015, 69% of all collisions have at least one driver noted as having an at-fault contributing factor
2.
Most fatal collisions (87%) have at least one driver with an at-fault contributing factor while 75% of injury collisions do. In the previous five year (2010 to 2014) annual average, 68% of all collisions have at least one driver noted as having an at-fault contributing factor, including 86% of fatal collisions and 65% of injury collisions. In 2015:
A driver action is a contributing factor in 62% of all collisions (81% of fatal collisions; 72% of injury collisions; 59% of PDO collisions);
A human condition is a contributing factor in 1% of all collisions (25% of fatal collisions; nearly 2% of injury collisions; less than 1% of PDO collisions); and,
Environmental conditions are contributing factors in 10% of all collisions (nearly 15% of fatal collisions; 6% of injury collisions; 11% of PDO collisions); and,
Some vehicle defect is noted as contributing factor in 1% of all collisions, including 2 fatal collisions.
In the five year (2010 to 2014) annual average:
51% of all collisions have at least one driver noted as having a driver action (74% of fatal collisions; 57% of injury collisions; 49% of PDO collisions);
Nearly 3% of all collisions have at least one driver noted as having a human condition (42% of fatal collisions; 4% of injury collisions; 2% of PDO collisions);
19% of all collisions have an environmental condition noted as contributing to the collision (12% of fatal collisions; nearly 10% of injury collisions; 21% of PDO collisions); and,
1% of collisions have a vehicle defect noted as contributing to the collision, including 2 fatal collisions each year.
The most prevalent contributing factors recorded for collisions in 2015 include:
Distracted driving – 23% of all collisions (36% fatal; 25% injury; 22% PDO);
“Following too closely” – 17% of all collisions (3% fatal; 28% injury; 14% PDO);
Speed – 7% of all collisions (19% fatal; 8% injury; 7% PDO);
“Backing unsafely” – 7% of all collisions (none fatal; 2% injury; 9% PDO);
“Turning improperly” – 6% of all collisions (6% fatal; 8% injury; nearly 6% PDO);
“Fail to yield right-of-way” – nearly 6% of all collisions (12% fatal; 9% injury; 5% PDO);
“Changing lanes improperly” –5% of all collisions (none fatal; 4% injury; 5% PDO);
The actions of a wild animal – 5% of all collisions (1% fatal; 1% injury; nearly 6% PDO);
“Lost control/Drive off the road” – 4% of all collisions (13% fatal; 4% injury; 4% PDO); and,
“Slippery road surface” – 3% of all collisions (6% fatal; 3% injury; 3% PDO). NOTE: For a detailed count of contributing factors recorded for collisions occurring in each year from 2010 to 2015, please refer to “Table 9-6 Historical Summary of Contributing Factors to a Collision” at the end of this section.
2 An “at-fault contributing factor” is an indication that some action or condition of the driver, vehicle or environment has been recorded as contributing to the collision. It excludes indications of the driver “driving properly” and being “apparently normal”.

Section 9 Contributing Factors
153
Table 9-2 Contributing Factors for Victims of a Collision by Casualty Type
Table 9-2
Contributing Factors for Each Victim of a Collision by Casualty Type: 2015
Contributing Factor
2015 Casualty Type
2015 Total Casualties
% of 2015 Total
Casualties Killed % of Total
Killed Serious Injury
% of Total Serious Injury
Other Injuries
% of Total Other
Injuries
Total Injuries
% of Total Injuries
Driver Action - Driving Properly and Human Condition - Apparently Normal
47 60.3% 236 56.9% 9,758 84.7% 9,994 83.7% 10,041 83.6%
Driver Action - Driving properly 2 2.6% 14 3.4% 239 2.1% 253 2.1% 255 2.1%
Any Driver Action 61 78.2% 324 78.1% 8,547 74.2% 8,871 74.3% 8,932 74.3%
Following too closely 2 2.6% 32 7.7% 3,352 29.1% 3,384 28.3% 3,386 28.2%
Turning improperly 4 5.1% 46 11.1% 1,031 8.9% 1,077 9.0% 1,081 9.0%
Passing improperly 3 3.8% 3 0.7% 31 0.3% 34 0.3% 37 0.3%
Changing lanes improperly 0 - 7 1.7% 384 3.3% 391 3.3% 391 3.3%
Fail to yield right-of-way 9 11.5% 40 9.6% 1,093 9.5% 1,133 9.5% 1,142 9.5%
Disobey traffic control device/officer 6 7.7% 25 6.0% 362 3.1% 387 3.2% 393 3.3%
Drive wrong way on roadway 1 1.3% 1 0.2% 20 0.2% 21 0.2% 22 0.2%
Passing a vehicle at pedestrian X-walk 0 - 0 - 0 - 0 - 0 -
Back unsafely 0 - 1 0.2% 230 2.0% 231 1.9% 231 1.9%
Parking improperly 1 1.3% 0 - 11 <0.1% 11 <0.1% 12 <0.1%
Lost control/Drive off road 10 12.8% 55 13.3% 415 3.6% 470 3.9% 480 4.0%
Driverless vehicle ran out of control 1 1.3% 0 - 10 <0.1% 10 <0.1% 11 <0.1%
Leave stop sign before safe to do so 5 6.4% 27 6.5% 418 3.6% 445 3.7% 450 3.7%
Failed to signal 0 - 0 - 11 <0.1% 11 <0.1% 11 <0.1%
Take avoiding action 0 - 4 1.0% 88 0.8% 92 0.8% 92 0.8%
Driver inexperience 3 3.8% 9 2.2% 46 0.4% 55 0.5% 58 0.5%
Pedestrian error/confusion 5 6.4% 4 1.0% 17 0.1% 21 0.2% 26 0.2%
NET Speed 13 16.7% 60 14.5% 920 8.0% 980 8.2% 993 8.3%
Exceeding speed limit 3 3.8% 6 1.4% 15 0.1% 21 0.2% 24 0.2%
Driving too fast for conditions 7 9.0% 52 12.5% 894 7.8% 946 7.9% 953 7.9%
Unsafe operating speed (Too fast or too slow) 3 3.8% 5 1.2% 16 0.1% 21 0.2% 24 0.2%
NET Distracted driving 28 35.9% 133 32.0% 2,940 25.5% 3,073 25.7% 3,101 25.8%
Careless Driving 23 29.5% 118 28.4% 2,697 23.4% 2,815 23.6% 2,838 23.6%
Distraction/Inattention 7 9.0% 30 7.2% 328 2.8% 358 3.0% 365 3.0%
(continued on next page)

Section 9 Contributing Factors
154
(continued from previous page)
Contributing Factor
2015 Casualty Type
2015 Total Casualties
% of 2015 Total
Casualties Killed % of Total
Killed Serious Injury
% of Total Serious Injury
Other Injuries
% of Total Other
Injuries
Total Injuries
% of Total Injuries
Human Condition - Apparently Normal 20 25.6% 79 19.0% 2,118 18.4% 2,197 18.4% 2,217 18.4%
Any Human Condition 18 23.1% 48 11.6% 160 1.4% 208 1.7% 226 1.9%
Loss of consciousness/Blackout prior to collision 0 - 17 4.1% 22 0.2% 39 0.3% 39 0.3%
Extreme fatigue/Fell asleep 0 - 3 0.7% 25 0.2% 28 0.2% 28 0.2%
Defective eyesight 0 - 1 0.2% 3 <0.1% 4 <0.1% 4 <0.1%
Defective hearing 1 1.3% 0 - 1 <0.1% 1 <0.1% 2 <0.1%
Medical disability 0 - 0 - 14 0.1% 14 0.1% 14 0.1%
Physical disability 1 1.3% 1 0.2% 2 <0.1% 3 <0.1% 4 <0.1%
Mental disability 0 - 1 0.2% 3 <0.1% 4 <0.1% 4 <0.1%
Mental confusion/Inability to remember 0 - 7 1.7% 20 0.2% 27 0.2% 27 0.2%
Sudden illness 1 1.3% 0 - 3 <0.1% 3 <0.1% 4 <0.1%
Exceed hours of service (commercial drivers only) 0 - 0 - 0 - 0 - 0 -
NET Impaired 16 20.5% 24 5.8% 81 0.7% 105 0.9% 121 1.0%
Ability impaired alcohol 13 16.7% 21 5.1% 63 0.5% 84 0.7% 97 0.8%
Ability impaired drugs 2 2.6% 1 0.2% 6 <0.1% 7 <0.1% 9 <0.1%
Had been drinking/Suspected alcohol use 3 3.8% 4 1.0% 20 0.2% 24 0.2% 27 0.2%
No Apparent (Vehicle) Defect 54 69.2% 280 67.5% 10,154 88.1% 10,434 87.4% 10,488 87.3%
Any Vehicle Defect 2 2.6% 4 1.0% 29 0.3% 33 0.3% 35 0.3%
Defective brakes 0 - 0 - 8 <0.1% 8 <0.1% 8 <0.1%
Defective steering 0 - 0 - 2 <0.1% 2 <0.1% 2 <0.1%
Defective headlights 0 - 0 - 0 - 0 - 0 -
Defective brake lights 0 - 0 - 0 - 0 - 0 -
Defective lighting (unspecified) 0 - 0 - 0 - 0 - 0 -
Defective engine controls/drive train 0 - 0 - 2 <0.1% 2 <0.1% 2 <0.1%
Defective suspension/wheels 0 - 0 - 4 <0.1% 4 <0.1% 4 <0.1%
Defective tires 1 1.3% 3 0.7% 4 <0.1% 7 <0.1% 8 <0.1%
Tow hitch/yoke defective 0 - 0 - 0 - 0 - 0 -
Defective exhaust system 0 - 0 - 0 - 0 - 0 -
Hood/tailgate/door/covering opened 0 - 0 - 1 <0.1% 1 <0.1% 1 <0.1%
Defective glazing (obscured windows) 0 - 0 - 0 - 0 - 0 -
Vehicle modifications 0 - 0 - 0 - 0 - 0 -
Fire 0 - 1 0.2% 0 - 1 <0.1% 1 <0.1%
Overloaded/oversized 0 - 0 - 1 <0.1% 1 <0.1% 1 <0.1%
(continued on next page)

Section 9 Contributing Factors
155
(continued from previous page)
Contributing Factor
2015 Casualty Type
2015 Total Casualties
% of 2015 Total
Casualties Killed % of Total
Killed Serious Injury
% of Total Serious Injury
Other Injuries
% of Total Other
Injuries
Total Injuries
% of Total Injuries
Load shifted/spilled 0 - 0 - 2 <0.1% 2 <0.1% 2 <0.1%
Jack-knife/trailer swing 0 - 0 - 3 <0.1% 3 <0.1% 3 <0.1%
Hydroplaning tires 1 1.3% 0 - 2 <0.1% 2 <0.1% 3 <0.1%
Any Environmental Condition 13 16.7% 50 12.0% 701 6.1% 751 6.3% 764 6.4%
Animal action – Wild 1 1.3% 7 1.7% 122 1.1% 129 1.1% 130 1.1%
Animal action – Domestic 0 - 1 0.2% 11 <0.1% 12 0.1% 12 <0.1%
Slippery road surface 4 5.1% 25 6.0% 383 3.3% 408 3.4% 412 3.4%
Snow drift 0 - 0 - 6 <0.1% 6 <0.1% 6 <0.1%
Obstruction/debris on roadway 0 - 1 0.2% 23 0.2% 24 0.2% 24 0.2%
View obstructed/limited 5 6.4% 6 1.4% 64 0.6% 70 0.6% 75 0.6%
Glare/reflection 0 - 1 0.2% 14 0.1% 15 0.1% 15 0.1%
Construction zone 0 - 0 - 5 <0.1% 5 <0.1% 5 <0.1%
Defective driving surface 2 2.6% 2 0.5% 8 <0.1% 10 <0.1% 12 <0.1%
Shoulders defective 0 - 1 0.2% 1 <0.1% 2 <0.1% 2 <0.1%
Lane markings inadequate 0 - 0 - 2 <0.1% 2 <0.1% 2 <0.1%
Defective/inoperative traffic control device 0 - 0 - 9 <0.1% 9 <0.1% 9 <0.1%
Weather 2 2.6% 13 3.1% 66 0.6% 79 0.7% 81 0.7%
Pedestrian corridor in use 0 - 1 0.2% 5 <0.1% 6 <0.1% 6 <0.1%
Uninvolved vehicle 0 - 0 - 11 <0.1% 11 <0.1% 11 <0.1%
Uninvolved pedestrian 0 - 0 - 2 <0.1% 2 <0.1% 2 <0.1%
Presence of prior accident 0 - 0 - 1 <0.1% 1 <0.1% 1 <0.1%
No Contributing Factor(s) Identified 11 14.1% 36 8.7% 603 5.2% 639 5.4% 650 5.4%
Not Stated 0 - 1 0.2% 15 0.1% 16 0.1% 16 0.1%
Total 78 100% 415 100.0% 11,524 100.0% 11,939 100.0% 12,017 100.0%
*NOTE: For each vehicle and/or driver involved in a collision, up to three contributing factors can be recorded. Because multiple factors can be noted, the counts and percentages under each casualty type will add to more than the total victims of that casualty type. "Other Injuries" includes injuries defined as "Minor", Minimal" and "Other", or undefined in severity.

Section 9 Contributing Factors
156
Table 9-2a Contributing Factors for Victims of a Collision by Casualty Type for Previous Five Years
Table 9-2a
Contributing Factors for Each Victim of a Collision by Casualty Type: 2010-2014 Average
Contributing Factor
2010-2014 Average Count of Casualties
Killed Serious Injury
Other Injuries
Total Injuries Total
Casualties % of Total Casualties
Driver Action - Driving Properly and Human Condition - Apparently Normal
36 154 6,946 7,100 7,137 72.8%
Driver Action - Driving properly 5 15 419 434 439 4.5%
Any Driver Action 67 186 5,445 5,630 5,697 58.1%
Following too closely 2 12 1,827 1,838 1,840 18.8%
Turning improperly 2 12 489 501 502 5.1%
Passing improperly 3 3 35 39 41 0.4%
Changing lanes improperly <1 2 216 218 219 2.2%
Fail to yield right-of-way 9 25 646 671 680 6.9%
Disobey traffic control device/officer 5 11 234 245 250 2.6%
Drive wrong way on roadway 3 2 13 15 18 0.2%
Passing a vehicle at pedestrian X-walk <1 <1 <1 <1 <1 <0.1%
Back unsafely - 1 149 150 150 1.5%
Parking improperly <1 <1 8 8 9 <0.1%
Lost control/Drive off road 15 40 330 370 385 3.9%
Driverless vehicle ran out of control - - 2 2 2 <0.1%
Leave stop sign before safe to do so 2 12 263 276 278 2.8%
Failed to signal - - 4 4 4 <0.1%
Take avoiding action 2 5 81 85 88 0.9%
Driver inexperience 2 5 67 72 74 0.8%
Pedestrian error/confusion 3 5 36 41 45 0.5%
NET Speed 21 42 563 605 626 6.4%
Exceeding speed limit 6 6 21 27 33 0.3%
Driving too fast for conditions 10 25 506 531 541 5.5%
Unsafe operating speed (Too fast or too slow) 6 11 42 53 59 0.6%
NET Distracted driving 29 59 1,272 1,331 1,360 13.9%
Careless Driving 19 44 1,054 1,098 1,117 11.4%
Distraction/Inattention 11 18 254 272 283 2.9%
Human Condition - Apparently Normal 19 65 1,555 1,620 1,639 16.7%
Any Human Condition 37 58 373 430 467 4.8%
Loss of consciousness/Blackout prior to collision 2 5 23 28 30 0.3%
Extreme fatigue/Fell asleep 1 5 31 36 38 0.4%
Defective eyesight <1 <1 3 3 4 <0.1%
Defective hearing - - <1 <1 <1 <0.1%
Medical disability <1 1 6 7 7 <0.1%
Physical disability <1 - 4 4 4 <0.1%
Mental disability 1 1 5 6 7 <0.1%
Mental confusion/Inability to remember <1 2 8 10 10 0.1%
Sudden illness <1 1 3 4 5 <0.1%
Exceed hours of service (commercial drivers only) - - - - - -
NET Impaired 24 31 101 132 156 1.6%
Ability impaired alcohol 15 22 66 88 104 1.1%
Ability impaired drugs <1 1 4 5 5 <0.1%
Had been drinking/Suspected alcohol use 9 10 36 46 55 0.6%
No Apparent (Vehicle) Defect 55 190 7,228 7,418 7,473 76.3%
Any Vehicle Defect 2 4 48 53 55 0.6%
Defective brakes <1 <1 12 12 13 0.1%
Defective steering - <1 3 3 3 <0.1%
Defective headlights <1 <1 2 2 3 <0.1%
(continued on next page)

Section 9 Contributing Factors
157
(continued from previous page)
Contributing Factor
2010-2014 Average Count of Casualties
Killed Serious Injury
Other Injuries
Total Injuries Total
Casualties % of Total Casualties
Defective brake lights - <1 1 2 2 <0.1%
Defective lighting (unspecified) <1 <1 1 2 2 <0.1%
Defective engine controls/drive train - <1 4 4 4 <0.1%
Defective suspension/wheels - <1 4 5 5 <0.1%
Defective tires <1 1 10 12 12 0.1%
Tow hitch/yoke defective - - 2 2 2 <0.1%
Defective exhaust system <1 - <1 <1 <1 <0.1%
Hood/tailgate/door/covering opened - - <1 <1 <1 <0.1%
Defective glazing (obscured windows) - - 1 1 1 <0.1%
Vehicle modifications - - <1 <1 <1 <0.1%
Fire - - <1 <1 <1 <0.1%
Overloaded/oversized - - <1 <1 <1 <0.1%
Load shifted/spilled - <1 1 2 2 <0.1%
Jack-knife/trailer swing <1 <1 2 2 2 <0.1%
Hydroplaning tires - <1 3 3 3 <0.1%
Any Environmental Condition 12 45 890 935 946 9.7%
Animal action - Wild <1 9 240 249 249 2.5%
Animal action - Domestic <1 <1 14 15 15 0.2%
Slippery road surface 5 16 417 434 438 4.5%
Snow drift - <1 21 22 22 0.2%
Obstruction/debris on roadway <1 1 17 19 19 0.2%
View obstructed/limited 1 5 54 58 60 0.6%
Glare/reflection - <1 21 22 22 0.2%
Construction zone - <1 8 9 9 <0.1%
Defective driving surface <1 4 33 37 37 0.4%
Shoulders defective <1 <1 5 6 6 <0.1%
Lane markings inadequate - <1 2 2 2 <0.1%
Defective/inoperative traffic control device <1 <1 4 5 5 <0.1%
Weather 4 6 77 84 87 0.9%
Pedestrian corridor in use <1 <1 7 8 8 <0.1%
Uninvolved vehicle <1 <1 10 10 10 0.1%
Uninvolved pedestrian - <1 3 4 4 <0.1%
Presence of prior accident - - 7 7 7 <0.1%
No Contributing Factor(s) Identified 12 68 1,813 1,882 1,893 19.3%
Not Stated - 2 35 37 37 0.4%
Total 89 320 9,391 9,711 9,800 100%
Note: Counts of victims in the 2010-2014 average may not add to the total due to rounding. *NOTE: For each vehicle and/or driver involved in a collision, up to three contributing factors can be recorded. Because multiple factors can be noted, the counts and percentages under each casualty type will add to more than the total victims of that casualty type. "Other Injuries" includes injuries defined as "Minor", Minimal" and "Other", or undefined in severity.

Section 9 Contributing Factors
158
Contributing factors recorded for each vehicle and/or driver involved in the collision are examined at the victim level in Table 9-2 and Table 9-2a. In this analysis, the contributing factors recorded for any driver involved in a fatal or injury collision is considered as contributing to the person being killed or injured. In 2015, at-fault contributing factors are recorded for 77% of all casualties. At-fault contributing factors are recorded for:
83% of people killed;
85% of people seriously injured; and,
77% of victims with other injuries (including minor, minimal and undefined injuries). In 2015, driver actions are recorded for 74% of all victims (78% of people killed and 78% of people seriously injured) while human conditions are recorded for 2% of all victims (23% of people killed and 12% of people seriously injured). Environmental conditions are recorded as a contributing factor for 6% of all victims (17% of people killed and 12% of people seriously injured). In the previous five year (2010 to 2014) annual average, driver actions are recorded for 58% of all victims (75% of people killed and 58% of people seriously injured), while human conditions are recorded for 5% of all victims (41% of people killed and 18% of people seriously injured). Environmental conditions are recorded as a contributing factor for 10% of all victims, including for 13% of people killed and 14% of people seriously injured. The most prevalent contributing factors recorded for collisions where people are killed or seriously injured in 2015 include:
Distracted driving – 36% of people killed and 32% of people seriously injured;
Speed –17% of people killed and nearly 15% of people seriously injured;
“Lost control/Drive off the road” – 13% of people killed and 13% of people seriously injured;
“Turning improperly” – 5% of people killed and 11% of people seriously injured;
“Fail to yield right-of-way” – nearly 12% of people killed and 10% of people seriously injured;
Impaired – nearly 21% of people killed and 6% of people seriously injured;
“Following too closely” – 3% of the people killed and 8% of people seriously injured;
“Leave stop sign before safe to do so” – 6% of people killed and nearly 7% of people seriously injured;
“Disobey traffic control” – 8% of people killed and 6% of people seriously injured; and,
“Slippery road surface” – 5% of the people killed and 6% of people seriously injured. NOTE: For a detailed count of contributing factors recorded for collisions occurring in each year from 2010 to 2015, please refer to “Table 9-7 Historical Summary of Contributing Factors Recorded for Victims of Collisions” at the end of this section.
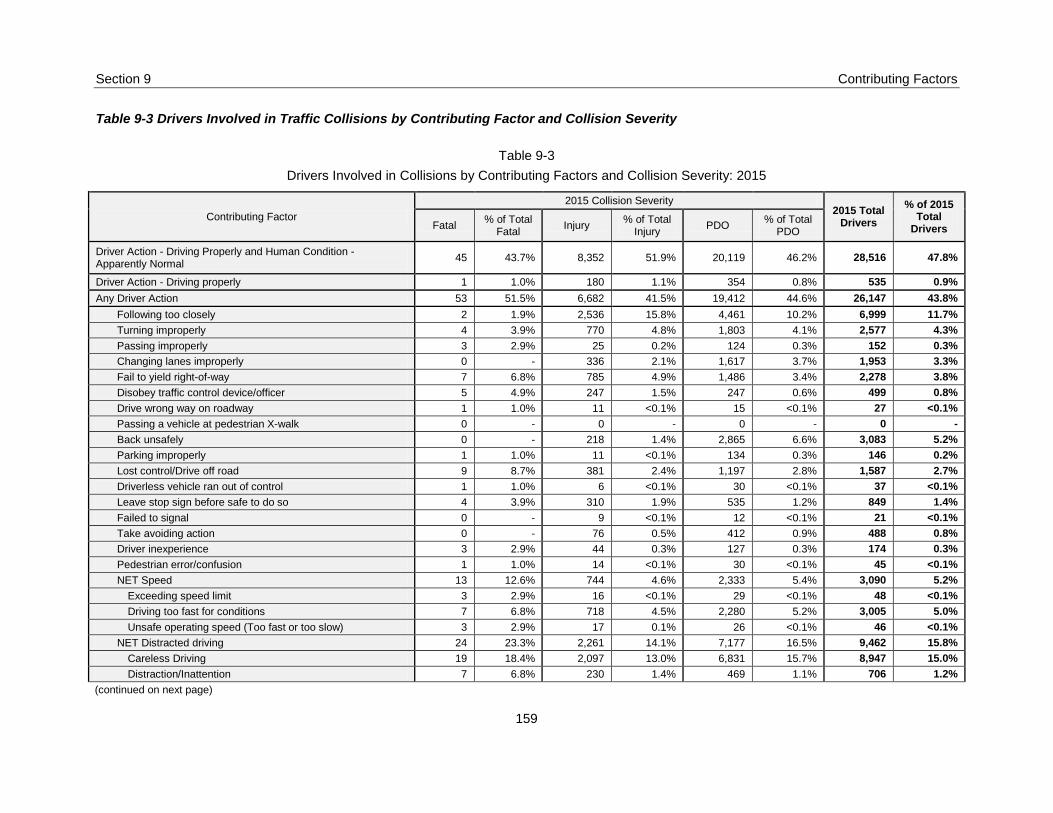
Section 9 Contributing Factors
159
Table 9-3 Drivers Involved in Traffic Collisions by Contributing Factor and Collision Severity
Table 9-3
Drivers Involved in Collisions by Contributing Factors and Collision Severity: 2015
Contributing Factor
2015 Collision Severity 2015 Total
Drivers
% of 2015 Total
Drivers Fatal % of Total
Fatal Injury
% of Total Injury
PDO % of Total
PDO
Driver Action - Driving Properly and Human Condition - Apparently Normal
45 43.7% 8,352 51.9% 20,119 46.2% 28,516 47.8%
Driver Action - Driving properly 1 1.0% 180 1.1% 354 0.8% 535 0.9%
Any Driver Action 53 51.5% 6,682 41.5% 19,412 44.6% 26,147 43.8%
Following too closely 2 1.9% 2,536 15.8% 4,461 10.2% 6,999 11.7%
Turning improperly 4 3.9% 770 4.8% 1,803 4.1% 2,577 4.3%
Passing improperly 3 2.9% 25 0.2% 124 0.3% 152 0.3%
Changing lanes improperly 0 - 336 2.1% 1,617 3.7% 1,953 3.3%
Fail to yield right-of-way 7 6.8% 785 4.9% 1,486 3.4% 2,278 3.8%
Disobey traffic control device/officer 5 4.9% 247 1.5% 247 0.6% 499 0.8%
Drive wrong way on roadway 1 1.0% 11 <0.1% 15 <0.1% 27 <0.1%
Passing a vehicle at pedestrian X-walk 0 - 0 - 0 - 0 -
Back unsafely 0 - 218 1.4% 2,865 6.6% 3,083 5.2%
Parking improperly 1 1.0% 11 <0.1% 134 0.3% 146 0.2%
Lost control/Drive off road 9 8.7% 381 2.4% 1,197 2.8% 1,587 2.7%
Driverless vehicle ran out of control 1 1.0% 6 <0.1% 30 <0.1% 37 <0.1%
Leave stop sign before safe to do so 4 3.9% 310 1.9% 535 1.2% 849 1.4%
Failed to signal 0 - 9 <0.1% 12 <0.1% 21 <0.1%
Take avoiding action 0 - 76 0.5% 412 0.9% 488 0.8%
Driver inexperience 3 2.9% 44 0.3% 127 0.3% 174 0.3%
Pedestrian error/confusion 1 1.0% 14 <0.1% 30 <0.1% 45 <0.1%
NET Speed 13 12.6% 744 4.6% 2,333 5.4% 3,090 5.2%
Exceeding speed limit 3 2.9% 16 <0.1% 29 <0.1% 48 <0.1%
Driving too fast for conditions 7 6.8% 718 4.5% 2,280 5.2% 3,005 5.0%
Unsafe operating speed (Too fast or too slow) 3 2.9% 17 0.1% 26 <0.1% 46 <0.1%
NET Distracted driving 24 23.3% 2,261 14.1% 7,177 16.5% 9,462 15.8%
Careless Driving 19 18.4% 2,097 13.0% 6,831 15.7% 8,947 15.0%
Distraction/Inattention 7 6.8% 230 1.4% 469 1.1% 706 1.2%
(continued on next page)

Section 9 Contributing Factors
160
(continued from previous page)
Contributing Factor
2015 Collision Severity 2015 Total
Drivers
% of 2015 Total
Drivers Fatal % of Total
Fatal Injury
% of Total Injury
PDO % of Total
PDO
Human Condition - Apparently Normal 18 17.5% 1,608 10.0% 5,968 13.7% 7,594 12.7%
Any Human Condition 14 13.6% 141 0.9% 136 0.3% 291 0.5%
Loss of consciousness/Blackout prior to collision 0 - 31 0.2% 12 <0.1% 43 <0.1%
Extreme fatigue/Fell asleep 0 - 22 0.1% 44 0.1% 66 0.1%
Defective eyesight 0 - 3 <0.1% 2 <0.1% 5 <0.1%
Defective hearing 0 - 0 - 0 - 0 -
Medical disability 0 - 12 <0.1% 8 <0.1% 20 <0.1%
Physical disability 0 - 2 <0.1% 2 <0.1% 4 <0.1%
Mental disability 0 - 3 <0.1% 2 <0.1% 5 <0.1%
Mental confusion/Inability to remember 0 - 20 0.1% 8 <0.1% 28 <0.1%
Sudden illness 1 1.0% 3 <0.1% 4 <0.1% 8 <0.1%
Exceed hours of service (commercial drivers only) 0 - 0 - 0 - 0 -
NET Impaired 13 12.6% 61 0.4% 61 0.1% 135 0.2%
Ability impaired alcohol 11 10.7% 48 0.3% 46 0.1% 105 0.2%
Ability impaired drugs 1 1.0% 5 <0.1% 1 <0.1% 7 <0.1%
Had been drinking/Suspected alcohol use 2 1.9% 15 <0.1% 18 <0.1% 35 <0.1%
No Apparent (Vehicle) Defect 66 64.1% 10,022 62.3% 26,268 60.4% 36,356 60.9%
Any Vehicle Defect 2 1.9% 29 0.2% 268 0.6% 299 0.5%
Defective brakes 0 - 6 <0.1% 16 <0.1% 22 <0.1%
Defective steering 0 - 2 <0.1% 12 <0.1% 14 <0.1%
Defective headlights 0 - 0 - 0 - 0 -
Defective brake lights 0 - 0 - 5 <0.1% 5 <0.1%
Defective lighting (unspecified) 0 - 0 - 0 - 0 -
Defective engine controls/drive train 0 - 2 <0.1% 4 <0.1% 6 <0.1%
Defective suspension/wheels 0 - 4 <0.1% 45 0.1% 49 <0.1%
Defective tires 1 1.0% 5 <0.1% 68 0.2% 74 0.1%
Tow hitch/yoke defective 0 - 0 - 25 <0.1% 25 <0.1%
Defective exhaust system 0 - 0 - 0 - 0 -
Hood/tailgate/door/covering opened 0 - 1 <0.1% 3 <0.1% 4 <0.1%
Defective glazing (obscured windows) 0 - 0 - 3 <0.1% 3 <0.1%
Vehicle modifications 0 - 0 - 2 <0.1% 2 <0.1%
Fire 0 - 1 <0.1% 0 - 1 <0.1%
Overloaded/oversized 0 - 1 <0.1% 3 <0.1% 4 <0.1%
Load shifted/spilled 0 - 2 <0.1% 21 - 1 <0.1%
(continued on next page)

Section 9 Contributing Factors
161
(continued from previous page)
Contributing Factor
2015 Collision Severity 2015 Total
Drivers
% of 2015 Total
Drivers Fatal % of Total
Fatal Injury
% of Total Injury
PDO % of Total
PDO
Jack-knife/trailer swing 0 - 3 <0.1% 60 0.1% 63 0.1%
Hydroplaning tires 1 1.0% 2 <0.1% 9 <0.1% 12 <0.1%
Any Environmental Condition 10 9.7% 571 3.5% 3,419 7.9% 4,000 6.7%
Animal action – Wild 1 1.0% 106 0.7% 1,784 4.1% 1,891 3.2%
Animal action – Domestic 0 - 7 <0.1% 26 <0.1% 33 <0.1%
Slippery road surface 4 3.9% 304 1.9% 1,053 2.4% 1,361 2.3%
Snow drift 0 - 5 <0.1% 40 <0.1% 45 <0.1%
Obstruction/debris on roadway 0 - 16 <0.1% 174 0.4% 190 0.3%
View obstructed/limited 2 1.9% 53 0.3% 100 0.2% 155 0.3%
Glare/reflection 0 - 11 <0.1% 30 <0.1% 41 <0.1%
Construction zone 0 - 3 <0.1% 12 <0.1% 15 <0.1%
Defective driving surface 2 1.9% 7 <0.1% 73 0.2% 82 0.1%
Shoulders defective 0 - 2 <0.1% 7 <0.1% 9 <0.1%
Lane markings inadequate 0 - 1 <0.1% 3 <0.1% 4 <0.1%
Defective/inoperative traffic control device 0 - 7 <0.1% 10 <0.1% 17 <0.1%
Weather 2 1.9% 60 0.4% 142 0.3% 204 0.3%
Pedestrian corridor in use 0 - 5 <0.1% 5 <0.1% 10 <0.1%
Uninvolved vehicle 0 - 9 <0.1% 18 <0.1% 27 <0.1%
Uninvolved pedestrian 0 - 1 <0.1% 2 <0.1% 3 <0.1%
Presence of prior accident 0 - 1 <0.1% 2 <0.1% 3 <0.1%
No Contributing Factor(s) Identified 3 2.9% 420 2.6% 837 1.9% 1,260 2.1%
Not Stated 0 - 11 <0.1% 57 0.1% 68 0.1%
Total 103 100% 16,088 100.0% 43,525 100.0% 59,716 100.0%
*NOTE: For each vehicle and/or driver involved in a collision, up to three contributing factors can be recorded. Because multiple factors can be noted, the counts and percentages under each collision severity will add to more than the total collisions of that severity.

Section 9 Contributing Factors
162
Table 9-3a Drivers Involved in Traffic Collisions by Contributing Factor and Collision Severity for Previous Five Years
Table 9-3a
Drivers Involved in Collisions by Contributing Factors and Collision Severity: 2010-2014 Average
Contributing Factor
2010-2014 Average Count of Drivers
Fatal Injury PDO Total
Drivers % of Total
Drivers
Driver Action - Driving Properly and Human Condition - Apparently Normal
33 6,144 16,143 22,320 40.3%
Driver Action - Driving properly 4 317 1,015 1,335 2.4%
Any Driver Action 57 4,318 14,363 18,738 33.8%
Following too closely 1 1,466 3,031 4,498 8.1%
Turning improperly 2 377 1,101 1,480 2.7%
Passing improperly 2 27 115 144 0.3%
Changing lanes improperly <1 175 1,036 1,212 2.2%
Fail to yield right-of-way 6 475 1,140 1,621 2.9%
Disobey traffic control device/officer 3 163 283 450 0.8%
Drive wrong way on roadway 2 7 17 25 <0.1%
Passing a vehicle at pedestrian X-walk <1 <1 <1 1 <0.1%
Back unsafely - 139 1,932 2,071 3.7%
Parking improperly <1 6 86 92 0.2%
Lost control/Drive off road 15 271 842 1,127 2.0%
Driverless vehicle ran out of control - 2 12 14 <0.1%
Leave stop sign before safe to do so 2 193 407 603 1.1%
Failed to signal - 4 10 14 <0.1%
Take avoiding action 2 67 333 401 0.7%
Driver inexperience 2 49 141 192 0.3%
Pedestrian error/confusion 2 11 10 23 <0.1%
NET Speed 18 440 1,561 2,019 3.6%
Exceeding speed limit 6 14 24 43 <0.1%
Driving too fast for conditions 9 399 1,489 1,896 3.4%
Unsafe operating speed (Too fast or too slow) 4 31 54 89 0.2%
NET Distracted driving 23 996 3,744 4,763 70.4%
Careless Driving 15 841 3,322 4,178 61.7%
Distraction/Inattention 9 180 473 662 9.8%
Human Condition - Apparently Normal 15 1,218 3,978 5,211 9.4%
Any Human Condition 29 273 588 890 1.6%
Loss of consciousness/Blackout prior to collision 2 23 14 39 <0.1%
Extreme fatigue/Fell asleep 1 29 44 74 0.1%
Defective eyesight <1 2 4 6 <0.1%
Defective hearing - <1 1 1 <0.1%
Medical disability <1 5 6 11 <0.1%
Physical disability - 2 4 6 <0.1%
Mental disability <1 2 1 4 <0.1%
Mental confusion/Inability to remember <1 7 11 18 <0.1%
Sudden illness <1 4 4 8 <0.1%
Exceed hours of service (commercial drivers only) - - <1 <1 <0.1%
NET Impaired 19 64 99 181 0.3%
Ability impaired alcohol 13 41 66 121 0.2%
Ability impaired drugs <1 2 4 6 <0.1%
Had been drinking/Suspected alcohol use 6 23 33 62 0.1%
No Apparent (Vehicle) Defect 56 7,091 18,432 25,579 46.1%
Any Vehicle Defect 2 35 176 213 0.4%
Defective brakes <1 9 22 31 <0.1%
Defective steering - 2 7 9 <0.1%
Defective headlights <1 <1 1 2 <0.1%
(continued on next page)
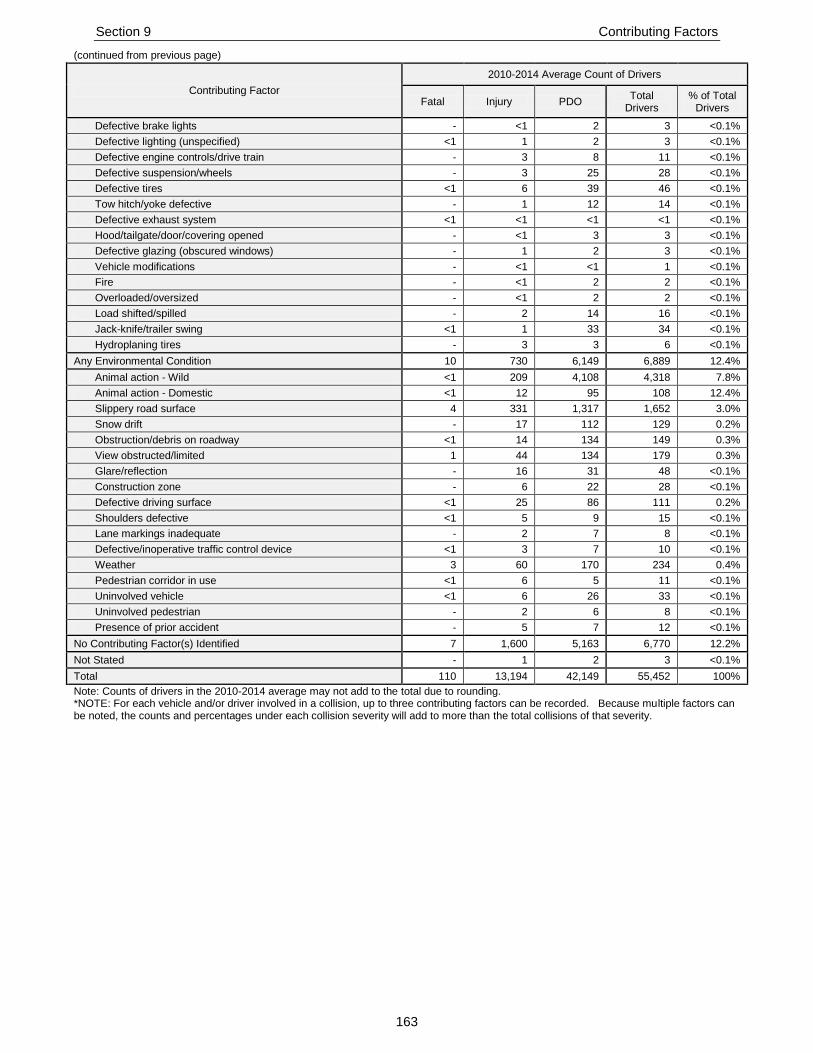
Section 9 Contributing Factors
163
(continued from previous page)
Contributing Factor
2010-2014 Average Count of Drivers
Fatal Injury PDO Total
Drivers % of Total
Drivers
Defective brake lights - <1 2 3 <0.1%
Defective lighting (unspecified) <1 1 2 3 <0.1%
Defective engine controls/drive train - 3 8 11 <0.1%
Defective suspension/wheels - 3 25 28 <0.1%
Defective tires <1 6 39 46 <0.1%
Tow hitch/yoke defective - 1 12 14 <0.1%
Defective exhaust system <1 <1 <1 <1 <0.1%
Hood/tailgate/door/covering opened - <1 3 3 <0.1%
Defective glazing (obscured windows) - 1 2 3 <0.1%
Vehicle modifications - <1 <1 1 <0.1%
Fire - <1 2 2 <0.1%
Overloaded/oversized - <1 2 2 <0.1%
Load shifted/spilled - 2 14 16 <0.1%
Jack-knife/trailer swing <1 1 33 34 <0.1%
Hydroplaning tires - 3 3 6 <0.1%
Any Environmental Condition 10 730 6,149 6,889 12.4%
Animal action - Wild <1 209 4,108 4,318 7.8%
Animal action - Domestic <1 12 95 108 12.4%
Slippery road surface 4 331 1,317 1,652 3.0%
Snow drift - 17 112 129 0.2%
Obstruction/debris on roadway <1 14 134 149 0.3%
View obstructed/limited 1 44 134 179 0.3%
Glare/reflection - 16 31 48 <0.1%
Construction zone - 6 22 28 <0.1%
Defective driving surface <1 25 86 111 0.2%
Shoulders defective <1 5 9 15 <0.1%
Lane markings inadequate - 2 7 8 <0.1%
Defective/inoperative traffic control device <1 3 7 10 <0.1%
Weather 3 60 170 234 0.4%
Pedestrian corridor in use <1 6 5 11 <0.1%
Uninvolved vehicle <1 6 26 33 <0.1%
Uninvolved pedestrian - 2 6 8 <0.1%
Presence of prior accident - 5 7 12 <0.1%
No Contributing Factor(s) Identified 7 1,600 5,163 6,770 12.2%
Not Stated - 1 2 3 <0.1%
Total 110 13,194 42,149 55,452 100%
Note: Counts of drivers in the 2010-2014 average may not add to the total due to rounding. *NOTE: For each vehicle and/or driver involved in a collision, up to three contributing factors can be recorded. Because multiple factors can be noted, the counts and percentages under each collision severity will add to more than the total collisions of that severity.

Section 9 Contributing Factors
164
Table 9-3 and Table 9-3a examine the contributing factors recorded for each driver involved in a collision. In 2015, half of the drivers involved in traffic collisions (49%) are recorded as not being at-fault in the collision. Almost all of these drivers (48% overall) are noted in the traffic accident report (TAR) as both “driving properly” and being “apparently normal” at the time of a collision. Two percent of drivers have no contributing factors recorded for the collision.
44% of the drivers involved in a fatal collision are noted as not being at-fault.
54% of the drivers in an injury collision are noted as not being at-fault.
48% of the drivers in a PDO collision are noted as not being at-fault. Driver actions are recorded for 44% of the drivers involved in traffic collisions in 2015. This is an increase from the previous five year (2010 to 2014) annual average, where driver actions are recorded for 34% of the drivers involved. In 2015:
Nearly 52% of the drivers involved in fatal collisions have a driver action recorded, including: o 23% who are driving while distracted (including “careless driving” and “distraction/
inattention”); o 13% who are speeding (including “exceeding speed limit”, “driving too fast for conditions”
and “unsafe operating speed”); o 9% who “lost control/ drive off road”; o 7% who “fail to yield right-of-way”; o 5% who “disobey traffic control”; o 4% (each) who “leave stop sign before safe to do so” or are “turning improperly”, and, o 3% (each) who are “passing improperly” or are inexperienced drivers;
Nearly 42% of the drivers involved in injury collisions have a driver action recorded, including: o 16% who are “following too closely”; o 14% who are driving while distracted; and, o 5% (each) who “fail to yield right-of-way”, are “turning improperly”, or are speeding;
45% of the drivers involved in PDO collisions have a driver action recorded, including: o Nearly 17% who are driving while distracted; o 10% who are “following too closely”; o 7% who are “back unsafely”; o 5% who are speeding; o 4% (each) who are “turning improperly” or “changing lanes improperly”; and, o 3% (each) who “fail to yield right-of-way” or “lost control/drive off road”.
Human conditions are recorded for nearly 1% of the drivers involved in traffic collisions in 2015, a decrease from the previous five year (2010 to 2014) annual average (2%). In 2015:
14% of the drivers involved in fatal collisions have a human condition recorded, including 13% who are impaired (including “ability impaired by alcohol”, “ability impaired by drugs” and “had been drinking/suspected alcohol use”); and,
1% of the drivers involved in injury collisions have a human condition recorded, including 0.4% who are impaired.
Some vehicle defect is recorded for 0.5% of drivers involved in traffic collisions in 2015 (0.4% in the previous five years, 2010 to 2014, annual average), including 2 drivers in a fatal collision. Environmental conditions are recorded as contributing factors for 7% of drivers involved in traffic collisions (10% of fatal, nearly 4% of injury, and 8% of PDO) in 2015; compared to 12% in the previous five year (2010 to 2014) annual average. In 2015:
3% of drivers have “animal action – wild” recorded as a contributing factor (one fatal; 1% of injury; 4% of PDO); and,
2% of drivers have “slippery road surface” recorded as a contributing factor (4% of fatal; 2% of injury; 2% PDO).
NOTE: For a detailed count of contributing factors recorded for drivers involved in collisions occurring in each year from 2010 to 2015, please refer to “Table 9-8 Historical Summary of Contributing Factors for Drivers Involved in Collisions” at the end of this section.

Section 9 Contributing Factors
165
Figure 9-1 Select Contributing Factors for Drivers Involved in Collisions by Collision Severity
While many contributing factors are recorded for the drivers involved in traffic collisions, generally there are only a few that account for a large proportion of traffic collisions in Manitoba. In 2015, driver actions and human conditions are most often recorded for fatal traffic collisions, with the most frequent of these being distracted driving, speeding, impaired driving, losing control of the vehicle, and failure to yield right-of-way. Driver actions and environmental conditions (including distracted driving, following too closely, speeding, and the actions of wild animals) are the most often recorded contributing factors for PDO collisions.
0%
10%
20%
30%
40%
50%
60% A
ny
Dri
ver
Act
ion
Dis
trac
ted
dri
vin
g (N
ET)
Spee
d (
NET
)
Lost
co
ntr
ol/
dro
ve
off
ro
ad
Follo
win
g to
o c
lose
ly
Fail
to y
ield
rig
ht-
of-
way
An
y H
um
an C
on
dit
ion
Imp
aire
d (
NET
)
An
y En
viro
. Co
nd
itio
n
An
imal
act
ion
- W
ild
Slip
per
y ro
ad s
urf
ace
Pro
po
rtio
n o
f D
rive
rs
Select Contributing Factors for Drivers Invovled in Collisions by Collision Severity: 2015
Fatal Injury PDO Total Collisions

Section 9 Contributing Factors
166
Table 9-4 Involvement Rate (per 10,000 Licensed Drivers) in Collisions by Contributing Factors and Collisions Severity
Table 9-4
Driver Involvement Rate (per 10,000 Licensed Drivers) in Collisions by Contributing Factors and Collision Severity: 2015, 2010-2014 Average
Contributing Factor
2015 Collision Severity 2015 Total
2010-2014 Average
Fatal Injury PDO Fatal Injury PDO Total
Any Driver Action 0.6 75.8 220.3 296.7 0.7 51.8 172.3 224.8
Following too closely <0.1 28.8 50.6 79.4 <0.1 17.6 36.4 54.0
Turning improperly <0.1 8.7 20.5 29.2 <0.1 4.5 13.2 17.8
Passing improperly <0.1 0.3 1.4 1.7 <0.1 0.3 1.4 1.7
Changing lanes improperly - 3.8 18.3 22.2 <0.1 2.1 12.4 14.5
Fail to yield right-of-way <0.1 8.9 16.9 25.8 <0.1 5.7 13.7 19.4
Disobey traffic control device/officer <0.1 2.8 2.8 5.7 <0.1 2.0 3.4 5.4
Drive wrong way on roadway <0.1 0.1 0.2 0.3 <0.1 <0.1 0.2 0.3
Passing a vehicle at pedestrian X-walk - - - - <0.1 <0.1 <0.1 <0.1
Back unsafely - 2.5 32.5 35.0 - 1.7 23.2 24.8
Parking improperly <0.1 0.1 1.5 1.7 <0.1 <0.1 1.0 1.1
Lost control/Drive off road 0.1 4.3 13.6 18.0 0.2 3.2 10.1 13.5
Driverless vehicle ran out of control <0.1 <0.1 0.3 0.4 - <0.1 0.1 0.2
Leave stop sign before safe to do so <0.1 3.5 6.1 9.6 <0.1 2.3 4.9 7.2
Failed to signal - 0.1 0.1 0.2 - <0.1 0.1 0.2
Take avoiding action - 0.9 4.7 5.5 <0.1 0.8 4.0 4.8
Driver inexperience <0.1 0.5 1.4 2.0 <0.1 0.6 1.7 2.3
Pedestrian error/confusion <0.1 0.2 0.3 0.5 <0.1 0.1 0.1 0.3
NET Speed 0.1 8.4 26.5 35.1 0.2 5.3 18.7 24.2
Exceeding speed limit <0.1 0.2 0.3 0.5 <0.1 0.2 0.3 0.5
Driving too fast for conditions <0.1 8.1 25.9 34.1 0.1 4.8 17.9 22.8
Unsafe operating speed (Too fast or too slow) <0.1 0.2 0.3 0.5 <0.1 0.4 0.6 1.1
NET Distracted driving 0.3 25.7 81.4 107.4 0.3 11.9 44.9 57.1
Careless Driving 0.2 23.8 77.5 101.5 0.2 10.1 39.9 50.1
Distraction/Inattention <0.1 2.6 5.3 8.0 0.1 2.2 5.7 7.9
(continued on next page)

Section 9 Contributing Factors
167
(continued from previous page)
Contributing Factor 2015 Collision Severity
2015 Total 2010-2014 Average
Fatal Injury PDO Fatal Injury PDO Total
Any Human Condition 0.2 1.6 1.5 3.3 0.4 3.3 7.1 10.7
Loss of consciousness/Blackout prior to collision - 0.4 0.1 0.5 <0.1 0.3 0.2 0.5
Extreme fatigue/Fell asleep - 0.2 0.5 0.7 <0.1 0.3 0.5 0.9
Defective eyesight - <0.1 <0.1 <0.1 <0.1 <0.1 <0.1 <0.1
Defective hearing - - - - - <0.1 <0.1 <0.1
Medical disability - 0.1 <0.1 0.2 <0.1 <0.1 <0.1 0.1
Physical disability - <0.1 <0.1 <0.1 - <0.1 <0.1 <0.1
Mental disability - <0.1 <0.1 <0.1 <0.1 <0.1 <0.1 <0.1
Mental confusion/Inability to remember - 0.2 <0.1 0.3 <0.1 <0.1 0.1 0.2
Sudden illness <0.1 <0.1 <0.1 <0.1 <0.1 <0.1 <0.1 <0.1
Exceed hours of service (commercial drivers only) - - - - - - <0.1 <0.1
NET Impaired 0.1 0.7 0.7 1.5 0.2 0.8 1.2 2.2
Ability impaired alcohol 0.1 0.5 0.5 1.2 0.2 0.5 0.8 1.5
Ability impaired drugs <0.1 <0.1 <0.1 <0.1 <0.1 <0.1 <0.1 <0.1
Had been drinking/Suspected alcohol use <0.1 0.2 0.2 0.4 <0.1 0.3 0.4 0.7
Any Vehicle Defect <0.1 0.3 3.0 3.4 <0.1 0.4 2.1 2.6
Defective brakes - <0.1 0.2 0.2 <0.1 0.1 0.3 0.4
Defective steering - <0.1 0.1 0.2 - <0.1 <0.1 0.1
Defective headlights - - - - <0.1 <0.1 <0.1 <0.1
Defective brake lights - - <0.1 <0.1 - <0.1 <0.1 <0.1
Defective lighting (unspecified) - - - - <0.1 <0.1 <0.1 <0.1
Defective engine controls/drive train - <0.1 <0.1 <0.1 - <0.1 <0.1 0.1
Defective suspension/wheels - <0.1 0.5 0.6 - <0.1 0.3 0.3
Defective tires <0.1 <0.1 0.8 0.8 <0.1 <0.1 0.5 0.5
Tow hitch/yoke defective - - 0.3 0.3 - <0.1 0.1 0.2
Defective exhaust system - - - - <0.1 <0.1 <0.1 <0.1
Hood/tailgate/door/covering opened - <0.1 <0.1 <0.1 - <0.1 <0.1 <0.1
Defective glazing (obscured windows) - - <0.1 <0.1 - <0.1 <0.1 <0.1
Vehicle modifications - - <0.1 <0.1 - <0.1 <0.1 <0.1
Fire - <0.1 - <0.1 - <0.1 <0.1 <0.1
Overloaded/oversized - <0.1 <0.1 <0.1 - <0.1 <0.1 <0.1
(continued on next page)

Section 9 Contributing Factors
168
(continued from previous page)
Contributing Factor 2015 Collision Severity
2015 Total 2010-2014 Average
Fatal Injury PDO Fatal Injury PDO Total
Load shifted/spilled - <0.1 0.2 <0.1 - <0.1 0.2 0.2
Jack-knife/trailer swing - <0.1 0.7 0.7 <0.1 <0.1 0.4 0.4
Hydroplaning tires <0.1 <0.1 0.1 0.1 - <0.1 <0.1 <0.1
Any Environmental Condition 0.1 6.5 38.8 45.4 0.1 8.8 73.8 82.7
Animal action – Wild <0.1 1.2 20.2 21.5 <0.1 2.5 49.3 51.8
Animal action - Domestic - <0.1 0.3 0.4 <0.1 0.1 1.1 1.3
Slippery road surface <0.1 3.4 11.9 15.4 <0.1 4.0 15.8 19.8
Snow drift - <0.1 0.5 0.5 - 0.2 1.3 1.5
Obstruction/debris on roadway - 0.2 2.0 2.2 <0.1 0.2 1.6 1.8
View obstructed/limited <0.1 0.6 1.1 1.8 <0.1 0.5 1.6 2.1
Glare/reflection - 0.1 0.3 0.5 - 0.2 0.4 0.6
Construction zone - <0.1 0.1 0.2 - <0.1 0.3 0.3
Defective driving surface <0.1 <0.1 0.8 0.9 <0.1 0.3 1.0 1.3
Shoulders defective - <0.1 <0.1 0.1 <0.1 <0.1 0.1 0.2
Lane markings inadequate - <0.1 <0.1 <0.1 - <0.1 <0.1 <0.1
Defective/inoperative traffic control device - <0.1 0.1 0.2 <0.1 <0.1 <0.1 0.1
Weather <0.1 0.7 1.6 2.3 <0.1 0.7 2.0 2.8
Pedestrian corridor in use - <0.1 <0.1 0.1 <0.1 <0.1 <0.1 0.1
Uninvolved vehicle - 0.1 0.2 0.3 <0.1 <0.1 0.3 0.4
Uninvolved pedestrian - <0.1 <0.1 <0.1 - <0.1 <0.1 <0.1
Presence of prior accident - <0.1 <0.1 <0.1 - <0.1 <0.1 0.1

Section 9 Contributing Factors
169
Recognizing that counts of drivers involved in collisions could be impacted either positively or negatively by changing population statistics, relative involvement rates per 10,000 licensed drivers is examined to provide a standardized collision rate comparison. This eliminates the effect of changing population size and focuses on the rate at which drivers are involved in collisions instead of simply a raw count of the number of drivers involved overall. Driver involvement rates (per 10,000 licensed drivers) in collisions where an at-fault contributing factor has been recorded generally increased in 2015 compared to the previous five years (2010 to 2014) annual average. The observed change in involvement rates compared to the previous five-year average is at least partially attributable to the change in reporting structure that took effect in October 2011. This change, discussed in detail in the 2012 Traffic Collision Statistics Report, resulted in a significant increase in the number of drivers involved in PDO collisions and less severe injury collisions being reported in the Traffic Accident Report Database than in previous years. In 2015, the driver involvement rate (per 10,000 licensed drivers) in traffic collisions where:
Any driver action is a contributing factor is 296.7, increased by 32% from the previous five years (224.8);
Any human condition is a contributing factor is 3.3, decreased by 69% from the previous five years (10.7);
Environmental conditions are a contributing factor is 45.4, decreased by 45% from the previous five years (82.7);
Distracted driving is a contributing factor is 107.4, increased by 88% from the previous five years (57.1);
“Following too closely” is a contributing factor is 79.4, increased by 47% from the previous five years (54.0);
Speed is a contributing factor is 35.1, increased by 45% from the previous five years (24.2);
“Backing unsafely” is a contributing factor is 35.0, increased by 41% from the previous five years (24.8);
“Turning improperly” is a contributing factor is 29.2, increased by 65% from the previous five years (17.8);
“Fail to yield right-of-way” is a contributing factor is 25.8, increased by 33% from the previous five years (19.4);
“Changing lanes improperly” is a contributing factor is 22.2, increased 52% from the previous five years (14.5);
“Animal action - wild” is a contributing factor is 21.5, decreased by 59% from the previous five years (51.8);
“Lost control/Drove off road” is a contributing factor is 18.0, increased by 33% from the previous five years (13.5);
“Slippery road surface” is a contributing factor is 15.4, decreased by 22% from the previous five years (19.8);
“Leave stop sign before safe to do so” is a contributing factor is 9.6, increased by 33% from the previous five years (7.2); and,
Impaired is a contributing factor is 1.5, decreased by nearly 30% from the previous five years (2.2).
In 2015, the driver involvement rate (per 10,000 licensed drivers) in fatal traffic collisions where:
A driver action is a contributing factor is 0.6, down from 0.7 in the previous five years;
Distracted driving is a contributing factor is 0.3, relatively the same as the previous five years (0.3);
A human condition is a contributing factor is 0.2, down from 0.4 in the previous five years;
Speed is a contributing factor is 0.1, down from 0.2 in the previous five years;
Impaired is a contributing factor is 0.1, down from 0.2 in the previous five years.
An environmental condition is a contributing factor is 0.1, relatively the same as the previous five years; and,
“Lost control/Drove off road” is a contributing factor is 0.1, down from 0.2 in the previous five years.

Section 9 Contributing Factors
170
Table 9-5 Driver Involvement Rate (per 10,000 Licensed Drivers) in Collisions by Contributing Factors and Age
Table 9-5
Driver Involvement Rate (per 10,000 Licensed Drivers) in All Collisions by Contributing Factors and Age Group: 2015
Contributing Factor
Age Group
16-19 20-24 25-34 35-44 45-54 55-64 65+
Any Driver Action 578.4 508.9 356.8 292.0 248.0 208.6 185.2
Following too closely 171.9 157.5 104.8 80.5 65.3 47.1 32.6
Turning improperly 55.0 49.1 34.9 27.5 24.6 19.3 22.0
Passing improperly 3.8 2.0 2.2 1.5 1.5 1.1 1.5
Changing lanes improperly 35.5 39.4 25.6 19.2 18.4 17.1 17.5
Fail to yield right-of-way 48.5 40.2 28.2 24.7 21.4 20.4 20.3
Disobey traffic control device/officer 11.5 10.0 6.5 4.8 5.1 3.8 4.1
Drive wrong way on roadway 0.6 0.5 0.4 0.4 0.1 0.2 0.2
Passing a vehicle at pedestrian X-walk - - - - - - -
Back unsafely 38.0 35.7 33.1 36.0 35.8 38.0 30.8
Parking improperly 1.5 1.5 2.2 1.7 1.7 1.1 1.8
Lost control/Drive off road 55.4 38.6 24.3 17.2 11.0 9.6 6.1
Driverless vehicle ran out of control 0.8 0.4 0.6 <0.1 0.4 0.2 0.6
Leave stop sign before safe to do so 17.2 14.0 9.4 8.4 8.4 7.9 9.5
Failed to signal 0.4 0.5 0.5 0.3 <0.1 <0.1 0.1
Take avoiding action 10.9 10.2 7.8 6.1 4.3 3.1 2.4
Driver inexperience 13.0 5.3 1.8 0.8 0.9 0.8 0.4
Pedestrian error/confusion 1.5 0.3 0.3 1.0 0.5 0.3 0.3
NET Speed 88.0 71.2 46.8 36.7 27.0 18.1 12.7
Exceeding speed limit 1.3 1.1 0.8 0.5 0.3 0.4 0.3
Driving too fast for conditions 85.0 69.6 45.3 35.7 26.6 17.6 12.3
Unsafe operating speed (Too fast or too slow) 2.5 1.1 0.8 0.5 0.1 0.1 0.2
NET Distracted driving 208.9 185.9 128.5 105.8 88.1 72.2 71.2
Careless Driving 195.9 175.6 121.0 100.8 83.3 68.7 67.4
Distraction/Inattention 17.8 14.2 10.0 6.8 6.1 5.7 5.2
Any Human Condition 8.0 7.4 4.4 2.2 2.0 1.8 2.5
Loss of consciousness/Blackout prior to collision 1.0 0.9 0.3 0.3 0.3 0.4 0.7
Extreme fatigue/Fell asleep 2.5 3.0 0.9 0.3 0.3 0.3 0.3
Defective eyesight - - - - - <0.1 0.3
Defective hearing - - - - - - -
Medical disability - 0.3 0.1 0.1 0.1 0.3 0.4
Physical disability - - <0.1 - - <0.1 0.1
Mental disability 0.2 - 0.2 - - - <0.1
Mental confusion/Inability to remember 0.2 0.5 0.2 0.1 0.1 0.3 0.8
Sudden illness 0.2 0.1 - - <0.1 0.2 0.1
Exceed hours of service (commercial drivers only) - - - - - - -
NET Impaired 4.0 3.2 2.8 1.4 1.1 0.5 0.3
Ability impaired alcohol 3.6 2.3 2.0 1.1 1.0 0.4 0.2
Ability impaired drugs 0.2 0.1 <0.1 0.1 0.1 - -
Had been drinking/Suspected alcohol use 0.4 1.1 1.0 0.3 0.2 0.1 <0.1
Any Vehicle Defect 3.8 5.1 3.7 2.5 4.1 3.3 2.2
Defective brakes 0.6 0.3 0.1 0.2 0.4 <0.1 0.2
Defective steering 0.2 0.3 0.2 - 0.5 - -
Defective headlights - - - - - - -
Defective brake lights 0.2 0.3 - - 0.1 - -
Defective lighting (unspecified) - - - - - - -
Defective engine controls/drive train - 0.5 - <0.1 <0.1 - -
Defective suspension/wheels 0.4 0.5 0.9 0.1 0.7 0.5 0.5
Defective tires 1.5 1.5 1.0 0.9 0.8 0.8 0.3
Tow hitch/yoke defective 0.2 - 0.3 0.3 0.4 0.4 0.2
Defective exhaust system - - - - - - -
(continued on next page)

Section 9 Contributing Factors
171
(continued from previous page)
Contributing Factor Age Group
16-19 20-24 25-34 35-44 45-54 55-64 65+
Hood/tailgate/door/covering opened - - - - 0.2 - <0.1
Defective glazing (obscured windows) - - 0.1 - - - <0.1
Vehicle modifications - - <0.1 - - <0.1 -
Fire - - - <0.1 - - -
Overloaded/oversized - - <0.1 <0.1 - - 0.1
Load shifted/spilled 0.2 0.3 0.3 0.3 0.4 0.3 -
Jack-knife/trailer swing 0.2 1.2 0.7 0.3 0.6 1.0 0.9
Hydroplaning tires 0.2 0.4 0.1 0.3 <0.1 <0.1 -
Any Environmental Condition 74.1 76.5 55.5 51.3 44.2 31.0 20.9
Animal action - Wild 25.8 32.6 24.1 24.9 24.5 17.2 9.9
Animal action - Domestic 0.4 0.8 0.6 0.5 0.3 <0.1 0.3
Slippery road surface 35.7 29.4 21.2 16.9 12.0 8.4 5.5
Snow drift 0.6 0.8 0.9 0.4 0.8 0.1 0.1
Obstruction/debris on roadway 3.4 3.4 2.2 2.3 1.9 1.6 1.8
View obstructed/limited 1.9 3.0 2.2 2.1 1.3 0.9 1.7
Glare/reflection 0.8 0.7 0.4 0.5 0.2 0.6 0.4
Construction zone 0.4 0.3 0.1 0.3 0.2 <0.1 <0.1
Defective driving surface 1.9 2.0 1.1 0.9 1.0 0.6 0.1
Shoulders defective 0.2 - 0.1 0.1 <0.1 0.1 <0.1
Lane markings inadequate 0.2 - 0.1 - - - <0.1
Defective/inoperative traffic control device 0.2 0.3 0.3 <0.1 0.3 0.2 0.1
Weather 2.9 4.3 3.1 2.5 2.0 1.5 1.3
Pedestrian corridor in use - - 0.2 0.1 <0.1 0.2 <0.1
Uninvolved vehicle 0.8 0.5 0.4 0.5 0.2 0.1 <0.1
Uninvolved pedestrian - - - 0.1 - <0.1 -
Presence of prior accident - - - <0.1 <0.1 - <0.1

Section 9 Contributing Factors
172
Table 9-5a Driver Involvement Rate (per 10,000 Licensed Drivers) in Collisions by Contributing Factors and Age for Previous Five Years
Table 9-5a
Driver Involvement Rate (per 10,000 Licensed Drivers) in All Collisions by Contributing Factors and Age Group: 2010-2014 Average
Contributing Factor
Age Group
16-19 20-24 25-34 35-44 45-54 55-64 65+
Any Driver Action 424.8 386.2 269.3 216.7 176.5 149.3 136.8
Following too closely 105.2 105.2 71.7 53.1 40.8 31.0 22.4
Turning improperly 29.9 27.9 20.8 15.2 13.5 12.7 13.9
Passing improperly 3.0 2.7 1.9 1.4 1.3 1.2 1.1
Changing lanes improperly 22.8 22.4 16.0 12.8 11.0 11.1 12.0
Fail to yield right-of-way 34.7 28.2 21.1 17.9 15.2 13.7 15.9
Disobey traffic control device/officer 9.0 8.2 5.6 4.5 3.5 3.8 4.1
Drive wrong way on roadway 0.6 0.4 0.3 0.3 0.2 0.2 0.2
Passing a vehicle at pedestrian X-walk - <0.1 <0.1 - <0.1 <0.1 <0.1
Back unsafely 30.2 25.0 24.1 26.8 25.6 23.1 20.3
Parking improperly 1.2 1.3 1.3 1.0 1.0 0.9 1.1
Lost control/Drive off road 39.3 30.4 17.4 12.5 9.6 6.5 4.7
Driverless vehicle ran out of control 0.3 0.3 0.2 0.2 0.2 0.2 <0.1
Leave stop sign before safe to do so 13.5 10.1 7.1 6.7 5.5 5.4 7.0
Failed to signal 0.2 0.3 0.2 0.2 0.1 <0.1 0.1
Take avoiding action 9.8 10.8 6.4 5.1 3.6 2.6 1.5
Driver inexperience 18.8 4.7 1.9 2.7 0.7 0.4 0.3
Pedestrian error/confusion 0.2 0.3 0.4 0.3 0.2 0.3 0.2
NET Speed 59.8 49.7 33.0 25.2 16.5 11.9 8.8
Exceeding speed limit 2.3 1.4 0.6 0.6 0.2 <0.1 <0.1
Driving too fast for conditions 54.2 46.5 31.2 23.6 15.6 11.5 8.4
Unsafe operating speed (Too fast or too slow) 3.8 2.1 1.3 1.1 0.7 0.4 0.3
NET Distracted driving 106.1 102.0 70.0 54.0 44.9 38.5 36.9
Careless Driving 89.3 90.2 62.0 47.7 39.9 34.1 32.3
Distraction/Inattention 18.9 13.7 9.0 7.1 5.5 5.1 5.2
Any Human Condition 25.3 20.0 12.5 9.2 7.1 6.1 6.7
Loss of consciousness/Blackout prior to collision 0.5 0.7 0.4 0.4 0.3 0.4 0.6
Extreme fatigue/Fell asleep 3.2 2.1 1.4 0.6 0.5 0.4 0.2
Defective eyesight <0.1 - <0.1 <0.1 <0.1 <0.1 0.1
Defective hearing - - - - <0.1 - <0.1
Medical disability <0.1 <0.1 0.1 <0.1 <0.1 0.2 0.3
Physical disability <0.1 - <0.1 <0.1 <0.1 <0.1 0.1
Mental disability 0.1 <0.1 <0.1 <0.1 <0.1 <0.1 <0.1
Mental confusion/Inability to remember 0.2 0.1 0.1 <0.1 <0.1 0.1 0.8
Sudden illness - <0.1 <0.1 <0.1 0.1 <0.1 0.2
Exceed hours of service (commercial drivers only) - - - - <0.1 - -
NET Impaired 5.0 5.6 3.1 1.9 1.4 0.7 0.3
Ability impaired alcohol 3.1 3.5 2.0 1.4 1.1 0.5 0.1
Ability impaired drugs 0.2 0.2 <0.1 <0.1 <0.1 <0.1 -
Had been drinking/Suspected alcohol use 2.1 2.2 1.1 0.5 0.4 0.2 0.1
Any Vehicle Defect 4.8 4.2 2.6 2.4 2.4 2.1 1.2
Defective brakes 1.1 0.6 0.4 0.5 0.2 0.2 0.1
Defective steering 0.3 0.3 0.1 <0.1 <0.1 <0.1 <0.1
Defective headlights 0.1 <0.1 <0.1 <0.1 <0.1 - -
Defective brake lights 0.2 <0.1 <0.1 <0.1 <0.1 <0.1 <0.1
Defective lighting (unspecified) <0.1 <0.1 <0.1 <0.1 <0.1 <0.1 <0.1
Defective engine controls/drive train 0.3 0.2 0.1 <0.1 <0.1 0.2 <0.1
Defective suspension/wheels 0.8 0.5 0.3 0.2 0.4 0.3 0.1
Defective tires 1.3 1.2 0.6 0.5 0.5 0.3 0.2
Tow hitch/yoke defective <0.1 0.2 0.2 0.2 0.1 0.1 0.1
Defective exhaust system - <0.1 <0.1 - - - -
(continued on next page)

Section 9 Contributing Factors
173
(continued from previous page)
Contributing Factor Age Group
16-19 20-24 25-34 35-44 45-54 55-64 65+
Hood/tailgate/door/covering opened - <0.1 <0.1 <0.1 <0.1 <0.1 <0.1
Defective glazing (obscured windows) 0.2 <0.1 <0.1 <0.1 <0.1 <0.1 -
Vehicle modifications - <0.1 <0.1 - <0.1 <0.1 -
Fire - <0.1 <0.1 - <0.1 <0.1 <0.1
Overloaded/oversized - - <0.1 <0.1 - <0.1 <0.1
Load shifted/spilled - 0.2 0.2 0.2 0.3 0.2 0.1
Jack-knife/trailer swing 0.3 0.5 0.4 0.6 0.4 0.4 0.3
Hydroplaning tires 0.1 0.2 0.1 <0.1 <0.1 <0.1 <0.1
Any Environmental Condition 121.4 125.0 97.6 85.0 83.3 65.5 39.7
Animal action - Wild 57.4 69.7 58.8 53.8 57.9 46.0 25.4
Animal action - Domestic 2.5 2.0 1.5 1.2 1.3 0.9 0.7
Slippery road surface 42.7 37.5 25.2 20.8 15.9 11.6 8.1
Snow drift 3.1 3.0 1.9 1.7 1.1 1.3 0.5
Obstruction/debris on roadway 2.3 2.6 2.2 1.8 1.6 1.5 1.1
View obstructed/limited 3.9 3.1 2.8 2.2 1.7 1.5 1.3
Glare/reflection 1.2 0.7 0.7 0.4 0.5 0.4 0.6
Construction zone 0.5 0.4 0.4 0.3 0.3 0.3 0.2
Defective driving surface 4.1 2.7 1.5 1.2 1.2 0.9 0.5
Shoulders defective 0.5 0.3 0.2 0.2 0.1 <0.1 0.1
Lane markings inadequate 0.2 0.3 <0.1 <0.1 <0.1 0.1 <0.1
Defective/inoperative traffic control device 0.3 <0.1 0.1 <0.1 0.1 <0.1 0.2
Weather 5.1 4.8 3.8 2.7 2.4 1.8 1.2
Pedestrian corridor in use <0.1 0.2 0.2 0.1 0.2 <0.1 <0.1
Uninvolved vehicle 0.8 0.7 0.4 0.3 0.3 0.3 0.3
Uninvolved pedestrian 0.1 0.2 0.1 <0.1 <0.1 <0.1 <0.1
Presence of prior accident 0.2 0.4 0.2 <0.1 0.1 0.1 <0.1
Younger drivers, especially those under the age of 25, tend to have higher driver involvement rates in traffic collisions overall and in collisions where specific contributing factors are noted. In 2015, the involvement rate in collisions for drivers aged 16 to 19 with:
Any at-fault contributing factor is: o 1.1 times that of drivers aged 20 to 24; o 1.6 times that of drivers aged 25 to 34; o 1.9 times that of drivers aged 35 to 44; and, o 2.6 times that of drivers aged 45 and older.
A driver action as a contributing factor is: o 1.1 times that of drivers aged 20 to 24; o 1.6 times that of drivers aged 25 to 34; o 2 times that of drivers aged 35 to 44; and, o 2.7 times that of drivers aged 45 and older.
A human condition as a contributing factor is: o 1.1 times that of drivers aged 20 to 24; o 1.8 times that of drivers aged 25 to 34; o 3.6 times that of drivers aged 35 to 44; and, o 3.8 times that of drivers aged 45 and older.
“Driver inexperience” as a contributing factor is: o 2.5 times that of drivers aged 20 to 24; o 7.4 times that of drivers aged 25 to 34; o 15.8 times that of drivers aged 35 to 44; and, o 18.1 times that of drivers aged 45 and older.
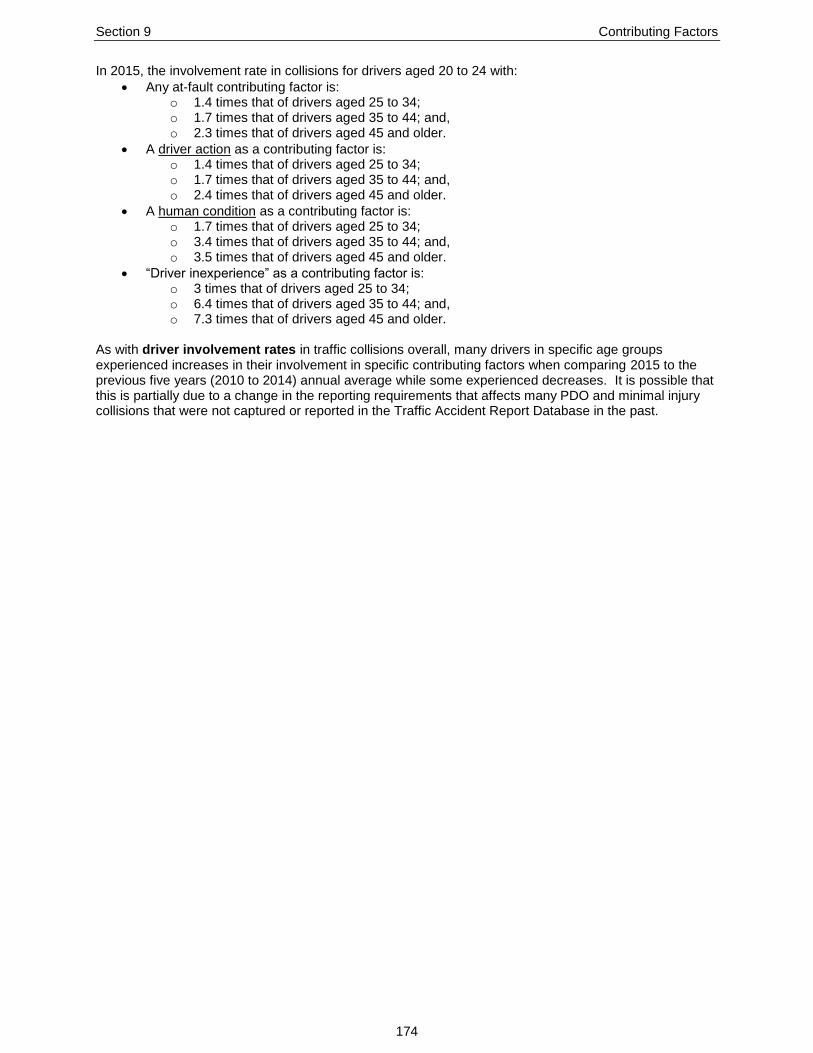
Section 9 Contributing Factors
174
In 2015, the involvement rate in collisions for drivers aged 20 to 24 with:
Any at-fault contributing factor is: o 1.4 times that of drivers aged 25 to 34; o 1.7 times that of drivers aged 35 to 44; and, o 2.3 times that of drivers aged 45 and older.
A driver action as a contributing factor is: o 1.4 times that of drivers aged 25 to 34; o 1.7 times that of drivers aged 35 to 44; and, o 2.4 times that of drivers aged 45 and older.
A human condition as a contributing factor is: o 1.7 times that of drivers aged 25 to 34; o 3.4 times that of drivers aged 35 to 44; and, o 3.5 times that of drivers aged 45 and older.
“Driver inexperience” as a contributing factor is: o 3 times that of drivers aged 25 to 34; o 6.4 times that of drivers aged 35 to 44; and, o 7.3 times that of drivers aged 45 and older.
As with driver involvement rates in traffic collisions overall, many drivers in specific age groups experienced increases in their involvement in specific contributing factors when comparing 2015 to the previous five years (2010 to 2014) annual average while some experienced decreases. It is possible that this is partially due to a change in the reporting requirements that affects many PDO and minimal injury collisions that were not captured or reported in the Traffic Accident Report Database in the past.

Section 9 Contributing Factors
175
Table 9-6 Historical Summary of Contributing Factors to a Collision Overall
Table 9-6
Summary of Contributing Factors to a Collision: 2010 to 2015
Contributing Factor
2010 Total
Collisions
% of 2010 Total
Collisions
2011 Total
Collisions
% of 2011 Total
Collisions
2012 Total
Collisions
% of 2012 Total
Collisions
2013 Total
Collisions
% of 2013 Total
Collisions
2014 Total
Collisions
% of 2014 Total
Collisions
2015 Total
Collisions
% of 2015 Total
Collisions
Driver Action - Driving Properly and Human Condition - Apparently Normal
12,438 45.8% 17,016 49.6% 25,573 65.6% 25,005 59.8% 24,166 59.4% 28,316 68.2%
Driver Action - Driving properly 2,363 8.7% 1,907 5.6% 843 2.2% 858 2.1% 789 1.9% 530 1.3%
Any Driver Action 7,387 27.2% 12,785 37.3% 20,260 52.0% 25,859 61.8% 26,734 65.7% 25,877 62.3%
Following too closely 1,400 5.2% 2,945 8.6% 5,247 13.5% 6,190 14.8% 6,581 16.2% 6,958 16.7%
Turning improperly 701 2.6% 861 2.5% 1,527 3.9% 2,046 4.9% 2,247 5.5% 2,564 6.2%
Passing improperly 137 0.5% 134 0.4% 129 0.3% 169 0.4% 149 0.4% 151 0.4%
Changing lanes improperly 436 1.6% 823 2.4% 1,351 3.5% 1,615 3.9% 1,770 4.4% 1,914 4.6%
Fail to yield right-of-way 1,091 4.0% 1,400 4.1% 1,378 3.5% 2,062 4.9% 2,174 5.3% 2,272 5.5%
Disobey traffic control device/officer 493 1.8% 525 1.5% 357 0.9% 443 1.1% 433 1.1% 500 1.2%
Drive wrong way on roadway 38 0.1% 42 0.1% 9 <0.1% 12 <0.1% 38 <0.1% 28 <0.1%
Passing a vehicle at pedestrian X-walk 2 <0.1% 1 <0.1% 2 <0.1% 0 - 0 - 0 -
Back unsafely 509 1.9% 1,417 4.1% 2,634 6.8% 2,800 6.7% 2,930 7.2% 3,040 7.3%
Parking improperly 46 0.2% 98 0.3% 104 0.3% 104 0.2% 155 0.4% 152 0.4%
Lost control/Drive off road 582 2.1% 992 2.9% 1,064 2.7% 1,598 3.8% 1,415 3.5% 1,589 3.8%
Driverless vehicle ran out of control 10 <0.1% 11 <0.1% 18 <0.1% 12 <0.1% 33 <0.1% 38 <0.1%
Leave stop sign before safe to do so 316 1.2% 438 1.3% 493 1.3% 745 1.8% 1,006 2.5% 844 2.0%
Failed to signal 12 <0.1% 18 <0.1% 16 <0.1% 8 <0.1% 17 <0.1% 21 <0.1%
Take avoiding action 357 1.3% 425 1.2% 356 0.9% 408 1.0% 458 1.1% 488 1.2%
Driver inexperience 253 0.9% 282 0.8% 161 0.4% 144 0.3% 122 0.3% 176 0.4%
Pedestrian error/confusion 86 0.3% 76 0.2% 29 <0.1% 31 <0.1% 49 0.1% 55 0.1%
NET Speed 1,078 4.0% 1,627 4.7% 1,891 4.9% 2,418 5.8% 3,076 7.6% 3,092 7.4%
Exceeding speed limit 103 0.4% 57 0.2% 16 <0.1% 14 <0.1% 26 <0.1% 48 0.1%
Driving too fast for conditions 838 3.1% 1,443 4.2% 1,813 4.7% 2,362 5.6% 3,018 7.4% 3,005 7.2%
Unsafe operating speed (Too fast or too slow)
159 0.6% 143 0.4% 67 0.2% 45 0.1% 36 <0.1% 48 0.1%
NET Distracted driving 1,534 5.6% 2,415 7.0% 4,780 12.3% 6,709 16.0% 8,468 20.8% 9,463 22.8%
Careless Driving 460 1.7% 1,451 4.2% 4,474 11.5% 6,409 15.3% 8,136 20.0% 8,943 21.5%
Distraction/Inattention 1,135 4.2% 1,038 3.0% 372 1.0% 359 0.9% 464 1.1% 716 1.7%
(continued on next page)

Section 9 Contributing Factors
176
(continued from previous page)
Contributing Factor 2010 Total
Collisions
% of 2010 Total
Collisions
2011 Total
Collisions
% of 2011 Total
Collisions
2012 Total
Collisions
% of 2012 Total
Collisions
2013 Total
Collisions
% of 2013 Total
Collisions
2014 Total
Collisions
% of 2014 Total
Collisions
2015 Total
Collisions
% of 2015 Total
Collisions
Human Condition - Apparently Normal 5,657 20.8% 5,894 17.2% 6,983 17.9% 2,990 7.1% 3,792 9.3% 7,580 18.2%
Any Human Condition 1,691 6.2% 1,429 4.2% 607 1.6% 599 1.4% 237 0.6% 297 0.7%
Loss of consciousness/Blackout prior to collision
50 0.2% 44 0.1% 33 <0.1% 34 <0.1% 37 <0.1% 43 0.1%
Extreme fatigue/Fell asleep 97 0.4% 88 0.3% 63 0.2% 63 0.2% 59 0.1% 66 0.2%
Defective eyesight 8 <0.1% 6 <0.1% 12 <0.1% 2 <0.1% 5 <0.1% 5 <0.1%
Defective hearing 5 <0.1% 2 <0.1% 1 <0.1% 0 - 0 - 1 <0.1%
Medical disability 19 <0.1% 11 <0.1% 6 <0.1% 10 <0.1% 10 <0.1% 20 <0.1%
Physical disability 11 <0.1% 16 <0.1% 1 <0.1% 3 <0.1% 1 <0.1% 5 <0.1%
Mental disability 11 <0.1% 6 <0.1% 2 <0.1% 4 <0.1% 4 <0.1% 5 <0.1%
Mental confusion/Inability to remember 21 <0.1% 21 <0.1% 13 <0.1% 22 <0.1% 15 <0.1% 28 <0.1%
Sudden illness 8 <0.1% 10 <0.1% 10 <0.1% 8 <0.1% 5 <0.1% 8 <0.1%
Exceed hours of service (commercial drivers only)
0 - 1 <0.1% 0 - 0 - 0 - 0 -
NET Impaired 373 1.4% 230 0.7% 123 0.3% 119 0.3% 115 0.3% 140 0.3%
Ability impaired alcohol 229 0.8% 147 0.4% 97 0.2% 94 0.2% 75 0.2% 109 0.3%
Ability impaired drugs 12 <0.1% 10 <0.1% 1 <0.1% 3 <0.1% 7 <0.1% 7 <0.1%
Had been drinking/Suspected alcohol use
152 0.6% 80 0.2% 30 <0.1% 31 <0.1% 38 <0.1% 36 <0.1%
No Apparent (Vehicle) Defect 14,097 51.9% 17,843 52.0% 26,336 67.6% 24,908 59.6% 25,414 62.5% 32,283 77.7%
Any Vehicle Defect 227 0.8% 223 0.7% 163 0.4% 189 0.5% 283 0.7% 300 0.7%
Defective brakes 68 0.3% 40 0.1% 17 <0.1% 14 <0.1% 23 <0.1% 22 <0.1%
Defective steering 17 <0.1% 13 <0.1% 3 <0.1% 4 <0.1% 10 <0.1% 15 <0.1%
Defective headlights 6 <0.1% 4 <0.1% 0 - 0 - 0 - 0 -
Defective brake lights 3 <0.1% 3 <0.1% 1 <0.1% 3 <0.1% 6 <0.1% 5 <0.1%
Defective lighting (unspecified) 7 <0.1% 5 <0.1% 0 - 3 <0.1% 3 <0.1% 0 -
Defective engine controls/drive train 23 <0.1% 13 <0.1% 6 <0.1% 8 <0.1% 7 <0.1% 6 <0.1%
Defective suspension/wheels 19 <0.1% 27 <0.1% 25 <0.1% 31 <0.1% 40 <0.1% 49 0.1%
Defective tires 41 0.2% 46 0.1% 27 <0.1% 35 <0.1% 80 0.2% 74 0.2%
Tow hitch/yoke defective 10 <0.1% 18 <0.1% 14 <0.1% 15 <0.1% 12 <0.1% 25 <0.1%
Defective exhaust system 2 <0.1% 1 <0.1% 1 <0.1% 0 - 0 - 0 -
Hood/tailgate/door/covering opened 3 <0.1% 4 <0.1% 4 <0.1% 3 <0.1% 4 <0.1% 4 <0.1%
Defective glazing (obscured windows) 5 <0.1% 2 <0.1% 3 <0.1% 2 <0.1% 3 <0.1% 3 <0.1%
Vehicle modifications 1 <0.1% 2 <0.1% 2 <0.1% 1 <0.1% 1 <0.1% 2 <0.1%
Fire 1 <0.1% 0 - 2 <0.1% 3 <0.1% 6 <0.1% 1 <0.1%
Overloaded/oversized 4 <0.1% 5 <0.1% 2 <0.1% 0 - 1 <0.1% 4 <0.1%
(continued on next page)

Section 9 Contributing Factors
177
(continued from previous page)
Contributing Factor 2010 Total
Collisions
% of 2010 Total
Collisions
2011 Total
Collisions
% of 2011 Total
Collisions
2012 Total
Collisions
% of 2012 Total
Collisions
2013 Total
Collisions
% of 2013 Total
Collisions
2014 Total
Collisions
% of 2014 Total
Collisions
2015 Total
Collisions
% of 2015 Total
Collisions
Jack-knife/trailer swing 6 <0.1% 16 <0.1% 39 0.1% 44 0.1% 67 0.2% 63 0.2%
Hydroplaning tires 7 <0.1% 6 <0.1% 4 <0.1% 10 <0.1% 3 <0.1% 12 <0.1%
Any Environmental Condition 5,320 19.6% 8,143 23.7% 6,631 17.0% 7,231 17.3% 6,823 16.8% 4,000 9.6%
Animal action – Wild 3,133 11.5% 4,706 13.7% 4,967 12.7% 4,756 11.4% 4,017 9.9% 1,892 4.6%
Animal action – Domestic 175 0.6% 223 0.7% 41 0.1% 45 0.1% 52 0.1% 33 <0.1%
Slippery road surface 1,214 4.5% 2,111 6.2% 1,151 3.0% 1,737 4.2% 1,859 4.6% 1,357 3.3%
Snow drift 126 0.5% 207 0.6% 15 <0.1% 118 0.3% 163 0.4% 45 0.1%
Obstruction/debris on roadway 117 0.4% 149 0.4% 116 0.3% 152 0.4% 202 0.5% 191 0.5%
View obstructed/limited 212 0.8% 296 0.9% 66 0.2% 106 0.3% 190 0.5% 155 0.4%
Glare/reflection 63 0.2% 84 0.2% 26 <0.1% 36 <0.1% 27 <0.1% 41 <0.1%
Construction zone 26 <0.1% 49 0.1% 27 <0.1% 11 <0.1% 19 <0.1% 15 <0.1%
Defective driving surface 138 0.5% 199 0.6% 45 0.1% 60 0.1% 118 0.3% 82 0.2%
Shoulders defective 26 <0.1% 22 <0.1% 4 <0.1% 10 <0.1% 10 <0.1% 9 <0.1%
Lane markings inadequate 10 <0.1% 7 <0.1% 6 <0.1% 10 <0.1% 6 <0.1% 4 <0.1%
Defective/inoperative traffic control device
9 <0.1% 11 <0.1% 6 <0.1% 12 <0.1% 10 <0.1% 18 <0.1%
Weather 223 0.8% 353 1.0% 158 0.4% 214 0.5% 189 0.5% 205 0.5%
Pedestrian corridor in use 10 <0.1% 15 <0.1% 16 <0.1% 7 <0.1% 16 <0.1% 11 <0.1%
Uninvolved vehicle 49 0.2% 58 0.2% 14 <0.1% 20 <0.1% 18 <0.1% 27 <0.1%
Uninvolved pedestrian 9 <0.1% 15 <0.1% 8 <0.1% 8 <0.1% 3 <0.1% 4 <0.1%
Presence of prior accident 18 <0.1% 20 <0.1% 4 <0.1% 9 <0.1% 1 <0.1% 3 <0.1%
No Contributing Factor(s) Identified 11,909 43.8% 9,276 27.0% 3,507 9.0% 3,126 7.5% 2,144 5.3% 1,572 3.8%
Not Stated 5 <0.1% 570 1.7% 0 - 0 - 14 <0.1% 73 0.2%
Total 27,172 100% 34,302 100% 38,972 100% 41,819 100% 40,672 100% 41,548 100%
*NOTE: For each vehicle and/or driver involved in a collision, up to three contributing factors can be recorded. Because multiple factors can be noted, the counts and percentages under each collision severity will add to more than the total collisions of that severity.

Section 9 Contributing Factors
178
Table 9-7 Historical Summary of Contributing Factors Recorded for Victims of Collisions
Table 9-7
Summary of Contributing Factors for Victims (Killed and Injured, Combined) of Collisions: 2010 to 2015
Contributing Factor
2010 Total
Victims
% of 2010 Total
Victims
2011 Total
Victims
% of 2011 Total
Victims
2012 Total
Victims
% of 2012 Total
Victims
2013 Total
Victims
% of 2013 Total
Victims
2014 Total
Victims
% of 2014 Total
Victims
2015 Total
Victims
% of 2015 Total
Victims
Driver Action - Driving Properly and Human Condition - Apparently Normal
3,762 52.8% 4,990 59.9% 8,678 81.7% 8,886 79.1% 9,367 80.2% 10,041 83.6%
Driver Action - Driving properly 630 8.8% 486 5.8% 348 3.3% 364 3.2% 366 3.1% 255 2.1%
Any Driver Action 2,641 37.0% 3,717 44.6% 5,866 55.2% 7,636 68.0% 8,625 73.9% 8,932 74.3%
Following too closely 420 5.9% 950 11.4% 2,191 20.6% 2,578 22.9% 3,061 26.2% 3,386 28.2%
Turning improperly 202 2.8% 284 3.4% 434 4.1% 717 6.4% 875 7.5% 1,081 9.0%
Passing improperly 36 0.5% 41 0.5% 53 0.5% 44 0.4% 32 0.3% 37 0.3%
Changing lanes improperly 66 0.9% 123 1.5% 270 2.5% 269 2.4% 366 3.1% 391 3.3%
Fail to yield right-of-way 408 5.7% 518 6.2% 550 5.2% 842 7.5% 1,081 9.3% 1,142 9.5%
Disobey traffic control device/officer 247 3.5% 258 3.1% 194 1.8% 245 2.2% 307 2.6% 393 3.3%
Drive wrong way on roadway 19 0.3% 25 0.3% 17 0.2% 8 <0.1% 21 0.2% 22 0.2%
Passing a vehicle at pedestrian X-walk 1 <0.1% 1 <0.1% 2 <0.1% 0 - 0 - 0 -
Back unsafely 31 0.4% 68 0.8% 184 1.7% 214 1.9% 252 2.2% 231 1.9%
Parking improperly 2 <0.1% 11 0.1% 8 <0.1% 10 <0.1% 12 0.1% 12 <0.1%
Lost control/Drive off road 357 5.0% 366 4.4% 324 3.0% 459 4.1% 421 3.6% 480 4.0%
Driverless vehicle ran out of control 2 <0.1% 1 <0.1% 2 <0.1% 6 <0.1% 1 <0.1% 11 <0.1%
Leave stop sign before safe to do so 186 2.6% 211 2.5% 202 1.9% 301 2.7% 490 4.2% 450 3.7%
Failed to signal 0 - 4 <0.1% 7 <0.1% 4 <0.1% 5 <0.1% 11 <0.1%
Take avoiding action 109 1.5% 91 1.1% 67 0.6% 80 0.7% 92 0.8% 92 0.8%
Driver inexperience 114 1.6% 92 1.1% 56 0.5% 60 0.5% 46 0.4% 58 0.5%
Pedestrian error/confusion 83 1.2% 64 0.8% 25 0.2% 27 0.2% 25 0.2% 26 0.2%
NET Speed 457 6.4% 553 6.6% 543 5.1% 696 6.2% 881 7.5% 993 8.3%
Exceeding speed limit 80 1.1% 27 0.3% 15 0.1% 26 0.2% 19 0.2% 24 0.2%
Driving too fast for conditions 286 4.0% 448 5.4% 492 4.6% 646 5.8% 834 7.1% 953 7.9%
Unsafe operating speed (Too fast or too slow)
112 1.6% 85 1.0% 37 0.3% 29 0.3% 30 0.3% 24 0.2%
NET Distracted driving 709 9.9% 715 8.6% 1,249 11.8% 1,759 15.7% 2,369 20.3% 3,101 25.8%
Careless Driving 276 3.9% 403 4.8% 1,111 10.5% 1,621 14.4% 2,173 18.6% 2,838 23.6%
Distraction/Inattention 473 6.6% 348 4.2% 164 1.5% 161 1.4% 270 2.3% 365 3.0%
(continued on next page)

Section 9 Contributing Factors
179
(continued from previous page)
Contributing Factor 2010 Total
Victims
% of 2010 Total
Victims
2011 Total
Victims
% of 2011 Total
Victims
2012 Total
Victims
% of 2012 Total
Victims
2013 Total
Victims
% of 2013 Total
Victims
2014 Total
Victims
% of 2014 Total
Victims
2015 Total
Victims
% of 2015 Total
Victims
Human Condition - Apparently Normal 1,747 24.5% 1,665 20.0% 2,264 21.3% 1,123 10.0% 1,394 11.9% 2,217 18.4%
Any Human Condition 816 11.4% 642 7.7% 315 3.0% 353 3.1% 208 1.8% 226 1.9%
Loss of consciousness/Blackout prior to collision
40 0.6% 28 0.3% 20 0.2% 26 0.2% 36 0.3% 39 0.3%
Extreme fatigue/Fell asleep 47 0.7% 51 0.6% 26 0.2% 39 0.3% 26 0.2% 28 0.2%
Defective eyesight 3 <0.1% 3 <0.1% 5 <0.1% 0 - 9 <0.1% 4 <0.1%
Defective hearing 2 <0.1% 1 <0.1% 0 - 0 - 0 - 2 <0.1%
Medical disability 10 0.1% 11 0.1% 5 <0.1% 2 <0.1% 7 <0.1% 14 0.1%
Physical disability 9 0.1% 9 0.1% 0 - 4 <0.1% 0 - 4 <0.1%
Mental disability 9 0.1% 9 0.1% 3 <0.1% 4 <0.1% 10 <0.1% 4 <0.1%
Mental confusion/Inability to remember 12 0.2% 9 0.1% 7 <0.1% 12 0.1% 12 0.1% 27 0.2%
Sudden illness 4 <0.1% 9 0.1% 5 <0.1% 6 <0.1% 2 <0.1% 4 <0.1%
Exceed hours of service (commercial drivers only)
0 - 0 - 0 - 0 - 0 - 0 -
NET Impaired 248 3.5% 190 2.3% 106 1.0% 118 1.1% 116 1.0% 121 1.0%
Ability impaired alcohol 165 2.3% 122 1.5% 76 0.7% 87 0.8% 68 0.6% 97 0.8%
Ability impaired drugs 9 0.1% 5 <0.1% 1 <0.1% 1 <0.1% 10 <0.1% 9 <0.1%
Had been drinking/Suspected alcohol use
87 1.2% 68 0.8% 34 0.3% 44 0.4% 44 0.4% 27 0.2%
No Apparent (Vehicle) Defect 4,340 60.9% 5,341 64.1% 9,009 84.8% 9,011 80.2% 9,664 82.8% 10,488 87.3%
Any Vehicle Defect 114 1.6% 49 0.6% 23 0.2% 45 0.4% 44 0.4% 35 0.3%
Defective brakes 27 0.4% 8 <0.1% 9 <0.1% 10 <0.1% 10 <0.1% 8 <0.1%
Defective steering 4 <0.1% 4 <0.1% 0 - 1 <0.1% 7 <0.1% 2 <0.1%
Defective headlights 11 0.2% 2 <0.1% 0 - 0 - 0 - 0 -
Defective brake lights 3 <0.1% 0 - 3 <0.1% 0 - 2 <0.1% 0 -
Defective lighting (unspecified) 4 <0.1% 3 <0.1% 0 - 4 <0.1% 1 <0.1% 0 -
Defective engine controls/drive train 13 0.2% 3 <0.1% 0 - 2 <0.1% 2 <0.1% 2 <0.1%
Defective suspension/wheels 6 <0.1% 3 <0.1% 0 - 11 <0.1% 4 <0.1% 4 <0.1%
Defective tires 20 0.3% 23 0.3% 3 <0.1% 8 <0.1% 7 <0.1% 8 <0.1%
Tow hitch/yoke defective 8 0.1% 1 <0.1% 1 <0.1% 0 - 0 - 0 -
Defective exhaust system 1 <0.1% 0 - 3 <0.1% 0 - 0 - 0 -
Hood/tailgate/door/covering opened 2 <0.1% 0 - 0 - 0 - 0 - 1 <0.1%
Defective glazing (obscured windows) 2 <0.1% 0 - 2 <0.1% 0 - 2 <0.1% 0 -
Vehicle modifications 1 <0.1% 1 <0.1% 0 - 1 <0.1% 1 <0.1% 0 -
Fire 0 - 0 - 0 - 1 <0.1% 2 <0.1% 1 <0.1%
Overloaded/oversized 1 <0.1% 0 - 0 - 0 - 0 - 1 <0.1%
(continued on next page)

Section 9 Contributing Factors
180
(continued from previous page)
Contributing Factor 2010 Total
Victims
% of 2010 Total
Victims
2011 Total
Victims
% of 2011 Total
Victims
2012 Total
Victims
% of 2012 Total
Victims
2013 Total
Victims
% of 2013 Total
Victims
2014 Total
Victims
% of 2014 Total
Victims
2015 Total
Victims
% of 2015 Total
Victims
Load shifted/spilled 1 <0.1% 0 - 1 <0.1% 3 <0.1% 3 <0.1% 2 <0.1%
Jack-knife/trailer swing 3 <0.1% 0 - 0 - 4 <0.1% 3 <0.1% 3 <0.1%
Hydroplaning tires 8 0.1% 2 <0.1% 1 <0.1% 5 <0.1% 0 - 3 <0.1%
Any Environmental Condition 979 13.7% 1,172 14.1% 713 6.7% 911 8.1% 957 8.2% 764 6.4%
Animal action – Wild 239 3.4% 275 3.3% 274 2.6% 240 2.1% 219 1.9% 130 1.1%
Animal action – Domestic 20 0.3% 39 0.5% 1 <0.1% 7 <0.1% 9 <0.1% 12 <0.1%
Slippery road surface 374 5.2% 558 6.7% 290 2.7% 475 4.2% 495 4.2% 412 3.4%
Snow drift 27 0.4% 39 0.5% 1 <0.1% 16 0.1% 27 0.2% 6 <0.1%
Obstruction/debris on roadway 30 0.4% 29 0.3% 10 <0.1% 12 0.1% 14 0.1% 24 0.2%
View obstructed/limited 67 0.9% 89 1.1% 22 0.2% 44 0.4% 77 0.7% 75 0.6%
Glare/reflection 31 0.4% 32 0.4% 17 0.2% 13 0.1% 15 0.1% 15 0.1%
Construction zone 15 0.2% 5 <0.1% 9 <0.1% 9 <0.1% 6 <0.1% 5 <0.1%
Defective driving surface 77 1.1% 58 0.7% 16 0.2% 18 0.2% 15 0.1% 12 <0.1%
Shoulders defective 10 0.1% 7 <0.1% 1 <0.1% 6 <0.1% 7 <0.1% 2 <0.1%
Lane markings inadequate 2 <0.1% 5 <0.1% 1 <0.1% 1 <0.1% 3 <0.1% 2 <0.1%
Defective/inoperative traffic control device
3 <0.1% 5 <0.1% 1 <0.1% 10 <0.1% 6 <0.1% 9 <0.1%
Weather 99 1.4% 120 1.4% 69 0.6% 74 0.7% 74 0.6% 81 0.7%
Pedestrian corridor in use 6 <0.1% 11 0.1% 11 0.1% 3 <0.1% 9 <0.1% 6 <0.1%
Uninvolved vehicle 23 0.3% 14 0.2% 3 <0.1% 7 <0.1% 5 <0.1% 11 <0.1%
Uninvolved pedestrian 4 <0.1% 7 <0.1% 5 <0.1% 2 <0.1% 0 - 2 <0.1%
Presence of prior accident 16 0.2% 13 0.2% 0 - 4 <0.1% 2 <0.1% 1 <0.1%
No Contributing Factor(s) Identified 2,900 40.7% 2,605 31.2% 1,605 15.1% 1,386 12.3% 971 8.3% 650 5.4%
Not Stated 1 <0.1% 178 2.1% 0 - 0 - 4 <0.1% 16 0.1%
Total 7,130 100% 8,337 100% 10,623 100% 11,234 100% 11,676 100% 12,017 100%
*NOTE: For each vehicle and/or driver involved in a collision, up to three contributing factors can be recorded. Because multiple factors can be noted, the counts and percentages under each year will add to more than the total victims for that year.

Section 9 Contributing Factors
181
Table 9-8 Historical Summary of Contributing Factors Recorded for Drivers Involved in Collisions
Table 9-8
Summary of Contributing Factors for Drivers Involved in Collisions: 2010 to 2015
Contributing Factor
2010 Total
Drivers
% of 2010 Total
Drivers
2011 Total
Drivers
% of 2011 Total
Drivers
2012 Total
Drivers
% of 2012 Total
Drivers
2013 Total
Drivers
% of 2013 Total
Drivers
2014 Total
Drivers
% of 2014 Total
Drivers
2015 Total
Drivers
% of 2015 Total
Drivers
Driver Action - Driving Properly and Human Condition - Apparently Normal
13,243 31.3% 18,204 35.5% 29,010 49.3% 26,101 41.1% 25,040 40.9% 28,516 47.8%
Driver Action - Driving properly 2,297 5.4% 1,882 3.7% 843 1.4% 863 1.4% 790 1.3% 535 0.9%
Any Driver Action 7,422 17.5% 12,805 25.0% 20,397 34.6% 26,087 41.1% 26,978 44.0% 26,147 43.8%
Following too closely 1,433 3.4% 2,973 5.8% 5,269 8.9% 6,207 9.8% 6,607 10.8% 6,999 11.7%
Turning improperly 700 1.7% 859 1.7% 1,528 2.6% 2,053 3.2% 2,258 3.7% 2,577 4.3%
Passing improperly 139 0.3% 131 0.3% 129 0.2% 173 0.3% 150 0.2% 152 0.3%
Changing lanes improperly 438 1.0% 821 1.6% 1,363 2.3% 1,642 2.6% 1,794 2.9% 1,953 3.3%
Fail to yield right-of-way 1,084 2.6% 1,393 2.7% 1,370 2.3% 2,070 3.3% 2,188 3.6% 2,278 3.8%
Disobey traffic control device/officer 493 1.2% 521 1.0% 356 0.6% 442 0.7% 437 0.7% 499 0.8%
Drive wrong way on roadway 29 <0.1% 40 <0.1% 9 <0.1% 11 <0.1% 38 <0.1% 27 <0.1%
Passing a vehicle at pedestrian X-walk 2 <0.1% 1 <0.1% 2 <0.1% 0 - 0 - 0 -
Back unsafely 498 1.2% 1,406 2.7% 2,665 4.5% 2,827 4.5% 2,960 4.8% 3,083 5.2%
Parking improperly 37 <0.1% 80 0.2% 101 0.2% 96 0.2% 147 0.2% 146 0.2%
Lost control/Drive off road 578 1.4% 986 1.9% 1,062 1.8% 1,597 2.5% 1,414 2.3% 1,587 2.7%
Driverless vehicle ran out of control 7 <0.1% 7 <0.1% 16 <0.1% 12 <0.1% 28 <0.1% 37 <0.1%
Leave stop sign before safe to do so 317 0.7% 440 0.9% 495 0.8% 750 1.2% 1,013 1.7% 849 1.4%
Failed to signal 11 <0.1% 18 <0.1% 16 <0.1% 8 <0.1% 17 <0.1% 21 <0.1%
Take avoiding action 355 0.8% 433 0.8% 353 0.6% 408 0.6% 458 0.7% 488 0.8%
Driver inexperience 249 0.6% 281 0.5% 161 0.3% 145 0.2% 122 0.2% 174 0.3%
Pedestrian error/confusion 22 <0.1% 20 <0.1% 26 <0.1% 17 <0.1% 28 <0.1% 45 <0.1%
NET Speed 1,082 2.6% 1,621 3.2% 1,890 3.2% 2,420 3.8% 3,081 5.0% 3,090 5.2%
Exceeding speed limit 103 0.2% 56 0.1% 16 <0.1% 15 <0.1% 26 <0.1% 48 <0.1%
Driving too fast for conditions 841 2.0% 1,441 2.8% 1,813 3.1% 2,363 3.7% 3,024 4.9% 3,005 5.0%
Unsafe operating speed (Too fast or too slow)
159 0.4% 139 0.3% 66 0.1% 45 <0.1% 34 <0.1% 46 <0.1%
NET Distracted driving 1,492 3.5% 2,382 4.6% 4,767 8.1% 6,702 10.6% 8,471 13.8% 9,462 15.8%
Careless Driving 445 1.1% 1,437 2.8% 4,461 7.6% 6,407 10.1% 8,140 13.3% 8,947 15.0%
Distraction/Inattention 1,105 2.6% 1,018 2.0% 372 0.6% 354 0.6% 460 0.8% 706 1.2%
(continued on next page)

Section 9 Contributing Factors
182
(continued from previous page)
Contributing Factor 2010 Total
Drivers
% of 2010 Total
Drivers
2011 Total
Drivers
% of 2011 Total
Drivers
2012 Total
Drivers
% of 2012 Total
Drivers
2013 Total
Drivers
% of 2013 Total
Drivers
2014 Total
Drivers
% of 2014 Total
Drivers
2015 Total
Drivers
% of 2015 Total
Drivers
Human Condition - Apparently Normal 6,033 14.3% 6,111 11.9% 7,037 12.0% 3,048 4.8% 3,826 6.2% 7,594 12.7%
Any Human Condition 1,630 3.9% 1,397 2.7% 602 1.0% 592 0.9% 230 0.4% 291 0.5%
Loss of consciousness/Blackout prior to collision
50 0.1% 44 <0.1% 33 <0.1% 34 <0.1% 36 <0.1% 43 <0.1%
Extreme fatigue/Fell asleep 97 0.2% 87 0.2% 63 0.1% 63 <0.1% 59 <0.1% 66 0.1%
Defective eyesight 8 <0.1% 6 <0.1% 12 <0.1% 2 <0.1% 4 <0.1% 5 <0.1%
Defective hearing 4 <0.1% 2 <0.1% 1 <0.1% 0 - 0 - 0 -
Medical disability 19 <0.1% 12 <0.1% 6 <0.1% 10 <0.1% 10 <0.1% 20 <0.1%
Physical disability 10 <0.1% 16 <0.1% 1 <0.1% 2 <0.1% 1 <0.1% 4 <0.1%
Mental disability 8 <0.1% 2 <0.1% 2 <0.1% 4 <0.1% 4 <0.1% 5 <0.1%
Mental confusion/Inability to remember 20 <0.1% 20 <0.1% 13 <0.1% 22 <0.1% 15 <0.1% 28 <0.1%
Sudden illness 8 <0.1% 10 <0.1% 10 <0.1% 8 <0.1% 5 <0.1% 8 <0.1%
Exceed hours of service (commercial drivers only)
0 - 1 <0.1% 0 - 0 - 0 - 0 -
NET Impaired 344 0.8% 217 0.4% 118 0.2% 117 0.2% 110 0.2% 135 0.2%
Ability impaired alcohol 209 0.5% 139 0.3% 93 0.2% 93 0.1% 72 0.1% 105 0.2%
Ability impaired drugs 11 <0.1% 10 <0.1% 1 <0.1% 3 <0.1% 7 <0.1% 7 <0.1%
Had been drinking/Suspected alcohol use
142 0.3% 75 0.1% 29 <0.1% 30 <0.1% 36 <0.1% 35 <0.1%
No Apparent (Vehicle) Defect 17,631 41.7% 21,567 42.1% 33,658 57.2% 26,885 42.3% 28,156 45.9% 36,356 60.9%
Any Vehicle Defect 216 0.5% 216 0.4% 163 0.3% 188 0.3% 282 0.5% 299 0.5%
Defective brakes 65 0.2% 39 <0.1% 17 <0.1% 14 <0.1% 22 <0.1% 22 <0.1%
Defective steering 17 <0.1% 13 <0.1% 3 <0.1% 4 <0.1% 10 <0.1% 14 <0.1%
Defective headlights 6 <0.1% 3 <0.1% 0 - 0 - 0 - 0 -
Defective brake lights 3 <0.1% 3 <0.1% 1 <0.1% 3 <0.1% 6 <0.1% 5 <0.1%
Defective lighting (unspecified) 6 <0.1% 4 <0.1% 0 - 3 <0.1% 3 <0.1% 0 -
Defective engine controls/drive train 20 <0.1% 13 <0.1% 6 <0.1% 8 <0.1% 7 <0.1% 6 <0.1%
Defective suspension/wheels 19 <0.1% 27 <0.1% 25 <0.1% 31 <0.1% 40 <0.1% 49 <0.1%
Defective tires 40 <0.1% 46 <0.1% 27 <0.1% 35 <0.1% 80 0.1% 74 0.1%
Tow hitch/yoke defective 10 <0.1% 17 <0.1% 14 <0.1% 15 <0.1% 12 <0.1% 25 <0.1%
Defective exhaust system 2 <0.1% 1 <0.1% 1 <0.1% 0 - 0 - 0 -
Hood/tailgate/door/covering opened 2 <0.1% 2 <0.1% 4 <0.1% 3 <0.1% 4 <0.1% 4 <0.1%
Defective glazing (obscured windows) 5 <0.1% 2 <0.1% 3 <0.1% 2 <0.1% 3 <0.1% 3 <0.1%
Vehicle modifications 0 - 2 <0.1% 2 <0.1% 1 <0.1% 1 <0.1% 2 <0.1%
Fire 1 <0.1% 0 - 2 <0.1% 3 <0.1% 6 <0.1% 1 <0.1%
Overloaded/oversized 3 <0.1% 4 <0.1% 2 <0.1% 0 - 1 <0.1% 4 <0.1%
(continued on next page)

Section 9 Contributing Factors
183
(continued from previous page)
Contributing Factor 2010 Total
Drivers
% of 2010 Total
Drivers
2011 Total
Drivers
% of 2011 Total
Drivers
2012 Total
Drivers
% of 2012 Total
Drivers
2013 Total
Drivers
% of 2013 Total
Drivers
2014 Total
Drivers
% of 2014 Total
Drivers
2015 Total
Drivers
% of 2015 Total
Drivers
Load shifted/spilled 9 <0.1% 19 <0.1% 15 <0.1% 16 <0.1% 21 <0.1% 23 <0.1%
Jack-knife/trailer swing 6 <0.1% 16 <0.1% 39 <0.1% 43 <0.1% 67 0.1% 63 0.1%
Hydroplaning tires 7 <0.1% 6 <0.1% 4 <0.1% 10 <0.1% 3 <0.1% 12 <0.1%
Any Environmental Condition 5,490 13.0% 8,256 16.1% 6,630 11.3% 7,240 11.4% 6,829 11.1% 4,000 6.7%
Animal action – Wild 3,137 7.4% 4,708 9.2% 4,969 8.4% 4,757 7.5% 4,017 6.6% 1,891 3.2%
Animal action – Domestic 175 0.4% 226 0.4% 41 <0.1% 45 <0.1% 52 <0.1% 33 <0.1%
Slippery road surface 1,316 3.1% 2,190 4.3% 1,152 2.0% 1,740 2.7% 1,862 3.0% 1,361 2.3%
Snow drift 132 0.3% 215 0.4% 15 <0.1% 118 0.2% 164 0.3% 45 <0.1%
Obstruction/debris on roadway 125 0.3% 147 0.3% 116 0.2% 153 0.2% 202 0.3% 190 0.3%
View obstructed/limited 229 0.5% 305 0.6% 65 0.1% 104 0.2% 191 0.3% 155 0.3%
Glare/reflection 65 0.2% 84 0.2% 26 <0.1% 36 <0.1% 27 <0.1% 41 <0.1%
Construction zone 32 <0.1% 51 <0.1% 27 <0.1% 11 <0.1% 20 <0.1% 15 <0.1%
Defective driving surface 135 0.3% 198 0.4% 45 <0.1% 60 <0.1% 118 0.2% 82 0.1%
Shoulders defective 26 <0.1% 22 <0.1% 4 <0.1% 10 <0.1% 11 <0.1% 9 <0.1%
Lane markings inadequate 11 <0.1% 8 <0.1% 6 <0.1% 10 <0.1% 6 <0.1% 4 <0.1%
Defective/inoperative traffic control device
11 <0.1% 12 <0.1% 6 <0.1% 12 <0.1% 10 <0.1% 17 <0.1%
Weather 240 0.6% 364 0.7% 159 0.3% 215 0.3% 191 0.3% 204 0.3%
Pedestrian corridor in use 9 <0.1% 14 <0.1% 14 <0.1% 7 <0.1% 13 <0.1% 10 <0.1%
Uninvolved vehicle 51 0.1% 61 0.1% 13 <0.1% 20 <0.1% 18 <0.1% 27 <0.1%
Uninvolved pedestrian 8 <0.1% 14 <0.1% 7 <0.1% 7 <0.1% 2 <0.1% 3 <0.1%
Presence of prior accident 22 <0.1% 23 <0.1% 4 <0.1% 9 <0.1% 1 <0.1% 3 <0.1%
No Contributing Factor(s) Identified 14,082 33.3% 11,540 22.5% 3,304 5.6% 2,969 4.7% 1,953 3.2% 1,260 2.1%
Not Stated 2 <0.1% 0 - 0 - 0 - 13 <0.1% 68 0.1%
Total 42,310 100% 51,279 100% 58,877 100% 63,501 100% 61,294 100% 59,716 100%
*NOTE: For each vehicle and/or driver involved in a collision, up to three contributing factors can be recorded. Because multiple factors can be noted, the counts and percentages under each collision severity will add to more than the total collisions of that severity.

Section 9 Contributing Factors
184
Table 9-9 Summary of ‘Speed’, ‘Distracted driving’ and ‘Impaired’ as Contributing Factors
Table 9-9
Summary of 'Speed', 'Distracted driving' & 'Impaired' as Contributing Factors: 2010 to 2015
2010 2011 2012 2013 2014
2010-2014 average
2015
NET Speed ('Exceeding speed limit', 'Driving too fast for conditions' and 'Unsafe operating speed (too fast or too slow)' combined)
Collisions
All collisions 1,078 1,627 1,891 2,418 3,076 2,018 3,092
4.0% 4.7% 4.9% 5.8% 7.6% 5.5% 7.4%
Fatal collisions 20 30 17 10 11 18 13
25.6% 31.9% 19.1% 14.5% 17.2% 22.3% 18.8%
Injury collisions 285 348 393 499 683 442 745
5.3% 5.5% 4.7% 5.7% 7.6% 5.9% 8.2%
Victims
All victims (killed or injured) 457 553 543 696 881 626 993
6.4% 6.6% 5.1% 6.2% 7.5% 6.4% 8.3%
People killed 23 37 19 14 12 21 13
26.4% 33.6% 19.8% 16.5% 17.6% 23.5% 16.7%
People seriously injured 43 56 35 38 36 42 60
13.8% 16.6% 10.3% 12.4% 11.9% 13.0% 14.5%
Driver Involvement (/10,000 drivers)
All collisions 13.6 20.0 22.6 28.3 35.4 24.2 35.1
Fatal collisions 0.3 0.4 0.2 0.1 0.1 0.2 0.1
Injury collisions 3.6 4.3 4.7 5.8 7.9 5.3 8.4
NET Distracted driving ('Distraction/ inattention' and 'Careless driving' combined)
Collisions
All collisions 1,534 2,415 4,780 6,709 8,468 4,781 9,463
5.6% 7.0% 12.3% 16.0% 20.8% 13.1% 22.8%
Fatal collisions 30 24 35 18 17 25 25
38.5% 25.5% 39.3% 26.1% 26.6% 31.5% 36.2%
Injury collisions 452 477 948 1,357 1,810 1,009 2,260
8.4% 7.6% 11.4% 15.5% 20.1% 13.4% 24.8%
Victims
All victims (killed or injured) 709 715 1,249 1,759 2,369 1,360 3,101
9.9% 8.6% 11.8% 15.7% 20.3% 13.9% 25.8%
People killed 31 30 37 28 18 29 28
35.6% 27.3% 38.5% 32.9% 26.5% 32.3% 35.9%
People seriously injured 56 46 45 64 84 59 133
17.9% 13.6% 13.3% 20.8% 27.7% 18.5% 32.0%
Driver Involvement (/10,000 drivers)
All collisions 19.4 29.7 57.0 78.4 97.4 57.1 107.4
Fatal collisions 0.4 0.3 0.4 0.2 0.2 0.3 0.3
Injury collisions 5.7 5.9 11.3 15.9 20.8 11.9 25.7
NET Impaired ('Impaired by alcohol', 'Impaired by drugs' and 'Had been drinking/Suspected alcohol use' combined)
Collisions
All collisions 373 230 123 119 115 192 140
1.4% 0.7% 0.3% 0.3% 0.3% 0.5% 0.3%
Fatal collisions 21 21 28 15 19 21 15
26.9% 22.3% 31.5% 21.7% 29.7% 26.4% 21.7%
Injury collisions 135 88 36 50 45 71 61
2.5% 1.4% 0.4% 0.6% 0.5% 0.9% 0.7%
Victims
All victims (killed or injured) 248 190 106 118 116 156 121
3.5% 2.3% 1.0% 1.1% 1.0% 1.6% 1.0%
People killed 22 27 32 19 19 24 16
25.3% 24.5% 33.3% 22.4% 27.9% 26.7% 20.5%
People seriously injured 40 38 23 32 22 31 24
12.8% 11.3% 6.8% 10.4% 7.3% 9.7% 5.8%
Driver Involvement (/10,000 drivers)
All collisions 4.7 2.8 1.5 1.4 1.3 2.2 1.5
Fatal collisions 0.3 0.3 0.3 0.2 0.2 0.2 0.1
Injury collisions 1.7 1.1 0.4 0.6 0.5 0.8 0.7
NOTE: Proportions provided for each contributing factor in a specific category are for the count of contributing factor as a portion of all collisions in the specific category. E.g., the proportion of fatal collisions where speed is a factor is derived from the count of fatal collisions in the specific year where speed is a factor divided by the total fatal collisions in that year.

SECTION 10 - National Safety Code
Monitoring Report


Section 10 NSC Monitoring Report
187
Introduction
This section counts the number of commercial vehicles involved in collisions, the severity of those collisions and the victims killed and injured in those collisions. This section includes only commercial vehicles with a National Safety Code (NSC). Key Highlights In 2015, there are 1,777 commercial vehicles involved in traffic collisions. Of these:
18 are involved in fatal collisions;
401 are involved in injury collisions; and,
1,358 are involved in PDO collisions. Traffic collisions where at least one commercial vehicle is involved resulted in a total of 557 victims in 2015, including:
21 people killed;
31 people seriously injured; and,
505 people where the injury is minor, minimal or unspecified. Major Elements Examined Counts of NSC commercial vehicles involved in collisions in Manitoba for 2015 and previous years are taken from Traffic Accident Reports (TARs) completed by Manitoba Public Insurance and law enforcement agencies, and compiled by Manitoba Public Insurance. These counts are presented for all reportable collisions, fatal collisions, injury collisions, and property damage only (PDO) collisions. It is important to note that the number of collisions is not equal to the number of vehicles involved in those collisions, nor does it equal the number of victims in those collisions. All collisions reported involve at least one vehicle, but may involve more than one as well. Likewise, a single collision could involve no victims, or one or more victims. The reader is cautioned that not all percentages and calculations in the following tables will add to 100% of the total noted. Rounding error will often produce a difference of one or two percentage points. Likewise, average calculations are presented for historical data from the years 2010 to 2014. Rounding error in these calculations will cause individual average counts not to add to total average counts in some cases. Due to the small numbers of fatal collisions, fluctuations year-over-year could be dramatic; a small change in the total count of these types of collisions could have a significant effect on statistics such as percentage change to previous years and involvement rates. Therefore, the reader is strongly cautioned when interpreting results regarding fatal collisions. The reader is cautioned that not all victims in a collision involving an NSC commercial vehicle will be a driver or passenger in the commercial vehicle. This section counts the number of total victims resulting from a collision where a commercial vehicle was involved, not just the victims in the commercial vehicle. Terms and Definitions “Collision severity”
A classification of a collision based on the most severe result of the collision, i.e., whether someone was killed (fatal), injured (injury) or property damage only (PDO) occurred.
“Fatal Collision”
A motor vehicle collision in which at least one person is killed as a result of the collision. The death must have occurred within thirty days of the collision occurrence.

Section 10 NSC Monitoring Report
188
“Injury Collision”
A motor vehicle collision in which at least one person has been recorded as sustaining some level of personal injury, but in which no one is fatally injured or killed. Levels of injury include: ‘major’ (admitted to hospital); ‘minor’ (treated and released from hospital); and, ‘minimal’ (no hospital treatment required).
“Property Damage Only (PDO) Collision”
A motor vehicle collision in which no injury or fatality is sustained and only property damage is the result.
“Light Duty Vehicles”
A classification of vehicle types including those defined in the Traffic Accident Report (TAR) as: passenger vehicles (automobile), mini/multi-purpose van, van under 4,500 kg and pick-up under 4,500 kg.
“NSC Commercial Vehicles”
The National Safety Code (NSC) is a classification of vehicle types including those defined in the Traffic Accident Report (TAR) as: “Truck greater than 4,500 kilograms (unit chassis)”, “Power Unit for Semi-Trailer”, “Truck (Other)” (where the type and size of truck is unknown), “School Bus”, “Transit Bus (Urban)”, “Inter-City Bus”, and “Bus (Other)”. These vehicles bear a National Safety Code Number and are entered onto the National Safety Code Collision Monitoring Report.
“Truck greater than 4,500 kilograms (unit chassis)”
A vehicle category that includes all straight trucks with a gross vehicle mass 4,500 kg and over on the vehicle registration. This does not include truck tractors with a fifth wheel assembly.
“Power Unit for Semi-Trailer”
A vehicle category that includes truck tractors used for the moving of cargo in or on a trailer by means of a fifth wheel connection. This does not include pickups equipped with a fifth wheel.
“Truck (Other)”
A vehicle category used if the type and size of truck is unknown.
“School Bus”
A vehicle category that includes a bus authorized for the transportation of students to or from school and related school activities.
“Transit Bus (Urban)”
A vehicle category that includes a bus used for commercial carrying of passengers within an urban area.
“Inter-City Bus”
A vehicle category that includes a bus licensed for inter-city or provincial travel.
“Bus (Other)”
A vehicle category that includes personal use of buses and bus type conversions, but does not include original equipment manufacturer type; for example, buses converted to motor homes.
“Contributing Factor”
Those circumstances or factors recorded as having contributed to the collision or its severity. Factors can be selected from four categories: driver action, human condition, vehicle condition, or environmental condition. The TAR allows for up to three contributing factors to be recorded for each driver or vehicle involved in the collision.
“At-fault Contributing Factor”
A contributing factor where some action or condition other than “driving properly” and “apparently normal” has been noted.
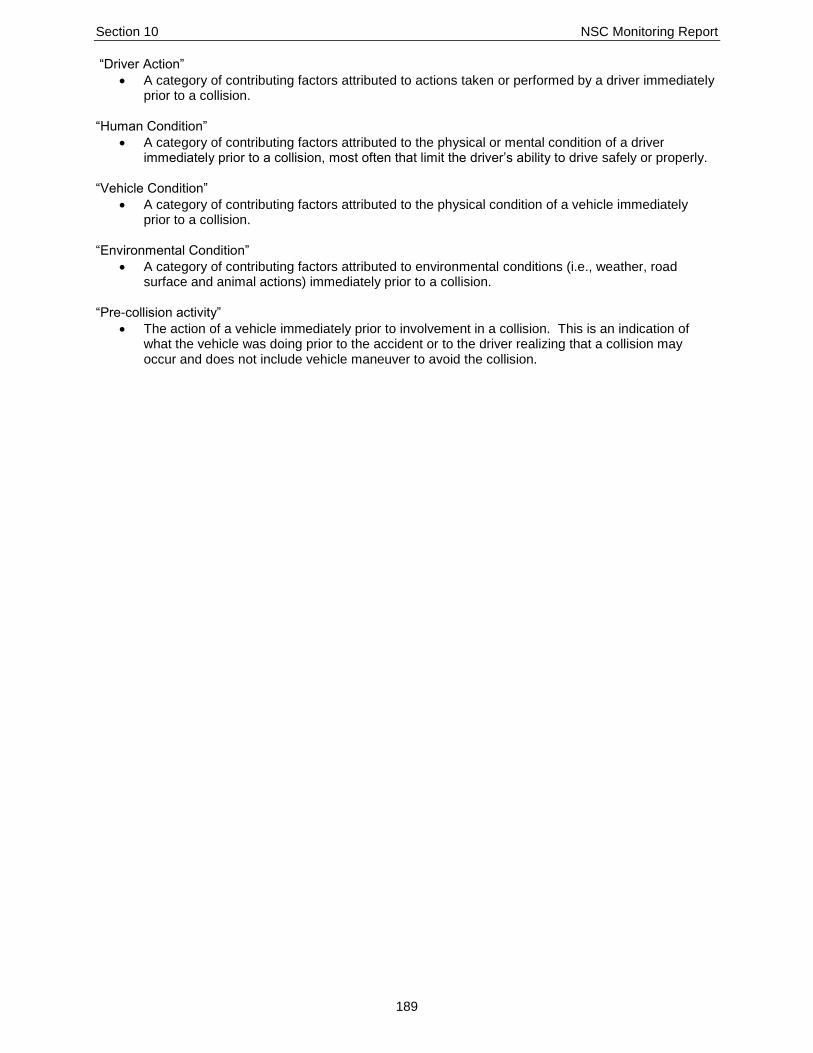
Section 10 NSC Monitoring Report
189
“Driver Action”
A category of contributing factors attributed to actions taken or performed by a driver immediately prior to a collision.
“Human Condition”
A category of contributing factors attributed to the physical or mental condition of a driver immediately prior to a collision, most often that limit the driver’s ability to drive safely or properly.
“Vehicle Condition”
A category of contributing factors attributed to the physical condition of a vehicle immediately prior to a collision.
“Environmental Condition”
A category of contributing factors attributed to environmental conditions (i.e., weather, road surface and animal actions) immediately prior to a collision.
“Pre-collision activity”
The action of a vehicle immediately prior to involvement in a collision. This is an indication of what the vehicle was doing prior to the accident or to the driver realizing that a collision may occur and does not include vehicle maneuver to avoid the collision.
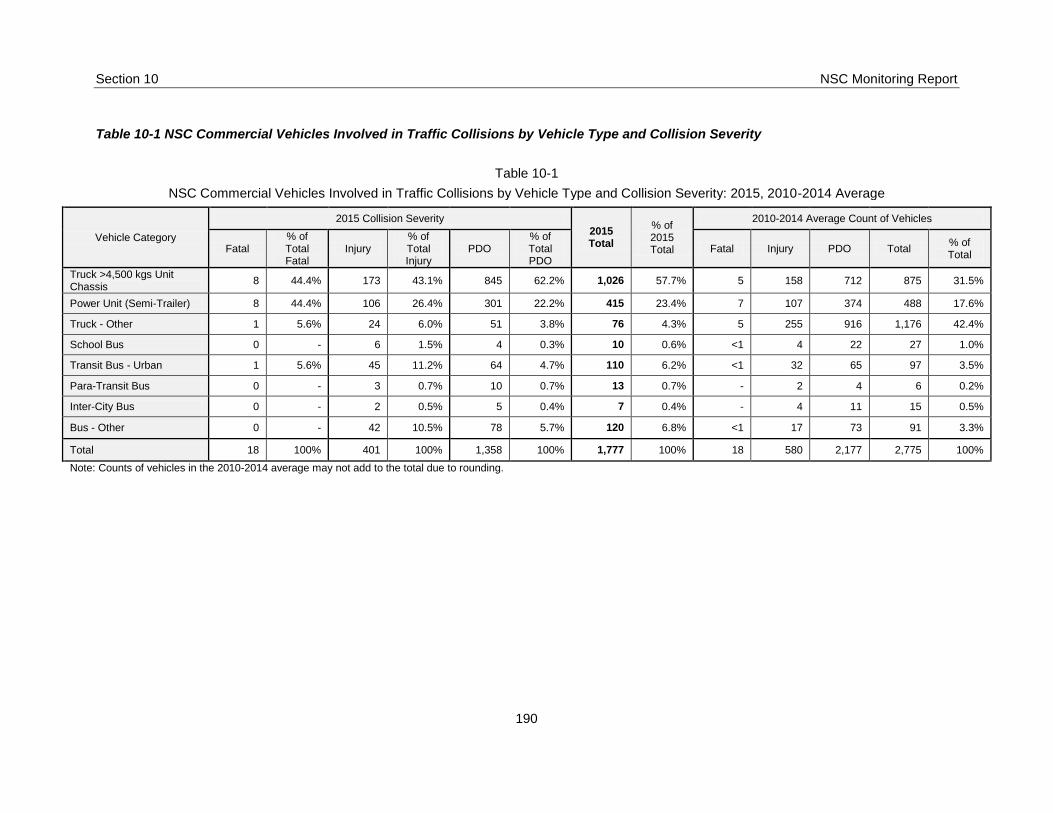
Section 10 NSC Monitoring Report
190
Table 10-1 NSC Commercial Vehicles Involved in Traffic Collisions by Vehicle Type and Collision Severity
Table 10-1
NSC Commercial Vehicles Involved in Traffic Collisions by Vehicle Type and Collision Severity: 2015, 2010-2014 Average
Vehicle Category
2015 Collision Severity
2015 Total
% of 2015 Total
2010-2014 Average Count of Vehicles
Fatal % of Total Fatal
Injury % of Total Injury
PDO % of Total PDO
Fatal Injury PDO Total % of Total
Truck >4,500 kgs Unit Chassis
8 44.4% 173 43.1% 845 62.2% 1,026 57.7% 5 158 712 875 31.5%
Power Unit (Semi-Trailer) 8 44.4% 106 26.4% 301 22.2% 415 23.4% 7 107 374 488 17.6%
Truck - Other 1 5.6% 24 6.0% 51 3.8% 76 4.3% 5 255 916 1,176 42.4%
School Bus 0 - 6 1.5% 4 0.3% 10 0.6% <1 4 22 27 1.0%
Transit Bus - Urban 1 5.6% 45 11.2% 64 4.7% 110 6.2% <1 32 65 97 3.5%
Para-Transit Bus 0 - 3 0.7% 10 0.7% 13 0.7% - 2 4 6 0.2%
Inter-City Bus 0 - 2 0.5% 5 0.4% 7 0.4% - 4 11 15 0.5%
Bus - Other 0 - 42 10.5% 78 5.7% 120 6.8% <1 17 73 91 3.3%
Total 18 100% 401 100% 1,358 100% 1,777 100% 18 580 2,177 2,775 100%
Note: Counts of vehicles in the 2010-2014 average may not add to the total due to rounding.

Section 10 NSC Monitoring Report
191
In 2015, there are 1,777 commercial vehicles involved in traffic collisions. Of these:
18 are involved in fatal collisions;
401 are involved in injury collisions; and,
1,358 are involved in PDO collisions. The number of NSC commercial vehicles involved in collisions in 2015 has decreased by 36% (a count of 998) compared to the previous five year (2010 to 2014) annual average. Compared to the previous five years, the number of NSC commercial vehicles in 2015 involved in:
Fatal collisions is unchanged;
Injury collisions decreased by 31% (a count of 179); and,
PDO collisions decreased by 38% (a count of 819). NOTE: For a detailed historical count of NSC Commercial Vehicles involved in traffic collisions occurring in each year from 2010 to 2014, please refer to “Table 10-5 Historical Summary of NSC Commercial Vehicles Involved in Traffic Collisions by Vehicle Type” at the end of this section.
Figure 10-1 Proportion of NSC Commercial Vehicles by Vehicle Type and Collision Severity
In 2015, trucks with a unit chassis greater than 4,500 kilograms and power units for semi-trailers combined account for 81% of the commercial vehicles involved in traffic collisions.
Power units for semi-trailers account for 8 of the 18 commercial vehicles involved in fatal collisions; and,
Trucks with unit chassis greater than 4,500 kilograms account for 8 of the 18 commercial vehicles involved in fatal collisions.
0%
10%
20%
30%
40%
50%
60%
70%
Truck >4,500KG Power Unit (Semi) Truck - Other Buses
Pro
po
rtio
n o
f To
tal
Proportion of NSC Commercial Vehicle Collisions by Vehicle Type and Collision Severity: 2015
Fatal Injury PDO Total Collisions

Section 10 NSC Monitoring Report
192
Table 10-2 Traffic Collision Victims by NSC Commercial Vehicle Type and Casualty Type
Table 10-2
Traffic Collision Victims by NSC Commercial Vehicle Type and Casualty Type: 2015
Vehicle Type
2015 Casualty Type
2015 Total
Victims
% of 2015 Total
Victims Killed
% of Total Killed
Serious Injury
% of Total
Serious Injury
Minor Injury
% of Total Minor Injury
Minimal Injury
% of Total Minimal Injury
Other Injury
% of Total Other Injury
Total Injured
% of Total
Injured
Truck >4,500 kgs Unit Chassis
9 42.9% 10 32.3% 36 27.1% 168 48.8% 9 32.1% 223 41.6% 232 41.7%
Power Unit (Semi-Trailer)
10 47.6% 14 45.2% 41 30.8% 71 20.6% 12 42.9% 138 25.7% 148 26.6%
Truck - Other 1 4.8% 1 3.2% 8 6.0% 24 7.0% 3 10.7% 36 6.7% 37 6.6%
School Bus 0 - 1 3.2% 5 3.8% 7 2.0% 1 3.6% 14 2.6% 14 2.5%
Transit Bus - Urban
1 4.8% 1 3.2% 17 12.8% 37 10.8% 2 7.1% 57 10.6% 58 10.4%
Para-Transit Bus 0 - 1 3.2% 1 0.8% 2 0.6% 0 - 4 0.7% 4 0.7%
Inter-City Bus 0 - 0 - 3 2.3% 1 0.3% 0 - 4 0.7% 4 0.7%
Bus - Other 0 - 3 9.7% 22 16.5% 34 9.9% 1 3.6% 60 11.2% 60 10.8%
Total 21 100% 31 100% 133 100% 344 100% 28 100% 536 100% 557 100%
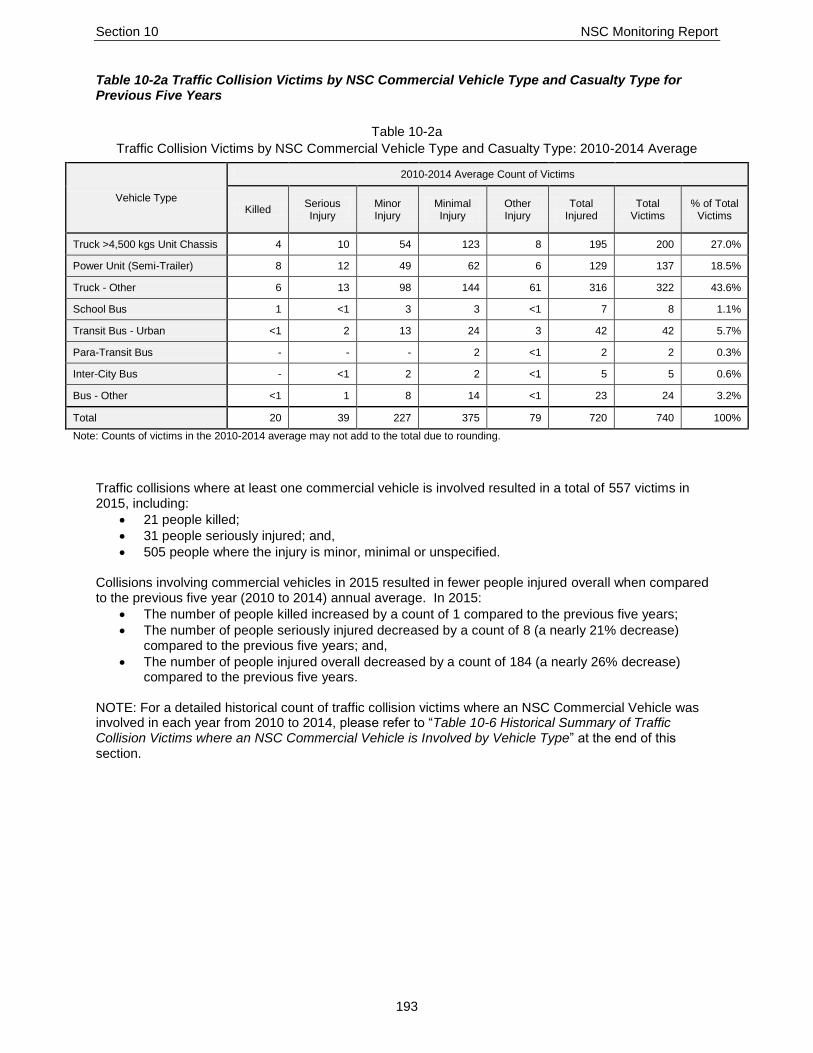
Section 10 NSC Monitoring Report
193
Table 10-2a Traffic Collision Victims by NSC Commercial Vehicle Type and Casualty Type for Previous Five Years
Table 10-2a
Traffic Collision Victims by NSC Commercial Vehicle Type and Casualty Type: 2010-2014 Average
Vehicle Type
2010-2014 Average Count of Victims
Killed Serious Injury
Minor Injury
Minimal Injury
Other Injury
Total Injured
Total Victims
% of Total Victims
Truck >4,500 kgs Unit Chassis 4 10 54 123 8 195 200 27.0%
Power Unit (Semi-Trailer) 8 12 49 62 6 129 137 18.5%
Truck - Other 6 13 98 144 61 316 322 43.6%
School Bus 1 <1 3 3 <1 7 8 1.1%
Transit Bus - Urban <1 2 13 24 3 42 42 5.7%
Para-Transit Bus - - - 2 <1 2 2 0.3%
Inter-City Bus - <1 2 2 <1 5 5 0.6%
Bus - Other <1 1 8 14 <1 23 24 3.2%
Total 20 39 227 375 79 720 740 100%
Note: Counts of victims in the 2010-2014 average may not add to the total due to rounding.
Traffic collisions where at least one commercial vehicle is involved resulted in a total of 557 victims in 2015, including:
21 people killed;
31 people seriously injured; and,
505 people where the injury is minor, minimal or unspecified. Collisions involving commercial vehicles in 2015 resulted in fewer people injured overall when compared to the previous five year (2010 to 2014) annual average. In 2015:
The number of people killed increased by a count of 1 compared to the previous five years;
The number of people seriously injured decreased by a count of 8 (a nearly 21% decrease) compared to the previous five years; and,
The number of people injured overall decreased by a count of 184 (a nearly 26% decrease) compared to the previous five years.
NOTE: For a detailed historical count of traffic collision victims where an NSC Commercial Vehicle was involved in each year from 2010 to 2014, please refer to “Table 10-6 Historical Summary of Traffic Collision Victims where an NSC Commercial Vehicle is Involved by Vehicle Type” at the end of this section.

Section 10 NSC Monitoring Report
194
Figure 10-2 Proportion of Victims Involved in Collisions with NSC Commercial Vehicles by Vehicle Type and Casualty Type
In 2015, collisions involving trucks with unit chassis greater than 4,500 kilograms along with power units for semi-trailers make up the largest proportions of NSC vehicles involved where someone is killed (19 of 21 people killed) or seriously injured (77%).
0%
10%
20%
30%
40%
50%
60%
Truck >4,500 kgs Unit Chassis Power Unit (Semi-Trailer) Truck - Other Buses
Pro
po
rtio
n o
f To
tal
Proportion of Victims Involved in Collisions with Commercial Vehicles by Vehicle Type and Casualty Type: 2015
Killed Injured Total Victims

Section 10 NSC Monitoring Report
195
Table 10-3 Commercial Vehicle Involvement in Traffic Collisions by Pre-Collision Activity and Collision Severity
Table 10-3
NSC Commercial Vehicles Involved in Traffic Collisions by Pre-Collision Activity and Collision Severity: 2015, 2010-2014 Average
Pre-Collision Activity
2015 Collision Severity
2015 Total
% of 2015 Total
2010-2014 Average Count of Vehicles
Fatal % of Total Fatal
Injury % of Total Injury
PDO % of Total PDO
Fatal Injury PDO Total % of Total
Going Straight Ahead 14 77.8% 127 31.7% 445 32.8% 586 33.0% 11 248 842 1,101 39.7%
Turning Left 2 11.1% 18 4.5% 52 3.8% 72 4.1% <1 38 127 166 6.0%
Turning Right 0 - 8 2.0% 32 2.4% 40 2.3% 1 16 93 111 4.0%
Making U Turn 0 - 2 0.5% 4 0.3% 6 0.3% - 1 6 8 0.3%
Changing Lanes – Left 0 - 1 0.2% 8 0.6% 9 0.5% - 4 30 34 1.2%
Changing Lanes – Right 0 - 5 1.2% 21 1.5% 26 1.5% - 6 29 35 1.2%
Merging 0 - 1 0.2% 3 0.2% 4 0.2% <1 4 18 23 0.8%
Reversing 0 - 6 1.5% 117 8.6% 123 6.9% - 5 118 122 4.4%
Overtaking 0 - 0 - 0 - 0 - <1 2 8 10 0.3%
Slowing/Stopping on Roadway 0 - 11 2.7% 36 2.7% 47 2.6% <1 21 65 87 3.1%
Stopped in Traffic 0 - 29 7.2% 72 5.3% 101 5.7% <1 55 177 232 8.4%
Starting in Traffic 1 5.6% 9 2.2% 12 0.9% 22 1.2% - 7 18 25 0.9%
Leave Parking Position/Roadside 0 - 1 0.2% 5 0.4% 6 0.3% - 1 6 7 0.3%
Enter Parking Position/Roadside 0 - 2 0.5% 6 0.4% 8 0.5% - <1 9 10 0.3%
Parked Legally 0 - 1 0.2% 22 1.6% 23 1.3% <1 4 69 73 2.6%
Parked Illegally 0 - 0 - 0 - 0 - - <1 3 3 0.1%
Swerving 0 - 2 0.5% 6 0.4% 8 0.5% <1 3 10 14 0.5%
Other 0 - 1 0.2% 20 1.5% 21 1.2% <1 3 16 20 0.7%
Not Applicable/Unknown 1 5.6% 177 44.1% 497 36.6% 675 38.0% 3 160 532 695 25.0%
Total 18 100% 401 100% 1,358 100% 1,777 100% 18 580 2,177 2,775 100%
Note: Counts of vehicles in the 2010-2014 average may not add to the total due to rounding.

Section 10 NSC Monitoring Report
196
In 2015, most NSC commercial vehicles involved in a collision were “going straight ahead” when the collision occurred (33% of NSC vehicles involved in collisions; 78% of NSC vehicles involved in fatal collisions; 32% of NSC vehicles involved in injury collisions; and 33% of NSC vehicles involved in PDO collisions). In the previous five year (2010 to 2014) annual average, “going straight ahead” was noted as the pre-collision action for 40% of all commercial vehicles involved in a collision. Other noteworthy pre-collision actions for commercial vehicles involved in collisions in 2015 include:
Stopped or stopping (“stopped in traffic” and “slowing/stopping on roadway” combined) – 8%;
Reversing – 7% of all collisions; and,
Turning (“turning left” and “turning right” combined) – 6%. Considering fatal collisions, there are very few pre-collision actions noted in 2015. “Going straight ahead” was noted for 14 of 18 vehicles involved in a fatal collision. “Turning left” was noted for two NSC vehicles involved in a fatal crash, while one was “starting in traffic”. Commercial vehicles involved in injury collisions in 2015 were noted most often as “going straight ahead” (32%). Other pre-collision actions of commercial vehicles involved in injury collisions include:
Stopped or stopping (“stopped in traffic” and slowing/stopping on roadway” combined) – 10%;
Turning (“turning left” and “turning right” combined) – nearly 7%;
Starting in traffic – 2%; and,
Changing lanes (left or right) – nearly 2%.

Section 10 NSC Monitoring Report
197
Table 10-4 NSC Commercial Vehicles Involved in Traffic Collisions by Contributing Factors and Collision Severity
Table 10-4
NSC Commercial Vehicles Involved in Traffic Collisions by Contributing Factors and Collision Severity: 2015
Contributing Factor
2015 Collision Severity
2015 Total
% of 2015 Total Fatal
% of Total Fatal
Injury % of Total
Injury PDO
% of Total PDO
Driver Action - Driving Properly and Human Condition - Apparently Normal
11 61.1% 190 47.4% 624 45.9% 825 46.4%
Driver Action - Driving properly 0 - 12 3.0% 24 1.8% 36 2.0%
Any Driver Action 6 33.3% 124 30.9% 453 33.4% 583 32.8%
Follow too closely 0 - 43 10.7% 67 4.9% 110 6.2%
Turning improperly 1 5.6% 12 3.0% 41 3.0% 54 3.0%
Passing improperly 0 - 2 0.5% 1 <0.1% 3 0.2%
Changing lanes improperly 0 - 9 2.2% 40 2.9% 49 2.8%
Fail to yield right of way 1 5.6% 13 3.2% 25 1.8% 39 2.2%
Disobey traffic control device/officer 1 5.6% 2 0.5% 5 0.4% 8 0.5%
Drive wrong way on roadway 0 - 0 - 0 - 0 -
Passing a vehicle at pedestrian X-walk 0 - 0 - 0 - 0 -
Back unsafely 0 - 6 1.5% 118 8.7% 124 7.0%
Parking improperly 0 - 0 - 4 0.3% 4 0.2%
Lost control/Drive off road 1 5.6% 5 1.2% 18 1.3% 24 1.4%
Driverless vehicle ran out of control 0 - 0 - 0 - 0 -
Leave stop sign before safe to do so 1 5.6% 5 1.2% 7 0.5% 13 0.7%
Failed to signal 0 - 0 - 0 - 0 -
Take avoiding action 0 - 2 0.5% 7 0.5% 9 0.5%
Driver inexperience 1 5.6% 0 - 4 0.3% 5 0.3%
Pedestrian error/confusion 0 - 0 - 0 - 0 -
NET Speed 1 5.6% 11 2.7% 43 3.2% 55 3.1%
Exceeding speed limit 0 - 0 - 0 - 0 -
Driving too fast for conditions 1 5.6% 11 2.7% 41 3.0% 53 3.0%
Unsafe operating speed (Too fast or too slow) 0 - 0 - 2 0.1% 2 0.1%
NET Distracted driving 3 16.7% 36 9.0% 179 13.2% 218 12.3%
Careless Driving 2 11.1% 32 8.0% 167 12.3% 201 11.3%
Distraction/Inattention 1 5.6% 4 1.0% 15 1.1% 20 1.1%
(continued on next page)

Section 10 NSC Monitoring Report
198
(continued from previous page)
Contributing Factor
2015 Collision Severity
2015 Total
% of 2015 Total Fatal
% of Total Fatal
Injury % of Total
Injury PDO
% of Total PDO
Human Condition - Apparently Normal 4 22.2% 32 8.0% 195 14.4% 231 13.0%
Any Human Condition 0 - 2 0.5% 0 - 2 0.1%
Loss of consciousness/Blackout prior to collision 0 - 0 - 0 - 0 -
Extreme fatigue/Fell asleep 0 - 2 0.5% 0 - 2 0.1%
Defective eyesight 0 - 0 - 0 - 0 -
Defective hearing 0 - 0 - 0 - 0 -
Medical disability 0 - 0 - 0 - 0 -
Physical disability 0 - 0 - 0 - 0 -
Mental disability 0 - 0 - 0 - 0 -
Mental confusion/Inability to remember 0 - 0 - 0 - 0 -
Sudden illness 0 - 0 - 0 - 0 -
Exceed hours of service (commercial drivers only) 0 - 0 - 0 - 0 -
NET Impaired 0 - 0 - 0 - 0 -
Ability impaired alcohol 0 - 0 - 0 - 0 -
Ability impaired drugs 0 - 0 - 0 - 0 -
Had been drinking/Suspected alcohol use 0 - 0 - 0 - 0 -
No apparent (vehicle) defect 15 83.3% 218 54.4% 774 57.0% 1,007 56.7%
Any Vehicle Defect 0 - 5 1.2% 32 2.4% 37 2.1%
Defective brakes 0 - 0 - 2 0.1% 2 0.1%
Defective steering 0 - 2 0.5% 1 <0.1% 3 0.2%
Defective headlights 0 - 0 - 0 - 0 -
Defective brakelights 0 - 0 - 0 - 0 -
Defective lighting (unspecified) 0 - 0 - 0 - 0 -
Defective engine controls/drive train 0 - 0 - 0 - 0 -
Defective suspension/wheels 0 - 0 - 5 0.4% 5 0.3%
Defective tires 0 - 0 - 4 0.3% 4 0.2%
Tow hitch/yoke defective 0 - 0 - 5 0.4% 5 0.3%
Defective exhaust system 0 - 0 - 0 - 0 -
Hood/tailgate/door/covering opened 0 - 1 0.2% 0 - 1 <0.1%
Defective glazing (obscured windows) 0 - 0 - 0 - 0 -
Vehicle modifications 0 - 0 - 0 - 0 -
Fire 0 - 0 - 0 - 0 -
Overloaded/oversized 0 - 1 0.2% 1 <0.1% 2 0.1%
(continued on next page)

Section 10 NSC Monitoring Report
199
(continued from previous page)
Contributing Factor
2015 Collision Severity
2015 Total
% of 2015 Total Fatal
% of Total Fatal
Injury % of Total
Injury PDO
% of Total PDO
Load shifted/spilled 0 - 1 0.2% 6 0.4% 7 0.4%
Jack-knife/trailer swing 0 - 0 - 7 0.5% 7 0.4%
Hydroplaning tires 0 - 0 - 1 <0.1% 1 <0.1%
Any Environmental Condition 0 - 12 3.0% 62 4.6% 74 4.2%
Animal action - Wild 0 - 1 0.2% 32 2.4% 33 1.9%
Animal action - Domestic 0 - 0 - 0 - 0 -
Slippery road surface 0 - 5 1.2% 15 1.1% 20 1.1%
Snow drift 0 - 0 - 1 <0.1% 1 <0.1%
Obstruction/debris on roadway 0 - 0 - 3 0.2% 3 0.2%
View obstructed/limited 0 - 2 0.5% 4 0.3% 6 0.3%
Glare/reflection 0 - 1 0.2% 0 - 1 <0.1%
Construction zone 0 - 0 - 0 - 0 -
Defective driving surface 0 - 0 - 2 0.1% 2 0.1%
Shoulders defective 0 - 1 0.2% 1 <0.1% 2 0.1%
Lane markings inadequate 0 - 0 - 0 - 0 -
Defective/inoperative traffic control device 0 - 0 - 0 - 0 -
Weather 0 - 3 0.7% 6 0.4% 9 0.5%
Pedestrian corridor in use 0 - 0 - 0 - 0 -
Uninvolved vehicle 0 - 0 - 0 - 0 -
Uninvolved pedestrian 0 - 0 - 0 - 0 -
Presence of prior accident 0 - 0 - 0 - 0 -
No Contributing Factor(s) Identified 0 - 56 14.0% 128 9.4% 184 10.4%
Not Applicable/Not Stated 0 - 2 0.5% 5 0.4% 7 0.4%
Total 18 100.0% 401 100.0% 1,358 100% 1,777 100.0%
*NOTE: Each vehicle and/or driver involved in a collision can have up to three contributing factors noted. Because multiple factors can be noted, the counts and percentages under each collision severity will add to more than the total. An exception to this is the factors “Driver Action – Driving Properly and Human Condition – Apparently Normal”, "Driver Action – Driving Properly” and “Human Condition – Apparently Normal”, which are mutually exclusive and can be added to determine a “Driver not at-fault” total.

Section 10 NSC Monitoring Report
200
Table 10-4a NSC Commercial Vehicles Involved in Traffic Collisions by Contributing Factors and
Collision Severity for the Previous Five Years
Table 10-4a
NSC Commercial Vehicles Involved in Traffic Collisions by Contributing Factors and Collision Severity: 2010-2014 Average
Contributing Factor
2010-2014 Average Count of Vehicles
Fatal Injury PDO Total
Vehicles
% of Total
Vehicles
Driver Action - Driving Properly and Human Condition - Apparently Normal
8 218 770 996 35.9%
Driver Action - Driving properly 1 17 78 96 3.4%
Any Driver Action 6 136 491 633 22.8%
Follow too closely <1 39 78 117 4.2%
Turning improperly <1 10 55 65 2.3%
Passing improperly <1 2 11 13 0.5%
Changing lanes improperly - 6 42 48 1.7%
Fail to yield right of way <1 18 41 59 2.1%
Disobey traffic control device/officer <1 5 12 18 0.6%
Drive wrong way on roadway <1 <1 <1 1 <0.1%
Passing a vehicle at pedestrian X-walk - - - - -
Back unsafely - 5 90 95 3.4%
Parking improperly - <1 3 4 0.1%
Lost control/Drive off road 1 12 24 37 1.3%
Driverless vehicle ran out of control - - <1 <1 <0.1%
Leave stop sign before safe to do so <1 6 10 17 0.6%
Failed to signal - - <1 <1 <0.1%
Take avoiding action <1 4 17 21 0.7%
Driver inexperience - 2 8 10 0.4%
Pedestrian error/confusion <1 <1 <1 1 <0.1%
NET Speed 2 20 50 71 2.6%
Exceeding speed limit <1 1 1 3 0.1%
Driving too fast for conditions 1 14 44 59 2.1%
Unsafe operating speed (Too fast or too slow) <1 5 4 9 0.3%
NET Distracted driving 2 27 112 142 5.1%
Careless Driving 1 18 74 93 3.4%
Distraction/Inattention <1 10 41 51 1.8%
Human Condition - Apparently Normal 3 71 254 328 11.8%
Any Human Condition 2 15 47 64 2.3%
Loss of consciousness/Blackout prior to collision - 1 1 3 <0.1%
Extreme fatigue/Fell asleep - 2 3 4 0.2%
Defective eyesight - - <1 <1 <0.1%
Defective hearing - - - - -
Medical disability - <1 <1 <1 <0.1%
Physical disability - - - - -
Mental disability <1 - - <1 <0.1%
Mental confusion/Inability to remember - <1 - <1 <0.1%
Sudden illness - <1 <1 <1 <0.1%
Exceed hours of service (commercial drivers only) - - - - -
NET Impaired 1 2 5 9 0.3%
Ability impaired alcohol 1 2 4 7 0.2%
Ability impaired drugs - - <1 <1 <0.1%
Had been drinking/Suspected alcohol use <1 <1 1 2 <0.1%
(continued on next page)

Section 10 NSC Monitoring Report
201
(continued from previous page)
Contributing Factor
2010-2014 Average Count of Vehicles
Fatal Injury PDO Total
Vehicles
% of Total
Vehicles
No apparent (vehicle) defect 11 271 907 1,189 42.8%
Any Vehicle Defect <1 6 29 35 1.3%
Defective brakes <1 1 3 4 0.1%
Defective steering - <1 <1 <1 <0.1%
Defective headlights - - - - -
Defective brakelights - - <1 <1 <0.1%
Defective lighting (unspecified) - <1 <1 <1 <0.1%
Defective engine controls/drive train - <1 <1 1 <0.1%
Defective suspension/wheels - - 1 1 <0.1%
Defective tires - 1 6 7 0.2%
Tow hitch/yoke defective - - 2 2 <0.1%
Defective exhaust system - - <1 <1 <0.1%
Hood/tailgate/door/covering opened - - <1 <1 <0.1%
Defective glazing (obscured windows) - - <1 <1 <0.1%
Vehicle modifications - - <1 <1 <0.1%
Fire - - <1 <1 <0.1%
Overloaded/oversized - <1 1 1 <0.1%
Load shifted/spilled - 1 5 6 0.2%
Jack-knife/trailer swing <1 <1 8 9 0.3%
Hydroplaning tires - <1 - <1 <0.1%
Any Environmental Condition 1 41 272 315 11.4%
Animal action - Wild - 7 159 166 6.0%
Animal action - Domestic - <1 7 8 0.3%
Slippery road surface <1 20 63 84 3.0%
Snow drift - 1 8 9 0.3%
Obstruction/debris on roadway - 1 8 9 0.3%
View obstructed/limited <1 4 13 16 0.6%
Glare/reflection - 1 2 3 0.1%
Construction zone - <1 2 3 <0.1%
Defective driving surface - 3 4 7 0.3%
Shoulders defective - <1 1 2 <0.1%
Lane markings inadequate - - <1 <1 <0.1%
Defective/inoperative traffic control device <1 <1 <1 1 <0.1%
Weather <1 5 16 21 0.8%
Pedestrian corridor in use - <1 <1 <1 <0.1%
Uninvolved vehicle - <1 3 4 0.1%
Uninvolved pedestrian - - <1 <1 <0.1%
Presence of prior accident - <1 <1 1 <0.1%
No Contributing Factor(s) Identified 1 162 550 713 25.7%
Not Applicable/Not Stated - - <1 <1 <0.1%
Total 18 580 2,177 2,775 100%
Note: Counts of vehicles in the 2010-2014 average may not add to the total due to rounding. *NOTE: Each vehicle and/or driver involved in a collision can have up to three contributing factors noted. Because multiple factors can be noted, the counts and percentages under each collision severity will add to more than the total. An exception to this is the factors “Driver Action – Driving Properly and Human Condition – Apparently Normal”, "Driver Action – Driving Properly” and “Human Condition – Apparently Normal”, which are mutually exclusive and can be added to determine a “Driver not at-fault” total.
In 2015, six in ten drivers of NSC vehicles involved in a collision are noted as driving properly and being in a normal human condition, including 46% as both “driving properly” and “apparently normal”, 2% as “driving properly” and 13% as “apparently normal” human condition. Over the previous five year (2010 to 2014) annual average, half (51%) of commercial drivers involved in collisions are noted as driving properly and being in a normal human condition.
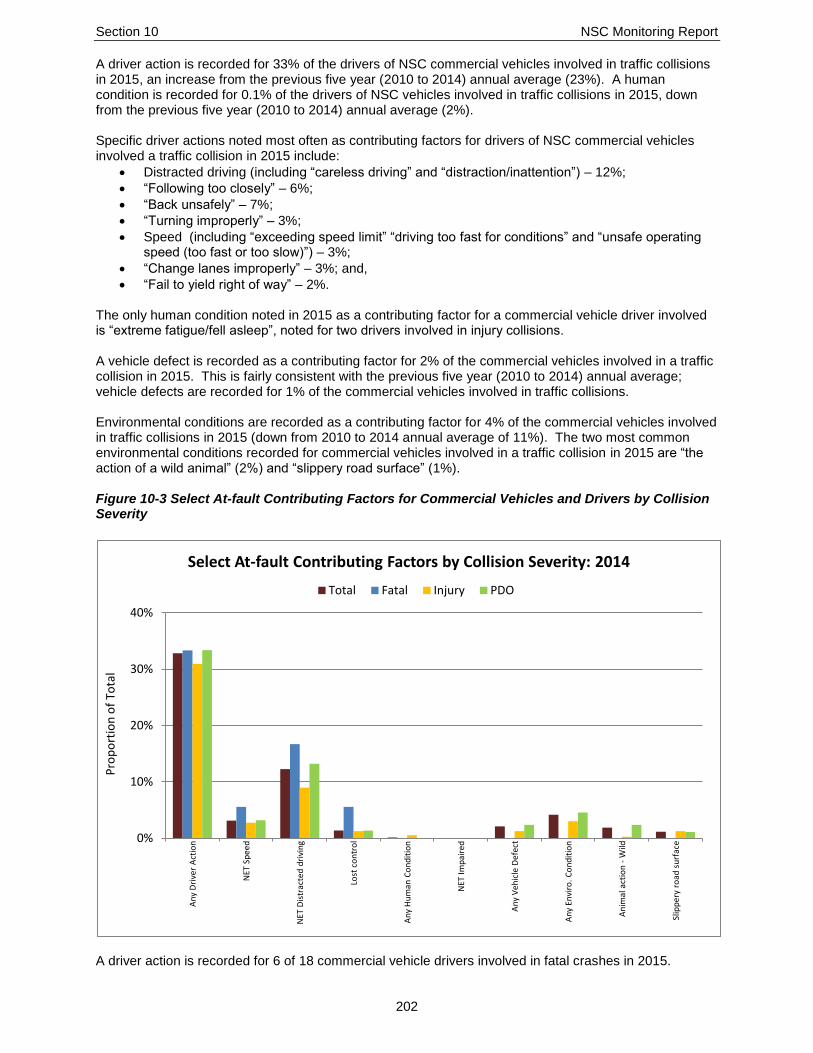
Section 10 NSC Monitoring Report
202
A driver action is recorded for 33% of the drivers of NSC commercial vehicles involved in traffic collisions in 2015, an increase from the previous five year (2010 to 2014) annual average (23%). A human condition is recorded for 0.1% of the drivers of NSC vehicles involved in traffic collisions in 2015, down from the previous five year (2010 to 2014) annual average (2%). Specific driver actions noted most often as contributing factors for drivers of NSC commercial vehicles involved a traffic collision in 2015 include:
Distracted driving (including “careless driving” and “distraction/inattention”) – 12%;
“Following too closely” – 6%;
“Back unsafely” – 7%;
“Turning improperly” – 3%;
Speed (including “exceeding speed limit” “driving too fast for conditions” and “unsafe operating speed (too fast or too slow)”) – 3%;
“Change lanes improperly” – 3%; and,
“Fail to yield right of way” – 2%. The only human condition noted in 2015 as a contributing factor for a commercial vehicle driver involved is “extreme fatigue/fell asleep”, noted for two drivers involved in injury collisions. A vehicle defect is recorded as a contributing factor for 2% of the commercial vehicles involved in a traffic collision in 2015. This is fairly consistent with the previous five year (2010 to 2014) annual average; vehicle defects are recorded for 1% of the commercial vehicles involved in traffic collisions. Environmental conditions are recorded as a contributing factor for 4% of the commercial vehicles involved in traffic collisions in 2015 (down from 2010 to 2014 annual average of 11%). The two most common environmental conditions recorded for commercial vehicles involved in a traffic collision in 2015 are “the action of a wild animal” (2%) and “slippery road surface” (1%). Figure 10-3 Select At-fault Contributing Factors for Commercial Vehicles and Drivers by Collision Severity
A driver action is recorded for 6 of 18 commercial vehicle drivers involved in fatal crashes in 2015.
0%
10%
20%
30%
40%
An
y D
rive
r A
ctio
n
NET
Sp
eed
NET
Dis
trac
ted
dri
vin
g
Lost
co
ntr
ol
An
y H
um
an C
on
dit
ion
NET
Imp
aire
d
An
y V
ehic
le D
efec
t
An
y En
viro
. C
on
dit
ion
An
imal
act
ion
- W
ild
Slip
per
y ro
ad s
urf
ace
Pro
po
rtio
n o
f To
tal
Select At-fault Contributing Factors by Collision Severity: 2014
Total Fatal Injury PDO

Section 10 NSC Monitoring Report
203
Table 10-5 Historical Summary of NSC Commercial Vehicles Involved in Traffic Collisions by Vehicle Type
Table 10-5
Historical Summary of NSC Commercial Vehicles Involved in Traffic Collisions by Vehicle Type: 2010 to 2015
Vehicle Category
2010 Total
% of 2010 Total
2011 Total
% of 2011 Total
2012 Total
% of 2012 Total
2013 Total
% of 2013 Total
2014 Total
% of 2014 Total
2015 Total
% of 2015 Total
Truck >4,500 kgs Unit Chassis 543 12.8% 721 17.4% 932 55.6% 1,097 57.4% 1,082 57.0% 1,026 57.7%
Power Unit (Semi-Trailer) 506 11.9% 546 13.2% 419 25.0% 471 24.7% 500 26.4% 415 23.4%
Truck - Other 2,961 69.7% 2,654 64.0% 88 5.3% 95 5.0% 80 4.2% 76 4.3%
School Bus 90 2.1% 44 1.1% 0 - 1 <0.1% 1 <0.1% 10 0.6%
Transit Bus - Urban 96 2.3% 90 2.2% 101 6.0% 102 5.3% 98 5.2% 110 6.2%
Para-Transit Bus 1 <0.1% 8 0.2% 8 0.5% 6 0.3% 5 0.3% 13 0.7%
Inter-City Bus 26 0.6% 23 0.6% 8 0.5% 7 0.4% 10 0.5% 7 0.4%
Bus - Other 24 0.6% 58 1.4% 120 7.2% 131 6.9% 121 6.4% 120 6.8%
Total 4,247 100% 4,144 100% 1,676 100% 1,910 100% 1,897 100% 1,777 100%

Section 10 NSC Monitoring Report
204
Table 10-6 Historical Summary of Traffic Collision Victims by NSC Commercial Vehicle Type
Table 10-6
Historical Summary of Traffic Collision Victims (Killed and Injured, Combined) by NSC Commercial Vehicle Type: 2010 to 2015
Vehicle Category
2010 Total
% of 2010 Total
2011 Total
% of 2011 Total
2012 Total
% of 2012 Total
2013 Total
% of 2013 Total
2014 Total
% of 2014 Total
2015 Total
% of 2015 Total
Truck >4,500 kgs Unit Chassis 131 11.7% 147 14.0% 196 42.7% 265 49.4% 260 48.6% 232 41.7%
Power Unit (Semi-Trailer) 112 10.0% 113 10.8% 155 33.8% 143 26.7% 162 30.3% 148 26.6%
Truck - Other 819 73.0% 702 67.0% 22 4.8% 33 6.2% 35 6.5% 37 6.6%
School Bus 19 1.7% 17 1.6% 0 - 5 0.9% 1 0.2% 14 2.5%
Transit Bus - Urban 30 2.7% 41 3.9% 55 12.0% 46 8.6% 38 7.1% 58 10.4%
Para-Transit Bus 0 - 2 0.2% 5 1.1% 2 0.4% 1 0.2% 4 0.7%
Inter-City Bus 5 0.4% 13 1.2% 3 0.7% 2 0.4% 1 0.2% 4 0.7%
Bus - Other 6 0.5% 12 1.1% 23 5.0% 40 7.5% 37 6.9% 60 10.8%
Total 1,122 100% 1,047 100% 459 100% 536 100% 535 100% 557 100%
NOTE: Information in Table 10-6 includes all victims of collisions where an NSC commercial vehicle is involved, not only victims from the NSC vehicle.

SECTION 11 – Off-Road Vehicle Collisions


Section 11 Off-Road Vehicle Collisions
207
Introduction This section counts the number of off-road vehicle (ORV) collisions in Manitoba and provides detail for collisions of different severity: fatal, injury and property damage only (PDO). Information regarding the number of ORV collisions, victims, vehicles and drivers involved over the four year period 2012 to 2015 is presented. Details are provided for 2015 ORV collisions in terms of the month of occurrence, day of the week, time of day, weather and road conditions, location, and type of collision. Data for ORV collisions are drawn from Traffic Accident Reports (TARs) generated by Manitoba Public Insurance as part of the claim process and from law enforcement agencies when they complete an accident report. Key Highlights In 2015, there are 269 off-road vehicle collisions, involving 67 victims, 303 vehicles and 300 drivers. Of these:
7 are fatal collisions, involving 8 vehicles and 8 drivers, resulting in 7 people killed and 0 injured;
53 are injury collisions, involving 63 vehicles and 63 drivers, resulting in 60 people injured; and,
209 are PDO collisions, involving 232 vehicles and 229 drivers. In 2015, ORV collisions occur most often:
During the months from January through June, representing 168 of 269 collisions (nearly 63%).
On weekends (Friday, Saturday and Sunday), representing 191 of 269 (71%) collisions.
During daylight, representing 166 of 269 (62%) collisions.
In the Eastern Region of Manitoba, representing 142 of 269 (53%) collisions.
With drivers under the age of 45, 189 of 279 drivers (where age is known) involved in ORV collisions (68%).
Notwithstanding the overall collision trends, fatal ORV collisions in 2015 occur most often:
On weekends (Friday, Saturday and Sunday), representing 5 of 7 fatal collisions (71%).
Between noon and midnight, 5 of 7 fatal collisions (71%).
In the South Central and Eastern Regions of Manitoba combined, accounting for 5 of 7 fatal collisions (71%).
Major Elements Examined Counts of off-road vehicle (ORV) collisions in Manitoba for 2015 and previous years are taken from Traffic Accident Reports compiled by Manitoba Public Insurance. These counts are presented for all reportable ORV collisions, fatal collisions, injury collisions and property damage only (PDO) collisions. ORV collisions are maintained in a separate database from roadway collisions. As ORV collisions occur primarily outside of roadways and road rights-of-way, most of them are not valid for inclusion in the public roadway Traffic Accident Database. However, some ORV collisions are included in the Traffic Accident Database (if they occur on a public roadway and involve a vehicle that normally operates on public roadways); therefore, statistics between this and other sections of this report are not additive. Collisions, victims, vehicles and drivers are presented separately at the beginning of this section with counts provided for the years 2012 through 2015. The remainder of this section explores ORV collisions occurring in 2015 and provides average counts of collisions for the time period of 2012 to 2014 as a comparison. It is important to note that the number of fatal or injury collisions is not equal to the number of fatal or injured victims as each collision can result in multiple victims. Likewise, the number of vehicles involved is not necessarily equal to the number of drivers involved as a driverless vehicle could be involved in a collision. No statistics are calculated for off-road vehicle involvement rates due to the fact that no reliable base population count of off-road vehicles is available. Similarly, it is difficult to establish a base count of actual riders/operators, making it difficult to calculate driver involvement rates.

Section 11 Off-Road Vehicle Collisions
208
“Drivers” in this section refers to the number of drivers of off-road vehicles involved in collisions. It excludes pedestrians, other types of vehicles, and driverless vehicles. In ORV collisions, there are few driverless vehicles involved, but still some. The terms ‘crash’, ‘collision’ and ‘accident’ are used interchangeably in this report. The terms ‘fatality’ and ‘killed’ are used interchangeably in this report. The reader is cautioned that not all percentages and calculations in the following tables will add to 100% of the total noted. Rounding error will often produce a difference of one or two percentage points. Likewise, average calculations are presented for historical data from the years 2012 to 2014. Rounding error in these calculations will cause individual average counts not to add to total average counts in some cases. When reviewing the “Contributing Factors” for a traffic collision, the reader is cautioned to note that more than one contributing factor can be recorded for each collision. The total count of contributing factors noted will add to more than the number of collisions, vehicles or victims in those crashes. Terms and Definitions “Off-road Vehicle (ORV)”
One of several vehicle types designed for off-road use. It includes snowmobiles, off-road motorcycles, all-terrain vehicles (ATVs), amphibious vehicles, dune/sport buggies, and 4-wheel drive vehicles operated off-road.
“Reportable ORV Collision”
ORV collisions resulting in a fatality, injury or property damage in excess of $1,000 are required by law to be reported to a law enforcement agency. Subsequently, the law enforcement agency completes a Traffic Accident Report (TAR) for the collision. This report deals with these reportable ORV collisions and the TARs arising from them.
“ATV”
All Terrain Vehicle; includes vehicles with 3, 4 and 6 wheels. “Collision severity”
A classification of a collision based on the most severe result of the collision, i.e., whether someone was killed (fatal), injured (injury) or property damage only (PDO) occurred.
“Fatal Collision”
A motor vehicle collision in which at least one person is killed as a result of the collision. The death must have occurred within thirty days of the collision occurrence.
“Injury Collision”
A motor vehicle collision in which at least one person has been recorded as sustaining some level of personal injury, but in which no one is fatally injured or killed.
“Property Damage Only (PDO) Collision”
A motor vehicle collision in which no injury or fatality is sustained and only property damage is the result.
“Casualty Type”
A classification of the severity of the injury sustained by a victim in a traffic collision, i.e., whether someone was killed or injured. This classification also includes a designation for the severity of each non-fatal (i.e., people injured but not killed) injury sustained.

Section 11 Off-Road Vehicle Collisions
209
“Killed”
The casualty type “killed” indicates where the victim involved in the traffic collision died as a result of their injuries within thirty days of the collision occurrence.
“Injured”
The casualty type “injured” indicates where the victim sustained some level of personal injury, but in which they were not killed. Levels of injury include: ‘serious’ or ‘major’ (admitted to hospital); ‘minor’ (treated and released from hospital); and, ‘minimal’ (no hospital treatment required). ‘Other’ injury is noted when the severity of the victim’s injuries is not known or recorded in the TAR.
“Collision Type”
Refers to the object struck by a motor vehicle during a collision (including: a pedestrian, another motor vehicle, a train, a motorcycle, a bicycle, an animal, and fixed objects) or to what happened to the vehicle in a single-vehicle collision (including: overturned on roadway and ran off roadway).
“Light Condition”
Describes the light conditions at the scene of the accident, including: o Day – the light conditions which normally occur between one half hour after sunrise and
one half hour before sunset; o Dawn – the light conditions which normally occur between one half hour before sunrise
and one half hour after sunrise; o Dusk – the light conditions which normally occur between one half hour before sunset
and one half hour after sunset; o Dark – the light conditions which normally occur between one half hour after sunset and
one half hour before sunrise; and, o Artificial lighting – artificial illumination devices were functioning at the accident site under
light conditions which normally occur between one half hour after sunset and one half hour before sunrise.
“Weather Condition”
Describes the weather conditions prevalent at the time of the accident, including: o Clear – bright conditions, without precipitation or airborne matter, are recorded as clear; o Cloudy – dull, overcast conditions, without precipitation or airborne matter, are recorded
as cloudy; o Raining; o Snowing; o Fog or Mist – airborne matter, of natural origin, which obscures visibility; o Smoke or Dust – airborne matter, of a natural or artificial origin, which obscures visibility; o Freezing Rain / Sleet / Hail – freezing rain, sleet or hail (self explanatory); o Drifting Snow – snow drifting on or above roadway, which obscures visibility of the
roadway, road markings, traffic devices or roadway fixtures; and, o Strong Winds – used if wind was a contributing factor in the accident.
“Region”
Manitoba Infrastructure and Transportation is served by five regional office locations, each responsible for a geographic region (for boundaries, see Map 1-1). “Regions” are used to indicate the region in which a collision occurred.
“Contributing Factor”
Those circumstances or factors recorded as having contributed to the collision or its severity. Factors can be selected from four categories: driver action, human condition, vehicle condition, or environmental condition. The TAR allows for up to three contributing factors to be recorded for each driver or vehicle involved in the collision.
“At-fault Contributing Factor”
A contributing factor where some action or condition other than “driving properly” and “apparently normal” has been noted.

Section 11 Off-Road Vehicle Collisions
210
Table 11-1 Historical Summary of Off-Road Vehicle Collisions
Table 11-1
Historical Summary of Off-Road Vehicle Collisions: 2012 to 2015
2012 2013 2014 2015
2012-2014 Average
Total Collisions 409 391 295 269 365
Fatal 9 13 11 7 11
Injury 87 59 49 53 65
PDO 313 319 235 209 289
Total Victims 108 76 69 67 84
Killed 10 13 14 7 12
Injured 98 63 55 60 72
Total Vehicles Involved 439 424 327 303 397
Fatal 10 14 16 8 13
Injury 91 63 57 63 70
PDO 338 347 254 232 313
Total Drivers Involved 439 422 325 300 395
Fatal 10 14 16 8 13
Injury 91 63 57 63 70
PDO 338 345 252 229 312
In 2015, there are 269 off-road vehicle collisions, involving 67 victims, 303 vehicles and 300 drivers. Of these:
7 are fatal collisions, involving 8 vehicles and 8 drivers, resulting in 7 people killed and 0 injured;
53 are injury collisions, involving 63 vehicles and 63 drivers, resulting in 60 people injured; and,
209 are PDO collisions, involving 232 vehicles and 229 drivers. Total ORV collisions in 2015 are 9% lower than in 2014 and 26% lower than the average number of collisions in the previous three year (2012 to 2014) period. Compared to the previous three years, in 2015:
ORV collision victims are down 21%;
The number of people killed decreased by 43%;
The number of vehicles involved decreased by 24%; and,
The number of drivers involved decreased by 24%.

Section 11 Off-Road Vehicle Collisions
211
Figure 11-1 Historical Summary of ORV Collisions
The numbers of ORV collisions and victims in those collisions decreased in 2015. The number of vehicles and drivers involved in those collisions has also decreased.
0
50
100
150
200
250
300
350
400
450
500
2012 2013 2014 2015
Co
un
t o
f C
olli
sio
ns
Summary of ORV Collisions: 2012 - 2015
Collisions Victims Vehicles Drivers

Section 11 Off-Road Vehicle Collisions
212
Table 11-2 Victims, Vehicles and Drivers Involved in Off-Road Vehicle Collisions by ORV Type
Table 11-2
Victims, Vehicles and Drivers Involved in Off-Road Vehicle Collisions by ORV Type: 2015, 2012-2014 Average
2015 2012-2014 Average % Change 2015 to 2012-2014 Average
Snowmobile ATV Motorcycle Other* Total Snowmobile ATV Motorcycle Other* Total Snowmobile ATV Motorcycle Other* Total
Total Victims 22 36 4 5 67 40 38 2 5 84 -44.5% -5.3% 100.0% 7.1% -20.6%
Killed 3 4 0 0 7 4 7 <1 <1 12 -30.8% -42.9% -100.0% -100.0% -43.2%
Injured 19 32 4 5 60 35 31 1 4 72 -46.2% 3.2% 200.0% 15.4% -16.7%
Total Vehicles Involved
118 143 5 37 303 196 158 2 41 397 -39.8% -9.7% 200.0% -9.0% -23.6%
Fatal 3 4 0 1 8 4 7 <1 1 13 -30.8% -42.9% -100.0% -25.0% -40.0%
Injury 20 31 4 8 63 36 27 1 6 70 -44.4% 14.8% 300.0% 26.3% -10.4%
PDO 95 108 1 28 232 156 124 0 33 313 -39.0% -13.1% 100.0% -15.2% -25.9%
Total Drivers Involved
118 141 5 36 300 196 158 2 40 395 -39.7% -10.8% 200.0% -10.0% -24.1%
Fatal 3 4 0 1 8 4 7 <1 1 13 -30.8% -42.9% -100.0% -25.0% -40.0%
Injury 20 31 4 8 63 36 27 1 6 70 -44.4% 14.8% 300.0% 26.3% -10.4%
PDO 95 106 1 27 229 155 124 0 32 312 -38.8% -14.5% 100.0% -16.5% -26.5%
* 'Other' includes: vehicles not registered as an off-road vehicle, dune/sport buggy, 4 wheel drive motor vehicle (operated off-road), amphibious vehicle, pedestrians and those listed under “not stated” category.

Section 11 Off-Road Vehicle Collisions
213
In 2015, a total of 303 vehicles were involved in off-road collisions, including:
118 snowmobiles and snowmobile drivers, resulting in 22 victims including 3 people killed;
143 ATVs and 141 ATV drivers, resulting in 36 victims including 4 people killed;
5 motorcycles and motorcycle drivers, resulting in 4 victims and no person killed; and,
37 ‘Other’ vehicles and 36 drivers of those vehicles, resulting in 5 victims and no person killed. Compared to the previous three year (2012 to 2014) annual average, in 2015:
Snowmobile collisions are below average across all categories – victims are down by nearly 45%, while vehicles and drivers involved are down by 40% each.
ATV collisions are below average across all categories – victims are down by 5%, vehicles and drivers are down by 10% and 11%, respectively. However, the number of people injured in ATV collisions increased by a count of 1 (or 3%).
Motorcycle collisions are above average across all categories – victims are up by a count of 2, while vehicles and drivers involved are up by a count of 3 each.
‘Other’ vehicle collisions are below average in total vehicles and total drivers involved, while victim counts remain the same – vehicles and drivers involved are down by 9% and 10%, respectively.
Note: Due to low annual counts of people killed and injured in ORV collisions, relatively small changes in these counts year-over-year can produce dramatic changes in percentage terms. Please use caution when interpreting these results.
Figure 11-2 Proportion of ORV Collisions by Victims, Vehicle Type and Drivers
In 2015, ATVs account for the largest proportion of victims as well as drivers and vehicles involved in ORV collisions, followed by snowmobiles.
0%
10%
20%
30%
40%
50%
60%
Snowmobile ATV Motorcycle Other
Pro
po
rtio
n o
f C
olli
sio
ns
Proportion of ORV Collisions by Victims, Vehicle Type and Drivers: 2015
Victims Vehicles Drivers

Section 11 Off-Road Vehicle Collisions
214
Table 11-3 Off-Road Vehicle Collisions by Month of Occurrence and Collision Severity
Table 11-3
ORV Collisions by Month of Occurrence and Collision Severity: 2015, 2012-2014 Average
Month
2015 Collision Severity
2015 Total
% of 2015 Total
2012-2014 Average
% Change 2015 to
2012-2014 Average
Fatal % of Total Fatal
Injury % of Total Injury
PDO % of Total PDO
January 1 14.3% 8 15.1% 26 12.4% 35 13.0% 48 -27.6%
February 0 - 8 15.1% 28 13.4% 36 13.4% 57 -37.2%
March 1 14.3% 4 7.5% 34 16.3% 39 14.5% 56 -30.4%
April 0 - 4 7.5% 20 9.6% 24 8.9% 27 -12.2%
May 0 - 6 11.3% 9 4.3% 15 5.6% 23 -35.7%
June 0 - 3 5.7% 16 7.7% 19 7.1% 19 -1.7%
July 1 14.3% 4 7.5% 15 7.2% 20 7.4% 20 -1.6%
August 0 - 3 5.7% 13 6.2% 16 5.9% 19 -17.2%
September 0 - 6 11.3% 16 7.7% 22 8.2% 19 17.9%
October 2 28.6% 3 5.7% 11 5.3% 16 5.9% 17 -7.7%
November 1 14.3% 2 3.8% 4 1.9% 7 2.6% 23 -69.1%
December 1 14.3% 2 3.8% 17 8.1% 20 7.4% 35 -42.9%
Total 7 100% 53 100% 209 100% 269 100% 365 -26.3%
The majority of ORV collisions in 2015 occur from January to June. When combined, these six months account for nearly 63% of ORV collisions. The 2015 proportional distribution of ORV collisions by month is similar to the previous three year (2012 to 2014) annual average.
Winter (December/January/February) – 34% in 2015; nearly 39% in the previous three years.
Spring (March/April/May) – 29% in 2015 and in the previous three years.
Summer (June/July/August) – 20% in 2015; 16% in the previous three years.
Fall (September/October/November) – 17% in 2015; 16% in the previous three years. In 2015, fatal ORV collisions do not follow any discernible pattern by month of occurrence. Injury ORV collisions appear more frequent from January to June in 2015 (62%). NOTE: For a detailed count of ORV collisions by month of occurrence in each year from 2012 to 2015, please refer to “Table 11-16 Historical Summary of ORV Collisions by Month of Occurrence” at the end of this section.

Section 11 Off-Road Vehicle Collisions
215
Table 11-4 Off-Road Vehicle Collisions by Day of Occurrence and Collision Severity
Table 11-4
ORV Collisions by Day of Occurrence and Collision Severity: 2015, 2012-2014 Average
Day
2015 Collision Severity
2015 Total
% of 2015 Total
2012-2014
Average
% Change 2015 to
2012-2014 Average
Fatal % of Total Fatal
Injury % of Total Injury
PDO % of Total PDO
Sunday 1 14.3% 21 39.6% 43 20.6% 65 24.2% 80 -18.8%
Monday 2 28.6% 2 3.8% 17 8.1% 21 7.8% 28 -25.9%
Tuesday 0 - 2 3.8% 13 6.2% 15 5.6% 26 -41.6%
Wednesday 0 - 4 7.5% 25 12.0% 29 10.8% 21 38.1%
Thursday 0 - 1 1.9% 12 5.7% 13 4.8% 28 -54.1%
Friday 3 42.9% 6 11.3% 21 10.0% 30 11.2% 42 -28.6%
Saturday 1 14.3% 17 32.1% 78 37.3% 96 35.7% 140 -31.3%
Total 7 100% 53 100% 209 100% 269 100% 365 -26.3%
The majority of ORV collisions happen on weekends (Friday, Saturday and Sunday). In 2015, 71% of ORV collisions occurred on Friday (11%), Saturday (36%) and Sunday (24%). Monday through Thursday account for 29% of ORV collisions. In 2015, 5 of 7 of all fatal ORV collisions (71%) occur on weekends (Friday, Saturday and Sunday combined), including 3 fatal ORV collisions on Fridays.
Figure 11-3 Proportion of ORV Collisions by Collision Severity and Day of Occurrence
0%
10%
20%
30%
40%
50%
60%
Sunday Monday Tuesday Wednesday Thursday Friday Saturday
Pro
po
rtio
n o
f C
olli
sio
ns
Proportion of ORV Collisions by Collision Serverity and Day of Occurrence: 2015
Fatal Injury PDO Total Collisions

Section 11 Off-Road Vehicle Collisions
216
Table 11-5 Off-Road Vehicle Collisions by Time of Occurrence and Collision Severity
Table 11-5
ORV Collisions by Time of Occurrence and Collision Severity: 2015, 2012-2014 Average
Time
2015 Collision Severity
2015 Total
% of 2015 Total
2012-2014 Average
% Change 2015 to
2012-2014 Average
Fatal % of Total Fatal
Injury % of Total Injury
PDO % of Total PDO
00:00 - 02:59 1 14.3% 4 7.5% 3 1.4% 8 3.0% 7 20.0%
03:00 - 05:59 1 14.3% 3 5.7% 0 - 4 1.5% 2 71.4%
06:00 - 08:59 0 - 0 - 2 1.0% 2 0.7% 4 -53.8%
09:00 - 11:59 0 - 6 11.3% 22 10.5% 28 10.4% 38 -27.0%
12:00 - 14:59 3 42.9% 7 13.2% 74 35.4% 84 31.2% 105 -20.3%
15:00 - 17:59 1 14.3% 16 30.2% 54 25.8% 71 26.4% 106 -33.2%
18:00 - 20:59 0 - 8 15.1% 42 20.1% 50 18.6% 69 -27.9%
21:00 - 23:59 1 14.3% 9 17.0% 12 5.7% 22 8.2% 32 -30.5%
Not Stated 0 - 0 - 0 - 0 - <1 -100.0%
Total 7 100% 53 100% 209 100% 269 100% 365 -26.3%
The majority of off-road collisions occur in the afternoon and evening. In 2015, 84% of all ORV vehicle collisions occurred between noon and midnight (12:00 to 14:59 – 31%; 15:00 to 17:59 – 26%; 18:00 to 20:59 – 19%; 21:00 to 23:59 – 8%). The proportional distribution of ORV collisions by time of day in 2015 is similar to the previous three year (2012 to 2014) annual average.
Morning (06:00 to 11:59) – 11% in 2015; 12% in the previous three years.
Afternoon (12:00 to 17:59) – 58% in 2015 and in the previous three years.
Evening (18:00 to 20:59) – 19% in 2015 and in the previous three years.
Overnight (21:00 to 05:59) – 13% in 2015; 11% in the previous three years. In 2015, the majority of fatal ORV collisions occurred between noon and midnight (5 of 7 fatal collisions). In 2015, 23 of 53 injury ORV collisions occurred between noon and 6 p.m. and 17 of 53 injury ORV collisions occurred between 6 p.m. and midnight.

Section 11 Off-Road Vehicle Collisions
217
Figure 11-4 Proportion of Total ORV Collisions by Collision Severity and Time of Occurrence
In 2015, nearly 5% of ORV collisions occurred between midnight and 6 a.m., however, the proportion of fatal collisions is much higher (2 of 7 fatal collisions occurred between midnight and 6 a.m., i.e. 29%). The majority of all ORV collisions occurred between noon and midnight (84%), while 11% occurred between 6 a.m. and noon.
0%
5%
10%
15%
20%
25%
30%
35%
40%
45%
00:00 - 02:59
03:00 - 05:59
06:00 - 08:59
09:00 - 11:59
12:00 - 14:59
15:00 - 17:59
18:00 - 20:59
21:00 - 23:59
Pro
po
rtio
n o
f C
olli
sio
ns
Proportion of ORV Collisions by Collision Severity and Time of Occurrence: 2015
Fatal Injury PDO Total Collisions

Section 11 Off-Road Vehicle Collisions
218
Table 11-6 Off-Road Vehicle Collisions by Light Condition and Collision Severity
Table 11-6
ORV Collisions by Light Condition and Collision Severity: 2015, 2012-2014 Average
Light Condition
2015 Collision Severity
2015 Total
% of 2015 Total
2012-2014 Average
% Change 2015 to
2012-2014 Average
Fatal % of Total Fatal
Injury % of Total Injury
PDO % of Total PDO
Day 1 14.3% 28 52.8% 137 65.6% 166 61.7% 231 -28.0%
Dawn 0 - 1 1.9% 1 0.5% 2 0.7% 2 0.0%
Dusk 0 - 2 3.8% 13 6.2% 15 5.6% 18 -15.1%
Dark 4 57.1% 15 28.3% 22 10.5% 41 15.2% 52 -20.6%
Artificial Light 0 - 0 - 0 - 0 - 2 -100.0%
Not Stated 2 28.6% 7 13.2% 36 17.2% 45 16.7% 61 -25.8%
Total 7 100% 53 100% 209 100% 269 100% 365 -26.3%
The majority of ORV collisions occur during daylight conditions, from a half hour after sunrise to a half hour before sunset. In 2015, daylight conditions account for 62% of ORV collisions. An additional 15% occurred during darkness. Table 11-7 ORV Collisions by Weather Condition and Collision Severity
Table 11-7
ORV Collisions by Weather Condition and Collision Severity: 2015, 2012-2014 Average
Weather Condition
2015 Collision Severity
2015 Total
% of 2015 Total
2012-2014 Average
% Change 2015 to
2012-2014 Average
Fatal % of Total Fatal
Injury % of Total Injury
PDO % of Total PDO
Clear 4 57.1% 35 66.0% 122 58.4% 161 59.9% 222 -27.6%
Cloudy 0 - 1 1.9% 23 11.0% 24 8.9% 39 -37.9%
Raining 1 14.3% 2 3.8% 2 1.0% 5 1.9% 5 -6.2%
Snowing 0 - 4 7.5% 10 4.8% 14 5.2% 12 16.7%
Fog/Mist 0 - 0 - 2 1.0% 2 0.7% 4 -45.5%
Smoke/Dust 0 - 0 - 2 1.0% 2 0.7% <1 500.0%
Freezing Rain/Sleet/Hail 0 - 0 - 0 - 0 - <1 -100.0%
Drifting Snow 0 - 0 - 5 2.4% 5 1.9% 5 0.0%
Strong Winds 1 14.3% 0 - 3 1.4% 4 1.5% 2 100.0%
Not Stated 1 14.3% 11 20.8% 40 19.1% 52 19.3% 75 -31.0%
Total 7 100% 53 100% 209 100% 269 100% 365 -26.3%
The majority of ORV collisions occur when weather conditions are clear. In 2015, 60% of ORV collisions occurred in clear weather conditions. Another 9% occurred in cloudy weather.

Section 11 Off-Road Vehicle Collisions
219
Map 1-1 Manitoba Infrastructure and Transportation (MIT) Regions
Source: Manitoba Infrastructure and Transportation, Traffic Engineering
This map shows the boundaries of Manitoba Infrastructure and Transportation (MIT) regions and regional office locations. Regional Offices are responsible for service delivery and management of MIT programs, as indicated in the department’s annual report.
3 Off-road vehicle collisions are reported by location within
these regions.
3 2014/2015 Annual Report for Manitoba Infrastructure and Transportation:
http://www.gov.mb.ca/mit/reports/annual/2014_2015_annual.pdf

Section 11 Off-Road Vehicle Collisions
220
Table 11-8 ORV Collisions by MIT Regions and Collision Severity
Table 11-8
ORV Collisions by MIT Regions and Collision Severity: 2015, 2012-2014 Average
Region
2015 Collision Severity
2015 Total
% of 2015 Total
2012-2014 Average
% Change 2015 to
2012-2014 Average
Fatal % of Total Fatal
Injury % of Total Injury
PDO % of Total PDO
Eastern Region 2 28.6% 32 60.4% 108 51.7% 142 52.8% 182 -22.1%
South Central Region 3 42.9% 11 20.8% 41 19.6% 55 20.4% 75 -27.0%
South Western Region 1 14.3% 3 5.7% 37 17.7% 41 15.2% 46 -10.9%
West Central Region 0 - 4 7.5% 14 6.7% 18 6.7% 37 -51.8%
Northern Region 1 14.3% 3 5.7% 9 4.3% 13 4.8% 24 -45.8%
Total 7 100% 53 100% 209 100% 269 100% 365 -26.3%
The Eastern Region of Manitoba historically accounts for a large share of off-road vehicle accidents. In 2015, 53% of ORV collisions occurred in the Eastern Region. The South Central Region follows with 20%, while the South Western Region accounts for 15% of the total collisions. The overall count of ORV collisions in 2015 is down across all regions in Manitoba (compared to the 2012 to 2014 annual average). The proportional distribution of collisions by region in 2015 is similar to the previous three year annual average.
Eastern Region – 53% of ORV collisions in 2015; 50% in previous three years.
South Central Region – 20% of ORV collisions in 2015; 21% in previous three years.
South Western Region – 15% of ORV collisions in 2015; 13% in previous three years.
West Central Region – 7% of ORV collisions in 2015; 10% in previous three years.
Northern Region – 5% of ORV collisions in 2015; 7% in previous three years. Figure 11-5 Proportion of ORV Collisions by Collision Severity and MIT Regions
Fatal ORV collisions in 2015 occur most often in the South Central and Eastern Regions of Manitoba (3 of 7 and 2 of 7 fatal collisions, respectively), followed by the South Western and Northern Regions (1 of 7 fatal collisions, each).
0%
10%
20%
30%
40%
50%
60%
70%
Eastern Region South Central Region
South Western Region
West Central Region
Northern Region
Pro
po
rtio
n o
f C
olli
sio
ns
Proportion of ORV Collisions by Collision Severity and MIT Regions: 2015
Fatal Injury PDO Total Collisions

Section 11 Off-Road Vehicle Collisions
221
Table 11-9 Off-Road Vehicle Collisions by Location and Collision Severity
Table 11-9
ORV Collisions by Location and Collision Severity: 2015, 2012-2014 Average
Location
2015 Collision Severity
2015 Total
% of 2015 Total
2012-2014
Average
% Change 2015 to
2012-2014 Average
Fatal % of Total Fatal
Injury % of Total Injury
PDO % of Total PDO
Public Roadway 4 57.1% 14 26.4% 36 17.2% 54 20.1% 58 -7.4%
Ditches 1 14.3% 4 7.5% 22 10.5% 27 10.0% 29 -6.9%
River/Lake 0 - 6 11.3% 16 7.7% 22 8.2% 36 -38.3%
Field 0 - 3 5.7% 14 6.7% 17 6.3% 14 21.4%
Farm Yard/Private Property 1 14.3% 4 7.5% 38 18.2% 43 16.0% 47 -9.2%
Parking Lot 0 - 0 - 2 1.0% 2 0.7% 2 20.0%
Embankment 0 - 0 - 1 0.5% 1 0.4% 2 -50.0%
Gravel Road 1 14.3% 2 3.8% 2 1.0% 5 1.9% 7 -28.6%
Trail* 0 - 8 15.1% 40 19.1% 48 17.8% 92 -48.0%
Other** 0 - 11 20.8% 36 17.2% 47 17.5% 71 -33.5%
Not Stated 0 - 1 1.9% 2 1.0% 3 1.1% 7 -57.1%
Total 7 100% 53 100% 209 100% 269 100% 365 -26.3%
*Includes marked groomed trail, bush trail/winter road, and snowmobile trail.
**Includes park, forest, bush, camp site, mountain, valley, hill, railroad and floodway/diversion.
Note: Historical averages are rounded off to the nearest integer. Computations of percentage changes from the historical trend to the current year are based on actual averages and not on the rounded numbers presented in the table.
In 2015, “public roadway” was the most common location for ORV collisions (20% of total) followed by “trail” (18%). The proportion of ORV collisions happening at specific locations in 2015 shows some differences when compared to the previous three year (2012 to 2014) annual average.
“Public Roadway” – 20% in 2015; 16% in the previous three years.
“Trail” – 18% in 2015; 25% in the previous three years.
“Other” – nearly 18% in 2015; 19% in the previous three years.
“Farm Yard/Private Property” – 16% in 2015; 13% in the previous three years.
“Ditches” – 10% in 2015; 8% in the previous three years. NOTE: For a detailed count of ORV collisions by location in each year from 2012 to 2015, please refer to “Table 11-17 Historical Summary of ORV Collisions by Location” at the end of this section.

Section 11 Off-Road Vehicle Collisions
222
Table 11-10 ORV Collision Victims by Age Group and Casualty Type
Table 11-10
ORV Collision Victims by Age Group and Casualty Type: 2015, 2012-2014 Average
Age Group
2015 Casualty Type
2015 Total
Victims
% of 2015 Total
Victims
2012-2014 Average
Killed % of Total Killed
Injured % of Total
Injured Killed Injured
Total Victims
% of Total
Victims
0-4 0 - 1 1.7% 1 1.5% 0 0 0 -
5-9 0 - 1 1.7% 1 1.5% 0 0 0 -
10-14 0 - 1 1.7% 1 1.5% 1 <1 2 2.0%
15-19 1 14.3% 4 6.7% 5 7.5% 1 7 8 9.5%
20-24 0 - 9 15.0% 9 13.4% 2 9 11 12.6%
25-34 2 28.6% 9 15.0% 11 16.4% 3 13 16 19.0%
35-44 0 - 16 26.7% 16 23.9% 1 16 17 20.2%
45-54 1 14.3% 9 15.0% 10 14.9% 2 13 15 17.4%
55-64 3 42.9% 4 6.7% 7 10.4% 2 6 7 8.7%
65+ 0 - 2 3.3% 2 3.0% 0 2 2 2.4%
Not Stated 0 - 4 6.7% 4 6.0% 1 6 7 8.3%
Total 7 100% 60 100% 67 100% 12 72 84 100%
The majority of ORV collision victims are under the age of 45 (66% of all victims). In 2015, 8 of 67 ORV collision victims (12%) are under the age of 20 while 13% are aged 20-24, 16% are aged 25-34, and 24% are aged 35-44. Nineteen of 67 victims (28%) are 45 years old and older (15% aged 45 to 54; 10% aged 55 to 64; 3% aged 65 and older). ORV collision victims in 2015 are, for the most part, consistent in terms of overall age demographic when compared with the previous three year (2012 to 2014) annual average. In the previous three years:
Persons under the age of 15 account for 2% of all victims in ORV collisions, compared to nearly 5% in 2015;
Persons aged 15 to 44 account for 61% of all victims in ORV collisions, compared to the same proportion in 2015;
Persons aged 45 and above account for nearly 29% of all victims in ORV collisions, compared to 28% in 2015.
NOTE: The classification of victims is different from that of drivers (see Table 11-14) as victims may be of any age. Therefore, they are classified by a 5-year age cohort up to age 24. While drivers of off-road vehicles may not be required to be licensed, driver statistics are recorded consistent with other sections, and identified as under 16, 16 to 19, and then using the same classifications for victims. NOTE: For a detailed count of ORV collision victims by age group in each year from 2012 to 2015, please refer to “Table 11-18 Historical Summary of ORV Collision Victims by Age Group” at the end of this section.

Section 11 Off-Road Vehicle Collisions
223
Table 11-11 ORV Collision Victims by Gender and Casualty Type
Table 11-11
ORV Collision Victims by Gender and Casualty Type: 2015, 2012-2014 Average
Gender
2015 Casualty Type
2015 Total
Victims
% of 2015 Total
Victims
2012-2014 Average
Killed % of Total Killed
Injured % of Total
Injured Killed Injured
Total Victims
% of Total Victims
Male 7 100% 43 78.2% 50 80.6% 9 56 66 85.3%
Female 0 - 12 21.8% 12 19.4% 2 9 11 14.7%
Total 7 100% 55 100% 62 100% 11 66 77 100%
Note: Some victims do not have gender recorded and are therefore missing from the table above.
The majority of people killed and injured in ORV collisions in 2015 are male. Males account for 50 of 62 ORV collision victims (81%). This is consistent with the previous three year (2012 to 2014) annual average (85%).
Table 11-12 ORV Collision Victims by Safety Equipment Use and Casualty Type
Table 11-12
ORV Collision Victims by Safety Equipment Use and Casualty Type: 2015, 2012-2014 Average
Safety Equipment
2015 Casualty Type
2015 Total
Victims
% of 2015 Total
Victims
2012-2014 Average % Change 2015 to 2012-2014
Average
Killed % of Total Killed
Injured % of Total
Injured Killed Injured
Total Victims
% of Total
Victims
Safety Helmet Worn 2 28.6% 35 58.3% 37 55.2% 4 50 54 64.4% -31.9%
Safety Helmet Not Worn 2 28.6% 5 8.3% 7 10.4% 4 6 10 11.9% -30.0%
Seat Belt Assembly Used 0 - 11 18.3% 11 16.4% 0 6 6 7.1% 83.3%
Seat Belt Assembly Not Used 2 28.6% 4 6.7% 6 9.0% <1 1 1 1.6% 350.0%
Not Stated 1 14.3% 1 1.7% 2 3.0% 2 3 5 5.9% -60.0%
Not Applicable* 0 - 4 6.7% 4 6.0% 2 6 8 9.1% -47.8%
Total 7 100% 60 100% 67 100% 12 72 84 100% -20.6%
* Victims who were not operators/passengers of off-road vehicles; therefore do not require a helmet.
In 2015, 37 victims (55%) in ORV collisions were wearing a safety helmet; 7 were not. This includes 2 people killed while wearing a helmet and 2 people killed while not wearing a helmet. The proportion of victims who were wearing a helmet in 2015 (55%) has decreased compared to the previous three year annual average (2012 to 2014; 64%).

Section 11 Off-Road Vehicle Collisions
224
Table 11-13 ORV Victims Killed vs. Injured for Helmeted and Non-helmeted ORV Occupants
Table 11-13
ORV Victims Killed vs. Injured for Helmeted and Non-helmeted ORV Occupants (2012-2015)
Helmet worn Helmet not worn Hemet Effectiveness
Number Percent Number Percent (Ratio of % helmet not
worn to % helmet worn)
Killed 14 7.0% 15 40.5% 5.79
Injured 186 93.0% 22 59.5% 0.64
Total 200 100% 37 100% -
Note: Data have been presented in aggregate for the years 2012-2015.
As the number of victims wearing helmets exceeds those not wearing helmets, a casual interpretation of the statistics may lead one to conclude that helmets contribute to fatalities and injuries in ORV collisions. However, it is likely that with a large majority of drivers and passengers wearing helmets, they have a high representation among collision victims. Table 11-13 compares the proportion of people killed and injured for those wearing and not wearing helmets. Among people wearing helmets when they sustain an injury from an ORV collision, 7% are killed. Among people not wearing helmets when they sustain an injury from an ORV collision, nearly 41% are killed. This indicates that an ORV collision victim is almost six times more likely to be killed if they are not wearing a helmet at the time of a collision.
Table 11-14 Drivers Involved in ORV Collisions by Age Group and Collision Severity
Table 11-14
Drivers Involved in ORV Collisions by Age Group and Collision Severity: 2015, 2012-2014 Average
Age Group
2015 Collision Severity
2015 Total
% of 2015 Total
2012-2014 Average
% Change 2015 to
2012-2014 Average
Fatal % of Total Fatal*
Injury % of Total
Injury* PDO
% of Total PDO*
<16 0 - 1 1.6% 5 2.4% 6 2.2% 9 -30.8%
16-19 2 25.0% 3 4.9% 15 7.1% 20 7.2% 28 -29.4%
20-24 0 - 9 14.8% 33 15.7% 42 15.1% 58 -27.6%
25-34 2 25.0% 9 14.8% 54 25.7% 65 23.3% 102 -36.3%
35-44 0 - 16 26.2% 40 19.0% 56 20.1% 71 -21.5%
45-54 1 12.5% 14 23.0% 46 21.9% 61 21.9% 68 -9.9%
55-64 3 37.5% 7 11.5% 16 7.6% 26 9.3% 27 -2.5%
65+ 0 - 2 3.3% 1 0.5% 3 1.1% 8 -60.9%
Not Stated 0 - 2 - 19 - 21 - 25 -
Total 8 100% 63 100% 229 100% 300 100% 395 -24.1%
*Percentage of the total does not include the "not stated" category.
In 2015, drivers under the age of 45 account for 68% of drivers involved in ORV collisions (<16 – 2%; 16 to 19 – 7%; 20 to 24 – 15%; 25 to 34 – 23%; 35 to 44 – 20%), while drivers aged 45 and older account for 32% (45 to 54 – 22%; 55 to 64 – 9%; 65 and older – 1%).

Section 11 Off-Road Vehicle Collisions
225
Table 11-15 ORV Collisions by Contributing Factors and Collision Severity
Table 11-15
Drivers Involved in ORV Collisions by Contributing Factors and Collision Severity: 2015
Contributing Factor
2015 Collision Severity 2015 Total
Drivers
% of 2015 Total
Drivers Fatal
% of Total Fatal
Injury % of Total Injury
PDO % of Total PDO
Driver Action - Driving Properly and Human Condition - Apparently Normal
0 - 9 14.3% 25 10.9% 34 11.3%
Driver Action - Driving properly 1 12.5% 0 - 2 0.9% 3 1.0%
Any At-fault Driver Action 4 50.0% 28 44.4% 107 46.7% 139 46.3%
Following too closely 0 - 2 3.2% 5 2.2% 7 2.3%
Turning improperly 0 - 1 1.6% 3 1.3% 4 1.3%
Passing improperly 0 - 0 - 0 - 0 -
Changing lanes improperly 0 - 0 - 0 - 0 -
Fail to yield right-of-way 0 - 1 1.6% 1 0.4% 2 0.7%
Disobey traffic control device/officer 1 12.5% 0 - 0 - 1 0.3%
Drive wrong way on roadway 0 - 0 - 0 - 0 -
Passing a vehicle at pedestrian X-walk 0 - 0 - 0 - 0 -
Back unsafely 0 - 0 - 5 2.2% 5 1.7%
Parking improperly 0 - 0 - 0 - 0 -
Lost control/Drive off road 2 25.0% 7 11.1% 13 5.7% 22 7.3%
Driverless vehicle ran out of control 0 - 0 - 0 - 0 -
Leave stop sign before safe to do so 0 - 0 - 0 - 0 -
Failed to signal 0 - 0 - 0 - 0 -
Take avoiding action 0 - 0 - 2 0.9% 2 0.7%
Driver inexperience 0 - 3 4.8% 0 - 3 1.0%
Pedestrian error/confusion 0 - 0 - 0 - 0 -
NET Speed 1 12.5% 3 4.8% 15 6.6% 19 6.3%
Exceeding speed limit 0 - 0 - 0 - 0 -
Driving too fast for conditions 0 - 3 4.8% 15 6.6% 18 6.0%
Unsafe operating speed (Too fast or too slow) 1 12.5% 0 - 0 - 1 0.3%
NET Distracted driving 1 12.5% 18 28.6% 78 34.1% 97 32.3%
Careless Driving 1 12.5% 17 27.0% 76 33.2% 94 31.3%
Distraction/Inattention 1 12.5% 3 4.8% 2 0.9% 6 2.0%
(continued on next page)

Section 11 Off-Road Vehicle Collisions
226
(continued from previous page)
Contributing Factor
2015 Collision Severity 2015 Total
Drivers
% of 2015 Total
Drivers Fatal
% of Total Fatal
Injury % of Total Injury
PDO % of Total PDO
Human Condition - Apparently Normal 0 - 11 17.5% 27 11.8% 38 12.7%
Any At-fault Human Condition 2 25.0% 2 3.2% 1 0.4% 5 1.7%
Loss of consciousness/Blackout prior to collision 0 - 0 - 0 - 0 -
Extreme fatigue/Fell asleep 0 - 0 - 1 0.4% 1 0.3%
Defective eyesight 0 - 0 - 0 - 0 -
Defective hearing 0 - 0 - 0 - 0 -
Medical disability 0 - 0 - 0 - 0 -
Physical disability 0 - 0 - 0 - 0 -
Mental disability 0 - 0 - 0 - 0 -
Mental confusion/Inability to remember 0 - 0 - 0 - 0 -
Sudden illness 0 - 0 - 0 - 0 -
Exceed hours of service (commercial drivers only) 0 - 0 - 0 - 0 -
NET Impaired 2 25.0% 2 3.2% 0 - 4 1.3%
Ability impaired alcohol 2 25.0% 1 1.6% 0 - 3 1.0%
Ability impaired drugs 0 - 0 - 0 - 0 -
Had been drinking/Suspected alcohol use 0 - 1 1.6% 0 - 1 0.3%
No Apparent (Vehicle) Defect 0 - 17 27.0% 47 20.5% 64 21.3%
Any At-fault Vehicle Defect 0 - 0 - 1 0.4% 1 0.3%
Defective brakes 0 - 0 - 0 - 0 -
Defective steering 0 - 0 - 1 0.4% 1 0.3%
Defective headlights 0 - 0 - 0 - 0 -
Defective brake lights 0 - 0 - 0 - 0 -
Defective lighting (unspecified) 0 - 0 - 0 - 0 -
Defective engine controls/drive train 0 - 0 - 0 - 0 -
Defective suspension/wheels 0 - 0 - 0 - 0 -
Defective tires 0 - 0 - 0 - 0 -
Tow hitch/yoke defective 0 - 0 - 0 - 0 -
Defective exhaust system 0 - 0 - 0 - 0 -
Hood/tailgate/door/covering opened 0 - 0 - 0 - 0 -
Defective glazing (obscured windows) 0 - 0 - 0 - 0 -
Vehicle modifications 0 - 0 - 0 - 0 -
Fire 0 - 0 - 0 - 0 -
Overloaded/oversized 0 - 0 - 0 - 0 -
Load shifted/spilled 0 - 0 - 0 - 0 -
Jack-knife/trailer swing 0 - 0 - 0 - 0 -
Hydroplaning tires 0 - 0 - 0 - 0 -
(continued on next page)

Section 11 Off-Road Vehicle Collisions
227
(continued from previous page)
Contributing Factor
2015 Collision Severity
2015 Total
Drivers
% of 2015 Total
Drivers Fatal
% of Total Fatal
Injury % of Total Injury
PDO % of Total PDO
Any At-fault Environmental Condition 0 - 1 1.6% 24 10.5% 25 8.3%
Animal action - Wild 0 - 0 - 1 0.4% 1 0.3%
Animal action - Domestic 0 - 0 - 1 0.4% 1 0.3%
Slippery road surface 0 - 0 - 2 0.9% 2 0.7%
Snow drift 0 - 0 - 1 0.4% 1 0.3%
Obstruction/debris on roadway 0 - 1 1.6% 14 6.1% 15 5.0%
View obstructed/limited 0 - 0 - 2 0.9% 2 0.7%
Glare/reflection 0 - 0 - 0 - 0 -
Construction zone 0 - 0 - 0 - 0 -
Defective driving surface 0 - 0 - 2 0.9% 2 0.7%
Shoulders defective 0 - 0 - 0 - 0 -
Lane markings inadequate 0 - 0 - 0 - 0 -
Defective/inoperative traffic control device 0 - 0 - 0 - 0 -
Weather 0 - 0 - 2 0.9% 2 0.7%
Pedestrian corridor in use 0 - 0 - 0 - 0 -
Uninvolved vehicle 0 - 0 - 0 - 0 -
Uninvolved pedestrian 0 - 0 - 0 - 0 -
Presence of prior accident 0 - 0 - 0 - 0 -
No Contributing Factor(s) Identified 0 - 0 - 0 - 0 -
Not Stated 3 37.5% 20 31.7% 82 35.8% 105 35.0%
Total 8 100% 63 100% 229 100% 300 100%
*NOTE: For each vehicle and/or driver involved in a collision, up to three contributing factors can be recorded. Because multiple factors can be noted, the counts and percentages under each collision severity will add to more than the total collisions of that severity.

Section 11 Off-Road Vehicle Collisions
228
In 2015, at least one at-fault driver action is recorded for 139 of the 300 drivers involved in ORV collisions (46%), including:
4 of 8 drivers involved in fatal collisions;
28 of 63 drivers involved in injury collisions; and,
107 of 229 drivers involved in PDO collisions. The most prevalent at-fault driver actions include:
Distracted driving (including “careless driving” and “distraction/inattention”) – 32% of the drivers involved;
“Loss of control/drive off road” – 7% of the drivers involved; and,
Speed (including “exceeding speed limit”, “driving too fast for conditions” and “unsafe operating speed”) – 6% of the drivers involved.
At-fault human conditions are recorded for 2% of the drivers involved in ORV collisions, with the most prevalent being impaired (including “ability impaired by alcohol”, “ability impaired by drugs” and “had been drinking/suspected alcohol use”) (1% of the drivers involved). Environmental conditions are recorded as contributing for 8% of the drivers involved in ORV collisions, with the most prevalent being “obstruction/debris on roadway” (5% of the drivers involved).
Only one of the drivers involved in ORV collisions had a vehicle defect recorded as a contributing factor. In the previous three year (2012 to 2014) annual average of the drivers involved in ORV collisions:
41% had an at-fault driver action recorded, with 27% being distracted (“careless driving” and “distraction/inattention”), 8% speed, and 5% “lost control/drive off road”;
1% had an at-fault ‘human condition’ recorded, with the most common being impaired (1%);
11% had an environmental condition recorded, with the most common being “obstruction/debris on roadway” (4%), “animal action – wild” (2%), and “defective driving surface” (2%); and,
only 2 drivers had a vehicle defect recorded as a contributing factor.
In 2015, 4 of 8 drivers involved in fatal collisions had an at-fault driver action and 2 of 8 had an at-fault human condition. The most common at-fault contributing factors recorded for drivers involved in fatal ORV collisions in 2015 include:
Impaired (including “ability impaired by alcohol”, “ability impaired by drugs” and “had been drinking/suspected alcohol use”) – 2 of 8 drivers;
Speed (including “exceeding speed limit”, “driving too fast for conditions” and “unsafe operating speed”) – 1 of 8 drivers; and,
Distracted driving (including “careless driving” and “distraction/inattention”) – 1 of 8 drivers. NOTE: For a detailed count of drivers involved in ORV collisions by the contributing factors recorded in each year from 2012 to 2015, please refer to “Table 11-19 Historical Summary of Drivers Involved in ORV Collisions by Contributing Factors” at the end of this section.

Section 11 Off-Road Vehicle Collisions
229
Table 11-16 Historical Summary of ORV Collisions by Month of Occurrence
Table 11-16
Summary of ORV Collisions by Month of Occurrence: 2012 to 2015
Month 2012 Total
% of 2012 Total
2013 Total
% of 2013 Total
2014 Total
% of 2014 Total
2015 Total
% of 2015 Total
January 52 12.7% 53 13.6% 40 13.6% 35 13.0%
February 67 16.4% 61 15.6% 44 14.9% 36 13.4%
March 60 14.7% 67 17.1% 41 13.9% 39 14.5%
April 24 5.9% 28 7.2% 30 10.2% 24 8.9%
May 20 4.9% 23 5.9% 27 9.2% 15 5.6%
June 20 4.9% 25 6.4% 13 4.4% 19 7.1%
July 18 4.4% 23 5.9% 20 6.8% 20 7.4%
August 18 4.4% 20 5.1% 20 6.8% 16 5.9%
September 23 5.6% 17 4.3% 16 5.4% 22 8.2%
October 16 3.9% 20 5.1% 16 5.4% 16 5.9%
November 29 7.1% 25 6.4% 14 4.7% 7 2.6%
December 62 15.2% 29 7.4% 14 4.7% 20 7.4%
Total 409 100% 391 100% 295 100% 269 100%

Section 11 Off-Road Vehicle Collisions
230
Table 11-17 Historical Summary of ORV Collisions by Location
Table 11-17
Summary of ORV Collisions by Location: 2012 to 2015
Location 2012 Total
% of 2012 Total
2013 Total
% of 2013 Total
2014 Total
% of 2014 Total
2015 Total
% of 2015 Total
Public Roadway 62 15.2% 68 17.4% 45 15.3% 54 20.1%
Ditches 36 8.8% 35 9.0% 16 5.4% 27 10.0%
River/Lake 45 11.0% 42 10.7% 20 6.8% 22 8.2%
Field 16 3.9% 17 4.3% 9 3.1% 17 6.3%
Farm Yard/Private Property 50 12.2% 46 11.8% 46 15.6% 43 16.0%
Parking Lot 2 0.5% 1 0.3% 2 0.7% 2 0.7%
Embankment 2 0.5% 2 0.5% 2 0.7% 1 0.4%
Gravel Road 4 1.0% 12 3.1% 5 1.7% 5 1.9%
Trail* 112 27.4% 88 22.5% 77 26.1% 48 17.8%
Other** 72 17.6% 74 18.9% 66 22.4% 47 17.5%
Not Stated 8 2.0% 6 1.5% 7 2.4% 3 1.1%
Total 409 100% 391 100% 295 100% 269 100%
*Includes marked groomed trail, bush trail/winter road, and snowmobile trail.
**Includes park, forest, bush, camp site, mountain, valley, hill, railroad and floodway/diversion.

Section 11 Off-Road Vehicle Collisions
231
Table 11-18 Historical Summary of ORV Collision Victims by Age Group
Table 11-18
Historical Summary of ORV Collision Victims by Age Group: 2012 to 2015
Age Group
2012 Total
% of 2012 Total
2013 Total
% of 2013 Total
2014 Total
% of 2014 Total
2015 Total
% of 2015 Total
0-4 0 - 0 - 0 - 1 1.5%
5-9 0 - 0 - 0 - 1 1.5%
10-14 3 2.8% 1 1.3% 1 1.4% 1 1.5%
15-19 10 9.3% 6 7.9% 8 11.6% 5 7.5%
20-24 12 11.1% 13 17.1% 7 10.1% 9 13.4%
25-34 15 13.9% 16 21.1% 17 24.6% 11 16.4%
35-44 29 26.9% 10 13.2% 12 17.4% 16 23.9%
45-54 22 20.4% 14 18.4% 8 11.6% 10 14.9%
55-64 7 6.5% 7 9.2% 8 11.6% 7 10.4%
65+ 4 3.7% 2 2.6% 0 - 2 3.0%
Not Stated 6 5.6% 7 9.2% 8 11.6% 4 6.0%
Total 108 100% 76 100% 69 100% 67 100%

Section 11 Off-Road Vehicle Collisions
232
Table 11-19 Historical Summary of ORV Collisions by Contributing Factors
Table 11-19
Historical Summary of ORV Collisions by Contributing Factors: 2012 to 2015
Contributing Factor
2012 Total Drivers
% of 2012 Total
Drivers
2013 Total Drivers
% of 2013 Total
Drivers
2014 Total Drivers
% of 2014 Total
Drivers
2015 Total Drivers
% of 2015 Total
Drivers
Driver Action - Driving Properly and Human Condition - Apparently Normal
75 17.1% 25 5.9% 18 5.5% 34 11.3%
Driver Action - Driving properly 7 1.6% 1 0.2% 0 - 3 1.0%
Any At-fault Driver Action 154 35.1% 176 41.7% 157 48.3% 139 46.3%
Following too closely 4 0.9% 1 0.2% 8 2.5% 7 2.3%
Turning improperly 0 - 2 0.5% 6 1.8% 4 1.3%
Passing improperly 0 - 0 - 0 - 0 -
Changing lanes improperly 0 - 0 - 0 - 0 -
Fail to yield right-of-way 2 0.5% 0 - 1 0.3% 2 0.7%
Disobey traffic control device/officer 0 - 0 - 0 - 1 0.3%
Drive wrong way on roadway 0 - 0 - 0 - 0 -
Passing a vehicle at pedestrian X-walk 0 - 0 - 0 - 0 -
Back unsafely 3 0.7% 1 0.2% 1 0.3% 5 1.7%
Parking improperly 0 - 0 - 0 - 0 -
Lost control/Drive off road 18 4.1% 23 5.5% 13 4.0% 22 7.3%
Driverless vehicle ran out of control 0 - 2 0.5% 0 - 0 -
Leave stop sign before safe to do so 1 0.2% 0 - 0 - 0 -
Failed to signal 0 - 0 - 0 - 0 -
Take avoiding action 2 0.5% 3 0.7% 3 0.9% 2 0.7%
Driver inexperience 4 0.9% 3 0.7% 1 0.3% 3 1.0%
Pedestrian error/confusion 0 - 0 - 0 - 0 -
NET Speed 26 5.9% 33 7.8% 35 10.8% 19 6.3%
Exceeding speed limit 1 0.2% 1 0.2% 0 - 0 -
Driving too fast for conditions 22 5.0% 29 6.9% 31 9.5% 18 6.0%
Unsafe operating speed (Too fast or too slow) 4 0.9% 3 0.7% 4 1.2% 1 0.3%
NET Distracted driving 99 22.6% 111 26.3% 109 33.5% 97 32.3%
Careless Driving 96 21.9% 110 26.1% 109 33.5% 94 31.3%
Distraction/Inattention 4 0.9% 2 0.5% 2 0.6% 6 2.0%
(continued on next page)

Section 11 Off-Road Vehicle Collisions
233
(continued from previous page)
Contributing Factor 2012 Total
Drivers
% of 2012 Total
Drivers
2013 Total Drivers
% of 2013 Total
Drivers
2014 Total Drivers
% of 2014 Total
Drivers
2015 Total Drivers
% of 2015 Total
Drivers
Human Condition - Apparently Normal 71 16.2% 34 8.1% 29 8.9% 38 12.7%
Any At-fault Human Condition 6 1.4% 6 1.4% 5 1.5% 5 1.7%
Loss of consciousness/Blackout prior to collision 0 - 0 - 0 - 0 -
Extreme fatigue/Fell asleep 0 - 0 - 0 - 1 0.3%
Defective eyesight 0 - 0 - 0 - 0 -
Defective hearing 0 - 0 - 0 - 0 -
Medical disability 0 - 0 - 0 - 0 -
Physical disability 0 - 1 0.2% 0 - 0 -
Mental disability 0 - 0 - 0 - 0 -
Mental confusion/Inability to remember 0 - 0 - 0 - 0 -
Sudden illness 0 - 0 - 0 - 0 -
Exceed hours of service (commercial drivers only) 0 - 0 - 0 - 0 -
NET Impaired 6 1.4% 5 1.2% 5 1.5% 4 1.3%
Ability impaired alcohol 6 1.4% 2 0.5% 2 0.6% 3 1.0%
Ability impaired drugs 0 - 0 - 0 - 0 -
Had been drinking/Suspected alcohol use 0 - 3 0.7% 3 0.9% 1 0.3%
No Apparent (Vehicle) Defect 139 31.7% 50 11.8% 39 12.0% 64 21.3%
Any At-fault Vehicle Defect 0 - 2 0.5% 3 0.9% 1 0.3%
Defective brakes 0 - 1 0.2% 1 0.3% 0 -
Defective steering 0 - 0 - 0 - 1 0.3%
Defective headlights 0 - 0 - 0 - 0 -
Defective brake lights 0 - 0 - 0 - 0 -
Defective lighting (unspecified) 0 - 0 - 0 - 0 -
Defective engine controls/drive train 0 - 0 - 0 - 0 -
Defective suspension/wheels 0 - 0 - 2 0.6% 0 -
Defective tires 0 - 0 - 0 - 0 -
Tow hitch/yoke defective 0 - 0 - 0 - 0 -
Defective exhaust system 0 - 0 - 0 - 0 -
Hood/tailgate/door/covering opened 0 - 0 - 0 - 0 -
Defective glazing (obscured windows) 0 - 0 - 0 - 0 -
Vehicle modifications 0 - 0 - 0 - 0 -
Fire 0 - 0 - 0 - 0 -
Overloaded/oversized 0 - 0 - 0 - 0 -
Load shifted/spilled 0 - 1 0.2% 0 - 0 -
Jack-knife/trailer swing 0 - 0 - 0 - 0 -
Hydroplaning tires 0 - 0 - 0 - 0 -
(continued on next page)

Section 11 Off-Road Vehicle Collisions
234
(continued from previous page)
Contributing Factor 2012 Total
Drivers
% of 2012 Total
Drivers
2013 Total Drivers
% of 2013 Total
Drivers
2014 Total Drivers
% of 2014 Total
Drivers
2015 Total Drivers
% of 2015 Total
Drivers
Any At-fault Environmental Condition 47 10.7% 52 12.3% 29 8.9% 25 8.3%
Animal action – Wild 4 0.9% 10 2.4% 5 1.5% 1 0.3%
Animal action - Domestic 1 0.2% 0 - 3 0.9% 1 0.3%
Slippery road surface 3 0.7% 7 1.7% 3 0.9% 2 0.7%
Snow drift 4 0.9% 7 1.7% 2 0.6% 1 0.3%
Obstruction/debris on roadway 20 4.6% 18 4.3% 13 4.0% 15 5.0%
View obstructed/limited 3 0.7% 1 0.2% 2 0.6% 2 0.7%
Glare/reflection 0 - 0 - 0 - 0 -
Construction zone 0 - 0 - 0 - 0 -
Defective driving surface 10 2.3% 7 1.7% 2 0.6% 2 0.7%
Shoulders defective 0 - 0 - 0 - 0 -
Lane markings inadequate 0 - 0 - 0 - 0 -
Defective/inoperative traffic control device 0 - 0 - 0 - 0 -
Weather 2 0.5% 2 0.5% 1 0.3% 2 0.7%
Pedestrian corridor in use 0 - 0 - 0 - 0 -
Uninvolved vehicle 0 - 1 0.2% 0 - 0 -
Uninvolved pedestrian 0 - 0 - 0 - 0 -
Presence of prior accident 0 - 0 - 0 - 0 -
No Contributing Factor(s) Identified 0 - 0 - 1 0.3% 0 -
Not Stated 154 35.1% 158 37.4% 107 32.9% 105 35.0%
Total 439 100% 422 100% 325 100% 300 100%
*NOTE: For each vehicle and/or driver involved in a collision, up to three contributing factors can be recorded. Because multiple factors can be noted, the counts and percentages under each collision severity will add to more than the total collisions of that severity.

SECTION 12 - Alcohol-Related Criminal
Code Convictions


Section 12 Alcohol-Related Criminal Code Convictions
237
Introduction
This section counts the number of drivers convicted of alcohol-related Criminal Code offences for the year 2014 by age at the time of the offence and includes historical statistics for the period 1995 to 2013. There is a one-year lag in the statistics reported to allow for court processing time. Therefore, 2014 is the most current year for which these statistics are available. Details are provided for “first”, “second” and “third and subsequent” (i.e., third, fourth, fifth, etc. combined) offences and whether or not a youth was present in the vehicle at the time of the offence. Key Highlights In 2014, there are a total of 3,017 alcohol-related Criminal Code offence convictions, including:
1,845 convictions for driving with a blood alcohol concentration (BAC) over .084;
1,026 convictions for impaired driving5; and,
146 convictions for refusing to provide a breath or blood sample6.
In 2014, the count of drivers convicted of alcohol-related Criminal Code offences (3,017) increased by 57% (1,095 more convictions) compared to 2013 (1,922) and was also up by 48% compared to the previous five year (2009 to 2013) annual average (2,037). Comparing 2014 to the previous five year (2009 to 2013) annual average:
Convictions for “alcohol content over .08” increased by 45%;
Convictions for “impaired driving” increased by 53%; and,
Convictions for “refuse sample” increased by 53%. Licensed drivers up to the age of 44 are overrepresented in alcohol-related Criminal Code convictions.
Drivers under age 25 represented 14% of the licensed drivers in 2014, but accounted for 26% of convictions.
Drivers aged 25 to 44 represented 34% of the licensed drivers in 2014, but accounted for 51% of convictions.
Over the past 10 years, from 2004 to 2014, there was a notable 36% increase in the rate of first offences. Rates of recidivism, indicated by second, and third and subsequent offences, increased at a marginal rate of 12% in second alcohol-related Criminal Code offences in 2014. In comparison, there was a 34% reduction in third and subsequent offences in 2014 compared to 2004. Major Elements Examined This section reports the number of drivers convicted of alcohol-related Criminal Code offences. Convictions have been broken down by whether or not a passenger under the age of 16 was in the vehicle at the time the offence occurred (under columns designated by a trailing “C” in the statute number). In 2005, Manitoba added increased consequences to Criminal Code offences 253A, 253B and 254-5 when these offences are committed with a youth in the vehicle; 2007 represents the first year where these conviction categories are available for reporting. Beginning in 2007, convictions of Manitoba drivers for impaired driving offences originating in other provinces and the United States have been added to the counts reported here. Prior to that time, these “out-of-province” offences were not included in the annual counts. “Relative involvement rates” in this section of the report are calculated as a rate per 1,000 licensed drivers to ensure consistency with other jurisdictions. In years past, the severity of the sanctions imposed by the courts in Manitoba took into account whether or not the offence involved a traffic collision. Until 2004, Driver Records noted whether the conviction was associated with a crash; that procedure has been discontinued and this report no longer includes a separate count for convictions occurring with or without a collision.
4 Includes s.253B and s.253BC
5 Includes s.253A, s.253AC, s.255-2 and s.255-3
6 Includes s.254-5 and s.254-5C

Section 12 Alcohol-Related Criminal Code Convictions
238
Terms and Definitions “Blood alcohol concentration (BAC)”
A measure of the concentration of alcohol in a person’s blood. A measure of “.08 BAC” is equivalent of 80 milligrams of alcohol per 1,000 milligrams of blood, or 0.08%.
“Criminal Code 253A” and “Criminal Code 253B”
7: Impaired driving
Everyone commits an offence who operates a motor vehicle or vessel or operates or assists in the operation of an aircraft or of railway equipment or has the care or control of a motor vehicle, vessel, aircraft or railway equipment, whether it is in motion or not,
o (a) while the person’s ability to operate the vehicle, vessel, aircraft or railway equipment is impaired by alcohol or a drug; or
o (b) having consumed alcohol in such a quantity that the concentration in the person’s blood exceeds eighty milligrams of alcohol in one hundred millilitres of blood.
For greater certainty, the reference to impairment by alcohol or a drug in paragraph (a) includes impairment by a combination of alcohol and a drug.
“253AC” and “253BC” indicate a conviction when there was a youth in the vehicle. “Criminal Code Statute 254-5”: Refusing to comply with a request for sample
If a peace officer has reasonable grounds to suspect that a person has alcohol or a drug in their body and that the person has, within the preceding three hours, operated a motor vehicle or vessel, operated or assisted in the operation of an aircraft or railway equipment or had the care or control of a motor vehicle, a vessel, an aircraft or railway equipment, whether it was in motion or not, the peace officer may, by demand, require the person to comply with paragraph (a), in the case of a drug, or with either or both of paragraphs (a) and (b), in the case of alcohol:
o (a) to perform forthwith physical coordination tests … and, if necessary, to accompany the peace officer for that purpose; and
o (b) to provide forthwith a sample of breath that, in the peace officer’s opinion, will enable a proper analysis to be made by means of an approved screening device and, if necessary, to accompany the peace officer for that purpose.
Everyone commits an offence who, without reasonable excuse, fails or refuses to comply with a demand made under this section.
“254-5C” indicates a conviction when there was a youth in the vehicle. “Criminal Code Statute 255-2”: Impaired driving/refusing to provide sample causing injury
Everyone who commits an offence under paragraph 253(a) and causes bodily harm to another person as a result is guilty of an indictable offence and liable to imprisonment for a term of not more than 10 years.
Everyone who, while committing an offence under paragraph 253(b), causes an accident resulting in bodily harm to another person is guilty of an indictable offence and liable to imprisonment for a term of not more than 10 years.
Everyone who commits an offence under subsection 254(5) and, at the time of committing the offence, knows or ought to know that their operation of the motor vehicle, vessel, aircraft or railway equipment, their assistance in the operation of the aircraft or railway equipment or their care or control of the motor vehicle, vessel, aircraft or railway equipment caused an accident resulting in bodily harm to another person is guilty of an indictable offence and liable to imprisonment for a term of not more than 10 years.
7 Definitions for Criminal Code Statute 253, 254 and 255 are taken directly from the Criminal Code (R.S., 1985, c. C-46) of Canada, as posted on the Department of Justice website. ( http://laws.justice.gc.ca/en/ )

Section 12 Alcohol-Related Criminal Code Convictions
239
“Criminal Code Statute 255-3”: Impaired driving/refusing to provide sample causing death
Everyone who commits an offence under paragraph 253(a) and causes the death of another person as a result is guilty of an indictable offence and liable to imprisonment for life.
Everyone who, while committing an offence under paragraph 253(b), causes an accident resulting in the death of another person is guilty of an indictable offence and liable to imprisonment for life.
Everyone who commits an offence under subsection 254(5) and, at the time of committing the offence, knows or ought to know that their operation of the motor vehicle, vessel, aircraft or railway equipment, their assistance in the operation of the aircraft or railway equipment or their care or control of the motor vehicle, vessel, aircraft or railway equipment caused an accident resulting in the death of another person, or in bodily harm to another person whose death ensues, is guilty of an indictable offence and liable to imprisonment for life.

Section 12 Alcohol-Related Criminal Code Convictions
240
Table 12-1: Total Alcohol-Related Criminal Code Convictions
Table 12-1
Total Alcohol-Related Criminal Code Convictions: 1995 to 2014*
Year
Alcohol Content Over .08 Impaired Driving Impaired Driving Causing
Injury/Death Refuse Sample
Total
253B 253BC 253A 253AC 255-2 255-3 254-5 254-5C
1995 2,478 N/A 405 N/A 25 3 264 N/A 3,175
1996 2,267 N/A 334 N/A 24 0 250 N/A 2,875
1997 2,519 N/A 366 N/A 37 3 277 N/A 3,202
1998 2,487 N/A 404 N/A 36 1 291 N/A 3,219
1999 2,460 N/A 441 N/A 29 3 320 N/A 3,253
2000 1,959 N/A 493 N/A 34 4 245 N/A 2,735
2001 1,783 N/A 574 N/A 35 2 186 N/A 2,580
2002 1,655 N/A 611 N/A 20 4 143 N/A 2,433
2003 1,464 N/A 567 N/A 19 3 144 N/A 2,197
2004 1,316 N/A 486 N/A 19 4 97 N/A 1,922
2005 1,089 N/A 474 N/A 16 4 98 N/A 1,681
2006 1,270 N/A 478 N/A 12 4 67 N/A 1,831
2007 1,301 3 618 1 14 2 80 0 2,019
2008 1,324 5 593 5 15 3 89 0 2,034
2009 1,344 4 657 3 23 0 84 1 2,116
2010 1,424 3 663 6 23 2 90 0 2,211
2011 1,252 8 577 0 19 5 94 1 1,956
2012 1,177 3 661 6 19 7 106 0 1,979
2013 1,127 5 661 8 16 4 100 1 1,922
2014 1,823 22 1,010 4 11 1 144 2 3,017
2009-13 Average 1,265 5 644 5 20 4 95 <1 2,037
% Change 2013 to 2014 61.8% 340.0% 52.8% -50.0% -31.3% -75.0% 44.0% 100.0% 57.0%
% Change 2009-13 Average to 2014
44.1% 378.3% 56.9% -13.0% -45.0% -72.2% 51.9% 233.3% 48.1%
% Change 1995 to 2014 -26.4% N/A 149.4% N/A -56.0% -66.7% -45.5% N/A -5.0%
*There is a one-year lag in the statistics reported to allow for court processing time. Therefore, 2014 is the most current year for which these statistics are available.
NOTE: In 2005, Manitoba added increased consequences for Criminal Code offences 253A, 253B and 254-5 committed with a youth under the age of 16 in the vehicle. These convictions are denoted by a trailing "C" in the statute number.

Section 12 Alcohol-Related Criminal Code Convictions
241
NOTE: Counts and percentage change statistics that cannot be calculated due to fact that the specific conviction code or type did not exist in historical data are noted in the table as “N/A”. Changes to the previous year and to the previous five-year trend for convictions committed with a youth in the vehicle should be interpreted with caution due to small counts. CAUTION: Beginning in 2007, convictions for impaired driving offences originating in other provinces and the United States have been added to the counts reported here. Prior to that time, these “out-of-province” offences were not included in the annual counts. The difference in convictions noted in 2008 compared to years prior to 2007 is affected by this change. In 2014, the count of drivers convicted of alcohol-related Criminal Code offences (3,017) increased by 57% (1,095 more convictions) compared to 2013 (1,922) and was also up by 48% compared to the previous five year (2009 to 2013) annual average (2,037). Comparing 2014 to the previous five year (2009 to 2013) annual average:
Convictions for “alcohol content over .08” increased by 45%;
Convictions for “impaired driving” increased by 53%; and,
Convictions for “refuse sample” increased by 53%. In 2014, there were 22 convictions for driving with a blood alcohol concentration (BAC) over .08 while a youth (under age 16) was in the vehicle, 4 for impaired driving while a youth was in the vehicle, and 2 for refusing to provide a breath or blood sample while a youth was in the vehicle. Counts of these convictions over the eight year period have fluctuated dramatically due to their overall low frequency in any given year. In the 20-year period from 1995 to 2014, total alcohol-related Criminal Code convictions declined by 5%, from 3,175 in 1995 to 3,017 in 2014.
Convictions for “alcohol content over .08” decreased by 26% (2,478 in 1995 to 1,845 in 2014).
Convictions for “impaired driving” increased by 137% (433 in 1995 to 1,026 in 2014).
Convictions for “refuse sample” decreased by 45% (264 in 1995 to 146 in 2014).

Section 12 Alcohol-Related Criminal Code Convictions
242
Table 12-2: Total Alcohol-Related Criminal Code Convictions by Age Group
Table 12-2
Total Alcohol-Related Criminal Code Convictions by Age Group: 1995 to 2014
<16 16-17 18-20 21-24 25-29 30-34 35-39 40-44 45-49 50-54 55-59 60-64 65-69 70-74 75+ Total
1995 3 82 364 471 518 547 422 278 177 111 86 59 33 11 13 3,175
1996 7 66 366 388 447 394 387 267 208 151 71 66 32 10 15 2,875
1997 7 105 430 495 451 440 440 302 201 130 78 50 44 18 11 3,202
1998 7 109 349 448 495 459 455 306 227 163 82 49 39 25 6 3,219
1999 13 81 412 504 484 445 429 330 248 151 56 46 28 15 11 3,253
2000 12 75 345 430 396 368 354 298 198 102 66 42 23 14 12 2,735
2001 11 91 357 379 384 334 322 259 177 128 54 44 22 15 3 2,580
2002 11 85 333 338 359 309 277 282 175 102 78 39 24 10 11 2,433
2003 7 65 300 308 317 269 237 233 178 109 81 44 26 14 9 2,197
2004 5 55 282 273 251 235 209 232 150 83 63 46 21 13 4 1,922
2005 6 46 210 272 243 204 178 158 139 91 51 45 24 5 9 1,681
2006 8 58 259 298 264 222 173 178 168 82 60 35 16 5 5 1,831
2007 7 50 274 289 306 248 244 200 151 110 67 35 19 9 10 2,019
2008 4 59 234 320 312 245 196 201 197 117 74 43 21 8 3 2,034
2009 2 37 255 341 358 268 222 213 176 120 57 37 19 8 3 2,116
2010 8 43 286 356 353 241 250 198 169 133 76 55 33 7 3 2,211
2011 5 36 235 333 334 220 200 166 157 122 88 36 15 7 2 1,956
2012 7 33 211 318 334 251 239 179 148 128 67 37 18 7 2 1,979
2013 4 29 179 292 302 278 237 179 148 118 72 45 26 12 1 1,922
2014 12 26 298 457 533 424 331 258 223 200 121 65 49 12 8 3,017
2009-13 Average 5 36 233 328 336 252 230 187 160 124 72 42 22 8 2 2,037
% Change 2013 to 2014
200.0% -10.3% 66.5% 56.5% 76.5% 52.5% 39.7% 44.1% 50.7% 69.5% 68.1% 44.4% 88.5% No change 700.0% 57.0%
% Change 2009-13 Average to 2014
130.8% -27.0% 27.8% 39.3% 58.5% 68.5% 44.2% 38.0% 39.7% 61.0% 68.1% 54.8% 120.7% 46.3% 263.6% 48.1%
% Change 1995 to 2014
300.0% -68.3% -18.1% -3.0% 2.9% -22.5% -21.6% -7.2% 26.0% 80.2% 40.7% 10.2% 48.5% 9.1% -38.5% -5.0%
Caution: The count of convictions shown does not take into account the number of licensed drivers by age group.

Section 12 Alcohol-Related Criminal Code Convictions
243
Comparing 2014 to the previous five year (2009 to 2013) annual average:
There are 48% more convictions in total (a difference of 980);
Convictions among the youngest age group (under age 16) increased by a count of 7;
Convictions among 16 to 24 year olds increased by 31% (a count of 184);
Convictions among 25 to 44 year olds is increased by 54% (a count of 542);
Convictions among 45 to 64 year olds increased by 53% (a count of 211); and,
Convictions among those aged 65 and older more than doubled, up to 69 from 32.
Figure 12-1: Percentage Change in Alcohol-Related Criminal Code Convictions by Age Group
During the twenty-year period 1995 to 2014, all age groups experienced a 5% decrease in alcohol-related Criminal Code convictions. Convictions among drivers aged:
under 16 increased by a count of 9;
16 to 24 decreased by 15%;
25 to 44 decreased by 12%;
45 to 64 increased by 41%; and,
65 and older increased by 21%.
-50
0
50
100
150
200
250
300
350
<16 16-24 25-44 45-64 65+
Per
cen
tage
Ch
ange
Percentage Change in Alcohol-Related Criminal Code Convictions by Age Group: 1995 to 2014

Section 12 Alcohol-Related Criminal Code Convictions
244
Table 12-3: Total Alcohol-Related Criminal Code Offences by Age Group and Conviction Type
Table 12-3
Total Alcohol-Related Criminal Code Offences by Age Group and Conviction Type: 2014
Age Group Alcohol Content Over .08 Impaired Driving
Impaired Driving Causing Injury/Death
Refuse Sample Total
253B 253BC 253A 253AC Injury Death 254-5 254-5C
<16 6 1 5 0 0 0 0 0 12
16-17 12 1 10 2 0 0 1 0 26
18-20 203 0 84 0 3 0 8 0 298
21-24 292 2 149 0 2 1 11 0 457
25-29 313 6 181 0 3 0 30 0 533
30-34 253 5 139 1 3 0 21 2 424
35-39 192 1 114 0 0 0 24 0 331
40-44 151 3 91 0 0 0 13 0 258
45-49 129 2 76 1 0 0 15 0 223
50-54 121 0 73 0 0 0 6 0 200
55-59 64 1 48 0 0 0 8 0 121
60-64 39 0 22 0 0 0 4 0 65
65-69 35 0 13 0 0 0 1 0 49
70-74 7 0 3 0 0 0 2 0 12
75+ 6 0 2 0 0 0 0 0 8
Total 1,823 22 1010 4 11 1 144 2 3,017
Caution: The count of convictions shown does not take into account population demographics by age group or the number of licensed drivers by age group.

Section 12 Alcohol-Related Criminal Code Convictions
245
Table 12-4: Alcohol-Related Criminal Code Convictions by Active Licensed Drivers and Age Group
Table 12-4
Alcohol-Related Criminal Code Convictions by Active Licensed Drivers and Age Group: 2004, 2009 and 2014
Age Group
2004 2009 2014
# Alcohol Convictions
% Total Alcohol
Convictions
% Licensed Drivers
# Alcohol Convictions
% Total Alcohol
Convictions
% Licensed Drivers
# Alcohol Convictions
% Total Alcohol
Convictions
% Licensed Drivers
<16-24* 615 32.0% 14.4% 635 30.0% 14.1% 793 26.3% 14.1%
25-44 927 48.2% 36.2% 1,061 50.1% 33.7% 1,546 51.2% 33.8%
45-64 342 17.8% 34.1% 390 18.4% 36.5% 609 20.2% 34.8%
65+ 38 2.0% 15.3% 30 1.4% 15.6% 69 2.3% 17.4%
Total 1,922 100% 100% 2,116 100% 100% 3,017 100% 100%
* Includes statistics for individuals under the age of 16 convicted of an alcohol-related Criminal Code offence, but who may not have been licensed at the time of offence.
Alcohol-related convictions increased by 57% from 2004 (count of 1,922) to 2014 (count of 3,017). <16 to 24 Age Group Drivers up to the age of 24 continue to be overrepresented in alcohol-related Criminal Code convictions. Drivers up to the age of 24 accounted for 14% of all licensed drivers in 2004 and 2009, but for 32% of alcohol offence convictions in 2004 and 30% in 2009. In 2014, these drivers again represent 14% of the licensed drivers, but accounted for 26% of convictions. 25 to 44 Age Group Drivers aged 25 to 44 continue to be overrepresented in alcohol-related Criminal Code convictions. In the years 2004, 2009, and 2014, drivers in this group made up 36%, 34%, and 34% of licensed drivers, respectively. However, these drivers accounted for 48%, 50%, and 51% of alcohol-related Criminal Code convictions in those years, respectively. 45 to 64 Age Group Drivers aged 45 to 64 are underrepresented in alcohol-related Criminal Code convictions. In the years 2004, 2009, and 2014, drivers in this group made up 34%, nearly 37%, and 35%, respectively, of licensed drivers. At the same time, these drivers accounted for 18%, 18%, and 20%, respectively, of alcohol-related Criminal Code convictions. 65 and Older Age Group Older drivers are underrepresented in alcohol-related Criminal Code convictions. In the years 2004, 2009, and 2014, drivers 65 years of age and older made up 15%, 16%, and 17% of licensed drivers, respectively, but accounted for only 2%, 1%, and 2% of alcohol-related Criminal Code convictions, respectively.

Section 12 Alcohol-Related Criminal Code Convictions
246
Table 12-5: Driver Involvement in “First”, “Second”, and “Third and Subsequent” Alcohol-Related Criminal Code Convictions by Age Group
Table 12-5
Driver Involvement in "First", "Second", and "Third and Subsequent" Alcohol-Related Criminal Code Convictions by Age Group: 2004, 2009 and 2014
Age Group
2004 2009 2014
Alcohol* Convictions
Licensed Drivers
Rate /1,000
Alcohol Convictions
Licensed Drivers
Rate /1,000
Alcohol Convictions
Licensed Drivers
Rate /1,000
Total Alcohol-Related Criminal Code Convictions
<16-24 615 104,810 5.9 635 109,587 5.8 793 122,192 6.5
25-44 927 263,983 3.5 1,061 261,782 4.1 1,546 293,540 5.3
45-64 342 248,289 1.4 390 283,428 1.4 609 302,229 2.0
65+ 38 111,489 0.3 30 121,412 0.2 69 151,278 0.5
Total 1,922 728,571 2.6 2,116 776,209 2.7 3,017 869,239 3.5
First Occurrence
<16-24 555 104,810 5.3 581 109,587 5.3 729 122,192 6.0
25-44 799 263,983 3.0 929 261,782 3.5 1,379 293,540 4.7
45-64 292 248,289 1.2 351 283,428 1.2 548 302,229 1.8
65+ 35 111,489 0.3 27 121,412 0.2 68 151,278 0.4
Total 1,681 728,571 2.3 1,888 776,209 2.4 2,724 869,239 3.1
Second Occurrence
<16-24 49 104,810 0.5 48 109,587 0.4 59 122,192 0.5
25-44 99 263,983 0.4 92 261,782 0.4 140 293,540 0.5
45-64 39 248,289 0.2 29 283,428 0.1 53 302,229 0.2
65+ 3 111,489 <0.1 2 121,412 <0.1 1 151,278 <0.1
Total 190 728,571 0.3 171 776,209 0.2 253 869,239 0.3
Third and Subsequent Occurrence
<16-24 11 104,810 0.1 6 109,587 0.1 5 122,192 <0.1
25-44 29 263,983 0.1 40 261,782 0.2 27 293,540 0.1
45-64 11 248,289 <0.1 10 283,428 <0.1 8 302,229 <0.1
65+ 0 111,489 <0.1 1 121,412 <0.1 0 151,278 <0.1
Total 51 728,571 0.1 57 776,209 0.1 40 869,239 <0.1
* For comparative purposes, the report assumes each alcohol-related Criminal Code conviction is for a single licensed driver although a single driver may obtain more than one alcohol-related Criminal Code conviction in any given year or specific incident.
Compared to ten years ago, the involvement rate of drivers in alcohol-related Criminal Code convictions has increased by 32% (2.6 per 1,000 licensed drivers in 2004; 3.5 per 1,000 licensed drivers in 2014).
8
8 Please note that due to the inclusion of only one decimal place in the figures displayed in Table 12-5 that some of the percentage changes in involvement rate noted will be different than those calculated using the figures from the table. The reported percentage change uses multiple decimal points in its calculation while the displayed figures have been rounded to one decimal.

Section 12 Alcohol-Related Criminal Code Convictions
247
<16 to 24 Age Group For every 1,000 licensed drivers in this age group, there were 5.9, 5.8 and 6.5 alcohol-related Criminal Code convictions in 2004, 2009 and 2014, respectively. The 2014 rate for this age group is 11% higher than the 2004 rate. 25 to 44 Age Group The relative involvement rate of drivers aged 25 to 44 in alcohol-related Criminal Code convictions (per 1,000 licensed drivers) was 3.5 in 2004, 4.1 in 2009, and 5.3 in 2014. The 2014 rate for this age group is 50% higher than the 2004 rate. 45 to 64 Age Group The relative involvement rate of drivers aged 45 to 64 in alcohol-related Criminal Code convictions (per 1,000 licensed drivers) was 1.4 in 2004, 1.4 in 2009, and 2.0 in 2014. The 2014 rate for this age group is 46% higher than the 2004 rate. 65 and Older Age Group The relative involvement rate of drivers aged 65 and older in alcohol-related Criminal Code convictions (per 1,000 licensed drivers) was 0.3 in 2004, 0.2 in 2009, and 0.5 in 2014. The 2014 rate for this age group is 34% higher than the 2004 rate. First Occurrence In 2014, the number of drivers convicted of an alcohol-related Criminal Code offence for the first time has increased by 62% compared to ten years ago (1,681 in 2004; 2,724 in 2014). Comparing the involvement rates (per 1,000 licensed drivers) for 2004 and 2014, first occurrence Criminal Code convictions increased by 36% overall and in each age group individually.
Age 24 and under – an 13% increase in 2014 compared to 2004
Age 25 to 44 – a 55% increase in 2014 compared to 2004
Age 45 to 64 – a 54% increase in 2014 compared to 2004
Age 65 and older –a 43% increase in 2014 compared to 2004 Second Occurrence In 2014, the number of drivers convicted of an alcohol-related Criminal Code offence for the second time has increased by 33% compared to ten years ago (190 in 2004; 253 in 2014). Comparing the involvement rates (per 1,000 licensed drivers) for 2004 and 2014, second occurrence Criminal Code convictions increased by 12% overall.
Age 24 and under – a 3% increase in 2014 compared to 2004
Age 25 to 44 – a 27% increase in 2014 compared to 2004
Age 45 to 64 – a 12% increase in 2014 compared to 2004
Age 65 and older – a 75% decrease in 2014 compared to 2004; a count of 1 in 2014 compared to 3 in 2004
Third and Subsequent Occurrence In 2014, the number of drivers convicted of an alcohol-related Criminal Code offence for the third and subsequent time has decreased by 22% compared to ten years ago (51 in 2004; 40 in 2014). Comparing the involvement rates (per 1,000 licensed drivers) for 2004 and 2014, third and subsequent occurrence Criminal Code convictions decreased by 34% overall.
Age 24 and under – a count of 5 in 2014 compared to 11 in 2004; a 61% decrease in the rate
Age 25 to 44 – a count of 27 in 2014 compared to 29 in 2004; a 16% decrease in the rate
Age 45 to 64 – a count of 8 in 2014 compared to 11 in 2004; a 40% decrease in the rate
Age 65 and older – no change (a count of 0) in 2014 compared to none in 2004 CAUTION: Please interpret numbers of convictions for “second” and “third and subsequent” offences with caution. Due to the small numbers of these convictions overall, small shifts in the counts can produce relatively large percentage change differences.


GLOSSARY – Terms & Definitions


Glossary Terms and Definitions
251
Terms and Definitions
“Accident Configuration”
Briefly describes the action taken by a vehicle immediately prior to or at the start of the collision, including such events as rear-ending another vehicle, side-swiping another vehicle, turning into (the path of) another vehicle, parking, meeting another vehicle at an intersection and/or leaving the roadway.
“Other” in terms of accident configuration includes, primarily, collisions involving more than one configuration or sequence of events.
“Active Drivers”
Drivers holding an active Manitoba Driver’s Licence of any specific Licence Class “At-fault Contributing Factor”
A contributing factor where some action or condition other than “driving properly” and “apparently normal” has been noted.
“ATV”
All Terrain Vehicle; includes vehicles with 3, 4 and 6 wheels. “Blood alcohol concentration (BAC)”
A measure of the concentration of alcohol in a person’s blood. A measure of “.08 BAC” is equivalent of 80 milligrams of alcohol per 1,000 milligrams of blood, or 0.08%.
“Casualty Type”
A classification of the severity of the injury sustained by a victim in a traffic collision, i.e., whether someone was killed or injured. This classification also includes a designation for the severity of each non-fatal injury sustained (i.e., victims sustaining a serious/major, minor or minimal injury).
“Collision Severity”
A classification of a collision based on the most severe result of the collision, i.e., whether someone was killed (fatal), injured (injury) or property damage only (PDO) occurred.
“Collision Type”
Refers to the object struck by a motor vehicle during a collision (including: a pedestrian, another motor vehicle, a train, a motorcycle, a bicycle, an animal, and fixed objects) or to what happened to the vehicle in a single-vehicle collision (including: overturned on roadway and ran off roadway).
“Contributing Factor”
Those circumstances or factors recorded as having contributed to the collision or its severity. Factors can be selected from four categories: driver action, human condition, vehicle condition, or environmental condition. The TAR allows for up to three contributing factors to be recorded for each driver or vehicle involved in the collision.
“Criminal Code 253A” and “Criminal Code 253B”
9: Impaired driving
Every one commits an offence who operates a motor vehicle or vessel or operates or assists in the operation of an aircraft or of railway equipment or has the care or control of a motor vehicle, vessel, aircraft or railway equipment, whether it is in motion or not,
o (a) while the person’s ability to operate the vehicle, vessel, aircraft or railway equipment is impaired by alcohol or a drug; or
o (b) having consumed alcohol in such a quantity that the concentration in the person’s blood exceeds eighty milligrams of alcohol in one hundred millilitres of blood.
For greater certainty, the reference to impairment by alcohol or a drug in paragraph (a) includes impairment by a combination of alcohol and a drug.
“253AC” and “253BC” indicate a conviction when there was a youth in the vehicle.
9 Definitions for Criminal Code Statute 253, 254 and 255 are taken directly from the Criminal Code (R.S., 1985, c. C-46) of Canada,
as posted on the Department of Justice website. ( http://laws.justice.gc.ca/en/ )

Glossary Terms and Definitions
252
“Criminal Code Statute 254-5”: Refusing to comply with a request for sample
If a peace officer has reasonable grounds to suspect that a person has alcohol or a drug in their body and that the person has, within the preceding three hours, operated a motor vehicle or vessel, operated or assisted in the operation of an aircraft or railway equipment or had the care or control of a motor vehicle, a vessel, an aircraft or railway equipment, whether it was in motion or not, the peace officer may, by demand, require the person to comply with paragraph (a), in the case of a drug, or with either or both of paragraphs (a) and (b), in the case of alcohol:
o (a) to perform forthwith physical coordination tests … and, if necessary, to accompany the peace officer for that purpose; and
o (b) to provide forthwith a sample of breath that, in the peace officer’s opinion, will enable a proper analysis to be made by means of an approved screening device and, if necessary, to accompany the peace officer for that purpose.
Everyone commits an offence who, without reasonable excuse, fails or refuses to comply with a demand made under this section.
“254-5C” indicates a conviction when there was a youth in the vehicle. “Criminal Code Statute 255-2”: Impaired driving/refusing to provide sample causing injury
Everyone who commits an offence under paragraph 253(a) and causes bodily harm to another person as a result is guilty of an indictable offence and liable to imprisonment for a term of not more than 10 years.
Everyone who, while committing an offence under paragraph 253(b), causes an accident resulting in bodily harm to another person is guilty of an indictable offence and liable to imprisonment for a term of not more than 10 years.
Everyone who commits an offence under subsection 254(5) and, at the time of committing the offence, knows or ought to know that their operation of the motor vehicle, vessel, aircraft or railway equipment, their assistance in the operation of the aircraft or railway equipment or their care or control of the motor vehicle, vessel, aircraft or railway equipment caused an accident resulting in bodily harm to another person is guilty of an indictable offence and liable to imprisonment for a term of not more than 10 years.
“Criminal Code Statute 255-3”: Impaired driving/refusing to provide sample causing death
Everyone who commits an offence under paragraph 253(a) and causes the death of another person as a result is guilty of an indictable offence and liable to imprisonment for life.
Everyone who, while committing an offence under paragraph 253(b), causes an accident resulting in the death of another person is guilty of an indictable offence and liable to imprisonment for life.
Everyone who commits an offence under subsection 254(5) and, at the time of committing the offence, knows or ought to know that their operation of the motor vehicle, vessel, aircraft or railway equipment, their assistance in the operation of the aircraft or railway equipment or their care or control of the motor vehicle, vessel, aircraft or railway equipment caused an accident resulting in the death of another person, or in bodily harm to another person whose death ensues, is guilty of an indictable offence and liable to imprisonment for life.
“Driver Action”
A category of contributing factors attributed to actions taken or performed by a driver immediately prior to a collision.
“Driver Involvement Rate”
A calculation of the number of drivers involved in traffic collisions for every 10,000 drivers licensed in Manitoba. The total number of drivers licensed to drive includes both active and suspended drivers. This involvement rate does not take into account the number of vehicle kilometres driven by each driver group.
“Environmental Condition”
A category of contributing factors attributed to environmental conditions (i.e., weather, road surface and animal actions) immediately prior to a collision.
“Fatal Collision”
A motor vehicle collision in which at least one person is killed as a result of the collision. The death must have occurred within thirty days of the collision occurrence.

Glossary Terms and Definitions
253
“Graduated Driver Licensing (GDL)”
A three-stage program designed to help new drivers, regardless of age, acquire the knowledge and skill needed to safely operate a motor vehicle. Each licence stage has specific rules and restrictions governing when and under what circumstances the holder is allowed to operate a motor vehicle, enabling novice drivers to gain more experience under a greater variety of driving conditions. Both Class 5 and Class 6 licences have a GDL stage associated with them.
Three stages of GDL: Learner (5/L or 6/L); Intermediate (5/I or 6/I); and, Full (5/F or 6/F).
To view a full discussion of the GDL program in Manitoba, please visit: o http://www.mpi.mb.ca/PDFs/DVL_PDFs/GDLGuide.pdf; ou en Français, o http://www.mpi.mb.ca/PDFs/DVL_PDFs/GDLGUIDEfr.pdf
“Human Condition”
A category of contributing factors attributed to the physical or mental condition of a driver immediately prior to a collision, most often that limit the driver’s ability to drive safely or properly.
“Injured”
The casualty type “injured” indicates the victim sustained some level of personal injury, but in which they were not killed. Levels of injury include: ‘serious’ or ‘major’ (admitted to hospital); ‘minor’ (treated and released from hospital); and, ‘minimal’ (no hospital treatment required). ‘Other’ injury is noted when the severity of the victim’s injuries is not known or recorded in the TAR.
“Injury Collision”
A motor vehicle collision in which at least one person has been recorded as sustaining some level of personal injury, but in which no one is fatally injured or killed.
“Involvement”
A calculation of the number of collisions per specific unit of licensed drivers or registered vehicles. For the purposes of this report, involvement is calculated per 10,000 licensed drivers or registered vehicles.
“Killed”
The casualty type “killed” indicates the victim involved in the traffic collision died as a result of their injuries within thirty (30) days of the collision occurrence.
“Licence Class”
A Manitoba Driver’s Licence of a specific level which permits the holder to operate vehicles within a specific Vehicle Class
“Licensed Drivers”
A count of all Manitobans aged 16 and older who hold a valid licence within the licensing year including active and suspended drivers. (See Section 2 Licensed Drivers for more information)
“Light Condition”
Describes the light conditions at the scene of the accident, including: o Day – the light conditions which normally occur between one half hour after sunrise and
one half hour before sunset; o Dawn – the light conditions which normally occur between one half hour before sunrise
and one half hour after sunrise; o Dusk – the light conditions which normally occur between one half hour before sunset
and one half hour after sunset; o Dark – the light conditions which normally occur between one half hour after sunset and
one half hour before sunrise; and, o Artificial lighting – artificial illumination devices were functioning at the accident site under
light conditions which normally occur between one half hour after sunset and one half hour before sunrise.
“Light Duty Vehicles”
A classification of vehicle types including those defined in the Traffic Accident Report (TAR) as: passenger vehicles (automobile), mini/multi-purpose van, van under 4,500 kg and pick-up under 4,500 kg.

Glossary Terms and Definitions
254
“NSC Commercial Vehicles”
The National Safety Code (NSC) classification of vehicles is a classification of vehicle types including those defined in the Traffic Accident Report (TAR) as: “Truck greater than 4,500 kilograms (unit chassis)”, “Power Unit for Semi-Trailer”, “Truck (Other)” (where the type and size of truck is unknown), “School Bus”, “Transit Bus (Urban)”, “Inter-City Bus”, and “Bus (Other)”. These vehicles bear a National Safety Code Number and are entered onto the National Safety Code Collision Monitoring Report.
“Off-road Vehicle (ORV)”
One of several vehicle types designed for off-road use. It includes snowmobiles, off-road motorcycles, all-terrain vehicles (ATVs), amphibious vehicles, dune/sport buggies, and 4-wheel drive vehicles operated off-road.
“Pedestrian Action”
Refers to the actions taken by a pedestrian immediately prior to a collision (including: crossing at an intersection with or without the right-of-way, crossing between intersections, running into the roadway, walking on the roadway, lying on the roadway, playing on the roadway, etc.).
“Pedestrian Involvement Rate”
A calculation of the number of pedestrians involved in traffic collisions for every 100,000 people in the general population in Manitoba. Population statistics are taken from the Provincial government and can be found at the following web address: http://www.gov.mb.ca/health/annstats/index.html
“Pre-collision activity”
The action of a vehicle immediately prior to involvement in a collision. This is an indication of what the vehicle was doing prior to the accident or to the driver realizing that a collision may occur and does not include vehicle manoeuver to avoid the collision.
“Property Damage Only (PDO) Collision”
A motor vehicle collision in which no injury or fatality is sustained and only property damage is the result.
“PSV Vehicles”
Also known as ‘public service vehicles’, a classification of vehicle types including those defined in the Traffic Accident Report (TAR) as: “Other school vehicle”, and “Emergency vehicles”, including ambulance, fire and police vehicles.
“Public Roadway”
A public roadway in Manitoba is considered to be any provincial road (PR), provincial trunk highway (PTH) or municipal road, including the entrances to and exits from these roadways. This excludes all off-road areas, parking lots, private property and First Nation Reserve roads (unless the road is a PR or PTH running through, across or on Reserve lands).
“Region”
Manitoba Infrastructure and Transportation is served by 5 regional office locations, each responsible for a geographic region (for boundaries, see Map 11-1). “Regions” are used to indicate the region in which a collision occurred.
“Reportable Collision”
Prior to a change in the Highway Traffic Account (which took effect in October of 2011), motor vehicle collisions resulting in a fatality, injury or property damage in excess of $1,000 were required by law to be reported to a law enforcement agency. Subsequently, the law enforcement agency completed a Traffic Accident Report for the collision.
Amendments to the Highway Traffic Act (which received Royal Ascent in June 2011 and took effect in October of 2011) changed the definition of a reportable collision to require a police report be made if the driver is aware, has reason to believe, or is later made aware, that a collision involves: a fatality; an injury requiring admittance to hospital for observation or treatment; another driver not having a valid driver’s licence; another vehicle not validly registered; the driver of another vehicle not providing the required particulars; the driver of another vehicle not stopping at the scene of the accident; or, alcohol or another intoxicating substance as a factor in the accident.

Glossary Terms and Definitions
255
As of October 2011, all accidents occurring on a public roadway where the above conditions are not met are reported through the claim registration process with Manitoba Public Insurance.
As of 2012 and consistent with other jurisdictions in Canada, it is a requirement that a minimum of $2,000 damage (all vehicles combined) is necessary for property damage only (PDO) collisions to be included in this report.
This report deals with these reportable collisions and the TARs arising from them, regardless of whether the TAR is generated by law enforcement agencies or by Manitoba Public Insurance.
“Reportable ORV Collision”
ORV collisions resulting in a fatality, injury or property damage in excess of $1,000 are required by law to be reported to a law enforcement agency. Subsequently, the law enforcement agency completes a Traffic Accident Report (TAR) for the collision. This report deals with these reportable ORV collisions and the TARs arising from them.
“Road User Class”
A classification based on how a person involved in a collision was using the road at the time of the collision. It includes: Drivers (of motor vehicles), Passengers (in motor vehicles), those Riding/Hanging On (to a motor vehicle), Motorcyclist (drivers and passengers), Moped (drivers and passengers), Bicyclist (drivers and passengers), and Pedestrians.
“Rural Location”
Collisions occurring on primary highways, secondary highways and local roadways, including the Trans Canada Highway and excluding those that occur within the municipal boundaries of an urban area.
“Suspended drivers”
Drivers holding a Manitoba Driver’s Licence of any specific Licence Class who have been disqualified from driving for some reason. Although the list is extensive, some possible suspensions could be for driving violations, medical conditions, administrative suspensions and criminal code convictions.
“Urban Location”
Collisions occurring within the municipal boundaries of urban areas, including Winnipeg, Brandon, Portage la Prairie, Flin Flon, Dauphin, Thompson, The Pas, Selkirk and others.
“Vehicle Class”
Category of vehicles meeting specific designations and specifications
Non-commercial vehicle classes are vehicles registered for private use and include: o Passenger - A motor vehicle classified by the manufacturer as a passenger car or which
is designed, constructed or adapted for the principle purpose of transporting passengers and includes a delivery car, but does not include a motorcycle, moped or motor vehicle which is designed, constructed or adapted for the purpose of carrying goods or commodities.
o Antique - A car, truck or motorcycle that is more than thirty years old at the time of application for registration. A motor vehicle registered as an antique car, truck or motorcycle can be driven only when: taking it to be repaired or serviced; displaying it to the public in a parade or procession and driving it to or from such a parade or procession; driving it to an antique car, truck or motorcycle rally as authorized by the Registrar of Motor Vehicles.
o Motorcycle - A vehicle that has a steering handlebar completely constrained from rotating in relation to the axle of one wheel in contact with the ground, is designed to travel on not more than three wheels in contact with the ground, has a minimum unladen seat height of 650 millimetres, has a minimum wheel rim diameter of 250 millimetres, has a minimum wheelbase of 1,016 millimetres, and, has a maximum speed capability of more than 50 km/h but does not include a moped, power-assisted bicycle or tractor.
o Moped - A motor vehicle which has 2 tandem wheels or 3 wheels, each of which is more than 250 millimetres in diameter, has a seat or saddle having a minimum unladen height of 650 millimetres, when measured from the ground level to the top of the forward most part of the saddle, is capable of being driven at all times by pedals only if so equipped, by motor only or by both pedals and motor, and, the motor has a piston displacement of not more than 50 cubic centimetres, or is an electric motor neither of which is capable of enabling the moped to attain a speed greater than 50 km/h.

Glossary Terms and Definitions
256
o Truck – see “Passenger”. o Farm Truck - A motor vehicle classified as a “truck” at time of registration and is owned
by a person engaged in farming. o Snow Vehicle A vehicle that has a gross vehicle weight in exceeding 454 kilograms and
is not equipped with wheels, but in place thereof is equipped with tractor treads alone or with tractor treads and skis, or with skis and a propeller, or is a toboggan equipped with tractor treads or a propeller, is designed primarily for operating over snow or ice, and is used primarily for that purpose, and is designed to be self-propelled.
o Trailer - A vehicle designed for carrying persons or chattels, and for being towed by a motor vehicle, and includes a farm trailer but does not include an implement of husbandry that is temporarily towed, propelled, or moved upon a highway.
o Tractor - A self-propelled vehicle that is designed primarily for traction purposes, and that is not itself constructed to carry a load other than the driver, and includes a farm tractor but does not include a truck tractor or a special mobile machine.
Commercial vehicle classes are those involving vehicles registered to or for the use of a business and include:
o Truck - A truck (or trailer) used to transport the registered owner’s (or lessee’s) own business goods: beyond a radius of 20 kilometres of the City of Winnipeg, where the registered owner’s business address is in the City of Winnipeg, beyond a radius of 30 kilometres of a city, town or village other than the City of Winnipeg, where the registered owner’s address is not in the City of Winnipeg.
o Public Service Vehicles (PSV) - A motor vehicle or trailer operated by or on behalf of any person, for transportation for gain or compensation of persons or property upon a highway, and includes a semi-trailer truck; but does not include the passenger-carrying-motor vehicles of an electric, or steam railway or motor bus company operating on the streets of a city, or school buses, ambulances or hearses or motor vehicle operated for gain or compensation under The Taxicab Act or a municipal by-law in cities, towns, and villages.
o Dealer - A person who carries on the business as principal or agent, or who holds himself or herself out as carrying on the business as principal or agent, (a) of buying motor vehicles or trailers; (b) of selling motor vehicles or trailers, whether or not in combination with leasing them; or (c) of buying and selling motor vehicles or trailers, whether or not in combination with leasing them.
o Repairer - A person who maintains a garage for the purpose of rendering services therein upon motor vehicles and/or trailers, at a charge, price or consideration; or who owns and operates a fleet of five or more motor vehicles or trailers; or both, and maintains a facility for their repair, is permitted under The Highway Traffic Act to obtain “Repairer” licence plates to be used to transport motor vehicles for repair from place of origin to the repair facility and return, and the testing of the motor vehicle after the repair work has been completed.
o Taxi - A motor vehicle had, kept, used, intended for use, or operated, for the transportation of persons for compensation, and includes such vehicles when garaged or under repair; but does not include a public service vehicle, a trolley bus or passenger-carrying motor vehicle or a public transportation system operating on the streets of a city, a school bus, an ambulance, a hearse, or a motor vehicle, or vehicle of a class of motor vehicles, that The Taxicab Board established under The Taxicab Act excludes from the definition of a taxicab under that Act.
o Livery - A vehicle licenced under The Highway Traffic Act for the transportation of persons for compensation and is licensed to operate in the Province according to terms issued by the Motor Transport Board.
o Trailers – see previous definition.

Glossary Terms and Definitions
257
“Vehicle Condition”
A category of contributing factors attributed to the physical condition of a vehicle immediately prior to a collision.
“Vehicle Occupant”
All those in the “Road User Class” of “Drivers” and “Passengers”. It excludes “Motorcyclist”, “Bicyclist”, “Moped”, those “Riding/Hanging On” to a vehicle and “Pedestrians”.
“Vehicle Involvement Rate”
A calculation of the number of vehicles involved in traffic collisions for every 10,000 vehicles registered in Manitoba. The total number of vehicles registered is based on a point-in-time observation of the number of vehicles registered in specific vehicle classes. More detail regarding the methodology used to count registered vehicles can be found in “Section 3 Vehicle Registrations” of this report.
“Victim Involvement Rate”
A calculation of the number of victims or casualties involved in traffic collisions for every 100,000 people in the general population in Manitoba. Population statistics are taken from the Provincial government and can be found at the following web address: http://www.gov.mb.ca/health/annstats/index.html
“Weather Condition”
Describes the weather conditions prevalent at the time of the accident, including: o Clear – bright conditions, without precipitation or airborne matter, are recorded as clear; o Cloudy – dull, overcast conditions, without precipitation or airborne matter, are recorded
as cloudy; o Raining – raining (self explanatory); o Snowing – snowing (self explanatory); o Fog or Mist – airborne matter, of natural origin, which obscures visibility; o Smoke or Dust – airborne matter, of a natural or artificial origin, which obscures visibility; o Freezing Rain / Sleet / Hail – freezing rain, sleet or hail (self explanatory); o Drifting Snow – snow drifting on or above roadway, which obscures visibility of the
roadway, road markings, traffic devices or roadway fixtures; and, o Strong Winds – used if wind was a contributing factor in the accident.


