190
March 2015 Revised November 2015 TRAFFIC OPERATIONAL & QUEUING ANALYSIS Maybank Highway (S.C. 700) Improvements CHARLESTON COUNTY, SOUTH CAROLINA

March 2015
Revised November 2015
TRAFFIC OPERATIONAL
& QUEUING ANALYSIS
Maybank Highway (S.C. 700) Improvements
CHARLESTON COUNTY, SOUTH CAROLINA
Maybank Highway Traffic Analysis & Queuing Report
i
TABLE OF CONTENTS
INTRODUCTION .................................................................................................................................................... 1 PROJECT BACKGROUND .................................................................................................................................................... 1 STUDY AREA / PROJECT LOCATION ........................................................................................................................... 2 TRAFFIC DATA COLLECTION ............................................................................................................................................ 4
Turning Movement Count Data ..................................................................................................................................... 4 24-Hour Arterial Tube Count Data ............................................................................................................................... 5 Historical AADT Data ........................................................................................................................................................ 11 Traffic Signal Data............................................................................................................................................................... 11 Field Visit .................................................................................................................................................................................. 11 Queue Evaluation ................................................................................................................................................................ 11
STUDY METHODOLOGY ..................................................................................................................................................... 11 ANALYSIS YEARS ................................................................................................................................................................... 12 EXISTING CONDITION ..................................................................................................................................... 14 EXISTING ROADWAY NETWORK ................................................................................................................................. 14
Maybank Highway (SC 700) ......................................................................................................................................... 14 River Road (S-54) ............................................................................................................................................................... 14
FUTURE NO BUILD ................................................................................................................................................................. 15 EXISTING TRAFFIC VOLUME .......................................................................................................................................... 17 FUTURE CONDITION ........................................................................................................................................ 19 TRAVEL DEMAND FORECASTING ............................................................................................................................... 19 FUTURE YEAR TRAFFIC VOLUME ............................................................................................................................... 19
Existing and Future Year AADT .................................................................................................................................. 19 FUTURE YEAR BUILD TRAFFIC VOLUME ............................................................................................................... 22 FUTURE YEAR BUILD GEOMETRIC MODIFICATIONS .................................................................................... 24 OPERATIONAL ANALYSIS SECTION ........................................................................................................ 27 TRAFFIC OPERATIONAL ANALYSIS ........................................................................................................................... 27
Analysis Methodology for Stop Controlled Intersections ............................................................................. 27 Analysis Methodology for SIGNAL Controlled Intersections ..................................................................... 27
EXISTING CONDITION OPERATIONAL ANALYSIS ............................................................................................ 28 Existing (2014) Intersection Operational Analysis ........................................................................................... 28
EXISTING YEAR (2014) BUILD CONDITION OPERATIONAL ANALYSIS .............................................. 29 FUTURE YEAR NO-BUILD (BACKGROUND) CONDITION OPERATIONAL ANALYSIS ................ 31
2040 No-Build Intersection Operational Analysis ............................................................................................. 31 FUTURE YEAR BUILD OPERATIONAL ANALYSIS ............................................................................................. 32 MICROSIMULATION ANALYSIS SECTION .............................................................................................. 38 PURPOSE OF MICROSIMULATION ANALYSIS .................................................................................................... 38
Existing Condition and Queue Evaluation ............................................................................................................ 38 Construction and Calibration of the Model ........................................................................................................... 38 Development of Future Condition Models ............................................................................................................ 39 Evaluated Measures of Effectiveness ..................................................................................................................... 39 Simulation Reports ............................................................................................................................................................. 40
CONCLUSIONS .................................................................................................................................................. 47 SUMMARY OF FINDINGS ............................................................................................................................... 51
Maybank Highway Traffic Analysis & Queuing Report
ii
LIST OF FIGURES
Figure 1: Project Location Map ............................................................................................................................................. 3 Figure 2: 24-Hour Traffic Distribution - Maybank Highway at 530 feet East of River Road ................. 7 Figure 3: 24-Hour Traffic Distribution - Maybank Highway at 250 feet West of River Road ............... 8 Figure 4: 24-Hour Traffic Distribution – River Road at 500 feet North of Maybank Highway ............. 9 Figure 5: 24-Hour Traffic Distribution – River Road at 240 feet South of Maybank Highway ........... 10 Figure 6: Existing Lane-Use Configuration within the Study Area ................................................................... 16 Figure 7: Existing (2014) Morning and Afternoon Peak Hour Traffic Volume ........................................... 18 Figure 8: 2040 No-Build Design Hour Traffic Volume – Both I-526 Scenarios ......................................... 21 Figure 9: 2040 Build Design Hour Vol. – Both I-526 Scenarios....................................................................... 23 Figure 10: 2040 Build Geometric Configurations ...................................................................................................... 26
LIST OF TABLES
Table 1: (Excerpted Table from Appendix C) Existing and Future Year Average Annual Daily
Traffic (AADT) ...................................................................................................................................................... 20 Table 2: Two-Way stop Controlled Intersection Level of Service (LOS) Criteria ..................................... 27 Table 3: SIGNAL Controlled Intersection Level of Service (LOS) Criteria .................................................. 28 Table 4: Existing Condition Study Intersection Operational Analysis ............................................................ 29 Table 5: Existing Year (2014) Build Comparison..................................................................................................... 30 Table 6: 2040 No-Build Intersection Operational Analysis .................................................................................. 31 Table 7: 2040 Build Intersection Operational Analysis .......................................................................................... 33 Table 8: 2040 Build Without Pitchfork Intersection Operational Analysis .................................................... 35 Table 9: 2040 Capacity Analysis Comparison Table .............................................................................................. 37 Table 10: MOE #1, Qualitative Queuing Evaluation ................................................................................................ 41 Table 11: MOE #2, MOE #3 Network Speed and Trips ........................................................................................ 43 Table 12: MOE #4, Average Queue ................................................................................................................................. 45
LIST OF APPENDICES
Appendix A: Traffic Data Collection – Field Traffic Count ..................................................................................... A Appendix B: Signal Timing Data ......................................................................................................................................... B Appendix C: Travel Demand Model Description ........................................................................................................ C Appendix D: Synchro Results – Existing Condition .................................................................................................. D Appendix E: Synchro Results – 2040 No-Build Condition .................................................................................... E Appendix F: Synchro Results – 2040 Build ................................................................................................................... F Appendix G: Synchro Results – 2040 Build without Pitchfork ............................................................................ G

Maybank Highway Traffic Analysis & Queuing Report
1
INTRODUCTION
Project Background
Within the study area, Maybank Highway (SC 700) is a two lane state highway that runs in a
northeast to southwest direction across Johns Island in the metropolitan area of Charleston,
South Carolina. Traffic congestion along Maybank Highway has increased in recent years and is
expected to worsen as the area continues to grow.
This study evaluated the roadway operation of Maybank Highway beginning at the entry to
Johns Island crossing the bridge over the Stono River (Paul J Gelegotis Bridge) and ending at
River Road. River Road was also examined north and south of Maybank Highway beyond the
nearest intersecting roads of Stardust Way to the north and Cane Slash Road to the south. The
goal of this study was to examine existing (2014) and future year (2040) traffic conditions along
this portion of the Maybank Highway corridor and to examine different alternatives to alleviate
the westbound queuing on the Maybank Highway entrance to Johns Island.
Traffic operational analyses were performed at the key intersections within the study area. Since
the construction completion date of the proposed I-526 extension is uncertain at this moment,
the 2040 analyses were performed for two separate scenarios: with and without the I-526
extension. Under the “With I-526 extension” scenario, the Maybank Highway/River Road
intersection includes improvements as identified in the most recent I-526 concept layout.
The operational analysis took into account the following traffic conditions.
Existing (2014) year traffic condition;
Future (2040) Design year No-Build traffic condition, without I-526;
Future (2040) Design year No-Build traffic condition, with I-526;
Future (2040) Design year Build traffic condition, without I-526;
Future (2040) Design year Build traffic condition, with I-526.
The operational analysis was performed for Existing, Future No-Build and Future Build
scenarios. The Build scenario included three phases of construction. Phase 1 is the Maybank
Highway Widening. Phase 2 is the Northern Pitchfork Road. Phase 3 is the Southern Pitchfork
Road. The key features of these phases are:
Widening Maybank Highway to three lanes from the existing merge point approximately
1,650 feet west of Old Maybank Highway to River Road. This will allow for two inbound
lanes from the bridge over the Stono River and one outbound lane;
Providing dedicated left turn lanes at key intersections, in this case, River Road, in order
to separate left turning traffic to allow through traffic to proceed more efficiently.
Providing a new parallel two lane roadway to the north of Maybank Highway beginning
at the intersection of Maybank Highway and Fenwick Hall Allee and terminating at a
point on River Road. This roadway is referred to as the Northern Pitchfork Road. A new
roundabout is proposed on the Northern Pitchfork Road adjacent to the existing Fenwick
Hall Allee.

Maybank Highway Traffic Analysis & Queuing Report
2
Providing a new parallel two lane roadway to the south of Maybank Highway beginning
at the end of the bridge over the Stono River and terminating at a point on the River
Road. This roadway is referred to as the Southern Pitchfork Road.
Figure 10 shows the geometric configuration of the Build scenario.
In addition to the traffic operational analyses, microsimulation modeling was conducted to
examine the westbound queuing of Maybank Highway and possible mitigation strategies. Four
different sites for a westbound lane drop were examined:
Existing Condition/Future No Build Condition: Lane drop approximately 1,650 feet west
of Old Maybank Highway.
Build Condition: Lane drop at River Road – This would call for widening Maybank
Highway to three lanes east of River Road. The scenario was examined both with and
without the Pitchfork Roads.
Merge Option 1: Lane drop 400 feet west of Fenwick Hall Allee – This would call for
widening Maybank Highway to three lanes from the current merge point to 400 feet west
of Fenwick Hall Allee. This scenario was examined with and without the Pitchfork Roads.
Merge Option 2: Lane drop approximately the end of the curve travelling westbound on
Maybank Highway after Old Maybank Highway – This would extend the current
westbound two-lane section approximately 670 feet further west from its current lane
drop location. This scenario was examined with and without the Pitchfork Roads.
All four locations were examined under the two separate scenarios of I-526 extension being
constructed and I-526 extension not being constructed.
Study Area / Project Location
The study area is located on Johns Island, the second largest island on the east coast. Across
the Stono River from Charleston, Johns Island is surrounded by the Intracoastal Waterway, the
Stono River, the Kiawah River and Bohicket Creek. A patchwork of natural waterways
separated by farmland, residential properties, and commercial development, Johns Island has
always served as the agricultural heart of the area. Maybank Highway is located approximately
6.0 miles west of the peninsula of Charleston, SC.
The study area covers approximately 2.0 miles along Maybank Highway (SC 700) between the
bridge over the Stono River and its intersection with River Road (S-54). The intersections being
analyzed include two existing signalized intersections along Maybank Highway at River Road
and Old Maybank Highway and three stop sign controlled intersections. The stop controlled
intersections in the study area are Maybank Highway at Fenwick Hall Allee, River Road at
Stardust Way, and River Road at Cane Slash Road.
The location map with the study area roadway network and intersections are shown in Figure 1.

Maybank Highway Traffic Analysis & Queuing Report
3
Figure 1: Project Location Map
River Road
Stono River
Cane Slash Road
Old Maybank Highway
Stardust Way
Fenwick Hall Allee
Maybank Highway

Maybank Highway Traffic Analysis & Queuing Report
4
Traffic Data Collection
Two types of traffic data were collected at all the study intersections and arterials. They were
manual intersection turning movement count data and 24-hour arterial automatic (tube) traffic
counts.
Turning Movement Count Data
The manual turning movement counts were collected at the study intersections on May 20, 2014
in 15 minutes intervals between 7:00 and 10:00 AM in the morning and 3:00 and 6:00 PM in the
afternoon. The 6-hour long manual turning movement counts were collected at the following five
study intersections:
i. Maybank Highway and Fenwick Hall Allee
ii. Maybank Highway and River Road
iii. River Road and Cane Slash Road
iv. River Road and Stardust Way
v. Maybank Highway and Old Maybank Highway.
The traffic data collected from the field does not show a uniform peak hour at all study
intersections. Therefore, this study uses each individual intersection peak hour traffic volume to
develop a conservative assessment of traffic flow in the area. The individual peak hour traffic
volumes were then balanced between the intersections. During the volume balancing
procedure, the existing turn percentages at the study intersections remained unchanged from
the field count data. These balanced intersection turning movements were then used in
performing the operational analysis for existing conditions. The existing traffic operational
analyses were performed for the morning and afternoon peak hour scenarios. The turning
movement counts were collected for two separate categories; automobiles and heavy vehicles
(trucks/buses). The heavy vehicle ratios at each approach of the study intersections were used
while performing the existing and future year operational analysis using the Synchro/SimTraffic
software program. Detailed observations of the current peak hour traffic counts at the key study
intersection are provided as follows:
Maybank Highway and River Road Intersection: The field traffic count data shows that the
actual peak hour at this intersection is between 7:30-8:30 AM and 4:45-5:45 PM during the
morning and afternoon peak periods. During both these analysis periods, Maybank Highway
carries significantly more traffic compared to River Road. The eastbound approach along
Maybank Highway is the predominant peak direction of flow during the AM period with the
westbound predominate in the PM period. Another important observation from the field counts
relates to turning traffic. Significant numbers of westbound traffic on Maybank Highway are
turning onto River Road all day long. The left turning traffic from westbound Maybank Highway
to southbound River Road during morning and afternoon peak hours are 21 percent and 18
percent, respectively. Similarly, the westbound to northbound right turn morning and afternoon
peak hour traffic ratios are 17 percent and 29 percent, respectively. Therefore, the combined
total of the turning traffic on westbound to River Road is between 38 and 47 percent. This is
approximately twice as high as turning percentages at a typical four leg intersection.

Maybank Highway Traffic Analysis & Queuing Report
5
Similarly, the traffic counts also demonstrate that the southbound River Road left turn to
eastbound Maybank Highway and the northbound River Road right turn to eastbound Maybank
Highway are also significantly high all day long. The southbound left turn traffic ratios during the
morning and afternoon peak periods are 77 percent and 55 percent, respectively; while the
northbound right-turn traffic ratios are 76 percent and 55 percent, respectively.
24-Hour Arterial Tube Count Data
The 24-hour arterial automatic (tube) traffic counts along the following ten key roadway links in
the study area were collected on May 20, 2014. The tubes were placed at the following location.
i. Maybank Highway east of River Road
ii. Maybank Highway west of River Road
iii. River Road north of Maybank Highway
iv. River Road south of Maybank Highway
v. Fenwick Hall Allee north of Maybank Highway
vi. Maybank Highway between Fenwick Hall Alee and Old Maybank Highway
vii. Maybank Highway east of Old Maybank Highway
viii. Old Maybank Highway north of Maybank Highway
ix. Cane Slash Road
x. Stardust Way
These existing tube counts were analyzed to determine the travel patterns within the study area.
Travelers currently use the intersection of Maybank Highway and River Road as one of their
gateways to enter or exit Johns Island from the Downtown Charleston area through the bridge
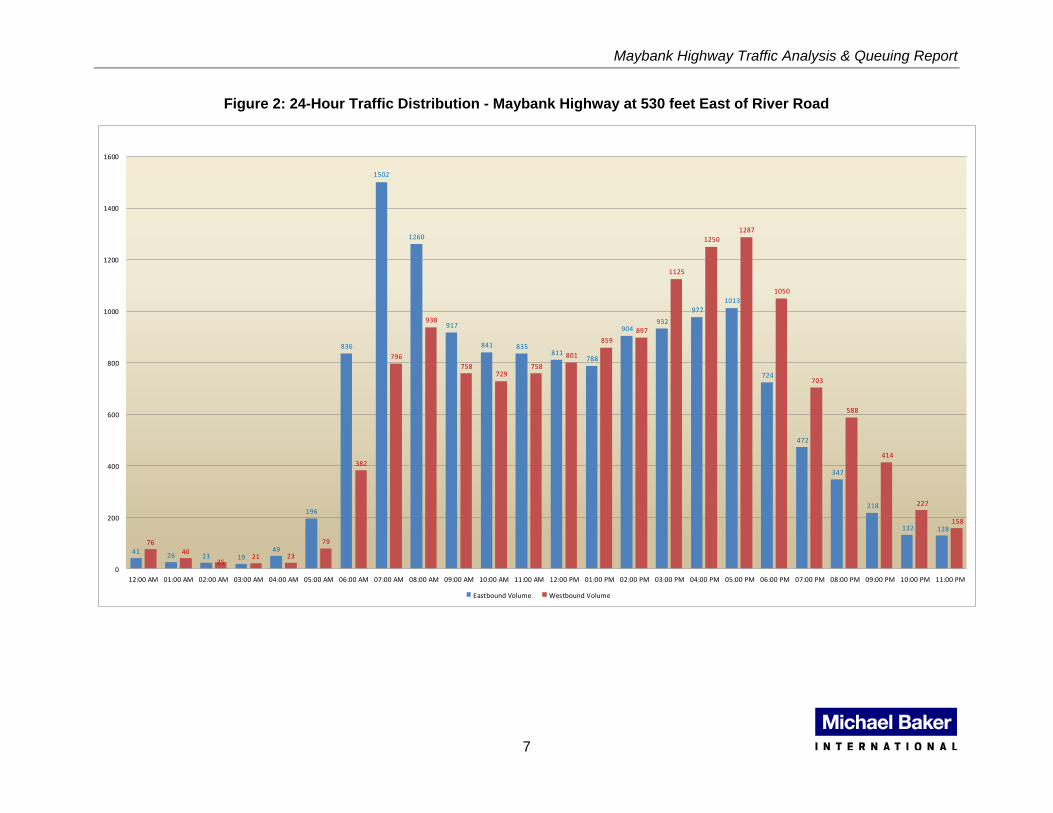
over the Stono River. Figure 2 through Figure 5 show the daily traffic distribution along all four
approaches of the Maybank Highway/River Road intersection. Interpretations of the 24-hour
traffic count data are provided below:
Maybank Highway, east of River Road (Figure 2): The chart shows traffic is heavier in the
eastbound direction during the morning peak hour while it is heavier in the westbound direction
during the afternoon peak hour. This traffic pattern shows that more traffic leaves than enters
Johns Island during the morning peak hour while more traffic returns to the Island than leaves in
the afternoon. The maximum eastbound hourly volume was 1,502 vehicles per hour (vph) from
7:00-8:00 AM. The maximum westbound hourly volume was 1,287 vph from 5:00-6:00 PM.
Maybank Highway, west of River Road (Figure 3): The chart shows a heavier eastbound
traffic during the morning peak hour and a heavier westbound direction during the afternoon
peak hour. This traffic pattern is consistent with the volumes obtained east of River Road,
showing that a higher amount of traffic is currently exiting Johns Island during the morning peak
hour and a higher amount of traffic returning to the Island in the afternoon. The maximum
eastbound hourly volume was 795 vph from 7:00-8:00 AM. The maximum westbound hourly
volume was 842 vph from 5:00-6:00 PM. These maximum eastbound and westbound volumes
on Maybank Highway west of River Road are substantially less than the maximum volumes east
of River Road, further showing the significant distribution of traffic to River Road at the Maybank
Highway intersection with River Road.
Maybank Highway Traffic Analysis & Queuing Report
6
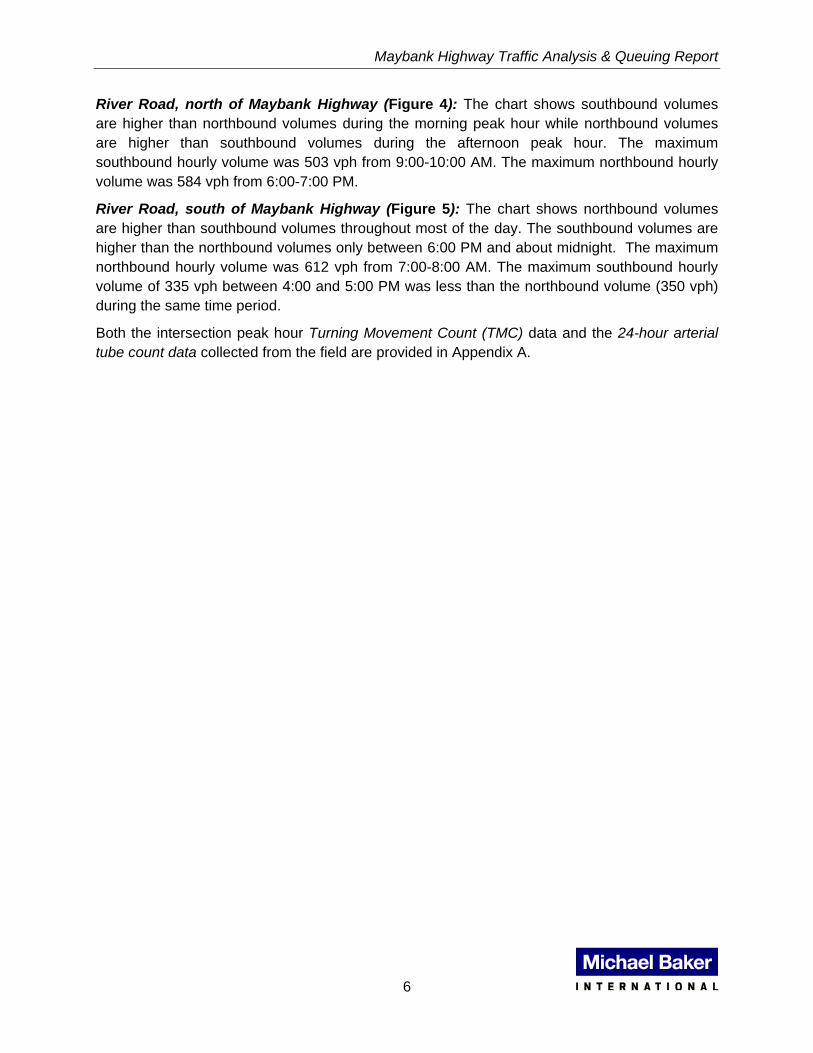
River Road, north of Maybank Highway (Figure 4): The chart shows southbound volumes
are higher than northbound volumes during the morning peak hour while northbound volumes
are higher than southbound volumes during the afternoon peak hour. The maximum
southbound hourly volume was 503 vph from 9:00-10:00 AM. The maximum northbound hourly
volume was 584 vph from 6:00-7:00 PM.
River Road, south of Maybank Highway (Figure 5): The chart shows northbound volumes
are higher than southbound volumes throughout most of the day. The southbound volumes are
higher than the northbound volumes only between 6:00 PM and about midnight. The maximum
northbound hourly volume was 612 vph from 7:00-8:00 AM. The maximum southbound hourly
volume of 335 vph between 4:00 and 5:00 PM was less than the northbound volume (350 vph)
during the same time period.
Both the intersection peak hour Turning Movement Count (TMC) data and the 24-hour arterial
tube count data collected from the field are provided in Appendix A.
Maybank Highway Traffic Analysis & Queuing Report
7
Figure 2: 24-Hour Traffic Distribution - Maybank Highway at 530 feet East of River Road
4126 23 19
49
196
836
1502
1260
917
841 835811
788
904932
977
1013
724
472
347
218
132 128
76
40
2521 23
79
382
796
938
758729
758
801
859
897
1125
1250
1287
1050
703
588
414
227
158
0
200
400
600
800
1000
1200
1400
1600
12:00 AM 01:00 AM 02:00 AM 03:00 AM 04:00 AM 05:00 AM 06:00 AM 07:00 AM 08:00 AM 09:00 AM 10:00 AM 11:00 AM 12:00 PM 01:00 PM 02:00 PM 03:00 PM 04:00 PM 05:00 PM 06:00 PM 07:00 PM 08:00 PM 09:00 PM 10:00 PM 11:00 PM
Maybank Highway Traffic; 530 feet East of River Road
Eastbound Volume Westbound Volume

Maybank Highway Traffic Analysis & Queuing Report
8
Figure 3: 24-Hour Traffic Distribution - Maybank Highway at 250 feet West of River Road
21 19 13 1230
134
489
795
724
592 590605
623
549568
682
724733
486
312
270
173
94 86
4525
12 12 20
58
284
559
668
528540
558
579
630 623
769
793
842
677
483
346
253
142
87
0
100
200
300
400
500
600
700
800
900
12:00 AM 01:00 AM 02:00 AM 03:00 AM 04:00 AM 05:00 AM 06:00 AM 07:00 AM 08:00 AM 09:00 AM 10:00 AM 11:00 AM 12:00 PM 01:00 PM 02:00 PM 03:00 PM 04:00 PM 05:00 PM 06:00 PM 07:00 PM 08:00 PM 09:00 PM 10:00 PM 11:00 PM
Maybank Highway Traffic; 250 feet West of River Road
Eastbound Volume Westbound Volume

Maybank Highway Traffic Analysis & Queuing Report
9
Figure 4: 24-Hour Traffic Distribution – River Road at 500 feet North of Maybank Highway
74
2112 13 9 11
38
145
227
283
255266
325340
322
340
472
565
584
473
333
258
170
102
40
11 9 6 820
70
365
476
503
373
302314
325
342351 354
363
394
308
206
162
90
49
0
100
200
300
400
500
600
700
12:00 AM 01:00 AM 02:00 AM 03:00 AM 04:00 AM 05:00 AM 06:00 AM 07:00 AM 08:00 AM 09:00 AM 10:00 AM 11:00 AM 12:00 PM 01:00 PM 02:00 PM 03:00 PM 04:00 PM 05:00 PM 06:00 PM 07:00 PM 08:00 PM 09:00 PM 10:00 PM 11:00 PM
River Road Traffic; 500 feet North of Maybank Highway
Northbound Volume Southbound Volume

Maybank Highway Traffic Analysis & Queuing Report
10
Figure 5: 24-Hour Traffic Distribution – River Road at 240 feet South of Maybank Highway
3323
10 1321
58
253
612
429
371
340
307 308
277
321 319
350 350
287
184
109
5141 38
168 3 5 4
13
99
208
286
212
231 225
262
279266
298
335328
308
186
208
121
6350
0
100
200
300
400
500
600
700
12:00 AM 01:00 AM 02:00 AM 03:00 AM 04:00 AM 05:00 AM 06:00 AM 07:00 AM 08:00 AM 09:00 AM 10:00 AM 11:00 AM 12:00 PM 01:00 PM 02:00 PM 03:00 PM 04:00 PM 05:00 PM 06:00 PM 07:00 PM 08:00 PM 09:00 PM 10:00 PM 11:00 PM
River Road Traffic; 240 feet South of Maybank Highway
Northbound Volume Southbound Volume
Maybank Highway Traffic Analysis & Queuing Report
11
Historical AADT Data
This study also collected the historical Average Annual Daily Traffic (AADT) volumes at multiple
SCDOT count locations. The eight year (2006-2013) historical traffic data along Maybank
Highway, Main Road/Bohicket Road and River Road were used to determine the background
traffic growth within the study area roadway network. The SCDOT count station locations that
were analyzed are provided as follows:
SCDOT count station 269: Maybank Highway (Riverland Drive to River Road);
SCDOT count station 267: Maybank Highway (River Road to Main Road/Bohicket Road)
SCDOT count station 265: Maybank Highway (Main Road/Bohicket Road to Bears Bluff
Road)
SCDOT count station 347: Main Road (Chisholm Road to Maybank Highway)
SCDOT count station 349: Bohicket Road (Maybank Highway to Edenvale Road)
SCDOT count station 355: River Road (Main Road to Maybank Highway);
SCDOT count station 357: River Road (Maybank Highway to Plow Ground Road)
Traffic Signal Data
There are two existing signalized intersections within the study area. They are located at the
Maybank Highway intersections with River Road and with Old Maybank Highway. The existing
signal timing sheets for the signalized intersections were obtained from the City of Charleston to
ensure the signal phasing and timings used in the analysis are consistent with the existing
signal operation. Photocopies of the original timing sheets are provided in Appendix B.
Field Visit
A field visit was conducted in the study area during the data collection period to inventory
existing roadway and geometric features, such as the roadway speed limit, adjacent land-use
characteristics, roadway conditions, intersection and arterial lane configurations and the traffic
patterns. Information concerning the type of traffic control (signal or stop controlled) and the
operation of the traffic control devices at all the study intersections were collected. The storage
lane lengths of the auxiliary lanes at all study intersections were measured and the values were
used in the simulation model to reflect the exact field condition.
Queue Evaluation
During the field visit, special attention was paid to the queuing of westbound Maybank Highway
as it enters Johns Island from the Stono River crossing. Four drivers were interviewed during
the field visit as to their experiences with queue lengths on the roadway and four additional
employees of Charleston County and the City of Charleston were interviewed by phone to attain
qualitative assessments of their commuting experiences. Further details concerning queue
lengths are contained in the section dealing with microsimulation modeling and calibration.
Study Methodology
The study consisted of analyses of existing and future traffic conditions on existing and
proposed roadway geometric configurations.

Maybank Highway Traffic Analysis & Queuing Report
12
AnalysisYearsThe analysis years for this project are 2014 (existing year) and 2040 (design year). The scope of the operational traffic analysis includes the following tasks:
Existing Condition: The operational conditions of all study intersections listed earlier were analyzed using the existing traffic volumes during the morning and afternoon peak hours. Based on this analysis, the critical peak hour of operation was identified which is called the Design Hour. Growth Factors were applied to the design hour traffic to estimate the future year design hour traffic condition. The existing Level of Service (LOS) was determined based on methodologies contained in the Highway Capacity Manual 2000 (HCM 2000). The Synchro/SimTraffic traffic analysis software program was used to perform the operational analysis.
Design Hour: Design hour condition analysis takes the place of examining both AM and PM peak periods in the future conditions. Using the design hour volumes allows the analysis to focus on the (potential) worst case scenario.
Future No-Build (Background) Condition: The future (2040) design year operational analyses were performed for the design hour traffic conditions. The two future year No-Build analysis scenarios are:
o 2040 No-Build without I-526 extension – This scenario does not include any proposed geometric modifications.
o 2040 No-Build with I-526 extension - This scenario includes geometric improvements at the intersection of Maybank Highway and River Road as identified in the most recent I-526 concept layout.
Future Build Condition: Future design year (2040) operational analyses were analyzed for the Build condition with and without I-526 Extension. The Build condition concept includes improvements to River Road and Maybank Highway. The improvements listed below will be built in three phases. Phase 1 will include widening Maybank Highway and improving key intersections (bullets 1 and 2). Phase 2 will include the Northern Pitchfork Road (bullet 3). Phase 3 will include the Southern Pitchfork Road (bullet 4). The key features of phases are:
o Widening Maybank Highway to three lanes from the existing merge point approximately 1,650 feet west of Old Maybank Highway to River Road with a 14’, 11’, and 14’ lane cross section, with a speed limit of 45 mph. This will allow for two inbound lanes from the Stono River and one outbound lane.
o Providing dedicated left turn lanes at key intersections in order to separate left turning traffic to allow through traffic to proceed more efficiently.
o Providing a new parallel two lane roadway to the north of Maybank Highway beginning at the intersection of Maybank Highway and Fenwick Hall Allee and terminating at a point on River Road. This roadway is referred to as the Northern Pitchfork Road. The entire route will have a single 11 foot wide lane in both
Maybank Highway Traffic Analysis & Queuing Report
13
directions of travel with a proposed speed limit of 25 mph. A new roundabout is
proposed on the Northern Pitchfork Road adjacent to the existing Fenwick Hall
Allee.
o Providing a new parallel two lane roadway to the south of Maybank Highway
beginning at the end of the bridge over the Stono River and terminating at a point
on the River Road. This roadway is referred to as the Southern Pitchfork Road.
The entire route will have a single eleven foot wide lane in both directions of
travel with a proposed speed limit of 25 mph.
The four future year Build analysis scenarios are:
o 2040 Build without I-526 extension – This scenario includes the geometric
improvements outlined above for the Build condition.
o 2040 Build with I-526 extension – This scenario includes geometric
improvements outlined above for the Build condition and improvements to the
intersection of Maybank Highway and River Road as identified in the most recent
I-526 concept layout. Those include:
Northbound River Road left turn bay lengthened to 200 feet
Northbound River Road right turn bay lengthened to 150 feet
Southbound River Road left turn bay lengthened to 200 feet
Southbound River Road right turn bay lengthened to 500 feet
Westbound Maybank Highway left turn bay lengthened to 200 feet
Westbound Maybank Highway right turns would be from the new through
lane that was constructed as a part of the Build condition.
Eastbound Maybank Highway left turn bay lengthened to 300 feet
Eastbound Maybank Highway right turn bay lengthened to 200 feet
o 2040 Build without the Pitchfork Roads and without the I-526 extension – This
scenario includes the geometric improvements outlined for the Build condition
except for the Northern and Southern Pitchfork Roads.
o 2040 Build without the Pitchfork Roads with I-526 extension – This scenario
includes geometric improvements outlined for the Build condition except for the
Northern and Southern Pitchfork Roads. It also includes improvements to the
intersection of Maybank Highway and River Road as identified in the most recent
I-526 concept layout, listed above.

Maybank Highway Traffic Analysis & Queuing Report
14
EXISTING CONDITION
Existing Roadway Network
The description of the existing roadway lane configuration and intersection turn lanes within the
study area is described as follows.
Maybank Highway (SC 700)
Maybank Highway is a rural arterial that has a posted 45 mile per hour speed limit. Maybank
Highway begins at its intersection with Folly Road (SC 171) on James Island, and continues
southwest until its terminus in Rockville. Residential subdivisions and business development
are scattered along Maybank Highway within the study area. Large, established trees line both
sides of Maybank Highway in many sections of the corridor, particularly in the section between
the bridge over the Stono River and River Road. Currently, there are no sidewalks or bike lanes
along Maybank Highway within the study area.
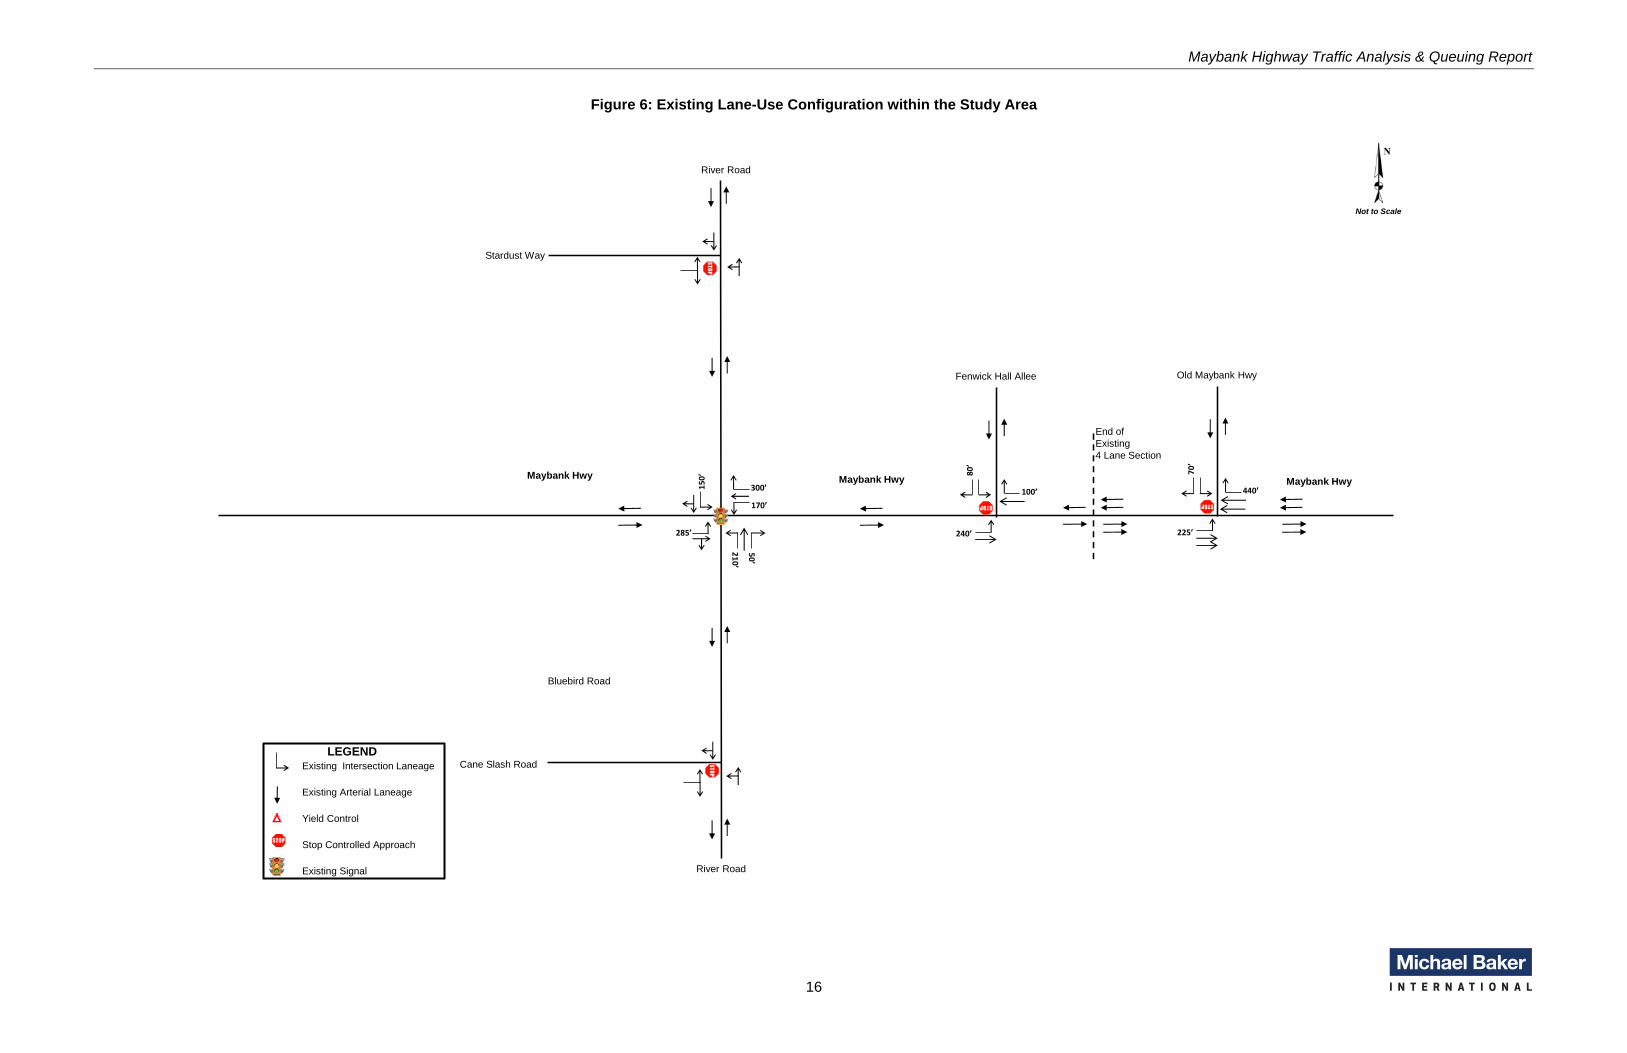
Within the study area, Maybank Highway is a two lane road with separate left turn lanes
provided at several intersections. As it enters the study area from the east, Maybank Highway
approaches the signalized intersection with Old Maybank Highway. It is a fully-actuated signal
with a left turn bay serving eastbound traffic. A right turn bay is present for the westbound
approach. The next studied intersection is that of Maybank Highway and Fenwick Hall Allee. It is
located approximately 3,600 feet west of Old Maybank Highway. Fenwick Hall Allee is controlled
by a stop sign and Maybank Highway is not required to stop at this intersection. The last studied
intersection on Maybank Highway is River Road approximately 2,400 feet west of Fenwick Hall
Allee. This is considered to be the key intersection of this study. The intersection at Maybank
Highway and River Road is controlled by a traffic signal. The intersection provides a separate
left turn lane and a shared through-right turn lane in all directions except the north and
westbound directions. On both north and westbound approaches, separate left turn, through
and right turn lanes are provided. Protected-permitted left turn phases are provided for the
westbound Maybank Highway and the southbound River Road approaches. Two gas stations
(BP and HESS) are located on the northeast and northwest corners of the intersection with
River Road. The southeast corner is covered with woods. Shopping center, restaurants and
other commercial land uses are located on the southwest corner.
River Road (S-54)
River Road is a two lane local arterial winding between Main Road and Bohicket Road. River
Road runs parallel to the Stono River. River Road has a posted speed limit of 45 miles per
hour. The intersection of Maybank Highway and River Road is located at approximately 1.7
miles west of the Paul J Gelegotis Bridge over the Stono River. A BP Gas station is located at
the northwest corner of the intersection of Maybank Highway and River Road, a Hess Gas
station and Food Lion grocery at the northeast corner, and a Kerr drugstore at the northeast
corner.
The lane-use configuration of the existing study intersections and roadway links within the study
area are provided in Figure 6.

Maybank Highway Traffic Analysis & Queuing Report
15
Future No Build
The future condition No Build roadway configurations will be the same as the existing conditions
except in the case of the I-526 construction.
If constructed, the I-526 extension would cross Maybank Highway without an interchange at a
location approximately 4,000 feet east of the intersection of Maybank Highway and River Road.
The currently preferred alternative developed as part of the preparation of the I-526
Environmental Impact Statement (EIS) calls for two separate connections between River Road
and I-526 to be located approximately 0.7 miles north and south of Maybank Highway. It is
anticipated that the south I-526 connector road will be pushed further to the south to avoid
conflicting with the Southern Pitchfork Road. Maybank Highway is now planned to have no
direct connection to the I-526 extension, and the I-526 crossing of Maybank Highway will be
grade separated.
As a part of the I-526 construction, assuming that no other work is completed on Maybank
Highway, the following improvements would be added to the Maybank Highway at River Road
intersection:
Northbound River Road left turn bay lengthened to 200 feet
Northbound River Road right turn bay lengthened to 150 feet
Southbound River Road left turn bay lengthened to 200 feet
Southbound River Road right turn bay lengthened to 500 feet
Westbound Maybank Highway left turn bay lengthened to 200 feet
Westbound Maybank Highway right turn bay lengthened to 300 feet
Eastbound Maybank Highway left turn bay lengthened to 300 feet
Eastbound Maybank Highway right turn bay lengthened to 200 feet
Maybank Highway Traffic Analysis & Queuing Report
16
Figure 6: Existing Lane-Use Configuration within the Study Area
Not to Scale
Fenwick Hall Allee
Maybank Hwy
LEGENDExisting Intersection Laneage
Existing Arterial Laneage
Yield Control
Stop Controlled Approach
Existing Signal
Bluebird Road
River Road
River Road
Cane Slash Road
Stardust Way
285’
210’
50’
150’
170’
80’
240’
100’
Maybank Hwy300’
Old Maybank Hwy
70’
225’
440’Maybank Hwy
End ofExisting4 Lane Section

Maybank Highway Traffic Analysis Report
17
Existing Traffic Volume
This existing turning movement data collected at all the study intersections during morning (AM)
and afternoon (PM) peak periods were used to develop future traffic. The peak hour traffic
volumes at all the study intersections were determined from the turning movement count data.
The traffic volumes between all the study intersections were then balanced and used in the
operational analysis.
The morning and afternoon peak hour traffic volumes at all of the study intersections are shown
in Figure 7.

Maybank Highway Traffic Analysis Report
18
Figure 7: Existing (2014) Morning and Afternoon Peak Hour Traffic Volume
Not to Scale
Fenwick Hall Allee
Maybank Hwy
River Road
River Road
Cane Slash Road
Stardust Way
Maybank Hwy
Old Maybank Hwy
Maybank Hwy
42 (
54)
70 (
116)
350 (
211)
38 (
82)
70
(107)
365 (
230)
160 (389)593 (734)197 (240)
40 (64)698 (570)
12 (25)
10 (14)1,422 (989)
13 (
15)
76 (
42)
21 (60)913 (1,372)
10 (24)1,375 (987)
20 (
10)
41 (
16)
8 (34)930 (1,353)
6 (3)21 (9)
2 (
5)
453 (
410)
4 (
19)
264 (
548)
53 (26)13 (4)
8 (
39)
239
(283)
4 (
4)
409 (
355)
LEGENDExisting AM Peak Volume
Existing PM Peak Volume
Existing Turn Movement
Stop Controlled Approach
Existing Signal
00
(00)
Maybank Highway Traffic Analysis & Queuing Report
19
FUTURE CONDITION
Travel Demand Forecasting
In order to develop future traffic it is necessary to have a basis for projecting local and regional
traffic growth, the turns the additional traffic will take, and the particular roadways that the traffic
will occupy. Travel Demand Forecasting is a tool for projecting future traffic and assigning that
traffic to the various roads that are projected to be in place during the design year
The travel demand forecasting presented in a December 2012 traffic report was evaluated for its
continued applicability. No significant changes were discovered that would affect the future
model years requiring a change to the model projections. Therefore the work was used to
develop the growth factors for this report. A full excerpt of the data gathered and the travel
demand modeling is included in Appendix C.
Future Year Traffic Volume
Existing and Future Year AADT
As part of the data collection effort, historical Annual Average Daily Traffic Data (AADT) was
collected at seven different SCDOT count locations within the study area for the most recently
available eight years of data (2006 to 2013).
The Travel Demand Model assignments were obtained as described in Appendix C by running
scenarios for the base year and the future year no-build and build conditions with and without I-
526 extension. The Model projections were compared to calculate the growth factors at all the
individual count locations. The calculated growth factors from Model projections were applied to
the 2014 Turning Movement Count data to obtain the future year turning movement volumes.
Additionally, an area wide growth factor within the entire study area was also calculated. Table 1
shows the SCDOT Average Annual Daily Traffic (AADT) and daily traffic projections for years
2014 and 2040. The growth rates (shown in Table 1) calculated from the Travel Demand Model
projections were used in this report.
Key differences were observed in the traffic assignments with and without the I-526 extension.
The assignments show that if the I-526 extension is added to the network a significant amount
of traffic currently entering Johns Island on Maybank Highway will be diverted to I-526 and to
River Road via the proposed connections from I-526. As a result, the westbound daily traffic
volume east of River Road will drop from 24,700 vpd (without I-526) to 7,300 vpd (with I-526).
With the connections to I-526, the assignments show that the daily traffic along River Road
north of Maybank Highway will increase from 3,600 vpd (without I-526) to 14,200 vpd (with I-
526), while River Road traffic south of Maybank Highway will increase from 8,100 vpd (without I-
526) to 16,200 vpd (with I-526). The daily traffic along Maybank Highway west of River Road
also increases significantly with the addition of I-526 extension.
The estimated design hour turning movement volumes for 2040 No-Build (i.e. background)
alternative for both roadway scenarios with and without I-526 extension are shown in Figure 8.

Maybank Highway Traffic Analysis & Queuing Report
20
Table 1: (Excerpted Table from Appendix C) Existing and Future Year Average Annual Daily Traffic (AADT)
Location SCDOT
Station
Limits SCDOT Count Data (AADT) Travel Demand Model Volume and Growth Projections
From To 2006 2007 2008 2009 2010 2011 2012 2013
SCDOT
GF
(2006
to
2013) –
not
used in
this
report
Year
2010
2040 No-Build 2040 Build Without Pitchfork Roads 2040 Build With Pitchfork Roads
Without
I-526
GF1
(2040
No-
Build
vs.
2010)
With I-
526
GF1
(2040
No-
Build
vs.
2010)
Without
I-526
GF1
(2040
Build A
vs.
2010)
With I-
526
GF1
(2040
Build A
vs.
2010)
Without
I-526
GF1
(2040
Build B
vs.
2010)
With I-
526
GF1
(2040
Build B
vs.
2010)
Maybank
Highway
- East
269 S-54 S-53 23,400 23,100 21,700 21,600 23,200 22,100 20,500 23,200 -0.12% 20,800 24,700 0.69% 7,300 -4.10% 30,300 1.52% 8,700 -3.43% 27,300 1.09% 6,100 -4.79%
267 S-20 S-54 14,200 15,200 13,800 13,900 17,200 16,300 14,800 15,000 0.79% - - - - - - - - - - - - -
Maybank
Highway
- West
265 S-
316 S-20 5,200 5,600 5,700 5,700 4,800 4,900 5,000 5,100 -0.28% 3,500 4,700 1.19% 4,400 0.92% 5,300 1.67% 6,400 2.44% 4,700 1.19% 3,800 0.33%
Main
Road 347 S-54
SC-
700 15,700 15,600 14,100 14,100 12,700 11,500 10,900 11,100 -4.83% 10,900 13,000 0.71% 8,800 -0.85% 12,200 0.45% 7,700 -1.38% 12,800 0.64% 11,500 0.21%
Bohicket
Road 349
SC-
700
S-
633 13,800 14,500 12,500 12,400 11,700 11,400 11,800 13,300 -0.53% 14,200 17,700 0.89% 14,100 -0.03% 18,100 0.98% 15,200 0.27% 14,400 0.06% 12,800 -0.41%
River
Road -
North
355 S-20 SC-
700 5,600 5,900 5,200 5,300 5,700 5,300 5,300 5,800 0.50% 3,100 3,600 0.60% 14,200 6.28% 4,600 1.59% 17,800 7.24% 4,000 1.02% 9,600 4.63%
River
Road -
South
357 SC-
700
S-
1156 5,700 6,100 5,400 5,800 5,300 5,400 5,500 5,800 0.25% 5,800 8,100 1.34% 16,200 4.19% 8,400 1.49% 15,300 3.96% 11,100 2.63% 16,600 4.30%
1:Growth Factor
Area
wide
GF1
0.90%
Area
wide
GF1
1.07%
Area
wide
GF1
1.28%
Area
wide
GF1
1.52%
Area
wide
GF1
1.11%
Area
wide
GF1
0.71%

Maybank Highway Traffic Analysis & Queuing Report
21
Figure 8: 2040 No-Build Design Hour Traffic Volume – Both I-526 Scenarios
Not to Scale
Fenwick Hall Allee
Maybank Hwy
River Road
River Road
Cane Slash Road
Stardust Way
Maybank Hwy
Old Maybank Hwy
Maybank Hwy
75 (
290)
161 (
227)
292 (
494)
95 (
819)
125
(296)
267 (
193)
462 (92)872 (284)285 (118)
86 (378)766 (301)34 (150)
19 (14)1,296 (972)
18 (
20)
50 (
55)
71 (21)1,629 (482)
31 (26)1,294 (961)
13 (
10)
20 (
24)
40 (17)1,607 (489)
4 (4)11 (12)
6 (
4)
476 (
1,2
96)
30 (
29)
679 (
667)
53 (30)13 (9)
8 (
53)
239
(511)
4 (
22)
409 (
980)
LEGEND2035 No-Build PM Peak Hour Volume - w/out I-526
2035 No-Build PM Peak Hour Volume - with I-526
2035 No-Build Turn Movement
Stop Controlled Approach
Existing Signal
00
(00)

Maybank Highway Traffic Analysis & Queuing Report
22
Future Year Build Traffic Volume
Future year Build condition defines the expected traffic conditions in the 2040 Design year with
the addition of the proposed roadway improvements. Two build concepts were evaluated for the
future traffic:
2040 Build: Widening Maybank Highway to three lanes and constructing the Pitchfork
Roadways. This is all three proposed phases of construction.
2040 Build: Widening Maybank Highway without constructing the Pitchfork Roadways.
This is only Phase 1 of construction.
Traffic volumes for the 2040 Build concept with Pitchfork are shown in Figure 9.
Traffic volumes for the 2040 Build without Pitchfork concept are equivalent to the 2040 No-Build
volumes shown in Figure 8.

Maybank Highway Traffic Analysis & Queuing Report
23
Figure 9: 2040 Build Design Hour Vol. – Both I-526 Scenarios
Not to Scale
Fenwick Hall Allee
Maybank Hwy
River Road
River Road
Cane Slash Road
Stardust Way
Maybank Hwy
Old Maybank Hwy
Maybank Hwy
90 (293)786 (233)10 (190)
161 (
867)
31
(63)
48 (
186)
190 (28)609 (270)148 (52)
34 (31)5 (5)
68 (
27)
655
(261)
8 (
11)
679 (
1,0
17)
4 (4)12 (11)
6 (
16)
528 (
1,2
71)
16 (
20)
372
(447)
10 (4)991 (424)
5 (
4)
532 (
368)
316 (66)947 (347)
1,260 (411)559 (12)
1,518 (790)5 (2)
180 (
791)
533 (
257)
173
(287)
17 (
18)
14 (13)549 (1)
124 (
407)
175 (
10)
178
(920)
362 (
362)
264 (60)62 (10)
8 (
699)
20
(95)
167
(9)
29 (15)2,037 (1,048)
19 (
19)
54 (
54)
79 (18)1800 (403)
LEGEND2040 Build (Pitchfork) Design Hr. Vol - w/out I-526
2040 Build (Pitchfork) Design Hr. Vol - with I-526
2040 Build (Pitchfork) Turn Movement
Yield / Stop Controlled Approach
Existing Signal
Proposed Signal– both I-526 scenarios
Proposed Signal @ South Pitchfork/Maybank ; @ South Pitchfork/River Road intersection - Without I-526 scenario ONLY
00
(00)

Maybank Highway Traffic Analysis & Queuing Report
24
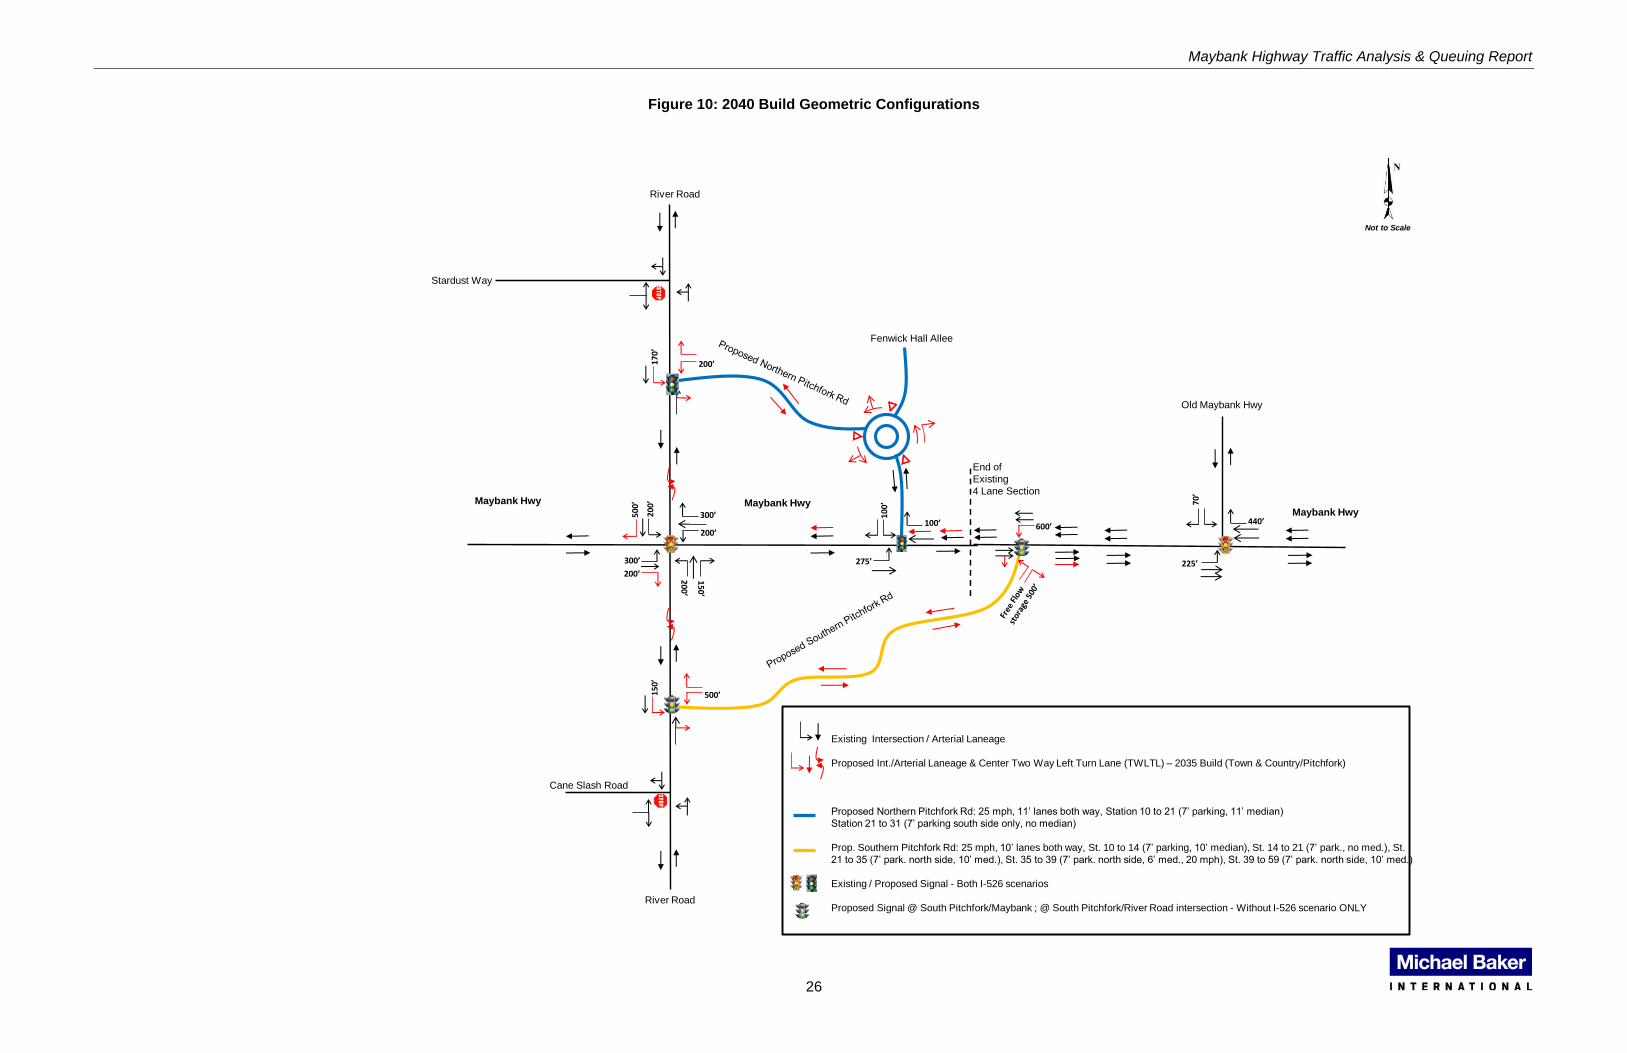
Future Year Build Geometric Modifications
This study evaluates the geometric layouts for the proposed Build scenario and the Build
without Pitchfork scenario.
2040 Build Concept Geometric Configuration: Build
The roadway geometric improvements evaluated for the Build Concept are listed as follows:
The existing two-lane Maybank Highway east of River Road will be widened to three lanes. The
speed limit will be 45 mph. The widened section will have 14’ wide outside lanes in each
direction of travel and an 11’ wide center lane for westbound traffic.
Specific intersection improvements analyzed include:
Maybank Highway and River Road Intersection:
o Southbound approach: A separate 500 feet long right turn lane;
o Eastbound approach: A separate 200 feet long right turn lane;
Maybank Highway and Proposed Northern Pitchfork Road Intersection:
o Eastbound approach: A separate 275 feet long left turn lane;
o New traffic signal: Future year traffic volumes increase along Maybank Highway
and the Northern Pitchfork Road. Traffic signal control is warranted under both I-
526 conditions.
River Road and proposed Northern Pitchfork Road Intersection:
o Westbound approach: Separate left and right turn lanes with 200 feet long
storage for the left turn movement;
o Southbound approach: A separate 170 feet long left turn lane;
o New traffic signal: Future year traffic volumes increase along the Northern
Pitchfork Road and River Road. The analysis includes a traffic signal at this
intersection under both I-526 scenarios;
Proposed roundabout at Northern Pitchfork Road and Fenwick Hall Allee:
o A single lane roundabout is proposed at this intersection.
Maybank Highway and proposed Southern Pitchfork Road Intersection:
o Westbound approach: A separate 600 feet long left turn lane;
o Northbound approach: Separate left and right turn lanes with 500 feet long
storage for the right turn movement. The northbound right turn movement will be
a free flow movement;
o New traffic signal: Future year traffic projections increase along Maybank
Highway and the Southern Pitchfork Road without the I-526 extension. For the

Maybank Highway Traffic Analysis & Queuing Report
25
alternative without the I-526 extension analysis a traffic signal control is included
at this intersection.
River Road and proposed Southern Pitchfork Road Intersection:
o Westbound approach: Separate left and right turn lanes with 200 feet long
storage for the left turn movement;
o Southbound approach: A separate 150 feet long left turn lane ;
o New traffic signal: Future year traffic projections increase along River Road and
the Southern Pitchfork Road without the I-526 extension. For the alternative
without the I-526 extension, the analysis includes a traffic signal at this
intersection.
2040 Build Concept Geometric Configuration: Build without Pitchfork
The roadway geometric improvements evaluated for the Build without Pitchfork Concept are
listed as follows:
The existing two-lane Maybank Highway east of River Road will be widened to three lanes. The
speed limit will be 45 mph. The widened section will have 14’ wide outside lanes in each
direction of travel and an 11’ wide center lane for westbound traffic.
Specific intersection improvements analyzed include:
Maybank Highway and River Road Intersection:
o Southbound approach: A separate 500 feet long right turn lane;
o Eastbound approach: A separate 200 feet long right turn lane;
The recommended geometric improvements for the 2040 Build Concept are shown graphically
in Figure 10.
Maybank Highway Traffic Analysis & Queuing Report
26
Figure 10: 2040 Build Geometric Configurations
Not to Scale
Fenwick Hall Allee
Maybank Hwy
Existing Intersection / Arterial Laneage
Proposed Int./Arterial Laneage & Center Two Way Left Turn Lane (TWLTL) – 2035 Build (Town & Country/Pitchfork)
Proposed Northern Pitchfork Rd: 25 mph, 11’ lanes both way, Station 10 to 21 (7’ parking, 11’ median)
Station 21 to 31 (7’ parking south side only, no median)
Prop. Southern Pitchfork Rd: 25 mph, 10’ lanes both way, St. 10 to 14 (7’ parking, 10’ median), St. 14 to 21 (7’ park., no med.), St. 21 to 35 (7’ park. north side, 10’ med.), St. 35 to 39 (7’ park. north side, 6’ med., 20 mph), St. 39 to 59 (7’ park. north side, 10’ med.)
Existing / Proposed Signal - Both I-526 scenarios
Proposed Signal @ South Pitchfork/Maybank ; @ South Pitchfork/River Road intersection - Without I-526 scenario ONLY
River Road
River Road
Cane Slash Road
Stardust Way
300’
200’
150’
200’
200’
100’
275’
100’
Maybank Hwy
600’
200’170’
500’150’
500’
200’
300’
Old Maybank Hwy
70’
225’
440’Maybank Hwy
End ofExisting4 Lane Section

Maybank Highway Traffic Analysis Report
27
OPERATIONAL ANALYSIS SECTION
Traffic Operational Analysis
Operational analyses at all the study area intersections were performed. The Existing year 2014
(morning and afternoon peak hours), Future year 2040 No-Build and 2040 Build condition
design hour traffic volume data and the respective roadway geometrics were used for the
capacity analysis. Analyses for all alternatives were performed using Synchro 7.0 traffic analysis
software program.
Analysis Methodology for Stop Controlled Intersections
The capacity analysis procedures provide an approach delay for the stop sign controlled
approaches at un-signalized intersections as well as the left turn approaches along the major
free flow directions. Based on these delay values, a grade or level of service (LOS) ranging from
LOS A, the best, to LOS F, the worst; are assigned. The approach LOS grades, as defined by
the Transportation Research Board for two-way stop-controlled intersections are shown in Table
2.
Table 2: Two-Way stop Controlled Intersection Level of Service (LOS) Criteria
Level of Service Two-Way Stop Delay (sec/veh)
A 10.0
B >10.0 to 15.0
C >15.0 to 25.0
D >25.0 to 35.0
E >35.0 to 50.0
F > 50.0
Analysis Methodology for SIGNAL Controlled Intersections
At a signalized intersection, the total delay is dependent upon a number of factors, including
when a driver approaches the intersection, the driver’s position in the queue, and the traffic
signal cycle length and green times. The control delay for a signalized intersection is determined
for each lane group and combined for each approach and for the intersection as a whole. Based
on these delay values, a grade or level of service (LOS) ranging from LOS A, the best, to LOS
F, the worst; are assigned. Each LOS represents a range of driver delay. Table 3 presents the
LOS criteria for signalized intersections, which is directly related to the overall intersection
control delay value.

Maybank Highway Traffic Analysis Report
28
The intersection LOS grades as defined by the Transportation Research Board for signalized
intersections are as follows:
Table 3: SIGNAL Controlled Intersection Level of Service (LOS) Criteria
Level of Service Signalized Intersection Delay
(sec/veh)
A 10.0
B >10.0 to 20.0
C >20.0 to 35.0
D >35.0 to 55.0
E >55.0 to 80.0
F > 80.0
The operational analyses at each study intersections for each individual alternative were
evaluated based on these delay thresholds. Detailed analysis results of the intersection
operational condition for each alternative (both Existing and Future Year scenarios) are
illustrated in the following sections.
Existing Condition Operational Analysis
The existing lane-use configuration (Figure 6) and the existing morning and afternoon peak hour
traffic volumes (Figure 7) were used in performing this analysis. The operation of the study
intersections for the existing peak hour traffic conditions were summarized and illustrated below.
The Synchro output files for all existing condition analyses are included in Appendix D.
Existing (2014) Intersection Operational Analysis
There are a total of two signalized and three stop controlled intersections within the study area.
All of the intersections were evaluated with the existing traffic volumes and lane-use
configuration. The existing controller timing data obtained from the City of Charleston was used
at the two signalized intersection locations. The storage/auxiliary lane lengths, the peak hour
factor (PHF) for each peak condition and the heavy vehicle ratios used in the analysis were
obtained from the field data in order to model the current field traffic condition. The operational
analysis results are shown in Table 4.

Maybank Highway Traffic Analysis Report
29
Table 4: Existing Condition Study Intersection Operational Analysis
Intersection
Signal
Control
(Y/N)
AM Peak PM Peak
Intersection
† Delay
(sec/veh)
Intersection
† LOS
Intersection
† Delay
(sec/veh)
Intersection
† LOS
River Rd at
Stardust Way N 13.0 B 14.0 B
River Rd at
Maybank Hwy Y 65.1 E 30.7 C
River Rd at Cane
Slash Rd N 17.2 C 15.7 C
Maybank Hwy at
Fenwick Hall
Allee
N Error* F 534.3 F
Maybank Hwy at
Old Maybank
Hwy
Y 6.2 A 4.6 A
† Delay and LOS reported for unsignalized intersections is that of the stop controlled approach
*Volume greatly exceeds capacity therefore delay cannot be calculated
The existing peak hour operational analysis results show that the five study intersections
currently operate at a variety of levels of service in both the AM and PM peak hours. In the
morning, both the signalized River Road intersection and the unsignalized Fenwick Hall Allee
operate at LOS E or LOS F. In the afternoon peak hour, only Fenwick Hall Allee operates at
LOS F. LOS F on an unsignalized intersection may overstate the actual delay at that
intersection, as the model can only measure likely gaps based on the volumes carrying through
the intersection, while in reality, drivers usually make it into the traffic stream by accepting
shorter gaps than the model would take into account, or by opposing drivers providing a gap for
the turning driver to use. In any case, a LOS E or F on an unsignalized approach must be
treated carefully.
Existing Year (2014) Build Condition Operational Analysis
To compare the existing No Build condition to a hypothetical “already constructed” condition, an
analysis of the 2014 roadway volumes was conducted under two scenarios: Build without I-526,
and Build without Pitchfork Roads, without I-526. The results of this analysis are shown in Table
5 with the No Build for comparison.

Maybank Highway Traffic Analysis Report
30
Table 5: Existing Year (2014) Build Comparison
Intersection
Signal Control (Y/N)
2014 No Build
Signal Control
(Y/N)
2014 Build without I-526
Signal Control (Y/N)
2014 Build without Pitchfork Roads without I-526
Design Hour
Intersection † Delay
(sec/veh)
Design Hour
Intersection † LOS
Design Hour Intersection †
Delay (sec/veh)
Design Hour Intersection †
LOS
Design Hour Intersection †
Delay (sec/veh)
Design Hour Intersection †
LOS
River Rd at Stardust Way
N 14.0 B N 11.9 B N 14.0 B
River Rd at N Pitchfork Rd
Y 11.7 B
River Rd at Maybank Hwy
Y 30.7 C Y 12.8 B Y 27.6 C
River Rd at S Pitchfork Rd
Y 20.0 B
River Rd at Cane Slash Rd
N 15.7 C N 18.6 C N 15.7 C
Maybank Hwy at N Pitchfork Rd/ Fenwick Hall Allee
N 534.3 F Y 33.8 C N 816.4 F
Maybank Hwy at S Pitchfork Rd
Y 15.3 A
Maybank Hwy at Old Maybank Hwy
Y 4.6 A Y 4.6 A Y 4.6 A
† Delay and LOS reported for unsignalized intersections is that of the stop controlled approach
Maybank Highway Traffic Analysis Report
31
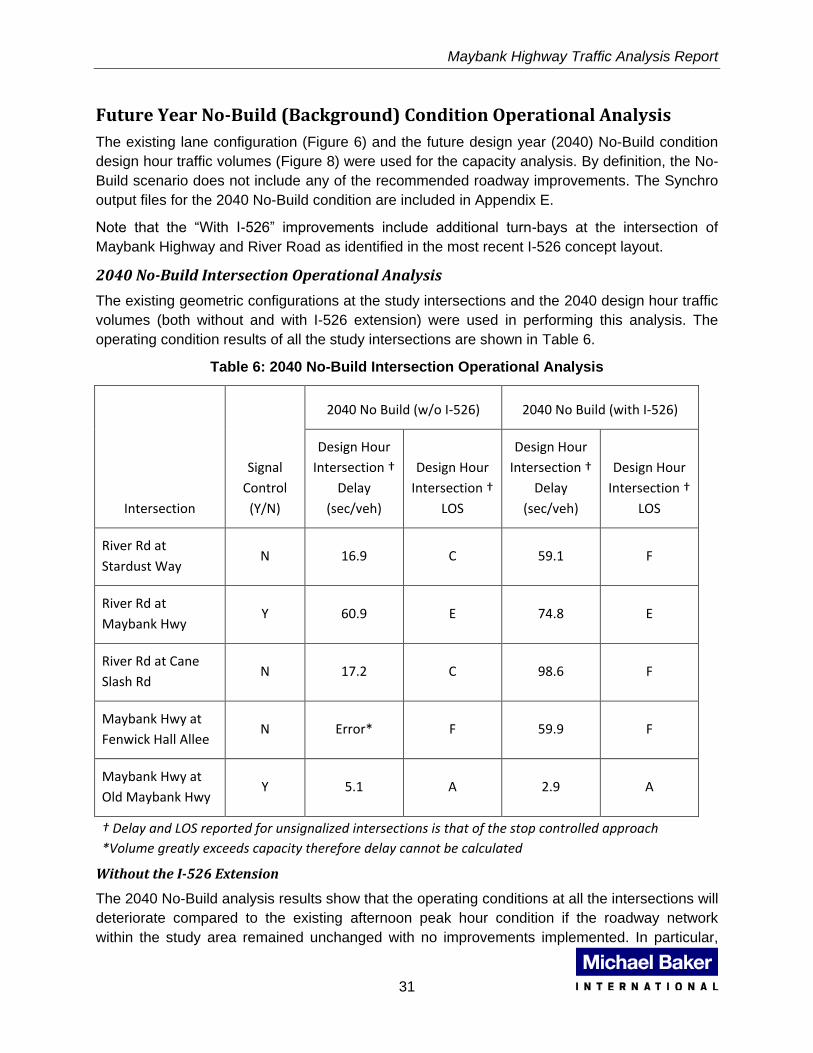
Future Year No-Build (Background) Condition Operational Analysis
The existing lane configuration (Figure 6) and the future design year (2040) No-Build condition
design hour traffic volumes (Figure 8) were used for the capacity analysis. By definition, the No-
Build scenario does not include any of the recommended roadway improvements. The Synchro
output files for the 2040 No-Build condition are included in Appendix E.
Note that the “With I-526” improvements include additional turn-bays at the intersection of
Maybank Highway and River Road as identified in the most recent I-526 concept layout.
2040 No-Build Intersection Operational Analysis
The existing geometric configurations at the study intersections and the 2040 design hour traffic
volumes (both without and with I-526 extension) were used in performing this analysis. The
operating condition results of all the study intersections are shown in Table 6.
Table 6: 2040 No-Build Intersection Operational Analysis
Intersection
Signal
Control
(Y/N)
2040 No Build (w/o I-526) 2040 No Build (with I-526)
Design Hour
Intersection †
Delay
(sec/veh)
Design Hour
Intersection †
LOS
Design Hour
Intersection †
Delay
(sec/veh)
Design Hour
Intersection †
LOS
River Rd at
Stardust Way N 16.9 C 59.1 F
River Rd at
Maybank Hwy Y 60.9 E 74.8 E
River Rd at Cane
Slash Rd N 17.2 C 98.6 F
Maybank Hwy at
Fenwick Hall Allee N Error* F 59.9 F
Maybank Hwy at
Old Maybank Hwy Y 5.1 A 2.9 A
† Delay and LOS reported for unsignalized intersections is that of the stop controlled approach
*Volume greatly exceeds capacity therefore delay cannot be calculated
Without the I-526 Extension
The 2040 No-Build analysis results show that the operating conditions at all the intersections will
deteriorate compared to the existing afternoon peak hour condition if the roadway network
within the study area remained unchanged with no improvements implemented. In particular,

Maybank Highway Traffic Analysis Report
32
River Road at Maybank Highway will drop from a LOS C to a LOS E in 2040 without the I-526
extension.
With the I-526 Extension
The addition of the I-526 extension will reroute the various ways traffic enters Johns Island. One
of the results will be to divert traffic from Maybank Highway to River Road. Figure 8 shows how
the majority of westbound Maybank Highway traffic will divert. The 2040 No-Build analysis
results show that the operating condition at all the intersections on River Road will deteriorate
compared to the existing design hour condition if the roadway network remained unchanged
other than the Maybank Highway at River Road turn lane extensions contained within the
concept of I-526. With the I-526 extension, all studied intersections will operate at LOS F or
LOS E except for Maybank Highway at Old Maybank which will continue to operate at LOS A.
Of particular note are the delays at the intersections along River Road in the “with I-526”
condition. The I-526 construction will reroute traffic from Maybank Highway east of River Road
to I-526, but traffic will still access Johns Island by moving south on River Road and turning right
onto Maybank Highway. Large delays will be caused at the Maybank Highway and River Road
intersection by the queuing for the southbound right turn movement. Similarly, with the increase
in traffic along river road reducing gaps traffic, the delay to the traffic on the Stardust Way and
Cane Slash Road minor approaches will increase.
Future Year Build Operational Analysis
The proposed geometric configuration (Figure 10) and the 2040 Build condition design hour
traffic volumes (Figure 9) were used to analyze the Build concepts both with and without the I-
526 extension. The Synchro output files are included in Appendix G.
2040 Build Intersection Operational Analysis
An additional lane was added to Maybank Highway for the Build concept and three new
intersections related to the Pitchfork Road concept were added to the analysis for the Pitchfork
alternative. These intersections are located at Maybank Highway and the Southern Pitchfork
Road, River Road and the Northern Pitchfork Road, and River Road and the Southern Pitchfork
Road. The proposed intersection of the Northern Pitchfork Road and River Road will likely
warrant the installation of a traffic signal in both of the I-526 extension scenarios. However, the
other two intersections, located along the Southern Pitchfork Road at its intersection with River
Road and with Maybank Highway, will likely warrant traffic signals only in the alternative without
the I-526 extension. In the alternative that includes the extension of I-526, the approaches of the
Southern Pitchfork Road to Maybank Highway and River Road will be controlled by stop signs.
The analysis was performed using the proposed geometrics and traffic. Where traffic signals are
present at intersections, the cycle length and offsets for the network were optimized. The
intersection analysis results are shown in Table 7 and Table 8.

Maybank Highway Traffic Analysis Report
33
Table 7: 2040 Build Intersection Operational Analysis
Intersection
Signal
Control
(Y/N)
2040 Build (w/o I-526)
Signal
Control
(Y/N)
2040 Build (with I-526)
Design Hour
Intersection †
Delay
(sec/veh)
Intersection †
LOS
Design Hour
Intersection †
Delay
(sec/veh)
Intersection †
LOS
River Rd at
Stardust Way N 13.7 B N 35.2 E
River Rd at N
Pitchfork Rd Y 12.7 B Y 6.9 A
River Rd at
Maybank Hwy Y 14.9 B Y 57.4 E
River Rd at S
Pitchfork Rd Y 38.1 D N 18.1 C
River Rd at Cane
Slash Rd N 39.8 E N 33.3 D
Maybank Hwy at N
Pitchfork Rd Y 89.1 F Y 16.7 B
Maybank Hwy at S
Pitchfork Rd Y 29.5 C N 18.5 C
Maybank Hwy at
Old Maybank Hwy Y 8.4 A Y 5.2 A
† Delay and LOS reported for unsignalized intersections is that of the stop controlled approach *Volume greatly exceeds capacity therefore delay cannot be calculated
* New Traffic Lights are proposed at the Southern Pitchfork Road intersections with River Road and Maybank Highway only for the concept without the I-526 extension.
Build Without the I-526 Extension
The 2040 Build results without the I-526 extension show that the operating conditions at
Maybank Highway and River Road will improve to LOS B. The operating condition at all other
currently existing intersections will remain as-is or improve except for Cane Slash Road. This
unsignalized intersection will deteriorate to LOS E. While this is a failing LOS, the volumes
accessing this two-way-stop controlled intersection are low and do not affect the network as a
whole.

Maybank Highway Traffic Analysis Report
34
Four additional traffic signals will likely be needed to control traffic for this condition. Two
signals will likely be required along Maybank Highway at the Northern Pitchfork Road and
Southern Pitchfork Road intersections. The other two signals will likely be required along River
Road at the Northern Pitchfork Road and the Southern Pitchfork Road intersections. All the
signalized study intersections will operate at an acceptable LOS D or better with the exception
of Maybank Highway at Northern Pitchfork Road, which with the projected traffic will operate at
LOS F due to the volume of left-turning vehicles projected to use Northern Pitchfork Road to
access Maybank Highway.
Build With the I-526 Extension
The 2040 Build results with I-526 extension show that the operating conditions at the existing
signalized intersections at Maybank Highway and River Road will improve compared to 2040
No-Build with I-526. Maybank Highway at River Road will remain a failing LOS E compared to
the No Build LOS F due to the traffic being diverted away from Maybank Highway to River Road
via the I-526 extension connectors and the Pitchfork Roadways, however the average vehicular
delay will fall by 81 seconds.
Traffic signals will likely be needed at the Northern Pitchfork Road intersections with Maybank
Highway and River Road. Both these intersections will operate at LOS B or A under signal
control.
The intersections of Stardust Way and Maybank Highway at River Road show a decrease in
level of service compared to the “without I-526” scenario. This is due to the rerouting of traffic to
River Road if the I-526 extension is constructed. With the increased traffic along River Road, the
number of gaps to serve the Stardust Way movements will be reduced, greatly increasing the
delay. At Maybank Highway and River Road, the higher approach volumes cause the increase
in overall intersection delay.

Maybank Highway Traffic Analysis Report
35
Table 8: 2040 Build Without Pitchfork Intersection Operational Analysis
Intersection
Signal
Control
(Y/N)
2040 Build without Pitchfork
(w/o I-526)
2040 Build without Pitchfork
(with I-526)
Design Hour
Intersection †
Delay
(sec/veh)
Design Hour
Intersection †
LOS
Design Hour
Intersection †
Delay
(sec/veh)
Design Hour
Intersection †
LOS
River Rd at
Stardust Way N 16.9 C 59.1 F
River Rd at
Maybank Hwy Y 60.9 E 74.8 E
River Rd at Cane
Slash Rd N 17.2 C 98.6 F
Maybank Hwy at
Fenwick Hall Allee N Error* F 77.0 F
Maybank Hwy at
Old Maybank Hwy Y 5.1 A 5.3 A
† Delay and LOS reported for unsignalized intersections is that of the stop controlled approach
*Volume greatly exceeds capacity therefore delay cannot be calculated * New Traffic Lights are proposed at the Southern Pitchfork Road intersections with River Road and Maybank
Highway only for the concept without the I-526 extension.
Build (Without Pitchfork) Without the I-526 Extension
The 2040 Build without Pitchfork results without the I-526 extension show that the conditions at
the existing two signalized intersections along Maybank Highway remain constant compared to
the 2040 No-Build. To show the differences between the 2040 No Build and the 2040 Build
(without pitchfork), further analysis was conducted using microsimulation and documented later
in this report.
Build (Without Pitchfork) With the I-526 Extension
The 2040 Build without Pitchfork results with I-526 extension show that the operating conditions
at the existing signalized intersections at Maybank Highway and River Road will remain at LOS
E. The traffic that uses Maybank Highway in the Without I-526 scenario is rerouted to River
Road and still causes this intersection to be over capacity. All other intersections remain the
same as the No Build condition except for Maybank Highway at Old Maybank Highway which
changes slightly based on the optimized signal timing. This is caused by the nature of the Build
without Pitchfork condition, which only has improvements on Maybank Highway, and at the

Maybank Highway Traffic Analysis Report
36
Maybank Highway and River Road intersection. No other improvements are included in this
scenario which might affect the other intersections in the network.
A complete table with all of the capacity results for comparison is presented in Table 9.
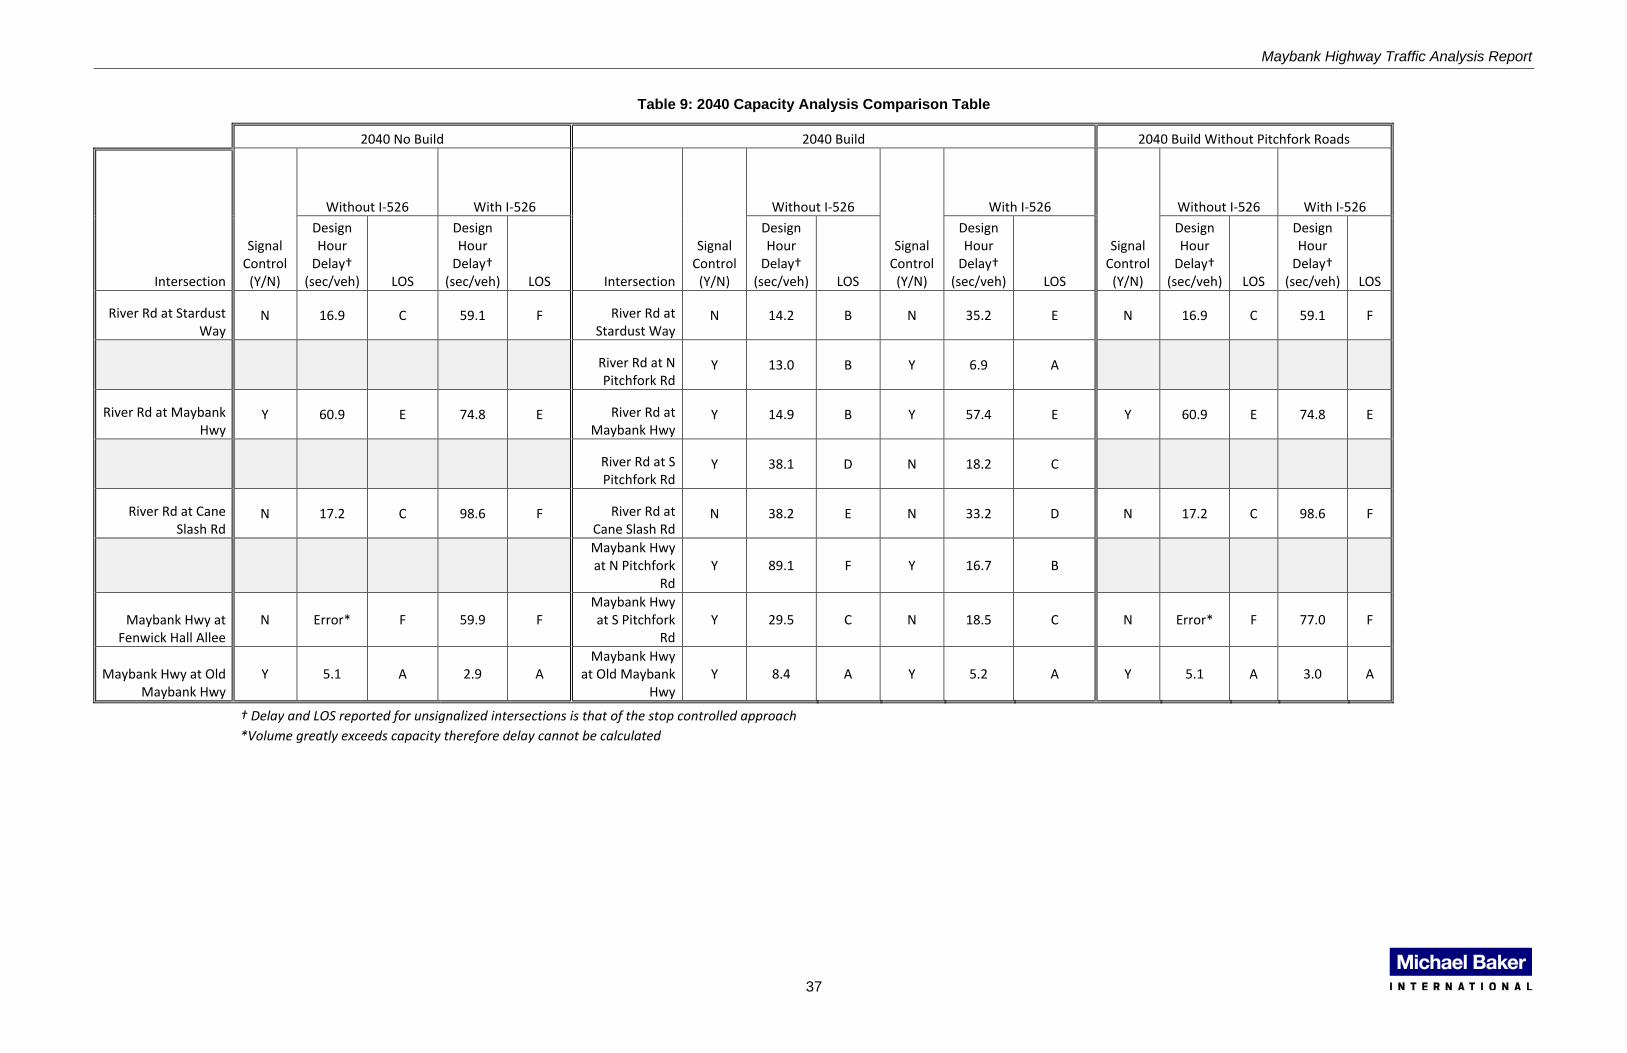
Maybank Highway Traffic Analysis Report
37
Table 9: 2040 Capacity Analysis Comparison Table
2040 No Build 2040 Build 2040 Build Without Pitchfork Roads
Intersection
Signal Control
(Y/N)
Without I-526 With I-526
Intersection
Signal Control
(Y/N)
Without I-526
Signal Control
(Y/N)
With I-526
Signal Control
(Y/N)
Without I-526 With I-526
Design Hour
Delay† (sec/veh) LOS
Design Hour
Delay† (sec/veh) LOS
Design Hour
Delay† (sec/veh) LOS
Design Hour
Delay† (sec/veh) LOS
Design Hour
Delay† (sec/veh) LOS
Design Hour
Delay† (sec/veh) LOS
River Rd at Stardust Way
N 16.9 C 59.1 F River Rd at Stardust Way
N 14.2 B N 35.2 E N 16.9 C 59.1 F
River Rd at N Pitchfork Rd
Y 13.0 B Y 6.9 A
River Rd at Maybank Hwy
Y 60.9 E 74.8 E River Rd at Maybank Hwy
Y 14.9 B Y 57.4 E Y 60.9 E 74.8 E
River Rd at S Pitchfork Rd
Y 38.1 D N 18.2 C
River Rd at Cane Slash Rd
N 17.2 C 98.6 F River Rd at Cane Slash Rd
N 38.2 E N 33.2 D N 17.2 C 98.6 F
Maybank Hwy at N Pitchfork
Rd Y 89.1 F Y 16.7 B
Maybank Hwy at Fenwick Hall Allee
N Error* F 59.9 F Maybank Hwy at S Pitchfork
Rd Y 29.5 C N 18.5 C N Error* F 77.0 F
Maybank Hwy at Old Maybank Hwy
Y 5.1 A 2.9 A Maybank Hwy
at Old Maybank Hwy
Y 8.4 A Y 5.2 A Y 5.1 A 3.0 A
† Delay and LOS reported for unsignalized intersections is that of the stop controlled approach
*Volume greatly exceeds capacity therefore delay cannot be calculated

Maybank Highway Traffic Analysis Report
38
MICROSIMULATION ANALYSIS SECTION
Purpose of Microsimulation Analysis
This purpose of the microsimulation analysis was to develop a calibrated microsimulation model
to compare and contrast two different scenarios in the future year 2040 with three different lane
drop locations for westbound Maybank Highway as it enters Johns Island. Microsimulation was
used because the existing condition of Maybank Highway includes a large westbound queue
that forms during the design hour. Synchro, the software used to conduct the Capacity Analysis,
does not reflect this queue due to the fundamental nature of its analysis programming. This
section, and the microsimulation analysis in general, was intended to address that problem.
Existing Condition and Queue Evaluation
Maybank Highway is a four-lane roadway with two lanes in each direction as it crosses the
Stono River. After passing Old Maybank Highway the westbound side of the roadway narrows
to a single lane before entering the wooded section of Maybank Highway, approximately 1,650
feet west of Old Maybank Highway and approximately 4,350 feet east of River Road.
During the field visit, special attention was paid to the queuing of westbound Maybank Highway.
The average queue during the field visit was approximately halfway between the lane merge
and the Old Maybank Highway intersection. Several times during the observation the queue
was long enough to cause queue failures at the Old Maybank Highway intersection.
Also during the field visit, four drivers were interviewed as to their experiences with queue
lengths on the roadway. Their qualitative evaluations indicated that queues extending to the Old
Maybank Highway were common and that a queue extending well past the Old Maybank
Highway intersection and onto the bridge over the Stono River was a regular occurrence.
As a part of due diligence, four employees of Charleston County and of the City of Charleston
were interviewed by phone to attain qualitative assessments of their commuting experiences.
Their reported experiences with the westbound queue agreed with the observed queue in the
field.
For purposes of the calibration of the microsimulation model, the evening queue length was
expected to extend to Old Maybank Highway and partially beyond.
Construction and Calibration of the Model
The microsimulation package TSIS-CORSIM was used for this modeling effort. The model was
based on existing conditions as described earlier in this report (Figure 6) and the traffic volumes
shown in Figure 7 were input to begin the calibration process. Signal timings and phasings were
as shown in the timing plans contained in Appendix B. The existing design hour condition
simulation model was run to compare existing field conditions to the model outputs. Vehicle
discharges from programmed links and the observed queue were measured in order to calibrate
the model. An existing condition model that replicated the existing conditions was produced and
a series of ten simulation runs were statistically compiled to verify that the 2014 conditions
observed in the field were as similar as possible to the calibrated model.

Maybank Highway Traffic Analysis Report
39
Development of Future Condition Models
The purpose of the microsimulation model was to evaluate different sites for extending
westbound Maybank Highway in the year 2040 with both I-526 constructed and without. The
following list shows the models that were developed from the existing condition for evaluation:
1. 2014 Existing Condition
2. 2014 Build Condition
3. 2014 Build without Pitchfork Roads
4. 2040 Design Hour No Build without I-526
5. 2040 Design Hour Build without I-526
6. 2040 Design Hour Merge Option 1 with Pitchfork Roads without I-526
7. 2040 Design Hour Merge Option 2 with Pitchfork Roads without I-526
8. 2040 Design Hour Merge Option 1 without Pitchfork Roads without I-526
9. 2040 Design Hour Merge Option 2 without Pitchfork Roads without I-526
10. 2040 Design Hour Build without Pitchfork Roads without I-526
11. 2040 Design Hour No Build with I-526
12. 2040 Design Hour Build without Pitchfork Roads with I-526
Of the twelve microsimulation models, only two were built around the assumption that I-526
would be constructed. The reason for this is that I-526 is a mitigation measure that will solve the
problem of westbound queuing. As will be evident by the results shown later in this section, no
other work beyond the construction of the I-526 extension is necessary to address the queuing.
Therefore, further modeling work involving multiple “with I-526” scenarios was not conducted.
The lane drop locations were specified as follows:
Existing Condition/Future No Build Condition: Lane drop approximately 1,650 feet west
of Old Maybank Highway.
Build Condition: Lane drop at River Road – This would call for widening Maybank
Highway to three lanes east of River Road. The scenario was examined both with and
without the Pitchfork Roads.
Merge Option 1: Lane drop 400 feet west of Fenwick Hall Allee – This would call for
widening Maybank Highway to three lanes from the current merge point to 400 feet west
of Fenwick Hall Allee. This scenario was examined with and without the Pitchfork Roads.
Merge Option 2: Lane drop approximately the end of the curve travelling westbound on
Maybank Highway after Old Maybank Highway – This would extend the current
westbound two-lane section approximately 670 feet further west from its current lane
drop location. This scenario was examined with and without the Pitchfork Roads.
Evaluated Measures of Effectiveness
Microsimulation models can examine a great number of measureable variables. A critical
component of developing the model is selecting the appropriate measure of effectiveness
(MOE) to evaluate the tested conditions.

Maybank Highway Traffic Analysis Report
40
The first MOE is a qualitative visual evaluation of the simulation itself. This is a useful metric as
the evaluator can see with very little delay or number interpretation the quality he or she is
looking for; in this case, observed westbound queuing.
MOE #1: Visual interpretation of Queuing – Evaluated queue on Maybank Highway in
ten runs of each model. Evaluated as No Queue, Queue between River Road and
Fenwick Hall Allee, Queue between Fenwick Hall Allee and Old Maybank Highway,
Queue between Old Maybank Highway and Bridge, Queue past Bridge.
Other, more quantitative MOEs used for this evaluation include overall network measures,
which are useful in this case because only one variable is being examined: the location of a
westbound lane drop. Using network evaluations allows for an overall examination of the effects
of a particular variable. The following network MOEs were used:
MOE #2: Average Network Speed: This evaluates the average speed of all vehicles
within the simulation.
MOE #3: Trips: This MOE counts the number of vehicles that are discharged from the
network during the simulation.
Finally, the last MOE examined is the most relevant concerning westbound queuing and the
effect different lane drops may have on it. That MOE is the Average Queue per Link.
MOE #4: Average Queue. This MOE measures the average length (in vehicles) on a
simulation segment during the study period.
Simulation Reports
The following tables show the results of the simulation runs with respect to the MOEs that are
being examined.
MOE #1: Visual interpretation of Queuing
Each simulation model was run ten times using different random number seeds and the visual
simulation results were evaluated in the last 5 minutes of the simulation run. The vehicle queue
on Maybank Highway was measured using a qualitative system that linked particular zones on
Maybank Highway to a numbered system.
If the queue on Maybank Highway was observed to be short enough to be processed by
one signal cycle, it was measured as No Queue and given a ranking of 1.
If the queue on Maybank Highway was observed to be between River Road and
Fenwick Hall Allee, but past the distance where a single signal cycle could clear it, it was
given a ranking of 2.
A queue between Fenwick Hall Allee and Old Maybank Highway was ranked as 3.
A queue between Old Maybank Highway and the beginning of the bridge over the Stono
River was ranked as 4.
A queue past the beginning of the bridge was ranked as 5.
Using these qualitative metrics, the results of 10 simulation runs is shown in Table 10.

Maybank Highway Traffic Analysis Report
41
Table 10: MOE #1, Qualitative Queuing Evaluation
2014 2040 without I-526 2040 with I-526
Location of Lane
Drop Existing Build
Build without
Pitchfork Roads
No Build Build
Merge Option 1
(with Pitchfork Roads)
Merge Option 2
(with Pitchfork Roads)
Build without
Pitchfork
Merge Option 1 (without Pitchfork Roads)
Merge Option 2 (without Pitchfork Roads)
No Build
Build without
Pitchfork
Run 1 5 1 2 4 2 3 3 3 4 5 1 1
Run 2 4 1 3 5 2 3 4 3 4 4 1 1
Run 3 4 1 2 5 2 3 3 3 3 4 1 1
Run 4 3 1 1 4 2 3 3 3 3 5 1 1
Run 5 4 1 2 4 3 3 4 3 4 4 1 1
Run 6 5 1 2 4 3 3 3 4 4 4 1 1
Run 7 4 1 3 5 2 3 3 2 4 4 1 1
Run 8 4 1 2 5 3 3 3 3 4 4 1 1
Run 9 3 1 2 4 2 3 4 3 4 4 1 1
Run 10 4 1 2 4 2 3 3 3 4 4 1 1
Average 4 1 2.1 4.4 2.3 3 3.3 3 3.8 4.2 1 1

Maybank Highway Traffic Analysis Report
42
A review of Table 10 shows that using the qualitative measure, all proposed sites for the lane
drop are improvements over the No Build condition, with the I-526 Extension causing the
greatest improvement that could occur.
The Build condition results show that the average queue decreases to just around Fenwick Hall
Allee. The addition of the Pitchfork Roads also has a significant effect on the queuing even if
Maybank Highway were not widened to three lanes. Both Merge Option 1 and 2 (with Pitchfork
Roads) show that the queue will reduce to between Fenwick Hall Alee and the existing lane
narrowing. Both Merge Option 1 and 2 (without Pitchfork Roads) would improve the queuing
compared to the 2040 No Build, but would maintain a queue that is approximately the same as
in the year 2014.
The last result of note is the model 2040 No Build with I-526. As shown in Table 10 the “No
Build” condition, i.e. without any relocation of the existing westbound lane drop, has no queuing.
This is attributed to the significant reduction in westbound Maybank Highway traffic due to the I-
526 Extension. The differences in traffic volumes can be seen in Figure 9. Due to the lack of
queuing in this condition, additional “with I-526” models were not run because they would have
no additional benefit for the queuing.
MOE #2: Average Network Speed
Each simulation model was run ten times using different random number seeds. The simulation
calculated the average speed of a vehicle over the entire network, on every roadway and
through every intersection. Along with the average speed, the standard deviation from the mean
is also reported, with the results assumed to be normally distributed. The results are shown in
Table 11.
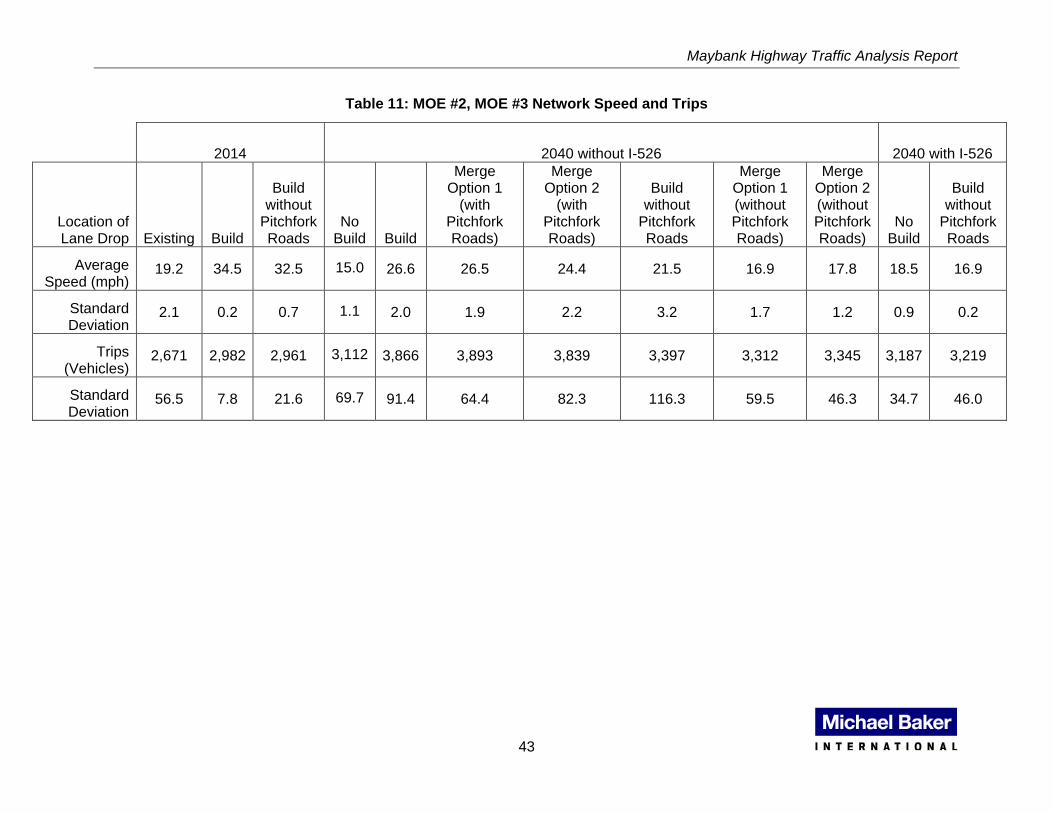
Maybank Highway Traffic Analysis Report
43
Table 11: MOE #2, MOE #3 Network Speed and Trips
2014 2040 without I-526 2040 with I-526
Location of Lane Drop Existing Build
Build without
Pitchfork Roads
No Build Build
Merge Option 1
(with Pitchfork Roads)
Merge Option 2
(with Pitchfork Roads)
Build without
Pitchfork Roads
Merge Option 1 (without Pitchfork Roads)
Merge Option 2 (without Pitchfork Roads)
No Build
Build without
Pitchfork Roads
Average Speed (mph)
19.2 34.5 32.5 15.0 26.6 26.5 24.4 21.5 16.9 17.8 18.5 16.9
Standard Deviation
2.1 0.2 0.7 1.1 2.0 1.9 2.2 3.2 1.7 1.2 0.9 0.2
Trips (Vehicles)
2,671 2,982 2,961 3,112 3,866 3,893 3,839 3,397 3,312 3,345 3,187 3,219
Standard Deviation
56.5 7.8 21.6 69.7 91.4 64.4 82.3 116.3 59.5 46.3 34.7 46.0
Maybank Highway Traffic Analysis Report
44
Table 11 shows that the 2040 average speed of the network as a whole improves no matter
which lane drop location is examined. The best alternative with this metric is the Build condition
and the second best is Merge Option 1 (with Pitchfork Roadways) followed by Merge Option 2
(with Pitchfork Roadways)
The average speed of the Merge Options (without Pitchfork Roadways) is less than the speed
with the Pitchfork Roadways, although the full Build (widening Maybank Highway all the way to
River Road) has the best average speed amongst the non-Pitchfork Roads options.
MOE #3: Trips
Each simulation model was run ten times using different random number seeds. The simulation
summarized the number of vehicles that exited the simulated roadway network. Along with the
volume of trips, the standard deviation from the mean is also reported, with the results assumed
to be normally distributed. The results are shown in Table 11.
Table 11 shows the number of vehicles exiting the network during the model run. All options for
the 2040 without I-526 scenarios increase the total throughput of the network as compared to
the No Build condition. The Merge Option 1 (with Pitchfork Roads) has the highest volume of
through traffic, followed by the Build condition and Merge Option 2 (with Pitchfork Roads).
These options are close to each other using this metric and should be considered equivalent.
The “without Pitchfork Roads” options have less throughput than the “with Pitchfork Road”
options. They are within 100 vehicles of each other and also can be considered equivalent in
vehicular throughput.
The 2040 No Build with I-526 condition does not show a marked increase in the number of trips,
due to the increase in delay on River Road at the Maybank Highway intersection.
MOE #4: Average Queue
Each simulation model was run ten times using different random number seeds. The simulation
calculated the Average Queue. This MOE measures the average length of queue (in vehicles)
on a simulation segment during the study period. The roadway segments are the roadway links
between individual simulation nodes. The following links were examined, and are numbered
here for ease of reference:
1. Between River Road and Fenwick Hall Allee.
2. Between Fenwick Hall Allee and 600 feet west of the existing lane merge.
3. Between 600 feet west of the existing lane merge and the existing lane merge.
4. Between the existing lane merge and Old Maybank Highway.
5. Between Old Maybank Highway and a point approximately 700 feet east of Old Maybank
Highway.
6. Between a point approximately 700 feet east of Old Maybank Highway and the end of the
simulation network, east of the bridge over the Stono River.
The results of MOE #4 are shown in Table 12.

Maybank Highway Traffic Analysis Report
45
Table 12: MOE #4, Average Queue
2014 2040 without I-526 2040 with I-526
Model Year and Condition Exist Build
Build without Pitchfork Roads No Build Build
Merge Option 1
(with Pitchfork Roads)
Merge Option 2 (with Pitchfork
Roads)
Build without Pitchfork Roads
Merge Option 1 (without Pitchfork Roads)
Merge Option 1 (without Pitchfork Roads) No Build
Build without
Pitchfork Roads
Average Queue
(Vehicles)
Location of Lane
Drop No Change River Road River Road No Change River Road
400' West of Fenwick Hall
Allee End of
Causeway River Road
400' West of Fenwick Hall
Allee
400' West of Fenwick Hall
Allee No Change River Road
Link 1 66 (3.5) 3 (0.3) 12 (1.7) 68 (3.0) 1 (0.5) 5 (0.7) 4 (0.6) 42 (15.2) 63 (2.4) 63 (2.4) 3 (0.4) 0 (0.0)
Link 2 30 (4.2) 1 (0.1) 0 (0.0) 35 (2.8) 2 (0.3) 1 (0.1) 16 (6.1) 16 (9.3) 40 (4.3) 40 (4.3) 0 (0.0) 0 (0.0)
Link 3 9 (2.0) 0 (0.1) 0 (0.0) 11 (1.4) 0 (0.0) 0 (0.0) 0 (0.0) 3 (3.9) 13 (2.1) 13 (2.1) 0 (0.0) 0 (0.0)
Link 4 22 (9.8) 0 (0.0) 0 (0.0) 46 (3.4) 0 (0.0) 7 (3.3) 9 (4.2) 4 (7.6) 25 (6.4) 25 (6.4) 0 (0.0) 0 (0.0)
Link 5 4 (3.2) 0 (0.1) 0 (0.0) 14 (1.6) 5 (3.8) 6 (3.8) 8 (4.5) 1 (2.1) 6 (3.3) 6 (3.3) 0 (0.0) 0 (0.0)
Link 6 1 (1.6) 0 (0.0) 0 (0.0) 34 (13.3) 3 (4.5) 3 (4.0) 10 (14.0) 0 (1.4) 5 (6.1) 5 (6.1) 0 (0.0) 0 (0.0)
Parenthetical numbers are the standard deviation results for that model and link.

Maybank Highway Traffic Analysis Report
46
Table 12 shows the average queues, measured in vehicles, on each roadway link. The best way
to read this table is to look at the values in the 2040 No Build without I-526, No Change column
and then scan to the right to see how the same link performs in different scenarios.
For example, looking at the 2040 No Build without I-526 conditions, Link 1 (from Maybank
Highway to Fenwick Hall Allee) has 68 vehicles queued behind the signal but In the 2040 Build
condition, only 1 vehicle is occupying that link. In the Merge Option 1 and Merge Option 2 (with
Pitchfork Roads) conditions, 5 and 4 vehicles are occupying the link. In the Merge Option 1 and
Merge Option 2 (without Pitchfork Roads) condition, 63 and 62 vehicles are occupying that link,
respectively. This indicates that the Build and other “With Pitchfork Roads” conditions are
reducing the standing queue in this link. In fact the inclusion of the Pitchfork Roads alleviates
the queue almost entirely. Simply widening Maybank Highway to River Road (Build without
Pitchfork Roads) will reduce the queue in this link from 65 vehicles to 42 vehicles.
Continuing our example, Link 2 (between Fenwick Hall Allee and 600 feet west of the existing
lane merge) shows similar queue storage as Link 1, with all “with Pitchfork Roads” conditions
alleviating the queue and the Build without Pitchfork condition cutting the queue in half, when
compared to the No Build. This indicates that Merge Option 1 and Merge Option 2 (without
Pitchfork Roads) are still causing these links to be full of queued vehicles. The Build scenario
has only a two-vehicle queue in this link.
Link 3 (between 600 feet west of the existing lane merge and the existing lane merge) is a short
(620 foot) link in the simulation model and shows similar queues across No Build and Merge
Option 1 (without Pitchfork Roads). The queues are essentially gone in the Build without
Pitchfork and are entirely gone in the Build condition and other scenarios that include the
Pitchfork Roads.
Link 4 (between the existing lane merge and Old Maybank Highway) starts showing queue
reductions for Merge Option 1 and Merge Option 2 (without Pitchfork Roads). Build, all Pitchfork
Roads scenarios, and Build without Pitchfork show few or zero vehicles in this link.
Link 5 (from Old Maybank Highway to a point approximately 700 feet east of Old Maybank
Highway) shows that there will be a slight queue in most alternatives that is behind the Old
Maybank Highway traffic signal. However all conditions show improvement over the No Build.
Link 6 (from a point approximately 700 feet east of Old Maybank Highway and the end of the
simulation network, east of the bridge over the Stono River) is the last link on the network and
shows an average queue of 34 vehicles in the No Build condition and all scenarios having
lesser queues.
All links show zero or very few queued vehicles if the I-526 extension is constructed.

Maybank Highway Traffic Analysis Report
47
CONCLUSIONS
Maybank Highway (SC 700) is a two lane state highway that runs in a northeast-southwest
direction across Johns Island in the metropolitan area of Charleston, South Carolina. The traffic
congestion and travel times along Maybank Highway have increased in recent years and are
expected to worsen as the area continues to grow.
The goal of this study was to examine existing (2014) and future year (2040) traffic conditions
along this portion of the Maybank Highway corridor and to examine different alternatives to
alleviate the westbound queuing on Maybank Highway westbound onto Johns Island.
The future year operational analysis was performed for Existing, Future No-Build and Future
Build scenarios with and without I-526 extension. The Build scenario includes three phases of
construction. Phase 1 is the widening of Maybank Highway. Phase 2 is the construction of the
Northern Pitchfork Road. Phase 3 is the construction of the Southern Pitchfork Road. The key
features of these improvements are:
Widening Maybank Highway to three lanes from the existing merge point approximately
1,650 feet west of Old Maybank Highway to River Road. This will allow for two inbound
lanes from the bridge over the Stono River and one outbound lane;
Providing dedicated left turn lanes at key intersections, in this case, River Road, in order
to separate left turning traffic to allow through traffic to proceed more efficiently.
Providing a new parallel two lane roadway to the north of Maybank Highway beginning
at the intersection of Maybank Highway and Fenwick Hall Allee and terminating at a
point on River Road. This roadway is referred to as the Northern Pitchfork Road. A new
roundabout is proposed on the Northern Pitchfork Road adjacent to the existing Fenwick
Hall Allee.
Providing a new parallel two lane roadway to the south of Maybank Highway beginning
at the end of the bridge over the Stono River and terminating at a point on the River
Road. This roadway is referred to as the Southern Pitchfork Road.
In addition to the traffic operational analyses, microsimulation modeling was conducted to
examine the westbound queuing of Maybank Highway and methods that it could be addressed.
Four different sites for a westbound lane drop were examined:
Existing Condition/Future No Build Condition: Approximately 1,650 feet west of Old
Maybank Highway.
Build Condition: River Road – This would call for widening Maybank Highway to three
lanes east of River Road. The scenario was examined both with and without the
Pitchfork Roads.
Merge Option 1: 400 feet west of Fenwick Hall Allee – This would call for widening
Maybank Highway to three lanes from the current merge point to 400 feet west of
Fenwick Hall Allee. The scenario was examined both with and without the Pitchfork
Roads.
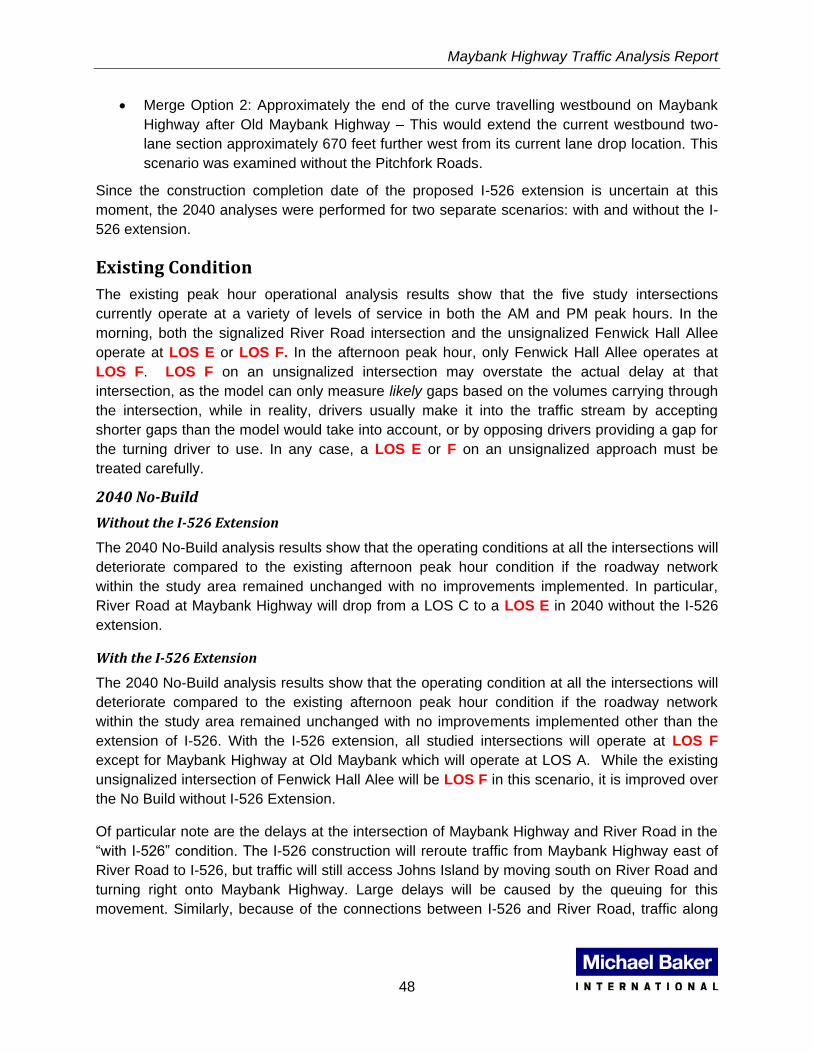
Maybank Highway Traffic Analysis Report
48
Merge Option 2: Approximately the end of the curve travelling westbound on Maybank
Highway after Old Maybank Highway – This would extend the current westbound two-
lane section approximately 670 feet further west from its current lane drop location. This
scenario was examined without the Pitchfork Roads.
Since the construction completion date of the proposed I-526 extension is uncertain at this
moment, the 2040 analyses were performed for two separate scenarios: with and without the I-
526 extension.
Existing Condition
The existing peak hour operational analysis results show that the five study intersections
currently operate at a variety of levels of service in both the AM and PM peak hours. In the
morning, both the signalized River Road intersection and the unsignalized Fenwick Hall Allee
operate at LOS E or LOS F. In the afternoon peak hour, only Fenwick Hall Allee operates at
LOS F. LOS F on an unsignalized intersection may overstate the actual delay at that
intersection, as the model can only measure likely gaps based on the volumes carrying through
the intersection, while in reality, drivers usually make it into the traffic stream by accepting
shorter gaps than the model would take into account, or by opposing drivers providing a gap for
the turning driver to use. In any case, a LOS E or F on an unsignalized approach must be
treated carefully.
2040 No-Build
Without the I-526 Extension
The 2040 No-Build analysis results show that the operating conditions at all the intersections will
deteriorate compared to the existing afternoon peak hour condition if the roadway network
within the study area remained unchanged with no improvements implemented. In particular,
River Road at Maybank Highway will drop from a LOS C to a LOS E in 2040 without the I-526
extension.
With the I-526 Extension
The 2040 No-Build analysis results show that the operating condition at all the intersections will
deteriorate compared to the existing afternoon peak hour condition if the roadway network
within the study area remained unchanged with no improvements implemented other than the
extension of I-526. With the I-526 extension, all studied intersections will operate at LOS F
except for Maybank Highway at Old Maybank which will operate at LOS A. While the existing
unsignalized intersection of Fenwick Hall Alee will be LOS F in this scenario, it is improved over
the No Build without I-526 Extension.
Of particular note are the delays at the intersection of Maybank Highway and River Road in the
“with I-526” condition. The I-526 construction will reroute traffic from Maybank Highway east of
River Road to I-526, but traffic will still access Johns Island by moving south on River Road and
turning right onto Maybank Highway. Large delays will be caused by the queuing for this
movement. Similarly, because of the connections between I-526 and River Road, traffic along

Maybank Highway Traffic Analysis Report
49
River Road will increase with the I-526 extension, reducing gaps in River Road traffic and
increasing delay to the traffic on the Stardust Way and Cane Slash Road approaches.
2040 Build Concept
Build Without the I-526 Extension
The 2040 Build results without the I-526 extension show that the operating conditions at
Maybank Highway and River Road will improve to LOS B. The operating condition at all other
currently existing intersections will remain as-is or improve except for Cane Slash Road. This
unsignalized intersection will deteriorate to LOS E. While this is a failing LOS, the volumes
accessing this two-way-stop controlled intersection are low and do not affect the network as a
whole.
Four additional traffic signals will likely be needed to control traffic for this condition. Two
signals along Maybank Highway at the Northern Pitchfork Road and Southern Pitchfork Road
intersections and the other two signals will likely be required along River Road at the Northern
Pitchfork Road and the Southern Pitchfork Road intersections. All the signalized study
intersections will operate at an acceptable LOS D or better with the exception of Maybank
Highway at Northern Pitchfork Road, which with the projected traffic will operate at LOS F due
to the volume of left-turning vehicles projected to use Northern Pitchfork Road to access
Maybank Highway instead of using the Maybank Highway/River Road intersection.
Build With the I-526 Extension
The 2040 Build results with I-526 extension show that the operating conditions at the existing
signalized intersections at Maybank Highway and River Road will improve compared to 2040
No-Build with I-526. Maybank Highway at River Road will remain a failing LOS E compared to
the No Build LOS F due to the traffic being diverted away from Maybank Highway to River Road
via the I-526 extension connectors and the Pitchfork Roadways, however the average vehicular
delay will fall by 81 seconds.
Two additional traffic signals are will likely be needed to control traffic. Traffic signals will likely
be needed at the Northern Pitchfork Road intersections with Maybank Highway and River Road.
Both these intersections will operate at LOS B or A under signal control.
Build (Without Pitchfork) Without the I-526 Extension
The 2040 Build without Pitchfork results without the I-526 extension show that the operating
conditions at the existing two signalized intersections along Maybank Highway remain constant
compared to the 2040 No-Build. To show the differences between the 2040 No Build and the
2040 Build (without pitchfork), further analysis was conducted using microsimulation and
documented later in this report.
Build (Without Pitchfork) With the I-526 Extension
The 2040 Build without Pitchfork results with I-526 extension show that the operating conditions
at the existing signalized intersections at Maybank Highway and River Road will remain at LOS
F. The traffic that uses Maybank Highway in the Without I-526 scenario is rerouted to River

Maybank Highway Traffic Analysis Report
50
Road and still causes this intersection to be over capacity. All other intersections remain the
same as the No Build condition.
Addressing the Westbound Queuing
The results of the microsimulation modeling show the Build condition reduce the queue
significantly either entirely, or to about halfway between River Road and Fenwick Hall Allee,
depending on which measure of effectiveness you are evaluating (Average or Visual,
respectively). The Build without Pitchfork will reduce the queuing to approximately just past
Fenwick Hall Allee.
In the case where I-526 was constructed, sufficient traffic would be diverted from the westbound
Maybank Highway approach to River Road to make the queuing situation moot.

Maybank Highway Traffic Analysis Report
51
SUMMARY OF FINDINGS
It was found that, in comparing the 2040 No-Build and Build results:
The Build condition (without I-526) will improve all existing signalized intersections.
The Build condition (without I-526) will significantly improve the westbound queuing.
The Build without Pitchfork Roads (without I-526) will also reduce westbound queues,
with the intersection traffic operations remaining similar to, if slightly better, than the No-
Build Condition.
In reviewing the Build scenario at the signalized intersection of the Northern Pitchfork
Road (Fenwick Hall Allee) and Maybank Highway it is noted that the intersection will
operate at LOS F without the construction of I-526. This is due to the volume of traffic
projected to use this intersection after the Pitchfork Roads are constructed.
The microsimulation queuing analysis demonstrates that of the locations for a
westbound drop lane, the condition with the best improvements is Build, dropping the
lane at River Road. Second best is Build without Pitchfork Roads.
The analysis shows that constructing the Build condition would greatly increase the
capacity of the immediate vicinity by presenting alternate routes to access River Road
and reducing the queuing on Maybank Highway.

Appendix A: Traffic Data Collection – Field Traffic Count

File Name : #1 FenwickHallAllee@MaybankHwyAMSite Code : Start Date : 5/20/2014Page No : 1
Groups Printed- Cars - TrucksFENWICH HALL ALLEE
SouthboundMAYBANK HWY
WestboundFENWICH HALL ALLEE
NorthboundMAYBANK HWY
EastboundStart Time Rght Thru Left Peds App. Total Rght Thru Left Peds App. Total Rght Thru Left Peds App. Total Rght Thru Left Peds App. Total Int. Total
07:00 AM 4 0 9 0 13 1 148 0 0 149 0 0 0 0 0 0 367 0 0 367 52907:15 AM 1 0 14 0 15 0 162 0 0 162 0 0 0 0 0 0 381 2 0 383 56007:30 AM 9 0 12 0 21 4 211 0 0 215 0 0 0 0 0 0 381 1 0 382 61807:45 AM 5 0 13 0 18 0 242 0 0 242 0 0 0 0 0 0 357 2 0 359 619
Total 19 0 48 0 67 5 763 0 0 768 0 0 0 0 0 0 1486 5 0 1491 2326
08:00 AM 2 0 8 0 10 1 238 0 0 239 0 0 0 0 0 0 314 4 0 318 56708:15 AM 4 0 8 0 12 3 239 0 0 242 0 0 0 0 0 0 323 3 0 326 58008:30 AM 3 0 11 0 14 2 217 0 0 219 0 0 0 0 0 0 313 0 0 313 54608:45 AM 7 0 7 0 14 0 217 0 0 217 0 0 0 0 0 0 268 1 0 269 500
Total 16 0 34 0 50 6 911 0 0 917 0 0 0 0 0 0 1218 8 0 1226 2193
09:00 AM 3 0 5 0 8 3 153 0 0 156 0 0 0 0 0 0 222 1 0 223 38709:15 AM 4 0 4 0 8 3 179 0 0 182 0 0 0 0 0 0 225 1 0 226 41609:30 AM 6 0 2 0 8 1 192 0 0 193 0 0 0 0 0 0 233 2 0 235 43609:45 AM 4 0 7 0 11 7 187 0 0 194 0 0 0 0 0 0 206 3 0 209 414
Total 17 0 18 0 35 14 711 0 0 725 0 0 0 0 0 0 886 7 0 893 1653
Grand Total 52 0 100 0 152 25 2385 0 0 2410 0 0 0 0 0 0 3590 20 0 3610 6172Apprch % 34.2 0 65.8 0 1 99 0 0 0 0 0 0 0 99.4 0.6 0
Total % 0.8 0 1.6 0 2.5 0.4 38.6 0 0 39 0 0 0 0 0 0 58.2 0.3 0 58.5Cars 49 0 99 0 148 19 2292 0 0 2311 0 0 0 0 0 0 3495 20 0 3515 5974
% Cars 94.2 0 99 0 97.4 76 96.1 0 0 95.9 0 0 0 0 0 0 97.4 100 0 97.4 96.8Trucks 3 0 1 0 4 6 93 0 0 99 0 0 0 0 0 0 95 0 0 95 198
% Trucks 5.8 0 1 0 2.6 24 3.9 0 0 4.1 0 0 0 0 0 0 2.6 0 0 2.6 3.2
All Traffic Data Service, Inc1336 Farmer RoadConyers, Ga 30012
404-374-1283

File Name : #1 FenwickHallAllee@MaybankHwyAMSite Code : Start Date : 5/20/2014Page No : 2
FENWICH HALL ALLEE
MA
YB
AN
K H
WY
MA
YB
AN
K H
WY
FENWICH HALL ALLEE
Rght
49 3
52 Thru
0 0 0
Left
99 1
100 Peds
0 0 0
InOut Total39 148 187 6 4 10
45 197 152
Rght
19
6
25
Thru
2292
93
2385
Left 0
0
0
Peds 0
0
0
Out
Tota
lIn
3594
2311
5905
96
99
195
3690
6100
2410
Left0 0 0
Thru0 0 0
Rght0 0 0
Peds0 0 0
Out TotalIn
0 0 0 0 0 0 0 0 0
Left20
0
20
Thru
3495
95
3590
Rght0
0
0
Peds0
0
0
Tota
lO
ut
In2341
3515
5856
96
95
191
2437
6047
3610
5/20/2014 07:00 AM5/20/2014 09:45 AM CarsTrucks
North
All Traffic Data Service, Inc1336 Farmer RoadConyers, Ga 30012
404-374-1283

File Name : #1 FenwickHallAllee@MaybankHwyAMSite Code : Start Date : 5/20/2014Page No : 3
FENWICH HALL ALLEESouthbound
MAYBANK HWYWestbound
FENWICH HALL ALLEENorthbound
MAYBANK HWYEastbound
Start Time Rght Thru Left Peds App. Total Rght Thru Left Peds App. Total Rght Thru Left Peds App. Total Rght Thru Left Peds App. Total Int. Total
Peak Hour Analysis From 07:00 AM to 09:45 AM - Peak 1 of 1Peak Hour for Entire Intersection Begins at 07:30 AM
07:30 AM 9 0 12 0 21 4 211 0 0 215 0 0 0 0 0 0 381 1 0 382 61807:45 AM 5 0 13 0 18 0 242 0 0 242 0 0 0 0 0 0 357 2 0 359 61908:00 AM 2 0 8 0 10 1 238 0 0 239 0 0 0 0 0 0 314 4 0 318 56708:15 AM 4 0 8 0 12 3 239 0 0 242 0 0 0 0 0 0 323 3 0 326 580
Total Volume 20 0 41 0 61 8 930 0 0 938 0 0 0 0 0 0 1375 10 0 1385 2384% App. Total 32.8 0 67.2 0 0.9 99.1 0 0 0 0 0 0 0 99.3 0.7 0
PHF .556 .000 .788 .000 .726 .500 .961 .000 .000 .969 .000 .000 .000 .000 .000 .000 .902 .625 .000 .906 .963Cars 20 0 41 0 61 8 912 0 0 920 0 0 0 0 0 0 1340
% Cars 100 0 100 0 100 100 98.1 0 0 98.1 0 0 0 0 0 0 97.5 100 0 97.5 97.8Trucks 0 0 0 0 0 0 18 0 0 18 0 0 0 0 0 0 35 0 0 35 53
% Trucks 0 0 0 0 0 0 1.9 0 0 1.9 0 0 0 0 0 0 2.5 0 0 2.5 2.2
FENWICH HALL ALLEE
MA
YB
AN
K H
WY
MA
YB
AN
K H
WY
FENWICH HALL ALLEE
Rght
20 0
20 Thru
0 0 0
Left
41 0
41 Peds
0 0 0
InOut Total18 61 79 0 0 0
18 79 61
Rght 8
0
8
Thru
912
18
930
Left 0
0
0
Peds 0
0
0
Out
Tota
lIn
1381
920
2301
35
18
53
1416
2354
938
Left0 0 0
Thru0 0 0
Rght0 0 0
Peds0 0 0
Out TotalIn
0 0 0 0 0 0 0 0 0
Left10
0
10
Thru
1340
35
1375
Rght0
0
0
Peds0
0
0
Tota
lO
ut
In932
1350
2282
18
35
53
950
2335
1385
Peak Hour Begins at 07:30 AM CarsTrucks
Peak Hour Data
North
All Traffic Data Service, Inc1336 Farmer RoadConyers, Ga 30012
404-374-1283

File Name : #1 FenwickHallAllee@MaybankHwyPMSite Code : Start Date : 5/20/2014Page No : 1
Groups Printed- Cars - TrucksFENWICH HALL ALLEE
SouthboundMAYBANK HWY
WestboundFENWICH HALL ALLEE
NorthboundMAYBANK HWY
EastboundStart Time Rght Thru Left Peds App. Total Rght Thru Left Peds App. Total Rght Thru Left Peds App. Total Rght Thru Left Peds App. Total Int. Total
03:00 PM 0 0 0 0 0 5 201 0 0 206 0 0 0 0 0 0 209 2 0 211 41703:15 PM 4 0 4 0 8 7 288 0 0 295 0 0 0 0 0 0 201 5 0 206 50903:30 PM 7 0 6 0 13 9 283 0 0 292 0 0 0 0 0 0 254 4 0 258 56303:45 PM 3 0 7 0 10 12 317 0 0 329 0 0 0 0 0 0 248 3 0 251 590
Total 14 0 17 0 31 33 1089 0 0 1122 0 0 0 0 0 0 912 14 0 926 2079
04:00 PM 2 0 3 1 6 7 296 0 0 303 0 0 0 0 0 0 195 8 0 203 51204:15 PM 2 0 3 0 5 11 316 0 0 327 0 0 0 0 0 0 240 3 0 243 57504:30 PM 1 0 3 0 4 8 301 0 0 309 0 0 0 0 0 0 234 4 0 238 55104:45 PM 2 0 3 0 5 7 297 0 0 304 0 0 0 0 0 0 262 6 0 268 577
Total 7 0 12 1 20 33 1210 0 0 1243 0 0 0 0 0 0 931 21 0 952 2215
05:00 PM 3 0 4 0 7 9 292 0 0 301 0 0 0 0 0 0 275 6 0 281 58905:15 PM 4 0 8 0 12 7 332 0 0 339 0 0 0 0 0 0 185 2 0 187 53805:30 PM 1 0 1 0 2 8 330 0 0 338 0 0 0 0 0 0 283 8 0 291 63105:45 PM 2 0 3 0 5 8 334 0 0 342 0 0 0 0 0 0 227 8 0 235 582
Total 10 0 16 0 26 32 1288 0 0 1320 0 0 0 0 0 0 970 24 0 994 2340
Grand Total 31 0 45 1 77 98 3587 0 0 3685 0 0 0 0 0 0 2813 59 0 2872 6634Apprch % 40.3 0 58.4 1.3 2.7 97.3 0 0 0 0 0 0 0 97.9 2.1 0
Total % 0.5 0 0.7 0 1.2 1.5 54.1 0 0 55.5 0 0 0 0 0 0 42.4 0.9 0 43.3Cars 30 0 45 1 76 98 3504 0 0 3602 0 0 0 0 0 0 2737 58 0 2795 6473
% Cars 96.8 0 100 100 98.7 100 97.7 0 0 97.7 0 0 0 0 0 0 97.3 98.3 0 97.3 97.6Trucks 1 0 0 0 1 0 83 0 0 83 0 0 0 0 0 0 76 1 0 77 161
% Trucks 3.2 0 0 0 1.3 0 2.3 0 0 2.3 0 0 0 0 0 0 2.7 1.7 0 2.7 2.4
All Traffic Data Service, Inc1336 Farmer RoadConyers, Ga 30012
404-374-1283
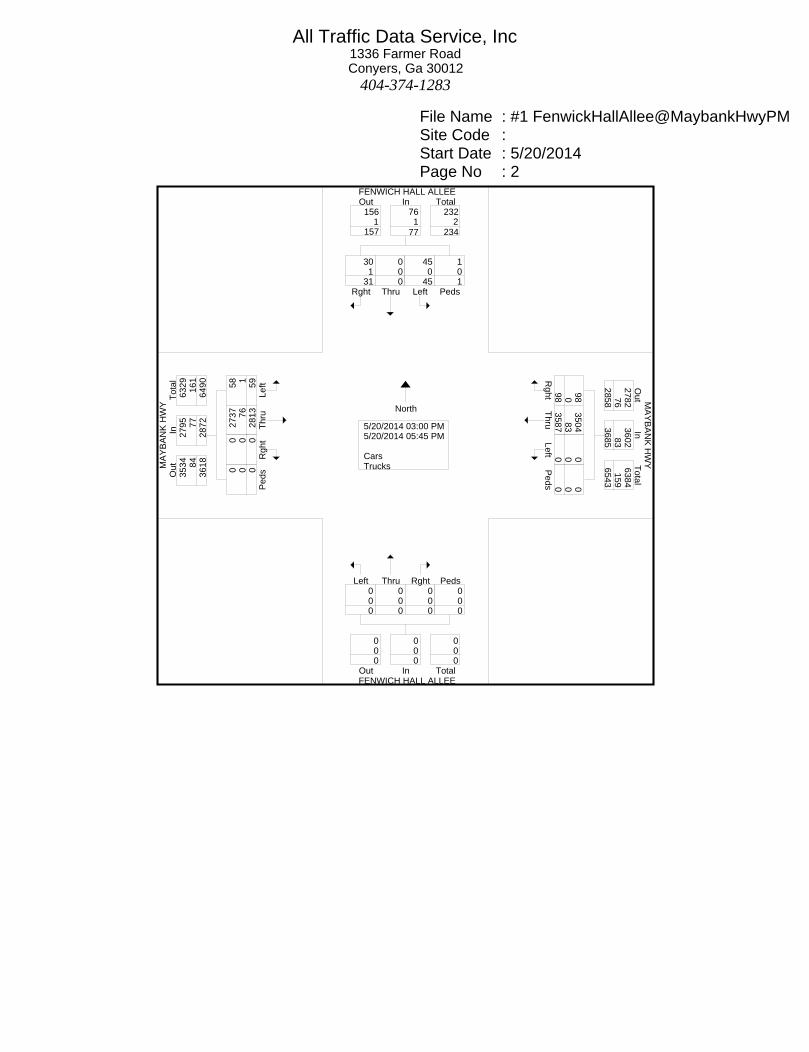
File Name : #1 FenwickHallAllee@MaybankHwyPMSite Code : Start Date : 5/20/2014Page No : 2
FENWICH HALL ALLEE
MA
YB
AN
K H
WY
MA
YB
AN
K H
WY
FENWICH HALL ALLEE
Rght
30 1
31 Thru
0 0 0
Left
45 0
45 Peds
1 0 1
InOut Total156 76 232
1 1 2 157 234 77
Rght
98
0
98
Thru
3504
83
3587
Left 0
0
0
Peds 0
0
0
Out
Tota
lIn
2782
3602
6384
76
83
159
2858
6543
3685
Left0 0 0
Thru0 0 0
Rght0 0 0
Peds0 0 0
Out TotalIn
0 0 0 0 0 0 0 0 0
Left58
1
59
Thru
2737
76
2813
Rght0
0
0
Peds0
0
0
Tota
lO
ut
In3534
2795
6329
84
77
161
3618
6490
2872
5/20/2014 03:00 PM5/20/2014 05:45 PM CarsTrucks
North
All Traffic Data Service, Inc1336 Farmer RoadConyers, Ga 30012
404-374-1283

File Name : #1 FenwickHallAllee@MaybankHwyPMSite Code : Start Date : 5/20/2014Page No : 3
FENWICH HALL ALLEESouthbound
MAYBANK HWYWestbound
FENWICH HALL ALLEENorthbound
MAYBANK HWYEastbound
Start Time Rght Thru Left Peds App. Total Rght Thru Left Peds App. Total Rght Thru Left Peds App. Total Rght Thru Left Peds App. Total Int. Total
Peak Hour Analysis From 03:00 PM to 05:45 PM - Peak 1 of 1Peak Hour for Entire Intersection Begins at 05:00 PM
05:00 PM 3 0 4 0 7 9 292 0 0 301 0 0 0 0 0 0 275 6 0 281 58905:15 PM 4 0 8 0 12 7 332 0 0 339 0 0 0 0 0 0 185 2 0 187 53805:30 PM 1 0 1 0 2 8 330 0 0 338 0 0 0 0 0 0 283 8 0 291 63105:45 PM 2 0 3 0 5 8 334 0 0 342 0 0 0 0 0 0 227 8 0 235 582
Total Volume 10 0 16 0 26 32 1288 0 0 1320 0 0 0 0 0 0 970 24 0 994 2340% App. Total 38.5 0 61.5 0 2.4 97.6 0 0 0 0 0 0 0 97.6 2.4 0
PHF .625 .000 .500 .000 .542 .889 .964 .000 .000 .965 .000 .000 .000 .000 .000 .000 .857 .750 .000 .854 .927Cars 10 0 16 0 26 32 1272
% Cars 100 0 100 0 100 100 98.8 0 0 98.8 0 0 0 0 0 0 98.8 100 0 98.8 98.8Trucks 0 0 0 0 0 0 16 0 0 16 0 0 0 0 0 0 12 0 0 12 28
% Trucks 0 0 0 0 0 0 1.2 0 0 1.2 0 0 0 0 0 0 1.2 0 0 1.2 1.2
FENWICH HALL ALLEE
MA
YB
AN
K H
WY
MA
YB
AN
K H
WY
FENWICH HALL ALLEE
Rght
10 0
10 Thru
0 0 0
Left
16 0
16 Peds
0 0 0
InOut Total56 26 82 0 0 0
56 82 26
Rght
32
0
32
Thru
1272
16
1288
Left 0
0
0
Peds 0
0
0
Out
Tota
lIn
974
1304
2278
12
16
28
986
2306
1320
Left0 0 0
Thru0 0 0
Rght0 0 0
Peds0 0 0
Out TotalIn
0 0 0 0 0 0 0 0 0
Left24
0
24
Thru958
12
970
Rght0
0
0
Peds0
0
0
Tota
lO
ut
In1282
982
2264
16
12
28
1298
2292
994
Peak Hour Begins at 05:00 PM CarsTrucks
Peak Hour Data
North
All Traffic Data Service, Inc1336 Farmer RoadConyers, Ga 30012
404-374-1283

Page 1
Site Code: 1Station ID: 1
MAYBANK HWY EASTY OFLatitude: 0' 0.0000 Undefined
Longitude: 0' 0.0000 Undefined
All Traffic Data Service, Inc1336 Farmer RoadConyers, Ga 30012
404-374-1283
Start 20-May-14 EB Hour Totals WB Hour Totals Combined TotalsTime Tue Morning Afternoon Morning Afternoon Morning Afternoon Morning Afternoon Morning Afternoon
12:00 17 216 32 18212:15 9 204 18 22812:30 10 195 14 15812:45 5 196 41 811 12 233 76 801 117 161201:00 9 192 5 18801:15 8 202 8 22001:30 4 186 8 19701:45 5 208 26 788 19 254 40 859 66 164702:00 9 226 8 20402:15 6 196 9 24202:30 4 260 4 23002:45 4 222 23 904 4 221 25 897 48 180103:00 5 212 5 20803:15 3 207 7 30303:30 5 270 4 30003:45 6 243 19 932 5 314 21 1125 40 205704:00 3 209 1 31004:15 8 256 5 32004:30 21 243 12 30804:45 17 269 49 977 5 312 23 1250 72 222705:00 26 280 7 30805:15 53 196 18 32305:30 58 295 18 31805:45 59 242 196 1013 36 338 79 1287 275 230006:00 109 217 54 28806:15 178 202 70 32206:30 245 146 118 22406:45 304 159 836 724 140 216 382 1050 1218 177407:00 359 136 155 19207:15 392 126 174 19607:30 387 106 210 17307:45 364 104 1502 472 257 142 796 703 2298 117508:00 322 96 246 17208:15 334 96 233 14408:30 324 90 214 13608:45 280 65 1260 347 245 136 938 588 2198 93509:00 223 46 164 13809:15 238 65 184 10009:30 243 56 200 9109:45 213 51 917 218 210 85 758 414 1675 63210:00 182 38 178 6610:15 241 33 174 7810:30 192 30 174 5010:45 226 31 841 132 203 33 729 227 1570 35911:00 194 36 180 4211:15 199 38 198 4211:30 228 32 185 4011:45 214 22 835 128 195 34 758 158 1593 286Total 6545 7446 4625 9359 11170 16805
Percent 46.8% 53.2% 33.1% 66.9% 39.9% 60.1%GrandTotal
6545 7446 4625 9359 11170 16805
Percent 46.8% 53.2% 33.1% 66.9% 39.9% 60.1%
ADT ADT 13,455 AADT 13,455

Page 1
Site Code: 2Station ID: 2
MAYBANK HWY WEST OFLatitude: 0' 0.0000 Undefined
Longitude: 0' 0.0000 Undefined
All Traffic Data Service, Inc1336 Farmer RoadConyers, Ga 30012
404-374-1283
Start 20-May-14 EB Hour Totals WB Hour Totals Combined TotalsTime Tue Morning Afternoon Morning Afternoon Morning Afternoon Morning Afternoon Morning Afternoon
12:00 7 166 20 12412:15 6 168 10 16212:30 4 126 6 13612:45 4 163 21 623 9 157 45 579 66 120201:00 6 137 1 15201:15 4 134 5 15101:30 3 136 7 15401:45 6 142 19 549 12 173 25 630 44 117902:00 6 148 4 15202:15 5 148 3 17502:30 1 144 2 15202:45 1 128 13 568 3 144 12 623 25 119103:00 2 162 2 15103:15 2 164 1 19603:30 5 186 5 18603:45 3 170 12 682 4 236 12 769 24 145104:00 2 156 1 19104:15 10 166 5 20204:30 9 206 10 20504:45 9 196 30 724 4 195 20 793 50 151705:00 20 180 7 17405:15 31 187 11 22805:30 40 226 13 22805:45 43 140 134 733 27 212 58 842 192 157506:00 78 160 38 17706:15 110 122 58 20606:30 134 108 76 17206:45 167 96 489 486 112 122 284 677 773 116307:00 200 84 118 12207:15 201 82 126 13507:30 214 82 149 12207:45 180 64 795 312 166 104 559 483 1354 79508:00 198 70 158 9108:15 202 77 180 9008:30 184 76 146 8308:45 140 47 724 270 184 82 668 346 1392 61609:00 158 48 122 9009:15 149 45 124 5409:30 142 50 134 5409:45 143 30 592 173 148 55 528 253 1120 42610:00 134 27 146 4010:15 140 22 128 3510:30 166 22 134 4110:45 150 23 590 94 132 26 540 142 1130 23611:00 153 30 133 2011:15 155 25 157 2211:30 158 13 138 1711:45 139 18 605 86 130 28 558 87 1163 173Total 4024 5300 3309 6224 7333 11524
Percent 43.2% 56.8% 34.7% 65.3% 38.9% 61.1%GrandTotal
4024 5300 3309 6224 7333 11524
Percent 43.2% 56.8% 34.7% 65.3% 38.9% 61.1%
ADT ADT 18,857 AADT 18,857
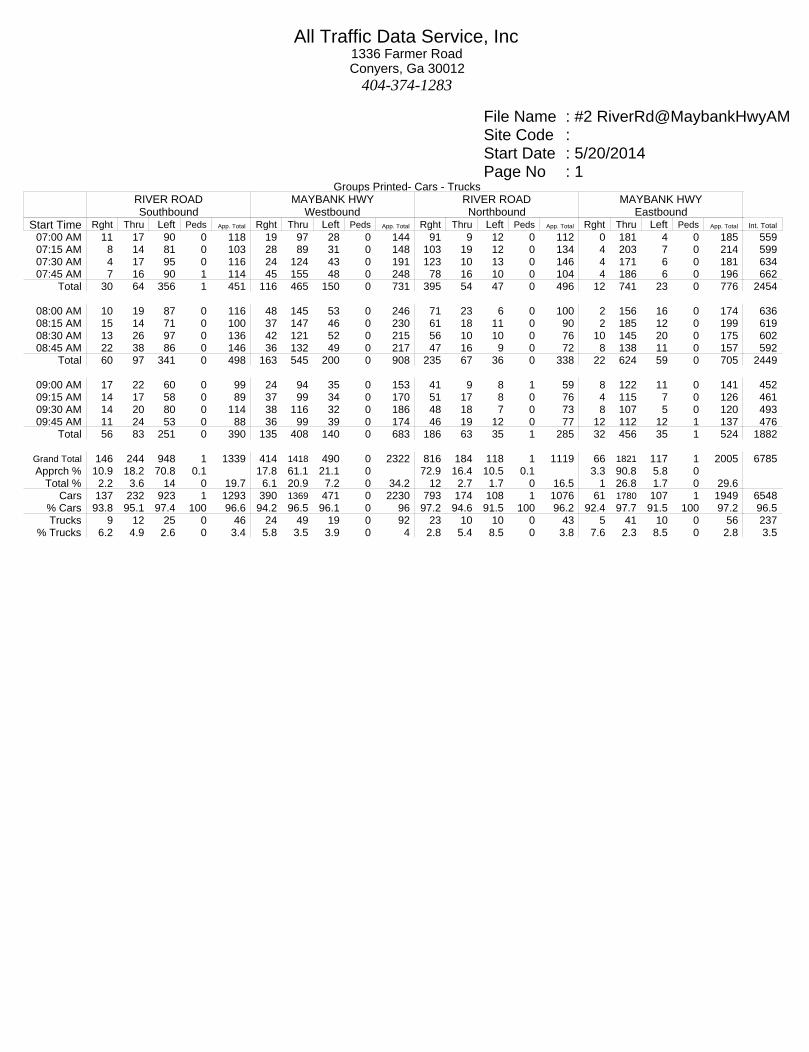
File Name : #2 RiverRd@MaybankHwyAMSite Code : Start Date : 5/20/2014Page No : 1
Groups Printed- Cars - TrucksRIVER ROADSouthbound
MAYBANK HWYWestbound
RIVER ROADNorthbound
MAYBANK HWYEastbound
Start Time Rght Thru Left Peds App. Total Rght Thru Left Peds App. Total Rght Thru Left Peds App. Total Rght Thru Left Peds App. Total Int. Total
07:00 AM 11 17 90 0 118 19 97 28 0 144 91 9 12 0 112 0 181 4 0 185 55907:15 AM 8 14 81 0 103 28 89 31 0 148 103 19 12 0 134 4 203 7 0 214 59907:30 AM 4 17 95 0 116 24 124 43 0 191 123 10 13 0 146 4 171 6 0 181 63407:45 AM 7 16 90 1 114 45 155 48 0 248 78 16 10 0 104 4 186 6 0 196 662
Total 30 64 356 1 451 116 465 150 0 731 395 54 47 0 496 12 741 23 0 776 2454
08:00 AM 10 19 87 0 116 48 145 53 0 246 71 23 6 0 100 2 156 16 0 174 63608:15 AM 15 14 71 0 100 37 147 46 0 230 61 18 11 0 90 2 185 12 0 199 61908:30 AM 13 26 97 0 136 42 121 52 0 215 56 10 10 0 76 10 145 20 0 175 60208:45 AM 22 38 86 0 146 36 132 49 0 217 47 16 9 0 72 8 138 11 0 157 592
Total 60 97 341 0 498 163 545 200 0 908 235 67 36 0 338 22 624 59 0 705 2449
09:00 AM 17 22 60 0 99 24 94 35 0 153 41 9 8 1 59 8 122 11 0 141 45209:15 AM 14 17 58 0 89 37 99 34 0 170 51 17 8 0 76 4 115 7 0 126 46109:30 AM 14 20 80 0 114 38 116 32 0 186 48 18 7 0 73 8 107 5 0 120 49309:45 AM 11 24 53 0 88 36 99 39 0 174 46 19 12 0 77 12 112 12 1 137 476
Total 56 83 251 0 390 135 408 140 0 683 186 63 35 1 285 32 456 35 1 524 1882
Grand Total 146 244 948 1 1339 414 1418 490 0 2322 816 184 118 1 1119 66 1821 117 1 2005 6785Apprch % 10.9 18.2 70.8 0.1 17.8 61.1 21.1 0 72.9 16.4 10.5 0.1 3.3 90.8 5.8 0
Total % 2.2 3.6 14 0 19.7 6.1 20.9 7.2 0 34.2 12 2.7 1.7 0 16.5 1 26.8 1.7 0 29.6Cars 137 232 923 1 1293 390 1369 471 0 2230 793 174 108 1 1076 61 1780 107 1 1949 6548
% Cars 93.8 95.1 97.4 100 96.6 94.2 96.5 96.1 0 96 97.2 94.6 91.5 100 96.2 92.4 97.7 91.5 100 97.2 96.5Trucks 9 12 25 0 46 24 49 19 0 92 23 10 10 0 43 5 41 10 0 56 237
% Trucks 6.2 4.9 2.6 0 3.4 5.8 3.5 3.9 0 4 2.8 5.4 8.5 0 3.8 7.6 2.3 8.5 0 2.8 3.5
All Traffic Data Service, Inc1336 Farmer RoadConyers, Ga 30012
404-374-1283

File Name : #2 RiverRd@MaybankHwyAMSite Code : Start Date : 5/20/2014Page No : 2
RIVER ROAD
MA
YB
AN
K H
WY
MA
YB
AN
K H
WY
RIVER ROAD
Rght
137 9
146 Thru
232 12
244 Left
923 25
948 Peds
1 0 1
InOut Total671 1293 1964 44 46 90
715 2054 1339
Rght
390
24
414
Thru
1369
49
1418
Left
471
19
490
Peds 0
0
0
Out
Tota
lIn
3496
2230
5726
89
92
181
3585
5907
2322
Left108 10
118
Thru174 10
184
Rght793 23
816
Peds1 0 1
Out TotalIn
764 1076 1840 36 43 79
800 1919 1119
Left
107
10
117
Thru
1780
41
1821
Rght
61
5
66
Peds1
0
1
Tota
lO
ut
In1614
1949
3563
68
56
124
1682
3687
2005
5/20/2014 07:00 AM5/20/2014 09:45 AM CarsTrucks
North
All Traffic Data Service, Inc1336 Farmer RoadConyers, Ga 30012
404-374-1283

File Name : #2 RiverRd@MaybankHwyAMSite Code : Start Date : 5/20/2014Page No : 3
RIVER ROADSouthbound
MAYBANK HWYWestbound
RIVER ROADNorthbound
MAYBANK HWYEastbound
Start Time Rght Thru Left Peds App. Total Rght Thru Left Peds App. Total Rght Thru Left Peds App. Total Rght Thru Left Peds App. Total Int. Total
Peak Hour Analysis From 07:00 AM to 09:45 AM - Peak 1 of 1Peak Hour for Entire Intersection Begins at 07:30 AM
07:30 AM 4 17 95 0 116 24 124 43 0 191 123 10 13 0 146 4 171 6 0 181 63407:45 AM 7 16 90 1 114 45 155 48 0 248 78 16 10 0 104 4 186 6 0 196 66208:00 AM 10 19 87 0 116 48 145 53 0 246 71 23 6 0 100 2 156 16 0 174 63608:15 AM 15 14 71 0 100 37 147 46 0 230 61 18 11 0 90 2 185 12 0 199 619
Total Volume 36 66 343 1 446 154 571 190 0 915 333 67 40 0 440 12 698 40 0 750 2551% App. Total 8.1 14.8 76.9 0.2 16.8 62.4 20.8 0 75.7 15.2 9.1 0 1.6 93.1 5.3 0
PHF .600 .868 .903 .250 .961 .802 .921 .896 .000 .922 .677 .728 .769 .000 .753 .750 .938 .625 .000 .942 .963Cars 33 62 335 1 431 151 559 189 0 899 322 64 37 0 423 12 683 37 0 732 2485
% Cars 91.7 93.9 97.7 100 96.6 98.1 97.9 99.5 0 98.3 96.7 95.5 92.5 0 96.1 100 97.9 92.5 0 97.6 97.4Trucks 3 4 8 0 15 3 12 1 0 16 11 3 3 0 17 0 15 3 0 18 66
% Trucks 8.3 6.1 2.3 0 3.4 1.9 2.1 0.5 0 1.7 3.3 4.5 7.5 0 3.9 0 2.1 7.5 0 2.4 2.6
RIVER ROAD
MA
YB
AN
K H
WY
MA
YB
AN
K H
WY
RIVER ROAD
Rght
33 3
36 Thru
62 4
66 Left
335 8
343 Peds
1 0 1
InOut Total252 431 683
9 15 24 261 707 446
Rght
151
3
154
Thru
559
12
571
Left
189
1
190
Peds 0
0
0
Out
Tota
lIn
1340
899
2239
34
16
50
1374
2289
915
Left37 3
40
Thru64 3
67
Rght322 11
333
Peds0 0 0
Out TotalIn
263 423 686 5 17 22
268 708 440
Left37
3
40
Thru683
15
698
Rght
12
0
12
Peds0
0
0
Tota
lO
ut
In629
732
1361
18
18
36
647
1397
750
Peak Hour Begins at 07:30 AM CarsTrucks
Peak Hour Data
North
All Traffic Data Service, Inc1336 Farmer RoadConyers, Ga 30012
404-374-1283

File Name : #2 RiverRd@MaybankHwyPMSite Code : Start Date : 5/20/2014Page No : 1
Groups Printed- Cars - TrucksRIVER ROADSouthbound
MAYBANK HWYWestbound
RIVER ROADNorthbound
MAYBANK HWYEastbound
Start Time Rght Thru Left Peds App. Total Rght Thru Left Peds App. Total Rght Thru Left Peds App. Total Rght Thru Left Peds App. Total Int. Total
03:00 PM 17 20 64 0 101 50 94 35 0 179 42 25 11 0 78 13 100 14 0 127 48503:15 PM 16 25 44 0 85 67 152 53 0 272 42 19 15 0 76 4 120 23 0 147 58003:30 PM 22 23 69 0 114 64 150 51 0 265 58 24 12 0 94 7 133 21 0 161 63403:45 PM 22 21 50 0 93 77 184 48 0 309 43 22 11 0 76 7 149 17 0 173 651
Total 77 89 227 0 393 258 580 187 0 1025 185 90 49 0 324 31 502 75 0 608 2350
04:00 PM 16 20 54 0 90 69 144 63 0 276 33 20 13 0 66 6 105 15 0 126 55804:15 PM 26 29 45 0 100 87 157 51 0 295 60 25 11 0 96 3 144 24 0 171 66204:30 PM 20 31 58 0 109 70 159 42 0 271 58 31 10 0 99 7 133 17 0 157 63604:45 PM 22 29 54 0 105 85 157 52 0 294 58 28 11 0 97 8 156 24 0 188 684
Total 84 109 211 0 404 311 617 208 0 1136 209 104 45 0 358 24 538 80 0 642 2540
05:00 PM 11 29 66 0 106 75 143 57 0 275 44 32 18 0 94 10 160 12 0 182 65705:15 PM 26 26 57 0 109 93 176 48 0 317 53 29 6 0 88 2 67 13 0 82 59605:30 PM 23 24 54 0 101 86 164 52 0 302 56 27 19 0 102 5 187 15 0 207 71205:45 PM 20 30 53 0 103 88 173 57 0 318 45 25 10 0 80 7 125 23 0 155 656
Total 80 109 230 0 419 342 656 214 0 1212 198 113 53 0 364 24 539 63 0 626 2621
Grand Total 241 307 668 0 1216 911 1853 609 0 3373 592 307 147 0 1046 79 1579 218 0 1876 7511Apprch % 19.8 25.2 54.9 0 27 54.9 18.1 0 56.6 29.3 14.1 0 4.2 84.2 11.6 0
Total % 3.2 4.1 8.9 0 16.2 12.1 24.7 8.1 0 44.9 7.9 4.1 2 0 13.9 1.1 21 2.9 0 25Cars 233 292 646 0 1171 889 1811 595 0 3295 575 291 137 0 1003 74 1544 209 0 1827 7296
% Cars 96.7 95.1 96.7 0 96.3 97.6 97.7 97.7 0 97.7 97.1 94.8 93.2 0 95.9 93.7 97.8 95.9 0 97.4 97.1Trucks 8 15 22 0 45 22 42 14 0 78 17 16 10 0 43 5 35 9 0 49 215
% Trucks 3.3 4.9 3.3 0 3.7 2.4 2.3 2.3 0 2.3 2.9 5.2 6.8 0 4.1 6.3 2.2 4.1 0 2.6 2.9
All Traffic Data Service, Inc1336 Farmer RoadConyers, Ga 30012
404-374-1283
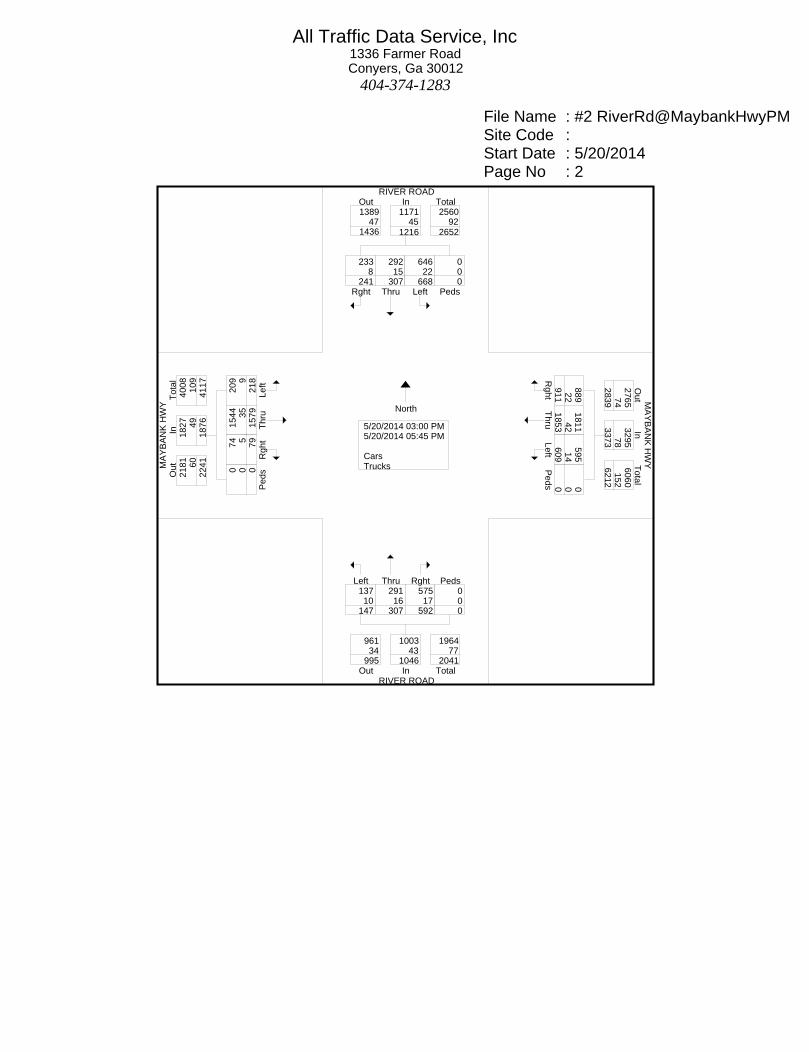
File Name : #2 RiverRd@MaybankHwyPMSite Code : Start Date : 5/20/2014Page No : 2
RIVER ROAD
MA
YB
AN
K H
WY
MA
YB
AN
K H
WY
RIVER ROAD
Rght
233 8
241 Thru
292 15
307 Left
646 22
668 Peds
0 0 0
InOut Total1389 1171 2560
47 45 92 1436 2652 1216
Rght
889
22
911
Thru
1811
42
1853
Left
595
14
609
Peds 0
0
0
Out
Tota
lIn
2765
3295
6060
74
78
152
2839
6212
3373
Left137 10
147
Thru291 16
307
Rght575 17
592
Peds0 0 0
Out TotalIn
961 1003 1964 34 43 77
995 2041 1046
Left
209
9
218
Thru
1544
35
1579
Rght
74
5
79
Peds0
0
0
Tota
lO
ut
In2181
1827
4008
60
49
109
2241
4117
1876
5/20/2014 03:00 PM5/20/2014 05:45 PM CarsTrucks
North
All Traffic Data Service, Inc1336 Farmer RoadConyers, Ga 30012
404-374-1283

File Name : #2 RiverRd@MaybankHwyPMSite Code : Start Date : 5/20/2014Page No : 3
RIVER ROADSouthbound
MAYBANK HWYWestbound
RIVER ROADNorthbound
MAYBANK HWYEastbound
Start Time Rght Thru Left Peds App. Total Rght Thru Left Peds App. Total Rght Thru Left Peds App. Total Rght Thru Left Peds App. Total Int. Total
Peak Hour Analysis From 03:00 PM to 05:45 PM - Peak 1 of 1Peak Hour for Entire Intersection Begins at 04:45 PM
04:45 PM 22 29 54 0 105 85 157 52 0 294 58 28 11 0 97 8 156 24 0 188 68405:00 PM 11 29 66 0 106 75 143 57 0 275 44 32 18 0 94 10 160 12 0 182 65705:15 PM 26 26 57 0 109 93 176 48 0 317 53 29 6 0 88 2 67 13 0 82 59605:30 PM 23 24 54 0 101 86 164 52 0 302 56 27 19 0 102 5 187 15 0 207 712
Total Volume 82 108 231 0 421 339 640 209 0 1188 211 116 54 0 381 25 570 64 0 659 2649% App. Total 19.5 25.7 54.9 0 28.5 53.9 17.6 0 55.4 30.4 14.2 0 3.8 86.5 9.7 0
PHF .788 .931 .875 .000 .966 .911 .909 .917 .000 .937 .909 .906 .711 .000 .934 .625 .762 .667 .000 .796 .930Cars 81 104 225 0 410 335 633 207 0 1175 208 114 51 0 373 25 563 63 0 651 2609
% Cars 98.8 96.3 97.4 0 97.4 98.8 98.9 99.0 0 98.9 98.6 98.3 94.4 0 97.9 100 98.8 98.4 0 98.8 98.5Trucks 1 4 6 0 11 4 7 2 0 13 3 2 3 0 8 0 7 1 0 8 40
% Trucks 1.2 3.7 2.6 0 2.6 1.2 1.1 1.0 0 1.1 1.4 1.7 5.6 0 2.1 0 1.2 1.6 0 1.2 1.5
RIVER ROAD
MA
YB
AN
K H
WY
MA
YB
AN
K H
WY
RIVER ROAD
Rght
81 1
82 Thru
104 4
108 Left
225 6
231 Peds
0 0 0
InOut Total512 410 922
7 11 18 519 940 421
Rght
335
4
339
Thru
633
7
640
Left
207
2
209
Peds 0
0
0
Out
Tota
lIn
996
1175
2171
16
13
29
1012
2200
1188
Left51 3
54
Thru114
2 116
Rght208
3 211
Peds0 0 0
Out TotalIn
336 373 709 6 8 14
342 723 381
Left63
1
64
Thru563
7
570
Rght
25
0
25
Peds0
0
0
Tota
lO
ut
In765
651
1416
11
8
19
776
1435
659
Peak Hour Begins at 04:45 PM CarsTrucks
Peak Hour Data
North
All Traffic Data Service, Inc1336 Farmer RoadConyers, Ga 30012
404-374-1283

Page 1
Site Code: 3Station ID: 3
RIVER ROAD NORTH OFLatitude: 0' 0.0000 Undefined
Longitude: 0' 0.0000 Undefined
All Traffic Data Service, Inc1336 Farmer RoadConyers, Ga 30012
404-374-1283
Start 20-May-14 NB Hour Totals SB Hour Totals Combined TotalsTime Tue Morning Afternoon Morning Afternoon Morning Afternoon Morning Afternoon Morning Afternoon
12:00 23 72 15 7512:15 22 84 9 7212:30 21 91 11 10212:45 8 78 74 325 5 65 40 314 114 63901:00 11 82 2 8101:15 5 90 3 8601:30 2 86 3 7601:45 3 82 21 340 3 82 11 325 32 66502:00 3 79 3 9802:15 2 81 1 8302:30 3 74 2 8302:45 4 88 12 322 3 78 9 342 21 66403:00 6 82 1 7803:15 1 72 2 9403:30 3 94 1 9603:45 3 92 13 340 2 83 6 351 19 69104:00 1 105 2 8904:15 3 119 2 9104:30 0 122 2 8804:45 5 126 9 472 2 86 8 354 17 82605:00 0 118 2 9805:15 6 151 4 8105:30 4 136 6 9905:45 1 160 11 565 8 85 20 363 31 92806:00 6 135 9 10106:15 8 154 16 10706:30 10 159 14 9406:45 14 136 38 584 31 92 70 394 108 97807:00 18 144 47 7807:15 33 126 58 7107:30 44 106 120 9807:45 50 97 145 473 140 61 365 308 510 78108:00 50 83 140 4708:15 52 104 106 6208:30 44 64 102 5408:45 81 82 227 333 128 43 476 206 703 53909:00 79 56 105 4209:15 68 73 132 4009:30 72 71 132 4909:45 64 58 283 258 134 31 503 162 786 42010:00 49 57 99 2610:15 60 43 83 2210:30 66 37 100 2510:45 80 33 255 170 91 17 373 90 628 26011:00 60 21 90 1511:15 84 34 72 1111:30 62 24 74 1211:45 60 23 266 102 66 11 302 49 568 151Total 1354 4284 2183 3258 3537 7542
Percent 24.0% 76.0% 40.1% 59.9% 31.9% 68.1%GrandTotal
1354 4284 2183 3258 3537 7542
Percent 24.0% 76.0% 40.1% 59.9% 31.9% 68.1%
ADT ADT 6,752 AADT 6,752

File Name : #3 RiverRd@CaneSlashRdAMSite Code : Start Date : 5/20/2014Page No : 1
Groups Printed- Cars - TrucksRIVER ROADSouthbound
CANE SLASH ROADWestbound
RIVER ROADNorthbound
CANE SLASH ROADEastbound
Start Time Rght Thru Left Peds App. Total Rght Thru Left Peds App. Total Rght Thru Left Peds App. Total Rght Thru Left Peds App. Total Int. Total
07:00 AM 1 36 0 0 37 0 0 0 0 0 0 109 0 0 109 0 0 10 0 10 15607:15 AM 2 46 0 0 48 0 0 0 0 0 0 123 1 0 124 4 0 13 0 17 18907:30 AM 3 60 0 0 63 0 0 0 0 0 0 101 1 0 102 3 0 17 0 20 18507:45 AM 3 64 0 0 67 0 0 0 0 0 0 93 1 0 94 3 0 10 1 14 175
Total 9 206 0 0 215 0 0 0 0 0 0 426 3 0 429 10 0 50 1 61 705
08:00 AM 0 69 0 0 69 0 0 0 0 0 0 92 1 0 93 3 0 13 0 16 17808:15 AM 7 52 0 0 59 0 0 0 0 0 0 78 2 0 80 2 0 4 0 6 14508:30 AM 2 74 0 0 76 0 0 0 0 0 0 70 1 0 71 2 0 3 0 5 15208:45 AM 3 91 0 0 94 0 0 0 0 0 0 55 1 0 56 0 0 2 0 2 152
Total 12 286 0 0 298 0 0 0 0 0 0 295 5 0 300 7 0 22 0 29 627
09:00 AM 6 52 0 0 58 0 0 0 0 0 0 49 1 0 50 2 0 5 0 7 11509:15 AM 0 48 0 0 48 0 0 0 0 0 0 63 0 0 63 0 0 9 0 9 12009:30 AM 5 52 0 0 57 0 0 0 0 0 0 52 2 0 54 1 0 9 0 10 12109:45 AM 4 63 0 0 67 0 0 0 0 0 0 60 0 0 60 2 0 3 0 5 132
Total 15 215 0 0 230 0 0 0 0 0 0 224 3 0 227 5 0 26 0 31 488
Grand Total 36 707 0 0 743 0 0 0 0 0 0 945 11 0 956 22 0 98 1 121 1820Apprch % 4.8 95.2 0 0 0 0 0 0 0 98.8 1.2 0 18.2 0 81 0.8
Total % 2 38.8 0 0 40.8 0 0 0 0 0 0 51.9 0.6 0 52.5 1.2 0 5.4 0.1 6.6Cars 33 676 0 0 709 0 0 0 0 0 0 914 10 0 924 19 0 95 1 115 1748
% Cars 91.7 95.6 0 0 95.4 0 0 0 0 0 0 96.7 90.9 0 96.7 86.4 0 96.9 100 95 96Trucks 3 31 0 0 34 0 0 0 0 0 0 31 1 0 32 3 0 3 0 6 72
% Trucks 8.3 4.4 0 0 4.6 0 0 0 0 0 0 3.3 9.1 0 3.3 13.6 0 3.1 0 5 4
All Traffic Data Service, Inc1336 Farmer RoadConyers, Ga 30012
404-374-1283
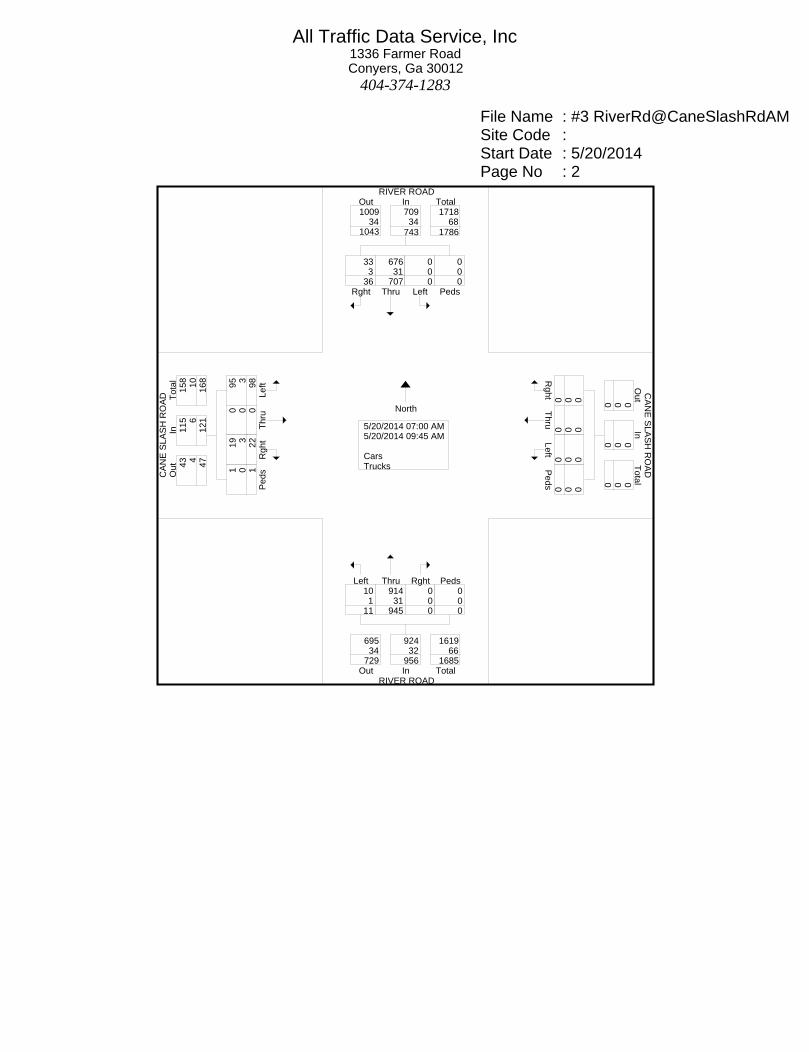
File Name : #3 RiverRd@CaneSlashRdAMSite Code : Start Date : 5/20/2014Page No : 2
RIVER ROAD
CA
NE
SLA
SH
RO
AD
CA
NE
SLA
SH
RO
AD
RIVER ROAD
Rght
33 3
36 Thru
676 31
707 Left
0 0 0
Peds
0 0 0
InOut Total1009 709 1718
34 34 68 1043 1786 743
Rght 0
0
0
Thru 0
0
0
Left 0
0
0
Peds 0
0
0
Out
Tota
lIn
0
0
0
0
0
0
0
0
0
Left10 1
11
Thru914 31
945
Rght0 0 0
Peds0 0 0
Out TotalIn
695 924 1619 34 32 66
729 1685 956
Left95
3
98
Thru
0
0
0
Rght
19
3
22
Peds1
0
1
Tota
lO
ut
In43
115
158
4
6
10
47
168
121
5/20/2014 07:00 AM5/20/2014 09:45 AM CarsTrucks
North
All Traffic Data Service, Inc1336 Farmer RoadConyers, Ga 30012
404-374-1283

File Name : #3 RiverRd@CaneSlashRdAMSite Code : Start Date : 5/20/2014Page No : 3
RIVER ROADSouthbound
CANE SLASH ROADWestbound
RIVER ROADNorthbound
CANE SLASH ROADEastbound
Start Time Rght Thru Left Peds App. Total Rght Thru Left Peds App. Total Rght Thru Left Peds App. Total Rght Thru Left Peds App. Total Int. Total
Peak Hour Analysis From 07:00 AM to 09:45 AM - Peak 1 of 1Peak Hour for Entire Intersection Begins at 07:15 AM
07:15 AM 2 46 0 0 48 0 0 0 0 0 0 123 1 0 124 4 0 13 0 17 18907:30 AM 3 60 0 0 63 0 0 0 0 0 0 101 1 0 102 3 0 17 0 20 18507:45 AM 3 64 0 0 67 0 0 0 0 0 0 93 1 0 94 3 0 10 1 14 17508:00 AM 0 69 0 0 69 0 0 0 0 0 0 92 1 0 93 3 0 13 0 16 178
Total Volume 8 239 0 0 247 0 0 0 0 0 0 409 4 0 413 13 0 53 1 67 727% App. Total 3.2 96.8 0 0 0 0 0 0 0 99 1 0 19.4 0 79.1 1.5
PHF .667 .866 .000 .000 .895 .000 .000 .000 .000 .000 .000 .831 1.00 .000 .833 .813 .000 .779 .250 .838 .962Cars 7 231 0 0 238 0 0 0 0 0 0 400 4 0 404 12 0 52 1 65 707
% Cars 87.5 96.7 0 0 96.4 0 0 0 0 0 0 97.8 100 0 97.8 92.3 0 98.1 100 97.0 97.2Trucks 1 8 0 0 9 0 0 0 0 0 0 9 0 0 9 1 0 1 0 2 20
% Trucks 12.5 3.3 0 0 3.6 0 0 0 0 0 0 2.2 0 0 2.2 7.7 0 1.9 0 3.0 2.8
RIVER ROAD
CA
NE
SLA
SH
RO
AD
CA
NE
SLA
SH
RO
AD
RIVER ROAD
Rght
7 1 8
Thru
231 8
239 Left
0 0 0
Peds
0 0 0
InOut Total452 238 690 10 9 19
462 709 247
Rght 0
0
0
Thru 0
0
0
Left 0
0
0
Peds 0
0
0
Out
Tota
lIn
0
0
0
0
0
0
0
0
0
Left4 0 4
Thru400
9 409
Rght0 0 0
Peds0 0 0
Out TotalIn
243 404 647 9 9 18
252 665 413
Left52
1
53
Thru
0
0
0
Rght
12
1
13
Peds1
0
1
Tota
lO
ut
In11
65
76
1
2
3
12
79
67
Peak Hour Begins at 07:15 AM CarsTrucks
Peak Hour Data
North
All Traffic Data Service, Inc1336 Farmer RoadConyers, Ga 30012
404-374-1283
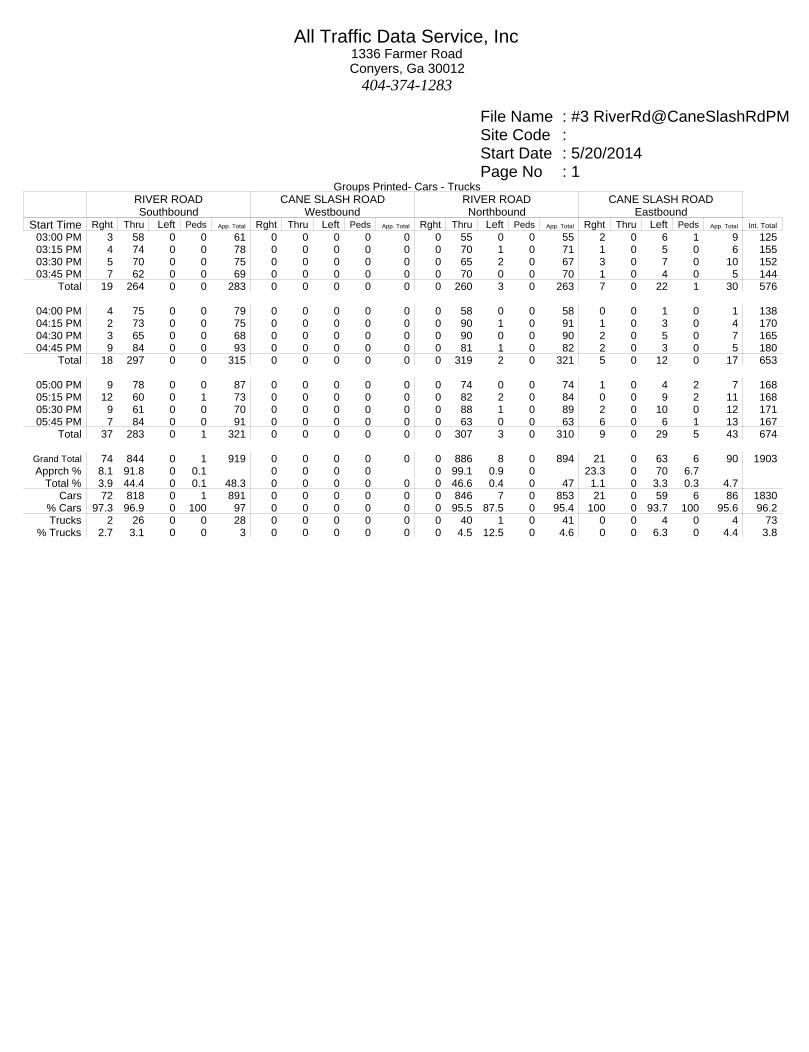
File Name : #3 RiverRd@CaneSlashRdPMSite Code : Start Date : 5/20/2014Page No : 1
Groups Printed- Cars - TrucksRIVER ROADSouthbound
CANE SLASH ROADWestbound
RIVER ROADNorthbound
CANE SLASH ROADEastbound
Start Time Rght Thru Left Peds App. Total Rght Thru Left Peds App. Total Rght Thru Left Peds App. Total Rght Thru Left Peds App. Total Int. Total
03:00 PM 3 58 0 0 61 0 0 0 0 0 0 55 0 0 55 2 0 6 1 9 12503:15 PM 4 74 0 0 78 0 0 0 0 0 0 70 1 0 71 1 0 5 0 6 15503:30 PM 5 70 0 0 75 0 0 0 0 0 0 65 2 0 67 3 0 7 0 10 15203:45 PM 7 62 0 0 69 0 0 0 0 0 0 70 0 0 70 1 0 4 0 5 144
Total 19 264 0 0 283 0 0 0 0 0 0 260 3 0 263 7 0 22 1 30 576
04:00 PM 4 75 0 0 79 0 0 0 0 0 0 58 0 0 58 0 0 1 0 1 13804:15 PM 2 73 0 0 75 0 0 0 0 0 0 90 1 0 91 1 0 3 0 4 17004:30 PM 3 65 0 0 68 0 0 0 0 0 0 90 0 0 90 2 0 5 0 7 16504:45 PM 9 84 0 0 93 0 0 0 0 0 0 81 1 0 82 2 0 3 0 5 180
Total 18 297 0 0 315 0 0 0 0 0 0 319 2 0 321 5 0 12 0 17 653
05:00 PM 9 78 0 0 87 0 0 0 0 0 0 74 0 0 74 1 0 4 2 7 16805:15 PM 12 60 0 1 73 0 0 0 0 0 0 82 2 0 84 0 0 9 2 11 16805:30 PM 9 61 0 0 70 0 0 0 0 0 0 88 1 0 89 2 0 10 0 12 17105:45 PM 7 84 0 0 91 0 0 0 0 0 0 63 0 0 63 6 0 6 1 13 167
Total 37 283 0 1 321 0 0 0 0 0 0 307 3 0 310 9 0 29 5 43 674
Grand Total 74 844 0 1 919 0 0 0 0 0 0 886 8 0 894 21 0 63 6 90 1903Apprch % 8.1 91.8 0 0.1 0 0 0 0 0 99.1 0.9 0 23.3 0 70 6.7
Total % 3.9 44.4 0 0.1 48.3 0 0 0 0 0 0 46.6 0.4 0 47 1.1 0 3.3 0.3 4.7Cars 72 818 0 1 891 0 0 0 0 0 0 846 7 0 853 21 0 59 6 86 1830
% Cars 97.3 96.9 0 100 97 0 0 0 0 0 0 95.5 87.5 0 95.4 100 0 93.7 100 95.6 96.2Trucks 2 26 0 0 28 0 0 0 0 0 0 40 1 0 41 0 0 4 0 4 73
% Trucks 2.7 3.1 0 0 3 0 0 0 0 0 0 4.5 12.5 0 4.6 0 0 6.3 0 4.4 3.8
All Traffic Data Service, Inc1336 Farmer RoadConyers, Ga 30012
404-374-1283

File Name : #3 RiverRd@CaneSlashRdPMSite Code : Start Date : 5/20/2014Page No : 2
RIVER ROAD
CA
NE
SLA
SH
RO
AD
CA
NE
SLA
SH
RO
AD
RIVER ROAD
Rght
72 2
74 Thru
818 26
844 Left
0 0 0
Peds
1 0 1
InOut Total905 891 1796 44 28 72
949 1868 919
Rght 0
0
0
Thru 0
0
0
Left 0
0
0
Peds 0
0
0
Out
Tota
lIn
0
0
0
0
0
0
0
0
0
Left7 1 8
Thru846 40
886
Rght0 0 0
Peds0 0 0
Out TotalIn
839 853 1692 26 41 67
865 1759 894
Left59
4
63
Thru
0
0
0
Rght
21
0
21
Peds6
0
6
Tota
lO
ut
In79
86
165
3
4
7
82
172
90
5/20/2014 03:00 PM5/20/2014 05:45 PM CarsTrucks
North
All Traffic Data Service, Inc1336 Farmer RoadConyers, Ga 30012
404-374-1283

File Name : #3 RiverRd@CaneSlashRdPMSite Code : Start Date : 5/20/2014Page No : 3
RIVER ROADSouthbound
CANE SLASH ROADWestbound
RIVER ROADNorthbound
CANE SLASH ROADEastbound
Start Time Rght Thru Left Peds App. Total Rght Thru Left Peds App. Total Rght Thru Left Peds App. Total Rght Thru Left Peds App. Total Int. Total
Peak Hour Analysis From 03:00 PM to 05:45 PM - Peak 1 of 1Peak Hour for Entire Intersection Begins at 04:45 PM
04:45 PM 9 84 0 0 93 0 0 0 0 0 0 81 1 0 82 2 0 3 0 5 18005:00 PM 9 78 0 0 87 0 0 0 0 0 0 74 0 0 74 1 0 4 2 7 16805:15 PM 12 60 0 1 73 0 0 0 0 0 0 82 2 0 84 0 0 9 2 11 16805:30 PM 9 61 0 0 70 0 0 0 0 0 0 88 1 0 89 2 0 10 0 12 171
Total Volume 39 283 0 1 323 0 0 0 0 0 0 325 4 0 329 5 0 26 4 35 687% App. Total 12.1 87.6 0 0.3 0 0 0 0 0 98.8 1.2 0 14.3 0 74.3 11.4
PHF .813 .842 .000 .250 .868 .000 .000 .000 .000 .000 .000 .923 .500 .000 .924 .625 .000 .650 .500 .729 .954Cars 39 278 0 1 318 0 0 0 0 0 0 317 4 0 321 5 0 26 4 35 674
% Cars 100 98.2 0 100 98.5 0 0 0 0 0 0 97.5 100 0 97.6 100 0 100 100 100 98.1Trucks 0 5 0 0 5 0 0 0 0 0 0 8 0 0 8 0 0 0 0 0 13
% Trucks 0 1.8 0 0 1.5 0 0 0 0 0 0 2.5 0 0 2.4 0 0 0 0 0 1.9
RIVER ROAD
CA
NE
SLA
SH
RO
AD
CA
NE
SLA
SH
RO
AD
RIVER ROAD
Rght
39 0
39 Thru
278 5
283 Left
0 0 0
Peds
1 0 1
InOut Total343 318 661
8 5 13 351 674 323
Rght 0
0
0
Thru 0
0
0
Left 0
0
0
Peds 0
0
0
Out
Tota
lIn
0
0
0
0
0
0
0
0
0
Left4 0 4
Thru317
8 325
Rght0 0 0
Peds0 0 0
Out TotalIn
283 321 604 5 8 13
288 617 329
Left26
0
26
Thru
0
0
0
Rght5
0
5
Peds4
0
4
Tota
lO
ut
In43
35
78
0
0
0
43
78
35
Peak Hour Begins at 04:45 PM CarsTrucks
Peak Hour Data
North
All Traffic Data Service, Inc1336 Farmer RoadConyers, Ga 30012
404-374-1283

Page 1
Site Code: 4Station ID: 4
RIVER ROAD SOUTH OFLatitude: 0' 0.0000 Undefined
Longitude: 0' 0.0000 Undefined
All Traffic Data Service, Inc1336 Farmer RoadConyers, Ga 30012
404-374-1283
Start 20-May-14 NB Hour Totals SB Hour Totals Combined TotalsTime Tue Morning Afternoon Morning Afternoon Morning Afternoon Morning Afternoon Morning Afternoon
12:00 4 76 6 4612:15 6 84 2 7612:30 11 80 4 5012:45 12 68 33 308 4 90 16 262 49 57001:00 6 76 2 5701:15 6 53 1 9201:30 3 73 1 5401:45 8 75 23 277 4 76 8 279 31 55602:00 4 88 1 6002:15 2 61 2 7802:30 2 86 0 6802:45 2 86 10 321 0 60 3 266 13 58703:00 4 74 2 6603:15 3 75 2 8603:30 2 90 0 7603:45 4 80 13 319 1 70 5 298 18 61704:00 1 62 1 8004:15 4 96 1 8004:30 10 100 0 7204:45 6 92 21 350 2 103 4 335 25 68505:00 11 84 2 8605:15 15 94 3 7405:30 16 98 4 7605:45 16 74 58 350 4 92 13 328 71 67806:00 34 85 18 7406:15 48 66 17 8806:30 71 70 30 7206:45 100 66 253 287 34 74 99 308 352 59507:00 140 54 38 5007:15 176 51 52 5007:30 154 38 62 3807:45 142 41 612 184 56 48 208 186 820 37008:00 128 35 70 5408:15 111 24 60 5308:30 98 26 66 5208:45 92 24 429 109 90 49 286 208 715 31709:00 94 18 53 3409:15 94 8 47 3209:30 80 12 55 3209:45 103 13 371 51 57 23 212 121 583 17210:00 89 11 50 2510:15 96 10 56 1610:30 75 10 60 1310:45 80 10 340 41 65 9 231 63 571 10411:00 83 11 62 1411:15 70 11 48 1611:30 70 12 55 1111:45 84 4 307 38 60 9 225 50 532 88Total 2470 2635 1310 2704 3780 5339
Percent 48.4% 51.6% 32.6% 67.4% 41.5% 58.5%GrandTotal
2470 2635 1310 2704 3780 5339
Percent 48.4% 51.6% 32.6% 67.4% 41.5% 58.5%
ADT ADT 4,375 AADT 4,375

File Name : #4 RiverRd@StardustWayAMSite Code : Start Date : 5/20/2014Page No : 1
Groups Printed- Cars - TrucksRIVER ROADSouthbound
STARDUST WAYWestbound
RIVER ROADNorthbound
STARDUST WAYEastbound
Start Time Rght Thru Left Peds App. Total Rght Thru Left Peds App. Total Rght Thru Left Peds App. Total Rght Thru Left Peds App. Total Int. Total
07:00 AM 1 157 0 0 158 0 0 0 0 0 0 47 0 0 47 6 0 1 0 7 21207:15 AM 1 110 0 0 111 0 0 0 0 0 0 57 1 0 58 6 0 1 1 8 17707:30 AM 0 93 0 0 93 0 0 0 0 0 0 37 0 0 37 7 0 0 0 7 13707:45 AM 0 107 0 0 107 0 0 0 0 0 0 67 0 0 67 4 0 0 0 4 178
Total 2 467 0 0 469 0 0 0 0 0 0 208 1 0 209 23 0 2 1 26 704
08:00 AM 0 81 0 0 81 0 0 0 0 0 0 77 2 0 79 5 0 1 0 6 16608:15 AM 2 120 0 0 122 0 0 0 0 0 0 62 1 0 63 7 0 4 0 11 19608:30 AM 0 121 0 0 121 0 0 0 0 0 0 61 0 0 61 4 0 0 0 4 18608:45 AM 0 131 0 0 131 0 0 0 0 0 0 64 1 0 65 5 0 1 0 6 202
Total 2 453 0 0 455 0 0 0 0 0 0 264 4 0 268 21 0 6 0 27 750
09:00 AM 0 91 0 0 91 0 0 0 0 0 0 44 1 0 45 6 0 0 1 7 14309:15 AM 0 80 0 0 80 0 0 0 0 0 0 57 1 0 58 2 0 0 0 2 14009:30 AM 0 91 0 0 91 0 0 0 0 0 0 51 1 0 52 5 0 1 0 6 14909:45 AM 0 83 0 0 83 0 0 0 0 0 0 71 3 0 74 3 0 0 0 3 160
Total 0 345 0 0 345 0 0 0 0 0 0 223 6 0 229 16 0 1 1 18 592
Grand Total 4 1265 0 0 1269 0 0 0 0 0 0 695 11 0 706 60 0 9 2 71 2046Apprch % 0.3 99.7 0 0 0 0 0 0 0 98.4 1.6 0 84.5 0 12.7 2.8
Total % 0.2 61.8 0 0 62 0 0 0 0 0 0 34 0.5 0 34.5 2.9 0 0.4 0.1 3.5Cars 4 1217 0 0 1221 0 0 0 0 0 0 656 10 0 666 58 0 9 2 69 1956
% Cars 100 96.2 0 0 96.2 0 0 0 0 0 0 94.4 90.9 0 94.3 96.7 0 100 100 97.2 95.6Trucks 0 48 0 0 48 0 0 0 0 0 0 39 1 0 40 2 0 0 0 2 90
% Trucks 0 3.8 0 0 3.8 0 0 0 0 0 0 5.6 9.1 0 5.7 3.3 0 0 0 2.8 4.4
All Traffic Data Service, Inc1336 Farmer RoadConyers, Ga 30012
404-374-1283

File Name : #4 RiverRd@StardustWayAMSite Code : Start Date : 5/20/2014Page No : 2
RIVER ROAD
ST
AR
DU
ST
WA
Y S
TA
RD
US
T W
AY
RIVER ROAD
Rght
4 0 4
Thru
1217 48
1265 Left
0 0 0
Peds
0 0 0
InOut Total665 1221 1886 39 48 87
704 1973 1269
Rght 0
0
0
Thru 0
0
0
Left 0
0
0
Peds 0
0
0
Out
Tota
lIn
0
0
0
0
0
0
0
0
0
Left10 1
11
Thru656 39
695
Rght0 0 0
Peds0 0 0
Out TotalIn
1275 666 1941 50 40 90
1325 2031 706
Left
9
0
9
Thru
0
0
0
Rght
58
2
60
Peds2
0
2
Tota
lO
ut
In14
69
83
1
2
3
15
86
71
5/20/2014 07:00 AM5/20/2014 09:45 AM CarsTrucks
North
All Traffic Data Service, Inc1336 Farmer RoadConyers, Ga 30012
404-374-1283

File Name : #4 RiverRd@StardustWayAMSite Code : Start Date : 5/20/2014Page No : 3
RIVER ROADSouthbound
STARDUST WAYWestbound
RIVER ROADNorthbound
STARDUST WAYEastbound
Start Time Rght Thru Left Peds App. Total Rght Thru Left Peds App. Total Rght Thru Left Peds App. Total Rght Thru Left Peds App. Total Int. Total
Peak Hour Analysis From 07:00 AM to 09:45 AM - Peak 1 of 1Peak Hour for Entire Intersection Begins at 08:00 AM
08:00 AM 0 81 0 0 81 0 0 0 0 0 0 77 2 0 79 5 0 1 0 6 16608:15 AM 2 120 0 0 122 0 0 0 0 0 0 62 1 0 63 7 0 4 0 11 19608:30 AM 0 121 0 0 121 0 0 0 0 0 0 61 0 0 61 4 0 0 0 4 18608:45 AM 0 131 0 0 131 0 0 0 0 0 0 64 1 0 65 5 0 1 0 6 202
Total Volume 2 453 0 0 455 0 0 0 0 0 0 264 4 0 268 21 0 6 0 27 750% App. Total 0.4 99.6 0 0 0 0 0 0 0 98.5 1.5 0 77.8 0 22.2 0
PHF .250 .865 .000 .000 .868 .000 .000 .000 .000 .000 .000 .857 .500 .000 .848 .750 .000 .375 .000 .614 .928Cars 2 436 0 0 438 0 0 0 0 0 0 252 4 0 256 20 0 6 0 26 720
% Cars 100 96.2 0 0 96.3 0 0 0 0 0 0 95.5 100 0 95.5 95.2 0 100 0 96.3 96.0Trucks 0 17 0 0 17 0 0 0 0 0 0 12 0 0 12 1 0 0 0 1 30
% Trucks 0 3.8 0 0 3.7 0 0 0 0 0 0 4.5 0 0 4.5 4.8 0 0 0 3.7 4.0
RIVER ROAD
ST
AR
DU
ST
WA
Y S
TA
RD
US
T W
AY
RIVER ROAD
Rght
2 0 2
Thru
436 17
453 Left
0 0 0
Peds
0 0 0
InOut Total258 438 696 12 17 29
270 725 455
Rght 0
0
0
Thru 0
0
0
Left 0
0
0
Peds 0
0
0
Out
Tota
lIn
0
0
0
0
0
0
0
0
0
Left4 0 4
Thru252 12
264
Rght0 0 0
Peds0 0 0
Out TotalIn
456 256 712 18 12 30
474 742 268
Left
6
0
6
Thru
0
0
0
Rght
20
1
21
Peds0
0
0
Tota
lO
ut
In6
26
32
0
1
1
6
33
27
Peak Hour Begins at 08:00 AM CarsTrucks
Peak Hour Data
North
All Traffic Data Service, Inc1336 Farmer RoadConyers, Ga 30012
404-374-1283

File Name : #4 RiverRd@StardustWayPMSite Code : Start Date : 5/20/2014Page No : 1
Groups Printed- Cars - TrucksRIVER ROADSouthbound
STARDUST WAYWestbound
RIVER ROADNorthbound
STARDUST WAYEastbound
Start Time Rght Thru Left Peds App. Total Rght Thru Left Peds App. Total Rght Thru Left Peds App. Total Rght Thru Left Peds App. Total Int. Total
03:00 PM 1 85 0 0 86 0 0 0 0 0 0 89 5 0 94 3 0 1 0 4 18403:15 PM 1 82 0 0 83 0 0 0 0 0 0 108 3 0 111 2 0 0 0 2 19603:30 PM 1 85 0 0 86 0 0 0 0 0 0 112 6 0 118 4 0 1 1 6 21003:45 PM 1 76 0 0 77 0 0 0 0 0 0 114 5 0 119 3 0 1 0 4 200
Total 4 328 0 0 332 0 0 0 0 0 0 423 19 0 442 12 0 3 1 16 790
04:00 PM 0 87 0 0 87 0 0 0 0 0 0 116 3 0 119 0 0 1 0 1 20704:15 PM 1 84 0 1 86 0 0 0 0 0 0 127 4 0 131 2 0 1 1 4 22104:30 PM 1 87 0 0 88 0 0 0 0 0 0 137 4 0 141 4 0 1 0 5 23404:45 PM 1 81 0 0 82 0 0 0 0 0 0 143 5 0 148 1 0 1 0 2 232
Total 3 339 0 1 343 0 0 0 0 0 0 523 16 0 539 7 0 4 1 12 894
05:00 PM 2 89 0 0 91 0 0 0 0 0 0 120 2 0 122 4 0 0 0 4 21705:15 PM 1 93 0 0 94 0 0 0 0 0 0 148 8 0 156 0 0 1 0 1 25105:30 PM 0 86 0 0 86 0 0 0 0 0 0 134 4 0 138 4 0 1 0 5 22905:45 PM 1 78 0 0 79 0 0 0 0 0 0 141 4 0 145 2 0 1 0 3 227
Total 4 346 0 0 350 0 0 0 0 0 0 543 18 0 561 10 0 3 0 13 924
Grand Total 11 1013 0 1 1025 0 0 0 0 0 0 1489 53 0 1542 29 0 10 2 41 2608Apprch % 1.1 98.8 0 0.1 0 0 0 0 0 96.6 3.4 0 70.7 0 24.4 4.9
Total % 0.4 38.8 0 0 39.3 0 0 0 0 0 0 57.1 2 0 59.1 1.1 0 0.4 0.1 1.6Cars 11 975 0 1 987 0 0 0 0 0 0 1439 52 0 1491 29 0 10 2 41 2519
% Cars 100 96.2 0 100 96.3 0 0 0 0 0 0 96.6 98.1 0 96.7 100 0 100 100 100 96.6Trucks 0 38 0 0 38 0 0 0 0 0 0 50 1 0 51 0 0 0 0 0 89
% Trucks 0 3.8 0 0 3.7 0 0 0 0 0 0 3.4 1.9 0 3.3 0 0 0 0 0 3.4
All Traffic Data Service, Inc1336 Farmer RoadConyers, Ga 30012
404-374-1283

File Name : #4 RiverRd@StardustWayPMSite Code : Start Date : 5/20/2014Page No : 2
RIVER ROAD
ST
AR
DU
ST
WA
Y S
TA
RD
US
T W
AY
RIVER ROAD
Rght
11 0
11 Thru
975 38
1013 Left
0 0 0
Peds
1 0 1
InOut Total1449 987 2436
50 38 88 1499 2524 1025
Rght 0
0
0
Thru 0
0
0
Left 0
0
0
Peds 0
0
0
Out
Tota
lIn
0
0
0
0
0
0
0
0
0
Left52 1
53
Thru1439
50 1489
Rght0 0 0
Peds0 0 0
Out TotalIn
1004 1491 2495 38 51 89
1042 2584 1542
Left10
0
10
Thru
0
0
0
Rght
29
0
29
Peds2
0
2
Tota
lO
ut
In63
41
104
1
0
1
64
105
41
5/20/2014 03:00 PM5/20/2014 05:45 PM CarsTrucks
North
All Traffic Data Service, Inc1336 Farmer RoadConyers, Ga 30012
404-374-1283

File Name : #4 RiverRd@StardustWayPMSite Code : Start Date : 5/20/2014Page No : 3
RIVER ROADSouthbound
STARDUST WAYWestbound
RIVER ROADNorthbound
STARDUST WAYEastbound
Start Time Rght Thru Left Peds App. Total Rght Thru Left Peds App. Total Rght Thru Left Peds App. Total Rght Thru Left Peds App. Total Int. Total
Peak Hour Analysis From 03:00 PM to 05:45 PM - Peak 1 of 1Peak Hour for Entire Intersection Begins at 04:30 PM
04:30 PM 1 87 0 0 88 0 0 0 0 0 0 137 4 0 141 4 0 1 0 5 23404:45 PM 1 81 0 0 82 0 0 0 0 0 0 143 5 0 148 1 0 1 0 2 23205:00 PM 2 89 0 0 91 0 0 0 0 0 0 120 2 0 122 4 0 0 0 4 21705:15 PM 1 93 0 0 94 0 0 0 0 0 0 148 8 0 156 0 0 1 0 1 251
Total Volume 5 350 0 0 355 0 0 0 0 0 0 548 19 0 567 9 0 3 0 12 934% App. Total 1.4 98.6 0 0 0 0 0 0 0 96.6 3.4 0 75 0 25 0
PHF .625 .941 .000 .000 .944 .000 .000 .000 .000 .000 .000 .926 .594 .000 .909 .563 .000 .750 .000 .600 .930Cars 5 340 0 0 345 0 0 0 0 0 0 539 19 0 558 9 0 3 0 12 915
% Cars 100 97.1 0 0 97.2 0 0 0 0 0 0 98.4 100 0 98.4 100 0 100 0 100 98.0Trucks 0 10 0 0 10 0 0 0 0 0 0 9 0 0 9 0 0 0 0 0 19
% Trucks 0 2.9 0 0 2.8 0 0 0 0 0 0 1.6 0 0 1.6 0 0 0 0 0 2.0
RIVER ROAD
ST
AR
DU
ST
WA
Y S
TA
RD
US
T W
AY
RIVER ROAD
Rght
5 0 5
Thru
340 10
350 Left
0 0 0
Peds
0 0 0
InOut Total542 345 887
9 10 19 551 906 355
Rght 0
0
0
Thru 0
0
0
Left 0
0
0
Peds 0
0
0
Out
Tota
lIn
0
0
0
0
0
0
0
0
0
Left19 0
19
Thru539
9 548
Rght0 0 0
Peds0 0 0
Out TotalIn
349 558 907 10 9 19
359 926 567
Left
3
0
3
Thru
0
0
0
Rght9
0
9
Peds0
0
0
Tota
lO
ut
In24
12
36
0
0
0
24
36
12
Peak Hour Begins at 04:30 PM CarsTrucks
Peak Hour Data
North
All Traffic Data Service, Inc1336 Farmer RoadConyers, Ga 30012
404-374-1283

Page 1
Site Code: 5Station ID: 5
FENWICK HALL ALLEE NORTH OFLatitude: 0' 0.0000 Undefined
Longitude: 0' 0.0000 Undefined
All Traffic Data Service, Inc1336 Farmer RoadConyers, Ga 30012
404-374-1283
Start 20-May-14 EB Hour Totals WB Hour Totals Combined TotalsTime Tue Morning Afternoon Morning Afternoon Morning Afternoon Morning Afternoon Morning Afternoon
12:00 2 5 1 712:15 2 14 1 412:30 1 8 1 812:45 0 8 5 35 0 6 3 25 8 6001:00 1 3 0 701:15 2 7 0 901:30 0 8 0 201:45 0 6 3 24 0 6 0 24 3 4802:00 1 9 0 702:15 2 10 0 902:30 0 6 0 502:45 2 8 5 33 0 5 0 26 5 5903:00 0 10 1 303:15 0 15 0 903:30 0 13 0 1203:45 0 16 0 54 0 11 1 35 1 8904:00 0 12 0 604:15 0 19 1 604:30 0 20 1 604:45 0 15 0 66 0 7 2 25 2 9105:00 0 12 1 605:15 0 10 2 1205:30 0 20 6 305:45 0 13 0 55 7 4 16 25 16 8006:00 0 9 5 606:15 0 18 5 1606:30 2 16 11 1006:45 0 12 2 55 16 9 37 41 39 9607:00 4 12 15 807:15 2 8 15 807:30 8 8 18 407:45 6 5 20 33 18 3 66 23 86 5608:00 8 10 13 308:15 7 13 9 508:30 2 12 17 208:45 1 11 18 46 14 4 53 14 71 6009:00 6 8 6 609:15 4 12 10 209:30 4 5 12 209:45 22 8 36 33 11 2 39 12 75 4510:00 5 8 11 010:15 4 4 14 110:30 8 6 6 710:45 3 5 20 23 8 1 39 9 59 3211:00 8 5 4 111:15 2 4 10 011:30 6 3 14 211:45 5 4 21 16 7 0 35 3 56 19Total 130 473 291 262 421 735
Percent 21.6% 78.4% 52.6% 47.4% 36.4% 63.6%GrandTotal
130 473 291 262 421 735
Percent 21.6% 78.4% 52.6% 47.4% 36.4% 63.6%
ADT ADT 537 AADT 537

File Name : #5 OldMaybankHwy@MaybankHwyAMSite Code : Start Date : 5/20/2014Page No : 1
Groups Printed- Cars - TrucksOLD MAYBANK HWY
SouthboundMAYBANK HWY
WestboundOLD MAYBANK HWY
NorthboundMAYBANK HWY
EastboundStart Time Rght Thru Left Peds App. Total Rght Thru Left Peds App. Total Rght Thru Left Peds App. Total Rght Thru Left Peds App. Total Int. Total
07:00 AM 2 0 11 0 13 3 144 0 0 147 0 0 0 0 0 0 375 4 0 379 53907:15 AM 2 0 23 0 25 1 163 0 0 164 0 0 0 0 0 0 376 0 0 376 56507:30 AM 2 0 21 0 23 0 223 0 0 223 0 0 0 0 0 0 410 2 0 412 65807:45 AM 2 0 20 0 22 8 227 0 0 235 0 0 0 0 0 0 367 2 0 369 626
Total 8 0 75 0 83 12 757 0 0 769 0 0 0 0 0 0 1528 8 0 1536 2388
08:00 AM 1 0 24 0 25 6 246 0 0 252 0 0 0 0 0 0 320 2 0 322 59908:15 AM 8 0 11 0 19 7 217 0 0 224 0 0 0 0 0 0 325 4 0 329 57208:30 AM 6 0 13 0 19 5 218 0 0 223 0 0 0 0 0 0 311 3 0 314 55608:45 AM 2 0 18 0 20 4 203 0 0 207 0 0 0 0 0 0 270 4 0 274 501
Total 17 0 66 0 83 22 884 0 0 906 0 0 0 0 0 0 1226 13 0 1239 2228
09:00 AM 2 0 8 0 10 11 148 0 0 159 0 0 0 0 0 0 217 10 0 227 39609:15 AM 1 0 5 0 6 5 166 0 0 171 0 0 0 0 0 0 229 6 0 235 41209:30 AM 8 0 12 0 20 12 185 0 0 197 0 0 0 0 0 0 230 1 0 231 44809:45 AM 7 0 5 0 12 8 186 0 0 194 0 0 0 0 0 0 213 2 0 215 421
Total 18 0 30 0 48 36 685 0 0 721 0 0 0 0 0 0 889 19 0 908 1677
Grand Total 43 0 171 0 214 70 2326 0 0 2396 0 0 0 0 0 0 3643 40 0 3683 6293Apprch % 20.1 0 79.9 0 2.9 97.1 0 0 0 0 0 0 0 98.9 1.1 0
Total % 0.7 0 2.7 0 3.4 1.1 37 0 0 38.1 0 0 0 0 0 0 57.9 0.6 0 58.5Cars 40 0 171 0 211 67 2225 0 0 2292 0 0 0 0 0 0 3563 39 0 3602 6105
% Cars 93 0 100 0 98.6 95.7 95.7 0 0 95.7 0 0 0 0 0 0 97.8 97.5 0 97.8 97Trucks 3 0 0 0 3 3 101 0 0 104 0 0 0 0 0 0 80 1 0 81 188
% Trucks 7 0 0 0 1.4 4.3 4.3 0 0 4.3 0 0 0 0 0 0 2.2 2.5 0 2.2 3
All Traffic Data Service, Inc1336 Farmer RoadConyers, Ga 30012
404-374-1283

File Name : #5 OldMaybankHwy@MaybankHwyAMSite Code : Start Date : 5/20/2014Page No : 2
OLD MAYBANK HWY
MA
YB
AN
K H
WY
MA
YB
AN
K H
WY
OLD MAYBANK HWY
Rght
40 3
43 Thru
0 0 0
Left
171 0
171 Peds
0 0 0
InOut Total106 211 317
4 3 7 110 324 214
Rght
67
3
70
Thru
2225
101
2326
Left 0
0
0
Peds 0
0
0
Out
Tota
lIn
3734
2292
6026
80
104
184
3814
6210
2396
Left0 0 0
Thru0 0 0
Rght0 0 0
Peds0 0 0
Out TotalIn
0 0 0 0 0 0 0 0 0
Left39
1
40
Thru
3563
80
3643
Rght0
0
0
Peds0
0
0
Tota
lO
ut
In2265
3602
5867
104
81
185
2369
6052
3683
5/20/2014 07:00 AM5/20/2014 09:45 AM CarsTrucks
North
All Traffic Data Service, Inc1336 Farmer RoadConyers, Ga 30012
404-374-1283
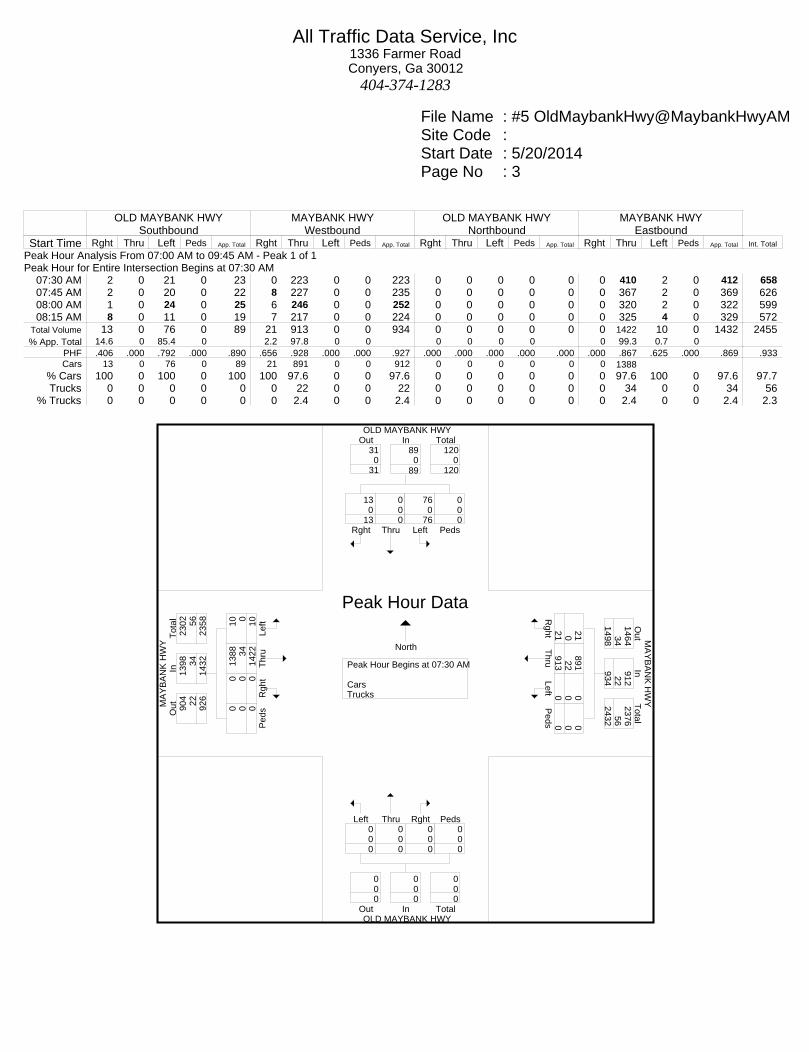
File Name : #5 OldMaybankHwy@MaybankHwyAMSite Code : Start Date : 5/20/2014Page No : 3
OLD MAYBANK HWYSouthbound
MAYBANK HWYWestbound
OLD MAYBANK HWYNorthbound
MAYBANK HWYEastbound
Start Time Rght Thru Left Peds App. Total Rght Thru Left Peds App. Total Rght Thru Left Peds App. Total Rght Thru Left Peds App. Total Int. Total
Peak Hour Analysis From 07:00 AM to 09:45 AM - Peak 1 of 1Peak Hour for Entire Intersection Begins at 07:30 AM
07:30 AM 2 0 21 0 23 0 223 0 0 223 0 0 0 0 0 0 410 2 0 412 65807:45 AM 2 0 20 0 22 8 227 0 0 235 0 0 0 0 0 0 367 2 0 369 62608:00 AM 1 0 24 0 25 6 246 0 0 252 0 0 0 0 0 0 320 2 0 322 59908:15 AM 8 0 11 0 19 7 217 0 0 224 0 0 0 0 0 0 325 4 0 329 572
Total Volume 13 0 76 0 89 21 913 0 0 934 0 0 0 0 0 0 1422 10 0 1432 2455% App. Total 14.6 0 85.4 0 2.2 97.8 0 0 0 0 0 0 0 99.3 0.7 0
PHF .406 .000 .792 .000 .890 .656 .928 .000 .000 .927 .000 .000 .000 .000 .000 .000 .867 .625 .000 .869 .933Cars 13 0 76 0 89 21 891 0 0 912 0 0 0 0 0 0 1388
% Cars 100 0 100 0 100 100 97.6 0 0 97.6 0 0 0 0 0 0 97.6 100 0 97.6 97.7Trucks 0 0 0 0 0 0 22 0 0 22 0 0 0 0 0 0 34 0 0 34 56
% Trucks 0 0 0 0 0 0 2.4 0 0 2.4 0 0 0 0 0 0 2.4 0 0 2.4 2.3
OLD MAYBANK HWY
MA
YB
AN
K H
WY
MA
YB
AN
K H
WY
OLD MAYBANK HWY
Rght
13 0
13 Thru
0 0 0
Left
76 0
76 Peds
0 0 0
InOut Total31 89 120 0 0 0
31 120 89
Rght
21
0
21
Thru
891
22
913
Left 0
0
0
Peds 0
0
0
Out
Tota
lIn
1464
912
2376
34
22
56
1498
2432
934
Left0 0 0
Thru0 0 0
Rght0 0 0
Peds0 0 0
Out TotalIn
0 0 0 0 0 0 0 0 0
Left10
0
10
Thru
1388
34
1422
Rght0
0
0
Peds0
0
0
Tota
lO
ut
In904
1398
2302
22
34
56
926
2358
1432
Peak Hour Begins at 07:30 AM CarsTrucks
Peak Hour Data
North
All Traffic Data Service, Inc1336 Farmer RoadConyers, Ga 30012
404-374-1283

File Name : #5 OldMaybankHwy@MaybankHwyPMSite Code : Start Date : 5/20/2014Page No : 1
Groups Printed- Cars - TrucksOLD MAYBANK HWY
SouthboundMAYBANK HWY
WestboundOLD MAYBANK HWY
NorthboundMAYBANK HWY
EastboundStart Time Rght Thru Left Peds App. Total Rght Thru Left Peds App. Total Rght Thru Left Peds App. Total Rght Thru Left Peds App. Total Int. Total
03:00 PM 2 0 11 0 13 7 214 0 0 221 0 0 0 0 0 0 207 3 0 210 44403:15 PM 4 0 6 0 10 8 324 0 0 332 0 0 0 0 0 0 194 4 0 198 54003:30 PM 6 0 11 0 17 13 252 0 0 265 0 0 0 0 0 0 258 2 0 260 54203:45 PM 3 0 4 1 8 19 346 0 0 365 0 0 0 0 0 0 254 7 0 261 634
Total 15 0 32 1 48 47 1136 0 0 1183 0 0 0 0 0 0 913 16 0 929 2160
04:00 PM 3 0 2 0 5 10 333 0 0 343 0 0 0 0 0 0 191 7 0 198 54604:15 PM 5 0 13 0 18 10 297 0 0 307 0 0 0 0 0 0 239 5 0 244 56904:30 PM 1 0 8 0 9 9 292 0 0 301 0 0 0 0 0 0 226 2 0 228 53804:45 PM 2 0 6 0 8 12 279 0 0 291 0 0 0 0 0 0 260 3 0 263 562
Total 11 0 29 0 40 41 1201 0 0 1242 0 0 0 0 0 0 916 17 0 933 2215
05:00 PM 7 0 12 0 19 21 318 0 0 339 0 0 0 0 0 0 285 4 0 289 64705:15 PM 4 0 10 0 14 14 369 0 0 383 0 0 0 0 0 0 188 4 0 192 58905:30 PM 3 0 13 0 16 10 342 0 0 352 0 0 0 0 0 0 273 4 0 277 64505:45 PM 1 0 7 0 8 15 343 0 0 358 0 0 0 0 0 0 232 2 0 234 600
Total 15 0 42 0 57 60 1372 0 0 1432 0 0 0 0 0 0 978 14 0 992 2481
Grand Total 41 0 103 1 145 148 3709 0 0 3857 0 0 0 0 0 0 2807 47 0 2854 6856Apprch % 28.3 0 71 0.7 3.8 96.2 0 0 0 0 0 0 0 98.4 1.6 0
Total % 0.6 0 1.5 0 2.1 2.2 54.1 0 0 56.3 0 0 0 0 0 0 40.9 0.7 0 41.6Cars 40 0 101 1 142 146 3630 0 0 3776 0 0 0 0 0 0 2746 45 0 2791 6709
% Cars 97.6 0 98.1 100 97.9 98.6 97.9 0 0 97.9 0 0 0 0 0 0 97.8 95.7 0 97.8 97.9Trucks 1 0 2 0 3 2 79 0 0 81 0 0 0 0 0 0 61 2 0 63 147
% Trucks 2.4 0 1.9 0 2.1 1.4 2.1 0 0 2.1 0 0 0 0 0 0 2.2 4.3 0 2.2 2.1
All Traffic Data Service, Inc1336 Farmer RoadConyers, Ga 30012
404-374-1283

File Name : #5 OldMaybankHwy@MaybankHwyPMSite Code : Start Date : 5/20/2014Page No : 2
OLD MAYBANK HWY
MA
YB
AN
K H
WY
MA
YB
AN
K H
WY
OLD MAYBANK HWY
Rght
40 1
41 Thru
0 0 0
Left
101 2
103 Peds
1 0 1
InOut Total191 142 333
4 3 7 195 340 145
Rght
146
2
148
Thru
3630
79
3709
Left 0
0
0
Peds 0
0
0
Out
Tota
lIn
2847
3776
6623
63
81
144
2910
6767
3857
Left0 0 0
Thru0 0 0
Rght0 0 0
Peds0 0 0
Out TotalIn
0 0 0 0 0 0 0 0 0
Left45
2
47
Thru
2746
61
2807
Rght0
0
0
Peds0
0
0
Tota
lO
ut
In3670
2791
6461
80
63
143
3750
6604
2854
5/20/2014 03:00 PM5/20/2014 05:45 PM CarsTrucks
North
All Traffic Data Service, Inc1336 Farmer RoadConyers, Ga 30012
404-374-1283

File Name : #5 OldMaybankHwy@MaybankHwyPMSite Code : Start Date : 5/20/2014Page No : 3
OLD MAYBANK HWYSouthbound
MAYBANK HWYWestbound
OLD MAYBANK HWYNorthbound
MAYBANK HWYEastbound
Start Time Rght Thru Left Peds App. Total Rght Thru Left Peds App. Total Rght Thru Left Peds App. Total Rght Thru Left Peds App. Total Int. Total
Peak Hour Analysis From 03:00 PM to 05:45 PM - Peak 1 of 1Peak Hour for Entire Intersection Begins at 05:00 PM
05:00 PM 7 0 12 0 19 21 318 0 0 339 0 0 0 0 0 0 285 4 0 289 64705:15 PM 4 0 10 0 14 14 369 0 0 383 0 0 0 0 0 0 188 4 0 192 58905:30 PM 3 0 13 0 16 10 342 0 0 352 0 0 0 0 0 0 273 4 0 277 64505:45 PM 1 0 7 0 8 15 343 0 0 358 0 0 0 0 0 0 232 2 0 234 600
Total Volume 15 0 42 0 57 60 1372 0 0 1432 0 0 0 0 0 0 978 14 0 992 2481% App. Total 26.3 0 73.7 0 4.2 95.8 0 0 0 0 0 0 0 98.6 1.4 0
PHF .536 .000 .808 .000 .750 .714 .930 .000 .000 .935 .000 .000 .000 .000 .000 .000 .858 .875 .000 .858 .959Cars 14 0 42 0 56 58 1357
% Cars 93.3 0 100 0 98.2 96.7 98.9 0 0 98.8 0 0 0 0 0 0 99.1 92.9 0 99.0 98.9Trucks 1 0 0 0 1 2 15 0 0 17 0 0 0 0 0 0 9 1 0 10 28
% Trucks 6.7 0 0 0 1.8 3.3 1.1 0 0 1.2 0 0 0 0 0 0 0.9 7.1 0 1.0 1.1
OLD MAYBANK HWY
MA
YB
AN
K H
WY
MA
YB
AN
K H
WY
OLD MAYBANK HWY
Rght
14 1
15 Thru
0 0 0
Left
42 0
42 Peds
0 0 0
InOut Total71 56 127 3 1 4
74 131 57
Rght
58
2
60
Thru
1357
15
1372
Left 0
0
0
Peds 0
0
0
Out
Tota
lIn
1011
1415
2426
9
17
26
1020
2452
1432
Left0 0 0
Thru0 0 0
Rght0 0 0
Peds0 0 0
Out TotalIn
0 0 0 0 0 0 0 0 0
Left13
1
14
Thru969
9
978
Rght0
0
0
Peds0
0
0
Tota
lO
ut
In1371
982
2353
16
10
26
1387
2379
992
Peak Hour Begins at 05:00 PM CarsTrucks
Peak Hour Data
North
All Traffic Data Service, Inc1336 Farmer RoadConyers, Ga 30012
404-374-1283

Page 1
Site Code: 6Station ID: 6
MAYBANK HWY WEST OFLatitude: 0' 0.0000 Undefined
Longitude: 0' 0.0000 Undefined
All Traffic Data Service, Inc1336 Farmer RoadConyers, Ga 30012
404-374-1283
Start 20-May-14 EB Hour Totals WB Hour Totals Combined TotalsTime Tue Morning Afternoon Morning Afternoon Morning Afternoon Morning Afternoon Morning Afternoon
12:00 18 204 31 16212:15 10 210 21 23912:30 10 195 14 16412:45 6 204 44 813 13 214 79 779 123 159201:00 9 197 6 18401:15 8 195 9 21801:30 4 174 9 20601:45 6 200 27 766 18 252 42 860 69 162602:00 8 224 8 21302:15 7 196 11 22802:30 4 254 5 22802:45 4 202 23 876 6 230 30 899 53 177503:00 5 216 4 21503:15 3 191 6 31403:30 5 258 4 29403:45 6 260 19 925 5 344 19 1167 38 209204:00 3 188 1 32104:15 8 234 8 34604:30 20 216 8 33604:45 19 256 50 894 6 314 23 1317 73 221105:00 26 268 5 30105:15 50 188 21 35605:30 64 270 15 34205:45 60 218 200 944 32 358 73 1357 273 230106:00 116 192 49 32406:15 174 174 84 32806:30 238 152 114 22806:45 306 162 834 680 133 207 380 1087 1214 176707:00 364 138 154 20807:15 378 120 172 20807:30 384 95 224 16007:45 366 102 1492 455 245 147 795 723 2287 117808:00 317 90 229 17008:15 334 90 236 15808:30 324 88 216 13208:45 282 74 1257 342 224 142 905 602 2162 94409:00 236 50 165 13409:15 234 62 190 10609:30 240 52 188 9809:45 212 48 922 212 198 88 741 426 1663 63810:00 182 38 174 6910:15 241 30 165 7710:30 194 28 172 5810:45 225 32 842 128 184 41 695 245 1537 37311:00 197 33 184 3711:15 200 32 203 4711:30 227 32 178 3911:45 221 18 845 115 194 38 759 161 1604 276Total 6555 7150 4541 9623 11096 16773
Percent 47.8% 52.2% 32.1% 67.9% 39.8% 60.2%GrandTotal
6555 7150 4541 9623 11096 16773
Percent 47.8% 52.2% 32.1% 67.9% 39.8% 60.2%
ADT ADT 27,604 AADT 27,604

Page 1
Site Code: 7Station ID: 7
MAYBANK HWY EAST OFLatitude: 0' 0.0000 Undefined
Longitude: 0' 0.0000 Undefined
All Traffic Data Service, Inc1336 Farmer RoadConyers, Ga 30012
404-374-1283
Start 20-May-14 EB Hour Totals WB Hour Totals Combined TotalsTime Tue Morning Afternoon Morning Afternoon Morning Afternoon Morning Afternoon Morning Afternoon
12:00 18 204 32 16812:15 9 210 18 24412:30 12 206 13 18012:45 6 190 45 810 13 222 76 814 121 162401:00 7 200 5 20001:15 7 196 10 21601:30 6 188 13 21501:45 5 213 25 797 15 256 43 887 68 168402:00 8 214 9 22402:15 5 194 6 24002:30 4 261 5 21802:45 4 201 21 870 7 226 27 908 48 177803:00 4 210 4 24203:15 4 210 4 33203:30 5 257 5 25203:45 4 238 17 915 7 370 20 1196 37 211104:00 5 189 0 34604:15 7 232 8 31304:30 18 226 9 29404:45 22 262 52 909 8 288 25 1241 77 215005:00 25 266 10 33005:15 50 216 20 36805:30 64 251 14 37105:45 68 223 207 956 37 360 81 1429 288 238506:00 110 164 54 32606:15 169 190 90 25106:30 236 165 106 22606:45 292 158 807 677 133 202 383 1005 1190 168207:00 372 144 160 19907:15 392 119 177 20807:30 410 104 212 16407:45 383 102 1557 469 248 162 797 733 2354 120208:00 330 78 250 15108:15 320 97 224 16708:30 328 91 222 14408:45 292 72 1270 338 212 154 908 616 2178 95409:00 224 44 172 12209:15 232 64 182 12009:30 240 50 190 9609:45 215 51 911 209 208 90 752 428 1663 63710:00 198 42 171 5610:15 224 36 168 7410:30 202 32 173 5610:45 220 35 844 145 184 38 696 224 1540 36911:00 204 28 194 3811:15 213 34 192 5111:30 224 32 194 3911:45 222 20 863 114 187 35 767 163 1630 277Total 6619 7209 4575 9644 11194 16853
Percent 47.9% 52.1% 32.2% 67.8% 39.9% 60.1%GrandTotal
6619 7209 4575 9644 11194 16853
Percent 47.9% 52.1% 32.2% 67.8% 39.9% 60.1%
ADT ADT 27,781 AADT 27,781

Page 1
Site Code: 8Station ID: 8
OLD MAYBANK HWY NORTH OFLatitude: 0' 0.0000 Undefined
Longitude: 0' 0.0000 Undefined
All Traffic Data Service, Inc1336 Farmer RoadConyers, Ga 30012
404-374-1283
Start 20-May-14 NB Hour Totals SB Hour Totals Combined TotalsTime Tue Morning Afternoon Morning Afternoon Morning Afternoon Morning Afternoon Morning Afternoon
12:00 0 11 0 1212:15 0 19 1 1012:30 1 14 0 1012:45 0 10 1 54 0 10 1 42 2 9601:00 0 26 0 1601:15 0 19 0 1201:30 0 6 0 701:45 0 19 0 70 0 15 0 50 0 12002:00 1 20 0 1802:15 0 17 1 1402:30 2 13 1 1802:45 0 20 3 70 1 18 3 68 6 13803:00 0 12 0 1203:15 0 15 0 1203:30 1 14 0 1803:45 0 30 1 71 1 9 1 51 2 12204:00 0 14 0 604:15 0 17 0 1704:30 0 10 2 1104:45 0 14 0 55 3 10 5 44 5 9905:00 0 30 1 1805:15 1 14 4 1105:30 2 16 4 1805:45 1 22 4 82 3 7 12 54 16 13606:00 2 24 4 706:15 4 11 4 1206:30 1 22 8 1306:45 6 13 13 70 14 11 30 43 43 11307:00 7 18 18 1007:15 4 16 23 1507:30 3 12 22 1107:45 12 14 26 60 24 4 87 40 113 10008:00 9 8 28 308:15 10 10 17 408:30 8 11 18 408:45 9 12 36 41 18 5 81 16 117 5709:00 20 4 12 209:15 10 8 7 009:30 14 8 20 409:45 10 6 54 26 12 2 51 8 105 3410:00 8 0 16 210:15 10 1 18 110:30 7 1 17 110:45 12 1 37 3 11 0 62 4 99 711:00 8 1 14 011:15 18 1 17 011:30 20 0 21 011:45 8 0 54 2 18 0 70 0 124 2Total 229 604 403 420 632 1024
Percent 27.5% 72.5% 49.0% 51.0% 38.2% 61.8%GrandTotal
229 604 403 420 632 1024
Percent 27.5% 72.5% 49.0% 51.0% 38.2% 61.8%
ADT ADT 1,670 AADT 1,670

Page 1
Site Code: 9Station ID: 9
CANE SLASH ROAD WEST OFLatitude: 0' 0.0000 Undefined
Longitude: 0' 0.0000 Undefined
All Traffic Data Service, Inc1336 Farmer RoadConyers, Ga 30012
404-374-1283
Start 20-May-14 EB Hour Totals WB Hour Totals Combined TotalsTime Tue Morning Afternoon Morning Afternoon Morning Afternoon Morning Afternoon Morning Afternoon
12:00 1 2 0 412:15 1 8 0 1112:30 1 6 0 212:45 0 8 3 24 1 13 1 30 4 5401:00 0 8 2 601:15 1 4 3 1201:30 0 4 0 401:45 0 4 1 20 2 12 7 34 8 5402:00 1 8 0 602:15 0 8 0 602:30 0 9 0 602:45 0 6 1 31 0 8 0 26 1 5703:00 1 8 0 703:15 0 6 0 603:30 0 11 0 803:45 0 6 1 31 0 7 0 28 1 5904:00 0 2 0 404:15 1 4 0 404:30 0 7 0 304:45 0 1 1 14 0 13 0 24 1 3805:00 2 4 1 1105:15 0 2 0 2005:30 2 3 1 2205:45 2 4 6 13 0 15 2 68 8 8106:00 1 4 0 606:15 8 5 1 1006:30 9 9 4 1006:45 8 13 26 31 5 12 10 38 36 6907:00 10 7 1 1207:15 16 10 4 907:30 20 5 6 507:45 13 9 59 31 4 7 15 33 74 6408:00 16 4 1 608:15 6 4 8 608:30 4 7 3 908:45 2 8 28 23 4 6 16 27 44 5009:00 8 4 8 609:15 9 1 0 209:30 11 3 8 209:45 6 1 34 9 5 2 21 12 55 2110:00 10 0 8 410:15 10 4 6 210:30 4 1 8 510:45 4 2 28 7 10 2 32 13 60 2011:00 2 2 5 311:15 8 2 2 211:30 8 1 2 311:45 8 0 26 5 10 0 19 8 45 13Total 214 239 123 341 337 580
Percent 47.2% 52.8% 26.5% 73.5% 36.8% 63.2%GrandTotal
214 239 123 341 337 580
Percent 47.2% 52.8% 26.5% 73.5% 36.8% 63.2%
ADT ADT 452 AADT 452
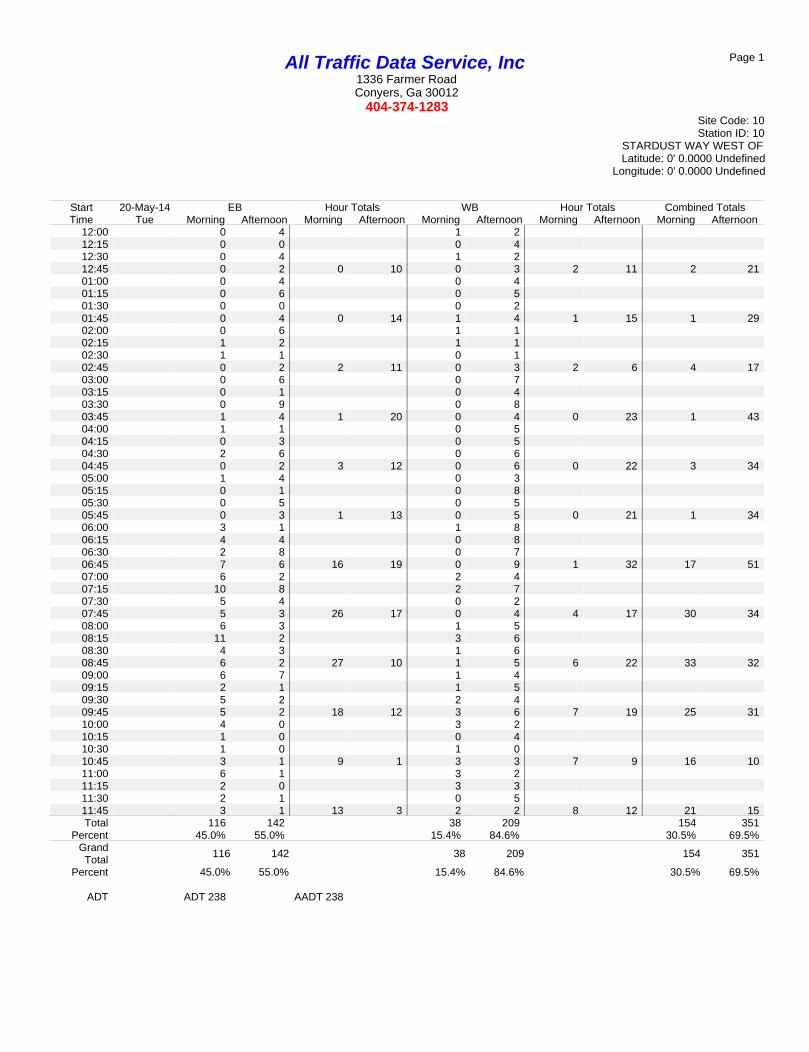
Page 1
Site Code: 10Station ID: 10
STARDUST WAY WEST OFLatitude: 0' 0.0000 Undefined
Longitude: 0' 0.0000 Undefined
All Traffic Data Service, Inc1336 Farmer RoadConyers, Ga 30012
404-374-1283
Start 20-May-14 EB Hour Totals WB Hour Totals Combined TotalsTime Tue Morning Afternoon Morning Afternoon Morning Afternoon Morning Afternoon Morning Afternoon
12:00 0 4 1 212:15 0 0 0 412:30 0 4 1 212:45 0 2 0 10 0 3 2 11 2 2101:00 0 4 0 401:15 0 6 0 501:30 0 0 0 201:45 0 4 0 14 1 4 1 15 1 2902:00 0 6 1 102:15 1 2 1 102:30 1 1 0 102:45 0 2 2 11 0 3 2 6 4 1703:00 0 6 0 703:15 0 1 0 403:30 0 9 0 803:45 1 4 1 20 0 4 0 23 1 4304:00 1 1 0 504:15 0 3 0 504:30 2 6 0 604:45 0 2 3 12 0 6 0 22 3 3405:00 1 4 0 305:15 0 1 0 805:30 0 5 0 505:45 0 3 1 13 0 5 0 21 1 3406:00 3 1 1 806:15 4 4 0 806:30 2 8 0 706:45 7 6 16 19 0 9 1 32 17 5107:00 6 2 2 407:15 10 8 2 707:30 5 4 0 207:45 5 3 26 17 0 4 4 17 30 3408:00 6 3 1 508:15 11 2 3 608:30 4 3 1 608:45 6 2 27 10 1 5 6 22 33 3209:00 6 7 1 409:15 2 1 1 509:30 5 2 2 409:45 5 2 18 12 3 6 7 19 25 3110:00 4 0 3 210:15 1 0 0 410:30 1 0 1 010:45 3 1 9 1 3 3 7 9 16 1011:00 6 1 3 211:15 2 0 3 311:30 2 1 0 511:45 3 1 13 3 2 2 8 12 21 15Total 116 142 38 209 154 351
Percent 45.0% 55.0% 15.4% 84.6% 30.5% 69.5%GrandTotal
116 142 38 209 154 351
Percent 45.0% 55.0% 15.4% 84.6% 30.5% 69.5%
ADT ADT 238 AADT 238

Appendix B: Signal Timing Data


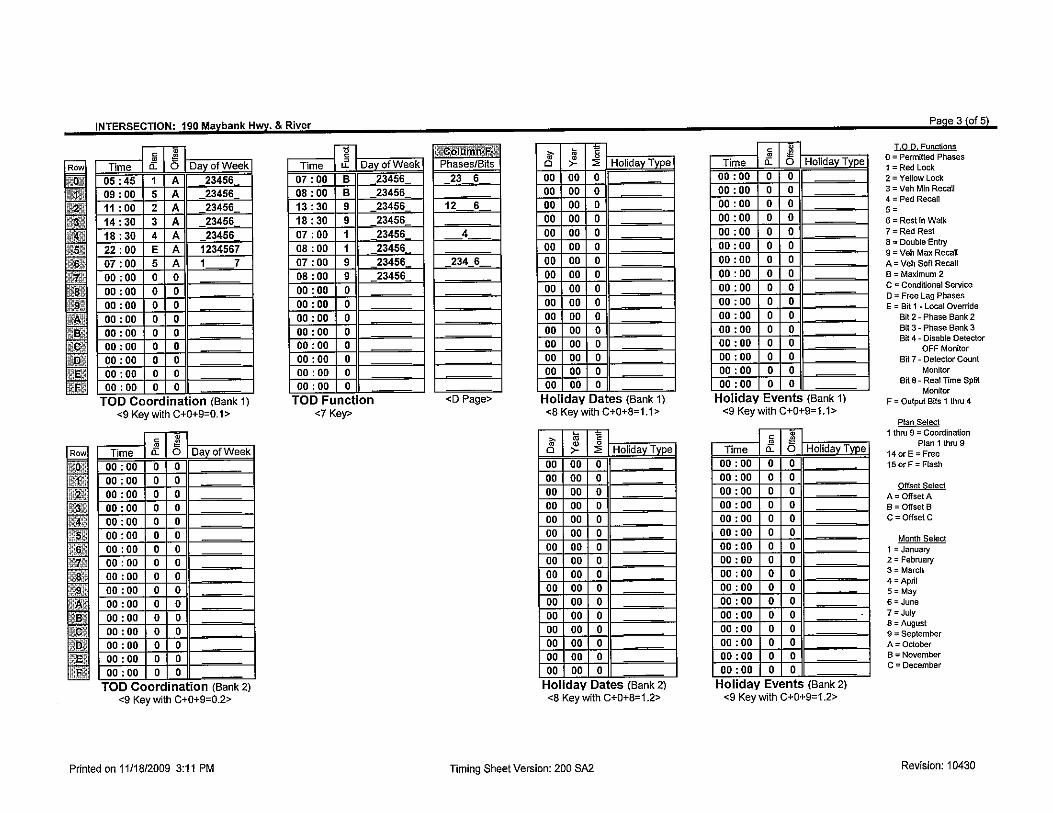
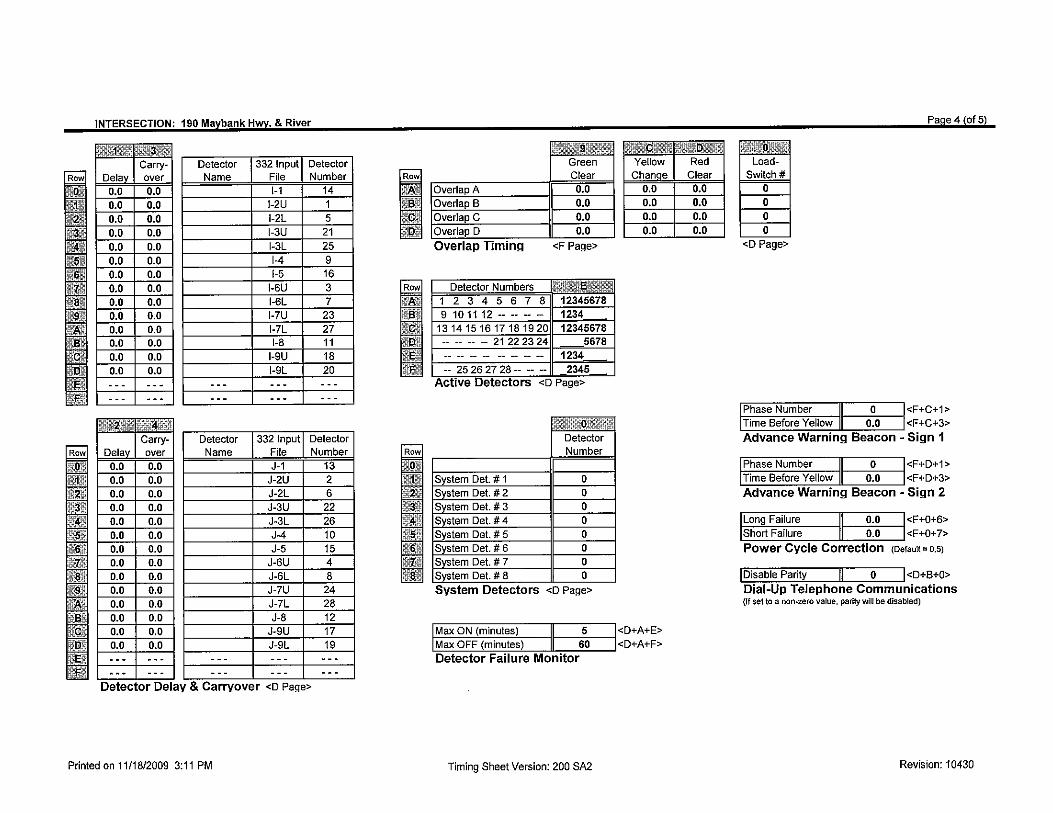
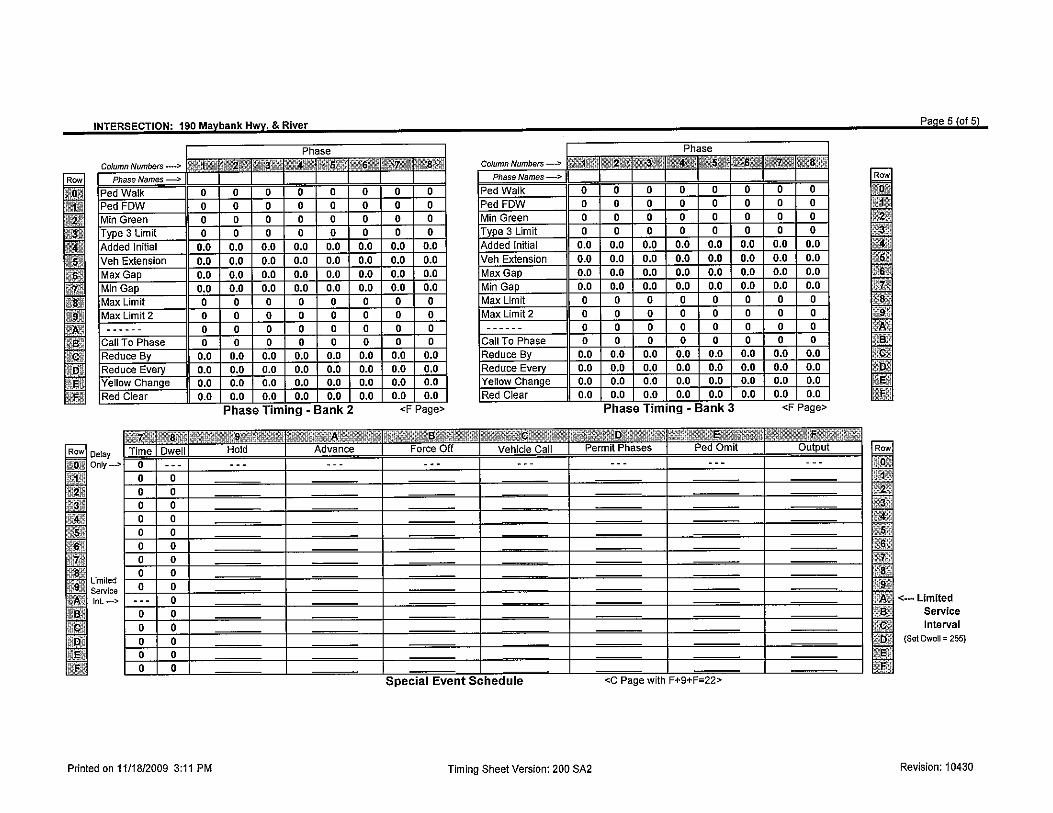

Appendix C: Travel Demand Model Description

Maybank Highway Traffic Analysis Report
29
FUTURE CONDITION
TravelDemandForecasting%ØÃÅÒÐÔ The current version of the Berkeley-Charleston-Dorchester Council of Governments (BCDCOG) regional travel demand model was used to provide estimates of future traffic volumes for the 2035 No-Build, and two 2035 Build Options: Concept A (widening Maybank Highway) and Concept B (the Town & Country/Pitchfork). The model was obtained from the BCDCOG, reviewed, modified to represent the proposed improvement alternatives, and run to obtain the traffic projections. The resulting traffic projections were used following the Guidelines for Using BCDCOG Model Data and Output to aid in estimating the projected rate of growth in traffic in the corridor through 2035 and to assist in the estimation and distribution of turning movement volumes in the 2035 No-Build, Concept A and Concept B operational analyses.
ReviewofRegionalModel
After the model was obtained from the BCDCOG, the model was reviewed to determine what modifications would be necessary to model the various alternatives. The model review focused on the following assignment alternatives:
2010 assignment; 2035 no-build assignment without the I-526 extension; 2035 no-build assignment with the I-526 extension; 2035 build Concept A (widening) without the I-526 extension; 2035 build Concept A (widening) with the I-526 extension; 2035 build Concept B (Pitchfork) without the I-526 extension; 2035 build Concept B (Pitchfork) with the I-526 extension;
The review consisted of examining the base network data for the 2010 and 2035 “Existing and Committed” (EC) networks as they are currently coded in the model. The review specifically examined if pertinent links were included in the network for the specific run, and if the link data coded for number of lanes, travel speed, parking, lane width and median type accurately represented the roadways in each of the proposed alternatives. The reviews generally were performed by first creating a selection set, selected by condition, to determine if the network links were coded as part of either the 2010 network (link data field BCD_Model coded “Yes”) or the 2035 EC network (link data field 2035_EC_Network coded “Yes”). The coded link data were then reviewed using the “Info” tool on links and/or displaying labels for link data within the BCDCOG_Network layer.
The following was observed in the model review for links within the study area:
The I-526 extension is coded in the model, but is not included in either the 2010 and 2035 EC networks. It is available for inclusion in alternative network assignments where

Maybank Highway Traffic Analysis Report
30
desired. Link data for the extension is coded in the 2035 Transportation Plan (TP) and “Vision” networks as a two-lane pair of one-way links with a 55 mph posted speed, a divided median, and 12 feet wide travel lanes.
Connections are provided between the I-526 extension and River Road to the north and south of Maybank Highway. In the network, these connections are located at a total link distance of 0.77 miles to the north of Maybank Highway and 0.60 miles to the south of Maybank Highway. These connections provide a single lane in each direction with a 45 mph posted speed.
The Pitchfork Roadways are coded in the model, but are not included in the 2010 network. The Pitchfork Roadways are included in the 2035 EC network. The Pitchfork Roadways are coded as two lane roads, with a 35 mph posted speed, a landscaped median, 12 feet wide lanes, and no parking provided along the links. This link data was not changed to reflect current design details as their impact on the assignments of the regional travel demand model were judged likely to be insignificant.
The Pitchfork Roadways are coded as starting at the same node on Maybank Highway. This is contrary to the current design concept for the Pitchfork Roadways, which has the South Pitchfork Road intersecting Maybank Highway to the east of the North Pitchfork Road. The location of the Pitchfork Roadways connection to Maybank Highway was not changed to reflect the current design details as its impact on the assignments of the regional travel demand model were judged likely to be insignificant.
When the Pitchfork Roadways are included in a network, additional centroid connectors to Traffic Analysis Zones (TAZ) 1005 and 1006 are also included. For TAZ 1005, a second connector from the TAZ is added to the South Pitchfork Roadway. For TAZ 1006, a third centroid connector from the TAZ is added to the North Pitchfork Roadway.
Maybank Highway is coded in both the 2010 and 2035 networks.
In the 2010 Network, Maybank Highway is coded as a two lane road with a 45 mph posted speed, no median, no parking and 10 feet wide lanes.
In the 2035 EC network, Maybank Highway is coded generally as a four lane road with a 45 mph posted speed, 12 feet wide travel lanes, a landscaped median, and no parking provided. The exception to the coding along Maybank Highway is for the link located between the Pitchfork Road and River Road nodes. This link is coded as a two lane roadway with a 35 mph posted speed (all other link data are the same as the remainder of the Maybank Highway links). This coding is consistent with the proposed cross-section of Maybank Highway within Concept B when the Pitchfork Roadways are implemented.

Maybank Highway Traffic Analysis Report
31
ModelModificationsbyAlternative
To produce the traffic assignments for the various alternatives, some adjustments were made to the 2035 EC network to obtain a reasonable representation of the conditions being modeled for this study. For the most part, these changes consisted of toggling the setting for the link data field 2035_EC_Network to “Yes” when elements such as the Pitchfork Roads or the I-526 Extension were included in an alternative. In a few cases, changes were made to the link data to more accurately reflect the currently proposed features in Concept A and Concept B. These will be described where appropriate in the following list of adjustments made to the model network structure.
2010 Assignment
No changes were made to the 2010 network for the 2010 assignment.
2035 No-Build Assignment (without the I-526 Extension)
The following changes were made to the 2035 EC network for this assignment alternative representing the No-Build condition:
The links for the Pitchfork Roads were not included in the network The centroid connectors linking TAZ 1005 and 1006 to the Pitchfork Roads were not
included in the network Link data for Maybank Highway links within the study area were modified to match the
settings used in the 2010 network. These changes included adjusting the number of lanes, the lane width and changing the median settings from “Landscaped” to “None”
2035 No-Build Assignment (with the I-526 Extension)
The changes described for the 2035 No-Build Assignment (without the I-526 Extension) were incorporated into this model alternative, with the additional modification of including the links associated with the I-526 extension.
2035 Concept A Assignment (without the I-526 Extension)
The following changes were made to the 2035 EC network for this assignment alternative representing the widening of Maybank Highway:
The links for the Pitchfork Roads were not included in the network
The centroid connectors linking TAZ 1005 and 1006 to the Pitchfork Roads were not included in the network
The Maybank Highway link immediately east of River Road was modified to be consistent with the other Maybank Highway links within the study area.

Maybank Highway Traffic Analysis Report
32
2035 Concept A Assignment (with the I-526 Extension)
The changes described for the 2035 Concept A Assignment (without the I-526 Extension) were incorporated into this model alternative, with the additional modification of including the links associated with the I-526 extension.
2035 Concept B Assignment (without the I-526 Extension)
The following changes were made to the 2035 EC network for this assignment alternative representing the construction of the Pitchfork Roads and the implementation of the Town and County roadway concepts:
The links for the Pitchfork Roads and the centroid connectors linking TAZ 1005 and 1006 to the Pitchfork Roads were included in the network. However, the network connections of the Pitchfork Roadways to Maybank Highway were not modified to replicate the offset between the North Pitchfork Road and South Pitchfork Road that is currently incorporated into the design concept. It is likely that modeling this offset would have a minimal effect on the resulting traffic assignments.
The Maybank Highway links between River Road and Main Road/Bohicket Road were modified to provide a single, 11 feet wide lane in each direction. The posted speeds were reduced from 45 mph to 35 mph and the landscaped median was retained.
2035 Concept B Assignment (with the I-526 Extension)
The changes described for the 2035 Concept B Assignment (without the I-526 Extension) were incorporated into this model alternative, with the additional modification of including the links associated with the I-526 extension.
TravelDemandModelResults
After completing the modifications to the network files, traffic assignments were produced following the CHATS Travel Demand Forecasting Model User’s Guide. The resulting traffic link and turning movement assignments, included in Appendix C, were reviewed. The following general comments reflect observations made during the assignment review:
Comparison of No-Build and Concept A assignments (without the I-526 extension)
The assignments for the 2035 No-Build and Concept A assignments (without the I-526 extension) were compared to determine the effect of widening Maybank Highway. In general, widening Maybank Highway will result in a slight diversion of traffic, increasing the amount of vehicular traffic through the corridor. Approaching River Road from the east, the traffic assignments show Maybank Highway traffic will increase from about 25,000 vehicles per day (vpd) in the No-Build alternative to about 30,000 vehicles per day in Concept A. Most of this increased volume will continue west on Maybank Highway to be distributed to destinations along Maybank Highway and, to a lesser extent, Bohicket Road.

Maybank Highway Traffic Analysis Report
33
The BCDCOG model estimates of the link levels of service (LOS) shows substantial improvement along Maybank Highway in Concept A compared to the No-Build Condition. In the No-Build assignment, the Maybank Highway links are projected to operate at LOS C near the Main Road/Bohicket Road intersection, with worsening LOS to the east towards River Road, where the LOS to the west and east of River Road are projected to be LOS E and LOS F respectively.
With Concept A, the assignments show the estimated LOS along Maybank Highway west of River Road will generally be LOS B, while those to the east will generally be LOS C or LOS D.
Based on these assignment results, shows vehicular traffic will be improved in Concept A compared to the No-Build alternative.
Comparison of No-Build and Concept B assignments (without the I-526 extension)
The assignments for the 2035 No-Build and Concept B assignments (without the I-526 extension) were compared to determine the effect of incorporating the Town and Country concepts with the Pitchfork Road. In general, the traffic assignments indicate the Pitchfork roadways will attract slightly more traffic into the study area compared to the No—Build alternative. Approaching River Road from the east, the traffic assignments show Maybank Highway traffic will increase from about 25,000 vehicles per day (vpd) in the No-Build alternative to about 27,300 vehicles per day in Concept B. The Pitchfork Roadways will carry a combined volume of about 12,000 vpd, with about 4,000 vpd on the North Pitchfork Road and about 8,000 vpd on the South Pitchfork Road. Traffic on Maybank Highway west of River Road will decrease from almost 25,000 vpd in the No-Build condition to about 15,000 vpd in Concept B.
The South Pitchfork Road will divert traffic from Maybank Highway towards River Road. Traffic along River Road immediately south of the location of the South Pitchfork Road intersection is projected to increase slightly from about 8,000 vpd to about 11,000 vpd because of the Pitchfork Road. Between the South Pitchfork Road and Maybank Highway, the traffic assignments will drop from about 8000 vpd in the No-Build alternative to about 4000 vpd in Concept B.
The assignments also show the diversion of traffic along the Pitchfork Roads, especially the South Pitchfork Road, will divert traffic from Maybank Highway west of River Road to travel to the south along River Road. The assignments show traffic along Maybank Highway between River Road and Main Road/Bohicket Road declining by 3,000 to 4,000 vpd because of this diversion. This diversion will allow for an improvement in LOS along the Town & Country portions of Maybank Highway, improving from LOS E immediately west of River Road in the No-Build assignment to LOS C in Concept B.
The assignments show that the Pitchfork Concept should adequately divert turning traffic away from the intersection of Maybank Highway and River Road.
Comparison of Concept A and Concept B assignments (without the I-526 extension)
The assignments for the 2035 Concept A and Concept B assignments (without the I-526 extension) were compared to determine the differences between the two alternatives. In

Maybank Highway Traffic Analysis Report
34
general, the traffic assignments indicate that the additional capacity provided by widening Maybank Highway will tend to attract more traffic to the corridor than would be encountered in the Pitchfork roadway concept. While this increase is only about 3,000 vpd east of River Road (about 30,000 vpd in Concept A and 27,000 vpd in Concept B), the difference is more evident between River Road and Main Road/Bohicket Road. In Concept A, traffic along this portion of Maybank Highway will range from about 13,000 vpd in the west to about 21,000 vpd in the east end of the corridor. In Concept B, traffic will range from about 6,000 vpd in the west to about 13,000 vpd in the east end of the corridor.
Traffic assignments on River Road north of Maybank Highway will remain about the same in both concepts. Traffic on River Road south of Maybank Highway will increase from about 8,500 vpd in Concept A to about 11,000 vpd in Concept B.
The projected LOS in each assignment are approximately the same, with Maybank Highway between River Road and Main Road/Bohicket Road projected to generally operate at LOS B in Concept A and LOS B and LOS C in Concept B.
The assignments essentially show that the two improvement concepts result in a tradeoff. Concept A can be viewed as providing slightly better operations that Concept B despite higher volumes because of the increased capacity provided by the widening. Concept B can be viewed as operating almost as well as Concept A, but carries less traffic on the proposed Town & Country sections through the Maybank Highway corridor. The assignments also show the Pitchfork Roads in Concept B should accomplish a reduction in turning volumes at the intersection of Maybank Highway and River Road.
Comparison of Assignments with and without the I-526 extension
Though the extension of I-526 is uncertain, the assignments show that it has the most substantial impact on how traffic will travel around and through the study area.
The assignments that included the I-526 extension had a major redistributive effect on traffic in the Johns Island region. Without the I-526 extension, 48,700 vpd are projected to enter and leave Johns Island via Main Road (21,400 vpd) and Maybank Highway (27,300 vpd) in the 2035 No-Build assignment.
With the I-526 extension included in the 2035 No-Build network, the volume of traffic entering and leaving Johns Island from these roads is reduced to a total of 19,300 vpd, with 10,900 vpd entering via Main Road and 8,400 vpd entering via Maybank Highway. The two connections from River Road to the I-526 extension are projected to carry a total of 41,600 vpd in the 2035 No-Build assignment, with two-way traffic on the northern connector totaling 21,500 vpd and the southern connector carrying 20,100 vpd.
In addition to the diversion of traffic from Main Road and Maybank Highway to the I-526 extension, the model assignments show additional changes in traffic patterns because of the connections between the extension and River Road. The assignments show that the northern connector will increase traffic on River Road between Maybank Highway and Murraywood Road from between 3,000 to 4,000 vpd without the extension to between 10,000 and 14,000 vpd with

Maybank Highway Traffic Analysis Report
35
the extension. Traffic on Murraywood Road itself is projected to increase from about 1,000 vpd to more than 8,000 vpd with the extension.
The assignments also show traffic on River Road between Maybank Highway and the southern connector to the extension will be reduced slightly (from about 8,000 vpd without the extension to about 6,000 vpd with the extension), but traffic on River Road south of the connector will increase substantially (from about 8,000 vpd to about 16,000 vpd).
Because of the redistributive effect the extension will have on traffic, the Traffic on Maybank Highway east of River Road will be substantially reduced by the extension of I-526, but traffic on Maybank Highway west of River Road is projected to increase because of the reorientation of traffic towards the northern connector.
Comparison of Concept A and Concept B assignments (with the I-526 extension)
The results observed in the No-Build assignments with and without the I-526 extension are comparable to the assignments for Concept A with and without the I-526 extension and Concept B with and without the I-526 extension. It appears that neither Concept A nor Concept B is significantly affected by the extension of I-526.
TravelDemandModelConclusions
Based on the review of the traffic modeling results, it was determined the assignments obtained for each of the alternatives are acceptable for use in estimating and distributing turning movement volumes for each of the 2035 alternatives.

2010 Traffic Assignments (ADT)

2010 Traffic Assignments (ADT)Pitchfork Area

2035 Traffic Assignments (ADT)
No‐Build Without I‐526

2035 Traffic Assignments (ADT)No‐Build Without I‐526
Pitchfork Area

2035 Traffic Assignments (ADT)
No‐Build With I‐526

2035 Traffic Assignments (ADT)No‐Build With I‐526
Pitchfork Area

2035 Traffic Assignments (ADT)Pitchfork Roadways
Without I‐526
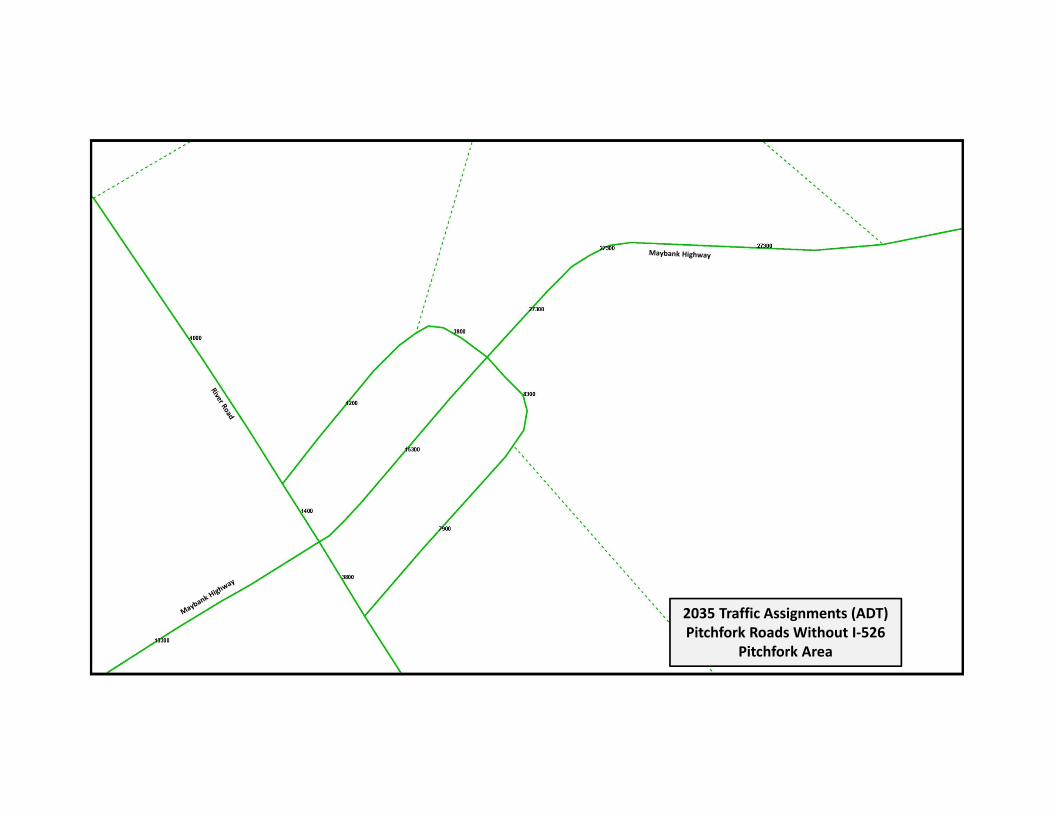
2035 Traffic Assignments (ADT)Pitchfork Roads Without I‐526
Pitchfork Area

2035 Traffic Assignments (ADT)Pitchfork Roadways
With I‐526

2035 Traffic Assignments (ADT)Pitchfork Roads With I‐526
Pitchfork Area

2035 Traffic Assignments (ADT)Maybank Widening
Without I‐526

2035 Traffic Assignments (ADT)Maybank Widening Without I‐526
Pitchfork Area

2035 Traffic Assignments (ADT)Maybank Widening
With I‐526

2035 Traffic Assignments (ADT)Maybank Widening With I‐526
Pitchfork Area

Appendix D: Synchro Results – Existing Condition

HCM Signalized Intersection Capacity Analysis Exist AM Peak1: Maybank Hwy & Old Maybank Hwy 1/22/2015
Existing AM.syn Synchro 8 ReportPage 1
Movement EBL EBT WBT WBR SBL SBRLane ConfigurationsVolume (vph) 10 1422 913 21 76 13Ideal Flow (vphpl) 1900 1900 1900 1900 1900 1900Total Lost time (s) 6.3 6.3 6.3 6.3 6.0 6.0Lane Util. Factor 1.00 0.95 0.95 1.00 1.00 1.00Frt 1.00 1.00 1.00 0.85 1.00 0.85Flt Protected 0.95 1.00 1.00 1.00 0.95 1.00Satd. Flow (prot) 1770 3539 3539 1583 1770 1583Flt Permitted 0.27 1.00 1.00 1.00 0.95 1.00Satd. Flow (perm) 506 3539 3539 1583 1770 1583Peak-hour factor, PHF 0.90 0.90 0.90 0.90 0.90 0.90Adj. Flow (vph) 11 1580 1014 23 84 14RTOR Reduction (vph) 0 0 0 6 0 13Lane Group Flow (vph) 11 1580 1014 17 84 1Turn Type Perm NA NA Perm Prot PermProtected Phases 2 6 4Permitted Phases 2 6 4Actuated Green, G (s) 59.7 59.7 59.7 59.7 8.1 8.1Effective Green, g (s) 59.7 59.7 59.7 59.7 8.1 8.1Actuated g/C Ratio 0.75 0.75 0.75 0.75 0.10 0.10Clearance Time (s) 6.3 6.3 6.3 6.3 6.0 6.0Vehicle Extension (s) 4.0 4.0 4.0 4.0 4.0 4.0Lane Grp Cap (vph) 377 2637 2637 1179 178 160v/s Ratio Prot c0.45 0.29 c0.05v/s Ratio Perm 0.02 0.01 0.00v/c Ratio 0.03 0.60 0.38 0.01 0.47 0.01Uniform Delay, d1 2.7 4.7 3.6 2.6 34.0 32.4Progression Factor 1.00 1.00 1.00 1.00 1.00 1.00Incremental Delay, d2 0.1 1.0 0.4 0.0 2.7 0.0Delay (s) 2.8 5.7 4.1 2.6 36.7 32.4Level of Service A A A A D CApproach Delay (s) 5.7 4.0 36.1Approach LOS A A D
Intersection SummaryHCM 2000 Control Delay 6.2 HCM 2000 Level of Service AHCM 2000 Volume to Capacity ratio 0.58Actuated Cycle Length (s) 80.1 Sum of lost time (s) 12.3Intersection Capacity Utilization 56.2% ICU Level of Service BAnalysis Period (min) 15c Critical Lane Group

HCM Signalized Intersection Capacity Analysis Exist AM Peak5: Maybank Hwy & River Rd 1/22/2015
Existing AM.syn Synchro 8 ReportPage 2
Movement NBL NBT NBR SBL SBT SBR NEL NET NER SWL SWT SWRLane ConfigurationsVolume (vph) 42 70 350 365 70 38 40 698 12 197 593 160Ideal Flow (vphpl) 1900 1900 1900 1900 1900 1900 1900 1900 1900 1900 1900 1900Total Lost time (s) 7.0 7.0 5.5 6.0 7.0 6.5 6.5 5.5 6.5 6.0Lane Util. Factor 1.00 1.00 1.00 1.00 1.00 1.00 1.00 1.00 1.00 1.00Frt 1.00 1.00 0.85 1.00 0.95 1.00 1.00 1.00 1.00 0.85Flt Protected 0.95 1.00 1.00 0.95 1.00 0.95 1.00 0.95 1.00 1.00Satd. Flow (prot) 1719 1810 1538 1719 1714 1736 1822 1687 1776 1509Flt Permitted 0.80 1.00 1.00 0.36 1.00 0.43 1.00 0.08 1.00 1.00Satd. Flow (perm) 1448 1810 1538 658 1714 777 1822 134 1776 1509Peak-hour factor, PHF 0.88 0.88 0.88 0.92 0.92 0.92 0.95 0.95 0.95 0.94 0.94 0.94Adj. Flow (vph) 48 80 398 397 76 41 42 735 13 210 631 170RTOR Reduction (vph) 0 0 88 0 17 0 0 1 0 0 0 21Lane Group Flow (vph) 48 80 310 397 100 0 42 747 0 210 631 149Heavy Vehicles (%) 5% 5% 5% 5% 5% 5% 4% 4% 4% 7% 7% 7%Turn Type Perm NA pm+ov pm+pt NA Perm NA pm+pt NA pm+ovProtected Phases 4 1 3 8 2 1 6 3Permitted Phases 4 4 8 2 6 6Actuated Green, G (s) 5.0 5.0 19.6 31.7 31.7 47.7 47.7 67.8 67.8 88.5Effective Green, g (s) 5.0 5.0 19.6 31.7 31.7 47.7 47.7 67.8 67.8 88.5Actuated g/C Ratio 0.04 0.04 0.17 0.28 0.28 0.42 0.42 0.60 0.60 0.78Clearance Time (s) 7.0 7.0 5.5 6.0 7.0 6.5 6.5 5.5 6.5 6.0Vehicle Extension (s) 3.0 3.0 3.0 3.0 3.0 3.0 3.0 3.0 3.0 3.0Lane Grp Cap (vph) 64 80 266 378 480 327 769 281 1065 1181v/s Ratio Prot 0.04 c0.15 c0.19 0.06 c0.41 0.10 0.36 0.02v/s Ratio Perm 0.03 0.05 c0.10 0.05 0.35 0.08v/c Ratio 0.75 1.00 1.17 1.05 0.21 0.13 0.97 0.75 0.59 0.13Uniform Delay, d1 53.4 54.0 46.7 38.3 31.1 19.9 32.0 30.8 14.0 2.9Progression Factor 1.00 1.00 1.00 1.00 1.00 1.00 1.00 1.00 1.00 1.00Incremental Delay, d2 38.4 100.6 108.0 60.1 0.2 0.8 26.3 10.3 2.4 0.0Delay (s) 91.8 154.6 154.7 98.4 31.3 20.8 58.3 41.1 16.5 3.0Level of Service F F F F C C E D B AApproach Delay (s) 148.9 83.1 56.3 19.3Approach LOS F F E B
Intersection SummaryHCM 2000 Control Delay 65.1 HCM 2000 Level of Service EHCM 2000 Volume to Capacity ratio 1.07Actuated Cycle Length (s) 113.0 Sum of lost time (s) 25.0Intersection Capacity Utilization 94.4% ICU Level of Service FAnalysis Period (min) 15c Critical Lane Group

HCM Unsignalized Intersection Capacity Analysis Exist AM Peak2: River Rd & Stardust Way 1/23/2015
Existing AM.syn Synchro 8 ReportPage 1
Movement EBL EBR NBL NBT SBT SBRLane ConfigurationsVolume (veh/h) 6 21 4 264 453 2Sign Control Stop Free FreeGrade 0% 0% 0%Peak Hour Factor 0.64 0.64 0.89 0.89 0.88 0.88Hourly flow rate (vph) 9 33 4 297 515 2PedestriansLane Width (ft)Walking Speed (ft/s)Percent BlockageRight turn flare (veh)Median type None NoneMedian storage veh)Upstream signal (ft)pX, platoon unblockedvC, conflicting volume 822 516 517vC1, stage 1 conf volvC2, stage 2 conf volvCu, unblocked vol 822 516 517tC, single (s) 6.4 6.2 4.2tC, 2 stage (s)tF (s) 3.5 3.3 2.3p0 queue free % 97 94 100cM capacity (veh/h) 344 561 1014
Direction, Lane # EB 1 NB 1 SB 1Volume Total 42 301 517Volume Left 9 4 0Volume Right 33 0 2cSH 492 1014 1700Volume to Capacity 0.09 0.00 0.30Queue Length 95th (ft) 7 0 0Control Delay (s) 13.0 0.2 0.0Lane LOS B AApproach Delay (s) 13.0 0.2 0.0Approach LOS B
Intersection SummaryAverage Delay 0.7Intersection Capacity Utilization 34.0% ICU Level of Service AAnalysis Period (min) 15
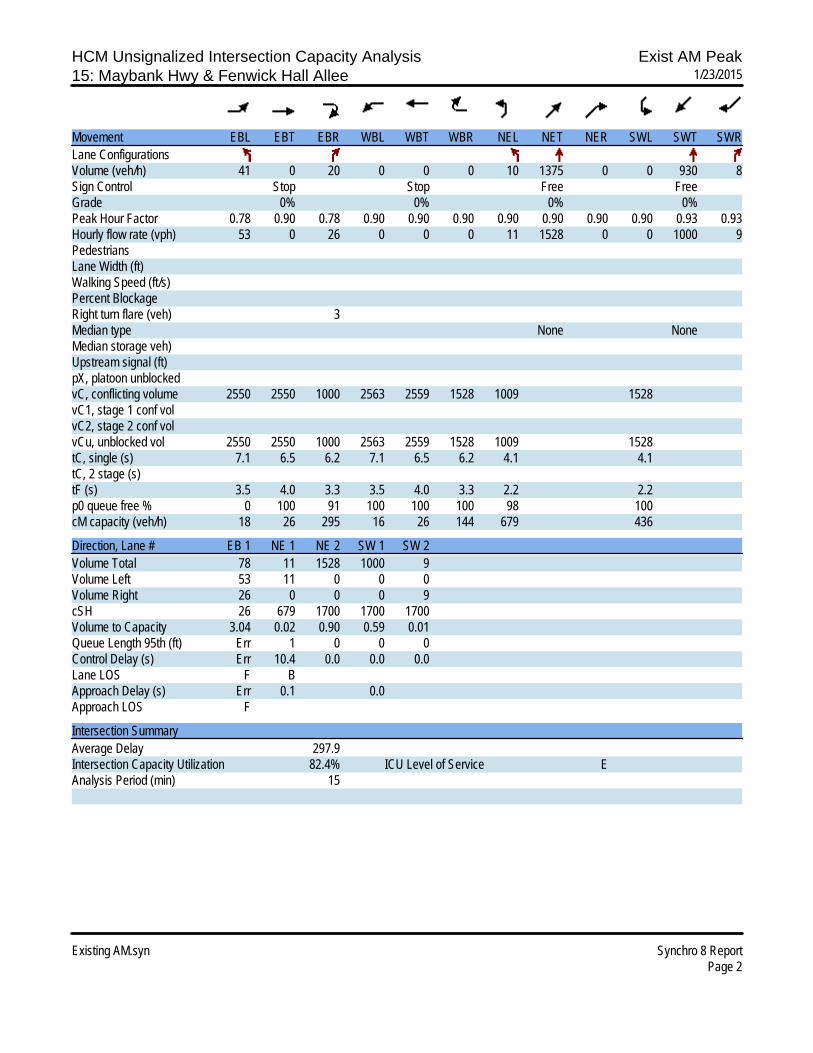
HCM Unsignalized Intersection Capacity Analysis Exist AM Peak15: Maybank Hwy & Fenwick Hall Allee 1/23/2015
Existing AM.syn Synchro 8 ReportPage 2
Movement EBL EBT EBR WBL WBT WBR NEL NET NER SWL SWT SWRLane ConfigurationsVolume (veh/h) 41 0 20 0 0 0 10 1375 0 0 930 8Sign Control Stop Stop Free FreeGrade 0% 0% 0% 0%Peak Hour Factor 0.78 0.90 0.78 0.90 0.90 0.90 0.90 0.90 0.90 0.90 0.93 0.93Hourly flow rate (vph) 53 0 26 0 0 0 11 1528 0 0 1000 9PedestriansLane Width (ft)Walking Speed (ft/s)Percent BlockageRight turn flare (veh) 3Median type None NoneMedian storage veh)Upstream signal (ft)pX, platoon unblockedvC, conflicting volume 2550 2550 1000 2563 2559 1528 1009 1528vC1, stage 1 conf volvC2, stage 2 conf volvCu, unblocked vol 2550 2550 1000 2563 2559 1528 1009 1528tC, single (s) 7.1 6.5 6.2 7.1 6.5 6.2 4.1 4.1tC, 2 stage (s)tF (s) 3.5 4.0 3.3 3.5 4.0 3.3 2.2 2.2p0 queue free % 0 100 91 100 100 100 98 100cM capacity (veh/h) 18 26 295 16 26 144 679 436
Direction, Lane # EB 1 NE 1 NE 2 SW 1 SW 2Volume Total 78 11 1528 1000 9Volume Left 53 11 0 0 0Volume Right 26 0 0 0 9cSH 26 679 1700 1700 1700Volume to Capacity 3.04 0.02 0.90 0.59 0.01Queue Length 95th (ft) Err 1 0 0 0Control Delay (s) Err 10.4 0.0 0.0 0.0Lane LOS F BApproach Delay (s) Err 0.1 0.0Approach LOS F
Intersection SummaryAverage Delay 297.9Intersection Capacity Utilization 82.4% ICU Level of Service EAnalysis Period (min) 15

HCM Unsignalized Intersection Capacity Analysis Exist AM Peak19: Cane Slash Rd & River Rd 1/23/2015
Existing AM.syn Synchro 8 ReportPage 3
Movement NBL NBT SBT SBR NEL NERLane ConfigurationsVolume (veh/h) 4 409 239 8 53 13Sign Control Free Free StopGrade 0% 0% 0%Peak Hour Factor 0.77 0.77 0.97 0.97 0.63 0.63Hourly flow rate (vph) 5 531 246 8 84 21PedestriansLane Width (ft)Walking Speed (ft/s)Percent BlockageRight turn flare (veh)Median type None NoneMedian storage veh)Upstream signal (ft)pX, platoon unblockedvC, conflicting volume 255 792 251vC1, stage 1 conf volvC2, stage 2 conf volvCu, unblocked vol 255 792 251tC, single (s) 4.1 6.4 6.2tC, 2 stage (s)tF (s) 2.2 3.5 3.3p0 queue free % 100 76 97cM capacity (veh/h) 1299 355 786
Direction, Lane # NB 1 SB 1 NE 1Volume Total 536 255 105Volume Left 5 0 84Volume Right 0 8 21cSH 1299 1700 398Volume to Capacity 0.00 0.15 0.26Queue Length 95th (ft) 0 0 26Control Delay (s) 0.1 0.0 17.2Lane LOS A CApproach Delay (s) 0.1 0.0 17.2Approach LOS C
Intersection SummaryAverage Delay 2.1Intersection Capacity Utilization 35.1% ICU Level of Service AAnalysis Period (min) 15
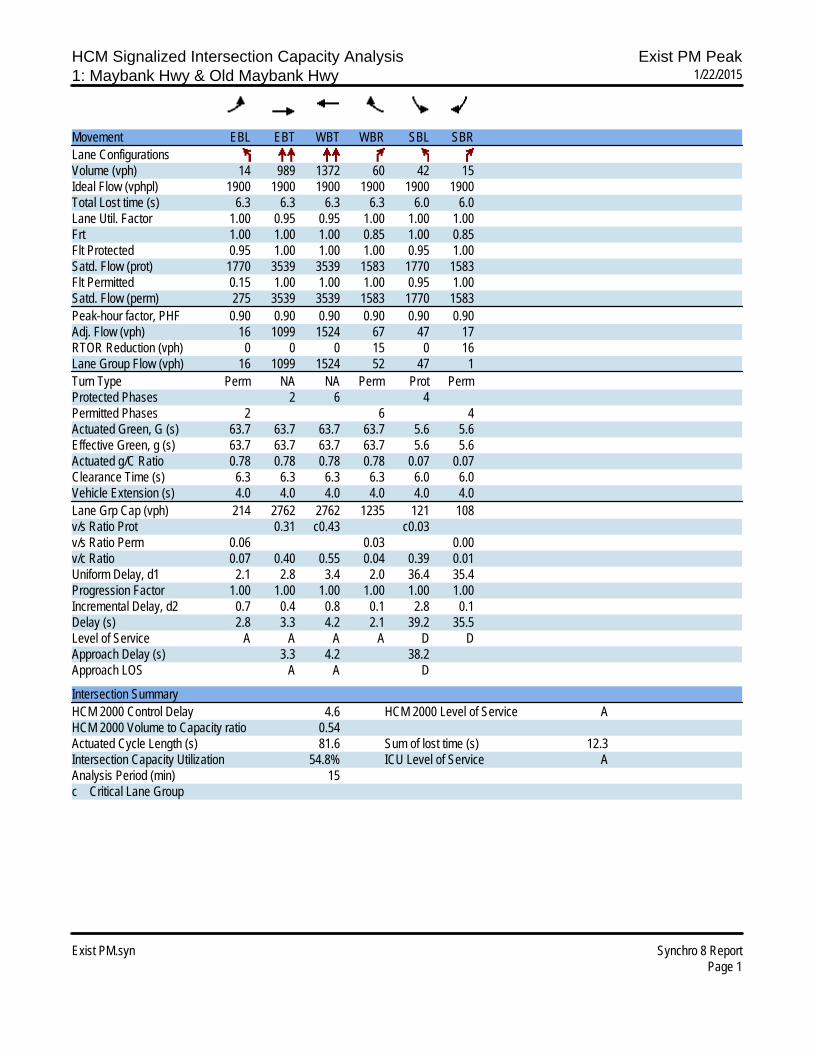
HCM Signalized Intersection Capacity Analysis Exist PM Peak1: Maybank Hwy & Old Maybank Hwy 1/22/2015
Exist PM.syn Synchro 8 ReportPage 1
Movement EBL EBT WBT WBR SBL SBRLane ConfigurationsVolume (vph) 14 989 1372 60 42 15Ideal Flow (vphpl) 1900 1900 1900 1900 1900 1900Total Lost time (s) 6.3 6.3 6.3 6.3 6.0 6.0Lane Util. Factor 1.00 0.95 0.95 1.00 1.00 1.00Frt 1.00 1.00 1.00 0.85 1.00 0.85Flt Protected 0.95 1.00 1.00 1.00 0.95 1.00Satd. Flow (prot) 1770 3539 3539 1583 1770 1583Flt Permitted 0.15 1.00 1.00 1.00 0.95 1.00Satd. Flow (perm) 275 3539 3539 1583 1770 1583Peak-hour factor, PHF 0.90 0.90 0.90 0.90 0.90 0.90Adj. Flow (vph) 16 1099 1524 67 47 17RTOR Reduction (vph) 0 0 0 15 0 16Lane Group Flow (vph) 16 1099 1524 52 47 1Turn Type Perm NA NA Perm Prot PermProtected Phases 2 6 4Permitted Phases 2 6 4Actuated Green, G (s) 63.7 63.7 63.7 63.7 5.6 5.6Effective Green, g (s) 63.7 63.7 63.7 63.7 5.6 5.6Actuated g/C Ratio 0.78 0.78 0.78 0.78 0.07 0.07Clearance Time (s) 6.3 6.3 6.3 6.3 6.0 6.0Vehicle Extension (s) 4.0 4.0 4.0 4.0 4.0 4.0Lane Grp Cap (vph) 214 2762 2762 1235 121 108v/s Ratio Prot 0.31 c0.43 c0.03v/s Ratio Perm 0.06 0.03 0.00v/c Ratio 0.07 0.40 0.55 0.04 0.39 0.01Uniform Delay, d1 2.1 2.8 3.4 2.0 36.4 35.4Progression Factor 1.00 1.00 1.00 1.00 1.00 1.00Incremental Delay, d2 0.7 0.4 0.8 0.1 2.8 0.1Delay (s) 2.8 3.3 4.2 2.1 39.2 35.5Level of Service A A A A D DApproach Delay (s) 3.3 4.2 38.2Approach LOS A A D
Intersection SummaryHCM 2000 Control Delay 4.6 HCM 2000 Level of Service AHCM 2000 Volume to Capacity ratio 0.54Actuated Cycle Length (s) 81.6 Sum of lost time (s) 12.3Intersection Capacity Utilization 54.8% ICU Level of Service AAnalysis Period (min) 15c Critical Lane Group

HCM Signalized Intersection Capacity Analysis Exist PM Peak5: Maybank Hwy & River Rd 1/22/2015
Exist PM.syn Synchro 8 ReportPage 2
Movement NBL NBT NBR SBL SBT SBR NEL NET NER SWL SWT SWRLane ConfigurationsVolume (vph) 54 116 211 230 107 82 64 570 25 240 734 389Ideal Flow (vphpl) 1900 1900 1900 1900 1900 1900 1900 1900 1900 1900 1900 1900Total Lost time (s) 7.0 7.0 5.5 6.0 7.0 6.5 6.5 5.5 6.5 6.0Lane Util. Factor 1.00 1.00 1.00 1.00 1.00 1.00 1.00 1.00 1.00 1.00Frt 1.00 1.00 0.85 1.00 0.93 1.00 0.99 1.00 1.00 0.85Flt Protected 0.95 1.00 1.00 0.95 1.00 0.95 1.00 0.95 1.00 1.00Satd. Flow (prot) 1719 1810 1538 1719 1692 1736 1816 1687 1776 1509Flt Permitted 0.63 1.00 1.00 0.36 1.00 0.29 1.00 0.12 1.00 1.00Satd. Flow (perm) 1139 1810 1538 651 1692 531 1816 218 1776 1509Peak-hour factor, PHF 0.88 0.88 0.88 0.92 0.92 0.92 0.95 0.95 0.95 0.94 0.94 0.94Adj. Flow (vph) 61 132 240 250 116 89 67 600 26 255 781 414RTOR Reduction (vph) 0 0 122 0 33 0 0 2 0 0 0 35Lane Group Flow (vph) 61 132 118 250 172 0 67 624 0 255 781 379Heavy Vehicles (%) 5% 5% 5% 5% 5% 5% 4% 4% 4% 7% 7% 7%Turn Type Perm NA pm+ov pm+pt NA Perm NA pm+pt NA pm+ovProtected Phases 4 1 3 8 2 1 6 3Permitted Phases 4 4 8 2 6 6Actuated Green, G (s) 6.9 6.9 15.6 22.0 22.0 30.3 30.3 44.5 44.5 53.6Effective Green, g (s) 6.9 6.9 15.6 22.0 22.0 30.3 30.3 44.5 44.5 53.6Actuated g/C Ratio 0.09 0.09 0.19 0.28 0.28 0.38 0.38 0.56 0.56 0.67Clearance Time (s) 7.0 7.0 5.5 6.0 7.0 6.5 6.5 5.5 6.5 6.0Vehicle Extension (s) 3.0 3.0 3.0 3.0 3.0 3.0 3.0 3.0 3.0 3.0Lane Grp Cap (vph) 98 156 299 300 465 201 687 281 987 1011v/s Ratio Prot 0.07 0.04 c0.09 0.10 0.34 0.10 c0.44 0.04v/s Ratio Perm 0.05 0.03 c0.13 0.13 c0.41 0.21v/c Ratio 0.62 0.85 0.39 0.83 0.37 0.33 0.91 0.91 0.79 0.38Uniform Delay, d1 35.3 36.0 28.1 25.3 23.4 17.7 23.5 18.0 14.1 5.8Progression Factor 1.00 1.00 1.00 1.00 1.00 1.00 1.00 1.00 1.00 1.00Incremental Delay, d2 11.7 32.2 0.9 17.7 0.5 4.4 18.1 30.5 6.5 0.2Delay (s) 47.0 68.2 28.9 43.0 23.9 22.1 41.6 48.5 20.5 6.1Level of Service D E C D C C D D C AApproach Delay (s) 43.5 34.4 39.7 21.3Approach LOS D C D C
Intersection SummaryHCM 2000 Control Delay 30.7 HCM 2000 Level of Service CHCM 2000 Volume to Capacity ratio 1.01Actuated Cycle Length (s) 80.0 Sum of lost time (s) 25.0Intersection Capacity Utilization 84.5% ICU Level of Service EAnalysis Period (min) 15c Critical Lane Group

HCM Unsignalized Intersection Capacity Analysis Exist PM Peak2: River Rd & Stardust Way 1/23/2015
Exist PM.syn Synchro 8 ReportPage 1
Movement EBL EBR NBL NBT SBT SBRLane ConfigurationsVolume (veh/h) 3 9 19 548 410 5Sign Control Stop Free FreeGrade 0% 0% 0%Peak Hour Factor 0.64 0.64 0.89 0.89 0.88 0.88Hourly flow rate (vph) 5 14 21 616 466 6PedestriansLane Width (ft)Walking Speed (ft/s)Percent BlockageRight turn flare (veh)Median type None NoneMedian storage veh)Upstream signal (ft)pX, platoon unblockedvC, conflicting volume 1127 469 472vC1, stage 1 conf volvC2, stage 2 conf volvCu, unblocked vol 1127 469 472tC, single (s) 6.4 6.2 4.2tC, 2 stage (s)tF (s) 3.5 3.3 2.3p0 queue free % 98 98 98cM capacity (veh/h) 223 597 1055
Direction, Lane # EB 1 NB 1 SB 1Volume Total 19 637 472Volume Left 5 21 0Volume Right 14 0 6cSH 420 1055 1700Volume to Capacity 0.04 0.02 0.28Queue Length 95th (ft) 3 2 0Control Delay (s) 14.0 0.5 0.0Lane LOS B AApproach Delay (s) 14.0 0.5 0.0Approach LOS B
Intersection SummaryAverage Delay 0.5Intersection Capacity Utilization 54.2% ICU Level of Service AAnalysis Period (min) 15

HCM Unsignalized Intersection Capacity Analysis Exist PM Peak15: Maybank Hwy & Fenwick Hall Allee 1/23/2015
Exist PM.syn Synchro 8 ReportPage 2
Movement EBL EBR EBR2 NWL NWR NEL NET NER SWL SWT SWRLane ConfigurationsVolume (veh/h) 16 0 10 0 0 24 987 0 0 1353 34Sign Control Stop Stop Free FreeGrade 0% 0% 0% 0%Peak Hour Factor 0.78 0.90 0.78 0.90 0.90 0.90 0.90 0.90 0.90 0.93 0.93Hourly flow rate (vph) 21 0 13 0 0 27 1097 0 0 1455 37PedestriansLane Width (ft)Walking Speed (ft/s)Percent BlockageRight turn flare (veh) 3 3Median type None NoneMedian storage veh)Upstream signal (ft)pX, platoon unblockedvC, conflicting volume 2605 2605 1455 2641 1097 1491 1097vC1, stage 1 conf volvC2, stage 2 conf volvCu, unblocked vol 2605 2605 1455 2641 1097 1491 1097tC, single (s) 7.1 6.5 6.2 6.5 6.2 4.1 4.1tC, 2 stage (s)tF (s) 3.5 4.0 3.3 4.0 3.3 2.2 2.2p0 queue free % 0 100 92 100 100 94 100cM capacity (veh/h) 16 23 160 22 259 444 636
Direction, Lane # EB 1 NE 1 NE 2 SW 1 SW 2Volume Total 33 27 1097 1455 37Volume Left 21 27 0 0 0Volume Right 13 0 0 0 37cSH 25 444 1700 1700 1700Volume to Capacity 1.34 0.06 0.65 0.86 0.02Queue Length 95th (ft) 103 5 0 0 0Control Delay (s) 534.3 13.6 0.0 0.0 0.0Lane LOS F BApproach Delay (s) 534.3 0.3 0.0Approach LOS F
Intersection SummaryAverage Delay 6.9Intersection Capacity Utilization 81.2% ICU Level of Service DAnalysis Period (min) 15

HCM Unsignalized Intersection Capacity Analysis Exist PM Peak19: Cane Slash Rd & River Rd 1/23/2015
Exist PM.syn Synchro 8 ReportPage 3
Movement NBL NBT SBT SBR NEL NERLane ConfigurationsVolume (veh/h) 4 355 283 39 26 4Sign Control Free Free StopGrade 0% 0% 0%Peak Hour Factor 0.77 0.77 0.97 0.97 0.63 0.63Hourly flow rate (vph) 5 461 292 40 41 6PedestriansLane Width (ft)Walking Speed (ft/s)Percent BlockageRight turn flare (veh)Median type None NoneMedian storage veh)Upstream signal (ft)pX, platoon unblockedvC, conflicting volume 332 783 312vC1, stage 1 conf volvC2, stage 2 conf volvCu, unblocked vol 332 783 312tC, single (s) 4.1 6.4 6.2tC, 2 stage (s)tF (s) 2.2 3.5 3.3p0 queue free % 100 89 99cM capacity (veh/h) 1216 359 726
Direction, Lane # NB 1 SB 1 NE 1Volume Total 466 332 48Volume Left 5 0 41Volume Right 0 40 6cSH 1216 1700 385Volume to Capacity 0.00 0.20 0.12Queue Length 95th (ft) 0 0 10Control Delay (s) 0.1 0.0 15.7Lane LOS A CApproach Delay (s) 0.1 0.0 15.7Approach LOS C
Intersection SummaryAverage Delay 1.0Intersection Capacity Utilization 31.9% ICU Level of Service AAnalysis Period (min) 15

HCM Signalized Intersection Capacity Analysis5: Maybank Hwy & River Rd 3/19/2015
2014 Build without I-526 4/6/2010 2014 Build without I-526 Synchro 8 ReportPage 1
Movement NBL NBT NBR SBL SBT SBR NEL NET NER SWL SWT SWRLane ConfigurationsVolume (vph) 5 11 94 37 24 126 67 592 8 114 469 147Ideal Flow (vphpl) 1900 1900 1900 1900 1900 1900 1900 1900 1900 1900 1900 1900Lane Width 12 12 11 12 14 10 12 13 10 11 11 11Total Lost time (s) 7.0 7.0 6.5 7.0 7.0 7.0 6.5 6.5 6.5 6.5 6.5 6.5Lane Util. Factor 1.00 1.00 1.00 1.00 1.00 1.00 1.00 1.00 1.00 1.00 1.00 1.00Frt 1.00 1.00 0.85 1.00 1.00 0.85 1.00 1.00 0.85 1.00 1.00 0.85Flt Protected 0.95 1.00 1.00 0.95 1.00 1.00 0.95 1.00 1.00 0.95 1.00 1.00Satd. Flow (prot) 1736 1827 1501 1736 1949 1449 1752 1716 1463 1694 1783 1516Flt Permitted 0.74 1.00 1.00 0.75 1.00 1.00 0.48 1.00 1.00 0.38 1.00 1.00Satd. Flow (perm) 1355 1827 1501 1371 1949 1449 885 1716 1463 682 1783 1516Peak-hour factor, PHF 0.97 0.97 0.97 0.98 0.98 0.98 0.87 0.87 0.87 0.97 0.97 0.97Adj. Flow (vph) 5 11 97 38 24 129 77 680 9 118 484 152RTOR Reduction (vph) 0 0 0 0 0 121 0 0 1 0 0 23Lane Group Flow (vph) 5 11 97 38 24 8 77 680 8 118 484 129Heavy Vehicles (%) 4% 4% 4% 4% 4% 4% 3% 3% 3% 3% 3% 3%Parking (#/hr) 0Turn Type Perm NA custom Perm NA Perm Perm NA Perm Perm NA PermProtected Phases 4 8 2 6Permitted Phases 4 2 4 6 8 8 2 2 6 6Actuated Green, G (s) 9.6 9.6 150.0 9.6 9.6 9.6 126.9 126.9 126.9 126.9 126.9 126.9Effective Green, g (s) 9.6 9.6 143.0 9.6 9.6 9.6 126.9 126.9 126.9 126.9 126.9 126.9Actuated g/C Ratio 0.06 0.06 0.95 0.06 0.06 0.06 0.85 0.85 0.85 0.85 0.85 0.85Clearance Time (s) 7.0 7.0 7.0 7.0 7.0 6.5 6.5 6.5 6.5 6.5 6.5Vehicle Extension (s) 3.0 3.0 3.0 3.0 3.0 3.0 3.0 3.0 3.0 3.0 3.0Lane Grp Cap (vph) 86 116 1430 87 124 92 748 1451 1237 576 1508 1282v/s Ratio Prot 0.01 0.01 c0.40 0.27v/s Ratio Perm 0.00 0.06 c0.03 0.01 0.09 0.01 0.17 0.08v/c Ratio 0.06 0.09 0.07 0.44 0.19 0.09 0.10 0.47 0.01 0.20 0.32 0.10Uniform Delay, d1 66.0 66.1 0.2 67.6 66.5 66.1 1.9 2.9 1.8 2.2 2.4 1.9Progression Factor 1.00 1.00 1.00 1.02 1.02 1.50 1.00 1.00 1.00 1.00 1.00 1.00Incremental Delay, d2 0.3 0.4 0.0 3.5 0.8 0.4 0.3 1.1 0.0 0.8 0.6 0.2Delay (s) 66.2 66.5 0.2 72.3 68.5 99.8 2.2 4.0 1.8 3.0 3.0 2.1Level of Service E E A E E F A A A A A AApproach Delay (s) 9.6 90.4 3.8 2.8Approach LOS A F A A
Intersection SummaryHCM 2000 Control Delay 12.8 HCM 2000 Level of Service BHCM 2000 Volume to Capacity ratio 0.47Actuated Cycle Length (s) 150.0 Sum of lost time (s) 13.5Intersection Capacity Utilization 62.9% ICU Level of Service BAnalysis Period (min) 15c Critical Lane Group
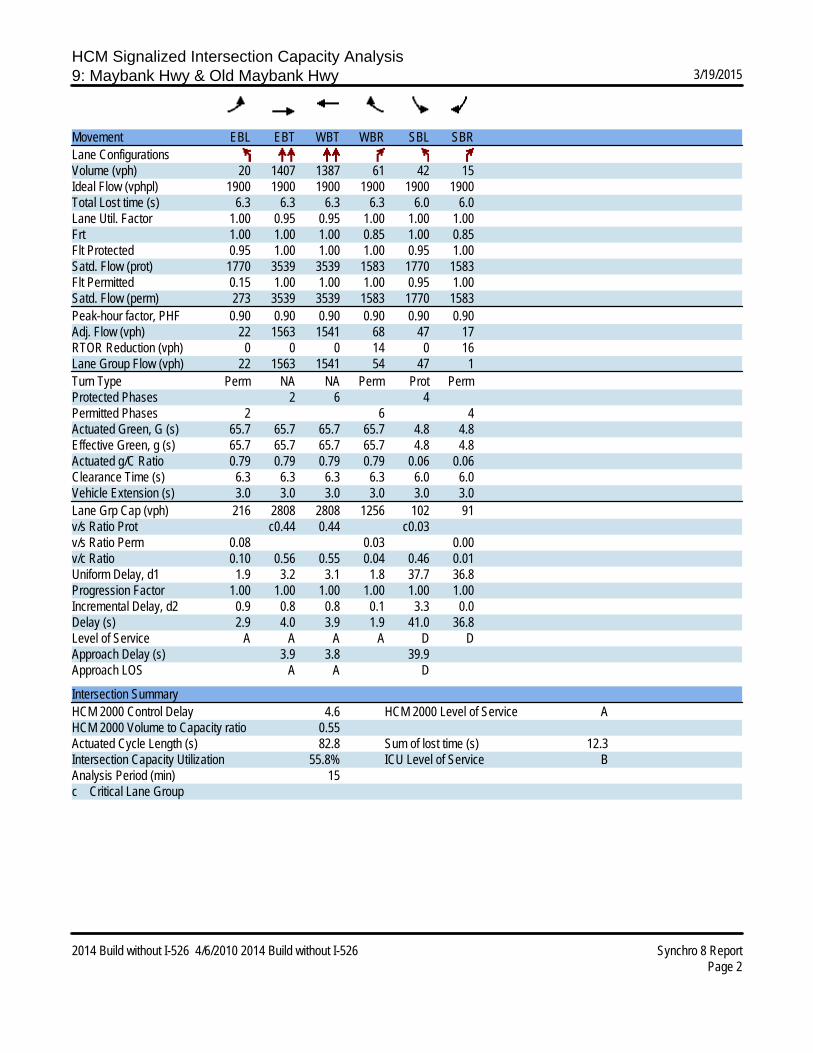
HCM Signalized Intersection Capacity Analysis9: Maybank Hwy & Old Maybank Hwy 3/19/2015
2014 Build without I-526 4/6/2010 2014 Build without I-526 Synchro 8 ReportPage 2
Movement EBL EBT WBT WBR SBL SBRLane ConfigurationsVolume (vph) 20 1407 1387 61 42 15Ideal Flow (vphpl) 1900 1900 1900 1900 1900 1900Total Lost time (s) 6.3 6.3 6.3 6.3 6.0 6.0Lane Util. Factor 1.00 0.95 0.95 1.00 1.00 1.00Frt 1.00 1.00 1.00 0.85 1.00 0.85Flt Protected 0.95 1.00 1.00 1.00 0.95 1.00Satd. Flow (prot) 1770 3539 3539 1583 1770 1583Flt Permitted 0.15 1.00 1.00 1.00 0.95 1.00Satd. Flow (perm) 273 3539 3539 1583 1770 1583Peak-hour factor, PHF 0.90 0.90 0.90 0.90 0.90 0.90Adj. Flow (vph) 22 1563 1541 68 47 17RTOR Reduction (vph) 0 0 0 14 0 16Lane Group Flow (vph) 22 1563 1541 54 47 1Turn Type Perm NA NA Perm Prot PermProtected Phases 2 6 4Permitted Phases 2 6 4Actuated Green, G (s) 65.7 65.7 65.7 65.7 4.8 4.8Effective Green, g (s) 65.7 65.7 65.7 65.7 4.8 4.8Actuated g/C Ratio 0.79 0.79 0.79 0.79 0.06 0.06Clearance Time (s) 6.3 6.3 6.3 6.3 6.0 6.0Vehicle Extension (s) 3.0 3.0 3.0 3.0 3.0 3.0Lane Grp Cap (vph) 216 2808 2808 1256 102 91v/s Ratio Prot c0.44 0.44 c0.03v/s Ratio Perm 0.08 0.03 0.00v/c Ratio 0.10 0.56 0.55 0.04 0.46 0.01Uniform Delay, d1 1.9 3.2 3.1 1.8 37.7 36.8Progression Factor 1.00 1.00 1.00 1.00 1.00 1.00Incremental Delay, d2 0.9 0.8 0.8 0.1 3.3 0.0Delay (s) 2.9 4.0 3.9 1.9 41.0 36.8Level of Service A A A A D DApproach Delay (s) 3.9 3.8 39.9Approach LOS A A D
Intersection SummaryHCM 2000 Control Delay 4.6 HCM 2000 Level of Service AHCM 2000 Volume to Capacity ratio 0.55Actuated Cycle Length (s) 82.8 Sum of lost time (s) 12.3Intersection Capacity Utilization 55.8% ICU Level of Service BAnalysis Period (min) 15c Critical Lane Group
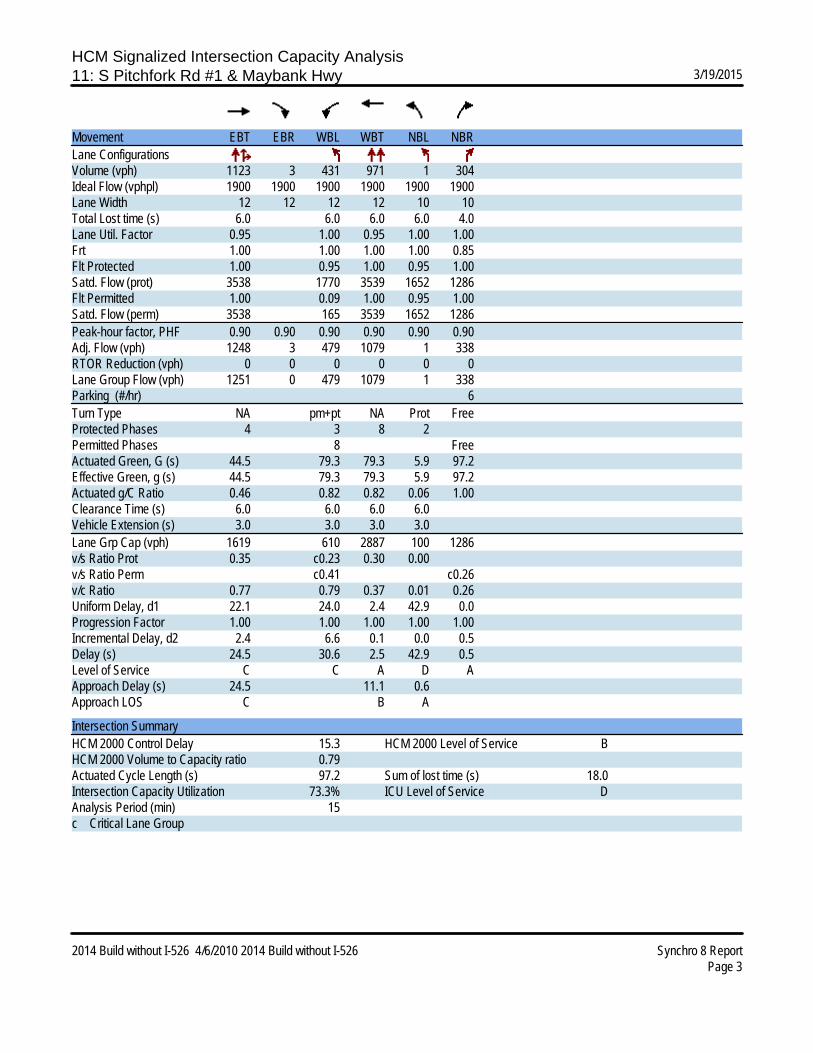
HCM Signalized Intersection Capacity Analysis11: S Pitchfork Rd #1 & Maybank Hwy 3/19/2015
2014 Build without I-526 4/6/2010 2014 Build without I-526 Synchro 8 ReportPage 3
Movement EBT EBR WBL WBT NBL NBRLane ConfigurationsVolume (vph) 1123 3 431 971 1 304Ideal Flow (vphpl) 1900 1900 1900 1900 1900 1900Lane Width 12 12 12 12 10 10Total Lost time (s) 6.0 6.0 6.0 6.0 4.0Lane Util. Factor 0.95 1.00 0.95 1.00 1.00Frt 1.00 1.00 1.00 1.00 0.85Flt Protected 1.00 0.95 1.00 0.95 1.00Satd. Flow (prot) 3538 1770 3539 1652 1286Flt Permitted 1.00 0.09 1.00 0.95 1.00Satd. Flow (perm) 3538 165 3539 1652 1286Peak-hour factor, PHF 0.90 0.90 0.90 0.90 0.90 0.90Adj. Flow (vph) 1248 3 479 1079 1 338RTOR Reduction (vph) 0 0 0 0 0 0Lane Group Flow (vph) 1251 0 479 1079 1 338Parking (#/hr) 6Turn Type NA pm+pt NA Prot FreeProtected Phases 4 3 8 2Permitted Phases 8 FreeActuated Green, G (s) 44.5 79.3 79.3 5.9 97.2Effective Green, g (s) 44.5 79.3 79.3 5.9 97.2Actuated g/C Ratio 0.46 0.82 0.82 0.06 1.00Clearance Time (s) 6.0 6.0 6.0 6.0Vehicle Extension (s) 3.0 3.0 3.0 3.0Lane Grp Cap (vph) 1619 610 2887 100 1286v/s Ratio Prot 0.35 c0.23 0.30 0.00v/s Ratio Perm c0.41 c0.26v/c Ratio 0.77 0.79 0.37 0.01 0.26Uniform Delay, d1 22.1 24.0 2.4 42.9 0.0Progression Factor 1.00 1.00 1.00 1.00 1.00Incremental Delay, d2 2.4 6.6 0.1 0.0 0.5Delay (s) 24.5 30.6 2.5 42.9 0.5Level of Service C C A D AApproach Delay (s) 24.5 11.1 0.6Approach LOS C B A
Intersection SummaryHCM 2000 Control Delay 15.3 HCM 2000 Level of Service BHCM 2000 Volume to Capacity ratio 0.79Actuated Cycle Length (s) 97.2 Sum of lost time (s) 18.0Intersection Capacity Utilization 73.3% ICU Level of Service DAnalysis Period (min) 15c Critical Lane Group

HCM Signalized Intersection Capacity Analysis12: River Rd & S Pitchfork Rd #1 3/19/2015
2014 Build without I-526 4/6/2010 2014 Build without I-526 Synchro 8 ReportPage 4
Movement NBT NBR SBL SBT SWL SWRLane ConfigurationsVolume (vph) 99 292 13 134 423 11Ideal Flow (vphpl) 1900 1900 1900 1900 1900 1900Lane Width 10 10 10 10 10 10Total Lost time (s) 6.0 6.0 6.0 6.0 6.0Lane Util. Factor 1.00 1.00 1.00 1.00 1.00Frt 0.90 1.00 1.00 1.00 0.85Flt Protected 1.00 0.95 1.00 0.95 1.00Satd. Flow (prot) 1563 1652 1739 1652 1286Flt Permitted 1.00 0.43 1.00 0.95 1.00Satd. Flow (perm) 1563 748 1739 1652 1286Peak-hour factor, PHF 0.90 0.90 0.90 0.90 0.90 0.90Adj. Flow (vph) 110 324 14 149 470 12RTOR Reduction (vph) 142 0 0 0 0 8Lane Group Flow (vph) 292 0 14 149 470 4Parking (#/hr) 6Turn Type NA Perm NA Prot PermProtected Phases 2 6 8Permitted Phases 6 8Actuated Green, G (s) 31.2 31.2 31.2 22.3 22.3Effective Green, g (s) 31.2 31.2 31.2 22.3 22.3Actuated g/C Ratio 0.48 0.48 0.48 0.34 0.34Clearance Time (s) 6.0 6.0 6.0 6.0 6.0Vehicle Extension (s) 3.0 3.0 3.0 3.0 3.0Lane Grp Cap (vph) 744 356 828 562 437v/s Ratio Prot c0.19 0.09 c0.28v/s Ratio Perm 0.02 0.00v/c Ratio 0.39 0.04 0.18 0.84 0.01Uniform Delay, d1 11.0 9.2 9.8 19.9 14.3Progression Factor 1.00 1.00 1.00 1.00 1.00Incremental Delay, d2 1.6 0.2 0.5 10.4 0.0Delay (s) 12.6 9.4 10.3 30.4 14.3Level of Service B A B C BApproach Delay (s) 12.6 10.2 30.0Approach LOS B B C
Intersection SummaryHCM 2000 Control Delay 20.0 HCM 2000 Level of Service BHCM 2000 Volume to Capacity ratio 0.58Actuated Cycle Length (s) 65.5 Sum of lost time (s) 12.0Intersection Capacity Utilization 56.6% ICU Level of Service BAnalysis Period (min) 15c Critical Lane Group

HCM Signalized Intersection Capacity Analysis15: Maybank Hwy & N Pitchfork Rd #1 3/19/2015
2014 Build without I-526 4/6/2010 2014 Build without I-526 Synchro 8 ReportPage 5
Movement SEL SER NEL NET SWT SWRLane ConfigurationsVolume (vph) 411 4 7 716 729 243Ideal Flow (vphpl) 1900 1900 1900 1900 1900 1900Lane Width 11 11 11 11 11 11Total Lost time (s) 6.0 6.0 6.0 6.0 6.0 6.0Lane Util. Factor 1.00 1.00 1.00 1.00 0.95 1.00Frt 1.00 0.85 1.00 1.00 1.00 0.85Flt Protected 0.95 1.00 0.95 1.00 1.00 1.00Satd. Flow (prot) 1631 1459 1694 1783 3421 1531Flt Permitted 0.95 1.00 0.31 1.00 1.00 1.00Satd. Flow (perm) 1631 1459 549 1783 3421 1531Peak-hour factor, PHF 0.73 0.73 0.87 0.87 0.98 0.98Adj. Flow (vph) 563 5 8 823 744 248RTOR Reduction (vph) 0 2 0 0 0 135Lane Group Flow (vph) 563 3 8 823 744 113Heavy Vehicles (%) 7% 7% 3% 3% 2% 2%Turn Type Prot Perm Perm NA NA customProtected Phases 8 2 6Permitted Phases 2 2 8Actuated Green, G (s) 49.0 66.2 66.2 66.2 66.2 49.0Effective Green, g (s) 49.0 66.2 66.2 66.2 66.2 49.0Actuated g/C Ratio 0.39 0.52 0.52 0.52 0.52 0.39Clearance Time (s) 6.0 6.0 6.0 6.0 6.0 6.0Vehicle Extension (s) 3.0 3.0 3.0 3.0 3.0 3.0Lane Grp Cap (vph) 628 759 285 927 1780 589v/s Ratio Prot c0.35 c0.46 0.22v/s Ratio Perm 0.00 0.01 0.07v/c Ratio 0.90 0.00 0.03 0.89 0.42 0.19Uniform Delay, d1 36.7 14.7 14.8 27.2 18.7 26.0Progression Factor 1.00 1.00 1.00 1.00 1.00 1.00Incremental Delay, d2 15.4 0.0 0.0 10.3 0.2 0.2Delay (s) 52.1 14.7 14.9 37.5 18.9 26.1Level of Service D B B D B CApproach Delay (s) 51.8 37.3 20.7Approach LOS D D C
Intersection SummaryHCM 2000 Control Delay 33.8 HCM 2000 Level of Service CHCM 2000 Volume to Capacity ratio 0.89Actuated Cycle Length (s) 127.2 Sum of lost time (s) 12.0Intersection Capacity Utilization 70.5% ICU Level of Service CAnalysis Period (min) 15c Critical Lane Group

HCM Signalized Intersection Capacity Analysis29: River Rd & N Pitchfork Rd #1 3/19/2015
2014 Build without I-526 4/6/2010 2014 Build without I-526 Synchro 8 ReportPage 6
Movement WBL WBR NBT NBR SBL SBTLane ConfigurationsVolume (vph) 48 203 93 132 284 140Ideal Flow (vphpl) 1900 1900 1900 1900 1900 1900Lane Width 11 11 10 10 10 10Total Lost time (s) 6.0 6.0 6.0 6.0 6.0Lane Util. Factor 1.00 1.00 1.00 1.00 1.00Frt 1.00 0.85 0.92 1.00 1.00Flt Protected 0.95 1.00 1.00 0.95 1.00Satd. Flow (prot) 1711 1332 1601 1652 1739Flt Permitted 0.95 1.00 1.00 0.60 1.00Satd. Flow (perm) 1711 1332 1601 1050 1739Peak-hour factor, PHF 0.90 0.90 0.90 0.90 0.90 0.90Adj. Flow (vph) 53 226 103 147 316 156RTOR Reduction (vph) 0 200 40 0 0 0Lane Group Flow (vph) 53 26 210 0 316 156Parking (#/hr) 6Turn Type Prot Perm NA Perm NAProtected Phases 8 2 6Permitted Phases 8 6Actuated Green, G (s) 8.6 8.6 54.4 54.4 54.4Effective Green, g (s) 8.6 8.6 54.4 54.4 54.4Actuated g/C Ratio 0.11 0.11 0.73 0.73 0.73Clearance Time (s) 6.0 6.0 6.0 6.0 6.0Vehicle Extension (s) 3.0 3.0 3.0 3.0 3.0Lane Grp Cap (vph) 196 152 1161 761 1261v/s Ratio Prot c0.03 0.13 0.09v/s Ratio Perm 0.02 c0.30v/c Ratio 0.27 0.17 0.18 0.42 0.12Uniform Delay, d1 30.3 30.0 3.3 4.0 3.1Progression Factor 1.00 1.00 0.90 1.00 1.00Incremental Delay, d2 0.7 0.5 0.3 1.7 0.2Delay (s) 31.1 30.5 3.3 5.7 3.3Level of Service C C A A AApproach Delay (s) 30.6 3.3 4.9Approach LOS C A A
Intersection SummaryHCM 2000 Control Delay 11.7 HCM 2000 Level of Service BHCM 2000 Volume to Capacity ratio 0.40Actuated Cycle Length (s) 75.0 Sum of lost time (s) 12.0Intersection Capacity Utilization 47.1% ICU Level of Service AAnalysis Period (min) 15c Critical Lane Group

HCM Unsignalized Intersection Capacity Analysis2: River Rd & Stardust Way 3/19/2015
2014 Build without I-526 4/6/2010 2014 Build without I-526 Synchro 8 ReportPage 1
Movement EBL EBR NBL NBT SBT SBRLane ConfigurationsVolume (veh/h) 3 9 12 284 414 5Sign Control Stop Free FreeGrade 0% 0% 0%Peak Hour Factor 0.64 0.64 0.98 0.98 0.97 0.97Hourly flow rate (vph) 5 14 12 290 427 5PedestriansLane Width (ft)Walking Speed (ft/s)Percent BlockageRight turn flare (veh)Median type None NoneMedian storage veh)Upstream signal (ft) 926pX, platoon unblockedvC, conflicting volume 744 429 432vC1, stage 1 conf volvC2, stage 2 conf volvCu, unblocked vol 744 429 432tC, single (s) 6.4 6.2 4.1tC, 2 stage (s)tF (s) 3.5 3.3 2.2p0 queue free % 99 98 99cM capacity (veh/h) 380 628 1122
Direction, Lane # EB 1 NB 1 SB 1Volume Total 19 302 432Volume Left 5 12 0Volume Right 14 0 5cSH 540 1122 1700Volume to Capacity 0.03 0.01 0.25Queue Length 95th (ft) 3 1 0Control Delay (s) 11.9 0.4 0.0Lane LOS B AApproach Delay (s) 11.9 0.4 0.0Approach LOS B
Intersection SummaryAverage Delay 0.5Intersection Capacity Utilization 34.7% ICU Level of Service AAnalysis Period (min) 15

HCM Unsignalized Intersection Capacity Analysis14: N Pitchfork Rd #1 & Fenwick Hall Allee 3/19/2015
2014 Build without I-526 4/6/2010 2014 Build without I-526 Synchro 8 ReportPage 2
Movement EBL EBT WBT WBR SBL SBRRight Turn Channelized YesVolume (veh/h) 0 532 382 0 0 0Peak Hour Factor 0.90 0.90 0.90 0.90 0.90 0.90Hourly flow rate (vph) 0 591 424 0 0 0Approach Volume (veh/h) 591 424 0Crossing Volume (veh/h) 0 0 424High Capacity (veh/h) 1385 1385 991High v/c (veh/h) 0.43 0.31 0.00Low Capacity (veh/h) 1161 1161 806Low v/c (veh/h) 0.51 0.37 0.00
Intersection SummaryMaximum v/c High 0.43Maximum v/c Low 0.51Intersection Capacity Utilization 31.3% ICU Level of Service A

HCM Unsignalized Intersection Capacity Analysis19: Cane Slash Rd & River Rd 3/19/2015
2014 Build without I-526 4/6/2010 2014 Build without I-526 Synchro 8 ReportPage 3
Movement NBL NBT SBT SBR NEL NERLane ConfigurationsVolume (veh/h) 4 364 505 52 26 4Sign Control Free Free StopGrade 0% 0% 0%Peak Hour Factor 0.93 0.93 0.94 0.94 0.81 0.81Hourly flow rate (vph) 4 391 537 55 32 5PedestriansLane Width (ft)Walking Speed (ft/s)Percent BlockageRight turn flare (veh)Median type None NoneMedian storage veh)Upstream signal (ft) 638pX, platoon unblockedvC, conflicting volume 593 965 565vC1, stage 1 conf volvC2, stage 2 conf volvCu, unblocked vol 593 965 565tC, single (s) 4.2 6.4 6.2tC, 2 stage (s)tF (s) 2.3 3.5 3.3p0 queue free % 100 89 99cM capacity (veh/h) 964 283 526
Direction, Lane # NB 1 SB 1 NE 1Volume Total 396 593 37Volume Left 4 0 32Volume Right 0 55 5cSH 964 1700 301Volume to Capacity 0.00 0.35 0.12Queue Length 95th (ft) 0 0 10Control Delay (s) 0.1 0.0 18.6Lane LOS A CApproach Delay (s) 0.1 0.0 18.6Approach LOS C
Intersection SummaryAverage Delay 0.7Intersection Capacity Utilization 39.7% ICU Level of Service AAnalysis Period (min) 15

HCM Signalized Intersection Capacity Analysis1: Maybank Hwy & Old Maybank Hwy 3/19/2015
Build without Pitchfork without I-526 4/6/2010 2014 Build without Pitchfork without I-526 Synchro 8 ReportPage 1
Movement EBL EBT WBT WBR SBL SBRLane ConfigurationsVolume (vph) 14 989 1372 60 42 15Ideal Flow (vphpl) 1900 1900 1900 1900 1900 1900Total Lost time (s) 6.3 6.3 6.3 6.3 6.0 6.0Lane Util. Factor 1.00 0.95 0.95 1.00 1.00 1.00Frt 1.00 1.00 1.00 0.85 1.00 0.85Flt Protected 0.95 1.00 1.00 1.00 0.95 1.00Satd. Flow (prot) 1770 3539 3539 1583 1770 1583Flt Permitted 0.15 1.00 1.00 1.00 0.95 1.00Satd. Flow (perm) 274 3539 3539 1583 1770 1583Peak-hour factor, PHF 0.90 0.90 0.90 0.90 0.90 0.90Adj. Flow (vph) 16 1099 1524 67 47 17RTOR Reduction (vph) 0 0 0 15 0 16Lane Group Flow (vph) 16 1099 1524 52 47 1Turn Type Perm NA NA Perm Prot PermProtected Phases 2 6 4Permitted Phases 2 6 4Actuated Green, G (s) 62.7 62.7 62.7 62.7 5.7 5.7Effective Green, g (s) 62.7 62.7 62.7 62.7 5.7 5.7Actuated g/C Ratio 0.78 0.78 0.78 0.78 0.07 0.07Clearance Time (s) 6.3 6.3 6.3 6.3 6.0 6.0Vehicle Extension (s) 4.0 4.0 4.0 4.0 4.0 4.0Lane Grp Cap (vph) 212 2749 2749 1229 125 111v/s Ratio Prot 0.31 c0.43 c0.03v/s Ratio Perm 0.06 0.03 0.00v/c Ratio 0.08 0.40 0.55 0.04 0.38 0.01Uniform Delay, d1 2.1 2.9 3.5 2.1 35.8 34.9Progression Factor 1.00 1.00 1.00 1.00 1.00 1.00Incremental Delay, d2 0.7 0.4 0.8 0.1 2.6 0.1Delay (s) 2.8 3.3 4.3 2.1 38.4 34.9Level of Service A A A A D CApproach Delay (s) 3.3 4.2 37.5Approach LOS A A D
Intersection SummaryHCM 2000 Control Delay 4.6 HCM 2000 Level of Service AHCM 2000 Volume to Capacity ratio 0.54Actuated Cycle Length (s) 80.7 Sum of lost time (s) 12.3Intersection Capacity Utilization 54.8% ICU Level of Service AAnalysis Period (min) 15c Critical Lane Group

HCM Signalized Intersection Capacity Analysis5: Maybank Hwy & River Rd 3/19/2015
Build without Pitchfork without I-526 4/6/2010 2014 Build without Pitchfork without I-526 Synchro 8 ReportPage 2
Movement NBL NBT NBR SBL SBT SBR NEL NET NER SWL SWT SWRLane ConfigurationsVolume (vph) 54 116 211 230 107 82 64 570 25 240 734 389Ideal Flow (vphpl) 1900 1900 1900 1900 1900 1900 1900 1900 1900 1900 1900 1900Total Lost time (s) 7.0 7.0 5.5 6.0 7.0 7.0 6.5 6.5 6.5 5.5 6.5 6.0Lane Util. Factor 1.00 1.00 1.00 1.00 1.00 1.00 1.00 1.00 1.00 1.00 1.00 1.00Frt 1.00 1.00 0.85 1.00 1.00 0.85 1.00 1.00 0.85 1.00 1.00 0.85Flt Protected 0.95 1.00 1.00 0.95 1.00 1.00 0.95 1.00 1.00 0.95 1.00 1.00Satd. Flow (prot) 1719 1810 1538 1719 1810 1538 1736 1827 1553 1687 1776 1509Flt Permitted 0.68 1.00 1.00 0.38 1.00 1.00 0.29 1.00 1.00 0.16 1.00 1.00Satd. Flow (perm) 1235 1810 1538 695 1810 1538 529 1827 1553 275 1776 1509Peak-hour factor, PHF 0.88 0.88 0.88 0.92 0.92 0.92 0.95 0.95 0.95 0.94 0.94 0.94Adj. Flow (vph) 61 132 240 250 116 89 67 600 26 255 781 414RTOR Reduction (vph) 0 0 132 0 0 64 0 0 16 0 0 35Lane Group Flow (vph) 61 132 108 250 116 25 67 600 10 255 781 379Heavy Vehicles (%) 5% 5% 5% 5% 5% 5% 4% 4% 4% 7% 7% 7%Turn Type Perm NA pm+ov pm+pt NA Perm Perm NA Perm pm+pt NA pm+ovProtected Phases 4 1 3 8 2 1 6 3Permitted Phases 4 4 8 8 2 2 6 6Actuated Green, G (s) 8.0 8.0 18.2 25.5 25.5 25.5 35.3 35.3 35.3 51.0 51.0 62.5Effective Green, g (s) 8.0 8.0 18.2 25.5 25.5 25.5 35.3 35.3 35.3 51.0 51.0 62.5Actuated g/C Ratio 0.09 0.09 0.20 0.28 0.28 0.28 0.39 0.39 0.39 0.57 0.57 0.69Clearance Time (s) 7.0 7.0 5.5 6.0 7.0 7.0 6.5 6.5 6.5 5.5 6.5 6.0Vehicle Extension (s) 3.0 3.0 3.0 3.0 3.0 3.0 3.0 3.0 3.0 3.0 3.0 3.0Lane Grp Cap (vph) 109 160 311 327 512 435 207 716 609 315 1006 1047v/s Ratio Prot 0.07 0.04 c0.10 0.06 0.33 0.09 c0.44 0.05v/s Ratio Perm 0.05 0.03 c0.12 0.02 0.13 0.01 c0.37 0.20v/c Ratio 0.56 0.82 0.35 0.76 0.23 0.06 0.32 0.84 0.02 0.81 0.78 0.36Uniform Delay, d1 39.3 40.3 30.8 27.3 24.7 23.5 19.0 24.8 16.7 15.7 15.1 5.6Progression Factor 1.00 1.00 1.00 1.00 1.00 1.00 1.00 1.00 1.00 1.00 1.00 1.00Incremental Delay, d2 6.1 27.9 0.7 10.2 0.2 0.1 4.1 11.3 0.1 14.2 5.9 0.2Delay (s) 45.4 68.2 31.5 37.5 24.9 23.6 23.1 36.0 16.8 29.9 21.0 5.8Level of Service D E C D C C C D B C C AApproach Delay (s) 44.6 31.6 34.1 18.2Approach LOS D C C B
Intersection SummaryHCM 2000 Control Delay 27.6 HCM 2000 Level of Service CHCM 2000 Volume to Capacity ratio 0.90Actuated Cycle Length (s) 90.0 Sum of lost time (s) 25.0Intersection Capacity Utilization 78.5% ICU Level of Service DAnalysis Period (min) 15c Critical Lane Group

HCM Unsignalized Intersection Capacity Analysis2: River Rd & Stardust Way 3/19/2015
Build without Pitchfork without I-526 4/6/2010 2014 Build without Pitchfork without I-526 Synchro 8 ReportPage 1
Movement EBL EBR NBL NBT SBT SBRLane ConfigurationsVolume (veh/h) 3 9 19 548 410 5Sign Control Stop Free FreeGrade 0% 0% 0%Peak Hour Factor 0.64 0.64 0.89 0.89 0.88 0.88Hourly flow rate (vph) 5 14 21 616 466 6PedestriansLane Width (ft)Walking Speed (ft/s)Percent BlockageRight turn flare (veh)Median type None NoneMedian storage veh)Upstream signal (ft)pX, platoon unblockedvC, conflicting volume 1127 469 472vC1, stage 1 conf volvC2, stage 2 conf volvCu, unblocked vol 1127 469 472tC, single (s) 6.4 6.2 4.2tC, 2 stage (s)tF (s) 3.5 3.3 2.3p0 queue free % 98 98 98cM capacity (veh/h) 223 597 1055
Direction, Lane # EB 1 NB 1 SB 1Volume Total 19 637 472Volume Left 5 21 0Volume Right 14 0 6cSH 420 1055 1700Volume to Capacity 0.04 0.02 0.28Queue Length 95th (ft) 3 2 0Control Delay (s) 14.0 0.5 0.0Lane LOS B AApproach Delay (s) 14.0 0.5 0.0Approach LOS B
Intersection SummaryAverage Delay 0.5Intersection Capacity Utilization 54.2% ICU Level of Service AAnalysis Period (min) 15

HCM Unsignalized Intersection Capacity Analysis15: Maybank Hwy & Fenwick Hall Allee 3/19/2015
Build without Pitchfork without I-526 4/6/2010 2014 Build without Pitchfork without I-526 Synchro 8 ReportPage 2
Movement EBL EBT EBR WBL WBT WBR NEL NET NER SWL SWT SWRLane ConfigurationsVolume (veh/h) 16 0 10 0 0 0 24 987 0 0 1353 34Sign Control Stop Stop Free FreeGrade 0% 0% 0% 0%Peak Hour Factor 0.78 0.90 0.78 0.90 0.90 0.90 0.90 0.90 0.90 0.90 0.93 0.93Hourly flow rate (vph) 21 0 13 0 0 0 27 1097 0 0 1455 37PedestriansLane Width (ft)Walking Speed (ft/s)Percent BlockageRight turn flare (veh) 3Median type None NoneMedian storage veh)Upstream signal (ft)pX, platoon unblockedvC, conflicting volume 2605 2605 727 1877 2641 1097 1491 1097vC1, stage 1 conf volvC2, stage 2 conf volvCu, unblocked vol 2605 2605 727 1877 2641 1097 1491 1097tC, single (s) 7.5 6.5 6.9 7.5 6.5 6.9 4.2 4.1tC, 2 stage (s)tF (s) 3.5 4.0 3.3 3.5 4.0 3.3 2.2 2.2p0 queue free % 0 100 96 100 100 100 94 100cM capacity (veh/h) 12 23 366 40 22 208 437 632
Direction, Lane # EB 1 NE 1 NE 2 SW 1 SW 2 SW 3Volume Total 33 27 1097 727 727 37Volume Left 21 27 0 0 0 0Volume Right 13 0 0 0 0 37cSH 18 437 1700 1700 1700 1700Volume to Capacity 1.80 0.06 0.65 0.43 0.43 0.02Queue Length 95th (ft) 115 5 0 0 0 0Control Delay (s) 816.4 13.8 0.0 0.0 0.0 0.0Lane LOS F BApproach Delay (s) 816.4 0.3 0.0Approach LOS F
Intersection SummaryAverage Delay 10.4Intersection Capacity Utilization 61.9% ICU Level of Service BAnalysis Period (min) 15

HCM Unsignalized Intersection Capacity Analysis19: Cane Slash Rd & River Rd 3/19/2015
Build without Pitchfork without I-526 4/6/2010 2014 Build without Pitchfork without I-526 Synchro 8 ReportPage 3
Movement NBL NBT SBT SBR NEL NERLane ConfigurationsVolume (veh/h) 4 355 283 39 26 4Sign Control Free Free StopGrade 0% 0% 0%Peak Hour Factor 0.77 0.77 0.97 0.97 0.63 0.63Hourly flow rate (vph) 5 461 292 40 41 6PedestriansLane Width (ft)Walking Speed (ft/s)Percent BlockageRight turn flare (veh)Median type None NoneMedian storage veh)Upstream signal (ft)pX, platoon unblockedvC, conflicting volume 332 783 312vC1, stage 1 conf volvC2, stage 2 conf volvCu, unblocked vol 332 783 312tC, single (s) 4.1 6.4 6.2tC, 2 stage (s)tF (s) 2.2 3.5 3.3p0 queue free % 100 89 99cM capacity (veh/h) 1216 359 726
Direction, Lane # NB 1 SB 1 NE 1Volume Total 466 332 48Volume Left 5 0 41Volume Right 0 40 6cSH 1216 1700 385Volume to Capacity 0.00 0.20 0.12Queue Length 95th (ft) 0 0 10Control Delay (s) 0.1 0.0 15.7Lane LOS A CApproach Delay (s) 0.1 0.0 15.7Approach LOS C
Intersection SummaryAverage Delay 1.0Intersection Capacity Utilization 31.9% ICU Level of Service AAnalysis Period (min) 15

Appendix E: Synchro Results – 2040 No-Build Condition

HCM Signalized Intersection Capacity Analysis1: Maybank Hwy & Old Maybank Hwy 3/19/2015
2040 No Build without I-526 4/6/2010 2040 No Build without I-526 Synchro 8 ReportPage 1
Movement EBL EBT WBT WBR SBL SBRLane ConfigurationsVolume (vph) 19 1296 1629 71 50 18Ideal Flow (vphpl) 1900 1900 1900 1900 1900 1900Total Lost time (s) 6.3 6.3 6.3 6.3 6.0 6.0Lane Util. Factor 1.00 0.95 0.95 1.00 1.00 1.00Frt 1.00 1.00 1.00 0.85 1.00 0.85Flt Protected 0.95 1.00 1.00 1.00 0.95 1.00Satd. Flow (prot) 1770 3539 3539 1583 1770 1583Flt Permitted 0.10 1.00 1.00 1.00 0.95 1.00Satd. Flow (perm) 189 3539 3539 1583 1770 1583Peak-hour factor, PHF 0.90 0.90 0.90 0.90 0.90 0.90Adj. Flow (vph) 21 1440 1810 79 56 20RTOR Reduction (vph) 0 0 0 16 0 19Lane Group Flow (vph) 21 1440 1810 63 56 1Turn Type Perm NA NA Perm Prot PermProtected Phases 2 6 4Permitted Phases 2 6 4Actuated Green, G (s) 65.3 65.3 65.3 65.3 4.8 4.8Effective Green, g (s) 65.3 65.3 65.3 65.3 4.8 4.8Actuated g/C Ratio 0.79 0.79 0.79 0.79 0.06 0.06Clearance Time (s) 6.3 6.3 6.3 6.3 6.0 6.0Vehicle Extension (s) 4.0 4.0 4.0 4.0 4.0 4.0Lane Grp Cap (vph) 149 2804 2804 1254 103 92v/s Ratio Prot 0.41 c0.51 c0.03v/s Ratio Perm 0.11 0.04 0.00v/c Ratio 0.14 0.51 0.65 0.05 0.54 0.01Uniform Delay, d1 2.0 3.0 3.6 1.8 37.7 36.6Progression Factor 1.00 1.00 1.00 1.00 1.00 1.00Incremental Delay, d2 2.0 0.7 1.2 0.1 7.2 0.1Delay (s) 4.0 3.7 4.8 1.9 44.9 36.6Level of Service A A A A D DApproach Delay (s) 3.7 4.7 42.7Approach LOS A A D
Intersection SummaryHCM 2000 Control Delay 5.1 HCM 2000 Level of Service AHCM 2000 Volume to Capacity ratio 0.64Actuated Cycle Length (s) 82.4 Sum of lost time (s) 12.3Intersection Capacity Utilization 61.9% ICU Level of Service BAnalysis Period (min) 15c Critical Lane Group

HCM Signalized Intersection Capacity Analysis5: Maybank Hwy & River Rd 3/19/2015
2040 No Build without I-526 4/6/2010 2040 No Build without I-526 Synchro 8 ReportPage 2
Movement NBL NBT NBR SBL SBT SBR NEL NET NER SWL SWT SWRLane ConfigurationsVolume (vph) 75 161 292 267 125 95 86 766 34 285 872 462Ideal Flow (vphpl) 1900 1900 1900 1900 1900 1900 1900 1900 1900 1900 1900 1900Lane Width 12 12 12 12 12 12 12 12 12 11 11 11Total Lost time (s) 7.0 7.0 5.5 6.0 7.0 6.5 6.5 5.5 6.5 6.5Lane Util. Factor 1.00 1.00 1.00 1.00 1.00 1.00 1.00 1.00 1.00 1.00Frt 1.00 1.00 0.85 1.00 0.94 1.00 0.99 1.00 1.00 0.85Flt Protected 0.95 1.00 1.00 0.95 1.00 0.95 1.00 0.95 1.00 1.00Satd. Flow (prot) 1719 1810 1538 1719 1693 1736 1815 1631 1717 1459Flt Permitted 0.61 1.00 1.00 0.24 1.00 0.20 1.00 0.07 1.00 1.00Satd. Flow (perm) 1104 1810 1538 437 1693 365 1815 118 1717 1459Peak-hour factor, PHF 0.88 0.88 0.88 0.92 0.92 0.92 0.95 0.95 0.95 0.94 0.94 0.94Adj. Flow (vph) 85 183 332 290 136 103 91 806 36 303 928 491RTOR Reduction (vph) 0 0 72 0 23 0 0 1 0 0 0 186Lane Group Flow (vph) 85 183 260 290 216 0 91 841 0 303 928 305Heavy Vehicles (%) 5% 5% 5% 5% 5% 5% 4% 4% 4% 7% 7% 7%Turn Type Perm NA pm+ov pm+pt NA Perm NA pm+pt NA PermProtected Phases 4 1 3 8 2 1 6Permitted Phases 4 4 8 2 6 6Actuated Green, G (s) 12.0 12.0 28.5 32.0 32.0 52.5 52.5 74.5 74.5 74.5Effective Green, g (s) 12.0 12.0 28.5 32.0 32.0 52.5 52.5 74.5 74.5 74.5Actuated g/C Ratio 0.10 0.10 0.24 0.27 0.27 0.44 0.44 0.62 0.62 0.62Clearance Time (s) 7.0 7.0 5.5 6.0 7.0 6.5 6.5 5.5 6.5 6.5Vehicle Extension (s) 3.0 3.0 3.0 3.0 3.0 3.0 3.0 3.0 3.0 3.0Lane Grp Cap (vph) 110 181 365 266 451 159 794 281 1065 905v/s Ratio Prot 0.10 0.10 c0.13 0.13 0.46 c0.15 0.54v/s Ratio Perm 0.08 0.07 c0.16 0.25 c0.52 0.21v/c Ratio 0.77 1.01 0.71 1.09 0.48 0.57 1.06 1.08 0.87 0.34Uniform Delay, d1 52.7 54.0 42.0 40.3 37.0 25.3 33.8 40.4 18.8 10.9Progression Factor 1.00 1.00 1.00 1.00 1.00 1.00 1.00 1.00 1.00 1.00Incremental Delay, d2 27.9 69.8 6.5 81.4 0.8 14.1 48.7 76.1 9.8 1.0Delay (s) 80.6 123.8 48.5 121.7 37.8 39.4 82.5 116.5 28.6 11.9Level of Service F F D F D D F F C BApproach Delay (s) 76.0 83.8 78.3 39.3Approach LOS E F E D
Intersection SummaryHCM 2000 Control Delay 60.9 HCM 2000 Level of Service EHCM 2000 Volume to Capacity ratio 1.15Actuated Cycle Length (s) 120.0 Sum of lost time (s) 25.0Intersection Capacity Utilization 102.3% ICU Level of Service GAnalysis Period (min) 15c Critical Lane Group

HCM Unsignalized Intersection Capacity Analysis2: River Rd & Stardust Way 3/19/2015
2040 No Build without I-526 4/6/2010 2040 No Build without I-526 Synchro 8 ReportPage 1
Movement EBL EBR NBL NBT SBT SBRLane ConfigurationsVolume (veh/h) 4 11 30 679 476 6Sign Control Stop Free FreeGrade 0% 0% 0%Peak Hour Factor 0.64 0.64 0.89 0.89 0.88 0.88Hourly flow rate (vph) 6 17 34 763 541 7PedestriansLane Width (ft)Walking Speed (ft/s)Percent BlockageRight turn flare (veh)Median type None NoneMedian storage veh)Upstream signal (ft)pX, platoon unblockedvC, conflicting volume 1375 544 548vC1, stage 1 conf volvC2, stage 2 conf volvCu, unblocked vol 1375 544 548tC, single (s) 6.4 6.2 4.2tC, 2 stage (s)tF (s) 3.5 3.3 2.3p0 queue free % 96 97 97cM capacity (veh/h) 156 541 987
Direction, Lane # EB 1 NB 1 SB 1Volume Total 23 797 548Volume Left 6 34 0Volume Right 17 0 7cSH 326 987 1700Volume to Capacity 0.07 0.03 0.32Queue Length 95th (ft) 6 3 0Control Delay (s) 16.9 0.9 0.0Lane LOS C AApproach Delay (s) 16.9 0.9 0.0Approach LOS C
Intersection SummaryAverage Delay 0.8Intersection Capacity Utilization 70.1% ICU Level of Service CAnalysis Period (min) 15

HCM Unsignalized Intersection Capacity Analysis15: Maybank Hwy & Fenwick Hall Allee 3/19/2015
2040 No Build without I-526 4/6/2010 2040 No Build without I-526 Synchro 8 ReportPage 2
Movement EBL EBR EBR2 NWL NWR NEL NET NER SWL SWT SWRLane ConfigurationsVolume (veh/h) 20 0 13 0 0 31 1294 0 0 1607 40Sign Control Stop Stop Free FreeGrade 0% 0% 0% 0%Peak Hour Factor 0.78 0.90 0.78 0.90 0.90 0.90 0.90 0.90 0.90 0.93 0.93Hourly flow rate (vph) 26 0 17 0 0 34 1438 0 0 1728 43PedestriansLane Width (ft)Walking Speed (ft/s)Percent BlockageRight turn flare (veh) 3 3Median type None NoneMedian storage veh)Upstream signal (ft)pX, platoon unblockedvC, conflicting volume 3235 3235 1728 3278 1438 1771 1438vC1, stage 1 conf volvC2, stage 2 conf volvCu, unblocked vol 3235 3235 1728 3278 1438 1771 1438tC, single (s) 7.1 6.5 6.2 6.5 6.2 4.1 4.1tC, 2 stage (s)tF (s) 3.5 4.0 3.3 4.0 3.3 2.2 2.2p0 queue free % 0 100 85 100 100 90 100cM capacity (veh/h) 5 9 110 8 163 346 472
Direction, Lane # EB 1 NE 1 NE 2 SW 1 SW 2Volume Total 42 34 1438 1728 43Volume Left 26 34 0 0 0Volume Right 17 0 0 0 43cSH 8 346 1700 1700 1700Volume to Capacity 5.06 0.10 0.85 1.02 0.03Queue Length 95th (ft) Err 8 0 0 0Control Delay (s) Err 16.5 0.0 0.0 0.0Lane LOS F CApproach Delay (s) Err 0.4 0.0Approach LOS F
Intersection SummaryAverage Delay 128.9Intersection Capacity Utilization 94.6% ICU Level of Service FAnalysis Period (min) 15

HCM Unsignalized Intersection Capacity Analysis19: Cane Slash Rd & River Rd 3/19/2015
2040 No Build without I-526 4/6/2010 2040 No Build without I-526 Synchro 8 ReportPage 3
Movement NBL NBT SBT SBR NEL NERLane ConfigurationsVolume (veh/h) 4 409 239 8 53 13Sign Control Free Free StopGrade 0% 0% 0%Peak Hour Factor 0.77 0.77 0.97 0.97 0.63 0.63Hourly flow rate (vph) 5 531 246 8 84 21PedestriansLane Width (ft)Walking Speed (ft/s)Percent BlockageRight turn flare (veh)Median type None NoneMedian storage veh)Upstream signal (ft)pX, platoon unblockedvC, conflicting volume 255 792 251vC1, stage 1 conf volvC2, stage 2 conf volvCu, unblocked vol 255 792 251tC, single (s) 4.1 6.4 6.2tC, 2 stage (s)tF (s) 2.2 3.5 3.3p0 queue free % 100 76 97cM capacity (veh/h) 1299 355 786
Direction, Lane # NB 1 SB 1 NE 1Volume Total 536 255 105Volume Left 5 0 84Volume Right 0 8 21cSH 1299 1700 398Volume to Capacity 0.00 0.15 0.26Queue Length 95th (ft) 0 0 26Control Delay (s) 0.1 0.0 17.2Lane LOS A CApproach Delay (s) 0.1 0.0 17.2Approach LOS C
Intersection SummaryAverage Delay 2.1Intersection Capacity Utilization 35.1% ICU Level of Service AAnalysis Period (min) 15

HCM Signalized Intersection Capacity Analysis1: Maybank Hwy & Old Maybank Hwy 3/19/2015
2040 No Build with I-526 4/6/2010 2040 No Build with I-526 Synchro 8 ReportPage 1
Movement EBL EBT WBT WBR SBL SBRLane ConfigurationsVolume (vph) 14 972 482 21 5 20Ideal Flow (vphpl) 1900 1900 1900 1900 1900 1900Total Lost time (s) 6.3 6.3 6.3 6.3 6.0 6.0Lane Util. Factor 1.00 0.95 0.95 1.00 1.00 1.00Frt 1.00 1.00 1.00 0.85 1.00 0.85Flt Protected 0.95 1.00 1.00 1.00 0.95 1.00Satd. Flow (prot) 1770 3539 3539 1583 1770 1583Flt Permitted 0.45 1.00 1.00 1.00 0.95 1.00Satd. Flow (perm) 843 3539 3539 1583 1770 1583Peak-hour factor, PHF 0.90 0.90 0.90 0.90 0.90 0.90Adj. Flow (vph) 16 1080 536 23 6 22RTOR Reduction (vph) 0 0 0 4 0 21Lane Group Flow (vph) 16 1080 536 19 6 1Turn Type Perm NA NA Perm Prot PermProtected Phases 2 6 4Permitted Phases 2 6 4Actuated Green, G (s) 65.7 65.7 65.7 65.7 3.3 3.3Effective Green, g (s) 65.7 65.7 65.7 65.7 3.3 3.3Actuated g/C Ratio 0.81 0.81 0.81 0.81 0.04 0.04Clearance Time (s) 6.3 6.3 6.3 6.3 6.0 6.0Vehicle Extension (s) 4.0 4.0 4.0 4.0 4.0 4.0Lane Grp Cap (vph) 681 2859 2859 1279 71 64v/s Ratio Prot c0.31 0.15 c0.00v/s Ratio Perm 0.02 0.01 0.00v/c Ratio 0.02 0.38 0.19 0.01 0.08 0.01Uniform Delay, d1 1.5 2.2 1.8 1.5 37.5 37.4Progression Factor 1.00 1.00 1.00 1.00 1.00 1.00Incremental Delay, d2 0.1 0.4 0.1 0.0 0.7 0.1Delay (s) 1.6 2.5 1.9 1.5 38.2 37.6Level of Service A A A A D DApproach Delay (s) 2.5 1.9 37.7Approach LOS A A D
Intersection SummaryHCM 2000 Control Delay 2.9 HCM 2000 Level of Service AHCM 2000 Volume to Capacity ratio 0.36Actuated Cycle Length (s) 81.3 Sum of lost time (s) 12.3Intersection Capacity Utilization 43.8% ICU Level of Service AAnalysis Period (min) 15c Critical Lane Group

HCM Signalized Intersection Capacity Analysis5: Maybank Hwy & River Rd 3/19/2015
2040 No Build with I-526 4/6/2010 2040 No Build with I-526 Synchro 8 ReportPage 2
Movement NBL NBT NBR SBL SBT SBR NEL NET NER SWL SWT SWRLane ConfigurationsVolume (vph) 290 227 494 193 296 819 378 301 150 118 284 92Ideal Flow (vphpl) 1900 1900 1900 1900 1900 1900 1900 1900 1900 1900 1900 1900Total Lost time (s) 6.0 7.0 5.5 6.0 7.0 7.0 6.0 6.5 6.5 5.5 6.5 6.0Lane Util. Factor 1.00 1.00 1.00 1.00 1.00 1.00 1.00 1.00 1.00 1.00 1.00 1.00Frt 1.00 1.00 0.85 1.00 1.00 0.85 1.00 1.00 0.85 1.00 1.00 0.85Flt Protected 0.95 1.00 1.00 0.95 1.00 1.00 0.95 1.00 1.00 0.95 1.00 1.00Satd. Flow (prot) 1719 1810 1538 1719 1810 1538 1736 1827 1553 1687 1776 1509Flt Permitted 0.49 1.00 1.00 0.54 1.00 1.00 0.15 1.00 1.00 0.46 1.00 1.00Satd. Flow (perm) 882 1810 1538 978 1810 1538 267 1827 1553 820 1776 1509Peak-hour factor, PHF 0.88 0.88 0.88 0.92 0.92 0.92 0.95 0.95 0.95 0.94 0.94 0.94Adj. Flow (vph) 330 258 561 210 322 890 398 317 158 126 302 98RTOR Reduction (vph) 0 0 143 0 0 197 0 0 121 0 0 75Lane Group Flow (vph) 330 258 418 210 322 693 398 317 37 126 302 23Heavy Vehicles (%) 5% 5% 5% 5% 5% 5% 4% 4% 4% 7% 7% 7%Turn Type pm+pt NA pm+ov pm+pt NA Perm pm+pt NA Perm pm+pt NA pm+ovProtected Phases 7 4 1 3 8 5 2 1 6 3Permitted Phases 4 4 8 8 2 2 6 6Actuated Green, G (s) 83.0 70.0 76.0 84.2 70.6 70.6 46.9 35.4 35.4 27.4 21.4 35.0Effective Green, g (s) 83.0 70.0 76.0 84.2 70.6 70.6 46.9 35.4 35.4 27.4 21.4 35.0Actuated g/C Ratio 0.55 0.47 0.51 0.56 0.47 0.47 0.31 0.24 0.24 0.18 0.14 0.23Clearance Time (s) 6.0 7.0 5.5 6.0 7.0 7.0 6.0 6.5 6.5 5.5 6.5 6.0Vehicle Extension (s) 3.0 3.0 3.0 3.0 3.0 3.0 3.0 3.0 3.0 3.0 3.0 3.0Lane Grp Cap (vph) 560 844 779 616 851 723 274 431 366 184 253 352v/s Ratio Prot c0.05 0.14 0.02 0.03 0.18 c0.19 0.17 0.03 0.17 0.01v/s Ratio Perm 0.27 0.25 0.16 c0.45 c0.27 0.02 0.10 0.01v/c Ratio 0.59 0.31 0.54 0.34 0.38 0.96 1.45 0.74 0.10 0.68 1.19 0.06Uniform Delay, d1 20.3 24.9 25.1 16.6 25.6 38.3 44.8 53.0 44.9 56.2 64.3 44.8Progression Factor 1.00 1.00 1.00 1.00 1.00 1.00 1.00 1.00 1.00 1.00 1.00 1.00Incremental Delay, d2 1.6 0.2 0.7 0.3 0.3 23.5 222.9 10.7 0.6 10.1 119.2 0.1Delay (s) 21.9 25.1 25.8 17.0 25.9 61.8 267.7 63.6 45.4 66.2 183.5 44.8Level of Service C C C B C E F E D E F DApproach Delay (s) 24.5 47.0 153.4 129.6Approach LOS C D F F
Intersection SummaryHCM 2000 Control Delay 74.8 HCM 2000 Level of Service EHCM 2000 Volume to Capacity ratio 1.12Actuated Cycle Length (s) 150.0 Sum of lost time (s) 25.5Intersection Capacity Utilization 98.0% ICU Level of Service FAnalysis Period (min) 15c Critical Lane Group

HCM Unsignalized Intersection Capacity Analysis2: River Rd & Stardust Way 3/19/2015
2040 No Build with I-526 4/6/2010 2040 No Build with I-526 Synchro 8 ReportPage 1
Movement EBL EBR NBL NBT SBT SBRLane ConfigurationsVolume (veh/h) 4 12 29 667 1296 4Sign Control Stop Free FreeGrade 0% 0% 0%Peak Hour Factor 0.64 0.64 0.89 0.89 0.88 0.88Hourly flow rate (vph) 6 19 33 749 1473 5PedestriansLane Width (ft)Walking Speed (ft/s)Percent BlockageRight turn flare (veh)Median type None NoneMedian storage veh)Upstream signal (ft)pX, platoon unblockedvC, conflicting volume 2290 1475 1477vC1, stage 1 conf volvC2, stage 2 conf volvCu, unblocked vol 2290 1475 1477tC, single (s) 6.4 6.2 4.2tC, 2 stage (s)tF (s) 3.5 3.3 2.3p0 queue free % 84 88 93cM capacity (veh/h) 40 156 435
Direction, Lane # EB 1 NB 1 SB 1Volume Total 25 782 1477Volume Left 6 33 0Volume Right 19 0 5cSH 91 435 1700Volume to Capacity 0.28 0.07 0.87Queue Length 95th (ft) 25 6 0Control Delay (s) 59.1 2.4 0.0Lane LOS F AApproach Delay (s) 59.1 2.4 0.0Approach LOS F
Intersection SummaryAverage Delay 1.5Intersection Capacity Utilization 78.5% ICU Level of Service DAnalysis Period (min) 15

HCM Unsignalized Intersection Capacity Analysis15: Maybank Hwy & Fenwick Hall Allee 3/19/2015
2040 No Build with I-526 4/6/2010 2040 No Build with I-526 Synchro 8 ReportPage 2
Movement EBL EBT EBR WBL WBT WBR NEL NET NER SWL SWT SWRLane ConfigurationsVolume (veh/h) 24 0 10 0 0 0 26 961 0 0 489 17Sign Control Stop Stop Free FreeGrade 0% 0% 0% 0%Peak Hour Factor 0.78 0.90 0.78 0.90 0.90 0.90 0.90 0.90 0.90 0.90 0.93 0.93Hourly flow rate (vph) 31 0 13 0 0 0 29 1068 0 0 526 18PedestriansLane Width (ft)Walking Speed (ft/s)Percent BlockageRight turn flare (veh) 3Median type None NoneMedian storage veh)Upstream signal (ft)pX, platoon unblockedvC, conflicting volume 1651 1651 526 1658 1670 1068 544 1068vC1, stage 1 conf volvC2, stage 2 conf volvCu, unblocked vol 1651 1651 526 1658 1670 1068 544 1068tC, single (s) 7.1 6.5 6.2 7.1 6.5 6.2 4.1 4.1tC, 2 stage (s)tF (s) 3.5 4.0 3.3 3.5 4.0 3.3 2.2 2.2p0 queue free % 60 100 98 100 100 100 97 100cM capacity (veh/h) 77 96 552 74 93 269 1015 653
Direction, Lane # EB 1 NE 1 NE 2 SW 1 SW 2Volume Total 44 29 1068 526 18Volume Left 31 29 0 0 0Volume Right 13 0 0 0 18cSH 109 1015 1700 1700 1700Volume to Capacity 0.40 0.03 0.63 0.31 0.01Queue Length 95th (ft) 42 2 0 0 0Control Delay (s) 59.9 8.7 0.0 0.0 0.0Lane LOS F AApproach Delay (s) 59.9 0.2 0.0Approach LOS F
Intersection SummaryAverage Delay 1.7Intersection Capacity Utilization 60.6% ICU Level of Service BAnalysis Period (min) 15

HCM Unsignalized Intersection Capacity Analysis19: Cane Slash Rd & River Rd 3/19/2015
2040 No Build with I-526 4/6/2010 2040 No Build with I-526 Synchro 8 ReportPage 3
Movement NBL NBT SBT SBR NEL NERLane ConfigurationsVolume (veh/h) 22 980 511 53 30 9Sign Control Free Free StopGrade 0% 0% 0%Peak Hour Factor 0.77 0.77 0.97 0.97 0.63 0.63Hourly flow rate (vph) 29 1273 527 55 48 14PedestriansLane Width (ft)Walking Speed (ft/s)Percent BlockageRight turn flare (veh)Median type None NoneMedian storage veh)Upstream signal (ft)pX, platoon unblockedvC, conflicting volume 581 1884 554vC1, stage 1 conf volvC2, stage 2 conf volvCu, unblocked vol 581 1884 554tC, single (s) 4.1 6.4 6.2tC, 2 stage (s)tF (s) 2.2 3.5 3.3p0 queue free % 97 37 97cM capacity (veh/h) 983 75 530
Direction, Lane # NB 1 SB 1 NE 1Volume Total 1301 581 62Volume Left 29 0 48Volume Right 0 55 14cSH 983 1700 94Volume to Capacity 0.03 0.34 0.66Queue Length 95th (ft) 2 0 81Control Delay (s) 1.2 0.0 98.6Lane LOS A FApproach Delay (s) 1.2 0.0 98.6Approach LOS F
Intersection SummaryAverage Delay 3.9Intersection Capacity Utilization 79.2% ICU Level of Service DAnalysis Period (min) 15

Appendix F: Synchro Results – 2040 Build
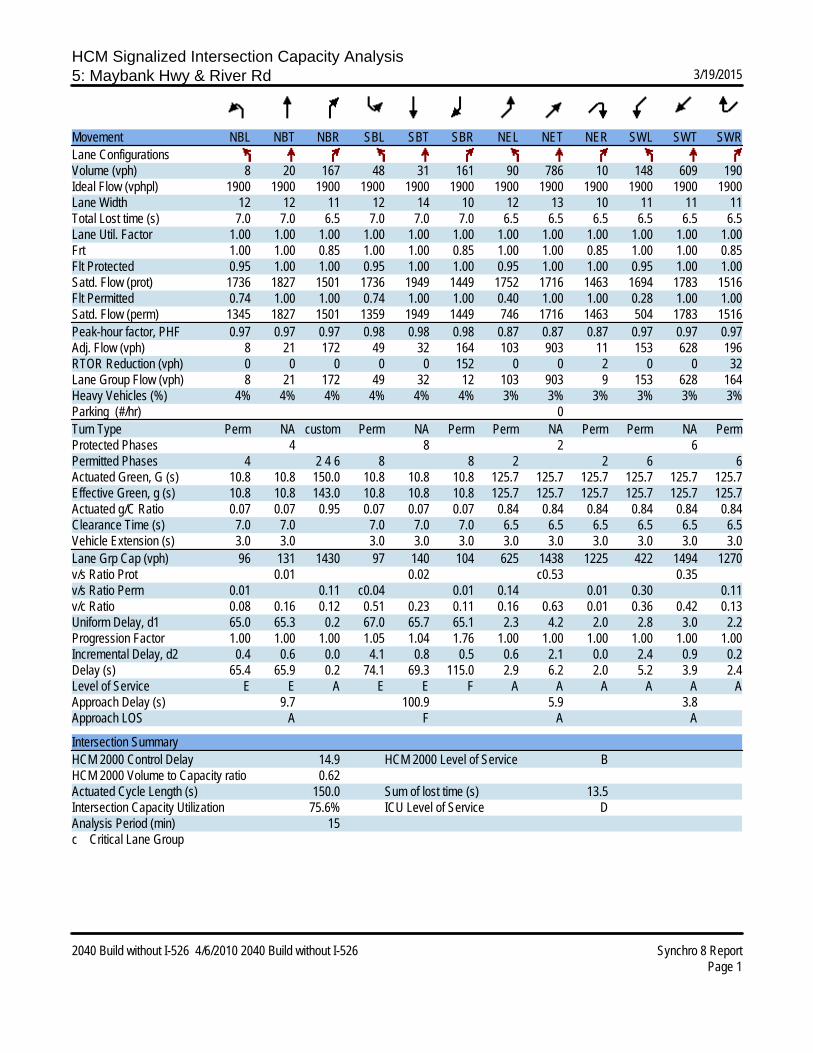
HCM Signalized Intersection Capacity Analysis5: Maybank Hwy & River Rd 3/19/2015
2040 Build without I-526 4/6/2010 2040 Build without I-526 Synchro 8 ReportPage 1
Movement NBL NBT NBR SBL SBT SBR NEL NET NER SWL SWT SWRLane ConfigurationsVolume (vph) 8 20 167 48 31 161 90 786 10 148 609 190Ideal Flow (vphpl) 1900 1900 1900 1900 1900 1900 1900 1900 1900 1900 1900 1900Lane Width 12 12 11 12 14 10 12 13 10 11 11 11Total Lost time (s) 7.0 7.0 6.5 7.0 7.0 7.0 6.5 6.5 6.5 6.5 6.5 6.5Lane Util. Factor 1.00 1.00 1.00 1.00 1.00 1.00 1.00 1.00 1.00 1.00 1.00 1.00Frt 1.00 1.00 0.85 1.00 1.00 0.85 1.00 1.00 0.85 1.00 1.00 0.85Flt Protected 0.95 1.00 1.00 0.95 1.00 1.00 0.95 1.00 1.00 0.95 1.00 1.00Satd. Flow (prot) 1736 1827 1501 1736 1949 1449 1752 1716 1463 1694 1783 1516Flt Permitted 0.74 1.00 1.00 0.74 1.00 1.00 0.40 1.00 1.00 0.28 1.00 1.00Satd. Flow (perm) 1345 1827 1501 1359 1949 1449 746 1716 1463 504 1783 1516Peak-hour factor, PHF 0.97 0.97 0.97 0.98 0.98 0.98 0.87 0.87 0.87 0.97 0.97 0.97Adj. Flow (vph) 8 21 172 49 32 164 103 903 11 153 628 196RTOR Reduction (vph) 0 0 0 0 0 152 0 0 2 0 0 32Lane Group Flow (vph) 8 21 172 49 32 12 103 903 9 153 628 164Heavy Vehicles (%) 4% 4% 4% 4% 4% 4% 3% 3% 3% 3% 3% 3%Parking (#/hr) 0Turn Type Perm NA custom Perm NA Perm Perm NA Perm Perm NA PermProtected Phases 4 8 2 6Permitted Phases 4 2 4 6 8 8 2 2 6 6Actuated Green, G (s) 10.8 10.8 150.0 10.8 10.8 10.8 125.7 125.7 125.7 125.7 125.7 125.7Effective Green, g (s) 10.8 10.8 143.0 10.8 10.8 10.8 125.7 125.7 125.7 125.7 125.7 125.7Actuated g/C Ratio 0.07 0.07 0.95 0.07 0.07 0.07 0.84 0.84 0.84 0.84 0.84 0.84Clearance Time (s) 7.0 7.0 7.0 7.0 7.0 6.5 6.5 6.5 6.5 6.5 6.5Vehicle Extension (s) 3.0 3.0 3.0 3.0 3.0 3.0 3.0 3.0 3.0 3.0 3.0Lane Grp Cap (vph) 96 131 1430 97 140 104 625 1438 1225 422 1494 1270v/s Ratio Prot 0.01 0.02 c0.53 0.35v/s Ratio Perm 0.01 0.11 c0.04 0.01 0.14 0.01 0.30 0.11v/c Ratio 0.08 0.16 0.12 0.51 0.23 0.11 0.16 0.63 0.01 0.36 0.42 0.13Uniform Delay, d1 65.0 65.3 0.2 67.0 65.7 65.1 2.3 4.2 2.0 2.8 3.0 2.2Progression Factor 1.00 1.00 1.00 1.05 1.04 1.76 1.00 1.00 1.00 1.00 1.00 1.00Incremental Delay, d2 0.4 0.6 0.0 4.1 0.8 0.5 0.6 2.1 0.0 2.4 0.9 0.2Delay (s) 65.4 65.9 0.2 74.1 69.3 115.0 2.9 6.2 2.0 5.2 3.9 2.4Level of Service E E A E E F A A A A A AApproach Delay (s) 9.7 100.9 5.9 3.8Approach LOS A F A A
Intersection SummaryHCM 2000 Control Delay 14.9 HCM 2000 Level of Service BHCM 2000 Volume to Capacity ratio 0.62Actuated Cycle Length (s) 150.0 Sum of lost time (s) 13.5Intersection Capacity Utilization 75.6% ICU Level of Service DAnalysis Period (min) 15c Critical Lane Group

HCM Signalized Intersection Capacity Analysis9: Maybank Hwy & Old Maybank Hwy 3/19/2015
2040 Build without I-526 4/6/2010 2040 Build without I-526 Synchro 8 ReportPage 2
Movement EBL EBT WBT WBR SBL SBRLane ConfigurationsVolume (vph) 29 2037 1800 79 54 19Ideal Flow (vphpl) 1900 1900 1900 1900 1900 1900Total Lost time (s) 6.3 6.3 6.3 6.3 6.0 6.0Lane Util. Factor 1.00 0.95 0.95 1.00 1.00 1.00Frt 1.00 1.00 1.00 0.85 1.00 0.85Flt Protected 0.95 1.00 1.00 1.00 0.95 1.00Satd. Flow (prot) 1770 3539 3539 1583 1770 1583Flt Permitted 0.07 1.00 1.00 1.00 0.95 1.00Satd. Flow (perm) 132 3539 3539 1583 1770 1583Peak-hour factor, PHF 0.90 0.90 0.90 0.90 0.90 0.90Adj. Flow (vph) 32 2263 2000 88 60 21RTOR Reduction (vph) 0 0 0 20 0 19Lane Group Flow (vph) 32 2263 2000 68 60 2Turn Type Perm NA NA Perm Prot PermProtected Phases 2 6 4Permitted Phases 2 6 4Actuated Green, G (s) 62.7 62.7 62.7 62.7 6.4 6.4Effective Green, g (s) 62.7 62.7 62.7 62.7 6.4 6.4Actuated g/C Ratio 0.77 0.77 0.77 0.77 0.08 0.08Clearance Time (s) 6.3 6.3 6.3 6.3 6.0 6.0Vehicle Extension (s) 3.0 3.0 3.0 3.0 3.0 3.0Lane Grp Cap (vph) 101 2725 2725 1219 139 124v/s Ratio Prot c0.64 0.57 c0.03v/s Ratio Perm 0.24 0.04 0.00v/c Ratio 0.32 0.83 0.73 0.06 0.43 0.01Uniform Delay, d1 2.8 6.0 4.9 2.2 35.8 34.6Progression Factor 1.00 1.00 1.00 1.00 1.00 1.00Incremental Delay, d2 8.1 3.1 1.8 0.1 2.1 0.0Delay (s) 10.9 9.1 6.7 2.3 37.9 34.6Level of Service B A A A D CApproach Delay (s) 9.1 6.6 37.1Approach LOS A A D
Intersection SummaryHCM 2000 Control Delay 8.4 HCM 2000 Level of Service AHCM 2000 Volume to Capacity ratio 0.79Actuated Cycle Length (s) 81.4 Sum of lost time (s) 12.3Intersection Capacity Utilization 73.2% ICU Level of Service DAnalysis Period (min) 15c Critical Lane Group

HCM Signalized Intersection Capacity Analysis11: S Pitchfork Rd #1 & Maybank Hwy 3/19/2015
2040 Build without I-526 4/6/2010 2040 Build without I-526 Synchro 8 ReportPage 3
Movement EBT EBR WBL WBT NBL NBRLane ConfigurationsVolume (vph) 1518 5 559 1260 2 548Ideal Flow (vphpl) 1900 1900 1900 1900 1900 1900Lane Width 12 12 12 12 10 10Total Lost time (s) 6.0 6.0 6.0 6.0 4.0Lane Util. Factor 0.95 1.00 0.95 1.00 1.00Frt 1.00 1.00 1.00 1.00 0.85Flt Protected 1.00 0.95 1.00 0.95 1.00Satd. Flow (prot) 3537 1770 3539 1652 1286Flt Permitted 1.00 0.05 1.00 0.95 1.00Satd. Flow (perm) 3537 99 3539 1652 1286Peak-hour factor, PHF 0.90 0.90 0.90 0.90 0.90 0.90Adj. Flow (vph) 1687 6 621 1400 2 609RTOR Reduction (vph) 0 0 0 0 0 0Lane Group Flow (vph) 1693 0 621 1400 2 609Parking (#/hr) 6Turn Type NA pm+pt NA Prot FreeProtected Phases 4 3 8 2Permitted Phases 8 FreeActuated Green, G (s) 69.0 121.0 121.0 5.8 138.8Effective Green, g (s) 69.0 121.0 121.0 5.8 138.8Actuated g/C Ratio 0.50 0.87 0.87 0.04 1.00Clearance Time (s) 6.0 6.0 6.0 6.0Vehicle Extension (s) 3.0 3.0 3.0 3.0Lane Grp Cap (vph) 1758 640 3085 69 1286v/s Ratio Prot 0.48 c0.32 0.40 0.00v/s Ratio Perm c0.52 c0.47v/c Ratio 0.96 0.97 0.45 0.03 0.47Uniform Delay, d1 33.7 41.9 1.9 63.8 0.0Progression Factor 1.00 1.00 1.00 1.00 1.00Incremental Delay, d2 13.7 28.2 0.1 0.2 1.3Delay (s) 47.4 70.1 2.0 64.0 1.3Level of Service D E A E AApproach Delay (s) 47.4 22.9 1.5Approach LOS D C A
Intersection SummaryHCM 2000 Control Delay 29.5 HCM 2000 Level of Service CHCM 2000 Volume to Capacity ratio 0.99Actuated Cycle Length (s) 138.8 Sum of lost time (s) 18.0Intersection Capacity Utilization 91.4% ICU Level of Service FAnalysis Period (min) 15c Critical Lane Group
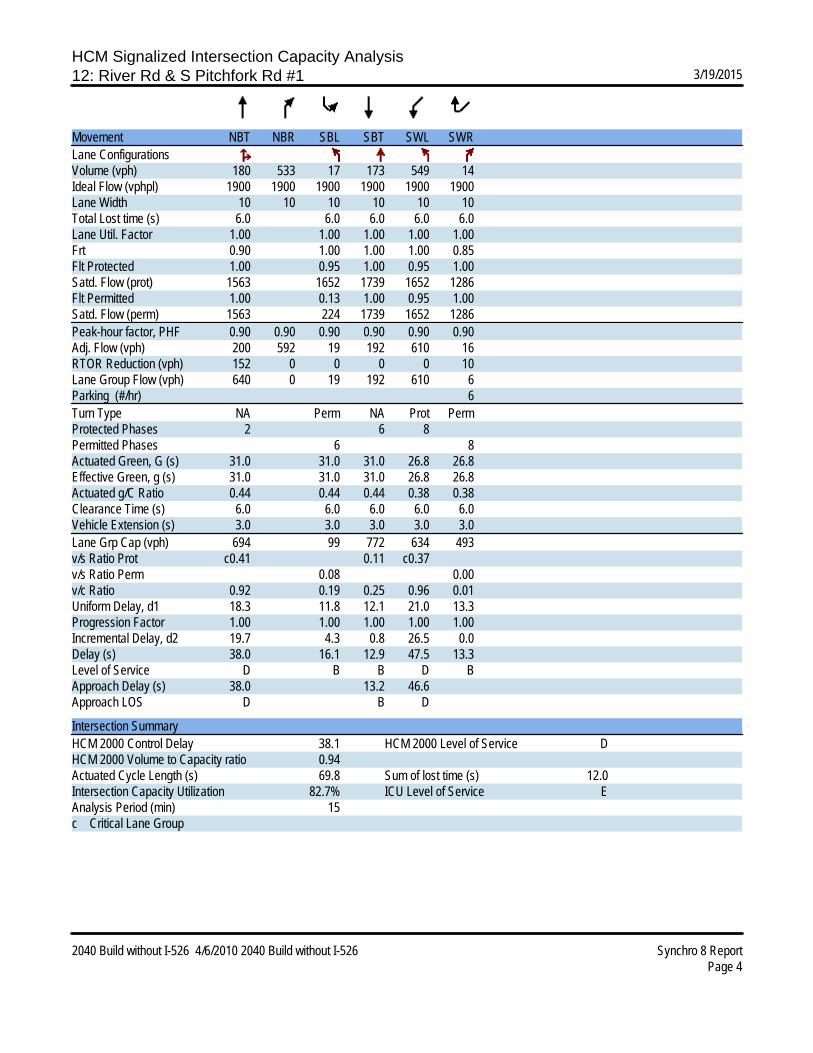
HCM Signalized Intersection Capacity Analysis12: River Rd & S Pitchfork Rd #1 3/19/2015
2040 Build without I-526 4/6/2010 2040 Build without I-526 Synchro 8 ReportPage 4
Movement NBT NBR SBL SBT SWL SWRLane ConfigurationsVolume (vph) 180 533 17 173 549 14Ideal Flow (vphpl) 1900 1900 1900 1900 1900 1900Lane Width 10 10 10 10 10 10Total Lost time (s) 6.0 6.0 6.0 6.0 6.0Lane Util. Factor 1.00 1.00 1.00 1.00 1.00Frt 0.90 1.00 1.00 1.00 0.85Flt Protected 1.00 0.95 1.00 0.95 1.00Satd. Flow (prot) 1563 1652 1739 1652 1286Flt Permitted 1.00 0.13 1.00 0.95 1.00Satd. Flow (perm) 1563 224 1739 1652 1286Peak-hour factor, PHF 0.90 0.90 0.90 0.90 0.90 0.90Adj. Flow (vph) 200 592 19 192 610 16RTOR Reduction (vph) 152 0 0 0 0 10Lane Group Flow (vph) 640 0 19 192 610 6Parking (#/hr) 6Turn Type NA Perm NA Prot PermProtected Phases 2 6 8Permitted Phases 6 8Actuated Green, G (s) 31.0 31.0 31.0 26.8 26.8Effective Green, g (s) 31.0 31.0 31.0 26.8 26.8Actuated g/C Ratio 0.44 0.44 0.44 0.38 0.38Clearance Time (s) 6.0 6.0 6.0 6.0 6.0Vehicle Extension (s) 3.0 3.0 3.0 3.0 3.0Lane Grp Cap (vph) 694 99 772 634 493v/s Ratio Prot c0.41 0.11 c0.37v/s Ratio Perm 0.08 0.00v/c Ratio 0.92 0.19 0.25 0.96 0.01Uniform Delay, d1 18.3 11.8 12.1 21.0 13.3Progression Factor 1.00 1.00 1.00 1.00 1.00Incremental Delay, d2 19.7 4.3 0.8 26.5 0.0Delay (s) 38.0 16.1 12.9 47.5 13.3Level of Service D B B D BApproach Delay (s) 38.0 13.2 46.6Approach LOS D B D
Intersection SummaryHCM 2000 Control Delay 38.1 HCM 2000 Level of Service DHCM 2000 Volume to Capacity ratio 0.94Actuated Cycle Length (s) 69.8 Sum of lost time (s) 12.0Intersection Capacity Utilization 82.7% ICU Level of Service EAnalysis Period (min) 15c Critical Lane Group

HCM Signalized Intersection Capacity Analysis15: Maybank Hwy & N Pitchfork Rd #1 11/5/2015
2040 Build without I-526 4/6/2010 2040 Build without I-526 Synchro 8 ReportPage 1
Movement SEL SER NEL NET SWT SWRLane ConfigurationsVolume (vph) 532 5 10 991 947 316Ideal Flow (vphpl) 1900 1900 1900 1900 1900 1900Lane Width 11 11 11 11 11 11Total Lost time (s) 6.0 6.0 6.0 6.0 6.0 6.0Lane Util. Factor 1.00 1.00 1.00 1.00 0.95 1.00Frt 1.00 0.85 1.00 1.00 1.00 0.85Flt Protected 0.95 1.00 0.95 1.00 1.00 1.00Satd. Flow (prot) 1631 1459 1694 1783 3421 1531Flt Permitted 0.95 1.00 0.22 1.00 1.00 1.00Satd. Flow (perm) 1631 1459 391 1783 3421 1531Peak-hour factor, PHF 0.73 0.73 0.87 0.87 0.98 0.98Adj. Flow (vph) 729 7 11 1139 966 322RTOR Reduction (vph) 0 3 0 0 0 76Lane Group Flow (vph) 729 4 11 1139 966 246Heavy Vehicles (%) 7% 7% 3% 3% 2% 2%Turn Type Prot Perm Perm NA NA customProtected Phases 8 2 6Permitted Phases 2 2 8Actuated Green, G (s) 57.0 81.0 81.0 81.0 81.0 57.0Effective Green, g (s) 57.0 81.0 81.0 81.0 81.0 57.0Actuated g/C Ratio 0.38 0.54 0.54 0.54 0.54 0.38Clearance Time (s) 6.0 6.0 6.0 6.0 6.0 6.0Vehicle Extension (s) 3.0 3.0 3.0 3.0 3.0 3.0Lane Grp Cap (vph) 619 787 211 962 1847 581v/s Ratio Prot c0.45 c0.64 0.28v/s Ratio Perm 0.00 0.03 0.16v/c Ratio 1.18 0.01 0.05 1.18 0.52 0.42Uniform Delay, d1 46.5 15.9 16.3 34.5 22.1 34.4Progression Factor 1.00 1.00 1.00 1.00 1.00 1.00Incremental Delay, d2 96.0 0.0 0.1 93.5 0.3 0.5Delay (s) 142.5 15.9 16.4 128.0 22.4 34.8Level of Service F B B F C CApproach Delay (s) 141.3 126.9 25.5Approach LOS F F C
Intersection SummaryHCM 2000 Control Delay 89.1 HCM 2000 Level of Service FHCM 2000 Volume to Capacity ratio 1.18Actuated Cycle Length (s) 150.0 Sum of lost time (s) 12.0Intersection Capacity Utilization 91.6% ICU Level of Service FAnalysis Period (min) 15c Critical Lane Group
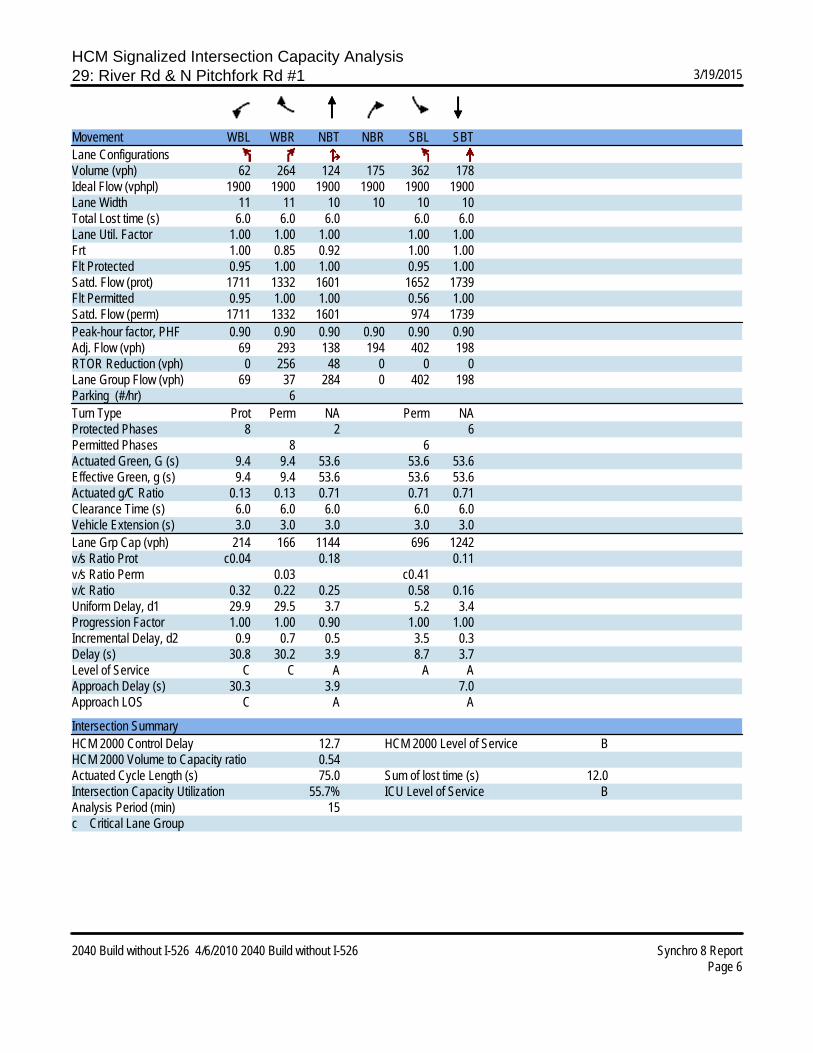
HCM Signalized Intersection Capacity Analysis29: River Rd & N Pitchfork Rd #1 3/19/2015
2040 Build without I-526 4/6/2010 2040 Build without I-526 Synchro 8 ReportPage 6
Movement WBL WBR NBT NBR SBL SBTLane ConfigurationsVolume (vph) 62 264 124 175 362 178Ideal Flow (vphpl) 1900 1900 1900 1900 1900 1900Lane Width 11 11 10 10 10 10Total Lost time (s) 6.0 6.0 6.0 6.0 6.0Lane Util. Factor 1.00 1.00 1.00 1.00 1.00Frt 1.00 0.85 0.92 1.00 1.00Flt Protected 0.95 1.00 1.00 0.95 1.00Satd. Flow (prot) 1711 1332 1601 1652 1739Flt Permitted 0.95 1.00 1.00 0.56 1.00Satd. Flow (perm) 1711 1332 1601 974 1739Peak-hour factor, PHF 0.90 0.90 0.90 0.90 0.90 0.90Adj. Flow (vph) 69 293 138 194 402 198RTOR Reduction (vph) 0 256 48 0 0 0Lane Group Flow (vph) 69 37 284 0 402 198Parking (#/hr) 6Turn Type Prot Perm NA Perm NAProtected Phases 8 2 6Permitted Phases 8 6Actuated Green, G (s) 9.4 9.4 53.6 53.6 53.6Effective Green, g (s) 9.4 9.4 53.6 53.6 53.6Actuated g/C Ratio 0.13 0.13 0.71 0.71 0.71Clearance Time (s) 6.0 6.0 6.0 6.0 6.0Vehicle Extension (s) 3.0 3.0 3.0 3.0 3.0Lane Grp Cap (vph) 214 166 1144 696 1242v/s Ratio Prot c0.04 0.18 0.11v/s Ratio Perm 0.03 c0.41v/c Ratio 0.32 0.22 0.25 0.58 0.16Uniform Delay, d1 29.9 29.5 3.7 5.2 3.4Progression Factor 1.00 1.00 0.90 1.00 1.00Incremental Delay, d2 0.9 0.7 0.5 3.5 0.3Delay (s) 30.8 30.2 3.9 8.7 3.7Level of Service C C A A AApproach Delay (s) 30.3 3.9 7.0Approach LOS C A A
Intersection SummaryHCM 2000 Control Delay 12.7 HCM 2000 Level of Service BHCM 2000 Volume to Capacity ratio 0.54Actuated Cycle Length (s) 75.0 Sum of lost time (s) 12.0Intersection Capacity Utilization 55.7% ICU Level of Service BAnalysis Period (min) 15c Critical Lane Group
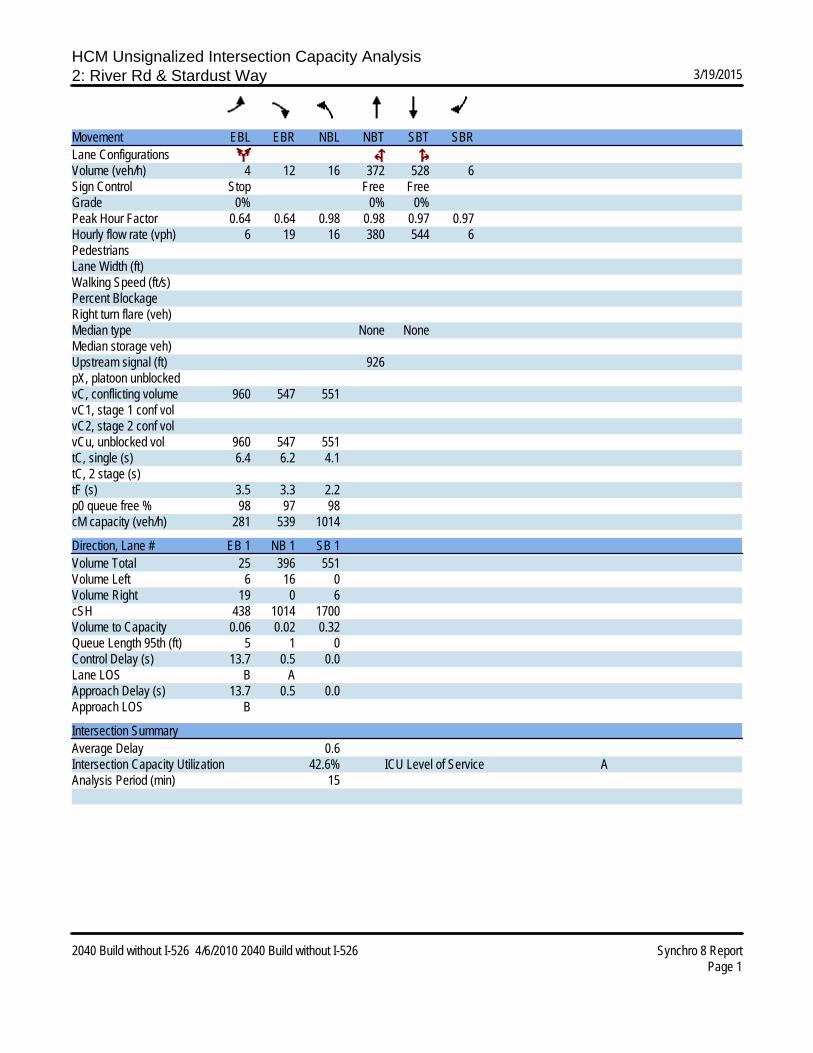
HCM Unsignalized Intersection Capacity Analysis2: River Rd & Stardust Way 3/19/2015
2040 Build without I-526 4/6/2010 2040 Build without I-526 Synchro 8 ReportPage 1
Movement EBL EBR NBL NBT SBT SBRLane ConfigurationsVolume (veh/h) 4 12 16 372 528 6Sign Control Stop Free FreeGrade 0% 0% 0%Peak Hour Factor 0.64 0.64 0.98 0.98 0.97 0.97Hourly flow rate (vph) 6 19 16 380 544 6PedestriansLane Width (ft)Walking Speed (ft/s)Percent BlockageRight turn flare (veh)Median type None NoneMedian storage veh)Upstream signal (ft) 926pX, platoon unblockedvC, conflicting volume 960 547 551vC1, stage 1 conf volvC2, stage 2 conf volvCu, unblocked vol 960 547 551tC, single (s) 6.4 6.2 4.1tC, 2 stage (s)tF (s) 3.5 3.3 2.2p0 queue free % 98 97 98cM capacity (veh/h) 281 539 1014
Direction, Lane # EB 1 NB 1 SB 1Volume Total 25 396 551Volume Left 6 16 0Volume Right 19 0 6cSH 438 1014 1700Volume to Capacity 0.06 0.02 0.32Queue Length 95th (ft) 5 1 0Control Delay (s) 13.7 0.5 0.0Lane LOS B AApproach Delay (s) 13.7 0.5 0.0Approach LOS B
Intersection SummaryAverage Delay 0.6Intersection Capacity Utilization 42.6% ICU Level of Service AAnalysis Period (min) 15

HCM Unsignalized Intersection Capacity Analysis14: N Pitchfork Rd #1 & Fenwick Hall Allee 3/19/2015
2040 Build without I-526 4/6/2010 2040 Build without I-526 Synchro 8 ReportPage 2
Movement EBL EBT WBT WBR SBL SBRRight Turn Channelized YesVolume (veh/h) 0 532 382 0 0 0Peak Hour Factor 0.90 0.90 0.90 0.90 0.90 0.90Hourly flow rate (vph) 0 591 424 0 0 0Approach Volume (veh/h) 591 424 0Crossing Volume (veh/h) 0 0 424High Capacity (veh/h) 1385 1385 991High v/c (veh/h) 0.43 0.31 0.00Low Capacity (veh/h) 1161 1161 806Low v/c (veh/h) 0.51 0.37 0.00
Intersection SummaryMaximum v/c High 0.43Maximum v/c Low 0.51Intersection Capacity Utilization 31.3% ICU Level of Service A

HCM Unsignalized Intersection Capacity Analysis19: Cane Slash Rd & River Rd 3/19/2015
2040 Build without I-526 4/6/2010 2040 Build without I-526 Synchro 8 ReportPage 3
Movement NBL NBT SBT SBR NEL NERLane ConfigurationsVolume (veh/h) 8 679 655 68 34 5Sign Control Free Free StopGrade 0% 0% 0%Peak Hour Factor 0.93 0.93 0.94 0.94 0.81 0.81Hourly flow rate (vph) 9 730 697 72 42 6PedestriansLane Width (ft)Walking Speed (ft/s)Percent BlockageRight turn flare (veh)Median type None NoneMedian storage veh)Upstream signal (ft) 638pX, platoon unblockedvC, conflicting volume 769 1480 733vC1, stage 1 conf volvC2, stage 2 conf volvCu, unblocked vol 769 1480 733tC, single (s) 4.2 6.4 6.2tC, 2 stage (s)tF (s) 2.3 3.5 3.3p0 queue free % 99 69 99cM capacity (veh/h) 827 137 422
Direction, Lane # NB 1 SB 1 NE 1Volume Total 739 769 48Volume Left 9 0 42Volume Right 0 72 6cSH 827 1700 150Volume to Capacity 0.01 0.45 0.32Queue Length 95th (ft) 1 0 32Control Delay (s) 0.3 0.0 39.8Lane LOS A EApproach Delay (s) 0.3 0.0 39.8Approach LOS E
Intersection SummaryAverage Delay 1.4Intersection Capacity Utilization 52.1% ICU Level of Service AAnalysis Period (min) 15

HCM Signalized Intersection Capacity Analysis5: Maybank Hwy & River Rd 3/19/2015
2040 Build with I-526 4/6/2010 2040 Build with I-526 Synchro 8 ReportPage 1
Movement NBL NBT NBR SBL SBT SBR NEL NET NER SWL SWT SWRLane ConfigurationsVolume (vph) 699 95 9 186 63 867 293 233 190 52 270 28Ideal Flow (vphpl) 1900 1900 1900 1900 1900 1900 1900 1900 1900 1900 1900 1900Lane Width 10 10 10 10 10 10 10 10 10 11 11 11Total Lost time (s) 7.0 7.0 6.5 7.0 7.0 7.0 6.5 6.5 6.5 6.5 6.5 6.5Lane Util. Factor 1.00 1.00 1.00 1.00 1.00 1.00 1.00 1.00 1.00 1.00 1.00 1.00Frt 1.00 1.00 0.85 1.00 1.00 0.85 1.00 1.00 0.85 1.00 1.00 0.85Flt Protected 0.95 1.00 1.00 0.95 1.00 1.00 0.95 1.00 1.00 0.95 1.00 1.00Satd. Flow (prot) 1620 1705 1449 1620 1705 1449 1636 1550 1463 1694 1783 1516Flt Permitted 0.72 1.00 1.00 0.69 1.00 1.00 0.49 1.00 1.00 0.50 1.00 1.00Satd. Flow (perm) 1220 1705 1449 1183 1705 1449 838 1550 1463 890 1783 1516Peak-hour factor, PHF 0.97 0.97 0.97 0.98 0.98 0.98 0.87 0.87 0.87 0.97 0.97 0.97Adj. Flow (vph) 721 98 9 190 64 885 337 268 218 54 278 29RTOR Reduction (vph) 0 0 0 0 0 199 0 0 137 0 0 18Lane Group Flow (vph) 721 98 9 190 64 686 337 268 81 54 278 11Heavy Vehicles (%) 4% 4% 4% 4% 4% 4% 3% 3% 3% 3% 3% 3%Parking (#/hr) 0Turn Type Perm NA custom Perm NA Perm Perm NA Perm Perm NA PermProtected Phases 4 8 2 6Permitted Phases 4 2 4 6 8 8 2 2 6 6Actuated Green, G (s) 68.0 68.0 130.0 68.0 68.0 68.0 48.5 48.5 48.5 48.5 48.5 48.5Effective Green, g (s) 68.0 68.0 123.0 68.0 68.0 68.0 48.5 48.5 48.5 48.5 48.5 48.5Actuated g/C Ratio 0.52 0.52 0.95 0.52 0.52 0.52 0.37 0.37 0.37 0.37 0.37 0.37Clearance Time (s) 7.0 7.0 7.0 7.0 7.0 6.5 6.5 6.5 6.5 6.5 6.5Vehicle Extension (s) 3.0 3.0 3.0 3.0 3.0 3.0 3.0 3.0 3.0 3.0 3.0Lane Grp Cap (vph) 638 891 1370 618 891 757 312 578 545 332 665 565v/s Ratio Prot 0.06 0.04 0.17 0.16v/s Ratio Perm c0.59 0.01 0.16 0.47 c0.40 0.06 0.06 0.01v/c Ratio 1.13 0.11 0.01 0.31 0.07 0.91 1.08 0.46 0.15 0.16 0.42 0.02Uniform Delay, d1 31.0 15.7 0.2 17.6 15.4 28.1 40.8 30.9 27.1 27.2 30.3 25.7Progression Factor 1.00 1.00 1.00 0.87 0.88 0.89 1.00 1.00 1.00 1.00 1.00 1.00Incremental Delay, d2 77.1 0.1 0.0 0.2 0.0 12.1 74.0 2.7 0.6 1.1 1.9 0.1Delay (s) 108.1 15.7 0.2 15.6 13.5 37.0 114.7 33.6 27.6 28.2 32.2 25.8Level of Service F B A B B D F C C C C CApproach Delay (s) 96.0 32.1 65.2 31.1Approach LOS F C E C
Intersection SummaryHCM 2000 Control Delay 57.4 HCM 2000 Level of Service EHCM 2000 Volume to Capacity ratio 1.11Actuated Cycle Length (s) 130.0 Sum of lost time (s) 13.5Intersection Capacity Utilization 123.7% ICU Level of Service HAnalysis Period (min) 15c Critical Lane Group

HCM Signalized Intersection Capacity Analysis9: Maybank Hwy & Old Maybank Hwy 3/19/2015
2040 Build with I-526 4/6/2010 2040 Build with I-526 Synchro 8 ReportPage 2
Movement EBL EBT WBT WBR SBL SBRLane ConfigurationsVolume (vph) 15 1048 403 18 54 19Ideal Flow (vphpl) 1900 1900 1900 1900 1900 1900Total Lost time (s) 6.3 6.3 6.3 6.3 6.0 6.0Lane Util. Factor 1.00 0.95 0.95 1.00 1.00 1.00Frt 1.00 1.00 1.00 0.85 1.00 0.85Flt Protected 0.95 1.00 1.00 1.00 0.95 1.00Satd. Flow (prot) 1770 3539 3539 1583 1770 1583Flt Permitted 0.49 1.00 1.00 1.00 0.95 1.00Satd. Flow (perm) 918 3539 3539 1583 1770 1583Peak-hour factor, PHF 0.90 0.90 0.90 0.90 0.90 0.90Adj. Flow (vph) 17 1164 448 20 60 21RTOR Reduction (vph) 0 0 0 5 0 19Lane Group Flow (vph) 17 1164 448 15 60 2Turn Type Perm NA NA Perm Prot PermProtected Phases 2 6 4Permitted Phases 2 6 4Actuated Green, G (s) 57.7 57.7 57.7 57.7 7.1 7.1Effective Green, g (s) 57.7 57.7 57.7 57.7 7.1 7.1Actuated g/C Ratio 0.75 0.75 0.75 0.75 0.09 0.09Clearance Time (s) 6.3 6.3 6.3 6.3 6.0 6.0Vehicle Extension (s) 3.0 3.0 3.0 3.0 3.0 3.0Lane Grp Cap (vph) 687 2648 2648 1184 162 145v/s Ratio Prot c0.33 0.13 c0.03v/s Ratio Perm 0.02 0.01 0.00v/c Ratio 0.02 0.44 0.17 0.01 0.37 0.01Uniform Delay, d1 2.5 3.6 2.8 2.5 32.9 31.8Progression Factor 1.00 1.00 1.00 1.00 1.00 1.00Incremental Delay, d2 0.1 0.5 0.1 0.0 1.4 0.0Delay (s) 2.6 4.2 2.9 2.5 34.3 31.9Level of Service A A A A C CApproach Delay (s) 4.1 2.9 33.7Approach LOS A A C
Intersection SummaryHCM 2000 Control Delay 5.2 HCM 2000 Level of Service AHCM 2000 Volume to Capacity ratio 0.43Actuated Cycle Length (s) 77.1 Sum of lost time (s) 12.3Intersection Capacity Utilization 45.9% ICU Level of Service AAnalysis Period (min) 15c Critical Lane Group

HCM Signalized Intersection Capacity Analysis15: Maybank Hwy & N Pitchfork Rd #1 3/19/2015
2040 Build with I-526 4/6/2010 2040 Build with I-526 Synchro 8 ReportPage 3
Movement SEL SER NEL NET SWT SWRLane ConfigurationsVolume (vph) 368 4 4 424 347 66Ideal Flow (vphpl) 1900 1900 1900 1900 1900 1900Lane Width 11 11 11 11 10 10Total Lost time (s) 6.0 6.0 6.0 6.0 6.0 6.0Lane Util. Factor 1.00 1.00 1.00 1.00 0.95 1.00Frt 1.00 0.85 1.00 1.00 1.00 0.85Flt Protected 0.95 1.00 0.95 1.00 1.00 1.00Satd. Flow (prot) 1631 1459 1694 1783 3303 1478Flt Permitted 0.95 1.00 0.54 1.00 1.00 1.00Satd. Flow (perm) 1631 1459 963 1783 3303 1478Peak-hour factor, PHF 0.73 0.73 0.87 0.87 0.98 0.98Adj. Flow (vph) 504 5 5 487 354 67RTOR Reduction (vph) 0 3 0 0 0 40Lane Group Flow (vph) 504 2 5 487 354 27Heavy Vehicles (%) 7% 7% 3% 3% 2% 2%Turn Type Prot Perm Perm NA NA customProtected Phases 8 2 6Permitted Phases 2 2 8Actuated Green, G (s) 21.1 18.5 18.5 18.5 18.5 21.1Effective Green, g (s) 21.1 18.5 18.5 18.5 18.5 21.1Actuated g/C Ratio 0.41 0.36 0.36 0.36 0.36 0.41Clearance Time (s) 6.0 6.0 6.0 6.0 6.0 6.0Vehicle Extension (s) 3.0 3.0 3.0 3.0 3.0 3.0Lane Grp Cap (vph) 666 523 345 639 1184 604v/s Ratio Prot c0.31 c0.27 0.11v/s Ratio Perm 0.00 0.01 0.02v/c Ratio 0.76 0.00 0.01 0.76 0.30 0.05Uniform Delay, d1 13.1 10.6 10.7 14.6 11.9 9.2Progression Factor 1.00 1.00 1.00 1.00 1.00 1.00Incremental Delay, d2 4.9 0.0 0.0 5.4 0.1 0.0Delay (s) 18.0 10.6 10.7 20.0 12.0 9.2Level of Service B B B B B AApproach Delay (s) 17.9 19.9 11.6Approach LOS B B B
Intersection SummaryHCM 2000 Control Delay 16.7 HCM 2000 Level of Service BHCM 2000 Volume to Capacity ratio 0.76Actuated Cycle Length (s) 51.6 Sum of lost time (s) 12.0Intersection Capacity Utilization 52.7% ICU Level of Service AAnalysis Period (min) 15c Critical Lane Group
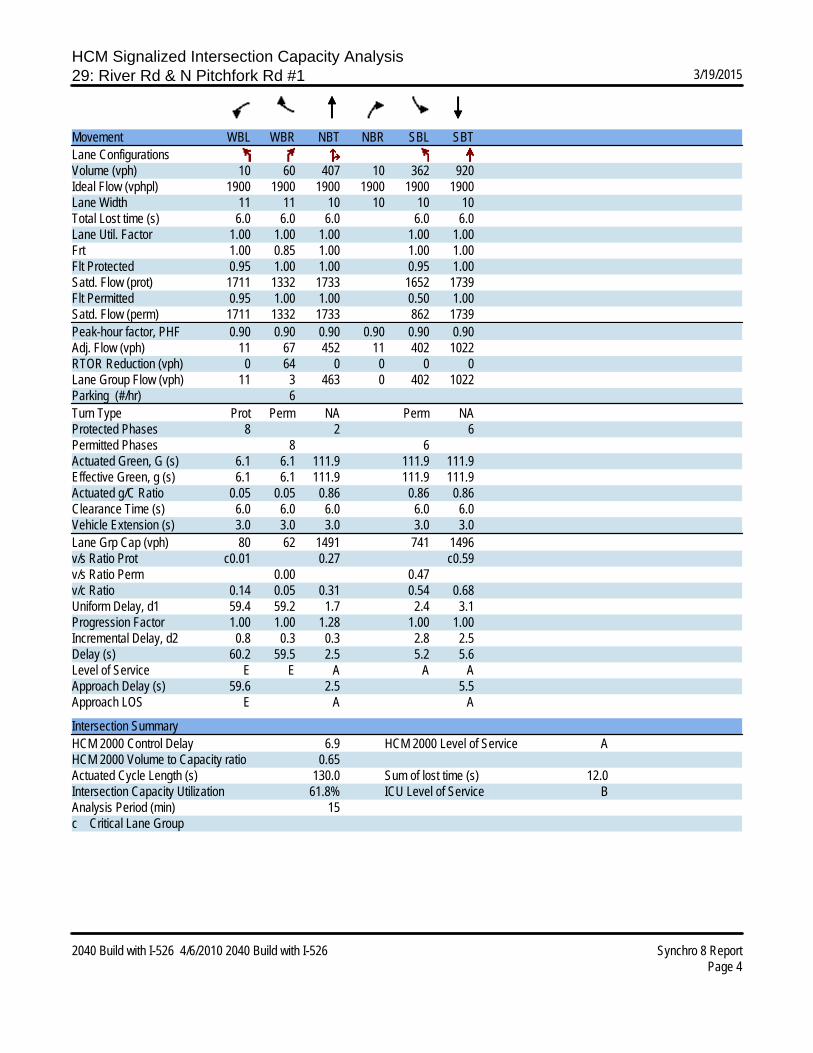
HCM Signalized Intersection Capacity Analysis29: River Rd & N Pitchfork Rd #1 3/19/2015
2040 Build with I-526 4/6/2010 2040 Build with I-526 Synchro 8 ReportPage 4
Movement WBL WBR NBT NBR SBL SBTLane ConfigurationsVolume (vph) 10 60 407 10 362 920Ideal Flow (vphpl) 1900 1900 1900 1900 1900 1900Lane Width 11 11 10 10 10 10Total Lost time (s) 6.0 6.0 6.0 6.0 6.0Lane Util. Factor 1.00 1.00 1.00 1.00 1.00Frt 1.00 0.85 1.00 1.00 1.00Flt Protected 0.95 1.00 1.00 0.95 1.00Satd. Flow (prot) 1711 1332 1733 1652 1739Flt Permitted 0.95 1.00 1.00 0.50 1.00Satd. Flow (perm) 1711 1332 1733 862 1739Peak-hour factor, PHF 0.90 0.90 0.90 0.90 0.90 0.90Adj. Flow (vph) 11 67 452 11 402 1022RTOR Reduction (vph) 0 64 0 0 0 0Lane Group Flow (vph) 11 3 463 0 402 1022Parking (#/hr) 6Turn Type Prot Perm NA Perm NAProtected Phases 8 2 6Permitted Phases 8 6Actuated Green, G (s) 6.1 6.1 111.9 111.9 111.9Effective Green, g (s) 6.1 6.1 111.9 111.9 111.9Actuated g/C Ratio 0.05 0.05 0.86 0.86 0.86Clearance Time (s) 6.0 6.0 6.0 6.0 6.0Vehicle Extension (s) 3.0 3.0 3.0 3.0 3.0Lane Grp Cap (vph) 80 62 1491 741 1496v/s Ratio Prot c0.01 0.27 c0.59v/s Ratio Perm 0.00 0.47v/c Ratio 0.14 0.05 0.31 0.54 0.68Uniform Delay, d1 59.4 59.2 1.7 2.4 3.1Progression Factor 1.00 1.00 1.28 1.00 1.00Incremental Delay, d2 0.8 0.3 0.3 2.8 2.5Delay (s) 60.2 59.5 2.5 5.2 5.6Level of Service E E A A AApproach Delay (s) 59.6 2.5 5.5Approach LOS E A A
Intersection SummaryHCM 2000 Control Delay 6.9 HCM 2000 Level of Service AHCM 2000 Volume to Capacity ratio 0.65Actuated Cycle Length (s) 130.0 Sum of lost time (s) 12.0Intersection Capacity Utilization 61.8% ICU Level of Service BAnalysis Period (min) 15c Critical Lane Group

HCM Unsignalized Intersection Capacity Analysis2: River Rd & Stardust Way 3/19/2015
2040 Build with I-526 4/6/2010 2040 Build with I-526 Synchro 8 ReportPage 1
Movement EBL EBR NBL NBT SBT SBRLane ConfigurationsVolume (veh/h) 4 11 20 447 1271 16Sign Control Stop Free FreeGrade 0% 0% 0%Peak Hour Factor 0.64 0.64 0.98 0.98 0.97 0.97Hourly flow rate (vph) 6 17 20 456 1310 16PedestriansLane Width (ft)Walking Speed (ft/s)Percent BlockageRight turn flare (veh)Median type None NoneMedian storage veh)Upstream signal (ft) 926pX, platoon unblockedvC, conflicting volume 1815 1319 1327vC1, stage 1 conf volvC2, stage 2 conf volvCu, unblocked vol 1815 1319 1327tC, single (s) 6.4 6.2 4.1tC, 2 stage (s)tF (s) 3.5 3.3 2.2p0 queue free % 92 91 96cM capacity (veh/h) 83 193 517
Direction, Lane # EB 1 NB 1 SB 1Volume Total 23 477 1327Volume Left 6 20 0Volume Right 17 0 16cSH 143 517 1700Volume to Capacity 0.16 0.04 0.78Queue Length 95th (ft) 14 3 0Control Delay (s) 35.2 1.2 0.0Lane LOS E AApproach Delay (s) 35.2 1.2 0.0Approach LOS E
Intersection SummaryAverage Delay 0.8Intersection Capacity Utilization 77.9% ICU Level of Service DAnalysis Period (min) 15

HCM Unsignalized Intersection Capacity Analysis11: S Pitchfork Rd #1 & Maybank Hwy 3/19/2015
2040 Build with I-526 4/6/2010 2040 Build with I-526 Synchro 8 ReportPage 2
Movement EBT EBR WBL WBT NBL NBRLane ConfigurationsVolume (veh/h) 790 2 12 411 3 272Sign Control Free Free StopGrade 0% 0% 0%Peak Hour Factor 0.90 0.90 0.90 0.90 0.90 0.90Hourly flow rate (vph) 878 2 13 457 3 302PedestriansLane Width (ft)Walking Speed (ft/s)Percent BlockageRight turn flare (veh) 20Median type None NoneMedian storage veh)Upstream signal (ft)pX, platoon unblockedvC, conflicting volume 880 1134 440vC1, stage 1 conf volvC2, stage 2 conf volvCu, unblocked vol 880 1134 440tC, single (s) 4.1 6.8 6.9tC, 2 stage (s)tF (s) 2.2 3.5 3.3p0 queue free % 98 98 46cM capacity (veh/h) 764 193 565
Direction, Lane # EB 1 EB 2 WB 1 WB 2 WB 3 NB 1Volume Total 585 295 13 228 228 306Volume Left 0 0 13 0 0 3Volume Right 0 2 0 0 0 302cSH 1700 1700 764 1700 1700 571Volume to Capacity 0.34 0.17 0.02 0.13 0.13 0.54Queue Length 95th (ft) 0 0 1 0 0 79Control Delay (s) 0.0 0.0 9.8 0.0 0.0 18.5Lane LOS A CApproach Delay (s) 0.0 0.3 18.5Approach LOS C
Intersection SummaryAverage Delay 3.5Intersection Capacity Utilization 45.4% ICU Level of Service AAnalysis Period (min) 15

HCM Unsignalized Intersection Capacity Analysis12: River Rd & S Pitchfork Rd #1 3/19/2015
2040 Build with I-526 4/6/2010 2040 Build with I-526 Synchro 8 ReportPage 3
Movement NBT NBR SBL SBT SWL SWRLane ConfigurationsVolume (veh/h) 791 257 18 287 1 13Sign Control Free Free StopGrade 0% 0% 0%Peak Hour Factor 0.90 0.90 0.90 0.90 0.90 0.90Hourly flow rate (vph) 879 286 20 319 1 14PedestriansLane Width (ft)Walking Speed (ft/s)Percent BlockageRight turn flare (veh)Median type None TWLTLMedian storage veh) 2Upstream signal (ft) 1102pX, platoon unblockedvC, conflicting volume 1164 1381 1022vC1, stage 1 conf vol 1022vC2, stage 2 conf vol 359vCu, unblocked vol 1164 1381 1022tC, single (s) 4.1 6.4 6.2tC, 2 stage (s) 5.4tF (s) 2.2 3.5 3.3p0 queue free % 97 100 95cM capacity (veh/h) 600 322 287
Direction, Lane # NB 1 SB 1 SB 2 SW 1 SW 2Volume Total 1164 20 319 1 14Volume Left 0 20 0 1 0Volume Right 286 0 0 0 14cSH 1700 600 1700 322 287Volume to Capacity 0.68 0.03 0.19 0.00 0.05Queue Length 95th (ft) 0 3 0 0 4Control Delay (s) 0.0 11.2 0.0 16.2 18.2Lane LOS B C CApproach Delay (s) 0.0 0.7 18.1Approach LOS C
Intersection SummaryAverage Delay 0.3Intersection Capacity Utilization 67.3% ICU Level of Service CAnalysis Period (min) 15
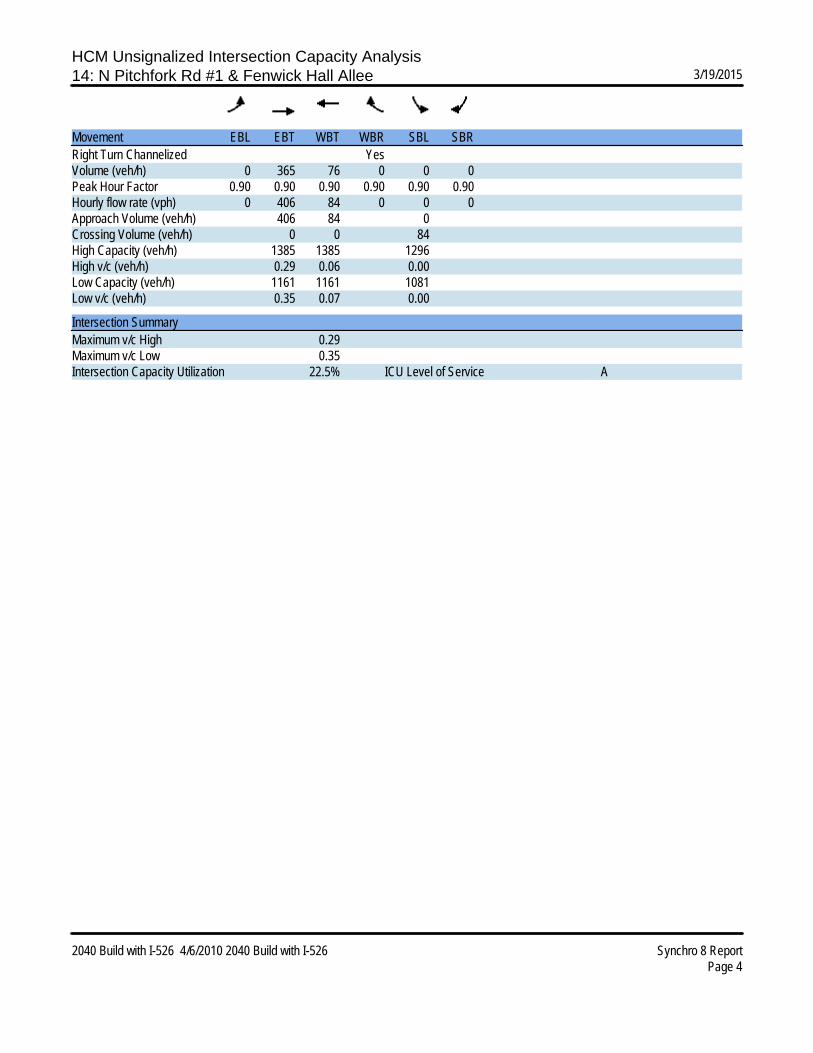
HCM Unsignalized Intersection Capacity Analysis14: N Pitchfork Rd #1 & Fenwick Hall Allee 3/19/2015
2040 Build with I-526 4/6/2010 2040 Build with I-526 Synchro 8 ReportPage 4
Movement EBL EBT WBT WBR SBL SBRRight Turn Channelized YesVolume (veh/h) 0 365 76 0 0 0Peak Hour Factor 0.90 0.90 0.90 0.90 0.90 0.90Hourly flow rate (vph) 0 406 84 0 0 0Approach Volume (veh/h) 406 84 0Crossing Volume (veh/h) 0 0 84High Capacity (veh/h) 1385 1385 1296High v/c (veh/h) 0.29 0.06 0.00Low Capacity (veh/h) 1161 1161 1081Low v/c (veh/h) 0.35 0.07 0.00
Intersection SummaryMaximum v/c High 0.29Maximum v/c Low 0.35Intersection Capacity Utilization 22.5% ICU Level of Service A

HCM Unsignalized Intersection Capacity Analysis19: Cane Slash Rd & River Rd 3/19/2015
2040 Build with I-526 4/6/2010 2040 Build with I-526 Synchro 8 ReportPage 5
Movement NBL NBT SBT SBR NEL NERLane ConfigurationsVolume (veh/h) 11 1017 261 27 31 5Sign Control Free Free StopGrade 0% 0% 0%Peak Hour Factor 0.93 0.93 0.94 0.94 0.81 0.81Hourly flow rate (vph) 12 1094 278 29 38 6PedestriansLane Width (ft)Walking Speed (ft/s)Percent BlockageRight turn flare (veh)Median type None NoneMedian storage veh)Upstream signal (ft)pX, platoon unblockedvC, conflicting volume 306 1409 292vC1, stage 1 conf volvC2, stage 2 conf volvCu, unblocked vol 306 1409 292tC, single (s) 4.2 6.4 6.2tC, 2 stage (s)tF (s) 2.3 3.5 3.3p0 queue free % 99 75 99cM capacity (veh/h) 1232 152 750
Direction, Lane # NB 1 SB 1 NE 1Volume Total 1105 306 44Volume Left 12 0 38Volume Right 0 29 6cSH 1232 1700 171Volume to Capacity 0.01 0.18 0.26Queue Length 95th (ft) 1 0 25Control Delay (s) 0.3 0.0 33.3Lane LOS A DApproach Delay (s) 0.3 0.0 33.3Approach LOS D
Intersection SummaryAverage Delay 1.2Intersection Capacity Utilization 72.3% ICU Level of Service CAnalysis Period (min) 15

Appendix G: Synchro Results – 2040 Build without Pitchfork

HCM Signalized Intersection Capacity Analysis1: Maybank Hwy & Old Maybank Hwy 3/19/2015
2040 Build without Pitchfork with I-526 4/6/2010 2040 Build without Pitchfork without I-526 Synchro 8 ReportPage 1
Movement EBL EBT WBT WBR SBL SBRLane ConfigurationsVolume (vph) 19 1296 1629 71 50 18Ideal Flow (vphpl) 1900 1900 1900 1900 1900 1900Total Lost time (s) 6.3 6.3 6.3 6.3 6.0 6.0Lane Util. Factor 1.00 0.95 0.95 1.00 1.00 1.00Frt 1.00 1.00 1.00 0.85 1.00 0.85Flt Protected 0.95 1.00 1.00 1.00 0.95 1.00Satd. Flow (prot) 1770 3539 3539 1583 1770 1583Flt Permitted 0.10 1.00 1.00 1.00 0.95 1.00Satd. Flow (perm) 189 3539 3539 1583 1770 1583Peak-hour factor, PHF 0.90 0.90 0.90 0.90 0.90 0.90Adj. Flow (vph) 21 1440 1810 79 56 20RTOR Reduction (vph) 0 0 0 16 0 19Lane Group Flow (vph) 21 1440 1810 63 56 1Turn Type Perm NA NA Perm Prot PermProtected Phases 2 6 4Permitted Phases 2 6 4Actuated Green, G (s) 65.3 65.3 65.3 65.3 4.8 4.8Effective Green, g (s) 65.3 65.3 65.3 65.3 4.8 4.8Actuated g/C Ratio 0.79 0.79 0.79 0.79 0.06 0.06Clearance Time (s) 6.3 6.3 6.3 6.3 6.0 6.0Vehicle Extension (s) 4.0 4.0 4.0 4.0 4.0 4.0Lane Grp Cap (vph) 149 2804 2804 1254 103 92v/s Ratio Prot 0.41 c0.51 c0.03v/s Ratio Perm 0.11 0.04 0.00v/c Ratio 0.14 0.51 0.65 0.05 0.54 0.01Uniform Delay, d1 2.0 3.0 3.6 1.8 37.7 36.6Progression Factor 1.00 1.00 1.00 1.00 1.00 1.00Incremental Delay, d2 2.0 0.7 1.2 0.1 7.2 0.1Delay (s) 4.0 3.7 4.8 1.9 44.9 36.6Level of Service A A A A D DApproach Delay (s) 3.7 4.7 42.7Approach LOS A A D
Intersection SummaryHCM 2000 Control Delay 5.1 HCM 2000 Level of Service AHCM 2000 Volume to Capacity ratio 0.64Actuated Cycle Length (s) 82.4 Sum of lost time (s) 12.3Intersection Capacity Utilization 61.9% ICU Level of Service BAnalysis Period (min) 15c Critical Lane Group

HCM Signalized Intersection Capacity Analysis5: Maybank Hwy & River Rd 3/19/2015
2040 Build without Pitchfork with I-526 4/6/2010 2040 Build without Pitchfork without I-526 Synchro 8 ReportPage 2
Movement NBL NBT NBR SBL SBT SBR NEL NET NER SWL SWT SWRLane ConfigurationsVolume (vph) 75 161 292 267 125 95 86 766 34 285 872 462Ideal Flow (vphpl) 1900 1900 1900 1900 1900 1900 1900 1900 1900 1900 1900 1900Lane Width 12 12 12 12 12 12 12 12 12 11 11 11Total Lost time (s) 7.0 7.0 5.5 6.0 7.0 6.5 6.5 5.5 6.5 6.5Lane Util. Factor 1.00 1.00 1.00 1.00 1.00 1.00 1.00 1.00 1.00 1.00Frt 1.00 1.00 0.85 1.00 0.94 1.00 0.99 1.00 1.00 0.85Flt Protected 0.95 1.00 1.00 0.95 1.00 0.95 1.00 0.95 1.00 1.00Satd. Flow (prot) 1719 1810 1538 1719 1693 1736 1815 1631 1717 1459Flt Permitted 0.61 1.00 1.00 0.24 1.00 0.20 1.00 0.07 1.00 1.00Satd. Flow (perm) 1104 1810 1538 437 1693 365 1815 118 1717 1459Peak-hour factor, PHF 0.88 0.88 0.88 0.92 0.92 0.92 0.95 0.95 0.95 0.94 0.94 0.94Adj. Flow (vph) 85 183 332 290 136 103 91 806 36 303 928 491RTOR Reduction (vph) 0 0 72 0 23 0 0 1 0 0 0 186Lane Group Flow (vph) 85 183 260 290 216 0 91 841 0 303 928 305Heavy Vehicles (%) 5% 5% 5% 5% 5% 5% 4% 4% 4% 7% 7% 7%Turn Type Perm NA pm+ov pm+pt NA Perm NA pm+pt NA PermProtected Phases 4 1 3 8 2 1 6Permitted Phases 4 4 8 2 6 6Actuated Green, G (s) 12.0 12.0 28.5 32.0 32.0 52.5 52.5 74.5 74.5 74.5Effective Green, g (s) 12.0 12.0 28.5 32.0 32.0 52.5 52.5 74.5 74.5 74.5Actuated g/C Ratio 0.10 0.10 0.24 0.27 0.27 0.44 0.44 0.62 0.62 0.62Clearance Time (s) 7.0 7.0 5.5 6.0 7.0 6.5 6.5 5.5 6.5 6.5Vehicle Extension (s) 3.0 3.0 3.0 3.0 3.0 3.0 3.0 3.0 3.0 3.0Lane Grp Cap (vph) 110 181 365 266 451 159 794 281 1065 905v/s Ratio Prot 0.10 0.10 c0.13 0.13 0.46 c0.15 0.54v/s Ratio Perm 0.08 0.07 c0.16 0.25 c0.52 0.21v/c Ratio 0.77 1.01 0.71 1.09 0.48 0.57 1.06 1.08 0.87 0.34Uniform Delay, d1 52.7 54.0 42.0 40.3 37.0 25.3 33.8 40.4 18.8 10.9Progression Factor 1.00 1.00 1.00 1.00 1.00 1.00 1.00 1.00 1.00 1.00Incremental Delay, d2 27.9 69.8 6.5 81.4 0.8 14.1 48.7 76.1 9.8 1.0Delay (s) 80.6 123.8 48.5 121.7 37.8 39.4 82.5 116.5 28.6 11.9Level of Service F F D F D D F F C BApproach Delay (s) 76.0 83.8 78.3 39.3Approach LOS E F E D
Intersection SummaryHCM 2000 Control Delay 60.9 HCM 2000 Level of Service EHCM 2000 Volume to Capacity ratio 1.15Actuated Cycle Length (s) 120.0 Sum of lost time (s) 25.0Intersection Capacity Utilization 102.3% ICU Level of Service GAnalysis Period (min) 15c Critical Lane Group

HCM Unsignalized Intersection Capacity Analysis2: River Rd & Stardust Way 3/19/2015
2040 Build without Pitchfork with I-526 4/6/2010 2040 Build without Pitchfork without I-526 Synchro 8 ReportPage 1
Movement EBL EBR NBL NBT SBT SBRLane ConfigurationsVolume (veh/h) 4 11 30 679 476 6Sign Control Stop Free FreeGrade 0% 0% 0%Peak Hour Factor 0.64 0.64 0.89 0.89 0.88 0.88Hourly flow rate (vph) 6 17 34 763 541 7PedestriansLane Width (ft)Walking Speed (ft/s)Percent BlockageRight turn flare (veh)Median type None NoneMedian storage veh)Upstream signal (ft)pX, platoon unblockedvC, conflicting volume 1375 544 548vC1, stage 1 conf volvC2, stage 2 conf volvCu, unblocked vol 1375 544 548tC, single (s) 6.4 6.2 4.2tC, 2 stage (s)tF (s) 3.5 3.3 2.3p0 queue free % 96 97 97cM capacity (veh/h) 156 541 987
Direction, Lane # EB 1 NB 1 SB 1Volume Total 23 797 548Volume Left 6 34 0Volume Right 17 0 7cSH 326 987 1700Volume to Capacity 0.07 0.03 0.32Queue Length 95th (ft) 6 3 0Control Delay (s) 16.9 0.9 0.0Lane LOS C AApproach Delay (s) 16.9 0.9 0.0Approach LOS C
Intersection SummaryAverage Delay 0.8Intersection Capacity Utilization 70.1% ICU Level of Service CAnalysis Period (min) 15

HCM Unsignalized Intersection Capacity Analysis15: Maybank Hwy & Fenwick Hall Allee 3/19/2015
2040 Build without Pitchfork with I-526 4/6/2010 2040 Build without Pitchfork without I-526 Synchro 8 ReportPage 2
Movement EBL EBR EBR2 NWL NWR NEL NET NER SWL SWT SWRLane ConfigurationsVolume (veh/h) 20 0 13 0 0 31 1294 0 0 1607 40Sign Control Stop Stop Free FreeGrade 0% 0% 0% 0%Peak Hour Factor 0.78 0.90 0.78 0.90 0.90 0.90 0.90 0.90 0.90 0.93 0.93Hourly flow rate (vph) 26 0 17 0 0 34 1438 0 0 1728 43PedestriansLane Width (ft)Walking Speed (ft/s)Percent BlockageRight turn flare (veh) 3 3Median type None NoneMedian storage veh)Upstream signal (ft)pX, platoon unblockedvC, conflicting volume 3235 3235 864 3278 1438 1771 1438vC1, stage 1 conf volvC2, stage 2 conf volvCu, unblocked vol 3235 3235 864 3278 1438 1771 1438tC, single (s) 7.5 6.5 6.9 6.5 6.9 4.2 4.1tC, 2 stage (s)tF (s) 3.5 4.0 3.3 4.0 3.3 2.2 2.2p0 queue free % 0 100 94 100 100 90 100cM capacity (veh/h) 4 8 297 8 122 339 468
Direction, Lane # EB 1 NE 1 NE 2 SW 1 SW 2 SW 3Volume Total 42 34 1438 864 864 43Volume Left 26 34 0 0 0 0Volume Right 17 0 0 0 0 43cSH 6 339 1700 1700 1700 1700Volume to Capacity 7.26 0.10 0.85 0.51 0.51 0.03Queue Length 95th (ft) Err 8 0 0 0 0Control Delay (s) Err 16.8 0.0 0.0 0.0 0.0Lane LOS F CApproach Delay (s) Err 0.4 0.0Approach LOS F
Intersection SummaryAverage Delay 128.9Intersection Capacity Utilization 78.1% ICU Level of Service DAnalysis Period (min) 15
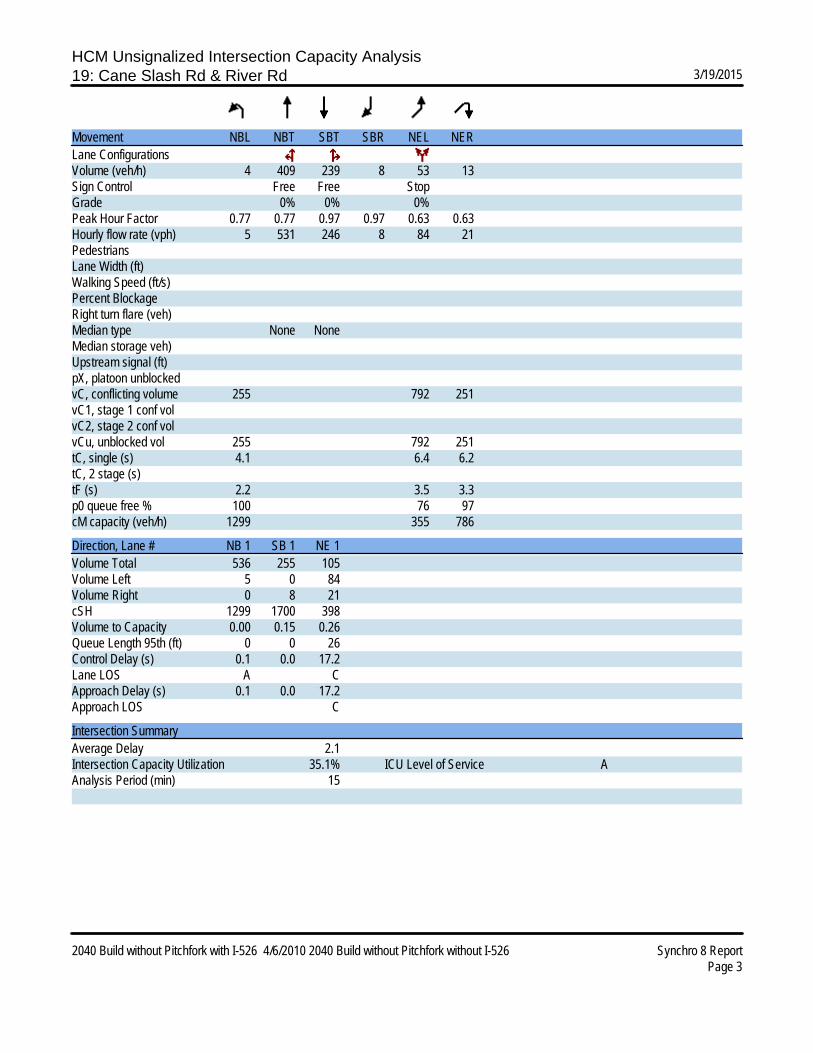
HCM Unsignalized Intersection Capacity Analysis19: Cane Slash Rd & River Rd 3/19/2015
2040 Build without Pitchfork with I-526 4/6/2010 2040 Build without Pitchfork without I-526 Synchro 8 ReportPage 3
Movement NBL NBT SBT SBR NEL NERLane ConfigurationsVolume (veh/h) 4 409 239 8 53 13Sign Control Free Free StopGrade 0% 0% 0%Peak Hour Factor 0.77 0.77 0.97 0.97 0.63 0.63Hourly flow rate (vph) 5 531 246 8 84 21PedestriansLane Width (ft)Walking Speed (ft/s)Percent BlockageRight turn flare (veh)Median type None NoneMedian storage veh)Upstream signal (ft)pX, platoon unblockedvC, conflicting volume 255 792 251vC1, stage 1 conf volvC2, stage 2 conf volvCu, unblocked vol 255 792 251tC, single (s) 4.1 6.4 6.2tC, 2 stage (s)tF (s) 2.2 3.5 3.3p0 queue free % 100 76 97cM capacity (veh/h) 1299 355 786
Direction, Lane # NB 1 SB 1 NE 1Volume Total 536 255 105Volume Left 5 0 84Volume Right 0 8 21cSH 1299 1700 398Volume to Capacity 0.00 0.15 0.26Queue Length 95th (ft) 0 0 26Control Delay (s) 0.1 0.0 17.2Lane LOS A CApproach Delay (s) 0.1 0.0 17.2Approach LOS C
Intersection SummaryAverage Delay 2.1Intersection Capacity Utilization 35.1% ICU Level of Service AAnalysis Period (min) 15

HCM Signalized Intersection Capacity Analysis1: Maybank Hwy & Old Maybank Hwy 3/19/2015
2040 Build without Pitchfork with I-526 4/6/2010 2040 Build without Pitchfork with I-526 Synchro 8 ReportPage 1
Movement EBL EBT WBT WBR SBL SBRLane ConfigurationsVolume (vph) 15 1057 482 21 55 20Ideal Flow (vphpl) 1900 1900 1900 1900 1900 1900Total Lost time (s) 6.3 6.3 6.3 6.3 6.0 6.0Lane Util. Factor 1.00 0.95 0.95 1.00 1.00 1.00Frt 1.00 1.00 1.00 0.85 1.00 0.85Flt Protected 0.95 1.00 1.00 1.00 0.95 1.00Satd. Flow (prot) 1770 3539 3539 1583 1770 1583Flt Permitted 0.45 1.00 1.00 1.00 0.95 1.00Satd. Flow (perm) 843 3539 3539 1583 1770 1583Peak-hour factor, PHF 0.90 0.90 0.90 0.90 0.90 0.90Adj. Flow (vph) 17 1174 536 23 61 22RTOR Reduction (vph) 0 0 0 6 0 20Lane Group Flow (vph) 17 1174 536 17 61 2Turn Type Perm NA NA Perm Prot PermProtected Phases 2 6 4Permitted Phases 2 6 4Actuated Green, G (s) 60.2 60.2 60.2 60.2 7.6 7.6Effective Green, g (s) 60.2 60.2 60.2 60.2 7.6 7.6Actuated g/C Ratio 0.75 0.75 0.75 0.75 0.09 0.09Clearance Time (s) 6.3 6.3 6.3 6.3 6.0 6.0Vehicle Extension (s) 4.0 4.0 4.0 4.0 4.0 4.0Lane Grp Cap (vph) 633 2659 2659 1189 167 150v/s Ratio Prot c0.33 0.15 c0.03v/s Ratio Perm 0.02 0.01 0.00v/c Ratio 0.03 0.44 0.20 0.01 0.37 0.01Uniform Delay, d1 2.5 3.7 2.9 2.5 34.0 32.9Progression Factor 1.00 1.00 1.00 1.00 1.00 1.00Incremental Delay, d2 0.1 0.5 0.2 0.0 1.8 0.1Delay (s) 2.6 4.2 3.1 2.5 35.8 32.9Level of Service A A A A D CApproach Delay (s) 4.2 3.1 35.1Approach LOS A A D
Intersection SummaryHCM 2000 Control Delay 5.3 HCM 2000 Level of Service AHCM 2000 Volume to Capacity ratio 0.43Actuated Cycle Length (s) 80.1 Sum of lost time (s) 12.3Intersection Capacity Utilization 46.1% ICU Level of Service AAnalysis Period (min) 15c Critical Lane Group

HCM Signalized Intersection Capacity Analysis5: Maybank Hwy & River Rd 3/19/2015
2040 Build without Pitchfork with I-526 4/6/2010 2040 Build without Pitchfork with I-526 Synchro 8 ReportPage 2
Movement NBL NBT NBR SBL SBT SBR NEL NET NER SWL SWT SWRLane ConfigurationsVolume (vph) 290 227 494 193 296 819 378 301 150 118 284 92Ideal Flow (vphpl) 1900 1900 1900 1900 1900 1900 1900 1900 1900 1900 1900 1900Total Lost time (s) 6.0 7.0 5.5 6.0 7.0 7.0 6.0 6.5 6.5 5.5 6.5 6.0Lane Util. Factor 1.00 1.00 1.00 1.00 1.00 1.00 1.00 1.00 1.00 1.00 1.00 1.00Frt 1.00 1.00 0.85 1.00 1.00 0.85 1.00 1.00 0.85 1.00 1.00 0.85Flt Protected 0.95 1.00 1.00 0.95 1.00 1.00 0.95 1.00 1.00 0.95 1.00 1.00Satd. Flow (prot) 1719 1810 1538 1719 1810 1538 1736 1827 1553 1687 1776 1509Flt Permitted 0.49 1.00 1.00 0.54 1.00 1.00 0.15 1.00 1.00 0.46 1.00 1.00Satd. Flow (perm) 882 1810 1538 978 1810 1538 267 1827 1553 820 1776 1509Peak-hour factor, PHF 0.88 0.88 0.88 0.92 0.92 0.92 0.95 0.95 0.95 0.94 0.94 0.94Adj. Flow (vph) 330 258 561 210 322 890 398 317 158 126 302 98RTOR Reduction (vph) 0 0 143 0 0 197 0 0 121 0 0 75Lane Group Flow (vph) 330 258 418 210 322 693 398 317 37 126 302 23Heavy Vehicles (%) 5% 5% 5% 5% 5% 5% 4% 4% 4% 7% 7% 7%Turn Type pm+pt NA pm+ov pm+pt NA Perm pm+pt NA Perm pm+pt NA pm+ovProtected Phases 7 4 1 3 8 5 2 1 6 3Permitted Phases 4 4 8 8 2 2 6 6Actuated Green, G (s) 83.0 70.0 76.0 84.2 70.6 70.6 46.9 35.4 35.4 27.4 21.4 35.0Effective Green, g (s) 83.0 70.0 76.0 84.2 70.6 70.6 46.9 35.4 35.4 27.4 21.4 35.0Actuated g/C Ratio 0.55 0.47 0.51 0.56 0.47 0.47 0.31 0.24 0.24 0.18 0.14 0.23Clearance Time (s) 6.0 7.0 5.5 6.0 7.0 7.0 6.0 6.5 6.5 5.5 6.5 6.0Vehicle Extension (s) 3.0 3.0 3.0 3.0 3.0 3.0 3.0 3.0 3.0 3.0 3.0 3.0Lane Grp Cap (vph) 560 844 779 616 851 723 274 431 366 184 253 352v/s Ratio Prot c0.05 0.14 0.02 0.03 0.18 c0.19 0.17 0.03 0.17 0.01v/s Ratio Perm 0.27 0.25 0.16 c0.45 c0.27 0.02 0.10 0.01v/c Ratio 0.59 0.31 0.54 0.34 0.38 0.96 1.45 0.74 0.10 0.68 1.19 0.06Uniform Delay, d1 20.3 24.9 25.1 16.6 25.6 38.3 44.8 53.0 44.9 56.2 64.3 44.8Progression Factor 1.00 1.00 1.00 1.00 1.00 1.00 1.00 1.00 1.00 1.00 1.00 1.00Incremental Delay, d2 1.6 0.2 0.7 0.3 0.3 23.5 222.9 10.7 0.6 10.1 119.2 0.1Delay (s) 21.9 25.1 25.8 17.0 25.9 61.8 267.7 63.6 45.4 66.2 183.5 44.8Level of Service C C C B C E F E D E F DApproach Delay (s) 24.5 47.0 153.4 129.6Approach LOS C D F F
Intersection SummaryHCM 2000 Control Delay 74.8 HCM 2000 Level of Service EHCM 2000 Volume to Capacity ratio 1.12Actuated Cycle Length (s) 150.0 Sum of lost time (s) 25.5Intersection Capacity Utilization 98.0% ICU Level of Service FAnalysis Period (min) 15c Critical Lane Group

HCM Unsignalized Intersection Capacity Analysis2: River Rd & Stardust Way 3/19/2015
2040 Build without Pitchfork with I-526 4/6/2010 2040 Build without Pitchfork with I-526 Synchro 8 ReportPage 1
Movement EBL EBR NBL NBT SBT SBRLane ConfigurationsVolume (veh/h) 4 12 29 667 1296 4Sign Control Stop Free FreeGrade 0% 0% 0%Peak Hour Factor 0.64 0.64 0.89 0.89 0.88 0.88Hourly flow rate (vph) 6 19 33 749 1473 5PedestriansLane Width (ft)Walking Speed (ft/s)Percent BlockageRight turn flare (veh)Median type None NoneMedian storage veh)Upstream signal (ft)pX, platoon unblockedvC, conflicting volume 2290 1475 1477vC1, stage 1 conf volvC2, stage 2 conf volvCu, unblocked vol 2290 1475 1477tC, single (s) 6.4 6.2 4.2tC, 2 stage (s)tF (s) 3.5 3.3 2.3p0 queue free % 84 88 93cM capacity (veh/h) 40 156 435
Direction, Lane # EB 1 NB 1 SB 1Volume Total 25 782 1477Volume Left 6 33 0Volume Right 19 0 5cSH 91 435 1700Volume to Capacity 0.28 0.07 0.87Queue Length 95th (ft) 25 6 0Control Delay (s) 59.1 2.4 0.0Lane LOS F AApproach Delay (s) 59.1 2.4 0.0Approach LOS F
Intersection SummaryAverage Delay 1.5Intersection Capacity Utilization 78.5% ICU Level of Service DAnalysis Period (min) 15

HCM Unsignalized Intersection Capacity Analysis15: Maybank Hwy & Fenwick Hall Allee 3/19/2015
2040 Build without Pitchfork with I-526 4/6/2010 2040 Build without Pitchfork with I-526 Synchro 8 ReportPage 2
Movement EBL EBT EBR WBL WBT WBR NEL NET NER SWL SWT SWRLane ConfigurationsVolume (veh/h) 24 0 10 0 0 0 26 961 0 0 484 17Sign Control Stop Stop Free FreeGrade 0% 0% 0% 0%Peak Hour Factor 0.78 0.90 0.78 0.90 0.90 0.90 0.90 0.90 0.90 0.90 0.93 0.93Hourly flow rate (vph) 31 0 13 0 0 0 29 1068 0 0 520 18PedestriansLane Width (ft)Walking Speed (ft/s)Percent BlockageRight turn flare (veh) 3Median type None NoneMedian storage veh)Upstream signal (ft)pX, platoon unblockedvC, conflicting volume 1646 1646 260 1386 1664 1068 539 1068vC1, stage 1 conf volvC2, stage 2 conf volvCu, unblocked vol 1646 1646 260 1386 1664 1068 539 1068tC, single (s) 7.5 6.5 6.9 7.5 6.5 6.9 4.2 4.1tC, 2 stage (s)tF (s) 3.5 4.0 3.3 3.5 4.0 3.3 2.2 2.2p0 queue free % 52 100 98 100 100 100 97 100cM capacity (veh/h) 64 96 739 99 93 218 1012 648
Direction, Lane # EB 1 NE 1 NE 2 SW 1 SW 2 SW 3Volume Total 44 29 1068 260 260 18Volume Left 31 29 0 0 0 0Volume Right 13 0 0 0 0 18cSH 91 1012 1700 1700 1700 1700Volume to Capacity 0.48 0.03 0.63 0.15 0.15 0.01Queue Length 95th (ft) 51 2 0 0 0 0Control Delay (s) 77.0 8.7 0.0 0.0 0.0 0.0Lane LOS F AApproach Delay (s) 77.0 0.2 0.0Approach LOS F
Intersection SummaryAverage Delay 2.1Intersection Capacity Utilization 60.6% ICU Level of Service BAnalysis Period (min) 15

HCM Unsignalized Intersection Capacity Analysis19: Cane Slash Rd & River Rd 3/19/2015
2040 Build without Pitchfork with I-526 4/6/2010 2040 Build without Pitchfork with I-526 Synchro 8 ReportPage 3
Movement NBL NBT SBT SBR NEL NERLane ConfigurationsVolume (veh/h) 22 980 511 53 30 9Sign Control Free Free StopGrade 0% 0% 0%Peak Hour Factor 0.77 0.77 0.97 0.97 0.63 0.63Hourly flow rate (vph) 29 1273 527 55 48 14PedestriansLane Width (ft)Walking Speed (ft/s)Percent BlockageRight turn flare (veh)Median type None NoneMedian storage veh)Upstream signal (ft)pX, platoon unblockedvC, conflicting volume 581 1884 554vC1, stage 1 conf volvC2, stage 2 conf volvCu, unblocked vol 581 1884 554tC, single (s) 4.1 6.4 6.2tC, 2 stage (s)tF (s) 2.2 3.5 3.3p0 queue free % 97 37 97cM capacity (veh/h) 983 75 530
Direction, Lane # NB 1 SB 1 NE 1Volume Total 1301 581 62Volume Left 29 0 48Volume Right 0 55 14cSH 983 1700 94Volume to Capacity 0.03 0.34 0.66Queue Length 95th (ft) 2 0 81Control Delay (s) 1.2 0.0 98.6Lane LOS A FApproach Delay (s) 1.2 0.0 98.6Approach LOS F
Intersection SummaryAverage Delay 3.9Intersection Capacity Utilization 79.2% ICU Level of Service DAnalysis Period (min) 15


