222
U.S. Department of Transportation TRAFFIC SAFETY FACTS 2005 A Compilation of Motor Vehicle Crash Data from the Fatality Analysis Reporting System and the General Estimates System
U.S. Department of Transportation
TRAFFIC SAFETY FACTS 2005
A Compilation of Motor Vehicle Crash Data from theFatality Analysis Reporting System and the General Estimates System
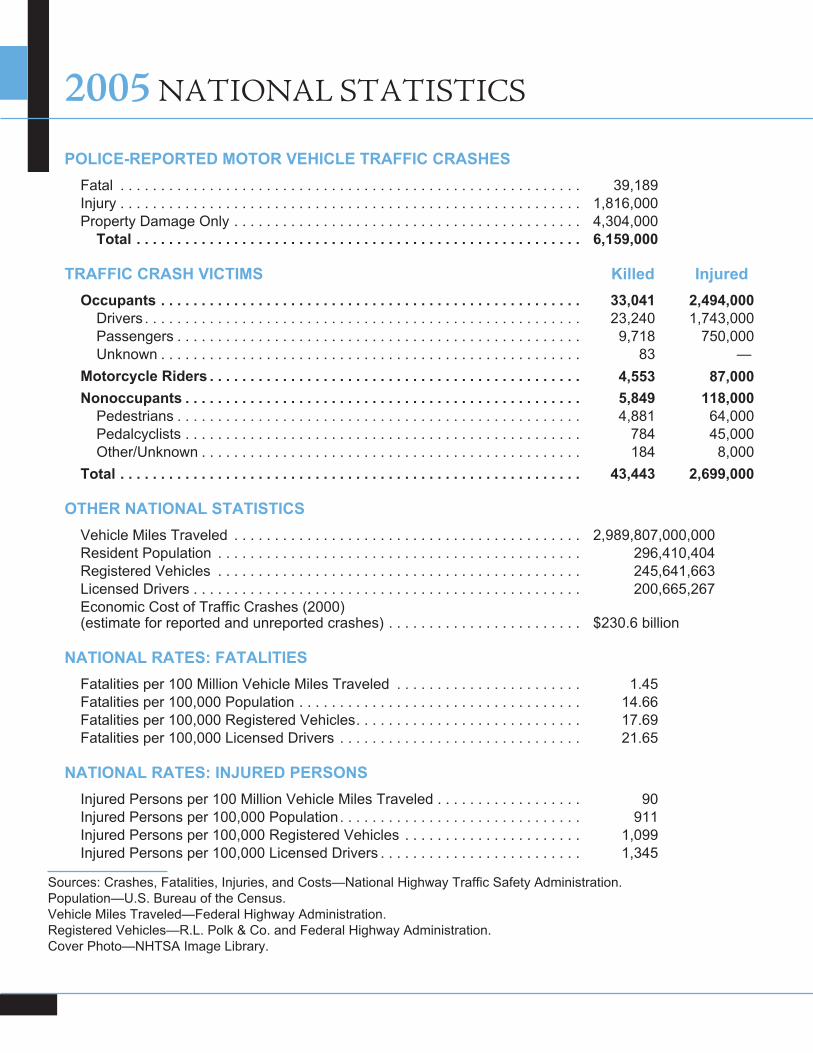
POLICE-REPORTED MOTOR VEHICLE TRAFFIC CRASHES
Fatal . . . . . . . . . . . . . . . . . . . . . . . . . . . . . . . . . . . . . . . . . . . . . . . . . . . . . . . . . 39,189Injury . . . . . . . . . . . . . . . . . . . . . . . . . . . . . . . . . . . . . . . . . . . . . . . . . . . . . . . . . 1,816,000Property Damage Only . . . . . . . . . . . . . . . . . . . . . . . . . . . . . . . . . . . . . . . . . . . 4,304,000
Total . . . . . . . . . . . . . . . . . . . . . . . . . . . . . . . . . . . . . . . . . . . . . . . . . . . . . . . 6,159,000
TRAFFIC CRASH VICTIMS Killed Injured
Occupants . . . . . . . . . . . . . . . . . . . . . . . . . . . . . . . . . . . . . . . . . . . . . . . . . . . . 33,041 2,494,000
Drivers . . . . . . . . . . . . . . . . . . . . . . . . . . . . . . . . . . . . . . . . . . . . . . . . . . . . . . 23,240 1,743,000Passengers . . . . . . . . . . . . . . . . . . . . . . . . . . . . . . . . . . . . . . . . . . . . . . . . . . 9,718 750,000Unknown . . . . . . . . . . . . . . . . . . . . . . . . . . . . . . . . . . . . . . . . . . . . . . . . . . . . 83 —
Motorcycle Riders . . . . . . . . . . . . . . . . . . . . . . . . . . . . . . . . . . . . . . . . . . . . . . 4,553 87,000
Nonoccupants . . . . . . . . . . . . . . . . . . . . . . . . . . . . . . . . . . . . . . . . . . . . . . . . . 5,849 118,000
Pedestrians . . . . . . . . . . . . . . . . . . . . . . . . . . . . . . . . . . . . . . . . . . . . . . . . . . 4,881 64,000Pedalcyclists . . . . . . . . . . . . . . . . . . . . . . . . . . . . . . . . . . . . . . . . . . . . . . . . . 784 45,000Other/Unknown . . . . . . . . . . . . . . . . . . . . . . . . . . . . . . . . . . . . . . . . . . . . . . . 184 8,000
Total . . . . . . . . . . . . . . . . . . . . . . . . . . . . . . . . . . . . . . . . . . . . . . . . . . . . . . . . . 43,443 2,699,000
OTHER NATIONAL STATISTICS
Vehicle Miles Traveled . . . . . . . . . . . . . . . . . . . . . . . . . . . . . . . . . . . . . . . . . . . 2,989,807,000,000Resident Population . . . . . . . . . . . . . . . . . . . . . . . . . . . . . . . . . . . . . . . . . . . . . 296,410,404Registered Vehicles . . . . . . . . . . . . . . . . . . . . . . . . . . . . . . . . . . . . . . . . . . . . . 245,641,663Licensed Drivers . . . . . . . . . . . . . . . . . . . . . . . . . . . . . . . . . . . . . . . . . . . . . . . . 200,665,267Economic Cost of Traffic Crashes (2000)(estimate for reported and unreported crashes) . . . . . . . . . . . . . . . . . . . . . . . . $230.6 billion
NATIONAL RATES: FATALITIES
Fatalities per 100 Million Vehicle Miles Traveled . . . . . . . . . . . . . . . . . . . . . . . 1.45Fatalities per 100,000 Population . . . . . . . . . . . . . . . . . . . . . . . . . . . . . . . . . . . 14.66Fatalities per 100,000 Registered Vehicles. . . . . . . . . . . . . . . . . . . . . . . . . . . . 17.69Fatalities per 100,000 Licensed Drivers . . . . . . . . . . . . . . . . . . . . . . . . . . . . . . 21.65
NATIONAL RATES: INJURED PERSONS
Injured Persons per 100 Million Vehicle Miles Traveled . . . . . . . . . . . . . . . . . . 90Injured Persons per 100,000 Population. . . . . . . . . . . . . . . . . . . . . . . . . . . . . . 911Injured Persons per 100,000 Registered Vehicles . . . . . . . . . . . . . . . . . . . . . . 1,099Injured Persons per 100,000 Licensed Drivers . . . . . . . . . . . . . . . . . . . . . . . . . 1,345
Sources: Crashes, Fatalities, Injuries, and Costs—National Highway Traffic Safety Administration.Population—U.S. Bureau of the Census.Vehicle Miles Traveled—Federal Highway Administration.Registered Vehicles—R.L. Polk & Co. and Federal Highway Administration.Cover Photo—NHTSA Image Library.
2005 NATIONAL STATISTICS
FOR MORE INFORMATIONInformation on motor vehicle crashes is available from the National Center for Statistics and Analysis,NPO-121, 400 Seventh Street, SW, Washington, DC 20590. NCSA information can also be obtained bytelephone or by fax-on-demand at 800-934-8517. FAX messages should be sent to 202-366-7078. To report asafety-related problem or to inquire about motor vehicle safety information, call the Auto Safety Hotline at888-327-4236. General information on highway traffic safety, which can be accessed by Internet users at website www.nhtsa.dot.gov/people/ncsa, includes the following annual NCSA fact sheets: Overview, Alcohol,Occupant Protection, Older Population, Speeding, Children, Young Drivers, Pedestrians, Bicyclists and Other Cyclists(formerly titled, Pedalcyclists), Motorcycles, Large Trucks, School Transportation-Related Crashes, State TrafficData, and State Alcohol Estimates.
DOT HS 810 631
Traffic Safety Facts 2005A Compilation of Motor Vehicle Crash Data from theFatality Analysis Reporting System and the General Estimates System
National Highway Traffic Safety AdministrationNational Center for Statistics and AnalysisU.S. Department of TransportationWashington, DC 20590

The National Highway Traffic Safety Administration (NHTSA) is pleased to present its Traffic Safety Facts2005: A Compilation of Motor Vehicle Crash Data from the Fatality Analysis Reporting System and the GeneralEstimates System. This report combines data from two of our key crash databases, providing statistics on trafficcrashes of all severities.
NHTSA’s mission is to reduce deaths, injuries, and economic losses from motor vehicle crashes. Although theNation’s crash fatality rate per 100 million vehicle miles of travel in 2005 increased, the injury rate declined. In2005 the fatality rate rose to 1.45 (up from 1.44 in 2004); however, it was the third consecutive year that the rateremained below 1.50. Nearly 6.2 million police-reported motor vehicle crashes occurred on our highways in2005—one every 5 seconds. The number of people injured in these crashes continued a steady decline. On average,a person was injured in a police-reported motor vehicle crash every 12 seconds, and someone was killed every 12minutes.
Alcohol and automobiles are a lethal combination, which is why we are working closely with our law enforcementand national advocacy partners to get even tougher on drunk drivers. We have seen alcohol-related fatalitiesplummet since the 1980s because police enforce drunk driving laws, and the public is aware of this enforcement.Alcohol-related fatalities declined in 2005, to 16,885, the third consecutive year in which alcohol-related fatalitieshave declined. Unfortunately, 14,539 persons still were killed in crashes that involved a driver or nonoccupant withblood alcohol concentration of .08 grams per deciliter or greater.
I believe the most promising gains in highway safety are going to come from the deployment of crash avoidancetechnologies. Today the technology exists not only to ameliorate the severity of the crash, but to help prevent itoutright. We are on the cusp of making dramatic and sustained gains in highway safety due to new safetytechnologies. For example, NHTSA has proposed a rule mandating electronic stability control to preventrollovers. We anticipate that because of this rulemaking, fewer lives will be lost due to vehicles rolling over in acrash, a number that increased to 10,816 in 2005.
But for all the resources, technology, and education at our disposal, we must never forget that safety starts with thefamily. It needs to be at the top of every family’s priorities list because vehicle safety has an impact on every family.Parents and caregivers must accept that providing and teaching safety, in all its forms, is their most importantresponsibility. Because of all the efforts in increasing safety belt use, many families have been spared the grief andsuffering that too often accompanies motor vehicle crashes.
I want to acknowledge the hard work of States and localities throughout the country who collect, code, and reportmuch of the information contained in this document. Quality information is critical to NHTSA’s efforts in itsimportant mission of saving lives. We cannot accomplish that mission without their dedicated work.
I hope users of this publication find the information helpful.
Nicole R. NasonAdministratorNational Highway Traffic Safety Administration
2005 Motor Vehicle Crash Data from FARS and GES
ADMINISTRATOR’S MESSAGE
iii

Introduction. . . . . . . . . . . . . . . . . . . . . . . . . . . . . . . . . . . . . . . . . . . . . . . . . . . . . . . . . . . . . . . . . . . . . . . . . . . . . . 1
FARS Operations . . . . . . . . . . . . . . . . . . . . . . . . . . . . . . . . . . . . . . . . . . . . . . . . . . . . . . . . . . . . . . . . . . . . . . . . . 3
GES Operations . . . . . . . . . . . . . . . . . . . . . . . . . . . . . . . . . . . . . . . . . . . . . . . . . . . . . . . . . . . . . . . . . . . . . . . . . . 5
About This Report . . . . . . . . . . . . . . . . . . . . . . . . . . . . . . . . . . . . . . . . . . . . . . . . . . . . . . . . . . . . . . . . . . . . . . . . 7
Data Availability . . . . . . . . . . . . . . . . . . . . . . . . . . . . . . . . . . . . . . . . . . . . . . . . . . . . . . . . . . . . . . . . . . . . . . . . . . 9
1. Trends . . . . . . . . . . . . . . . . . . . . . . . . . . . . . . . . . . . . . . . . . . . . . . . . . . . . . . . . . . . . . . . . . . . . . . . . . . . . . . . . 13
2. Crashes . . . . . . . . . . . . . . . . . . . . . . . . . . . . . . . . . . . . . . . . . . . . . . . . . . . . . . . . . . . . . . . . . . . . . . . . . . . . . . . . 43
3. Vehicles . . . . . . . . . . . . . . . . . . . . . . . . . . . . . . . . . . . . . . . . . . . . . . . . . . . . . . . . . . . . . . . . . . . . . . . . . . . . . . . 61
4. People . . . . . . . . . . . . . . . . . . . . . . . . . . . . . . . . . . . . . . . . . . . . . . . . . . . . . . . . . . . . . . . . . . . . . . . . . . . . . . . . . 85
5. States . . . . . . . . . . . . . . . . . . . . . . . . . . . . . . . . . . . . . . . . . . . . . . . . . . . . . . . . . . . . . . . . . . . . . . . . . . . . . . . . . 139
Appendix A. FARS Data Elements . . . . . . . . . . . . . . . . . . . . . . . . . . . . . . . . . . . . . . . . . . . . . . . . . . . . . . . . . . 189
Crash Level. . . . . . . . . . . . . . . . . . . . . . . . . . . . . . . . . . . . . . . . . . . . . . . . . . . . . . . . . . . . . . . . . . . . . . . . . . . . . . . . . 189
Vehicle Level . . . . . . . . . . . . . . . . . . . . . . . . . . . . . . . . . . . . . . . . . . . . . . . . . . . . . . . . . . . . . . . . . . . . . . . . . . . . . . . 189
Driver Level . . . . . . . . . . . . . . . . . . . . . . . . . . . . . . . . . . . . . . . . . . . . . . . . . . . . . . . . . . . . . . . . . . . . . . . . . . . . . . . . 190
Person Level . . . . . . . . . . . . . . . . . . . . . . . . . . . . . . . . . . . . . . . . . . . . . . . . . . . . . . . . . . . . . . . . . . . . . . . . . . . . . . . . 190
Appendix B. GES Data Elements . . . . . . . . . . . . . . . . . . . . . . . . . . . . . . . . . . . . . . . . . . . . . . . . . . . . . . . . . . . . 191
Crash Level. . . . . . . . . . . . . . . . . . . . . . . . . . . . . . . . . . . . . . . . . . . . . . . . . . . . . . . . . . . . . . . . . . . . . . . . . . . . . . . . . 191
Vehicle/Driver Level . . . . . . . . . . . . . . . . . . . . . . . . . . . . . . . . . . . . . . . . . . . . . . . . . . . . . . . . . . . . . . . . . . . . . . . . 191
Person Level . . . . . . . . . . . . . . . . . . . . . . . . . . . . . . . . . . . . . . . . . . . . . . . . . . . . . . . . . . . . . . . . . . . . . . . . . . . . . . . . 192
Appendix C. GES Technical Notes . . . . . . . . . . . . . . . . . . . . . . . . . . . . . . . . . . . . . . . . . . . . . . . . . . . . . . . . . . 193
Standard Errors. . . . . . . . . . . . . . . . . . . . . . . . . . . . . . . . . . . . . . . . . . . . . . . . . . . . . . . . . . . . . . . . . . . . . . . . . . . . . 193
Unknowns . . . . . . . . . . . . . . . . . . . . . . . . . . . . . . . . . . . . . . . . . . . . . . . . . . . . . . . . . . . . . . . . . . . . . . . . . . . . . . . . . 195
Glossary . . . . . . . . . . . . . . . . . . . . . . . . . . . . . . . . . . . . . . . . . . . . . . . . . . . . . . . . . . . . . . . . . . . . . . . . . . . . . . . . . 197
Index . . . . . . . . . . . . . . . . . . . . . . . . . . . . . . . . . . . . . . . . . . . . . . . . . . . . . . . . . . . . . . . . . . . . . . . . . . . . . . . . . . . . 201
2005 Motor Vehicle Crash Data from FARS and GES
TABLE OF CONTENTS
v
vi
TRENDS: General1. Crashes by Crash Severity, 1988-2005 . . . . . . . . . . . . . . . . . . . . . . . . . . . . . . . . . . . . . . . . . . . . . . . . . . . . . . . 142. Persons Killed or Injured and Fatality and Injury Rates per Population, Licensed Drivers,
Registered Vehicles, and Vehicle Miles Traveled, 1966-2005 . . . . . . . . . . . . . . . . . . . . . . . . . . . . . . . . . . . 153. Vehicles Involved in Crashes and Involvement Rates per Vehicle Miles of Travel
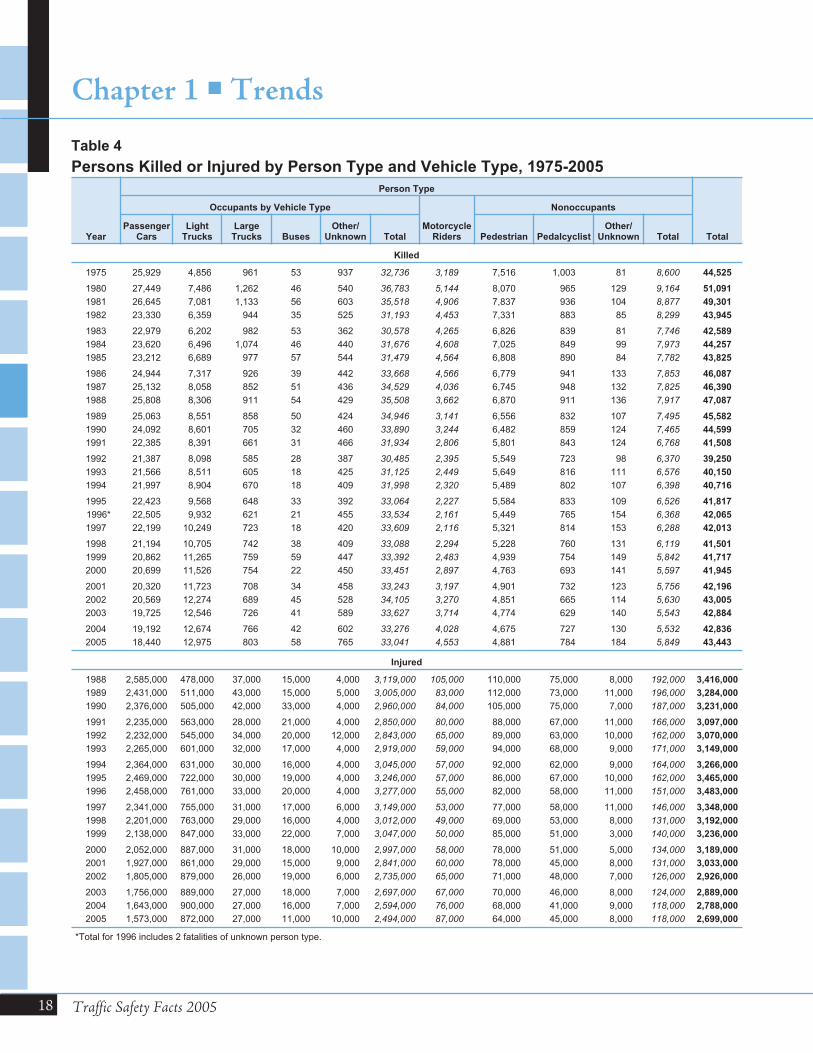
and per Registered Vehicle by Vehicle Type and Crash Severity, 1975-2005 . . . . . . . . . . . . . . . . . . . . . . 174. Persons Killed or Injured by Person Type and Vehicle Type, 1975-2005 . . . . . . . . . . . . . . . . . . . . . . . . . 185. Drivers Involved in Crashes and Involvement Rates per Licensed Driver by Sex and
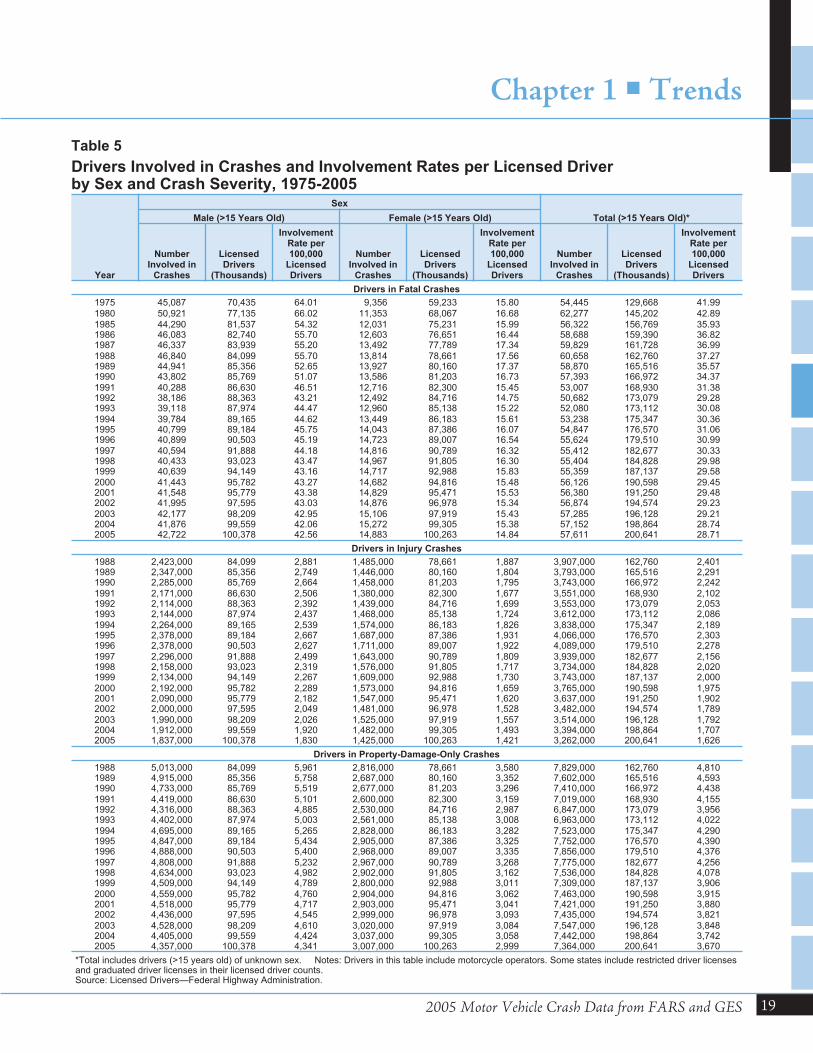
Crash Severity, 1975-2005 . . . . . . . . . . . . . . . . . . . . . . . . . . . . . . . . . . . . . . . . . . . . . . . . . . . . . . . . . . . . . . . . . 19
TRENDS: Occupants6. Motor Vehicle Occupant and Motorcycle Rider Fatality and Injury Rates
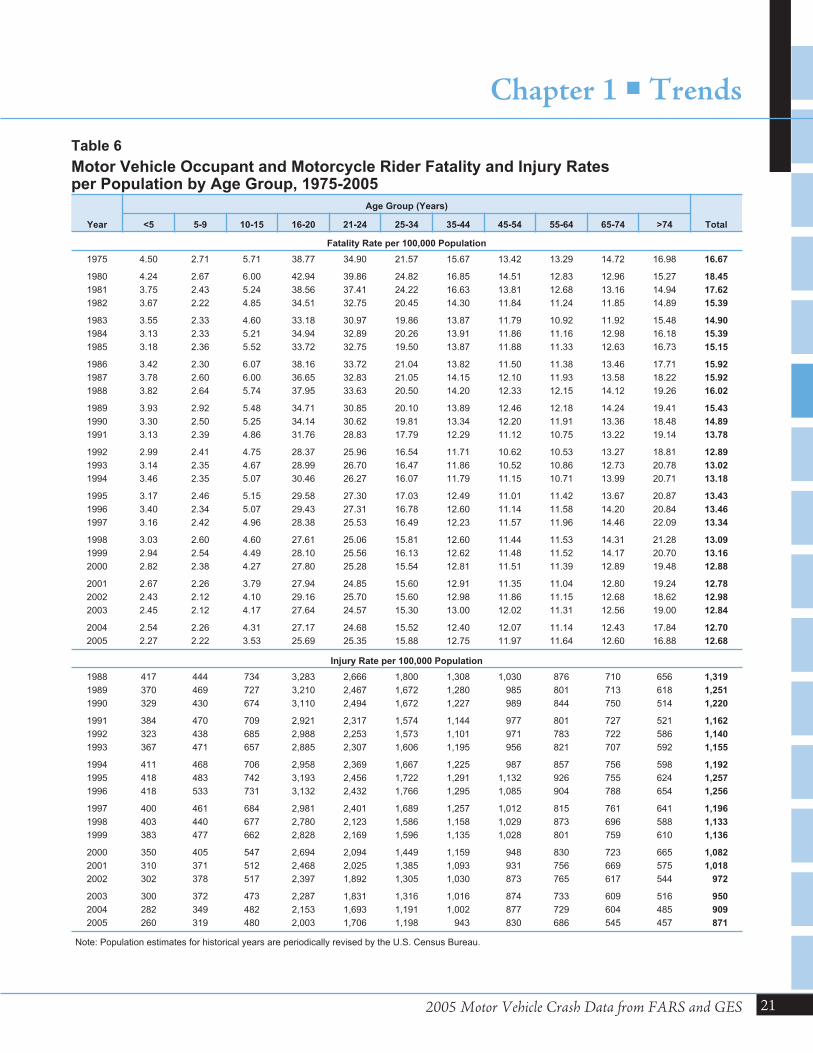
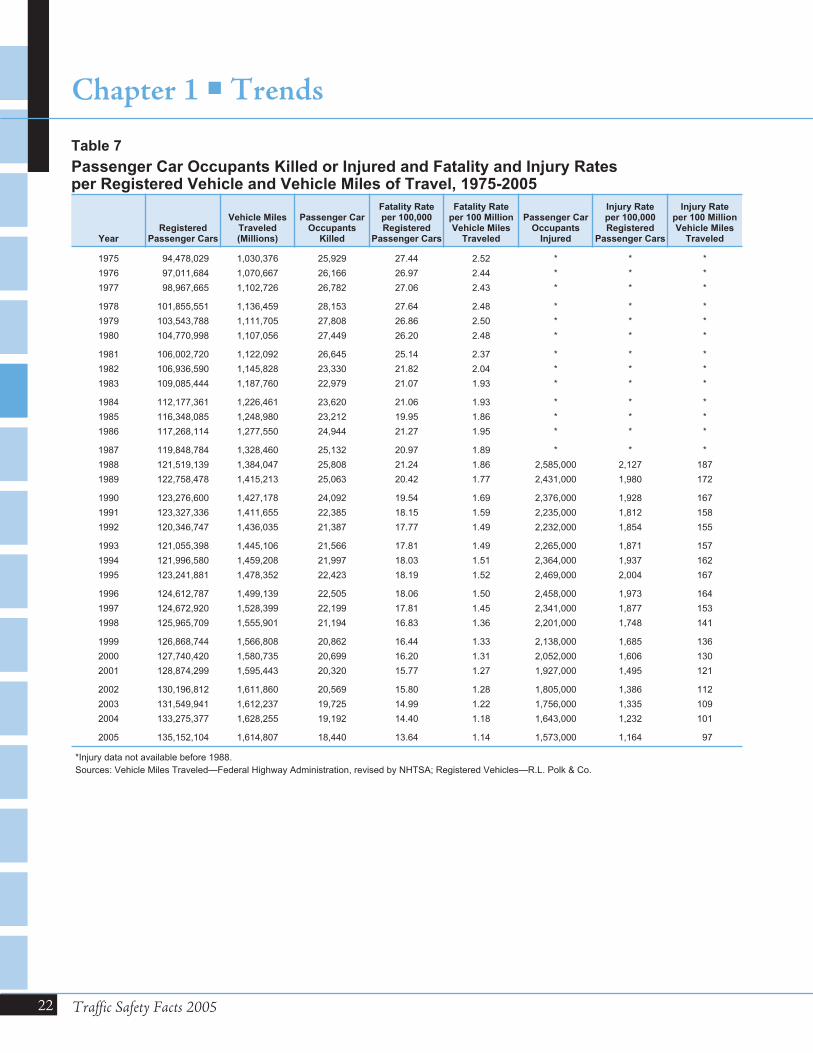
per Population by Age Group, 1975-2005. . . . . . . . . . . . . . . . . . . . . . . . . . . . . . . . . . . . . . . . . . . . . . . . . . . . 217. Passenger Car Occupants Killed or Injured and Fatality and Injury Rates
per Registered Vehicle and Vehicle Miles of Travel, 1975-2005 . . . . . . . . . . . . . . . . . . . . . . . . . . . . . . . . . 228. Light Truck Occupants Killed or Injured and Fatality and Injury Rates
per Registered Vehicle and Vehicle Miles of Travel, 1975-2005 . . . . . . . . . . . . . . . . . . . . . . . . . . . . . . . . . 249. Large Truck Occupants Killed or Injured and Fatality and Injury Rates
per Registered Vehicle and Vehicle Miles of Travel, 1975-2005 . . . . . . . . . . . . . . . . . . . . . . . . . . . . . . . . . 2610. Motorcycle Riders Killed or Injured and Fatality and Injury Rates
per Registered Vehicle and Vehicle Miles of Travel, 1975-2005 . . . . . . . . . . . . . . . . . . . . . . . . . . . . . . . . . 28
TRENDS: Large Truck Related11. Persons Killed or Injured in Crashes Involving a Large Truck by Person Type
and Crash Type, 1975-2005. . . . . . . . . . . . . . . . . . . . . . . . . . . . . . . . . . . . . . . . . . . . . . . . . . . . . . . . . . . . . . . . 30
TRENDS: Nonoccupants12. Nonoccupant Fatality and Injury Rates per Population by Age Group, 1975-2005 . . . . . . . . . . . . . . . . 31
TRENDS: Alcohol13. Persons Killed, by Highest Blood Alcohol Concentration (BAC) in the Crash, 1982-2005. . . . . . . . . . 3214. Persons Killed and Percent Alcohol-Related During Holiday Periods, 1982-2005 . . . . . . . . . . . . . . . . . 3315. Drivers in Fatal Crashes by Blood Alcohol Concentration (BAC) and Time of Day, 1982-2005 . . . . . 3416. Drivers in Fatal Crashes by Blood Alcohol Concentration (BAC) and Sex, 1982-2005 . . . . . . . . . . . . . 3417. Drivers in Fatal Crashes by Blood Alcohol Concentration (BAC) and Vehicle Type, 1982-2005 . . . . 3518. Drivers in Fatal Crashes by Blood Alcohol Concentration (BAC) and Age, 1982-2005 . . . . . . . . . . . . . 3619. Drivers in Fatal Crashes by Blood Alcohol Concentration (BAC) and Survival Status, 1982-2005 . . . 3820. Pedestrians Killed, 14 Years and Older, by Blood Alcohol Concentration (BAC), 1982-2005 . . . . . . . 38
TRENDS: Restraints21. Drivers of Passenger Cars and Light Trucks in Crashes by Crash Severity and
Restraint Use, 1975-2005 . . . . . . . . . . . . . . . . . . . . . . . . . . . . . . . . . . . . . . . . . . . . . . . . . . . . . . . . . . . . . . . . . . 3922. Occupants of Passenger Cars and Light Trucks Killed or Injured, by Restraint Use, 1975-2005 . . . . . 40
Traffic Safety Facts 2005
TABLES
CRASHES: Time23. Crashes and Crash Rates by Month and Crash Severity . . . . . . . . . . . . . . . . . . . . . . . . . . . . . . . . . . . . . . . . 4424. Crashes by Time of Day, Day of Week, and Crash Severity. . . . . . . . . . . . . . . . . . . . . . . . . . . . . . . . . . . . . 4525. Crashes by Weather Condition, Light Condition, and Crash Severity . . . . . . . . . . . . . . . . . . . . . . . . . . . . 4726. Fatal Crashes by Emergency Medical Services (EMS) Response Times
Within Designated Minutes and by Land Use . . . . . . . . . . . . . . . . . . . . . . . . . . . . . . . . . . . . . . . . . . . . . . . . 48
CRASHES: Location27. Crashes by Crash Type, Relation to Roadway, and Crash Severity . . . . . . . . . . . . . . . . . . . . . . . . . . . . . . . 4928. Crashes by Relation to Junction, Traffic Control Device, and Crash Severity . . . . . . . . . . . . . . . . . . . . . . 5029. Crashes by Speed Limit, Crash Type, and Crash Severity . . . . . . . . . . . . . . . . . . . . . . . . . . . . . . . . . . . . . . 5130. Fatal Crashes by Speed Limit and Land Use . . . . . . . . . . . . . . . . . . . . . . . . . . . . . . . . . . . . . . . . . . . . . . . . . . 5231. Crashes by Number of Lanes, Trafficway Flow, and Crash Severity. . . . . . . . . . . . . . . . . . . . . . . . . . . . . . 53
CRASHES: Circumstances32. Crashes by First Harmful Event, Manner of Collision, and Crash Severity . . . . . . . . . . . . . . . . . . . . . . . . 5433. Two-Vehicle Crashes by Vehicle Type and Crash Severity . . . . . . . . . . . . . . . . . . . . . . . . . . . . . . . . . . . . . 55
CRASHES: Alcohol34. Crashes and Percent Alcohol Related by Time of Day, Crash Type, and Crash Severity . . . . . . . . . . . . 56
VEHICLES: All Vehicles35. Vehicles Involved in Crashes by Vehicle Type and Crash Severity . . . . . . . . . . . . . . . . . . . . . . . . . . . . . . . 6236. Vehicles Involved in Fatal Crashes by Body Type . . . . . . . . . . . . . . . . . . . . . . . . . . . . . . . . . . . . . . . . . . . . . 6337. Vehicles Involved in Crashes by Vehicle Type, Rollover Occurrence, and Crash Severity . . . . . . . . . . . 6438. Vehicles Involved in Crashes by Vehicle Type, Fire Occurrence, and Crash Severity . . . . . . . . . . . . . . . 6639. Vehicles Involved in Single- and Two-Vehicle Crashes by Vehicle Maneuver and Crash Severity . . . . 6740. Vehicles Involved in Fatal Crashes by Roadway Function Class, Crash Type,
and Hazardous Cargo . . . . . . . . . . . . . . . . . . . . . . . . . . . . . . . . . . . . . . . . . . . . . . . . . . . . . . . . . . . . . . . . . . . . . 68
VEHICLES: Passenger Cars41. Passenger Cars Involved in Crashes by Most Harmful Event and Crash Severity . . . . . . . . . . . . . . . . . . 7142. Passenger Cars Involved in Crashes by Initial Point of Impact, Crash Severity, and Crash Type . . . . . 72
VEHICLES: Light Trucks43. Light Trucks Involved in Crashes by Most Harmful Event and Crash Severity . . . . . . . . . . . . . . . . . . . . 7344. Light Trucks Involved in Crashes by Initial Point of Impact, Crash Severity, and Crash Type . . . . . . . 74
VEHICLES: Large Trucks45. Large Trucks Involved in Crashes by Most Harmful Event and Crash Severity . . . . . . . . . . . . . . . . . . . . 7546. Large Trucks Involved in Crashes by Initial Point of Impact, Crash Severity, and Crash Type . . . . . . . 7647. Large Trucks Involved in Crashes by Truck Type, Rollover Occurrence, and Crash Severity . . . . . . . . 7748. Truck Tractors with Trailers Involved in Crashes by Number of Trailers,
Jackknife Occurrence, and Crash Severity . . . . . . . . . . . . . . . . . . . . . . . . . . . . . . . . . . . . . . . . . . . . . . . . . . . . 78
2005 Motor Vehicle Crash Data from FARS and GES
Tables (Continued)
vii
viii
VEHICLES: Motorcycles49. Motorcycles Involved in Crashes by Most Harmful Event and Crash Severity . . . . . . . . . . . . . . . . . . . . . 7950. Motorcycles Involved in Crashes by Initial Point of Impact, Crash Severity, and Crash Type . . . . . . . . 80
VEHICLES: Buses51. Buses Involved in Crashes by Most Harmful Event and Crash Severity . . . . . . . . . . . . . . . . . . . . . . . . . . . 8152. Buses Involved in Crashes by Initial Point of Impact, Crash Severity, and Crash Type. . . . . . . . . . . . . . 82
PEOPLE: All Victims53. Persons Killed or Injured, by Person Type and Injury Severity . . . . . . . . . . . . . . . . . . . . . . . . . . . . . . . . . . 8654. Persons Killed or Injured, by Age and Injury Severity . . . . . . . . . . . . . . . . . . . . . . . . . . . . . . . . . . . . . . . . . . 8655. Persons Killed or Injured, by Sex and Injury Severity . . . . . . . . . . . . . . . . . . . . . . . . . . . . . . . . . . . . . . . . . . 8656. Persons Killed or Injured and Fatality and Injury Rates per 100,000 Population, by Age and Sex . . . . 8857. Persons Killed or Injured in Crashes, by Weather Condition and Light Condition. . . . . . . . . . . . . . . . . 9058. Persons Killed or Injured in Crashes, by Speed Limit and Crash Type . . . . . . . . . . . . . . . . . . . . . . . . . . . 9059. Persons Killed in Crashes, by Speed Limit and Land Use. . . . . . . . . . . . . . . . . . . . . . . . . . . . . . . . . . . . . . . 9160. Persons Killed or Injured in Crashes and Percent Alcohol Related,
by Time of Day and Crash Type . . . . . . . . . . . . . . . . . . . . . . . . . . . . . . . . . . . . . . . . . . . . . . . . . . . . . . . . . . . . 9261. Persons Killed in Construction/Maintenance Zones, by Roadway Function Class
and Person Type. . . . . . . . . . . . . . . . . . . . . . . . . . . . . . . . . . . . . . . . . . . . . . . . . . . . . . . . . . . . . . . . . . . . . . . . . . 9462. Persons Killed in Crashes Involving Emergency Vehicles, by Person Type,
Crash Type, and Vehicle Type . . . . . . . . . . . . . . . . . . . . . . . . . . . . . . . . . . . . . . . . . . . . . . . . . . . . . . . . . . . . . 94
PEOPLE: Drivers63. Driver Involvement Rates per 100,000 Licensed Drivers, by Age, Sex, and Crash Severity. . . . . . . . . . . 98
64. Drivers and Motorcycle Operators Involved in Fatal Crashes, by Previous Driving Recordand License Type Compliance . . . . . . . . . . . . . . . . . . . . . . . . . . . . . . . . . . . . . . . . . . . . . . . . . . . . . . . . . . . . . . 100
65. Related Factors for Drivers and Motorcycle Operators Involved in Fatal Crashes . . . . . . . . . . . . . . . . . . 100
PEOPLE: Occupants66. Vehicle Occupants Killed or Injured, by Vehicle Type, Person Type, and Injury Severity . . . . . . . . . . . 101
67. Vehicle Occupants Killed or Injured, by Sex and Vehicle Type . . . . . . . . . . . . . . . . . . . . . . . . . . . . . . . . . 102
68. Vehicle Occupants Killed or Injured, by Age and Vehicle Type . . . . . . . . . . . . . . . . . . . . . . . . . . . . . . . . . 103
69. Vehicle Occupants Killed or Injured, by Age, Person Type, and Sex . . . . . . . . . . . . . . . . . . . . . . . . . . . . . 104
70. Vehicle Occupants Killed or Injured, by Vehicle Type and Most Harmful Event . . . . . . . . . . . . . . . . . . 105
71. Vehicle Occupants Killed or Injured, by Initial Point of Impact and Vehicle Type . . . . . . . . . . . . . . . . . 106
72. Vehicle Occupants Killed or Injured, by Vehicle Type and Ejection . . . . . . . . . . . . . . . . . . . . . . . . . . . . . 107
73. Occupants Killed or Injured in Two-Vehicle Crashes, by Vehicle Types Involved . . . . . . . . . . . . . . . . . 108
74. Occupants Involved in Fatal Crashes and Occupant Fatalities, by Vehicle Body Type . . . . . . . . . . . . . . 109
75. Passenger Car Occupants Involved in Fatal Crashes and Occupants Killed, by Car Wheelbase Size . . 110
Traffic Safety Facts 2005
Tables (Continued)
PEOPLE: Alcohol76. Persons Killed or Injured in Alcohol-Related Crashes, by Person Type and Injury Severity . . . . . . . . . 111
77. Drivers and Motorcycle Operators Involved in Crashes, by Age, Alcohol Involvement,and Crash Severity . . . . . . . . . . . . . . . . . . . . . . . . . . . . . . . . . . . . . . . . . . . . . . . . . . . . . . . . . . . . . . . . . . . . . . . . 112
78. Drivers and Motorcycle Operators Killed or Injured, by Time of Day, Day of Week,Age, Alcohol Involvement, and Crash Type . . . . . . . . . . . . . . . . . . . . . . . . . . . . . . . . . . . . . . . . . . . . . . . . . . 114
79. Drivers and Motorcycle Operators Killed in Crashes, by Age and Driver’sBlood Alcohol Concentration (BAC) . . . . . . . . . . . . . . . . . . . . . . . . . . . . . . . . . . . . . . . . . . . . . . . . . . . . . . . . 114
80. Drivers and Motorcycle Operators Involved in Crashes, by Vehicle Type,Alcohol Involvement, and Crash Severity. . . . . . . . . . . . . . . . . . . . . . . . . . . . . . . . . . . . . . . . . . . . . . . . . . . . . 116
81. Persons Killed, by Age and Highest Blood Alcohol Concentration (BAC) in the Crash . . . . . . . . . . . . 117
82. Pedestrians Killed, by Pedestrian’s and Driver’s Blood Alcohol Concentration (BAC) . . . . . . . . . . . . . . 117
PEOPLE: Restraints83. Drivers Involved in Crashes, by Vehicle Type, Restraint Use, and Crash Severity . . . . . . . . . . . . . . . . . . 118
84. Passenger Car and Light Truck Occupants Killed or Injured, by Age and Restraint Use . . . . . . . . . . . . 119
85. Passenger Car and Light Truck Occupant Survivors of Fatal Crashes, by Age and Restraint Use. . . . . 120
86. Passenger Car Occupants Killed or Injured, by Seating Position and Restraint Use . . . . . . . . . . . . . . . . 121
87. Light Truck Occupants Killed or Injured, by Seating Position and Restraint Use . . . . . . . . . . . . . . . . . . 122
88. Passenger Car and Light Truck Occupants Killed or Injured, by Restraint Useand Type of Restraint . . . . . . . . . . . . . . . . . . . . . . . . . . . . . . . . . . . . . . . . . . . . . . . . . . . . . . . . . . . . . . . . . . . . . 123
PEOPLE: Motorcycle Riders89. Motorcycle Riders Killed or Injured, by Time of Day and Day of Week . . . . . . . . . . . . . . . . . . . . . . . . . . 124
90. Motorcycle Riders Killed, by Person Type and Helmet Use . . . . . . . . . . . . . . . . . . . . . . . . . . . . . . . . . . . . 126
91. Motorcycle Operators Involved in Fatal Crashes, by Age and License Compliance . . . . . . . . . . . . . . . . . 126
PEOPLE: School Bus Related92. Pedestrians Killed in School Bus Related Crashes, by Age and Striking Vehicle . . . . . . . . . . . . . . . . . . . 127
93. Persons Killed or Injured in School Bus Related Crashes, by Person Type . . . . . . . . . . . . . . . . . . . . . . . . 127
PEOPLE: Pedestrians94. Pedestrians Killed or Injured, by Age and Location . . . . . . . . . . . . . . . . . . . . . . . . . . . . . . . . . . . . . . . . . . . . 128
95. Pedestrians Killed or Injured and Fatality and Injury Rates per 100,000 Population,by Age and Sex . . . . . . . . . . . . . . . . . . . . . . . . . . . . . . . . . . . . . . . . . . . . . . . . . . . . . . . . . . . . . . . . . . . . . . . . . . . 129
96. Pedestrians Killed or Injured, by Time of Day and Day of Week . . . . . . . . . . . . . . . . . . . . . . . . . . . . . . . . 130
97. Pedestrians Killed or Injured in Single-Vehicle Crashes, by Vehicle Type andInitial Point of Impact . . . . . . . . . . . . . . . . . . . . . . . . . . . . . . . . . . . . . . . . . . . . . . . . . . . . . . . . . . . . . . . . . . . . . 132
98. Pedestrians Killed, by Related Factors . . . . . . . . . . . . . . . . . . . . . . . . . . . . . . . . . . . . . . . . . . . . . . . . . . . . . . . 132
2005 Motor Vehicle Crash Data from FARS and GES
Tables (Continued)
ix
x
PEOPLE: Pedalcyclists99. Pedalcyclists Killed or Injured, by Age and Location . . . . . . . . . . . . . . . . . . . . . . . . . . . . . . . . . . . . . . . . . . . 133
100. Pedalcyclists Killed or Injured and Fatality and Injury Rates per 100,000 Population,by Age and Sex . . . . . . . . . . . . . . . . . . . . . . . . . . . . . . . . . . . . . . . . . . . . . . . . . . . . . . . . . . . . . . . . . . . . . . . . . . . 134
101. Pedalcyclists Killed or Injured, by Time of Day and Day of Week . . . . . . . . . . . . . . . . . . . . . . . . . . . . . . . 135
102. Pedalcyclists Killed or Injured in Single-Vehicle Crashes, by Vehicle Typeand Initial Point of Impact . . . . . . . . . . . . . . . . . . . . . . . . . . . . . . . . . . . . . . . . . . . . . . . . . . . . . . . . . . . . . . . . . 136
103. Pedalcyclists Killed, by Related Factors . . . . . . . . . . . . . . . . . . . . . . . . . . . . . . . . . . . . . . . . . . . . . . . . . . . . . . 136
STATES: Crashes and All Victims104. 2005 Traffic Fatalities by State and Percent Change from 2004 . . . . . . . . . . . . . . . . . . . . . . . . . . . . . . . . . 140
105. Fatal Crashes, by State and First Harmful Event . . . . . . . . . . . . . . . . . . . . . . . . . . . . . . . . . . . . . . . . . . . . . . 142
106. Fatal Crashes, by State and Roadway Function Class . . . . . . . . . . . . . . . . . . . . . . . . . . . . . . . . . . . . . . . . . . 144
107. Fatalities, by State and Roadway Function Class . . . . . . . . . . . . . . . . . . . . . . . . . . . . . . . . . . . . . . . . . . . . . . 146
108. Persons Killed, Licensed Drivers, Registered Vehicles, Population, and Fatality Rates by State . . . . . . 148
109. Persons Killed, by State and Person Type . . . . . . . . . . . . . . . . . . . . . . . . . . . . . . . . . . . . . . . . . . . . . . . . . . . . 150
110. Persons Killed, by State and Age Group . . . . . . . . . . . . . . . . . . . . . . . . . . . . . . . . . . . . . . . . . . . . . . . . . . . . . 152
STATES: Occupants111. Occupants Killed, by State and Vehicle Type . . . . . . . . . . . . . . . . . . . . . . . . . . . . . . . . . . . . . . . . . . . . . . . . . 154
112. Passenger Car and Light Truck Occupants Killed, by State and Restraint Use . . . . . . . . . . . . . . . . . . . . 156
STATES: Pedestrians113. 2005 Ranking of State Pedestrian Fatality Rates . . . . . . . . . . . . . . . . . . . . . . . . . . . . . . . . . . . . . . . . . . . . . . 158
STATES: Alcohol114. Persons Killed, by State and Highest Blood Alcohol Concentration (BAC) in the Crash . . . . . . . . . . . 160
115. Drivers Involved in Fatal Crashes, by State and Blood Alcohol Concentration (BAC) of the Driver . . 162
116. Drivers Killed in Fatal Crashes, by State and Blood Alcohol Concentration (BAC) of the Driver . . . . 164
117. Surviving Drivers Involved in Fatal Crashes, by State andBlood Alcohol Concentration (BAC) of the Driver . . . . . . . . . . . . . . . . . . . . . . . . . . . . . . . . . . . . . . . . . . . . 166
STATES: Speeding118. Speeding-Related Traffic Fatalities, by Road Type and Speed Limit . . . . . . . . . . . . . . . . . . . . . . . . . . . . . 168
STATES: Emergency Medical Services119. Rural Fatal Crashes, by State and Average Emergency Medical Services (EMS)
Response Times . . . . . . . . . . . . . . . . . . . . . . . . . . . . . . . . . . . . . . . . . . . . . . . . . . . . . . . . . . . . . . . . . . . . . . . . . . 170
120. Urban Fatal Crashes, by State and Average Emergency Medical Services (EMS)Response Times . . . . . . . . . . . . . . . . . . . . . . . . . . . . . . . . . . . . . . . . . . . . . . . . . . . . . . . . . . . . . . . . . . . . . . . . . . 172
Traffic Safety Facts 2005
Tables (Continued)
STATES: City Rates121. Persons Killed, Population, and Fatality Rates by City . . . . . . . . . . . . . . . . . . . . . . . . . . . . . . . . . . . . . . . . . 174
STATES: Fatalities and Fatality Rates122. Fatalities and Fatality Rates by State, 1975-2005 . . . . . . . . . . . . . . . . . . . . . . . . . . . . . . . . . . . . . . . . . . . . . . 178
STATES: Laws123. Key Provisions of Occupant Restraint Laws . . . . . . . . . . . . . . . . . . . . . . . . . . . . . . . . . . . . . . . . . . . . . . . . . . 180
124. History of State Motorcycle Helmet Laws . . . . . . . . . . . . . . . . . . . . . . . . . . . . . . . . . . . . . . . . . . . . . . . . . . . 184
125. States With .08 Blood Alcohol Concentration Illegal Per Se Laws . . . . . . . . . . . . . . . . . . . . . . . . . . . . . . . 186
2005 Motor Vehicle Crash Data from FARS and GES
Tables (Continued)
xi
xii
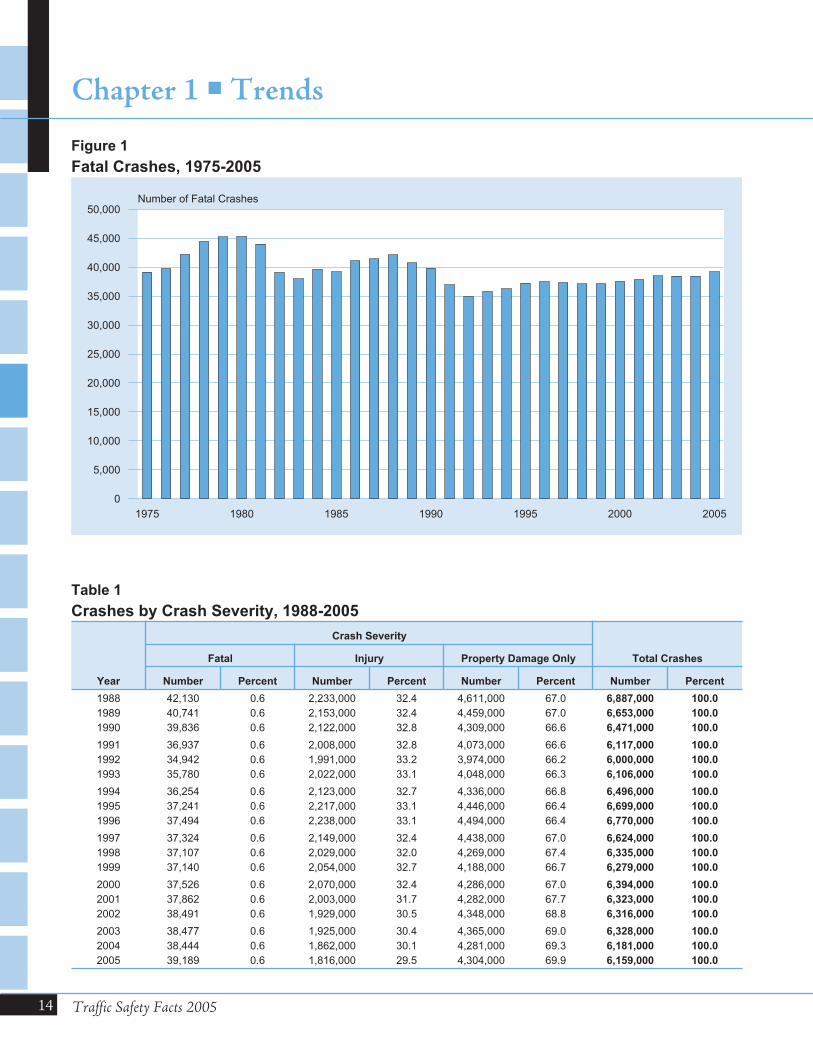
TRENDS1. Fatal Crashes, 1975-2005 . . . . . . . . . . . . . . . . . . . . . . . . . . . . . . . . . . . . . . . . . . . . . . . . . . . . . . . . . . . . . . . . . . 14
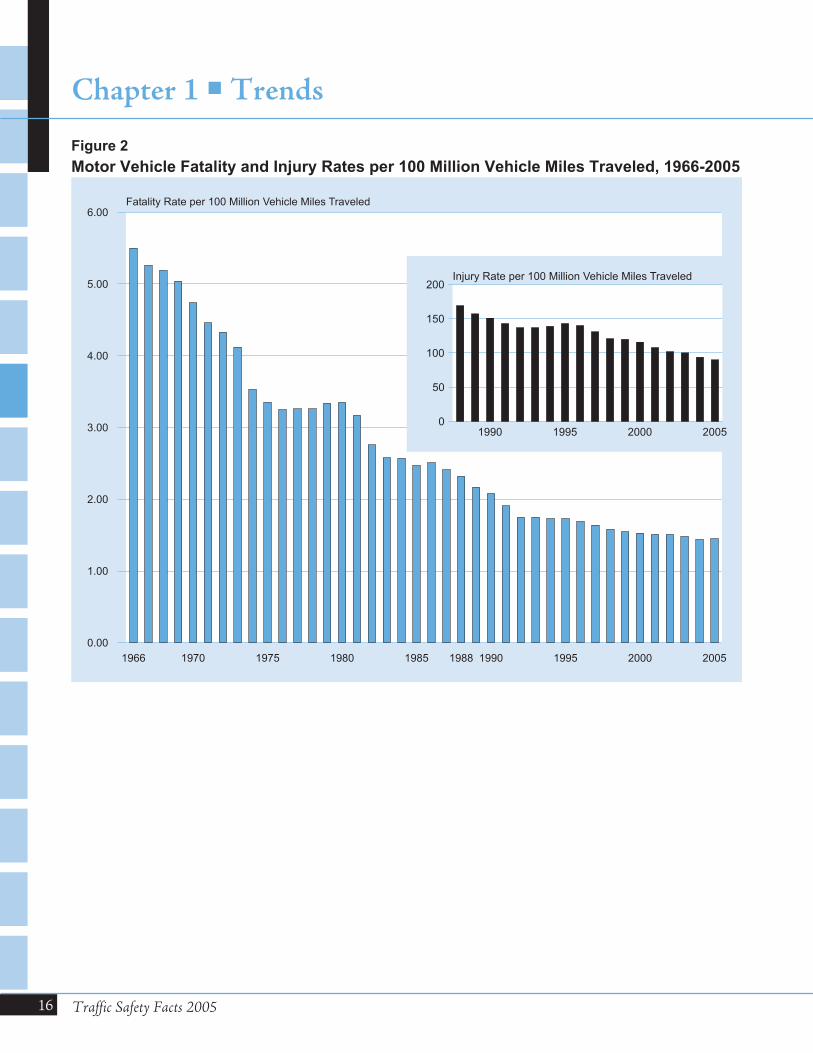
2. Motor Vehicle Fatality and Injury Rates per 100 Million Vehicle Miles Traveled, 1966-2005 . . . . . . . 16
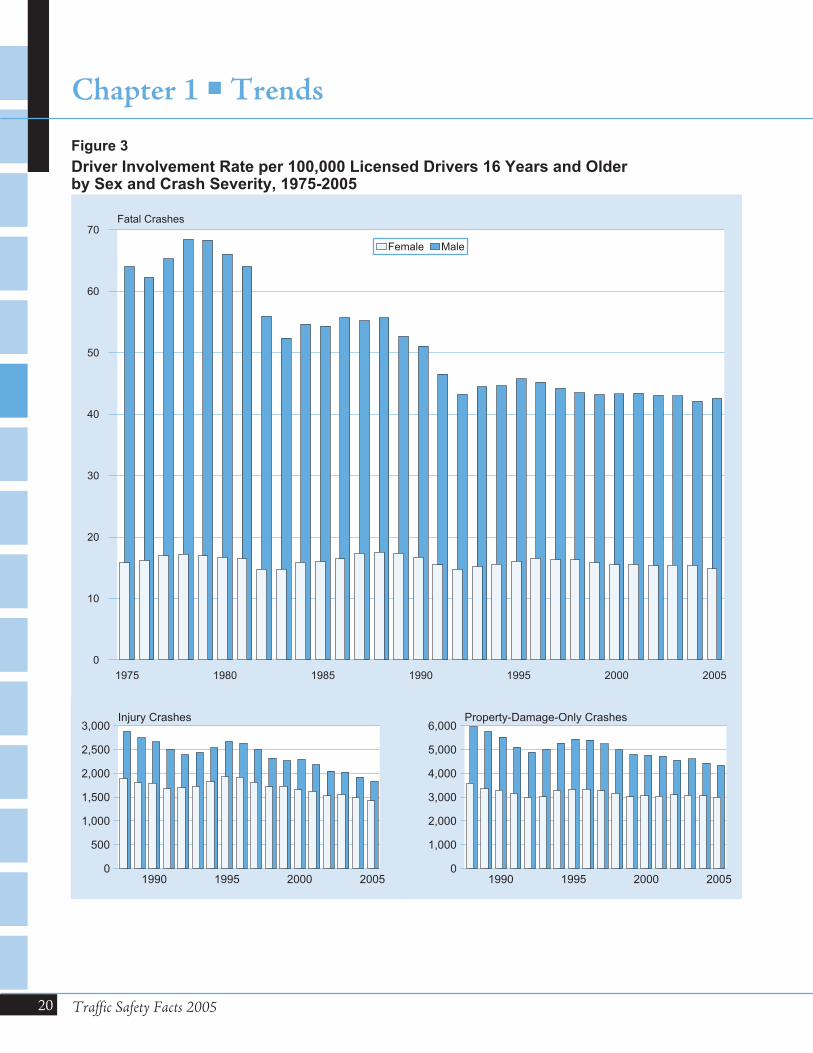
3. Driver Involvement Rate per 100,000 Licensed Drivers 16 Years and Olderby Sex and Crash Severity, 1975-2005 . . . . . . . . . . . . . . . . . . . . . . . . . . . . . . . . . . . . . . . . . . . . . . . . . . . . . . . 20
4. Passenger Car Occupant Fatality and Injury Rates per 100 Million Vehicle MilesTraveled, 1975-2005 . . . . . . . . . . . . . . . . . . . . . . . . . . . . . . . . . . . . . . . . . . . . . . . . . . . . . . . . . . . . . . . . . . . . . . 23
5. Light Truck Occupant Fatality and Injury Rates per 100 Million Vehicle MilesTraveled, 1975-2005 . . . . . . . . . . . . . . . . . . . . . . . . . . . . . . . . . . . . . . . . . . . . . . . . . . . . . . . . . . . . . . . . . . . . . . 25
6. Large Truck Occupant Fatality and Injury Rates per 100 Million Vehicle MilesTraveled, 1975-2005 . . . . . . . . . . . . . . . . . . . . . . . . . . . . . . . . . . . . . . . . . . . . . . . . . . . . . . . . . . . . . . . . . . . . . . 27
7. Motorcycle Rider Fatality and Injury Rates per 100 Million Vehicle MilesTraveled, 1975-2005 . . . . . . . . . . . . . . . . . . . . . . . . . . . . . . . . . . . . . . . . . . . . . . . . . . . . . . . . . . . . . . . . . . . . . . 29
8. Proportion of Persons Killed, by Highest Blood Alcohol Concentration (BAC)in the Crash, 1982-2005 . . . . . . . . . . . . . . . . . . . . . . . . . . . . . . . . . . . . . . . . . . . . . . . . . . . . . . . . . . . . . . . . . . . 32
9. Proportion of Drivers Involved in Fatal Crashes with BAC = .08+ by Vehicle Type, 1982-2005 . . . . 35
10. Proportion of Drivers in Fatal Crashes with BAC = .08+ by Age, 1982-2005 . . . . . . . . . . . . . . . . . . . . . 37
CRASHES11. Average Fatal Crashes per Hour, by Time of Day, Weekdays and Weekends . . . . . . . . . . . . . . . . . . . . . 46
12. Percent of Fatal Crashes, by Speed Limit and Land Use . . . . . . . . . . . . . . . . . . . . . . . . . . . . . . . . . . . . . . . . 52
13. Percent of Crashes Alcohol Related, by Time of Day and Crash Severity . . . . . . . . . . . . . . . . . . . . . . . . . 57
VEHICLES14. Proportion of Vehicles Involved in Traffic Crashes . . . . . . . . . . . . . . . . . . . . . . . . . . . . . . . . . . . . . . . . . . . . 62
15. Percent Rollover Occurrence, by Vehicle Type and Crash Severity . . . . . . . . . . . . . . . . . . . . . . . . . . . . . . 65
16. Percent of Vehicles in Crashes, by Most Harmful Event and Vehicle Type . . . . . . . . . . . . . . . . . . . . . . . 69
17. Percent of Vehicles in Crashes, by Initial Point of Impact, Crash Type, and Vehicle Type . . . . . . . . . . 70
Traffic Safety Facts 2005
FIGURES
PEOPLE18. Percent of Persons Killed or Injured, by Age. . . . . . . . . . . . . . . . . . . . . . . . . . . . . . . . . . . . . . . . . . . . . . . . . . 87
19. Fatality and Injury Rates per 100,000 Population, by Age and Sex . . . . . . . . . . . . . . . . . . . . . . . . . . . . . . . 89
20. Percent of Fatalities, by Speed Limit and Land Use . . . . . . . . . . . . . . . . . . . . . . . . . . . . . . . . . . . . . . . . . . . . 91
21. Percent of Persons Killed or Injured in Alcohol-Related Crashes, by Time of Day . . . . . . . . . . . . . . . . . 93
22. Fatality and Injury Rates per 1,000 Crashes, by First Harmful Event and Manner of Collision. . . . . . . 95
23. Fatality and Injury Rates per 1,000 Crashes, by Time of Day . . . . . . . . . . . . . . . . . . . . . . . . . . . . . . . . . . . 96
24. Fatality and Injury Rates per 1,000 Crashes, by Speed Limit . . . . . . . . . . . . . . . . . . . . . . . . . . . . . . . . . . . . 97
25. Driver Involvement Rates per 100,000 Licensed Drivers, by Age, Sex, and Crash Severity, 2005 . . . . . 99
26. Percent of Driver and Motorcycle Operator Alcohol Involvement for Fatal and Injury Crashes . . . . . . 113
27. Alcohol Involvement (BAC .01 or Higher) for Drivers and Motorcycle Operators Killed,by Driver Age, Crash Type, Time of Day, and Day of Week. . . . . . . . . . . . . . . . . . . . . . . . . . . . . . . . . . . . 115
28. Average Number of Motorcycle Riders Killed per Hour, by Time of Day and Day of Week . . . . . . . . 125
29. Average Number of Pedestrians Killed per Hour, by Time of Day and Day of Week . . . . . . . . . . . . . . 131
STATES30. 2005 Traffic Fatalities by State and Percent Change from 2004 . . . . . . . . . . . . . . . . . . . . . . . . . . . . . . . . . 141
2005 Motor Vehicle Crash Data from FARS and GES
Figures (Continued)
xiii

In this annual report, Traffic Safety Facts 2005: A Compilation of Motor Vehicle Crash Data from the FatalityAnalysis Reporting System and the General Estimates System, the National Highway Traffic Safety Administration(NHTSA) presents descriptive statistics about traffic crashes of all severities, from those that result in propertydamage to those that result in the loss of human life.
Information from two of NHTSA’s primary data systems has been combined to create a single source for motorvehicle crash statistics. The first data system, the Fatality Analysis Reporting System (FARS), is probably thebetter known of the two sources. Established in 1975, FARS contains data on the most severe traffic crashes, thosein which someone was killed. The second source is the National Automotive Sampling System General EstimatesSystem (GES), which began operation in 1988. GES contains data from a nationally representative sample ofpolice-reported crashes of all severities, including those that result in death, injury, or property damage. The nexttwo sections provide a brief description of FARS and GES.
Both systems were designed and developed by NHTSA’s National Center for Statistics and Analysis (NCSA) toprovide an overall measure of highway safety, to help identify traffic safety problems, to suggest solutions, and tohelp provide an objective basis on which to evaluate the effectiveness of motor vehicle safety standards and highwaysafety initiatives. Data from these systems are used to answer requests for information from the international andnational highway traffic safety communities, including state and local governments, the Congress, Federalagencies, research organizations, industry, the media, and private citizens.
2005 Motor Vehicle Crash Data from FARS and GES
INTRODUCTION
1

The Fatality Analysis Reporting System (FARS), which became operational in 1975, contains data on acensus of fatal traffic crashes within the 50 states, the District of Columbia, and Puerto Rico. To be included inFARS, a crash must involve a motor vehicle traveling on a trafficway customarily open to the public, and mustresult in the death of an occupant of a vehicle or a nonoccupant within 30 days of the crash.
NHTSA has a cooperative agreement with an agency in each state’s government to provide information on allqualifying fatal crashes in the state. These agreements are managed by Regional Contracting Officer’s TechnicalRepresentatives located in the 10 NHTSA Regional Offices. Trained state employees, called “FARS Analysts,”are responsible for gathering, translating, and transmitting their state’s data to NCSA in a standard format. Thenumber of analysts varies by state, depending on the number of fatal crashes and the ease of obtaining data.
FARS data are obtained solely from the state’s existing documents:
Police Accident Reports Death CertificatesState Vehicle Registration Files Coroner/Medical Examiner ReportsState Driver Licensing Files Hospital Medical ReportsState Highway Department Data Emergency Medical Service ReportsVital Statistics Other State Records
From these documents, the analysts code more than 100 FARS data elements. (See Appendix A for a list of theFARS data elements.) The specific data elements may be modified slightly each year to conform to changing userneeds, vehicle characteristics, and highway safety emphasis areas. The data collected within FARS do not includeany personal identifying information, such as names, addresses, or social security numbers. Thus, any data kept inFARS files and made available to the public fully conform to the Privacy Act.
Each analyst enters data into a local microcomputer data file, and daily updates are sent to NHTSA’s centralcomputer database. Data are automatically checked when entered for acceptable range values and for consistency,enabling the analyst to make corrections immediately. Several programs continually monitor and improve thecompleteness and accuracy of the data. The 2005 FARS data file used for the statistics in this report was created inJune 2006; however, the 2005 FARS file will officially close in February 2007. This additional time provides theopportunity for submission of important variable data requiring outside sources, which may lead to changes in thefinal counts. The updated final counts for 2004 are reflected in this report. The updated final counts for 2005 willbe reflected in the 2006 annual report.
2005 Motor Vehicle Crash Data from FARS and GES
FARS OPERATIONS
3

The National Automotive Sampling System (NASS) - General Estimates System (GES) data are obtainedfrom a nationally representative probability sample selected from all police-reported crashes. The system beganoperation in 1988. To be eligible for the GES sample, a police accident report (PAR) must be completed for thecrash, and the crash must involve at least one motor vehicle traveling on a trafficway and must result in propertydamage, injury, or death. Although various sources suggest that about half the motor vehicle crashes in the countryare not reported to police, the majority of these unreported crashes involve only minor property damage and nosignificant personal injury. By restricting attention to police-reported crashes, the GES concentrates on thosecrashes of greatest concern to the highway safety community and the general public.
GES data collectors make weekly visits to 410 police jurisdictions in 60 sites across the United States, where theyrandomly sample about 57,000 PARs per year. The collectors obtain copies of the PARs and send them to theNASS quality control centers for coding. No other data are collected beyond the selected PARs—no driverlicense, vehicle registration, or medical information is obtained.
Trained data entry personnel interpret and code data directly from the PARs into an electronic data file.Approximately 90 data elements are coded into a common format. (See Appendix B for a list of the GES dataelements.) Some elements are modified every other year to meet the changing needs of the highway safetycommunity. To protect individual privacy, no personal information (names, addresses, specific crash locations) iscoded. During data coding, the data are checked electronically for validity and consistency. After the data file iscreated, further quality checks are performed on the data through computer processing and by the data codingsupervisors. The 2005 file used for the statistics in this report was completed in June 2006.
2005 Motor Vehicle Crash Data from FARS and GES
GES OPERATIONS
5

Fatal crash data from FARS and nonfatal crash data from GES are presented in this report in five chapters.Chapter 1, “Trends,” presents data from all years of FARS (1975 through 2005) and GES (1988 through 2005).The remaining chapters present data only from 2005. Chapter 2, “Crashes,” describes general characteristics ofcrashes, such as when and how often they occurred, where they occurred, and what happened during the crash.Chapter 3, “Vehicles,” concentrates on the types of vehicles involved in crashes and the damage to the vehicles.Chapter 4, “People,” is the largest chapter of this report, with statistics about drivers, passengers, pedestrians, andpedalcyclists. The last chapter of the report, “States,” contains information about crashes for each state, theDistrict of Columbia, and Puerto Rico. Terms used throughout the report are defined in the Glossary.
About three-quarters of the tables in this report present data from both FARS and GES. The remaining tablescontain FARS data only. Statistics describing fatal crashes or fatalities have been derived from FARS. Statisticsdescribing injury crashes, property-damage-only crashes, or nonfatal injuries have been derived from GES. Thereader should be aware that FARS numbers are actual counts of fatalities or fatal crashes, whereas GES numbersare estimates of counts of crashes and injuries and are subject to sampling and nonsampling errors. (See AppendixC for more information on these errors.) To emphasize this difference, FARS numbers are not rounded, whileGES estimates have been rounded to the nearest thousand. As a result of the rounding, for some tables, the sum ofthe row or column entries may not equal the row or column total. In addition, percentages have been calculatedprior to rounding.
The reader may also notice that many tables have rows or footnotes for “unknowns” for FARS data, but not forGES data. The reason for this difference is that almost all the GES unknown data have been assigned valuesthrough complex statistical procedures. FARS unknown data, on the other hand, are not assigned values, with theexception of blood alcohol concentration (BAC) test results. When the alcohol test results are unknown, BACvalues have been assigned to drivers and nonoccupants involved in fatal crashes, using a method of multipleimputation that was revised in 2001. More information on the new multiple imputation method, including detailedtabulations of alcohol involvement in various categories (age, sex, time of day, etc.), is available in NHTSATechnical Report DOT HS 809 403, Transitioning to Multiple Imputation: A New Method to Estimate MissingBlood Alcohol Concentration (BAC) Values in FARS.
2005 Motor Vehicle Crash Data from FARS and GES
ABOUT THIS REPORT
7

VEHICLE SAFETY HOTLINETo report a safety-related problem or to inquire about motor vehiclesafety information, contact the Vehicle Safety Hotline at 888-327-4236.
While this report presents a wide spectrum of information in more than 100 tables and figures, it containsonly a fraction of the data available from FARS and GES. Additional data from FARS (1975 through 2005) orfrom GES (1988 through 2005) are available in four ways:
O Modest requests for specific data will be answered by NCSA at no charge. Response usually requires about twoweeks, depending on the nature and complexity of the data requested.
O Compact disks can be purchased in one of several formats amenable to analysis. This will enable you to processthe data using your own computer system. Information on acquiring the compact disks is available bycontacting the Volpe Center at the following address:
Attn: Marjorie SaccoccioUSDOT Volpe National Transportation Systems CenterDTS-2355 BroadwayCambridge, MA 02142617-494-2640617-494-3770 (FAX)
O FARS and GES data can be obtained by downloading any of the published files from the Internet, atftp://ftp.nhtsa.dot.gov/FARS or ftp://ftp.nhtsa.dot.gov/GES. The files are available in SAS, sequentialASCII, and (for FARS only, not GES) DBF file formats. This will enable you to process the data using yourown computer system.
O FARS data can also be accessed on the Web at www-fars.nhtsa.dot.gov. This Web site provides instant accessto the 1994 through 2005 FARS data via the Create-a-Query, Create-a-Map, and Reports features. TheCreate-a-Query feature will enable you to process the data using our interactive user interface. TheCreate-a-Map feature will enable you to create state-by-state and county-by-county map displays from aninventory of report selections. The Reports feature is an inventory of the fatality statistical reports found in thispublication. These are national reports for current and past years that may be customized by selection of state;and for state reports, county tabulation may be selected.
2005 Motor Vehicle Crash Data from FARS and GES
DATA AVAILABILITY
9
CATS
10
Requests for more information from FARS or GES should be directed to:
National Highway Traffic Safety AdministrationNational Center for Statistics and AnalysisNPO-121400 Seventh Street, SWWashington, DC 20590202-366-4198 or 800-934-8517202-366-7078 (FAX)
Requests for more information may also be submitted online via NCSA’s Customer Automated Tracking System(CATS):
http://www-nrd.nhtsa.dot.gov/CMSWeb
Additional information on all NHTSA’s data files, including FARS and GES, can be found on the NCSA Website: www.nhtsa.dot.gov/people/ncsa. Fact sheets, recent NCSA research notes, and abstracts of technical reportscan be downloaded in portable document format (PDF). Comments and suggestions about the NCSA Web sitecan be e-mailed to the following address: [email protected].
Traffic Safety Facts 2005
Data Availability

Chapter 1
TRENDS

The tables in this chapter present statistics about police-reported motor vehicle crashes over time. Trends forfatal crashes and fatalities generally are presented from 1975 (when FARS began operation) to 2005; however,tables with alcohol data from FARS show data only for the years these data are available—1982 to 2005. Trendsfor nonfatal crashes and injured are presented from 1988 (when GES began operation) to 2005. Care should betaken when comparing nonfatal crash and injury statistics from one year to the next. Since the statistics derivedfrom GES data are estimates, year-to-year differences may be the result of the sampling process, not the result of anactual trend. The variability or sampling errors associated with the estimates must be considered when making anyyear-to-year comparisons using GES data. (For more information on sampling error, see Appendix C.) Below aresome of the statistics you will find in this chapter:
O Fatal crashes increased by 1.9 percent from 2004 to 2005, and the fatality rate rose to 1.45 fatalities per100 million vehicle miles of travel in 2005.
O The injury rate per 100 million vehicle miles of travel decreased by 4.3 percent from 2004 to 2005.
O The occupant fatality rate (including motorcycle riders) per 100,000 population, which declined by 22.7percent from 1975 to 1992, decreased by 1.6 percent from 1992 to 2005.
O The occupant injury rate (including motorcycle riders) per 100,000 population, which declined by 13.6 percentfrom 1988 to 1992, decreased by 23.6 percent from 1992 to 2005.
O The nonoccupant fatality rate per 100,000 population has declined by 50.6 percent from 1975 to 2005.
O The nonoccupant injury rate per 100,000 population has declined by 49.4 percent from 1988 to 2005.
O The percent of alcohol-related fatalities has declined from 60 percent in 1982 to 39 percent in 2005.
2005 Motor Vehicle Crash Data from FARS and GES
CHAPTER 1 �TRENDS
13
14 Traffic Safety Facts 2005
Chapter 1 �Trends
1975 1980 1985 1990 1995 2000 2005
0
5,000
10,000
15,000
20,000
25,000
30,000
35,000
40,000
45,000
50,000Number of Fatal Crashes
Figure 1
Fatal Crashes, 1975-2005
Year
Crash Severity
Total CrashesFatal Injury Property Damage Only
Number Percent Number Percent Number Percent Number Percent
1988 42,130 0.6 2,233,000 32.4 4,611,000 67.0 6,887,000 100.0
1989 40,741 0.6 2,153,000 32.4 4,459,000 67.0 6,653,000 100.0
1990 39,836 0.6 2,122,000 32.8 4,309,000 66.6 6,471,000 100.0
1991 36,937 0.6 2,008,000 32.8 4,073,000 66.6 6,117,000 100.0
1992 34,942 0.6 1,991,000 33.2 3,974,000 66.2 6,000,000 100.0
1993 35,780 0.6 2,022,000 33.1 4,048,000 66.3 6,106,000 100.0
1994 36,254 0.6 2,123,000 32.7 4,336,000 66.8 6,496,000 100.0
1995 37,241 0.6 2,217,000 33.1 4,446,000 66.4 6,699,000 100.0
1996 37,494 0.6 2,238,000 33.1 4,494,000 66.4 6,770,000 100.0
1997 37,324 0.6 2,149,000 32.4 4,438,000 67.0 6,624,000 100.0
1998 37,107 0.6 2,029,000 32.0 4,269,000 67.4 6,335,000 100.0
1999 37,140 0.6 2,054,000 32.7 4,188,000 66.7 6,279,000 100.0
2000 37,526 0.6 2,070,000 32.4 4,286,000 67.0 6,394,000 100.0
2001 37,862 0.6 2,003,000 31.7 4,282,000 67.7 6,323,000 100.0
2002 38,491 0.6 1,929,000 30.5 4,348,000 68.8 6,316,000 100.0
2003 38,477 0.6 1,925,000 30.4 4,365,000 69.0 6,328,000 100.0
2004 38,444 0.6 1,862,000 30.1 4,281,000 69.3 6,181,000 100.0
2005 39,189 0.6 1,816,000 29.5 4,304,000 69.9 6,159,000 100.0
Table 1
Crashes by Crash Severity, 1988-2005
2005 Motor Vehicle Crash Data from FARS and GES
Chapter 1 �Trends
15
Killed
Year Fatalities
ResidentPopulation
(Thousands)
Fatality Rateper 100,000Population
LicensedDrivers
(Thousands)
Fatality Rateper 100,000
LicensedDrivers
RegisteredMotor
Vehicles(Thousands)
Fatality Rateper 100,000RegisteredVehicles
Vehicle MilesTraveled(Billions)
Fatality Rateper 100 MillionVehicle Miles
Traveled
1966 50,894 196,560 25.89 100,998 50.39 95,703 53.18 926 5.50
1975 44,525 215,973 20.62 129,791 34.31 126,153 35.29 1,328 3.35
1980 51,091 227,225 22.48 145,295 35.16 146,845 34.79 1,527 3.351981 49,301 229,466 21.49 147,075 33.52 149,330 33.01 1,555 3.171982 43,945 231,664 18.97 150,234 29.25 151,148 29.07 1,595 2.76
1983 42,589 233,792 18.22 154,389 27.59 153,830 27.69 1,653 2.581984 44,257 235,825 18.77 155,424 28.48 158,900 27.85 1,720 2.571985 43,825 237,924 18.42 156,868 27.94 166,047 26.39 1,775 2.47
1986 46,087 240,133 19.19 159,486 28.90 168,545 27.34 1,835 2.511987 46,390 242,289 19.15 161,816 28.67 172,750 26.85 1,921 2.411988 47,087 244,499 19.26 162,854 28.91 177,455 26.53 2,026 2.32
1989 45,582 246,819 18.47 165,554 27.53 181,165 25.16 2,096 2.171990 44,599 249,464 17.88 167,015 26.70 184,275 24.20 2,144 2.081991 41,508 252,153 16.46 168,995 24.56 186,370 22.27 2,172 1.91
1992 39,250 255,030 15.39 173,125 22.67 184,938 21.22 2,247 1.751993 40,150 257,783 15.58 173,149 23.19 188,350 21.32 2,296 1.751994 40,716 260,327 15.64 175,403 23.21 192,497 21.15 2,358 1.73
1995 41,817 262,803 15.91 176,628 23.68 197,065 21.22 2,423 1.731996 42,065 265,229 15.86 179,539 23.43 201,631 20.86 2,486 1.691997 42,013 267,784 15.69 182,709 22.99 203,568 20.64 2,562 1.64
1998 41,501 270,248 15.36 184,861 22.45 208,076 19.95 2,632 1.581999 41,717 272,691 15.30 187,170 22.29 212,685 19.61 2,691 1.552000 41,945 282,193 14.86 190,625 22.00 217,028 19.33 2,747 1.53
2001 42,196 285,108 14.80 191,276 22.06 221,230 19.07 2,797 1.512002 43,005 287,985 14.93 194,602 22.10 225,685 19.06 2,856 1.512003 42,884 290,850 14.74 196,166 21.86 230,633 18.59 2,890 1.48
2004 42,836 293,657 14.59 198,889 21.54 237,949 18.00 2,965 1.442005 43,443 296,410 14.66 200,665 21.65 245,642 17.69 2,990 1.45
Injured
Year Injured
ResidentPopulation
(Thousands)
Injury Rateper 100,000Population
LicensedDrivers
(Thousands)
Injury Rateper 100,000
LicensedDrivers
RegisteredMotor
Vehicles(Thousands)
Injury Rateper 100,000RegisteredVehicles
Vehicle MilesTraveled(Billions)
Injury Rateper 100 MillionVehicle Miles
Traveled
1988 3,416,000 244,499 1,397 162,854 2,098 177,455 1,925 2,026 1691989 3,284,000 246,819 1,330 165,554 1,984 181,165 1,813 2,096 1571990 3,231,000 249,464 1,295 167,015 1,934 184,275 1,753 2,144 151
1991 3,097,000 252,153 1,228 168,995 1,833 186,370 1,662 2,172 1431992 3,070,000 255,030 1,204 173,125 1,773 184,938 1,660 2,247 1371993 3,149,000 257,783 1,222 173,149 1,819 188,350 1,672 2,296 137
1994 3,266,000 260,327 1,255 175,403 1,862 192,497 1,697 2,358 1391995 3,465,000 262,803 1,319 176,628 1,962 197,065 1,758 2,423 1431996 3,483,000 265,229 1,313 179,539 1,940 201,631 1,728 2,486 140
1997 3,348,000 267,784 1,250 182,709 1,832 203,568 1,644 2,562 1311998 3,192,000 270,248 1,181 184,861 1,727 208,076 1,534 2,632 1211999 3,236,000 272,691 1,187 187,170 1,729 212,685 1,522 2,691 120
2000 3,189,000 282,193 1,130 190,625 1,673 217,028 1,469 2,747 1162001 3,033,000 285,108 1,064 191,276 1,585 221,230 1,371 2,797 1082002 2,926,000 287,985 1,016 194,602 1,503 225,685 1,296 2,856 102
2003 2,889,000 290,850 993 196,166 1,473 230,633 1,252 2,890 1002004 2,788,000 293,657 950 198,889 1,402 237,949 1,172 2,965 942005 2,699,000 296,410 911 200,665 1,345 245,642 1,099 2,990 90
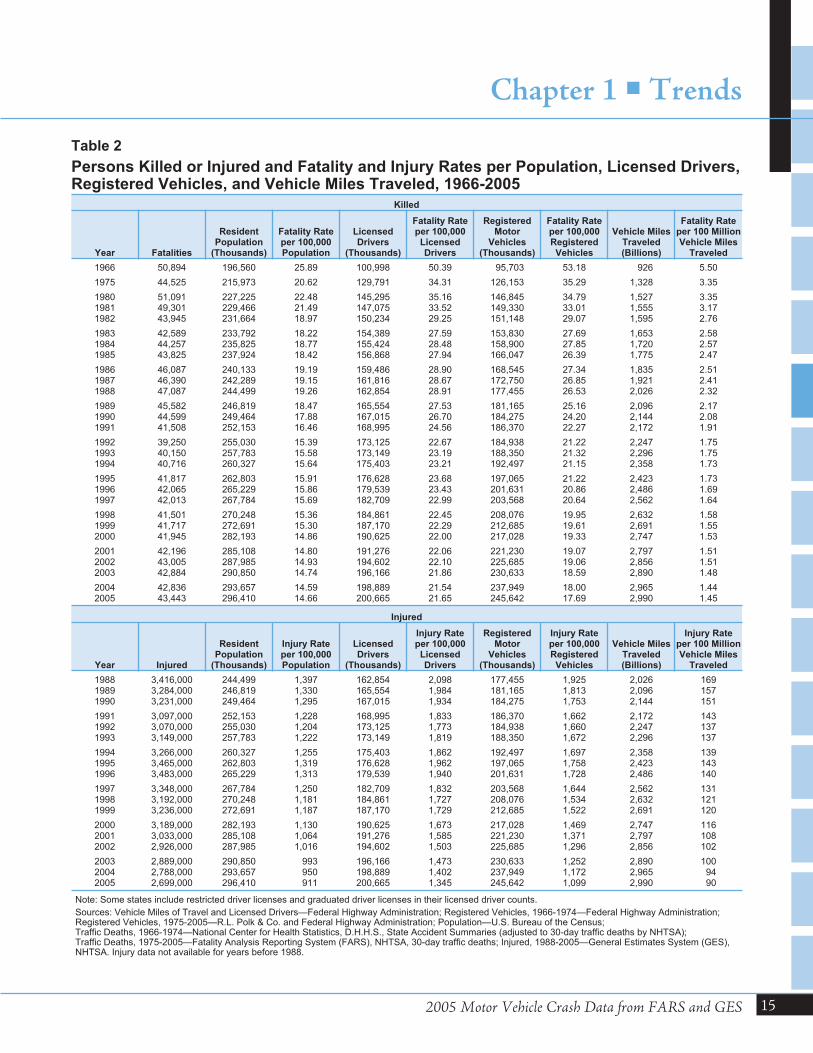
Note: Some states include restricted driver licenses and graduated driver licenses in their licensed driver counts.
Sources: Vehicle Miles of Travel and Licensed Drivers—Federal Highway Administration; Registered Vehicles, 1966-1974—Federal Highway Administration;Registered Vehicles, 1975-2005—R.L. Polk & Co. and Federal Highway Administration; Population—U.S. Bureau of the Census;Traffic Deaths, 1966-1974—National Center for Health Statistics, D.H.H.S., State Accident Summaries (adjusted to 30-day traffic deaths by NHTSA);Traffic Deaths, 1975-2005—Fatality Analysis Reporting System (FARS), NHTSA, 30-day traffic deaths; Injured, 1988-2005—General Estimates System (GES),NHTSA. Injury data not available for years before 1988.
Table 2
Persons Killed or Injured and Fatality and Injury Rates per Population, Licensed Drivers,Registered Vehicles, and Vehicle Miles Traveled, 1966-2005
16 Traffic Safety Facts 2005
Chapter 1 �Trends
1966 1970 1975 1980 1985 1988 1990 1995 2000 2005
0.00
1.00
2.00
3.00
4.00
5.00
6.00Fatality Rate per 100 Million Vehicle Miles Traveled
Figure 2
Motor Vehicle Fatality and Injury Rates per 100 Million Vehicle Miles Traveled, 1966-2005
1990 1995 2000 20050
50
100
150
200Injury Rate per 100 Million Vehicle Miles Traveled
2005 Motor Vehicle Crash Data from FARS and GES
Chapter 1 �Trends
17
Year
Vehicle Type
Passenger Cars Light Trucks Large Trucks Motorcycles
Number
InvolvementRate per
100 MillionVMT
InvolvementRate per100,000
RegisteredVehicles Number
InvolvementRate per
100 MillionVMT
InvolvementRate per100,000
RegisteredVehicles Number
InvolvementRate per
100 MillionVMT
InvolvementRate per100,000
RegisteredVehicles Number
InvolvementRate per
100 MillionVMT
InvolvementRate per100,000
RegisteredVehicles
Fatal Crashes
1975 37,897 3.68 40.11 8,636 4.23 41.35 3,977 4.89 74.16 3,265 58.00 65.771980 39,059 3.53 37.28 12,680 4.29 42.18 5,379 4.96 92.89 5,194 50.85 91.221985 34,277 2.74 29.46 12,464 3.21 33.09 5,153 4.17 85.94 4,608 50.72 84.641986 36,195 2.83 30.87 13,327 3.20 33.52 5,097 4.02 89.09 4,570 48.63 87.901987 36,580 2.75 30.52 14,514 3.27 34.81 5,108 3.83 89.33 4,067 42.78 83.241988 36,977 2.67 30.43 15,286 3.13 34.27 5,241 3.80 85.40 3,715 37.06 81.041989 35,410 2.50 28.85 15,700 3.00 33.31 4,984 3.49 80.05 3,192 30.78 72.211990 34,085 2.39 27.65 15,620 2.81 31.29 4,776 3.27 77.08 3,276 34.28 76.911991 31,291 2.22 25.37 14,832 2.49 28.49 4,347 2.91 70.43 2,829 30.82 67.721992 29,817 2.08 24.78 14,648 2.28 27.21 4,035 2.63 66.75 2,439 25.52 60.001993 30,233 2.09 24.97 15,332 2.27 27.10 4,328 2.71 71.09 2,477 25.01 62.271994 30,273 2.07 24.81 16,353 2.30 27.49 4,644 2.73 70.49 2,339 22.84 62.261995 30,940 2.09 25.11 17,587 2.35 28.13 4,472 2.51 66.55 2,268 23.15 58.201996 30,727 2.05 24.66 18,246 2.32 27.88 4,755 2.60 67.81 2,176 21.94 56.201997 30,059 1.97 24.11 18,628 2.26 27.68 4,917 2.57 69.42 2,160 21.43 56.451998 29,040 1.87 23.05 19,363 2.25 27.75 4,955 2.52 64.08 2,334 22.70 60.161999 28,027 1.79 22.09 19,959 2.21 27.29 4,920 2.43 63.15 2,532 23.92 60.982000 27,802 1.76 21.76 20,498 2.17 26.91 4,995 2.43 62.26 2,975 28.42 68.452001 27,586 1.73 21.41 20,831 2.13 26.42 4,823 2.31 61.38 3,265 33.87 66.592002 27,374 1.70 21.03 21,668 2.14 26.49 4,587 2.14 57.86 3,365 35.23 67.242003 26,562 1.65 20.19 22,299 2.14 26.18 4,721 2.17 60.86 3,802 39.70 70.802004 25,682 1.58 19.27 22,486 2.05 25.00 4,902 2.22 59.99 4,121 40.71 71.452005 25,029 1.55 18.52 22,838 2.01 24.05 4,932 2.21 58.15 4,655 43.22 74.75
Injury Crashes
1988 3,073,000 222 2,529 683,000 140 1,530 96,000 69 1,562 98,000 974 2,1291989 2,892,000 204 2,355 727,000 139 1,543 110,000 77 1,770 76,000 732 1,7171990 2,838,000 199 2,302 729,000 131 1,460 107,000 73 1,730 82,000 854 1,9161991 2,615,000 185 2,120 789,000 132 1,515 78,000 52 1,264 79,000 856 1,8821992 2,640,000 184 2,194 758,000 118 1,409 95,000 62 1,567 61,000 642 1,5091993 2,631,000 182 2,174 843,000 125 1,490 97,000 60 1,585 56,000 565 1,4071994 2,785,000 191 2,283 912,000 128 1,533 96,000 56 1,452 54,000 526 1,4331995 2,914,000 197 2,365 1,024,000 137 1,638 84,000 47 1,244 52,000 530 1,3311996 2,884,000 192 2,314 1,071,000 136 1,636 94,000 51 1,339 51,000 512 1,3121997 2,736,000 179 2,195 1,064,000 129 1,582 96,000 50 1,349 51,000 501 1,3211998 2,545,000 164 2,020 1,059,000 123 1,517 89,000 45 1,146 45,000 433 1,1481999 2,438,000 156 1,921 1,165,000 129 1,593 101,000 50 1,292 46,000 436 1,1112000 2,396,000 152 1,876 1,209,000 128 1,587 101,000 49 1,253 53,000 509 1,2262001 2,279,000 143 1,768 1,218,000 125 1,545 90,000 43 1,143 57,000 587 1,1552002 2,136,000 133 1,641 1,210,000 119 1,479 94,000 44 1,189 58,000 612 1,1672003 2,129,000 132 1,619 1,233,000 118 1,447 89,000 41 1,145 64,000 665 1,1852004 1,990,000 122 1,493 1,246,000 113 1,385 87,000 39 1,062 70,000 694 1,2172005 1,893,000 117 1,401 1,209,000 107 1,273 82,000 37 971 80,000 746 1,291
Property-Damage-Only Crashes
1988 6,050,000 437 4,979 1,542,000 316 3,458 297,000 215 4,839 21,000 207 4531989 5,678,000 401 4,625 1,613,000 309 3,421 300,000 210 4,825 20,000 188 4411990 5,485,000 384 4,450 1,654,000 298 3,314 273,000 187 4,411 20,000 208 4671991 5,084,000 360 4,122 1,675,000 281 3,217 248,000 166 4,022 25,000 268 5891992 4,852,000 338 4,031 1,704,000 265 3,165 277,000 181 4,586 10,000 100 2361993 4,789,000 331 3,956 1,884,000 279 3,331 296,000 185 4,861 17,000 169 4201994 5,126,000 351 4,202 2,023,000 284 3,401 360,000 212 5,467 13,000 128 3491995 5,335,000 361 4,329 2,149,000 287 3,437 289,000 162 4,307 13,000 131 3291996 5,281,000 352 4,238 2,274,000 289 3,475 295,000 161 4,209 14,000 138 3551997 5,116,000 335 4,104 2,314,000 281 3,439 337,000 176 4,761 10,000 102 2681998 4,896,000 315 3,887 2,315,000 269 3,317 318,000 162 4,114 9,000 84 2221999 4,469,000 285 3,523 2,491,000 276 3,406 369,000 182 4,739 10,000 96 2462000 4,467,000 283 3,497 2,621,000 278 3,441 351,000 171 4,377 14,000 133 3212001 4,399,000 276 3,413 2,679,000 275 3,398 335,000 160 4,261 14,000 150 2952002 4,443,000 276 3,412 2,757,000 272 3,370 336,000 156 4,232 17,000 173 3302003 4,356,000 270 3,311 2,804,000 269 3,292 363,000 167 4,681 14,000 142 2532004 4,216,000 259 3,164 2,886,000 263 3,208 324,000 147 3,970 13,000 132 2312005 4,169,000 258 3,085 2,919,000 257 3,074 354,000 159 4,176 18,000 168 291
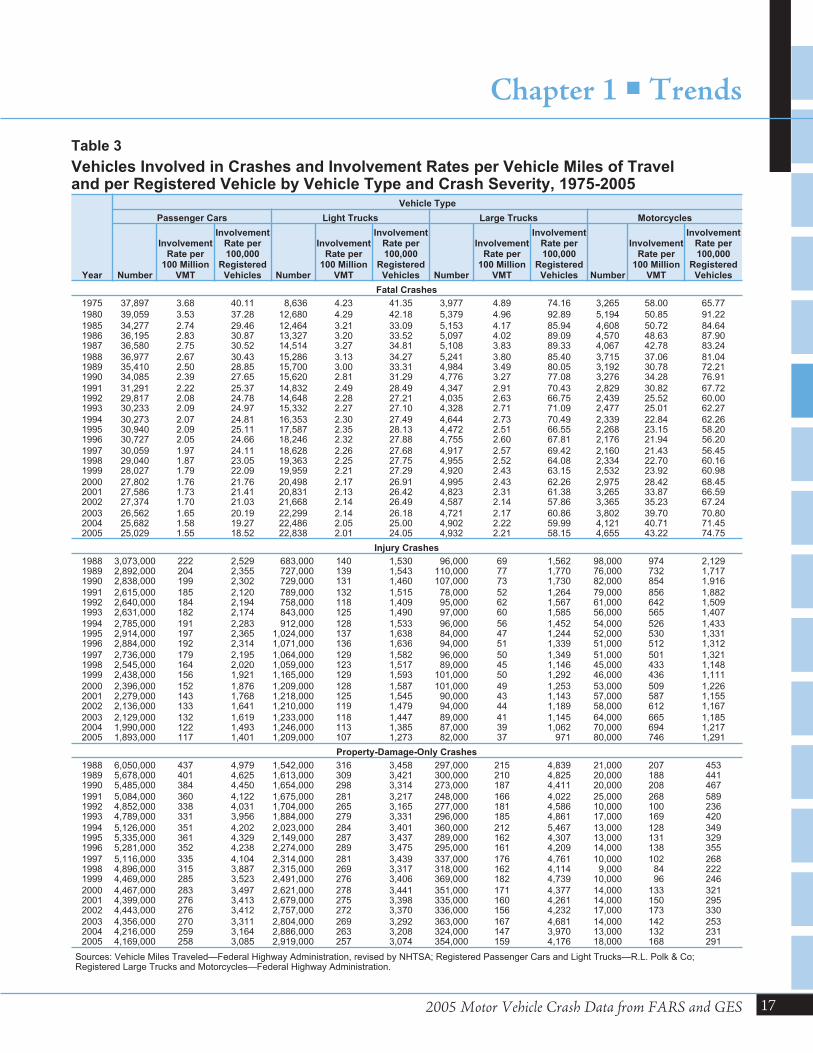
Sources: Vehicle Miles Traveled—Federal Highway Administration, revised by NHTSA; Registered Passenger Cars and Light Trucks—R.L. Polk & Co;Registered Large Trucks and Motorcycles—Federal Highway Administration.
Table 3
Vehicles Involved in Crashes and Involvement Rates per Vehicle Miles of Traveland per Registered Vehicle by Vehicle Type and Crash Severity, 1975-2005
18 Traffic Safety Facts 2005
Chapter 1 �Trends
Year
Person Type
Total
Occupants by Vehicle Type
MotorcycleRiders
Nonoccupants
PassengerCars
LightTrucks
LargeTrucks Buses
Other/Unknown Total Pedestrian Pedalcyclist
Other/Unknown Total
Killed
1975 25,929 4,856 961 53 937 32,736 3,189 7,516 1,003 81 8,600 44,525
1980 27,449 7,486 1,262 46 540 36,783 5,144 8,070 965 129 9,164 51,091
1981 26,645 7,081 1,133 56 603 35,518 4,906 7,837 936 104 8,877 49,301
1982 23,330 6,359 944 35 525 31,193 4,453 7,331 883 85 8,299 43,945
1983 22,979 6,202 982 53 362 30,578 4,265 6,826 839 81 7,746 42,589
1984 23,620 6,496 1,074 46 440 31,676 4,608 7,025 849 99 7,973 44,257
1985 23,212 6,689 977 57 544 31,479 4,564 6,808 890 84 7,782 43,825
1986 24,944 7,317 926 39 442 33,668 4,566 6,779 941 133 7,853 46,087
1987 25,132 8,058 852 51 436 34,529 4,036 6,745 948 132 7,825 46,390
1988 25,808 8,306 911 54 429 35,508 3,662 6,870 911 136 7,917 47,087
1989 25,063 8,551 858 50 424 34,946 3,141 6,556 832 107 7,495 45,582
1990 24,092 8,601 705 32 460 33,890 3,244 6,482 859 124 7,465 44,599
1991 22,385 8,391 661 31 466 31,934 2,806 5,801 843 124 6,768 41,508
1992 21,387 8,098 585 28 387 30,485 2,395 5,549 723 98 6,370 39,250
1993 21,566 8,511 605 18 425 31,125 2,449 5,649 816 111 6,576 40,150
1994 21,997 8,904 670 18 409 31,998 2,320 5,489 802 107 6,398 40,716
1995 22,423 9,568 648 33 392 33,064 2,227 5,584 833 109 6,526 41,817
1996* 22,505 9,932 621 21 455 33,534 2,161 5,449 765 154 6,368 42,065
1997 22,199 10,249 723 18 420 33,609 2,116 5,321 814 153 6,288 42,013
1998 21,194 10,705 742 38 409 33,088 2,294 5,228 760 131 6,119 41,501
1999 20,862 11,265 759 59 447 33,392 2,483 4,939 754 149 5,842 41,717
2000 20,699 11,526 754 22 450 33,451 2,897 4,763 693 141 5,597 41,945
2001 20,320 11,723 708 34 458 33,243 3,197 4,901 732 123 5,756 42,196
2002 20,569 12,274 689 45 528 34,105 3,270 4,851 665 114 5,630 43,005
2003 19,725 12,546 726 41 589 33,627 3,714 4,774 629 140 5,543 42,884
2004 19,192 12,674 766 42 602 33,276 4,028 4,675 727 130 5,532 42,836
2005 18,440 12,975 803 58 765 33,041 4,553 4,881 784 184 5,849 43,443
Injured
1988 2,585,000 478,000 37,000 15,000 4,000 3,119,000 105,000 110,000 75,000 8,000 192,000 3,416,000
1989 2,431,000 511,000 43,000 15,000 5,000 3,005,000 83,000 112,000 73,000 11,000 196,000 3,284,000
1990 2,376,000 505,000 42,000 33,000 4,000 2,960,000 84,000 105,000 75,000 7,000 187,000 3,231,000
1991 2,235,000 563,000 28,000 21,000 4,000 2,850,000 80,000 88,000 67,000 11,000 166,000 3,097,000
1992 2,232,000 545,000 34,000 20,000 12,000 2,843,000 65,000 89,000 63,000 10,000 162,000 3,070,000
1993 2,265,000 601,000 32,000 17,000 4,000 2,919,000 59,000 94,000 68,000 9,000 171,000 3,149,000
1994 2,364,000 631,000 30,000 16,000 4,000 3,045,000 57,000 92,000 62,000 9,000 164,000 3,266,000
1995 2,469,000 722,000 30,000 19,000 4,000 3,246,000 57,000 86,000 67,000 10,000 162,000 3,465,000
1996 2,458,000 761,000 33,000 20,000 4,000 3,277,000 55,000 82,000 58,000 11,000 151,000 3,483,000
1997 2,341,000 755,000 31,000 17,000 6,000 3,149,000 53,000 77,000 58,000 11,000 146,000 3,348,000
1998 2,201,000 763,000 29,000 16,000 4,000 3,012,000 49,000 69,000 53,000 8,000 131,000 3,192,000
1999 2,138,000 847,000 33,000 22,000 7,000 3,047,000 50,000 85,000 51,000 3,000 140,000 3,236,000
2000 2,052,000 887,000 31,000 18,000 10,000 2,997,000 58,000 78,000 51,000 5,000 134,000 3,189,000
2001 1,927,000 861,000 29,000 15,000 9,000 2,841,000 60,000 78,000 45,000 8,000 131,000 3,033,000
2002 1,805,000 879,000 26,000 19,000 6,000 2,735,000 65,000 71,000 48,000 7,000 126,000 2,926,000
2003 1,756,000 889,000 27,000 18,000 7,000 2,697,000 67,000 70,000 46,000 8,000 124,000 2,889,000
2004 1,643,000 900,000 27,000 16,000 7,000 2,594,000 76,000 68,000 41,000 9,000 118,000 2,788,000
2005 1,573,000 872,000 27,000 11,000 10,000 2,494,000 87,000 64,000 45,000 8,000 118,000 2,699,000
*Total for 1996 includes 2 fatalities of unknown person type.
Table 4
Persons Killed or Injured by Person Type and Vehicle Type, 1975-2005
2005 Motor Vehicle Crash Data from FARS and GES
Chapter 1 �Trends
19
Year
Sex
Total (>15 Years Old)*Male (>15 Years Old) Female (>15 Years Old)
NumberInvolved in
Crashes
LicensedDrivers
(Thousands)
InvolvementRate per100,000
LicensedDrivers
NumberInvolved in
Crashes
LicensedDrivers
(Thousands)
InvolvementRate per100,000
LicensedDrivers
NumberInvolved in
Crashes
LicensedDrivers
(Thousands)
InvolvementRate per100,000
LicensedDrivers
Drivers in Fatal Crashes
1975 45,087 70,435 64.01 9,356 59,233 15.80 54,445 129,668 41.991980 50,921 77,135 66.02 11,353 68,067 16.68 62,277 145,202 42.891985 44,290 81,537 54.32 12,031 75,231 15.99 56,322 156,769 35.931986 46,083 82,740 55.70 12,603 76,651 16.44 58,688 159,390 36.821987 46,337 83,939 55.20 13,492 77,789 17.34 59,829 161,728 36.991988 46,840 84,099 55.70 13,814 78,661 17.56 60,658 162,760 37.271989 44,941 85,356 52.65 13,927 80,160 17.37 58,870 165,516 35.571990 43,802 85,769 51.07 13,586 81,203 16.73 57,393 166,972 34.371991 40,288 86,630 46.51 12,716 82,300 15.45 53,007 168,930 31.381992 38,186 88,363 43.21 12,492 84,716 14.75 50,682 173,079 29.281993 39,118 87,974 44.47 12,960 85,138 15.22 52,080 173,112 30.081994 39,784 89,165 44.62 13,449 86,183 15.61 53,238 175,347 30.361995 40,799 89,184 45.75 14,043 87,386 16.07 54,847 176,570 31.061996 40,899 90,503 45.19 14,723 89,007 16.54 55,624 179,510 30.991997 40,594 91,888 44.18 14,816 90,789 16.32 55,412 182,677 30.331998 40,433 93,023 43.47 14,967 91,805 16.30 55,404 184,828 29.981999 40,639 94,149 43.16 14,717 92,988 15.83 55,359 187,137 29.582000 41,443 95,782 43.27 14,682 94,816 15.48 56,126 190,598 29.452001 41,548 95,779 43.38 14,829 95,471 15.53 56,380 191,250 29.482002 41,995 97,595 43.03 14,876 96,978 15.34 56,874 194,574 29.232003 42,177 98,209 42.95 15,106 97,919 15.43 57,285 196,128 29.212004 41,876 99,559 42.06 15,272 99,305 15.38 57,152 198,864 28.742005 42,722 100,378 42.56 14,883 100,263 14.84 57,611 200,641 28.71
Drivers in Injury Crashes
1988 2,423,000 84,099 2,881 1,485,000 78,661 1,887 3,907,000 162,760 2,4011989 2,347,000 85,356 2,749 1,446,000 80,160 1,804 3,793,000 165,516 2,2911990 2,285,000 85,769 2,664 1,458,000 81,203 1,795 3,743,000 166,972 2,2421991 2,171,000 86,630 2,506 1,380,000 82,300 1,677 3,551,000 168,930 2,1021992 2,114,000 88,363 2,392 1,439,000 84,716 1,699 3,553,000 173,079 2,0531993 2,144,000 87,974 2,437 1,468,000 85,138 1,724 3,612,000 173,112 2,0861994 2,264,000 89,165 2,539 1,574,000 86,183 1,826 3,838,000 175,347 2,1891995 2,378,000 89,184 2,667 1,687,000 87,386 1,931 4,066,000 176,570 2,3031996 2,378,000 90,503 2,627 1,711,000 89,007 1,922 4,089,000 179,510 2,2781997 2,296,000 91,888 2,499 1,643,000 90,789 1,809 3,939,000 182,677 2,1561998 2,158,000 93,023 2,319 1,576,000 91,805 1,717 3,734,000 184,828 2,0201999 2,134,000 94,149 2,267 1,609,000 92,988 1,730 3,743,000 187,137 2,0002000 2,192,000 95,782 2,289 1,573,000 94,816 1,659 3,765,000 190,598 1,9752001 2,090,000 95,779 2,182 1,547,000 95,471 1,620 3,637,000 191,250 1,9022002 2,000,000 97,595 2,049 1,481,000 96,978 1,528 3,482,000 194,574 1,7892003 1,990,000 98,209 2,026 1,525,000 97,919 1,557 3,514,000 196,128 1,7922004 1,912,000 99,559 1,920 1,482,000 99,305 1,493 3,394,000 198,864 1,7072005 1,837,000 100,378 1,830 1,425,000 100,263 1,421 3,262,000 200,641 1,626
Drivers in Property-Damage-Only Crashes
1988 5,013,000 84,099 5,961 2,816,000 78,661 3,580 7,829,000 162,760 4,8101989 4,915,000 85,356 5,758 2,687,000 80,160 3,352 7,602,000 165,516 4,5931990 4,733,000 85,769 5,519 2,677,000 81,203 3,296 7,410,000 166,972 4,4381991 4,419,000 86,630 5,101 2,600,000 82,300 3,159 7,019,000 168,930 4,1551992 4,316,000 88,363 4,885 2,530,000 84,716 2,987 6,847,000 173,079 3,9561993 4,402,000 87,974 5,003 2,561,000 85,138 3,008 6,963,000 173,112 4,0221994 4,695,000 89,165 5,265 2,828,000 86,183 3,282 7,523,000 175,347 4,2901995 4,847,000 89,184 5,434 2,905,000 87,386 3,325 7,752,000 176,570 4,3901996 4,888,000 90,503 5,400 2,968,000 89,007 3,335 7,856,000 179,510 4,3761997 4,808,000 91,888 5,232 2,967,000 90,789 3,268 7,775,000 182,677 4,2561998 4,634,000 93,023 4,982 2,902,000 91,805 3,162 7,536,000 184,828 4,0781999 4,509,000 94,149 4,789 2,800,000 92,988 3,011 7,309,000 187,137 3,9062000 4,559,000 95,782 4,760 2,904,000 94,816 3,062 7,463,000 190,598 3,9152001 4,518,000 95,779 4,717 2,903,000 95,471 3,041 7,421,000 191,250 3,8802002 4,436,000 97,595 4,545 2,999,000 96,978 3,093 7,435,000 194,574 3,8212003 4,528,000 98,209 4,610 3,020,000 97,919 3,084 7,547,000 196,128 3,8482004 4,405,000 99,559 4,424 3,037,000 99,305 3,058 7,442,000 198,864 3,7422005 4,357,000 100,378 4,341 3,007,000 100,263 2,999 7,364,000 200,641 3,670
*Total includes drivers (>15 years old) of unknown sex. Notes: Drivers in this table include motorcycle operators. Some states include restricted driver licensesand graduated driver licenses in their licensed driver counts.Source: Licensed Drivers—Federal Highway Administration.
Table 5
Drivers Involved in Crashes and Involvement Rates per Licensed Driverby Sex and Crash Severity, 1975-2005
20 Traffic Safety Facts 2005
Chapter 1 �Trends
1975 1980 1985 1990 1995 2000 2005
0
10
20
30
40
50
60
70Fatal Crashes
Female Male
Figure 3
Driver Involvement Rate per 100,000 Licensed Drivers 16 Years and Olderby Sex and Crash Severity, 1975-2005
1990 1995 2000 20050
500
1,000
1,500
2,000
2,500
3,000Injury Crashes
1990 1995 2000 20050
1,000
2,000
3,000
4,000
5,000
6,000Property-Damage-Only Crashes
2005 Motor Vehicle Crash Data from FARS and GES
Chapter 1 �Trends
21
Year
Age Group (Years)
Total<5 5-9 10-15 16-20 21-24 25-34 35-44 45-54 55-64 65-74 >74
Fatality Rate per 100,000 Population
1975 4.50 2.71 5.71 38.77 34.90 21.57 15.67 13.42 13.29 14.72 16.98 16.67
1980 4.24 2.67 6.00 42.94 39.86 24.82 16.85 14.51 12.83 12.96 15.27 18.45
1981 3.75 2.43 5.24 38.56 37.41 24.22 16.63 13.81 12.68 13.16 14.94 17.62
1982 3.67 2.22 4.85 34.51 32.75 20.45 14.30 11.84 11.24 11.85 14.89 15.39
1983 3.55 2.33 4.60 33.18 30.97 19.86 13.87 11.79 10.92 11.92 15.48 14.90
1984 3.13 2.33 5.21 34.94 32.89 20.26 13.91 11.86 11.16 12.98 16.18 15.39
1985 3.18 2.36 5.52 33.72 32.75 19.50 13.87 11.88 11.33 12.63 16.73 15.15
1986 3.42 2.30 6.07 38.16 33.72 21.04 13.82 11.50 11.38 13.46 17.71 15.92
1987 3.78 2.60 6.00 36.65 32.83 21.05 14.15 12.10 11.93 13.58 18.22 15.92
1988 3.82 2.64 5.74 37.95 33.63 20.50 14.20 12.33 12.15 14.12 19.26 16.02
1989 3.93 2.92 5.48 34.71 30.85 20.10 13.89 12.46 12.18 14.24 19.41 15.43
1990 3.30 2.50 5.25 34.14 30.62 19.81 13.34 12.20 11.91 13.36 18.48 14.89
1991 3.13 2.39 4.86 31.76 28.83 17.79 12.29 11.12 10.75 13.22 19.14 13.78
1992 2.99 2.41 4.75 28.37 25.96 16.54 11.71 10.62 10.53 13.27 18.81 12.89
1993 3.14 2.35 4.67 28.99 26.70 16.47 11.86 10.52 10.86 12.73 20.78 13.02
1994 3.46 2.35 5.07 30.46 26.27 16.07 11.79 11.15 10.71 13.99 20.71 13.18
1995 3.17 2.46 5.15 29.58 27.30 17.03 12.49 11.01 11.42 13.67 20.87 13.43
1996 3.40 2.34 5.07 29.43 27.31 16.78 12.60 11.14 11.58 14.20 20.84 13.46
1997 3.16 2.42 4.96 28.38 25.53 16.49 12.23 11.57 11.96 14.46 22.09 13.34
1998 3.03 2.60 4.60 27.61 25.06 15.81 12.60 11.44 11.53 14.31 21.28 13.09
1999 2.94 2.54 4.49 28.10 25.56 16.13 12.62 11.48 11.52 14.17 20.70 13.16
2000 2.82 2.38 4.27 27.80 25.28 15.54 12.81 11.51 11.39 12.89 19.48 12.88
2001 2.67 2.26 3.79 27.94 24.85 15.60 12.91 11.35 11.04 12.80 19.24 12.78
2002 2.43 2.12 4.10 29.16 25.70 15.60 12.98 11.86 11.15 12.68 18.62 12.98
2003 2.45 2.12 4.17 27.64 24.57 15.30 13.00 12.02 11.31 12.56 19.00 12.84
2004 2.54 2.26 4.31 27.17 24.68 15.52 12.40 12.07 11.14 12.43 17.84 12.70
2005 2.27 2.22 3.53 25.69 25.35 15.88 12.75 11.97 11.64 12.60 16.88 12.68
Injury Rate per 100,000 Population
1988 417 444 734 3,283 2,666 1,800 1,308 1,030 876 710 656 1,319
1989 370 469 727 3,210 2,467 1,672 1,280 985 801 713 618 1,251
1990 329 430 674 3,110 2,494 1,672 1,227 989 844 750 514 1,220
1991 384 470 709 2,921 2,317 1,574 1,144 977 801 727 521 1,162
1992 323 438 685 2,988 2,253 1,573 1,101 971 783 722 586 1,140
1993 367 471 657 2,885 2,307 1,606 1,195 956 821 707 592 1,155
1994 411 468 706 2,958 2,369 1,667 1,225 987 857 756 598 1,192
1995 418 483 742 3,193 2,456 1,722 1,291 1,132 926 755 624 1,257
1996 418 533 731 3,132 2,432 1,766 1,295 1,085 904 788 654 1,256
1997 400 461 684 2,981 2,401 1,689 1,257 1,012 815 761 641 1,196
1998 403 440 677 2,780 2,123 1,586 1,158 1,029 873 696 588 1,133
1999 383 477 662 2,828 2,169 1,596 1,135 1,028 801 759 610 1,136
2000 350 405 547 2,694 2,094 1,449 1,159 948 830 723 665 1,082
2001 310 371 512 2,468 2,025 1,385 1,093 931 756 669 575 1,018
2002 302 378 517 2,397 1,892 1,305 1,030 873 765 617 544 972
2003 300 372 473 2,287 1,831 1,316 1,016 874 733 609 516 950
2004 282 349 482 2,153 1,693 1,191 1,002 877 729 604 485 909
2005 260 319 480 2,003 1,706 1,198 943 830 686 545 457 871
Note: Population estimates for historical years are periodically revised by the U.S. Census Bureau.
Table 6
Motor Vehicle Occupant and Motorcycle Rider Fatality and Injury Ratesper Population by Age Group, 1975-2005
22 Traffic Safety Facts 2005
Chapter 1 �Trends
YearRegistered
Passenger Cars
Vehicle MilesTraveled(Millions)
Passenger CarOccupants
Killed
Fatality Rateper 100,000Registered
Passenger Cars
Fatality Rateper 100 MillionVehicle Miles
Traveled
Passenger CarOccupants
Injured
Injury Rateper 100,000Registered
Passenger Cars
Injury Rateper 100 MillionVehicle Miles
Traveled
1975 94,478,029 1,030,376 25,929 27.44 2.52 * * *
1976 97,011,684 1,070,667 26,166 26.97 2.44 * * *
1977 98,967,665 1,102,726 26,782 27.06 2.43 * * *
1978 101,855,551 1,136,459 28,153 27.64 2.48 * * *
1979 103,543,788 1,111,705 27,808 26.86 2.50 * * *
1980 104,770,998 1,107,056 27,449 26.20 2.48 * * *
1981 106,002,720 1,122,092 26,645 25.14 2.37 * * *
1982 106,936,590 1,145,828 23,330 21.82 2.04 * * *
1983 109,085,444 1,187,760 22,979 21.07 1.93 * * *
1984 112,177,361 1,226,461 23,620 21.06 1.93 * * *
1985 116,348,085 1,248,980 23,212 19.95 1.86 * * *
1986 117,268,114 1,277,550 24,944 21.27 1.95 * * *
1987 119,848,784 1,328,460 25,132 20.97 1.89 * * *
1988 121,519,139 1,384,047 25,808 21.24 1.86 2,585,000 2,127 187
1989 122,758,478 1,415,213 25,063 20.42 1.77 2,431,000 1,980 172
1990 123,276,600 1,427,178 24,092 19.54 1.69 2,376,000 1,928 167
1991 123,327,336 1,411,655 22,385 18.15 1.59 2,235,000 1,812 158
1992 120,346,747 1,436,035 21,387 17.77 1.49 2,232,000 1,854 155
1993 121,055,398 1,445,106 21,566 17.81 1.49 2,265,000 1,871 157
1994 121,996,580 1,459,208 21,997 18.03 1.51 2,364,000 1,937 162
1995 123,241,881 1,478,352 22,423 18.19 1.52 2,469,000 2,004 167
1996 124,612,787 1,499,139 22,505 18.06 1.50 2,458,000 1,973 164
1997 124,672,920 1,528,399 22,199 17.81 1.45 2,341,000 1,877 153
1998 125,965,709 1,555,901 21,194 16.83 1.36 2,201,000 1,748 141
1999 126,868,744 1,566,808 20,862 16.44 1.33 2,138,000 1,685 136
2000 127,740,420 1,580,735 20,699 16.20 1.31 2,052,000 1,606 130
2001 128,874,299 1,595,443 20,320 15.77 1.27 1,927,000 1,495 121
2002 130,196,812 1,611,860 20,569 15.80 1.28 1,805,000 1,386 112
2003 131,549,941 1,612,237 19,725 14.99 1.22 1,756,000 1,335 109
2004 133,275,377 1,628,255 19,192 14.40 1.18 1,643,000 1,232 101
2005 135,152,104 1,614,807 18,440 13.64 1.14 1,573,000 1,164 97
*Injury data not available before 1988.
Sources: Vehicle Miles Traveled—Federal Highway Administration, revised by NHTSA; Registered Vehicles—R.L. Polk & Co.
Table 7
Passenger Car Occupants Killed or Injured and Fatality and Injury Ratesper Registered Vehicle and Vehicle Miles of Travel, 1975-2005
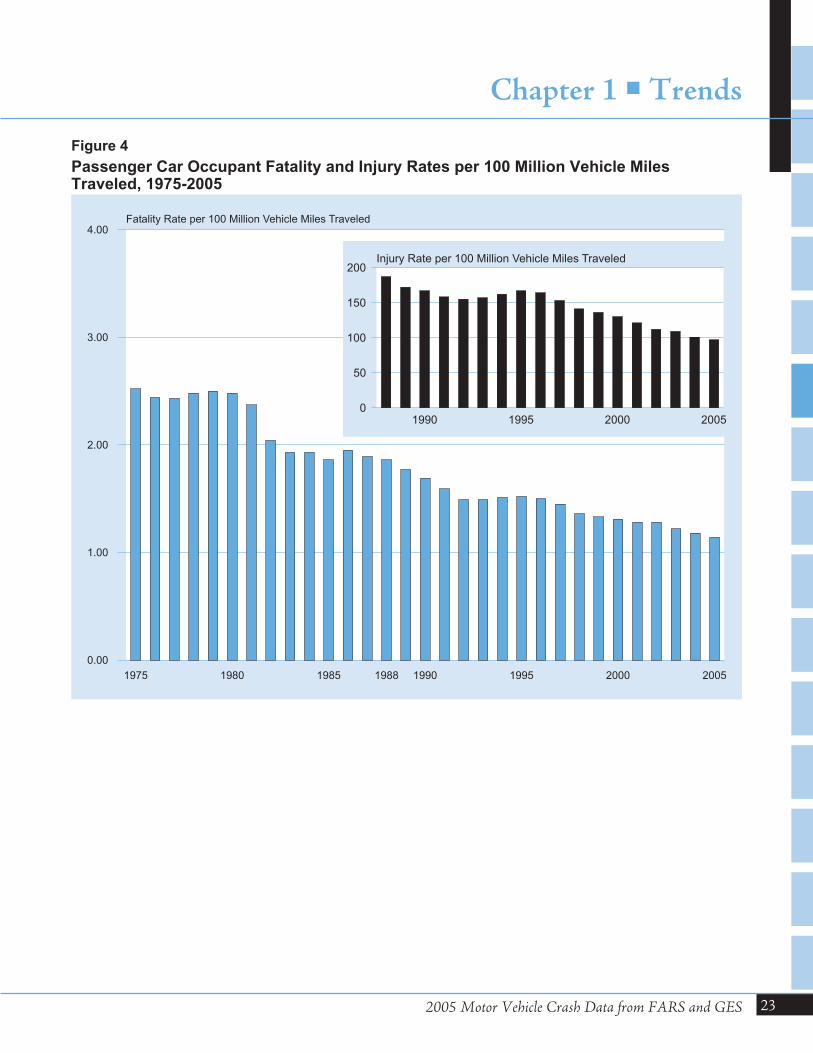
2005 Motor Vehicle Crash Data from FARS and GES
Chapter 1 �Trends
23
1975 1980 1985 1988 1990 1995 2000 2005
0.00
1.00
2.00
3.00
4.00Fatality Rate per 100 Million Vehicle Miles Traveled
Figure 4
Passenger Car Occupant Fatality and Injury Rates per 100 Million Vehicle MilesTraveled, 1975-2005
1990 1995 2000 20050
50
100
150
200Injury Rate per 100 Million Vehicle Miles Traveled
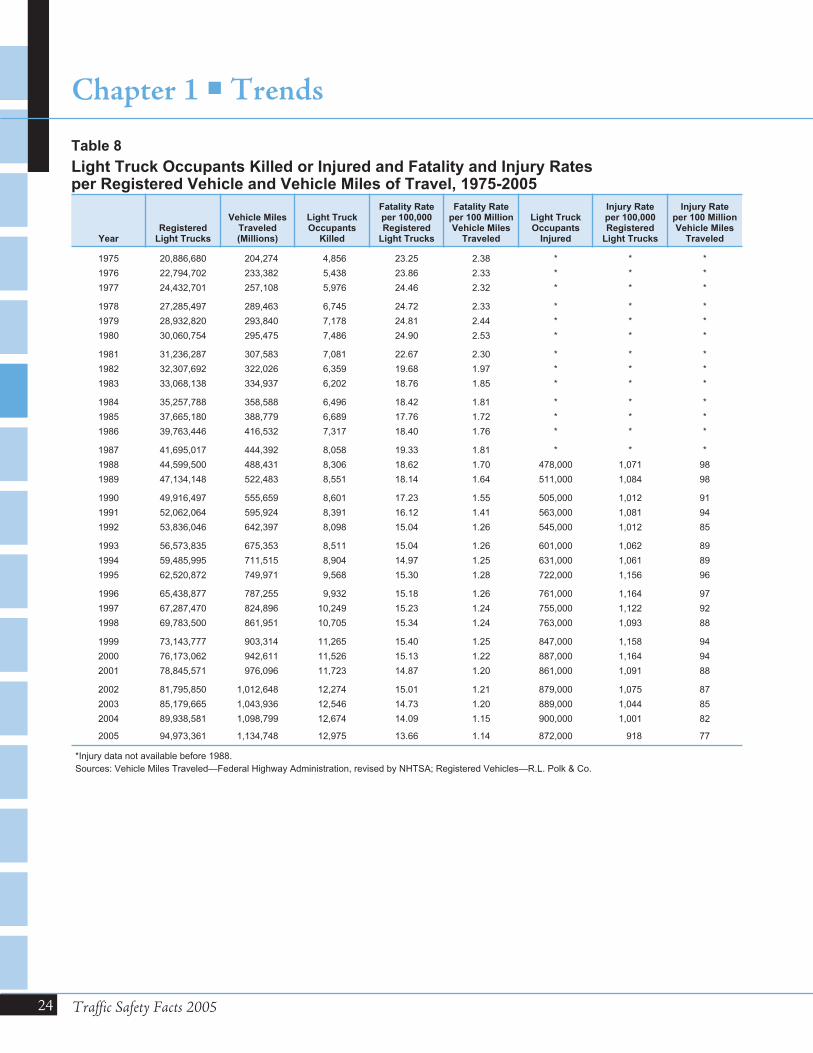
24 Traffic Safety Facts 2005
Chapter 1 �Trends
YearRegistered
Light Trucks
Vehicle MilesTraveled(Millions)
Light TruckOccupants
Killed
Fatality Rateper 100,000Registered
Light Trucks
Fatality Rateper 100 MillionVehicle Miles
Traveled
Light TruckOccupants
Injured
Injury Rateper 100,000Registered
Light Trucks
Injury Rateper 100 MillionVehicle Miles
Traveled
1975 20,886,680 204,274 4,856 23.25 2.38 * * *
1976 22,794,702 233,382 5,438 23.86 2.33 * * *
1977 24,432,701 257,108 5,976 24.46 2.32 * * *
1978 27,285,497 289,463 6,745 24.72 2.33 * * *
1979 28,932,820 293,840 7,178 24.81 2.44 * * *
1980 30,060,754 295,475 7,486 24.90 2.53 * * *
1981 31,236,287 307,583 7,081 22.67 2.30 * * *
1982 32,307,692 322,026 6,359 19.68 1.97 * * *
1983 33,068,138 334,937 6,202 18.76 1.85 * * *
1984 35,257,788 358,588 6,496 18.42 1.81 * * *
1985 37,665,180 388,779 6,689 17.76 1.72 * * *
1986 39,763,446 416,532 7,317 18.40 1.76 * * *
1987 41,695,017 444,392 8,058 19.33 1.81 * * *
1988 44,599,500 488,431 8,306 18.62 1.70 478,000 1,071 98
1989 47,134,148 522,483 8,551 18.14 1.64 511,000 1,084 98
1990 49,916,497 555,659 8,601 17.23 1.55 505,000 1,012 91
1991 52,062,064 595,924 8,391 16.12 1.41 563,000 1,081 94
1992 53,836,046 642,397 8,098 15.04 1.26 545,000 1,012 85
1993 56,573,835 675,353 8,511 15.04 1.26 601,000 1,062 89
1994 59,485,995 711,515 8,904 14.97 1.25 631,000 1,061 89
1995 62,520,872 749,971 9,568 15.30 1.28 722,000 1,156 96
1996 65,438,877 787,255 9,932 15.18 1.26 761,000 1,164 97
1997 67,287,470 824,896 10,249 15.23 1.24 755,000 1,122 92
1998 69,783,500 861,951 10,705 15.34 1.24 763,000 1,093 88
1999 73,143,777 903,314 11,265 15.40 1.25 847,000 1,158 94
2000 76,173,062 942,611 11,526 15.13 1.22 887,000 1,164 94
2001 78,845,571 976,096 11,723 14.87 1.20 861,000 1,091 88
2002 81,795,850 1,012,648 12,274 15.01 1.21 879,000 1,075 87
2003 85,179,665 1,043,936 12,546 14.73 1.20 889,000 1,044 85
2004 89,938,581 1,098,799 12,674 14.09 1.15 900,000 1,001 82
2005 94,973,361 1,134,748 12,975 13.66 1.14 872,000 918 77
*Injury data not available before 1988.
Sources: Vehicle Miles Traveled—Federal Highway Administration, revised by NHTSA; Registered Vehicles—R.L. Polk & Co.
Table 8
Light Truck Occupants Killed or Injured and Fatality and Injury Ratesper Registered Vehicle and Vehicle Miles of Travel, 1975-2005
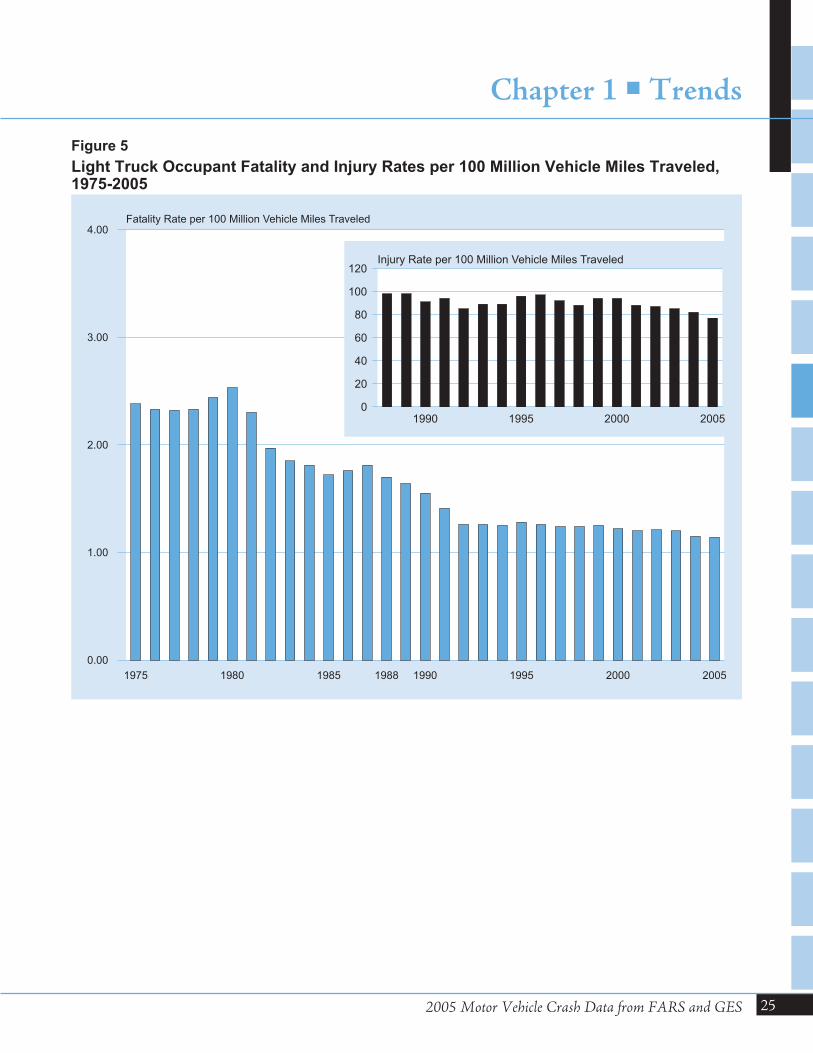
2005 Motor Vehicle Crash Data from FARS and GES
Chapter 1 �Trends
25
1975 1980 1985 1988 1990 1995 2000 2005
0.00
1.00
2.00
3.00
4.00Fatality Rate per 100 Million Vehicle Miles Traveled
Figure 5
Light Truck Occupant Fatality and Injury Rates per 100 Million Vehicle Miles Traveled,1975-2005
1990 1995 2000 20050
20
40
60
80
100
120Injury Rate per 100 Million Vehicle Miles Traveled

26 Traffic Safety Facts 2005
Chapter 1 �Trends
YearRegistered
Large Trucks
Vehicle MilesTraveled(Millions)
Large TruckOccupants
Killed
Fatality Rateper 100,000Registered
Large Trucks
Fatality Rateper 100 MillionVehicle Miles
Traveled
Large TruckOccupants
Injured
Injury Rateper 100,000Registered
Large Trucks
Injury Rateper 100 MillionVehicle Miles
Traveled
1975 5,362,369 81,330 961 17.92 1.18 * * *
1976 5,575,185 86,070 1,132 20.30 1.32 * * *
1977 5,689,903 95,021 1,287 22.62 1.35 * * *
1978 5,859,807 105,739 1,395 23.81 1.32 * * *
1979 5,891,571 109,004 1,432 24.31 1.31 * * *
1980 5,790,653 108,491 1,262 21.79 1.16 * * *
1981 5,716,278 108,702 1,133 19.82 1.04 * * *
1982 5,590,415 111,423 944 16.89 0.85 * * *
1983 5,508,392 116,132 982 17.83 0.85 * * *
1984 5,401,075 121,796 1,074 19.88 0.88 * * *
1985 5,996,337 123,504 977 16.29 0.79 * * *
1986 5,720,880 126,675 926 16.19 0.73 * * *
1987 5,718,266 133,517 852 14.90 0.64 * * *
1988 6,136,884 137,985 911 14.84 0.66 37,000 611 27
1989 6,226,482 142,749 858 13.78 0.60 43,000 687 30
1990 6,195,876 146,242 705 11.38 0.48 42,000 675 29
1991 6,172,146 149,543 661 10.71 0.44 28,000 454 19
1992 6,045,205 153,384 585 9.68 0.38 34,000 559 22
1993 6,088,155 159,888 605 9.94 0.38 32,000 527 20
1994 6,587,885 170,216 670 10.17 0.39 30,000 459 18
1995 6,719,421 178,156 648 9.64 0.36 30,000 452 17
1996 7,012,615 182,971 621 8.86 0.34 33,000 467 18
1997 7,083,326 191,477 723 10.21 0.38 31,000 436 16
1998 7,732,270 196,380 742 9.60 0.38 29,000 372 15
1999 7,791,426 202,688 759 9.74 0.37 33,000 422 16
2000 8,022,649 205,520 754 9.40 0.37 31,000 384 15
2001 7,857,675 209,032 708 9.01 0.34 29,000 374 14
2002 7,927,280 214,603 689 8.69 0.32 26,000 331 12
2003 7,756,888 217,917 726 9.36 0.33 27,000 347 12
2004 8,171,364 220,811 766 9.37 0.35 27,000 334 12
2005 8,481,999 222,836 803 9.47 0.36 27,000 322 12
*Injury data not available before 1988.
Source: Registered Vehicles and Vehicle Miles Traveled—Federal Highway Administration.
Table 9
Large Truck Occupants Killed or Injured and Fatality and Injury Ratesper Registered Vehicle and Vehicle Miles of Travel, 1975-2005
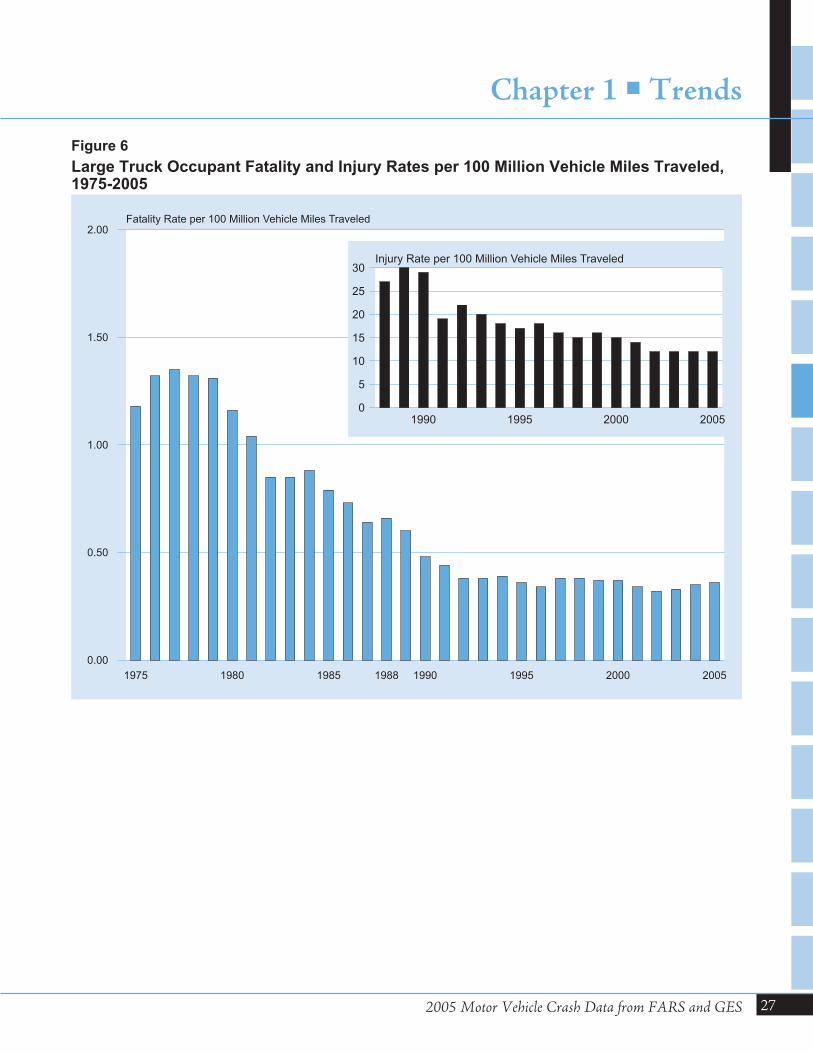
2005 Motor Vehicle Crash Data from FARS and GES
Chapter 1 �Trends
27
1975 1980 1985 1988 1990 1995 2000 2005
0.00
0.50
1.00
1.50
2.00Fatality Rate per 100 Million Vehicle Miles Traveled
Figure 6
Large Truck Occupant Fatality and Injury Rates per 100 Million Vehicle Miles Traveled,1975-2005
1990 1995 2000 20050
5
10
15
20
25
30Injury Rate per 100 Million Vehicle Miles Traveled
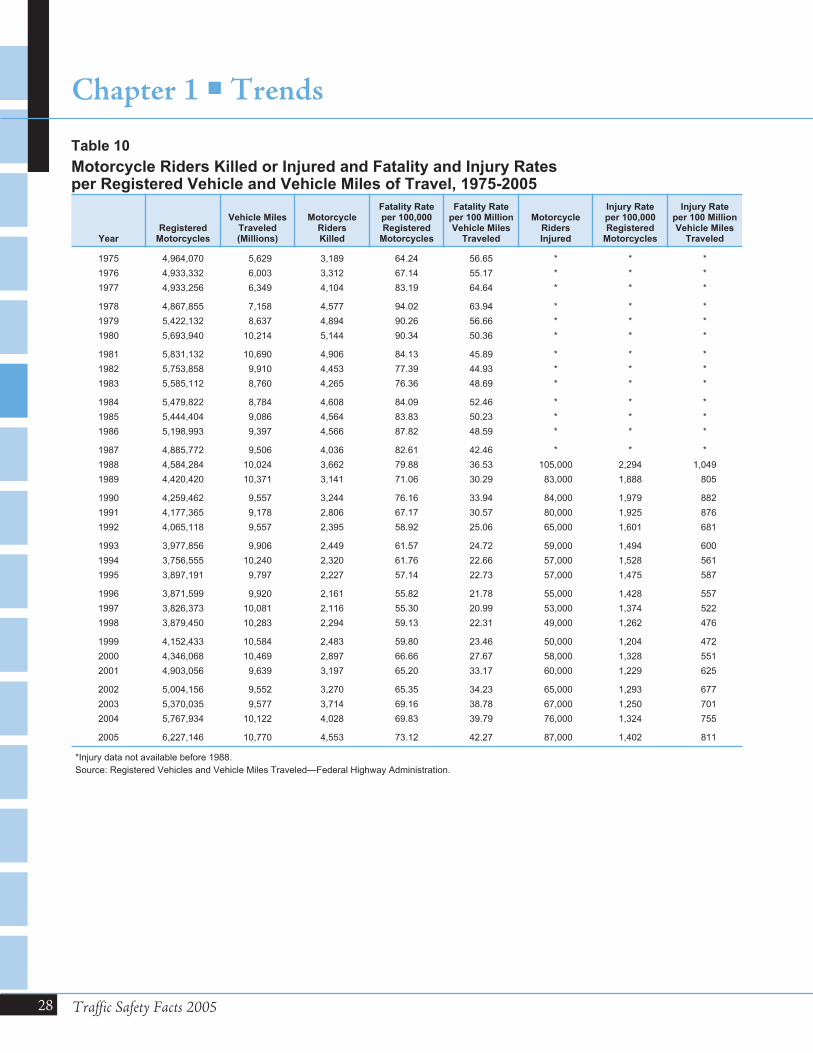
28 Traffic Safety Facts 2005
Chapter 1 �Trends
YearRegistered
Motorcycles
Vehicle MilesTraveled(Millions)
MotorcycleRidersKilled
Fatality Rateper 100,000Registered
Motorcycles
Fatality Rateper 100 MillionVehicle Miles
Traveled
MotorcycleRidersInjured
Injury Rateper 100,000Registered
Motorcycles
Injury Rateper 100 MillionVehicle Miles
Traveled
1975 4,964,070 5,629 3,189 64.24 56.65 * * *
1976 4,933,332 6,003 3,312 67.14 55.17 * * *
1977 4,933,256 6,349 4,104 83.19 64.64 * * *
1978 4,867,855 7,158 4,577 94.02 63.94 * * *
1979 5,422,132 8,637 4,894 90.26 56.66 * * *
1980 5,693,940 10,214 5,144 90.34 50.36 * * *
1981 5,831,132 10,690 4,906 84.13 45.89 * * *
1982 5,753,858 9,910 4,453 77.39 44.93 * * *
1983 5,585,112 8,760 4,265 76.36 48.69 * * *
1984 5,479,822 8,784 4,608 84.09 52.46 * * *
1985 5,444,404 9,086 4,564 83.83 50.23 * * *
1986 5,198,993 9,397 4,566 87.82 48.59 * * *
1987 4,885,772 9,506 4,036 82.61 42.46 * * *
1988 4,584,284 10,024 3,662 79.88 36.53 105,000 2,294 1,049
1989 4,420,420 10,371 3,141 71.06 30.29 83,000 1,888 805
1990 4,259,462 9,557 3,244 76.16 33.94 84,000 1,979 882
1991 4,177,365 9,178 2,806 67.17 30.57 80,000 1,925 876
1992 4,065,118 9,557 2,395 58.92 25.06 65,000 1,601 681
1993 3,977,856 9,906 2,449 61.57 24.72 59,000 1,494 600
1994 3,756,555 10,240 2,320 61.76 22.66 57,000 1,528 561
1995 3,897,191 9,797 2,227 57.14 22.73 57,000 1,475 587
1996 3,871,599 9,920 2,161 55.82 21.78 55,000 1,428 557
1997 3,826,373 10,081 2,116 55.30 20.99 53,000 1,374 522
1998 3,879,450 10,283 2,294 59.13 22.31 49,000 1,262 476
1999 4,152,433 10,584 2,483 59.80 23.46 50,000 1,204 472
2000 4,346,068 10,469 2,897 66.66 27.67 58,000 1,328 551
2001 4,903,056 9,639 3,197 65.20 33.17 60,000 1,229 625
2002 5,004,156 9,552 3,270 65.35 34.23 65,000 1,293 677
2003 5,370,035 9,577 3,714 69.16 38.78 67,000 1,250 701
2004 5,767,934 10,122 4,028 69.83 39.79 76,000 1,324 755
2005 6,227,146 10,770 4,553 73.12 42.27 87,000 1,402 811
*Injury data not available before 1988.
Source: Registered Vehicles and Vehicle Miles Traveled—Federal Highway Administration.
Table 10
Motorcycle Riders Killed or Injured and Fatality and Injury Ratesper Registered Vehicle and Vehicle Miles of Travel, 1975-2005
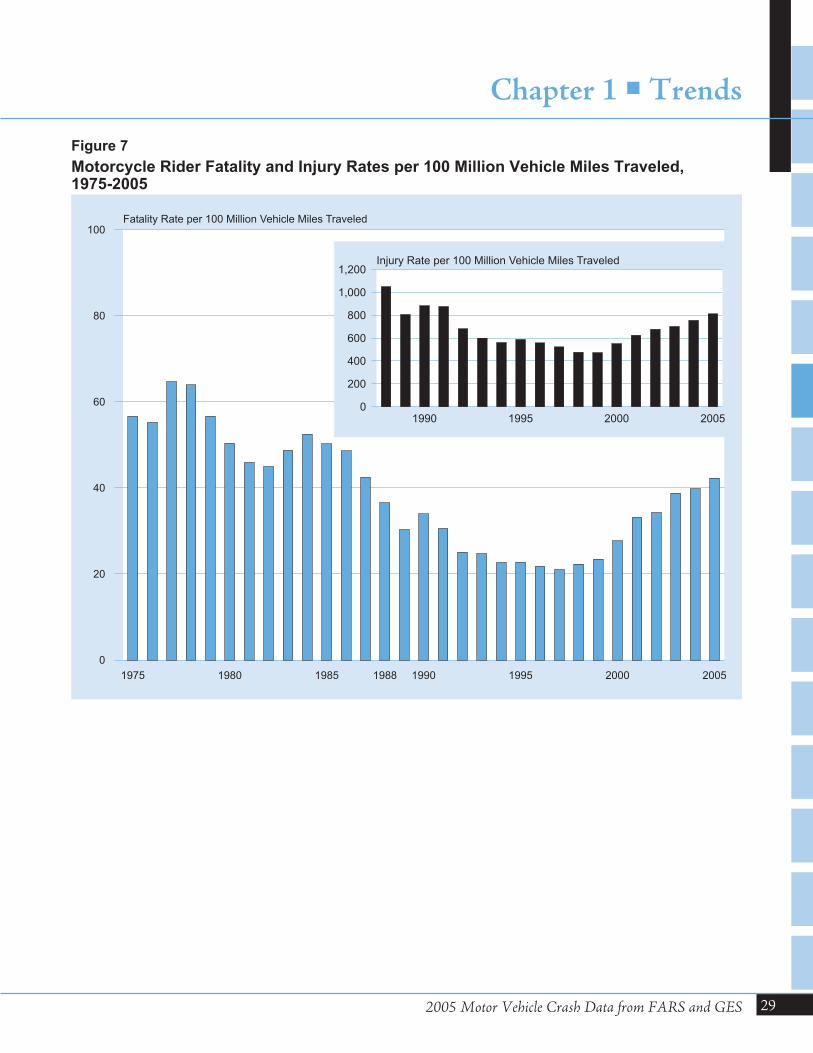
2005 Motor Vehicle Crash Data from FARS and GES
Chapter 1 �Trends
29
1975 1980 1985 1988 1990 1995 2000 2005
0
20
40
60
80
100Fatality Rate per 100 Million Vehicle Miles Traveled
Figure 7
Motorcycle Rider Fatality and Injury Rates per 100 Million Vehicle Miles Traveled,1975-2005
1990 1995 2000 20050
200
400
600
800
1,000
1,200Injury Rate per 100 Million Vehicle Miles Traveled
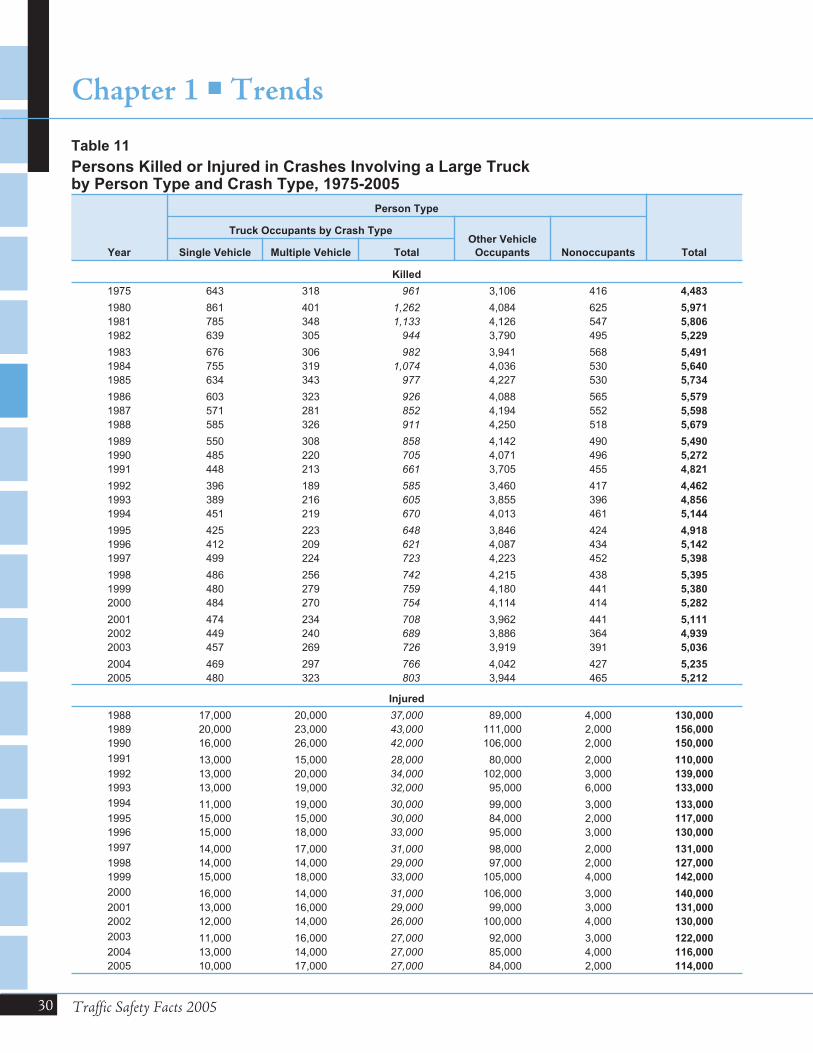
30 Traffic Safety Facts 2005
Chapter 1 �Trends
Year
Person Type
Total
Truck Occupants by Crash TypeOther Vehicle
Occupants NonoccupantsSingle Vehicle Multiple Vehicle Total
Killed
1975 643 318 961 3,106 416 4,483
1980 861 401 1,262 4,084 625 5,971
1981 785 348 1,133 4,126 547 5,806
1982 639 305 944 3,790 495 5,229
1983 676 306 982 3,941 568 5,491
1984 755 319 1,074 4,036 530 5,640
1985 634 343 977 4,227 530 5,734
1986 603 323 926 4,088 565 5,579
1987 571 281 852 4,194 552 5,598
1988 585 326 911 4,250 518 5,679
1989 550 308 858 4,142 490 5,490
1990 485 220 705 4,071 496 5,272
1991 448 213 661 3,705 455 4,821
1992 396 189 585 3,460 417 4,462
1993 389 216 605 3,855 396 4,856
1994 451 219 670 4,013 461 5,144
1995 425 223 648 3,846 424 4,918
1996 412 209 621 4,087 434 5,142
1997 499 224 723 4,223 452 5,398
1998 486 256 742 4,215 438 5,395
1999 480 279 759 4,180 441 5,380
2000 484 270 754 4,114 414 5,282
2001 474 234 708 3,962 441 5,111
2002 449 240 689 3,886 364 4,939
2003 457 269 726 3,919 391 5,036
2004 469 297 766 4,042 427 5,235
2005 480 323 803 3,944 465 5,212
Injured
1988 17,000 20,000 37,000 89,000 4,000 130,000
1989 20,000 23,000 43,000 111,000 2,000 156,000
1990 16,000 26,000 42,000 106,000 2,000 150,000
1991 13,000 15,000 28,000 80,000 2,000 110,000
1992 13,000 20,000 34,000 102,000 3,000 139,000
1993 13,000 19,000 32,000 95,000 6,000 133,000
1994 11,000 19,000 30,000 99,000 3,000 133,000
1995 15,000 15,000 30,000 84,000 2,000 117,000
1996 15,000 18,000 33,000 95,000 3,000 130,000
1997 14,000 17,000 31,000 98,000 2,000 131,000
1998 14,000 14,000 29,000 97,000 2,000 127,000
1999 15,000 18,000 33,000 105,000 4,000 142,000
2000 16,000 14,000 31,000 106,000 3,000 140,000
2001 13,000 16,000 29,000 99,000 3,000 131,000
2002 12,000 14,000 26,000 100,000 4,000 130,000
2003 11,000 16,000 27,000 92,000 3,000 122,000
2004 13,000 14,000 27,000 85,000 4,000 116,000
2005 10,000 17,000 27,000 84,000 2,000 114,000
Table 11
Persons Killed or Injured in Crashes Involving a Large Truckby Person Type and Crash Type, 1975-2005
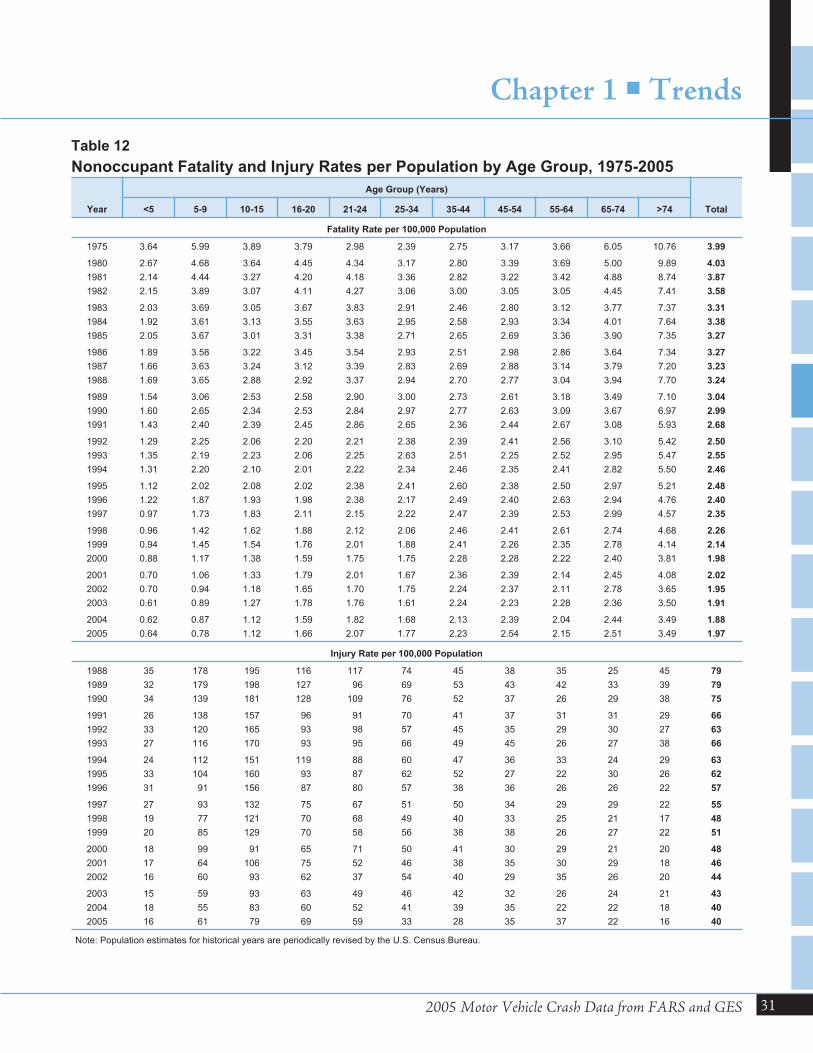
2005 Motor Vehicle Crash Data from FARS and GES
Chapter 1 �Trends
31
Year
Age Group (Years)
Total<5 5-9 10-15 16-20 21-24 25-34 35-44 45-54 55-64 65-74 >74
Fatality Rate per 100,000 Population
1975 3.64 5.99 3.89 3.79 2.98 2.39 2.75 3.17 3.66 6.05 10.76 3.99
1980 2.67 4.68 3.64 4.45 4.34 3.17 2.80 3.39 3.69 5.00 9.89 4.03
1981 2.14 4.44 3.27 4.20 4.18 3.36 2.82 3.22 3.42 4.88 8.74 3.87
1982 2.15 3.89 3.07 4.11 4.27 3.06 3.00 3.05 3.05 4.45 7.41 3.58
1983 2.03 3.69 3.05 3.67 3.83 2.91 2.46 2.80 3.12 3.77 7.37 3.31
1984 1.92 3.61 3.13 3.55 3.63 2.95 2.58 2.93 3.34 4.01 7.64 3.38
1985 2.05 3.67 3.01 3.31 3.38 2.71 2.65 2.69 3.36 3.90 7.35 3.27
1986 1.89 3.58 3.22 3.45 3.54 2.93 2.51 2.98 2.86 3.64 7.34 3.27
1987 1.66 3.63 3.24 3.12 3.39 2.83 2.69 2.88 3.14 3.79 7.20 3.23
1988 1.69 3.65 2.88 2.92 3.37 2.94 2.70 2.77 3.04 3.94 7.70 3.24
1989 1.54 3.06 2.53 2.58 2.90 3.00 2.73 2.61 3.18 3.49 7.10 3.04
1990 1.60 2.65 2.34 2.53 2.84 2.97 2.77 2.63 3.09 3.67 6.97 2.99
1991 1.43 2.40 2.39 2.45 2.86 2.65 2.36 2.44 2.67 3.08 5.93 2.68
1992 1.29 2.25 2.06 2.20 2.21 2.38 2.39 2.41 2.56 3.10 5.42 2.50
1993 1.35 2.19 2.23 2.06 2.25 2.63 2.51 2.25 2.52 2.95 5.47 2.55
1994 1.31 2.20 2.10 2.01 2.22 2.34 2.46 2.35 2.41 2.82 5.50 2.46
1995 1.12 2.02 2.08 2.02 2.38 2.41 2.60 2.38 2.50 2.97 5.21 2.48
1996 1.22 1.87 1.93 1.98 2.38 2.17 2.49 2.40 2.63 2.94 4.76 2.40
1997 0.97 1.73 1.83 2.11 2.15 2.22 2.47 2.39 2.53 2.99 4.57 2.35
1998 0.96 1.42 1.62 1.88 2.12 2.06 2.46 2.41 2.61 2.74 4.68 2.26
1999 0.94 1.45 1.54 1.76 2.01 1.88 2.41 2.26 2.35 2.78 4.14 2.14
2000 0.88 1.17 1.38 1.59 1.75 1.75 2.28 2.28 2.22 2.40 3.81 1.98
2001 0.70 1.06 1.33 1.79 2.01 1.67 2.36 2.39 2.14 2.45 4.08 2.02
2002 0.70 0.94 1.18 1.65 1.70 1.75 2.24 2.37 2.11 2.78 3.65 1.95
2003 0.61 0.89 1.27 1.78 1.76 1.61 2.24 2.23 2.28 2.36 3.50 1.91
2004 0.62 0.87 1.12 1.59 1.82 1.68 2.13 2.39 2.04 2.44 3.49 1.88
2005 0.64 0.78 1.12 1.66 2.07 1.77 2.23 2.54 2.15 2.51 3.49 1.97
Injury Rate per 100,000 Population
1988 35 178 195 116 117 74 45 38 35 25 45 79
1989 32 179 198 127 96 69 53 43 42 33 39 79
1990 34 139 181 128 109 76 52 37 26 29 38 75
1991 26 138 157 96 91 70 41 37 31 31 29 66
1992 33 120 165 93 98 57 45 35 29 30 27 63
1993 27 116 170 93 95 66 49 45 26 27 38 66
1994 24 112 151 119 88 60 47 36 33 24 29 63
1995 33 104 160 93 87 62 52 27 22 30 26 62
1996 31 91 156 87 80 57 38 36 26 26 22 57
1997 27 93 132 75 67 51 50 34 29 29 22 55
1998 19 77 121 70 68 49 40 33 25 21 17 48
1999 20 85 129 70 58 56 38 38 26 27 22 51
2000 18 99 91 65 71 50 41 30 29 21 20 48
2001 17 64 106 75 52 46 38 35 30 29 18 46
2002 16 60 93 62 37 54 40 29 35 26 20 44
2003 15 59 93 63 49 46 42 32 26 24 21 43
2004 18 55 83 60 52 41 39 35 22 22 18 40
2005 16 61 79 69 59 33 28 35 37 22 16 40
Note: Population estimates for historical years are periodically revised by the U.S. Census Bureau.
Table 12
Nonoccupant Fatality and Injury Rates per Population by Age Group, 1975-2005
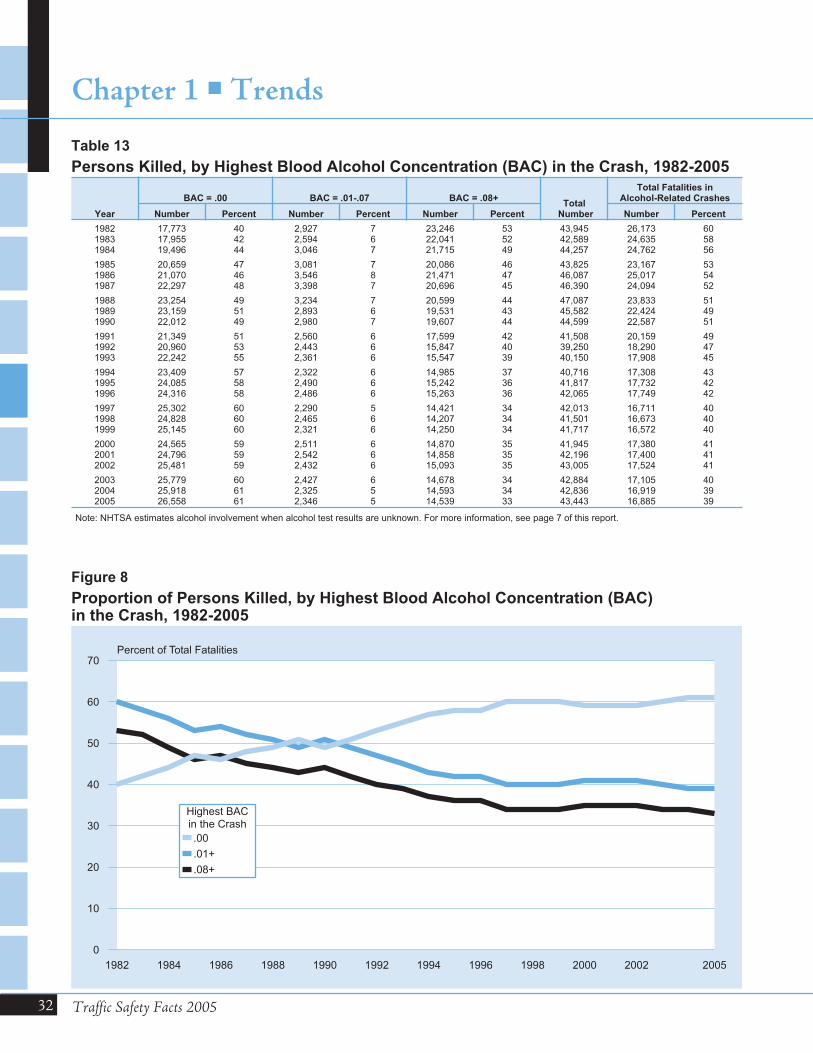
32 Traffic Safety Facts 2005
Chapter 1 �Trends
Year
BAC = .00 BAC = .01-.07 BAC = .08+Total
Number
Total Fatalities inAlcohol-Related Crashes
Number Percent Number Percent Number Percent Number Percent
1982 17,773 40 2,927 7 23,246 53 43,945 26,173 601983 17,955 42 2,594 6 22,041 52 42,589 24,635 581984 19,496 44 3,046 7 21,715 49 44,257 24,762 56
1985 20,659 47 3,081 7 20,086 46 43,825 23,167 531986 21,070 46 3,546 8 21,471 47 46,087 25,017 541987 22,297 48 3,398 7 20,696 45 46,390 24,094 52
1988 23,254 49 3,234 7 20,599 44 47,087 23,833 511989 23,159 51 2,893 6 19,531 43 45,582 22,424 491990 22,012 49 2,980 7 19,607 44 44,599 22,587 51
1991 21,349 51 2,560 6 17,599 42 41,508 20,159 491992 20,960 53 2,443 6 15,847 40 39,250 18,290 471993 22,242 55 2,361 6 15,547 39 40,150 17,908 45
1994 23,409 57 2,322 6 14,985 37 40,716 17,308 431995 24,085 58 2,490 6 15,242 36 41,817 17,732 421996 24,316 58 2,486 6 15,263 36 42,065 17,749 42
1997 25,302 60 2,290 5 14,421 34 42,013 16,711 401998 24,828 60 2,465 6 14,207 34 41,501 16,673 401999 25,145 60 2,321 6 14,250 34 41,717 16,572 40
2000 24,565 59 2,511 6 14,870 35 41,945 17,380 412001 24,796 59 2,542 6 14,858 35 42,196 17,400 412002 25,481 59 2,432 6 15,093 35 43,005 17,524 41
2003 25,779 60 2,427 6 14,678 34 42,884 17,105 402004 25,918 61 2,325 5 14,593 34 42,836 16,919 392005 26,558 61 2,346 5 14,539 33 43,443 16,885 39
Note: NHTSA estimates alcohol involvement when alcohol test results are unknown. For more information, see page 7 of this report.
Table 13
Persons Killed, by Highest Blood Alcohol Concentration (BAC) in the Crash, 1982-2005
1982 1984 1986 1988 1990 1992 1994 1996 1998 2000 2002 2005
0
10
20
30
40
50
60
70Percent of Total Fatalities
Highest BACin the Crash
.00 `
.01+
.08+
Figure 8
Proportion of Persons Killed, by Highest Blood Alcohol Concentration (BAC)in the Crash, 1982-2005
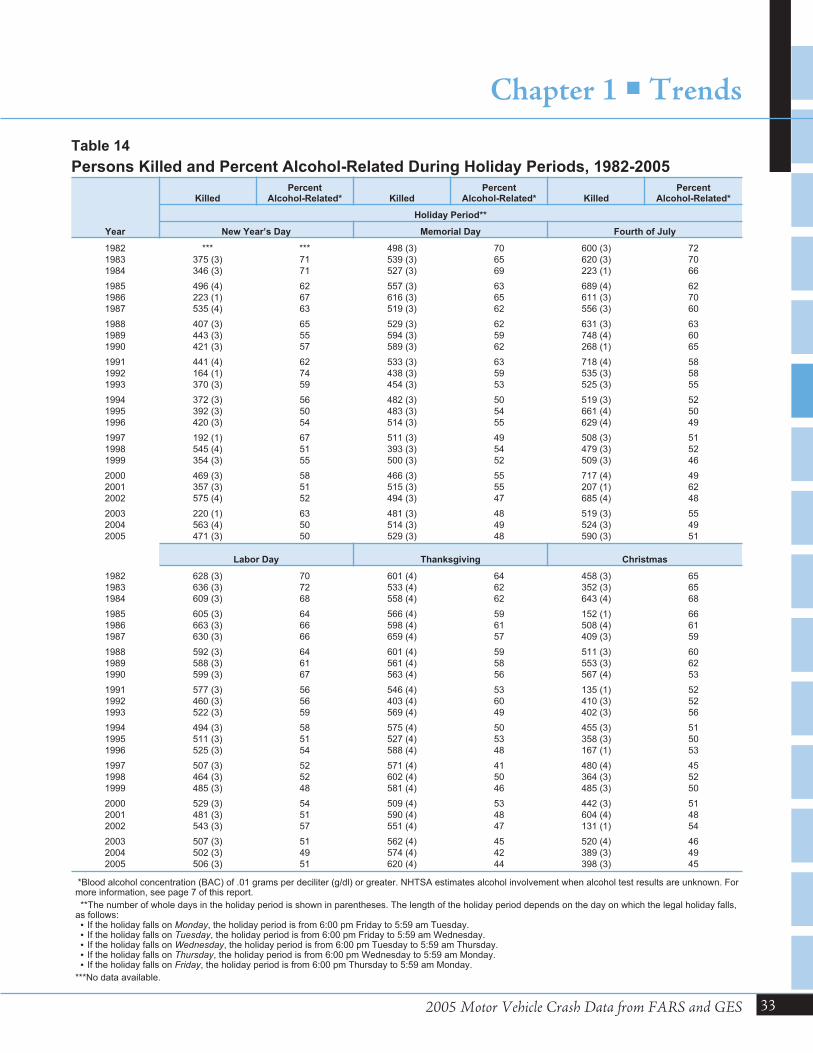
2005 Motor Vehicle Crash Data from FARS and GES
Chapter 1 �Trends
33
Year
KilledPercent
Alcohol-Related* KilledPercent
Alcohol-Related* KilledPercent
Alcohol-Related*
Holiday Period**
New Year’s Day Memorial Day Fourth of July
1982 *** *** 498 (3) 70 600 (3) 721983 375 (3) 71 539 (3) 65 620 (3) 701984 346 (3) 71 527 (3) 69 223 (1) 66
1985 496 (4) 62 557 (3) 63 689 (4) 621986 223 (1) 67 616 (3) 65 611 (3) 701987 535 (4) 63 519 (3) 62 556 (3) 60
1988 407 (3) 65 529 (3) 62 631 (3) 631989 443 (3) 55 594 (3) 59 748 (4) 601990 421 (3) 57 589 (3) 62 268 (1) 65
1991 441 (4) 62 533 (3) 63 718 (4) 581992 164 (1) 74 438 (3) 59 535 (3) 581993 370 (3) 59 454 (3) 53 525 (3) 55
1994 372 (3) 56 482 (3) 50 519 (3) 521995 392 (3) 50 483 (3) 54 661 (4) 501996 420 (3) 54 514 (3) 55 629 (4) 49
1997 192 (1) 67 511 (3) 49 508 (3) 511998 545 (4) 51 393 (3) 54 479 (3) 521999 354 (3) 55 500 (3) 52 509 (3) 46
2000 469 (3) 58 466 (3) 55 717 (4) 492001 357 (3) 51 515 (3) 55 207 (1) 622002 575 (4) 52 494 (3) 47 685 (4) 48
2003 220 (1) 63 481 (3) 48 519 (3) 552004 563 (4) 50 514 (3) 49 524 (3) 492005 471 (3) 50 529 (3) 48 590 (3) 51
Labor Day Thanksgiving Christmas
1982 628 (3) 70 601 (4) 64 458 (3) 651983 636 (3) 72 533 (4) 62 352 (3) 651984 609 (3) 68 558 (4) 62 643 (4) 68
1985 605 (3) 64 566 (4) 59 152 (1) 661986 663 (3) 66 598 (4) 61 508 (4) 611987 630 (3) 66 659 (4) 57 409 (3) 59
1988 592 (3) 64 601 (4) 59 511 (3) 601989 588 (3) 61 561 (4) 58 553 (3) 621990 599 (3) 67 563 (4) 56 567 (4) 53
1991 577 (3) 56 546 (4) 53 135 (1) 521992 460 (3) 56 403 (4) 60 410 (3) 521993 522 (3) 59 569 (4) 49 402 (3) 56
1994 494 (3) 58 575 (4) 50 455 (3) 511995 511 (3) 51 527 (4) 53 358 (3) 501996 525 (3) 54 588 (4) 48 167 (1) 53
1997 507 (3) 52 571 (4) 41 480 (4) 451998 464 (3) 52 602 (4) 50 364 (3) 521999 485 (3) 48 581 (4) 46 485 (3) 50
2000 529 (3) 54 509 (4) 53 442 (3) 512001 481 (3) 51 590 (4) 48 604 (4) 482002 543 (3) 57 551 (4) 47 131 (1) 54
2003 507 (3) 51 562 (4) 45 520 (4) 462004 502 (3) 49 574 (4) 42 389 (3) 492005 506 (3) 51 620 (4) 44 398 (3) 45
*Blood alcohol concentration (BAC) of .01 grams per deciliter (g/dl) or greater. NHTSA estimates alcohol involvement when alcohol test results are unknown. Formore information, see page 7 of this report.
**The number of whole days in the holiday period is shown in parentheses. The length of the holiday period depends on the day on which the legal holiday falls,as follows:
• If the holiday falls on Monday, the holiday period is from 6:00 pm Friday to 5:59 am Tuesday.• If the holiday falls on Tuesday, the holiday period is from 6:00 pm Friday to 5:59 am Wednesday.• If the holiday falls on Wednesday, the holiday period is from 6:00 pm Tuesday to 5:59 am Thursday.• If the holiday falls on Thursday, the holiday period is from 6:00 pm Wednesday to 5:59 am Monday.• If the holiday falls on Friday, the holiday period is from 6:00 pm Thursday to 5:59 am Monday.
***No data available.
Table 14
Persons Killed and Percent Alcohol-Related During Holiday Periods, 1982-2005
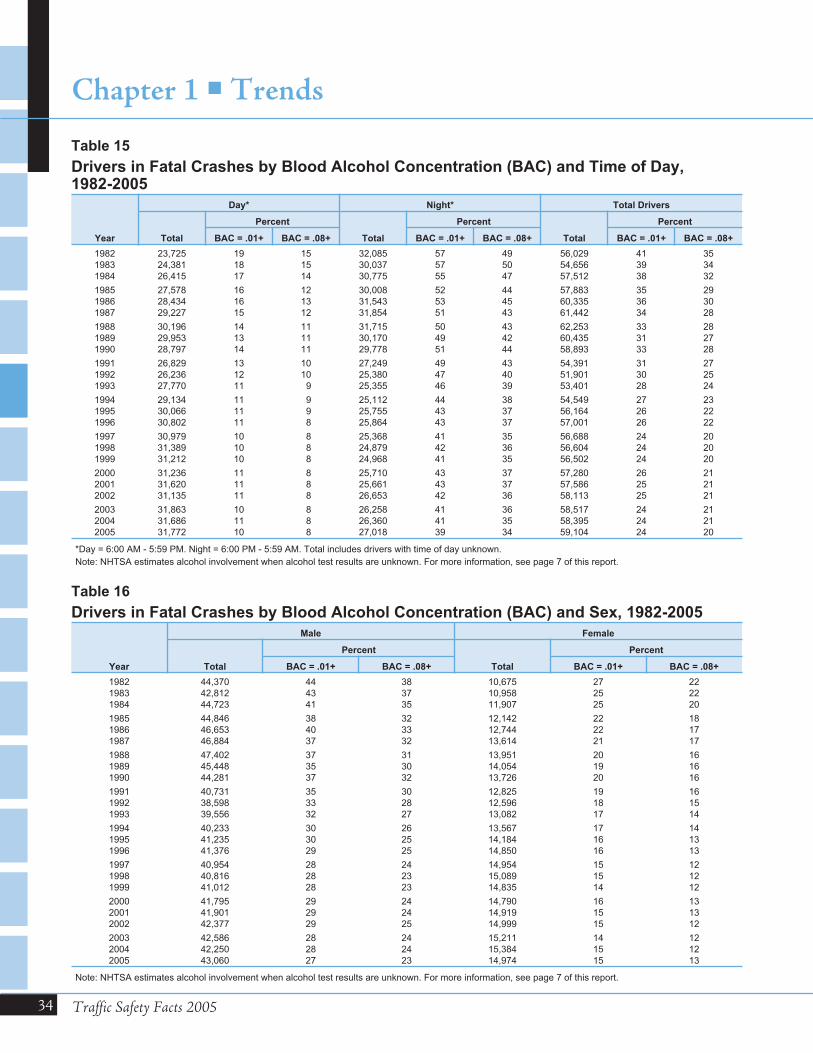
34 Traffic Safety Facts 2005
Chapter 1 �Trends
Year
Day* Night* Total Drivers
Total
Percent
Total
Percent
Total
Percent
BAC = .01+ BAC = .08+ BAC = .01+ BAC = .08+ BAC = .01+ BAC = .08+
1982 23,725 19 15 32,085 57 49 56,029 41 351983 24,381 18 15 30,037 57 50 54,656 39 341984 26,415 17 14 30,775 55 47 57,512 38 32
1985 27,578 16 12 30,008 52 44 57,883 35 291986 28,434 16 13 31,543 53 45 60,335 36 301987 29,227 15 12 31,854 51 43 61,442 34 28
1988 30,196 14 11 31,715 50 43 62,253 33 281989 29,953 13 11 30,170 49 42 60,435 31 271990 28,797 14 11 29,778 51 44 58,893 33 28
1991 26,829 13 10 27,249 49 43 54,391 31 271992 26,236 12 10 25,380 47 40 51,901 30 251993 27,770 11 9 25,355 46 39 53,401 28 24
1994 29,134 11 9 25,112 44 38 54,549 27 231995 30,066 11 9 25,755 43 37 56,164 26 221996 30,802 11 8 25,864 43 37 57,001 26 22
1997 30,979 10 8 25,368 41 35 56,688 24 201998 31,389 10 8 24,879 42 36 56,604 24 201999 31,212 10 8 24,968 41 35 56,502 24 20
2000 31,236 11 8 25,710 43 37 57,280 26 212001 31,620 11 8 25,661 43 37 57,586 25 212002 31,135 11 8 26,653 42 36 58,113 25 21
2003 31,863 10 8 26,258 41 36 58,517 24 212004 31,686 11 8 26,360 41 35 58,395 24 212005 31,772 10 8 27,018 39 34 59,104 24 20
*Day = 6:00 AM - 5:59 PM. Night = 6:00 PM - 5:59 AM. Total includes drivers with time of day unknown.
Note: NHTSA estimates alcohol involvement when alcohol test results are unknown. For more information, see page 7 of this report.
Table 15
Drivers in Fatal Crashes by Blood Alcohol Concentration (BAC) and Time of Day,1982-2005
Year
Male Female
Total
Percent
Total
Percent
BAC = .01+ BAC = .08+ BAC = .01+ BAC = .08+
1982 44,370 44 38 10,675 27 221983 42,812 43 37 10,958 25 221984 44,723 41 35 11,907 25 20
1985 44,846 38 32 12,142 22 181986 46,653 40 33 12,744 22 171987 46,884 37 32 13,614 21 17
1988 47,402 37 31 13,951 20 161989 45,448 35 30 14,054 19 161990 44,281 37 32 13,726 20 16
1991 40,731 35 30 12,825 19 161992 38,598 33 28 12,596 18 151993 39,556 32 27 13,082 17 14
1994 40,233 30 26 13,567 17 141995 41,235 30 25 14,184 16 131996 41,376 29 25 14,850 16 13
1997 40,954 28 24 14,954 15 121998 40,816 28 23 15,089 15 121999 41,012 28 23 14,835 14 12
2000 41,795 29 24 14,790 16 132001 41,901 29 24 14,919 15 132002 42,377 29 25 14,999 15 12
2003 42,586 28 24 15,211 14 122004 42,250 28 24 15,384 15 122005 43,060 27 23 14,974 15 13
Note: NHTSA estimates alcohol involvement when alcohol test results are unknown. For more information, see page 7 of this report.
Table 16
Drivers in Fatal Crashes by Blood Alcohol Concentration (BAC) and Sex, 1982-2005
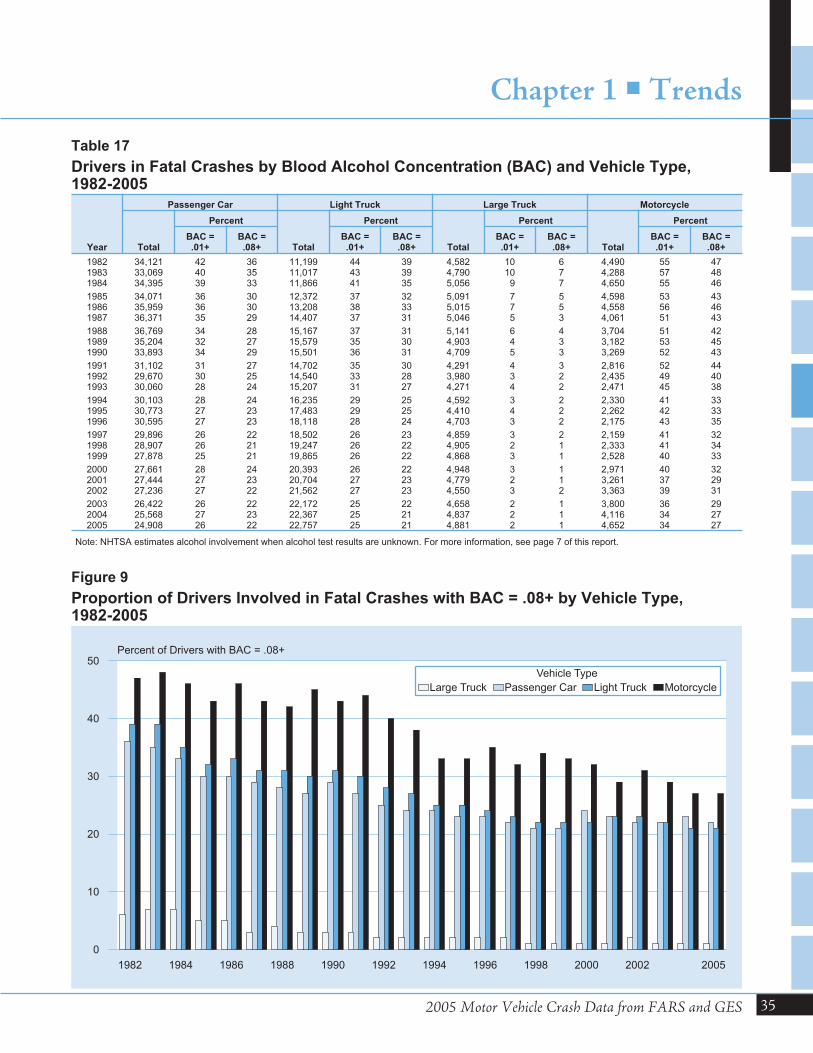
2005 Motor Vehicle Crash Data from FARS and GES
Chapter 1 �Trends
35
Year
Passenger Car Light Truck Large Truck Motorcycle
Total
Percent
Total
Percent
Total
Percent
Total
Percent
BAC =.01+
BAC =.08+
BAC =.01+
BAC =.08+
BAC =.01+
BAC =.08+
BAC =.01+
BAC =.08+
1982 34,121 42 36 11,199 44 39 4,582 10 6 4,490 55 471983 33,069 40 35 11,017 43 39 4,790 10 7 4,288 57 481984 34,395 39 33 11,866 41 35 5,056 9 7 4,650 55 46
1985 34,071 36 30 12,372 37 32 5,091 7 5 4,598 53 431986 35,959 36 30 13,208 38 33 5,015 7 5 4,558 56 461987 36,371 35 29 14,407 37 31 5,046 5 3 4,061 51 43
1988 36,769 34 28 15,167 37 31 5,141 6 4 3,704 51 421989 35,204 32 27 15,579 35 30 4,903 4 3 3,182 53 451990 33,893 34 29 15,501 36 31 4,709 5 3 3,269 52 43
1991 31,102 31 27 14,702 35 30 4,291 4 3 2,816 52 441992 29,670 30 25 14,540 33 28 3,980 3 2 2,435 49 401993 30,060 28 24 15,207 31 27 4,271 4 2 2,471 45 38
1994 30,103 28 24 16,235 29 25 4,592 3 2 2,330 41 331995 30,773 27 23 17,483 29 25 4,410 4 2 2,262 42 331996 30,595 27 23 18,118 28 24 4,703 3 2 2,175 43 35
1997 29,896 26 22 18,502 26 23 4,859 3 2 2,159 41 321998 28,907 26 21 19,247 26 22 4,905 2 1 2,333 41 341999 27,878 25 21 19,865 26 22 4,868 3 1 2,528 40 33
2000 27,661 28 24 20,393 26 22 4,948 3 1 2,971 40 322001 27,444 27 23 20,704 27 23 4,779 2 1 3,261 37 292002 27,236 27 22 21,562 27 23 4,550 3 2 3,363 39 31
2003 26,422 26 22 22,172 25 22 4,658 2 1 3,800 36 292004 25,568 27 23 22,367 25 21 4,837 2 1 4,116 34 272005 24,908 26 22 22,757 25 21 4,881 2 1 4,652 34 27
Note: NHTSA estimates alcohol involvement when alcohol test results are unknown. For more information, see page 7 of this report.
Table 17
Drivers in Fatal Crashes by Blood Alcohol Concentration (BAC) and Vehicle Type,1982-2005
1982 1984 1986 1988 1990 1992 1994 1996 1998 2000 2002 2005
0
10
20
30
40
50Percent of Drivers with BAC = .08+
Vehicle Type
Large Truck Passenger Car Light Truck Motorcycle
Figure 9
Proportion of Drivers Involved in Fatal Crashes with BAC = .08+ by Vehicle Type,1982-2005
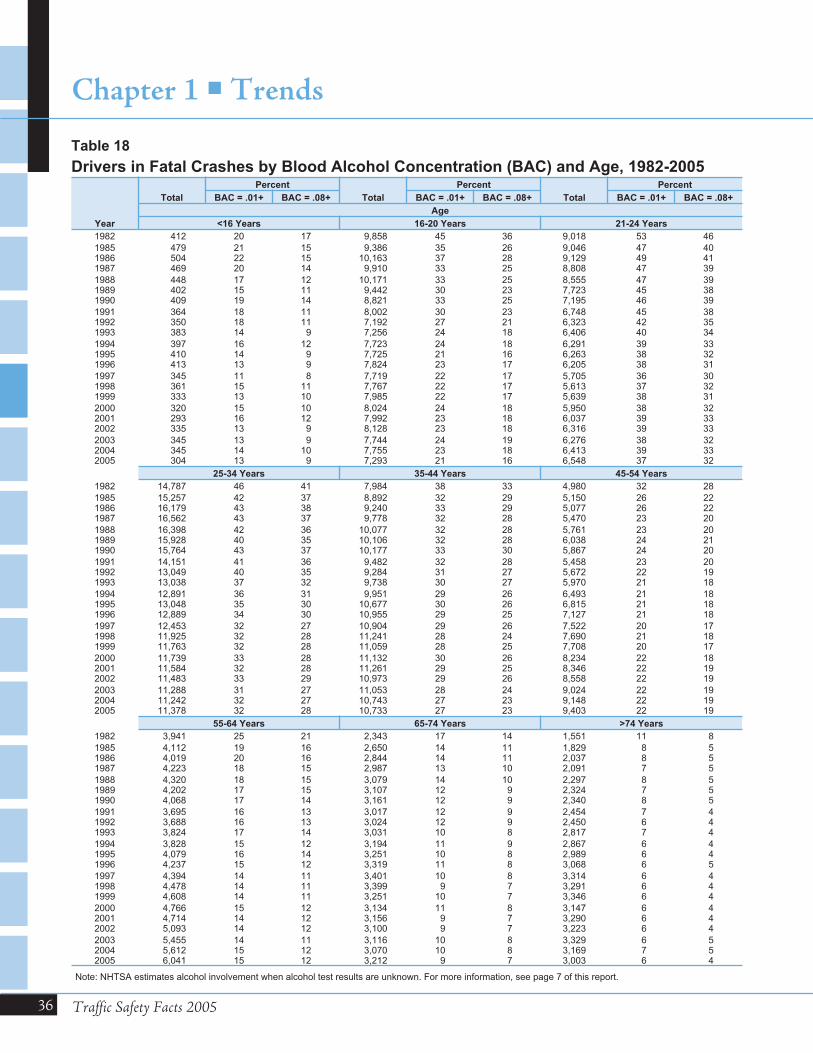
36 Traffic Safety Facts 2005
Chapter 1 �Trends
Year
Total
Percent
Total
Percent
Total
Percent
BAC = .01+ BAC = .08+ BAC = .01+ BAC = .08+ BAC = .01+ BAC = .08+
Age
<16 Years 16-20 Years 21-24 Years
1982 412 20 17 9,858 45 36 9,018 53 46
1985 479 21 15 9,386 35 26 9,046 47 401986 504 22 15 10,163 37 28 9,129 49 411987 469 20 14 9,910 33 25 8,808 47 39
1988 448 17 12 10,171 33 25 8,555 47 391989 402 15 11 9,442 30 23 7,723 45 381990 409 19 14 8,821 33 25 7,195 46 39
1991 364 18 11 8,002 30 23 6,748 45 381992 350 18 11 7,192 27 21 6,323 42 351993 383 14 9 7,256 24 18 6,406 40 34
1994 397 16 12 7,723 24 18 6,291 39 331995 410 14 9 7,725 21 16 6,263 38 321996 413 13 9 7,824 23 17 6,205 38 31
1997 345 11 8 7,719 22 17 5,705 36 301998 361 15 11 7,767 22 17 5,613 37 321999 333 13 10 7,985 22 17 5,639 38 31
2000 320 15 10 8,024 24 18 5,950 38 322001 293 16 12 7,992 23 18 6,037 39 332002 335 13 9 8,128 23 18 6,316 39 33
2003 345 13 9 7,744 24 19 6,276 38 322004 345 14 10 7,755 23 18 6,413 39 332005 304 13 9 7,293 21 16 6,548 37 32
25-34 Years 35-44 Years 45-54 Years
1982 14,787 46 41 7,984 38 33 4,980 32 28
1985 15,257 42 37 8,892 32 29 5,150 26 221986 16,179 43 38 9,240 33 29 5,077 26 221987 16,562 43 37 9,778 32 28 5,470 23 20
1988 16,398 42 36 10,077 32 28 5,761 23 201989 15,928 40 35 10,106 32 28 6,038 24 211990 15,764 43 37 10,177 33 30 5,867 24 20
1991 14,151 41 36 9,482 32 28 5,458 23 201992 13,049 40 35 9,284 31 27 5,672 22 191993 13,038 37 32 9,738 30 27 5,970 21 18
1994 12,891 36 31 9,951 29 26 6,493 21 181995 13,048 35 30 10,677 30 26 6,815 21 181996 12,889 34 30 10,955 29 25 7,127 21 18
1997 12,453 32 27 10,904 29 26 7,522 20 171998 11,925 32 28 11,241 28 24 7,690 21 181999 11,763 32 28 11,059 28 25 7,708 20 17
2000 11,739 33 28 11,132 30 26 8,234 22 182001 11,584 32 28 11,261 29 25 8,346 22 192002 11,483 33 29 10,973 29 26 8,558 22 19
2003 11,288 31 27 11,053 28 24 9,024 22 192004 11,242 32 27 10,743 27 23 9,148 22 192005 11,378 32 28 10,733 27 23 9,403 22 19
55-64 Years 65-74 Years >74 Years
1982 3,941 25 21 2,343 17 14 1,551 11 8
1985 4,112 19 16 2,650 14 11 1,829 8 51986 4,019 20 16 2,844 14 11 2,037 8 51987 4,223 18 15 2,987 13 10 2,091 7 5
1988 4,320 18 15 3,079 14 10 2,297 8 51989 4,202 17 15 3,107 12 9 2,324 7 51990 4,068 17 14 3,161 12 9 2,340 8 5
1991 3,695 16 13 3,017 12 9 2,454 7 41992 3,688 16 13 3,024 12 9 2,450 6 41993 3,824 17 14 3,031 10 8 2,817 7 4
1994 3,828 15 12 3,194 11 9 2,867 6 41995 4,079 16 14 3,251 10 8 2,989 6 41996 4,237 15 12 3,319 11 8 3,068 6 5
1997 4,394 14 11 3,401 10 8 3,314 6 41998 4,478 14 11 3,399 9 7 3,291 6 41999 4,608 14 11 3,251 10 7 3,346 6 4
2000 4,766 15 12 3,134 11 8 3,147 6 42001 4,714 14 12 3,156 9 7 3,290 6 42002 5,093 14 12 3,100 9 7 3,223 6 4
2003 5,455 14 11 3,116 10 8 3,329 6 52004 5,612 15 12 3,070 10 8 3,169 7 52005 6,041 15 12 3,212 9 7 3,003 6 4
Note: NHTSA estimates alcohol involvement when alcohol test results are unknown. For more information, see page 7 of this report.
Table 18
Drivers in Fatal Crashes by Blood Alcohol Concentration (BAC) and Age, 1982-2005
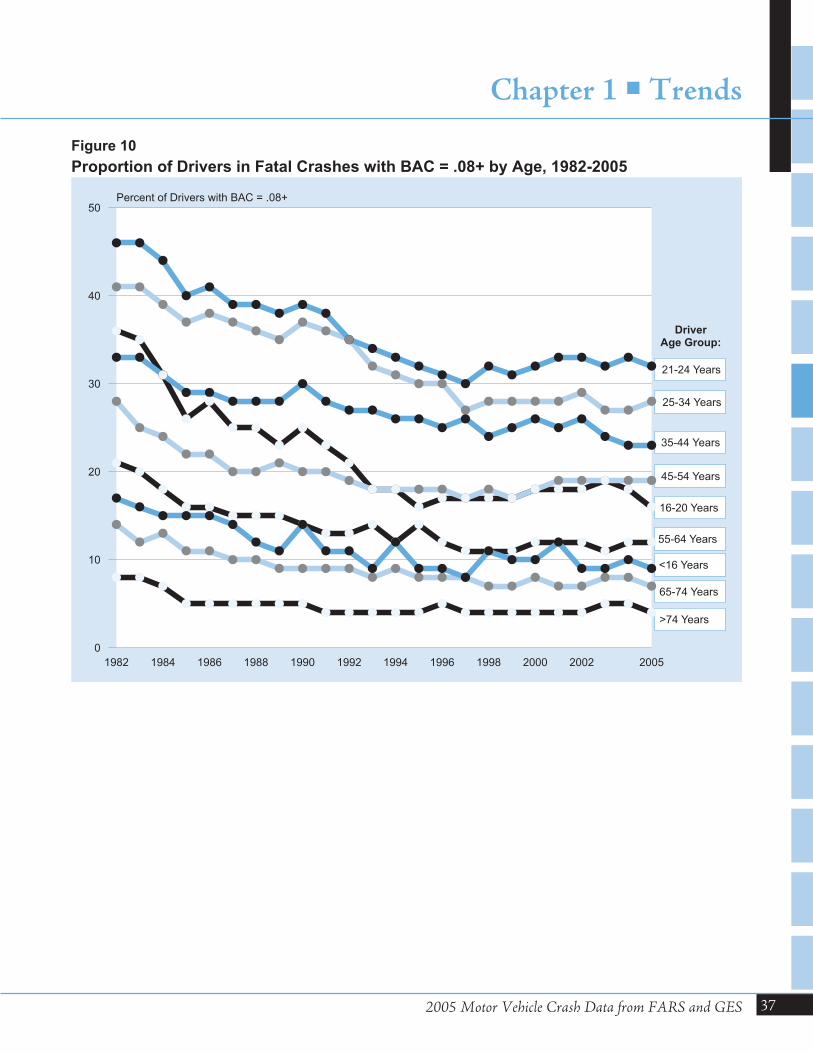
2005 Motor Vehicle Crash Data from FARS and GES
Chapter 1 �Trends
37
>74 Years
<16 Years
21-24 Years
25-34 Years
35-44 Years
45-54 Years
16-20 Years
55-64 Years
65-74 Years
�
�
�
�
��
� ����
������
���� �
��
�
�
�
�
�����
���
��� �
�� � � �
�
� �
�
�
�
�
� �� � �
�
�� �
� ���
�����
��
�
�
��
� �
� ��� �
�� � � �
����� � � �
�
�
�
�
�
�
� �
�
�
�
�
� �
�� � � �
� � ���
�
�
�
�
� �� � �
�� �
�
�
�
�� � �
� � ���
�
�
��
� �� �
� � � ���� � �
� ��� �
� �
�
�
�� � �
�
��
�
� �
�
�
� ��
�� �
�
� ��
�
�
��
� � � � � �� � � � �
�� � � � � �
� �
1982 1984 1986 1988 1990 1992 1994 1996 1998 2000 2002 2005
0
10
20
30
40
50Percent of Drivers with BAC = .08+
DriverAge Group:
Figure 10
Proportion of Drivers in Fatal Crashes with BAC = .08+ by Age, 1982-2005
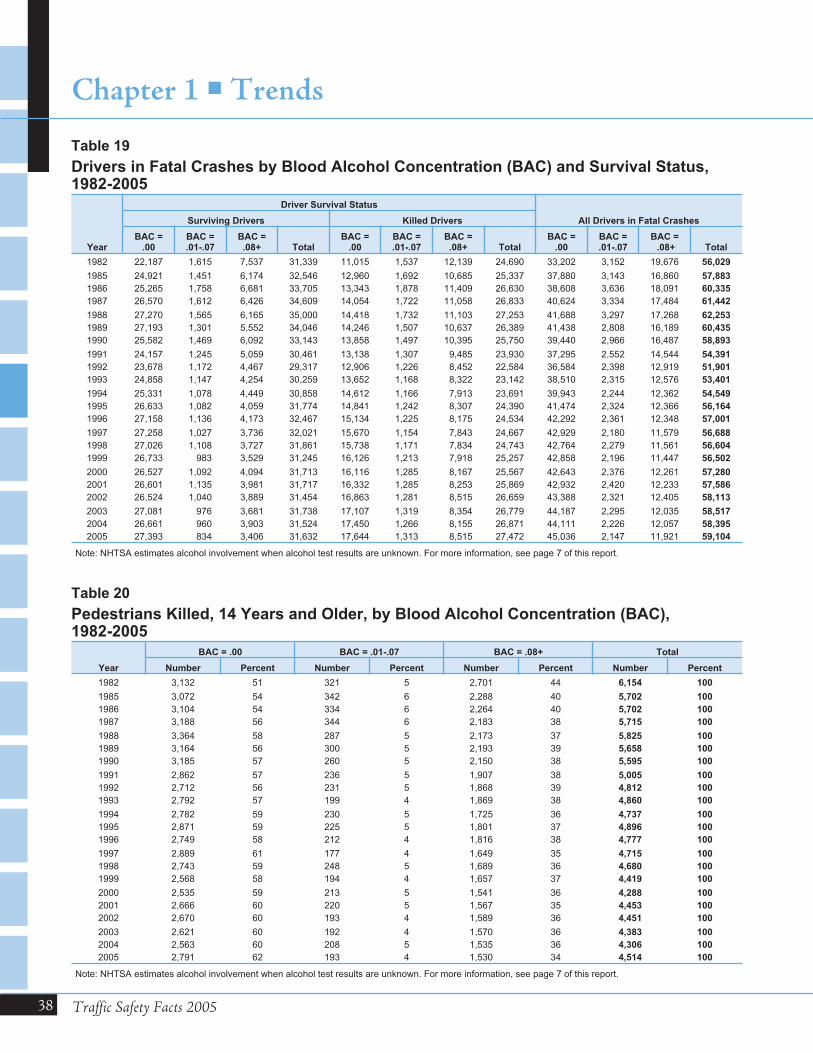
38 Traffic Safety Facts 2005
Chapter 1 �Trends
Year
Driver Survival Status
All Drivers in Fatal CrashesSurviving Drivers Killed Drivers
BAC =.00
BAC =.01-.07
BAC =.08+ Total
BAC =.00
BAC =.01-.07
BAC =.08+ Total
BAC =.00
BAC =.01-.07
BAC =.08+ Total
1982 22,187 1,615 7,537 31,339 11,015 1,537 12,139 24,690 33,202 3,152 19,676 56,029
1985 24,921 1,451 6,174 32,546 12,960 1,692 10,685 25,337 37,880 3,143 16,860 57,883
1986 25,265 1,758 6,681 33,705 13,343 1,878 11,409 26,630 38,608 3,636 18,091 60,335
1987 26,570 1,612 6,426 34,609 14,054 1,722 11,058 26,833 40,624 3,334 17,484 61,442
1988 27,270 1,565 6,165 35,000 14,418 1,732 11,103 27,253 41,688 3,297 17,268 62,253
1989 27,193 1,301 5,552 34,046 14,246 1,507 10,637 26,389 41,438 2,808 16,189 60,435
1990 25,582 1,469 6,092 33,143 13,858 1,497 10,395 25,750 39,440 2,966 16,487 58,893
1991 24,157 1,245 5,059 30,461 13,138 1,307 9,485 23,930 37,295 2,552 14,544 54,391
1992 23,678 1,172 4,467 29,317 12,906 1,226 8,452 22,584 36,584 2,398 12,919 51,901
1993 24,858 1,147 4,254 30,259 13,652 1,168 8,322 23,142 38,510 2,315 12,576 53,401
1994 25,331 1,078 4,449 30,858 14,612 1,166 7,913 23,691 39,943 2,244 12,362 54,549
1995 26,633 1,082 4,059 31,774 14,841 1,242 8,307 24,390 41,474 2,324 12,366 56,164
1996 27,158 1,136 4,173 32,467 15,134 1,225 8,175 24,534 42,292 2,361 12,348 57,001
1997 27,258 1,027 3,736 32,021 15,670 1,154 7,843 24,667 42,929 2,180 11,579 56,688
1998 27,026 1,108 3,727 31,861 15,738 1,171 7,834 24,743 42,764 2,279 11,561 56,604
1999 26,733 983 3,529 31,245 16,126 1,213 7,918 25,257 42,858 2,196 11,447 56,502
2000 26,527 1,092 4,094 31,713 16,116 1,285 8,167 25,567 42,643 2,376 12,261 57,280
2001 26,601 1,135 3,981 31,717 16,332 1,285 8,253 25,869 42,932 2,420 12,233 57,586
2002 26,524 1,040 3,889 31,454 16,863 1,281 8,515 26,659 43,388 2,321 12,405 58,113
2003 27,081 976 3,681 31,738 17,107 1,319 8,354 26,779 44,187 2,295 12,035 58,517
2004 26,661 960 3,903 31,524 17,450 1,266 8,155 26,871 44,111 2,226 12,057 58,395
2005 27,393 834 3,406 31,632 17,644 1,313 8,515 27,472 45,036 2,147 11,921 59,104
Note: NHTSA estimates alcohol involvement when alcohol test results are unknown. For more information, see page 7 of this report.
Table 19
Drivers in Fatal Crashes by Blood Alcohol Concentration (BAC) and Survival Status,1982-2005
Year
BAC = .00 BAC = .01-.07 BAC = .08+ Total
Number Percent Number Percent Number Percent Number Percent
1982 3,132 51 321 5 2,701 44 6,154 100
1985 3,072 54 342 6 2,288 40 5,702 100
1986 3,104 54 334 6 2,264 40 5,702 100
1987 3,188 56 344 6 2,183 38 5,715 100
1988 3,364 58 287 5 2,173 37 5,825 100
1989 3,164 56 300 5 2,193 39 5,658 100
1990 3,185 57 260 5 2,150 38 5,595 100
1991 2,862 57 236 5 1,907 38 5,005 100
1992 2,712 56 231 5 1,868 39 4,812 100
1993 2,792 57 199 4 1,869 38 4,860 100
1994 2,782 59 230 5 1,725 36 4,737 100
1995 2,871 59 225 5 1,801 37 4,896 100
1996 2,749 58 212 4 1,816 38 4,777 100
1997 2,889 61 177 4 1,649 35 4,715 100
1998 2,743 59 248 5 1,689 36 4,680 100
1999 2,568 58 194 4 1,657 37 4,419 100
2000 2,535 59 213 5 1,541 36 4,288 100
2001 2,666 60 220 5 1,567 35 4,453 100
2002 2,670 60 193 4 1,589 36 4,451 100
2003 2,621 60 192 4 1,570 36 4,383 100
2004 2,563 60 208 5 1,535 36 4,306 100
2005 2,791 62 193 4 1,530 34 4,514 100
Note: NHTSA estimates alcohol involvement when alcohol test results are unknown. For more information, see page 7 of this report.
Table 20
Pedestrians Killed, 14 Years and Older, by Blood Alcohol Concentration (BAC),1982-2005
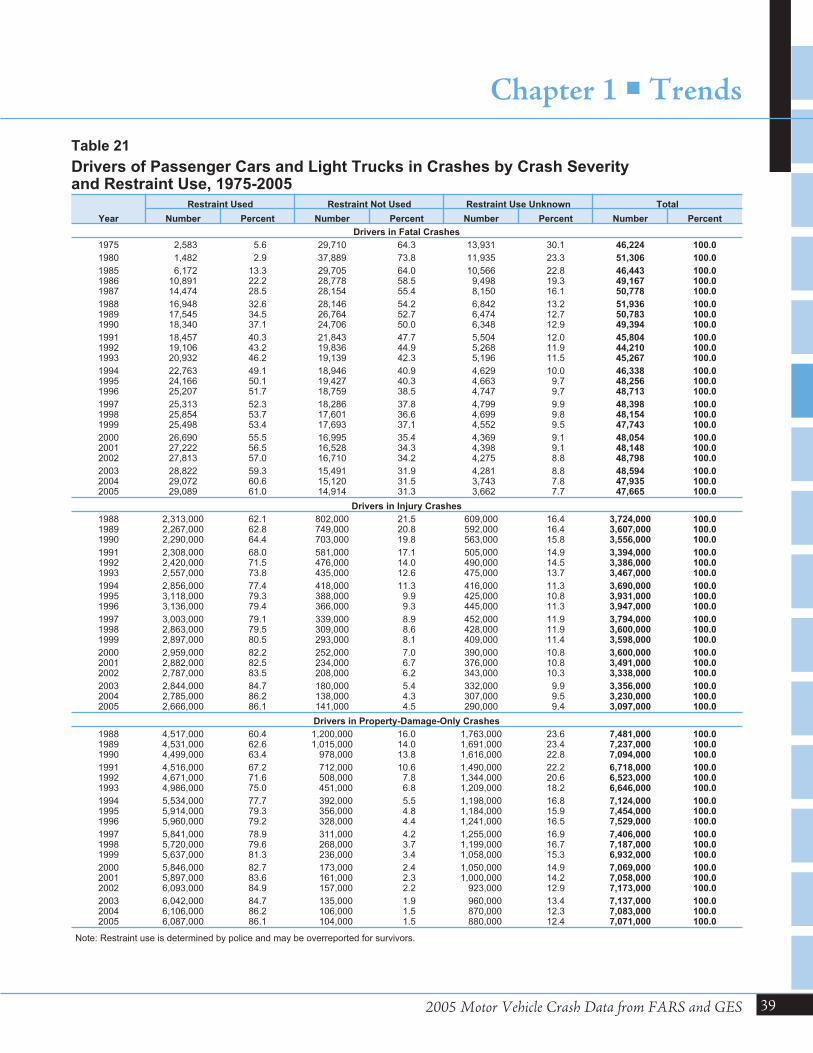
2005 Motor Vehicle Crash Data from FARS and GES
Chapter 1 �Trends
39
Year
Restraint Used Restraint Not Used Restraint Use Unknown Total
Number Percent Number Percent Number Percent Number Percent
Drivers in Fatal Crashes
1975 2,583 5.6 29,710 64.3 13,931 30.1 46,224 100.0
1980 1,482 2.9 37,889 73.8 11,935 23.3 51,306 100.0
1985 6,172 13.3 29,705 64.0 10,566 22.8 46,443 100.01986 10,891 22.2 28,778 58.5 9,498 19.3 49,167 100.01987 14,474 28.5 28,154 55.4 8,150 16.1 50,778 100.0
1988 16,948 32.6 28,146 54.2 6,842 13.2 51,936 100.01989 17,545 34.5 26,764 52.7 6,474 12.7 50,783 100.01990 18,340 37.1 24,706 50.0 6,348 12.9 49,394 100.0
1991 18,457 40.3 21,843 47.7 5,504 12.0 45,804 100.01992 19,106 43.2 19,836 44.9 5,268 11.9 44,210 100.01993 20,932 46.2 19,139 42.3 5,196 11.5 45,267 100.0
1994 22,763 49.1 18,946 40.9 4,629 10.0 46,338 100.01995 24,166 50.1 19,427 40.3 4,663 9.7 48,256 100.01996 25,207 51.7 18,759 38.5 4,747 9.7 48,713 100.0
1997 25,313 52.3 18,286 37.8 4,799 9.9 48,398 100.01998 25,854 53.7 17,601 36.6 4,699 9.8 48,154 100.01999 25,498 53.4 17,693 37.1 4,552 9.5 47,743 100.0
2000 26,690 55.5 16,995 35.4 4,369 9.1 48,054 100.02001 27,222 56.5 16,528 34.3 4,398 9.1 48,148 100.02002 27,813 57.0 16,710 34.2 4,275 8.8 48,798 100.0
2003 28,822 59.3 15,491 31.9 4,281 8.8 48,594 100.02004 29,072 60.6 15,120 31.5 3,743 7.8 47,935 100.02005 29,089 61.0 14,914 31.3 3,662 7.7 47,665 100.0
Drivers in Injury Crashes
1988 2,313,000 62.1 802,000 21.5 609,000 16.4 3,724,000 100.01989 2,267,000 62.8 749,000 20.8 592,000 16.4 3,607,000 100.01990 2,290,000 64.4 703,000 19.8 563,000 15.8 3,556,000 100.0
1991 2,308,000 68.0 581,000 17.1 505,000 14.9 3,394,000 100.01992 2,420,000 71.5 476,000 14.0 490,000 14.5 3,386,000 100.01993 2,557,000 73.8 435,000 12.6 475,000 13.7 3,467,000 100.0
1994 2,856,000 77.4 418,000 11.3 416,000 11.3 3,690,000 100.01995 3,118,000 79.3 388,000 9.9 425,000 10.8 3,931,000 100.01996 3,136,000 79.4 366,000 9.3 445,000 11.3 3,947,000 100.0
1997 3,003,000 79.1 339,000 8.9 452,000 11.9 3,794,000 100.01998 2,863,000 79.5 309,000 8.6 428,000 11.9 3,600,000 100.01999 2,897,000 80.5 293,000 8.1 409,000 11.4 3,598,000 100.0
2000 2,959,000 82.2 252,000 7.0 390,000 10.8 3,600,000 100.02001 2,882,000 82.5 234,000 6.7 376,000 10.8 3,491,000 100.02002 2,787,000 83.5 208,000 6.2 343,000 10.3 3,338,000 100.0
2003 2,844,000 84.7 180,000 5.4 332,000 9.9 3,356,000 100.02004 2,785,000 86.2 138,000 4.3 307,000 9.5 3,230,000 100.02005 2,666,000 86.1 141,000 4.5 290,000 9.4 3,097,000 100.0
Drivers in Property-Damage-Only Crashes
1988 4,517,000 60.4 1,200,000 16.0 1,763,000 23.6 7,481,000 100.01989 4,531,000 62.6 1,015,000 14.0 1,691,000 23.4 7,237,000 100.01990 4,499,000 63.4 978,000 13.8 1,616,000 22.8 7,094,000 100.0
1991 4,516,000 67.2 712,000 10.6 1,490,000 22.2 6,718,000 100.01992 4,671,000 71.6 508,000 7.8 1,344,000 20.6 6,523,000 100.01993 4,986,000 75.0 451,000 6.8 1,209,000 18.2 6,646,000 100.0
1994 5,534,000 77.7 392,000 5.5 1,198,000 16.8 7,124,000 100.01995 5,914,000 79.3 356,000 4.8 1,184,000 15.9 7,454,000 100.01996 5,960,000 79.2 328,000 4.4 1,241,000 16.5 7,529,000 100.0
1997 5,841,000 78.9 311,000 4.2 1,255,000 16.9 7,406,000 100.01998 5,720,000 79.6 268,000 3.7 1,199,000 16.7 7,187,000 100.01999 5,637,000 81.3 236,000 3.4 1,058,000 15.3 6,932,000 100.0
2000 5,846,000 82.7 173,000 2.4 1,050,000 14.9 7,069,000 100.02001 5,897,000 83.6 161,000 2.3 1,000,000 14.2 7,058,000 100.02002 6,093,000 84.9 157,000 2.2 923,000 12.9 7,173,000 100.0
2003 6,042,000 84.7 135,000 1.9 960,000 13.4 7,137,000 100.02004 6,106,000 86.2 106,000 1.5 870,000 12.3 7,083,000 100.02005 6,087,000 86.1 104,000 1.5 880,000 12.4 7,071,000 100.0
Note: Restraint use is determined by police and may be overreported for survivors.
Table 21
Drivers of Passenger Cars and Light Trucks in Crashes by Crash Severityand Restraint Use, 1975-2005
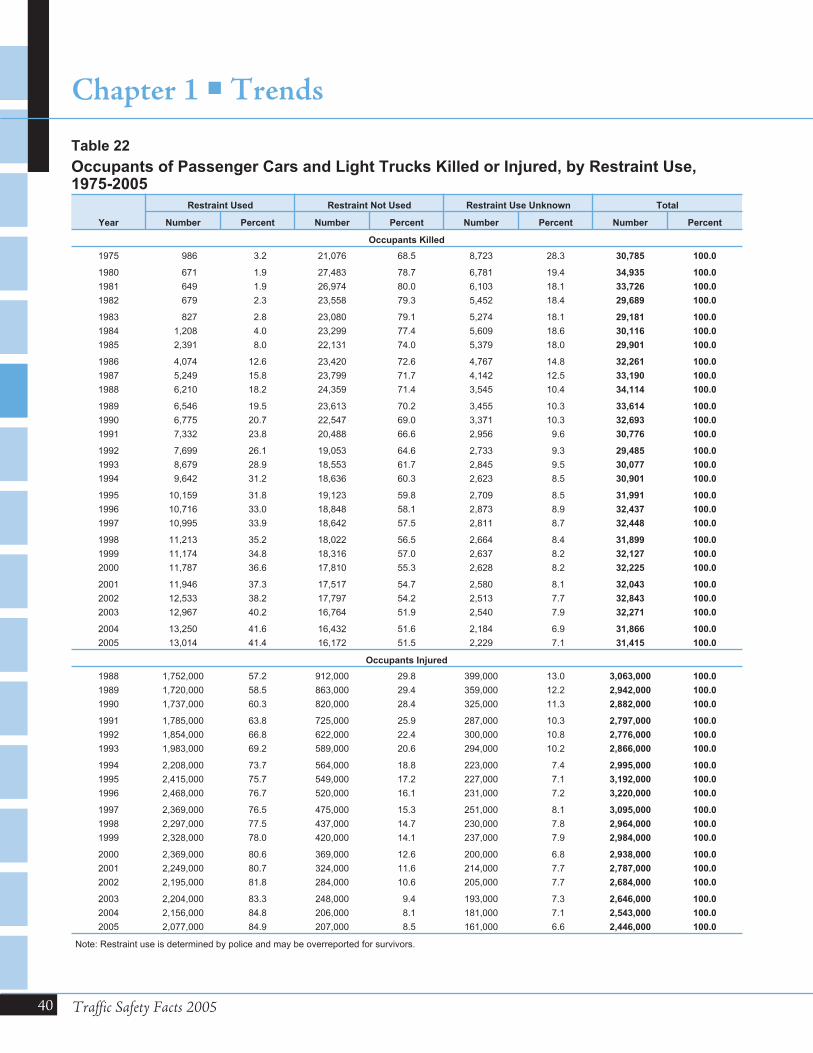
40 Traffic Safety Facts 2005
Chapter 1 �Trends
Year
Restraint Used Restraint Not Used Restraint Use Unknown Total
Number Percent Number Percent Number Percent Number Percent
Occupants Killed
1975 986 3.2 21,076 68.5 8,723 28.3 30,785 100.0
1980 671 1.9 27,483 78.7 6,781 19.4 34,935 100.0
1981 649 1.9 26,974 80.0 6,103 18.1 33,726 100.0
1982 679 2.3 23,558 79.3 5,452 18.4 29,689 100.0
1983 827 2.8 23,080 79.1 5,274 18.1 29,181 100.0
1984 1,208 4.0 23,299 77.4 5,609 18.6 30,116 100.0
1985 2,391 8.0 22,131 74.0 5,379 18.0 29,901 100.0
1986 4,074 12.6 23,420 72.6 4,767 14.8 32,261 100.0
1987 5,249 15.8 23,799 71.7 4,142 12.5 33,190 100.0
1988 6,210 18.2 24,359 71.4 3,545 10.4 34,114 100.0
1989 6,546 19.5 23,613 70.2 3,455 10.3 33,614 100.0
1990 6,775 20.7 22,547 69.0 3,371 10.3 32,693 100.0
1991 7,332 23.8 20,488 66.6 2,956 9.6 30,776 100.0
1992 7,699 26.1 19,053 64.6 2,733 9.3 29,485 100.0
1993 8,679 28.9 18,553 61.7 2,845 9.5 30,077 100.0
1994 9,642 31.2 18,636 60.3 2,623 8.5 30,901 100.0
1995 10,159 31.8 19,123 59.8 2,709 8.5 31,991 100.0
1996 10,716 33.0 18,848 58.1 2,873 8.9 32,437 100.0
1997 10,995 33.9 18,642 57.5 2,811 8.7 32,448 100.0
1998 11,213 35.2 18,022 56.5 2,664 8.4 31,899 100.0
1999 11,174 34.8 18,316 57.0 2,637 8.2 32,127 100.0
2000 11,787 36.6 17,810 55.3 2,628 8.2 32,225 100.0
2001 11,946 37.3 17,517 54.7 2,580 8.1 32,043 100.0
2002 12,533 38.2 17,797 54.2 2,513 7.7 32,843 100.0
2003 12,967 40.2 16,764 51.9 2,540 7.9 32,271 100.0
2004 13,250 41.6 16,432 51.6 2,184 6.9 31,866 100.0
2005 13,014 41.4 16,172 51.5 2,229 7.1 31,415 100.0
Occupants Injured
1988 1,752,000 57.2 912,000 29.8 399,000 13.0 3,063,000 100.0
1989 1,720,000 58.5 863,000 29.4 359,000 12.2 2,942,000 100.0
1990 1,737,000 60.3 820,000 28.4 325,000 11.3 2,882,000 100.0
1991 1,785,000 63.8 725,000 25.9 287,000 10.3 2,797,000 100.0
1992 1,854,000 66.8 622,000 22.4 300,000 10.8 2,776,000 100.0
1993 1,983,000 69.2 589,000 20.6 294,000 10.2 2,866,000 100.0
1994 2,208,000 73.7 564,000 18.8 223,000 7.4 2,995,000 100.0
1995 2,415,000 75.7 549,000 17.2 227,000 7.1 3,192,000 100.0
1996 2,468,000 76.7 520,000 16.1 231,000 7.2 3,220,000 100.0
1997 2,369,000 76.5 475,000 15.3 251,000 8.1 3,095,000 100.0
1998 2,297,000 77.5 437,000 14.7 230,000 7.8 2,964,000 100.0
1999 2,328,000 78.0 420,000 14.1 237,000 7.9 2,984,000 100.0
2000 2,369,000 80.6 369,000 12.6 200,000 6.8 2,938,000 100.0
2001 2,249,000 80.7 324,000 11.6 214,000 7.7 2,787,000 100.0
2002 2,195,000 81.8 284,000 10.6 205,000 7.7 2,684,000 100.0
2003 2,204,000 83.3 248,000 9.4 193,000 7.3 2,646,000 100.0
2004 2,156,000 84.8 206,000 8.1 181,000 7.1 2,543,000 100.0
2005 2,077,000 84.9 207,000 8.5 161,000 6.6 2,446,000 100.0
Note: Restraint use is determined by police and may be overreported for survivors.
Table 22
Occupants of Passenger Cars and Light Trucks Killed or Injured, by Restraint Use,1975-2005

Chapter 2
CRASHES

This chapter presents statistics about police-reported motor vehicle crashes according to the most severe injuryin the crash: Fatal, Nonfatal Injury (Injury), and Property Damage. The tables and figures are presented in fourgroups: Time, Location, Circumstances, and Alcohol. Below are some of the crash statistics you will find in thissection:
O More than 6.1 million police-reported motor vehicle crashes occurred in the United States in 2005. Almostone-third of these crashes resulted in an injury, with less than 1 percent of total crashes (39,189) resulting in adeath.
O Midnight to 3 a.m. on Saturdays and Sundays proved to be the deadliest 3-hour periods throughout 2005, with1,320 and 1,275 fatal crashes, respectively.
O Fifty-eight percent of fatal crashes involved only one vehicle, compared to 31 percent of injury crashes and31 percent of property-damage-only crashes.
O More than half of fatal crashes occurred on roads with posted speed limits of 55 mph or more, while only23 percent of property-damage-only crashes occurred on these roads.
O Collision with another motor vehicle in transport was the most common first harmful event for fatal, injury, andproperty-damage-only crashes. Collisions with fixed objects and noncollisions accounted for only 19 percent ofall crashes, but they accounted for 44 percent of fatal crashes.
O Thirty-nine percent of fatal crashes involved alcohol. For fatal crashes occurring from midnight to 3 a.m.,75 percent involved alcohol.
2005 Motor Vehicle Crash Data from FARS and GES
CHAPTER 2 � CRASHES
43
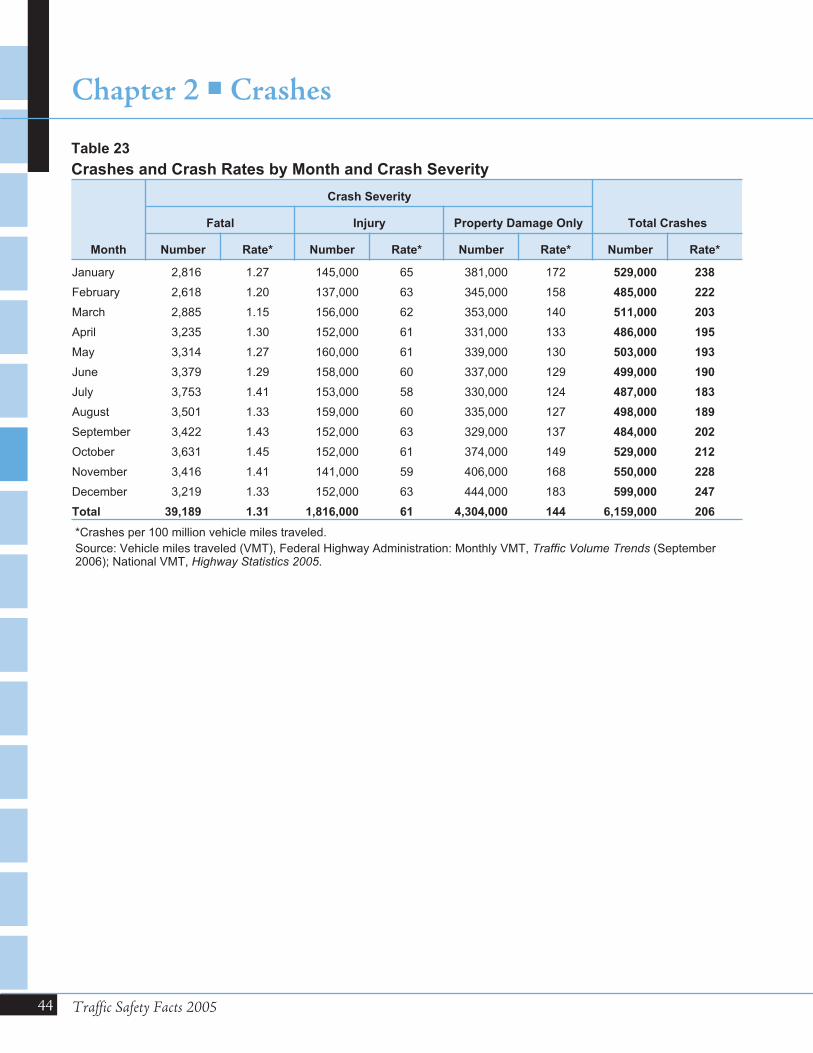
44 Traffic Safety Facts 2005
Chapter 2 � Crashes
Month
Crash Severity
Total CrashesFatal Injury Property Damage Only
Number Rate* Number Rate* Number Rate* Number Rate*
January 2,816 1.27 145,000 65 381,000 172 529,000 238
February 2,618 1.20 137,000 63 345,000 158 485,000 222
March 2,885 1.15 156,000 62 353,000 140 511,000 203
April 3,235 1.30 152,000 61 331,000 133 486,000 195
May 3,314 1.27 160,000 61 339,000 130 503,000 193
June 3,379 1.29 158,000 60 337,000 129 499,000 190
July 3,753 1.41 153,000 58 330,000 124 487,000 183
August 3,501 1.33 159,000 60 335,000 127 498,000 189
September 3,422 1.43 152,000 63 329,000 137 484,000 202
October 3,631 1.45 152,000 61 374,000 149 529,000 212
November 3,416 1.41 141,000 59 406,000 168 550,000 228
December 3,219 1.33 152,000 63 444,000 183 599,000 247
Total 39,189 1.31 1,816,000 61 4,304,000 144 6,159,000 206
*Crashes per 100 million vehicle miles traveled.
Source: Vehicle miles traveled (VMT), Federal Highway Administration: Monthly VMT, Traffic Volume Trends (September2006); National VMT, Highway Statistics 2005.
Table 23
Crashes and Crash Rates by Month and Crash Severity
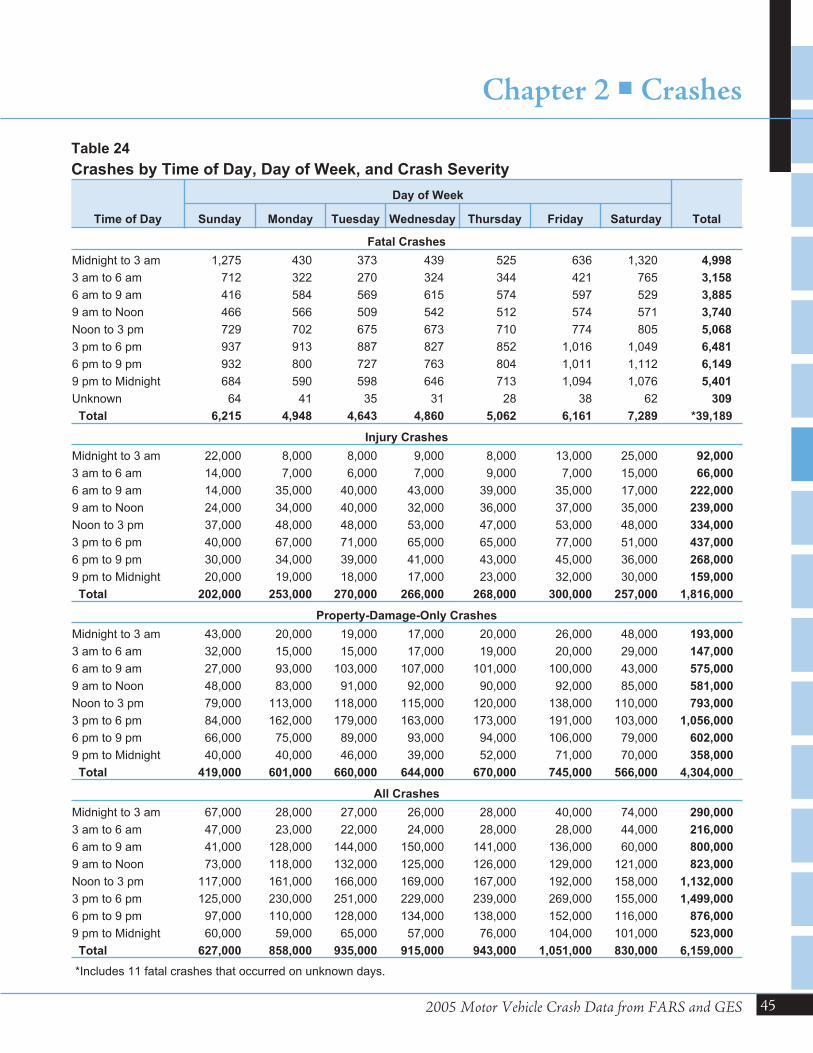
2005 Motor Vehicle Crash Data from FARS and GES
Chapter 2 � Crashes
45
Time of Day
Day of Week
TotalSunday Monday Tuesday Wednesday Thursday Friday Saturday
Fatal Crashes
Midnight to 3 am 1,275 430 373 439 525 636 1,320 4,998
3 am to 6 am 712 322 270 324 344 421 765 3,158
6 am to 9 am 416 584 569 615 574 597 529 3,885
9 am to Noon 466 566 509 542 512 574 571 3,740
Noon to 3 pm 729 702 675 673 710 774 805 5,068
3 pm to 6 pm 937 913 887 827 852 1,016 1,049 6,481
6 pm to 9 pm 932 800 727 763 804 1,011 1,112 6,149
9 pm to Midnight 684 590 598 646 713 1,094 1,076 5,401
Unknown 64 41 35 31 28 38 62 309
Total 6,215 4,948 4,643 4,860 5,062 6,161 7,289 *39,189
Injury Crashes
Midnight to 3 am 22,000 8,000 8,000 9,000 8,000 13,000 25,000 92,000
3 am to 6 am 14,000 7,000 6,000 7,000 9,000 7,000 15,000 66,000
6 am to 9 am 14,000 35,000 40,000 43,000 39,000 35,000 17,000 222,000
9 am to Noon 24,000 34,000 40,000 32,000 36,000 37,000 35,000 239,000
Noon to 3 pm 37,000 48,000 48,000 53,000 47,000 53,000 48,000 334,000
3 pm to 6 pm 40,000 67,000 71,000 65,000 65,000 77,000 51,000 437,000
6 pm to 9 pm 30,000 34,000 39,000 41,000 43,000 45,000 36,000 268,000
9 pm to Midnight 20,000 19,000 18,000 17,000 23,000 32,000 30,000 159,000
Total 202,000 253,000 270,000 266,000 268,000 300,000 257,000 1,816,000
Property-Damage-Only Crashes
Midnight to 3 am 43,000 20,000 19,000 17,000 20,000 26,000 48,000 193,000
3 am to 6 am 32,000 15,000 15,000 17,000 19,000 20,000 29,000 147,000
6 am to 9 am 27,000 93,000 103,000 107,000 101,000 100,000 43,000 575,000
9 am to Noon 48,000 83,000 91,000 92,000 90,000 92,000 85,000 581,000
Noon to 3 pm 79,000 113,000 118,000 115,000 120,000 138,000 110,000 793,000
3 pm to 6 pm 84,000 162,000 179,000 163,000 173,000 191,000 103,000 1,056,000
6 pm to 9 pm 66,000 75,000 89,000 93,000 94,000 106,000 79,000 602,000
9 pm to Midnight 40,000 40,000 46,000 39,000 52,000 71,000 70,000 358,000
Total 419,000 601,000 660,000 644,000 670,000 745,000 566,000 4,304,000
All Crashes
Midnight to 3 am 67,000 28,000 27,000 26,000 28,000 40,000 74,000 290,000
3 am to 6 am 47,000 23,000 22,000 24,000 28,000 28,000 44,000 216,000
6 am to 9 am 41,000 128,000 144,000 150,000 141,000 136,000 60,000 800,000
9 am to Noon 73,000 118,000 132,000 125,000 126,000 129,000 121,000 823,000
Noon to 3 pm 117,000 161,000 166,000 169,000 167,000 192,000 158,000 1,132,000
3 pm to 6 pm 125,000 230,000 251,000 229,000 239,000 269,000 155,000 1,499,000
6 pm to 9 pm 97,000 110,000 128,000 134,000 138,000 152,000 116,000 876,000
9 pm to Midnight 60,000 59,000 65,000 57,000 76,000 104,000 101,000 523,000
Total 627,000 858,000 935,000 915,000 943,000 1,051,000 830,000 6,159,000
*Includes 11 fatal crashes that occurred on unknown days.
Table 24
Crashes by Time of Day, Day of Week, and Crash Severity
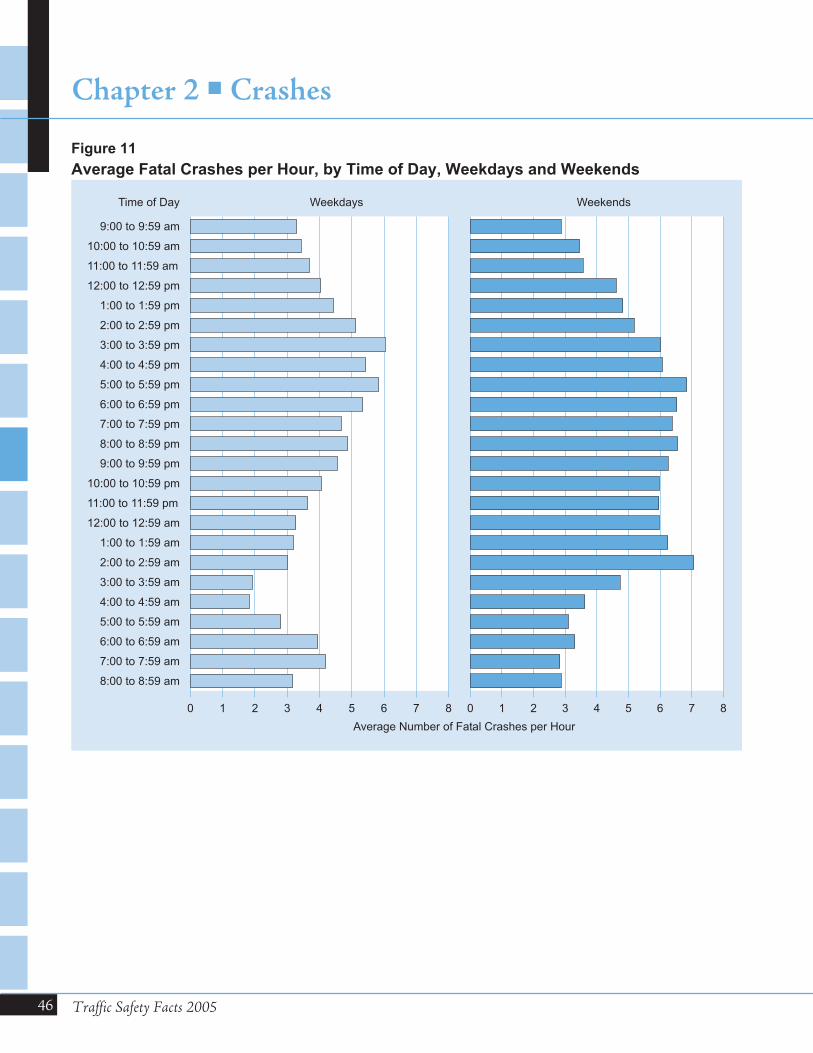
46 Traffic Safety Facts 2005
Chapter 2 � Crashes
9:00 to 9:59 am
10:00 to 10:59 am
11:00 to 11:59 am
12:00 to 12:59 pm
1:00 to 1:59 pm
2:00 to 2:59 pm
3:00 to 3:59 pm
4:00 to 4:59 pm
5:00 to 5:59 pm
6:00 to 6:59 pm
7:00 to 7:59 pm
8:00 to 8:59 pm
9:00 to 9:59 pm
10:00 to 10:59 pm
11:00 to 11:59 pm
12:00 to 12:59 am
1:00 to 1:59 am
2:00 to 2:59 am
3:00 to 3:59 am
4:00 to 4:59 am
5:00 to 5:59 am
6:00 to 6:59 am
7:00 to 7:59 am
8:00 to 8:59 am
0 1 2 3 4 5 6 7 8 0 1 2 3 4 5 6 7 8
Average Number of Fatal Crashes per Hour
Weekdays WeekendsTime of Day
Figure 11
Average Fatal Crashes per Hour, by Time of Day, Weekdays and Weekends
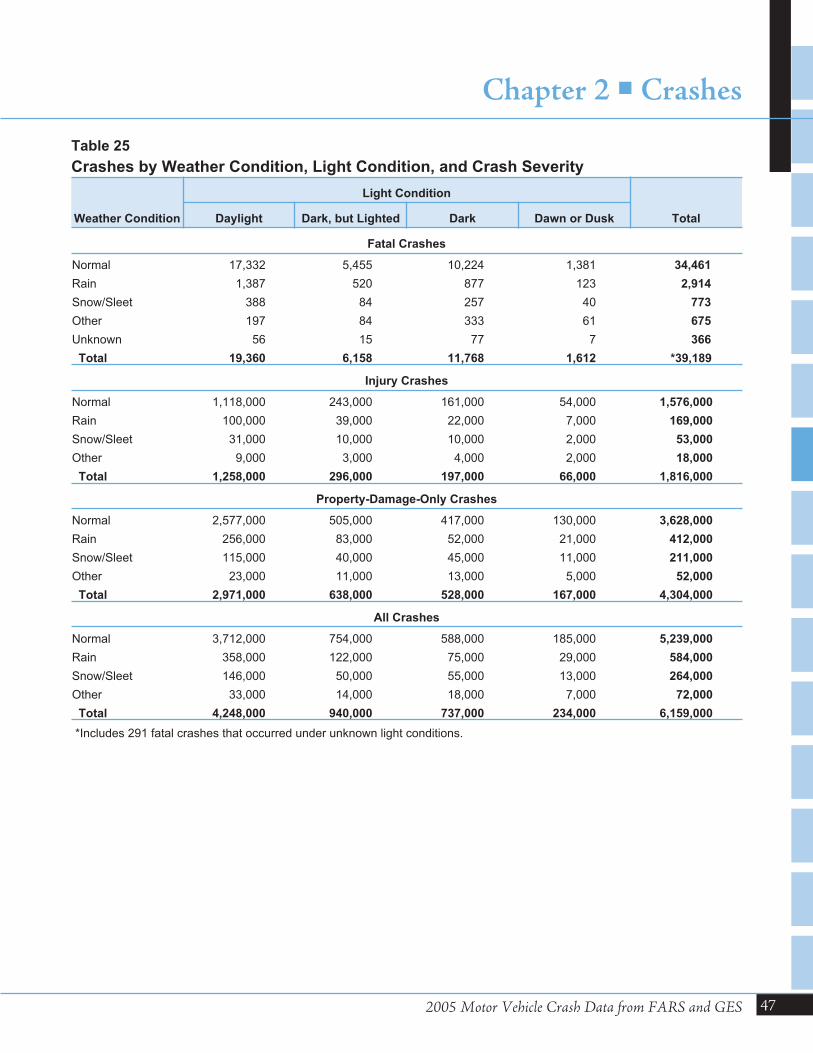
2005 Motor Vehicle Crash Data from FARS and GES
Chapter 2 � Crashes
47
Weather Condition
Light Condition
TotalDaylight Dark, but Lighted Dark Dawn or Dusk
Fatal Crashes
Normal 17,332 5,455 10,224 1,381 34,461
Rain 1,387 520 877 123 2,914
Snow/Sleet 388 84 257 40 773
Other 197 84 333 61 675
Unknown 56 15 77 7 366
Total 19,360 6,158 11,768 1,612 *39,189
Injury Crashes
Normal 1,118,000 243,000 161,000 54,000 1,576,000
Rain 100,000 39,000 22,000 7,000 169,000
Snow/Sleet 31,000 10,000 10,000 2,000 53,000
Other 9,000 3,000 4,000 2,000 18,000
Total 1,258,000 296,000 197,000 66,000 1,816,000
Property-Damage-Only Crashes
Normal 2,577,000 505,000 417,000 130,000 3,628,000
Rain 256,000 83,000 52,000 21,000 412,000
Snow/Sleet 115,000 40,000 45,000 11,000 211,000
Other 23,000 11,000 13,000 5,000 52,000
Total 2,971,000 638,000 528,000 167,000 4,304,000
All Crashes
Normal 3,712,000 754,000 588,000 185,000 5,239,000
Rain 358,000 122,000 75,000 29,000 584,000
Snow/Sleet 146,000 50,000 55,000 13,000 264,000
Other 33,000 14,000 18,000 7,000 72,000
Total 4,248,000 940,000 737,000 234,000 6,159,000
*Includes 291 fatal crashes that occurred under unknown light conditions.
Table 25
Crashes by Weather Condition, Light Condition, and Crash Severity

48 Traffic Safety Facts 2005
Chapter 2 � Crashes
Response
Time
(Minutes)
Time of Crash
to EMS Notification
EMS Notification
to EMS Arrival
EMS Arrival at Scene
to Hospital Arrival
Time of Crash
to Hospital Arrival
Number Percent Number Percent Number Percent Number Percent
Rural Fatal Crashes
0 to 10 10,009 84.5 6,620 54.6 150 2.6 23 0.4
11 to 20 1,210 10.2 4,073 33.6 929 16.3 166 3.0
21 to 30 316 2.7 1,035 8.5 1,384 24.3 564 10.2
31 to 40 125 1.1 246 2.0 1,180 20.7 945 17.1
41 to 50 60 0.5 89 0.7 799 14.0 1,042 18.9
51 to 60 35 0.3 24 0.2 498 8.7 895 16.2
61 to 120 88 0.7 29 0.2 766 13.4 1,891 34.2
Total* 11,843 100.0 12,116 100.0 5,706 100.0 5,526 100.0
Urban Fatal Crashes
0 to 10 7,668 93.5 6,826 85.9 226 6.2 38 1.0
11 to 20 344 4.2 918 11.5 1,084 29.6 446 12.3
21 to 30 102 1.2 134 1.7 1,194 32.6 1,007 27.8
31 to 40 21 0.3 41 0.5 580 15.9 893 24.6
41 to 50 13 0.2 16 0.2 270 7.4 565 15.6
51 to 60 16 0.2 3 ** 146 4.0 315 8.7
61 to 120 33 0.4 13 0.2 157 4.3 363 10.0
Total* 8,197 100.0 7,951 100.0 3,657 100.0 3,627 100.0
*Includes crashes for which both times were known.
**Less than 0.05 percent.
Table 26
Fatal Crashes by Emergency Medical Services (EMS) Response TimesWithin Designated Minutes and by Land Use
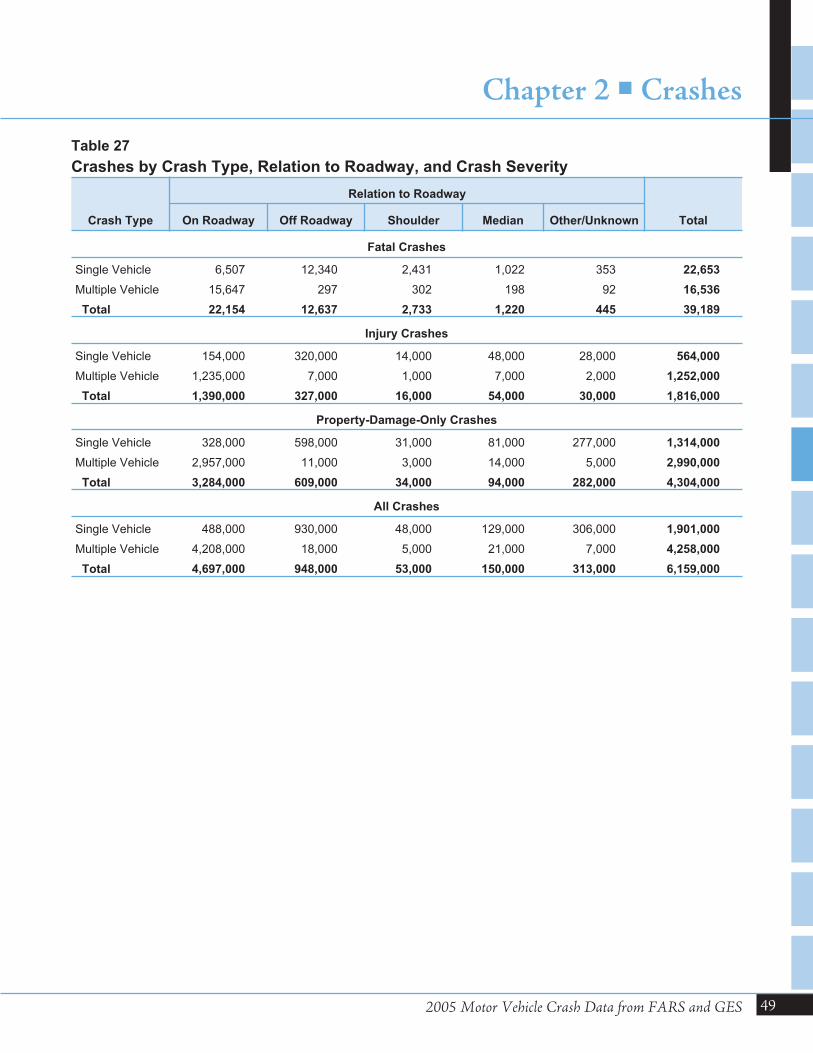
2005 Motor Vehicle Crash Data from FARS and GES
Chapter 2 � Crashes
49
Crash Type
Relation to Roadway
TotalOn Roadway Off Roadway Shoulder Median Other/Unknown
Fatal Crashes
Single Vehicle 6,507 12,340 2,431 1,022 353 22,653
Multiple Vehicle 15,647 297 302 198 92 16,536
Total 22,154 12,637 2,733 1,220 445 39,189
Injury Crashes
Single Vehicle 154,000 320,000 14,000 48,000 28,000 564,000
Multiple Vehicle 1,235,000 7,000 1,000 7,000 2,000 1,252,000
Total 1,390,000 327,000 16,000 54,000 30,000 1,816,000
Property-Damage-Only Crashes
Single Vehicle 328,000 598,000 31,000 81,000 277,000 1,314,000
Multiple Vehicle 2,957,000 11,000 3,000 14,000 5,000 2,990,000
Total 3,284,000 609,000 34,000 94,000 282,000 4,304,000
All Crashes
Single Vehicle 488,000 930,000 48,000 129,000 306,000 1,901,000
Multiple Vehicle 4,208,000 18,000 5,000 21,000 7,000 4,258,000
Total 4,697,000 948,000 53,000 150,000 313,000 6,159,000
Table 27
Crashes by Crash Type, Relation to Roadway, and Crash Severity
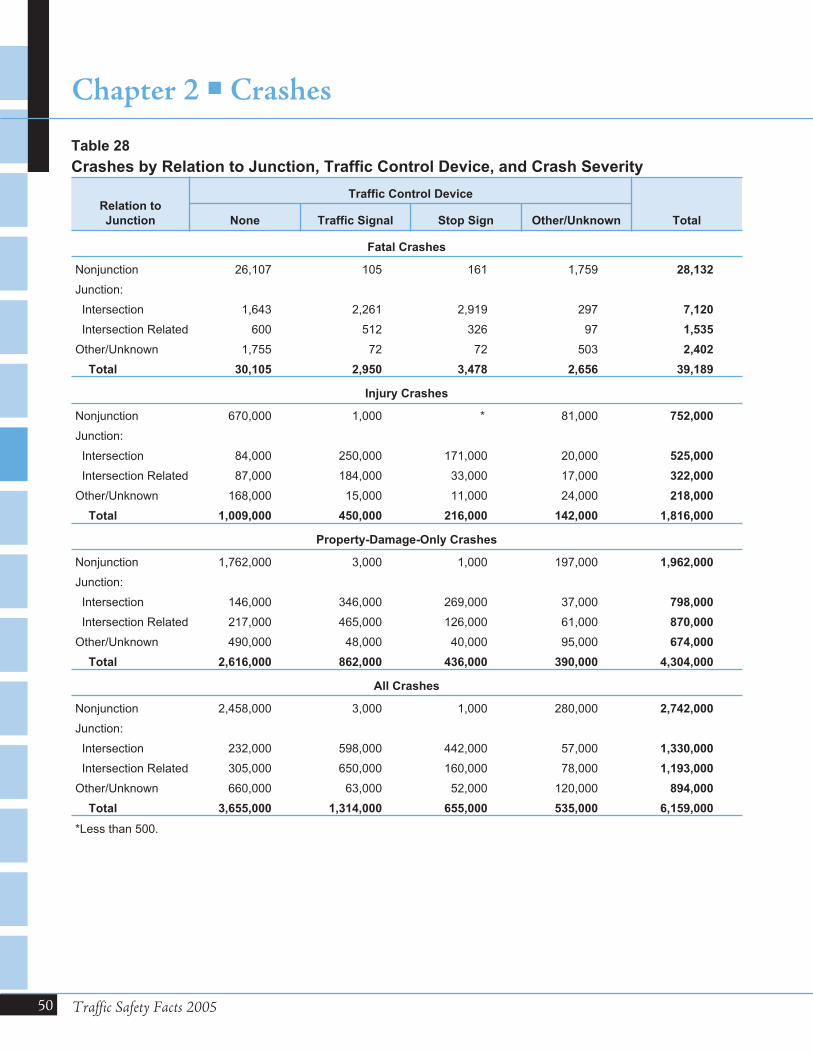
50 Traffic Safety Facts 2005
Chapter 2 � Crashes
Relation to
Junction
Traffic Control Device
TotalNone Traffic Signal Stop Sign Other/Unknown
Fatal Crashes
Nonjunction 26,107 105 161 1,759 28,132
Junction:
Intersection 1,643 2,261 2,919 297 7,120
Intersection Related 600 512 326 97 1,535
Other/Unknown 1,755 72 72 503 2,402
Total 30,105 2,950 3,478 2,656 39,189
Injury Crashes
Nonjunction 670,000 1,000 * 81,000 752,000
Junction:
Intersection 84,000 250,000 171,000 20,000 525,000
Intersection Related 87,000 184,000 33,000 17,000 322,000
Other/Unknown 168,000 15,000 11,000 24,000 218,000
Total 1,009,000 450,000 216,000 142,000 1,816,000
Property-Damage-Only Crashes
Nonjunction 1,762,000 3,000 1,000 197,000 1,962,000
Junction:
Intersection 146,000 346,000 269,000 37,000 798,000
Intersection Related 217,000 465,000 126,000 61,000 870,000
Other/Unknown 490,000 48,000 40,000 95,000 674,000
Total 2,616,000 862,000 436,000 390,000 4,304,000
All Crashes
Nonjunction 2,458,000 3,000 1,000 280,000 2,742,000
Junction:
Intersection 232,000 598,000 442,000 57,000 1,330,000
Intersection Related 305,000 650,000 160,000 78,000 1,193,000
Other/Unknown 660,000 63,000 52,000 120,000 894,000
Total 3,655,000 1,314,000 655,000 535,000 6,159,000
*Less than 500.
Table 28
Crashes by Relation to Junction, Traffic Control Device, and Crash Severity
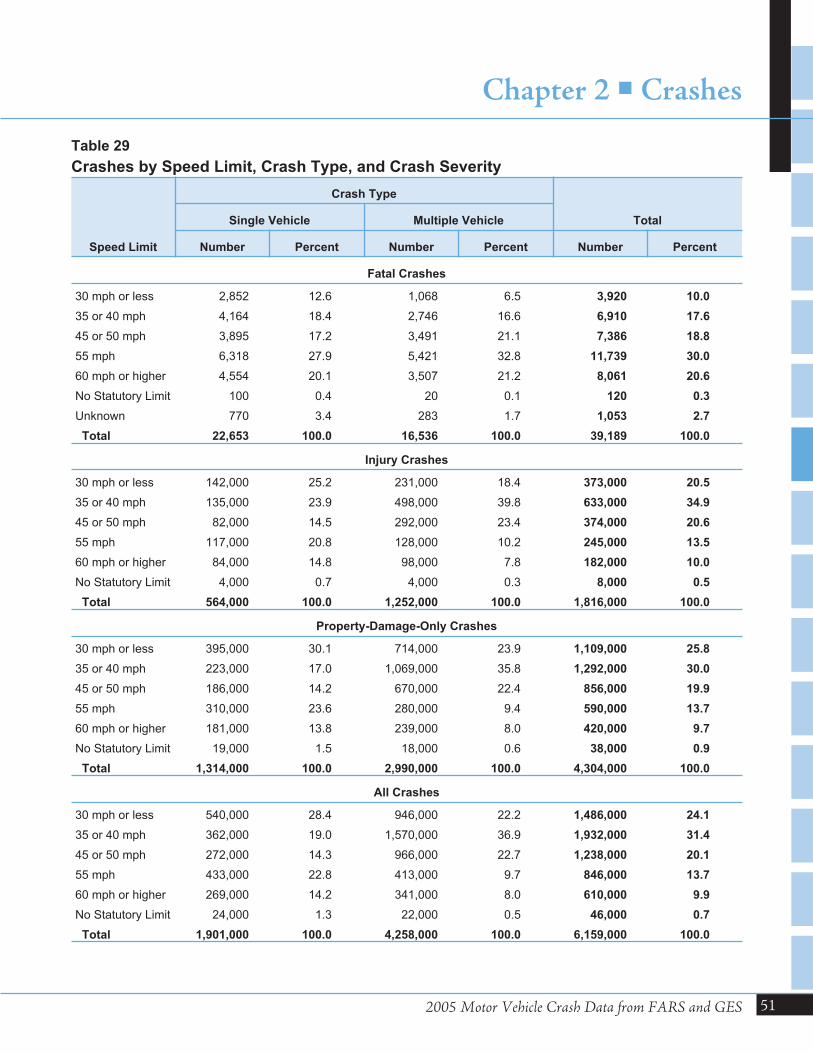
2005 Motor Vehicle Crash Data from FARS and GES
Chapter 2 � Crashes
51
Speed Limit
Crash Type
TotalSingle Vehicle Multiple Vehicle
Number Percent Number Percent Number Percent
Fatal Crashes
30 mph or less 2,852 12.6 1,068 6.5 3,920 10.0
35 or 40 mph 4,164 18.4 2,746 16.6 6,910 17.6
45 or 50 mph 3,895 17.2 3,491 21.1 7,386 18.8
55 mph 6,318 27.9 5,421 32.8 11,739 30.0
60 mph or higher 4,554 20.1 3,507 21.2 8,061 20.6
No Statutory Limit 100 0.4 20 0.1 120 0.3
Unknown 770 3.4 283 1.7 1,053 2.7
Total 22,653 100.0 16,536 100.0 39,189 100.0
Injury Crashes
30 mph or less 142,000 25.2 231,000 18.4 373,000 20.5
35 or 40 mph 135,000 23.9 498,000 39.8 633,000 34.9
45 or 50 mph 82,000 14.5 292,000 23.4 374,000 20.6
55 mph 117,000 20.8 128,000 10.2 245,000 13.5
60 mph or higher 84,000 14.8 98,000 7.8 182,000 10.0
No Statutory Limit 4,000 0.7 4,000 0.3 8,000 0.5
Total 564,000 100.0 1,252,000 100.0 1,816,000 100.0
Property-Damage-Only Crashes
30 mph or less 395,000 30.1 714,000 23.9 1,109,000 25.8
35 or 40 mph 223,000 17.0 1,069,000 35.8 1,292,000 30.0
45 or 50 mph 186,000 14.2 670,000 22.4 856,000 19.9
55 mph 310,000 23.6 280,000 9.4 590,000 13.7
60 mph or higher 181,000 13.8 239,000 8.0 420,000 9.7
No Statutory Limit 19,000 1.5 18,000 0.6 38,000 0.9
Total 1,314,000 100.0 2,990,000 100.0 4,304,000 100.0
All Crashes
30 mph or less 540,000 28.4 946,000 22.2 1,486,000 24.1
35 or 40 mph 362,000 19.0 1,570,000 36.9 1,932,000 31.4
45 or 50 mph 272,000 14.3 966,000 22.7 1,238,000 20.1
55 mph 433,000 22.8 413,000 9.7 846,000 13.7
60 mph or higher 269,000 14.2 341,000 8.0 610,000 9.9
No Statutory Limit 24,000 1.3 22,000 0.5 46,000 0.7
Total 1,901,000 100.0 4,258,000 100.0 6,159,000 100.0
Table 29
Crashes by Speed Limit, Crash Type, and Crash Severity
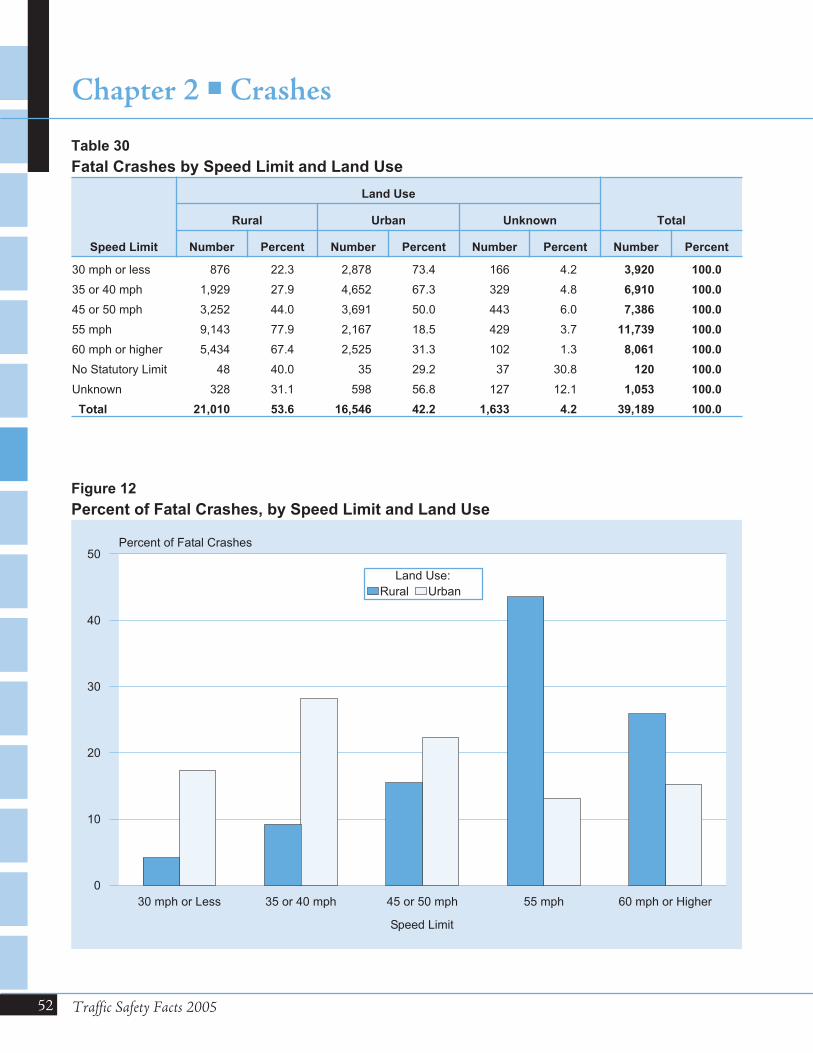
52 Traffic Safety Facts 2005
Chapter 2 � Crashes
30 mph or Less 35 or 40 mph 45 or 50 mph 55 mph 60 mph or Higher
Speed Limit
0
10
20
30
40
50Percent of Fatal Crashes
Land Use:
Rural Urban
Figure 12
Percent of Fatal Crashes, by Speed Limit and Land Use
Speed Limit
Land Use
TotalRural Urban Unknown
Number Percent Number Percent Number Percent Number Percent
30 mph or less 876 22.3 2,878 73.4 166 4.2 3,920 100.0
35 or 40 mph 1,929 27.9 4,652 67.3 329 4.8 6,910 100.0
45 or 50 mph 3,252 44.0 3,691 50.0 443 6.0 7,386 100.0
55 mph 9,143 77.9 2,167 18.5 429 3.7 11,739 100.0
60 mph or higher 5,434 67.4 2,525 31.3 102 1.3 8,061 100.0
No Statutory Limit 48 40.0 35 29.2 37 30.8 120 100.0
Unknown 328 31.1 598 56.8 127 12.1 1,053 100.0
Total 21,010 53.6 16,546 42.2 1,633 4.2 39,189 100.0
Table 30
Fatal Crashes by Speed Limit and Land Use
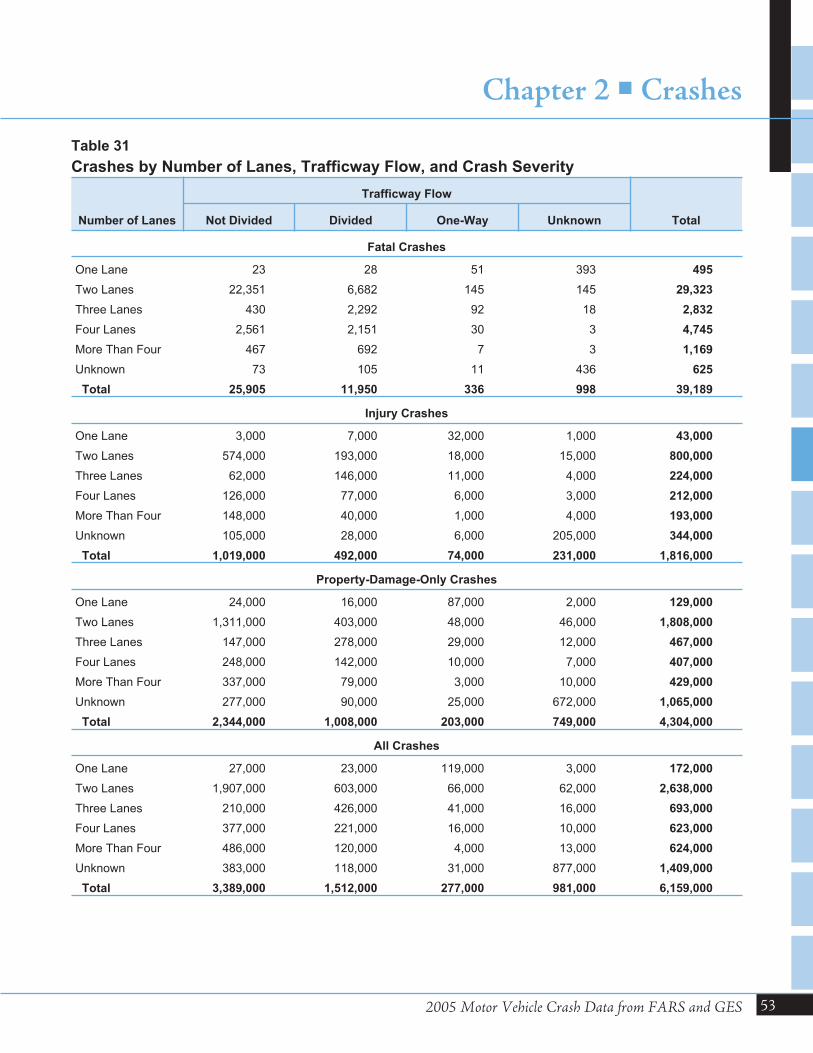
2005 Motor Vehicle Crash Data from FARS and GES
Chapter 2 � Crashes
53
Number of Lanes
Trafficway Flow
TotalNot Divided Divided One-Way Unknown
Fatal Crashes
One Lane 23 28 51 393 495
Two Lanes 22,351 6,682 145 145 29,323
Three Lanes 430 2,292 92 18 2,832
Four Lanes 2,561 2,151 30 3 4,745
More Than Four 467 692 7 3 1,169
Unknown 73 105 11 436 625
Total 25,905 11,950 336 998 39,189
Injury Crashes
One Lane 3,000 7,000 32,000 1,000 43,000
Two Lanes 574,000 193,000 18,000 15,000 800,000
Three Lanes 62,000 146,000 11,000 4,000 224,000
Four Lanes 126,000 77,000 6,000 3,000 212,000
More Than Four 148,000 40,000 1,000 4,000 193,000
Unknown 105,000 28,000 6,000 205,000 344,000
Total 1,019,000 492,000 74,000 231,000 1,816,000
Property-Damage-Only Crashes
One Lane 24,000 16,000 87,000 2,000 129,000
Two Lanes 1,311,000 403,000 48,000 46,000 1,808,000
Three Lanes 147,000 278,000 29,000 12,000 467,000
Four Lanes 248,000 142,000 10,000 7,000 407,000
More Than Four 337,000 79,000 3,000 10,000 429,000
Unknown 277,000 90,000 25,000 672,000 1,065,000
Total 2,344,000 1,008,000 203,000 749,000 4,304,000
All Crashes
One Lane 27,000 23,000 119,000 3,000 172,000
Two Lanes 1,907,000 603,000 66,000 62,000 2,638,000
Three Lanes 210,000 426,000 41,000 16,000 693,000
Four Lanes 377,000 221,000 16,000 10,000 623,000
More Than Four 486,000 120,000 4,000 13,000 624,000
Unknown 383,000 118,000 31,000 877,000 1,409,000
Total 3,389,000 1,512,000 277,000 981,000 6,159,000
Table 31
Crashes by Number of Lanes, Trafficway Flow, and Crash Severity
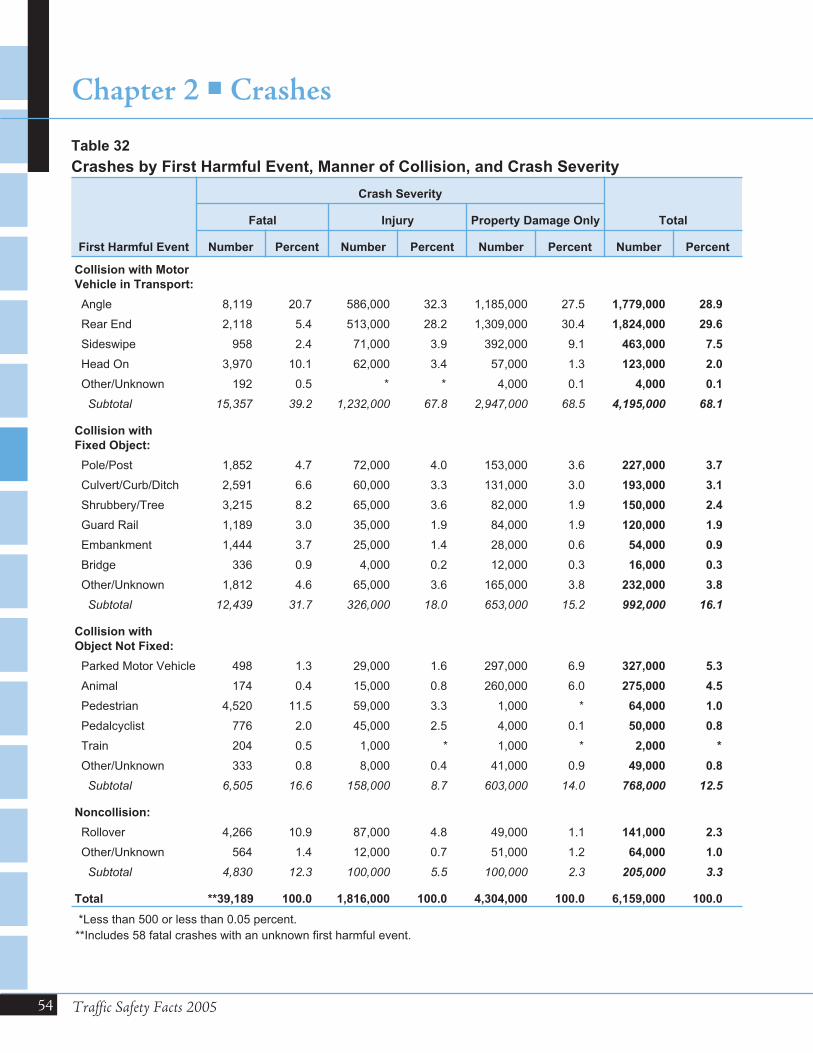
54 Traffic Safety Facts 2005
Chapter 2 � Crashes
First Harmful Event
Crash Severity
TotalFatal Injury Property Damage Only
Number Percent Number Percent Number Percent Number Percent
Collision with Motor
Vehicle in Transport:
Angle 8,119 20.7 586,000 32.3 1,185,000 27.5 1,779,000 28.9
Rear End 2,118 5.4 513,000 28.2 1,309,000 30.4 1,824,000 29.6
Sideswipe 958 2.4 71,000 3.9 392,000 9.1 463,000 7.5
Head On 3,970 10.1 62,000 3.4 57,000 1.3 123,000 2.0
Other/Unknown 192 0.5 * * 4,000 0.1 4,000 0.1
Subtotal 15,357 39.2 1,232,000 67.8 2,947,000 68.5 4,195,000 68.1
Collision with
Fixed Object:
Pole/Post 1,852 4.7 72,000 4.0 153,000 3.6 227,000 3.7
Culvert/Curb/Ditch 2,591 6.6 60,000 3.3 131,000 3.0 193,000 3.1
Shrubbery/Tree 3,215 8.2 65,000 3.6 82,000 1.9 150,000 2.4
Guard Rail 1,189 3.0 35,000 1.9 84,000 1.9 120,000 1.9
Embankment 1,444 3.7 25,000 1.4 28,000 0.6 54,000 0.9
Bridge 336 0.9 4,000 0.2 12,000 0.3 16,000 0.3
Other/Unknown 1,812 4.6 65,000 3.6 165,000 3.8 232,000 3.8
Subtotal 12,439 31.7 326,000 18.0 653,000 15.2 992,000 16.1
Collision with
Object Not Fixed:
Parked Motor Vehicle 498 1.3 29,000 1.6 297,000 6.9 327,000 5.3
Animal 174 0.4 15,000 0.8 260,000 6.0 275,000 4.5
Pedestrian 4,520 11.5 59,000 3.3 1,000 * 64,000 1.0
Pedalcyclist 776 2.0 45,000 2.5 4,000 0.1 50,000 0.8
Train 204 0.5 1,000 * 1,000 * 2,000 *
Other/Unknown 333 0.8 8,000 0.4 41,000 0.9 49,000 0.8
Subtotal 6,505 16.6 158,000 8.7 603,000 14.0 768,000 12.5
Noncollision:
Rollover 4,266 10.9 87,000 4.8 49,000 1.1 141,000 2.3
Other/Unknown 564 1.4 12,000 0.7 51,000 1.2 64,000 1.0
Subtotal 4,830 12.3 100,000 5.5 100,000 2.3 205,000 3.3
Total **39,189 100.0 1,816,000 100.0 4,304,000 100.0 6,159,000 100.0
*Less than 500 or less than 0.05 percent.
**Includes 58 fatal crashes with an unknown first harmful event.
Table 32
Crashes by First Harmful Event, Manner of Collision, and Crash Severity
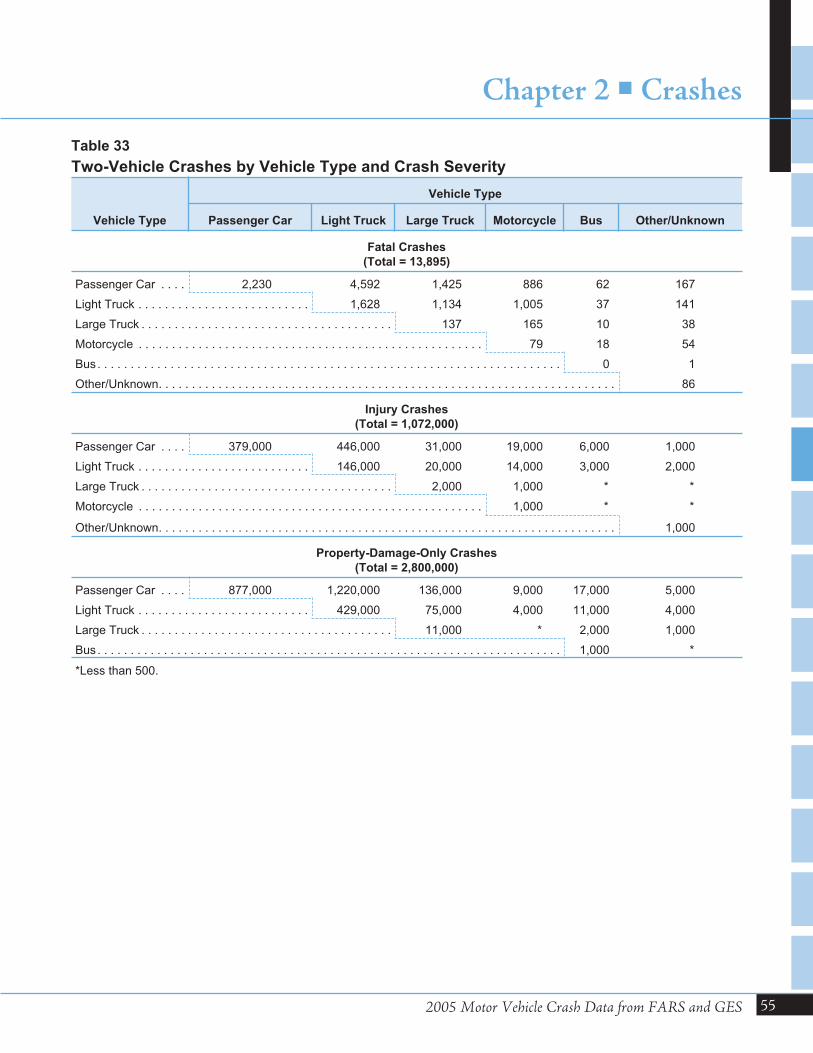
2005 Motor Vehicle Crash Data from FARS and GES
Chapter 2 � Crashes
55
Vehicle Type
Vehicle Type
Passenger Car Light Truck Large Truck Motorcycle Bus Other/Unknown
Fatal Crashes
(Total = 13,895)
Passenger Car . . . . 2,230 4,592 1,425 886 62 167
Light Truck . . . . . . . . . . . . . . . . . . . . . . . . . . 1,628 1,134 1,005 37 141
Large Truck . . . . . . . . . . . . . . . . . . . . . . . . . . . . . . . . . . . . . . 137 165 10 38
Motorcycle . . . . . . . . . . . . . . . . . . . . . . . . . . . . . . . . . . . . . . . . . . . . . . . . . . . . 79 18 54
Bus. . . . . . . . . . . . . . . . . . . . . . . . . . . . . . . . . . . . . . . . . . . . . . . . . . . . . . . . . . . . . . . . . . . . . . 0 1
Other/Unknown. . . . . . . . . . . . . . . . . . . . . . . . . . . . . . . . . . . . . . . . . . . . . . . . . . . . . . . . . . . . . . . . . . . . . 86
Injury Crashes
(Total = 1,072,000)
Passenger Car . . . . 379,000 446,000 31,000 19,000 6,000 1,000
Light Truck . . . . . . . . . . . . . . . . . . . . . . . . . . 146,000 20,000 14,000 3,000 2,000
Large Truck . . . . . . . . . . . . . . . . . . . . . . . . . . . . . . . . . . . . . . 2,000 1,000 * *
Motorcycle . . . . . . . . . . . . . . . . . . . . . . . . . . . . . . . . . . . . . . . . . . . . . . . . . . . . 1,000 * *
Other/Unknown. . . . . . . . . . . . . . . . . . . . . . . . . . . . . . . . . . . . . . . . . . . . . . . . . . . . . . . . . . . . . . . . . . . . . 1,000
Property-Damage-Only Crashes
(Total = 2,800,000)
Passenger Car . . . . 877,000 1,220,000 136,000 9,000 17,000 5,000
Light Truck . . . . . . . . . . . . . . . . . . . . . . . . . . 429,000 75,000 4,000 11,000 4,000
Large Truck . . . . . . . . . . . . . . . . . . . . . . . . . . . . . . . . . . . . . . 11,000 * 2,000 1,000
Bus. . . . . . . . . . . . . . . . . . . . . . . . . . . . . . . . . . . . . . . . . . . . . . . . . . . . . . . . . . . . . . . . . . . . . . 1,000 *
*Less than 500.
Table 33
Two-Vehicle Crashes by Vehicle Type and Crash Severity
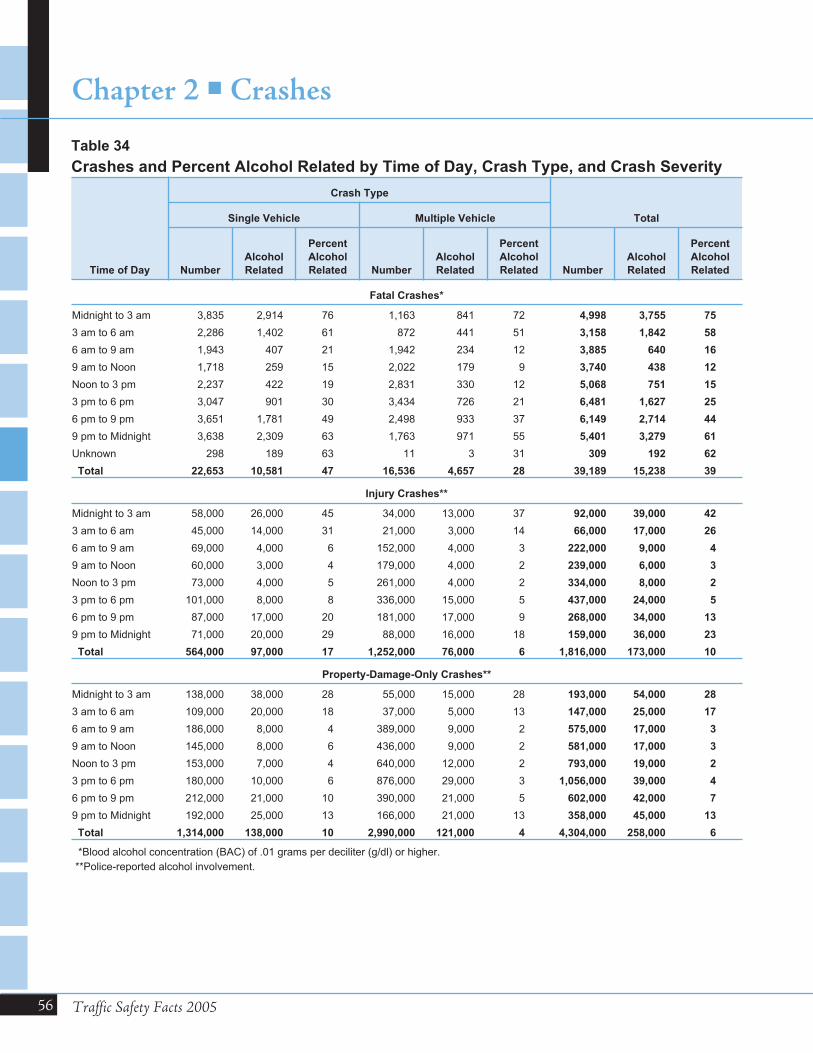
56 Traffic Safety Facts 2005
Chapter 2 � Crashes
Time of Day
Crash Type
TotalSingle Vehicle Multiple Vehicle
Number
Alcohol
Related
Percent
Alcohol
Related Number
Alcohol
Related
Percent
Alcohol
Related Number
Alcohol
Related
Percent
Alcohol
Related
Fatal Crashes*
Midnight to 3 am 3,835 2,914 76 1,163 841 72 4,998 3,755 75
3 am to 6 am 2,286 1,402 61 872 441 51 3,158 1,842 58
6 am to 9 am 1,943 407 21 1,942 234 12 3,885 640 16
9 am to Noon 1,718 259 15 2,022 179 9 3,740 438 12
Noon to 3 pm 2,237 422 19 2,831 330 12 5,068 751 15
3 pm to 6 pm 3,047 901 30 3,434 726 21 6,481 1,627 25
6 pm to 9 pm 3,651 1,781 49 2,498 933 37 6,149 2,714 44
9 pm to Midnight 3,638 2,309 63 1,763 971 55 5,401 3,279 61
Unknown 298 189 63 11 3 31 309 192 62
Total 22,653 10,581 47 16,536 4,657 28 39,189 15,238 39
Injury Crashes**
Midnight to 3 am 58,000 26,000 45 34,000 13,000 37 92,000 39,000 42
3 am to 6 am 45,000 14,000 31 21,000 3,000 14 66,000 17,000 26
6 am to 9 am 69,000 4,000 6 152,000 4,000 3 222,000 9,000 4
9 am to Noon 60,000 3,000 4 179,000 4,000 2 239,000 6,000 3
Noon to 3 pm 73,000 4,000 5 261,000 4,000 2 334,000 8,000 2
3 pm to 6 pm 101,000 8,000 8 336,000 15,000 5 437,000 24,000 5
6 pm to 9 pm 87,000 17,000 20 181,000 17,000 9 268,000 34,000 13
9 pm to Midnight 71,000 20,000 29 88,000 16,000 18 159,000 36,000 23
Total 564,000 97,000 17 1,252,000 76,000 6 1,816,000 173,000 10
Property-Damage-Only Crashes**
Midnight to 3 am 138,000 38,000 28 55,000 15,000 28 193,000 54,000 28
3 am to 6 am 109,000 20,000 18 37,000 5,000 13 147,000 25,000 17
6 am to 9 am 186,000 8,000 4 389,000 9,000 2 575,000 17,000 3
9 am to Noon 145,000 8,000 6 436,000 9,000 2 581,000 17,000 3
Noon to 3 pm 153,000 7,000 4 640,000 12,000 2 793,000 19,000 2
3 pm to 6 pm 180,000 10,000 6 876,000 29,000 3 1,056,000 39,000 4
6 pm to 9 pm 212,000 21,000 10 390,000 21,000 5 602,000 42,000 7
9 pm to Midnight 192,000 25,000 13 166,000 21,000 13 358,000 45,000 13
Total 1,314,000 138,000 10 2,990,000 121,000 4 4,304,000 258,000 6
*Blood alcohol concentration (BAC) of .01 grams per deciliter (g/dl) or higher.
**Police-reported alcohol involvement.
Table 34
Crashes and Percent Alcohol Related by Time of Day, Crash Type, and Crash Severity
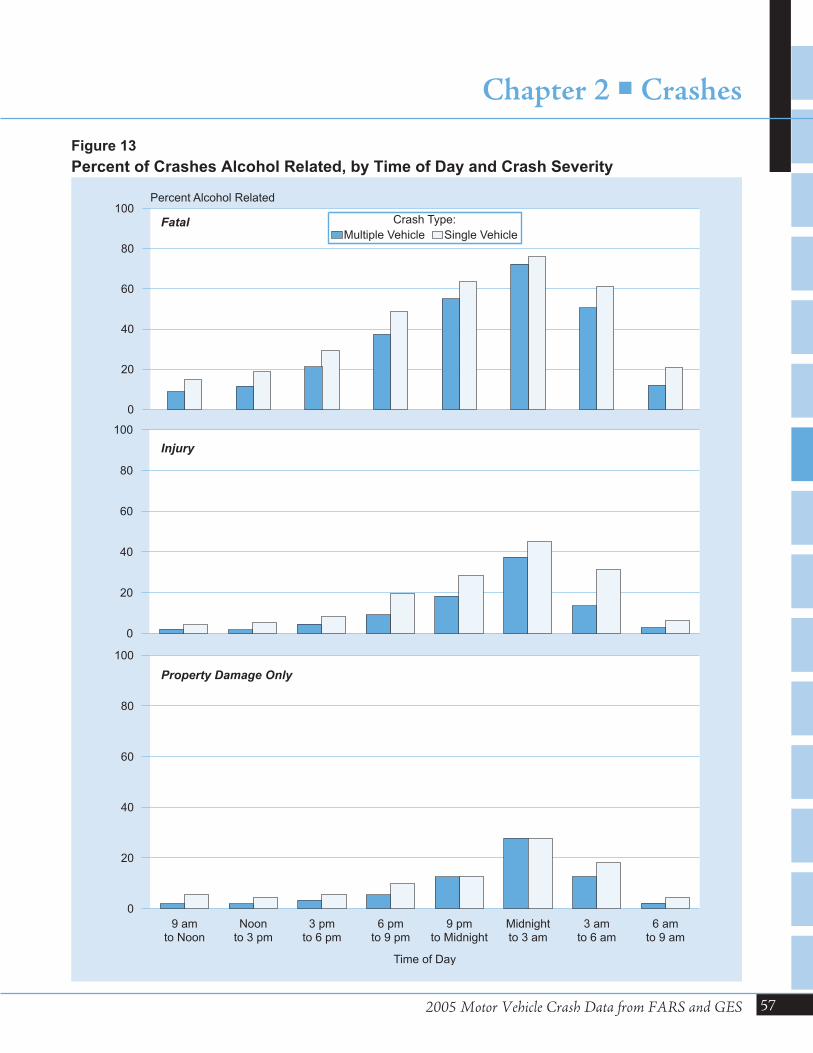
2005 Motor Vehicle Crash Data from FARS and GES
Chapter 2 � Crashes
57
0
20
40
60
80
100Percent Alcohol Related
Crash Type:
Multiple Vehicle Single Vehicle
0
20
40
60
80
100
9 amto Noon
Noonto 3 pm
3 pmto 6 pm
6 pmto 9 pm
9 pmto Midnight
Midnightto 3 am
3 amto 6 am
6 amto 9 am
Time of Day
0
20
40
60
80
100
Fatal
Injury
Property Damage Only
Figure 13
Percent of Crashes Alcohol Related, by Time of Day and Crash Severity


Chapter 3
VEHICLES

Statistics about the vehicles involved in police-reported motor vehicle crashes are presented in this chapter,according to six major vehicle types: Passenger Cars, Light Trucks (including pickups, vans, and utility vehicleswith a gross vehicle weight rating of 10,000 pounds or less), Large Trucks (including single-unit trucks and trucktractors with a gross vehicle weight rating of more than 10,000 pounds), Motorcycles (including motorcycles,mopeds, and motorscooters), Buses (including school buses and transit buses), and Other Vehicles (includingall-terrain vehicles, farm and construction equipment, and motorhomes). The tables and figures are presented forall vehicle types first, then by individual vehicle type. Below are some of the vehicle statistics you will find in thissection:
O More than 94 percent of the 11 million vehicles involved in motor vehicle crashes in 2005 were passenger cars orlight trucks.
O Large trucks accounted for 8 percent of the vehicles in fatal crashes, but only 3 percent of the vehicles involved ininjury crashes and 5 percent of the vehicles involved in property-damage-only crashes. Of the 4,932 large trucksinvolved in fatal crashes, 74 percent were combination trucks.
O The proportion of vehicles that rolled over in fatal crashes (21.1 percent) was 4 times as high as the proportionin injury crashes (5.3 percent) and 16 times as high as the proportion in property-damage-only crashes(1.3 percent).
O Compared with other vehicle types, utility vehicles experienced the highest rollover rates in fatal crashes(35.4 percent) and in property-damage-only crashes (2.6 percent). Large trucks experienced the highest rolloverrate in injury crashes (9.9 percent).
O Fires occurred in 0.1 percent of the vehicles involved in all traffic crashes in 2005. For fatal crashes, however,fires occurred in 3 percent of the vehicles involved.
O Regardless of crash severity, the majority of vehicles in single- and two-vehicle crashes were going straight priorto the crash. The next most common vehicle maneuver differed by crash severity: negotiating a curve for fatalcrashes, turning left for injury crashes, and stopped in traffic lane for property-damage-only crashes.
O Motorcycles in fatal crashes had the highest proportion of collisions with fixed objects (26.0 percent), and busesin fatal crashes had the lowest proportion (2.2 percent).
2005 Motor Vehicle Crash Data from FARS and GES
CHAPTER 3 �VEHICLES
61
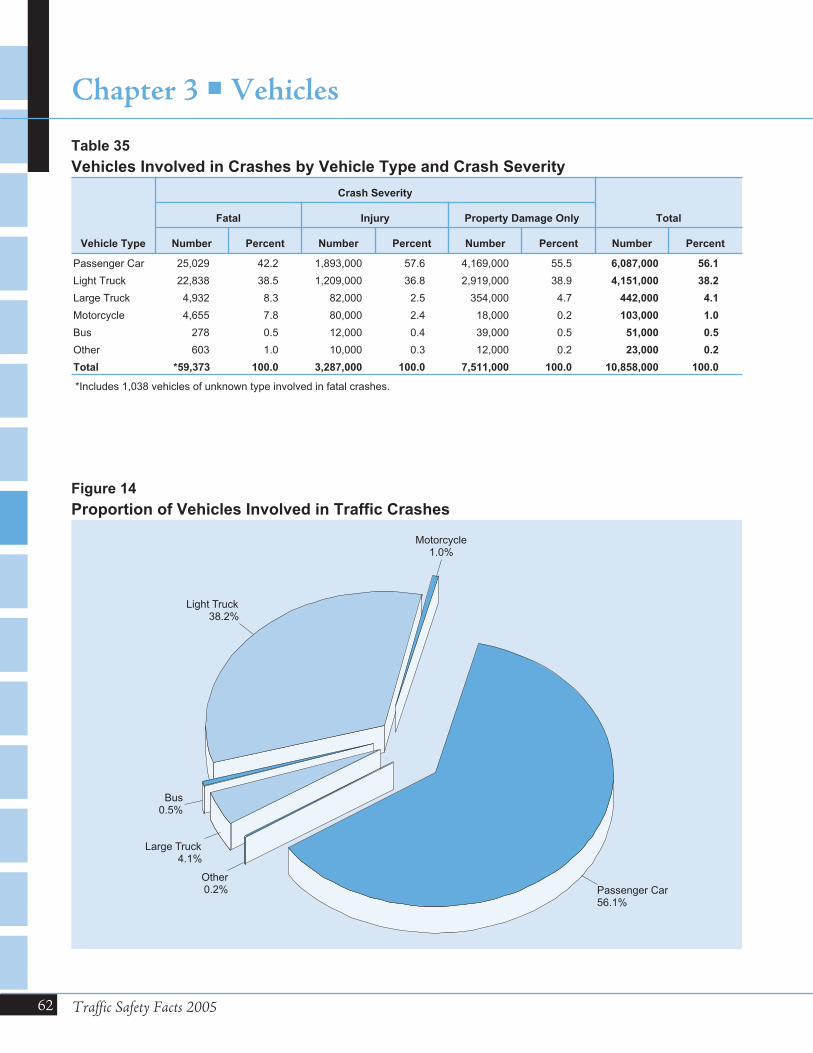
62 Traffic Safety Facts 2005
Chapter 3 �Vehicles
Vehicle Type
Crash Severity
TotalFatal Injury Property Damage Only
Number Percent Number Percent Number Percent Number Percent
Passenger Car 25,029 42.2 1,893,000 57.6 4,169,000 55.5 6,087,000 56.1
Light Truck 22,838 38.5 1,209,000 36.8 2,919,000 38.9 4,151,000 38.2
Large Truck 4,932 8.3 82,000 2.5 354,000 4.7 442,000 4.1
Motorcycle 4,655 7.8 80,000 2.4 18,000 0.2 103,000 1.0
Bus 278 0.5 12,000 0.4 39,000 0.5 51,000 0.5
Other 603 1.0 10,000 0.3 12,000 0.2 23,000 0.2
Total *59,373 100.0 3,287,000 100.0 7,511,000 100.0 10,858,000 100.0
*Includes 1,038 vehicles of unknown type involved in fatal crashes.
Table 35
Vehicles Involved in Crashes by Vehicle Type and Crash Severity
Light Truck38.2%
Motorcycle1.0%
Passenger Car56.1%
Bus0.5%
Large Truck4.1%
Other0.2%
Figure 14
Proportion of Vehicles Involved in Traffic Crashes
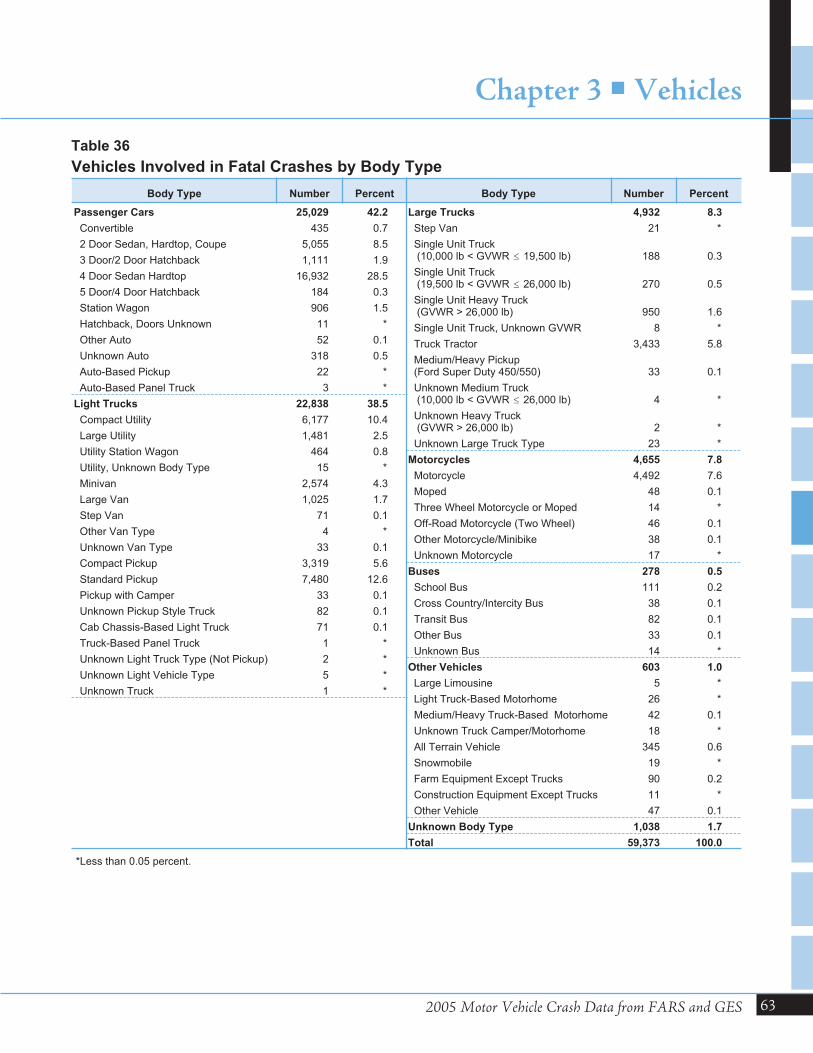
2005 Motor Vehicle Crash Data from FARS and GES
Chapter 3 �Vehicles
63
Table 36
Vehicles Involved in Fatal Crashes by Body Type
Body Type Number Percent
Passenger Cars 25,029 42.2
Convertible 435 0.7
2 Door Sedan, Hardtop, Coupe 5,055 8.5
3 Door/2 Door Hatchback 1,111 1.9
4 Door Sedan Hardtop 16,932 28.5
5 Door/4 Door Hatchback 184 0.3
Station Wagon 906 1.5
Hatchback, Doors Unknown 11 *
Other Auto 52 0.1
Unknown Auto 318 0.5
Auto-Based Pickup 22 *
Auto-Based Panel Truck 3 *
Light Trucks 22,838 38.5
Compact Utility 6,177 10.4
Large Utility 1,481 2.5
Utility Station Wagon 464 0.8
Utility, Unknown Body Type 15 *
Minivan 2,574 4.3
Large Van 1,025 1.7
Step Van 71 0.1
Other Van Type 4 *
Unknown Van Type 33 0.1
Compact Pickup 3,319 5.6
Standard Pickup 7,480 12.6
Pickup with Camper 33 0.1
Unknown Pickup Style Truck 82 0.1
Cab Chassis-Based Light Truck 71 0.1
Truck-Based Panel Truck 1 *
Unknown Light Truck Type (Not Pickup) 2 *
Unknown Light Vehicle Type 5 *
Unknown Truck 1 *
*Less than 0.05 percent.
Body Type Number Percent
Large Trucks 4,932 8.3
Step Van 21 *
Single Unit Truck(10,000 lb < GVWR � 19,500 lb) 188 0.3
Single Unit Truck(19,500 lb < GVWR � 26,000 lb) 270 0.5
Single Unit Heavy Truck(GVWR > 26,000 lb) 950 1.6
Single Unit Truck, Unknown GVWR 8 *
Truck Tractor 3,433 5.8
Medium/Heavy Pickup(Ford Super Duty 450/550) 33 0.1
Unknown Medium Truck(10,000 lb < GVWR � 26,000 lb) 4 *
Unknown Heavy Truck(GVWR > 26,000 lb) 2 *
Unknown Large Truck Type 23 *
Motorcycles 4,655 7.8
Motorcycle 4,492 7.6
Moped 48 0.1
Three Wheel Motorcycle or Moped 14 *
Off-Road Motorcycle (Two Wheel) 46 0.1
Other Motorcycle/Minibike 38 0.1
Unknown Motorcycle 17 *
Buses 278 0.5
School Bus 111 0.2
Cross Country/Intercity Bus 38 0.1
Transit Bus 82 0.1
Other Bus 33 0.1
Unknown Bus 14 *
Other Vehicles 603 1.0
Large Limousine 5 *
Light Truck-Based Motorhome 26 *
Medium/Heavy Truck-Based Motorhome 42 0.1
Unknown Truck Camper/Motorhome 18 *
All Terrain Vehicle 345 0.6
Snowmobile 19 *
Farm Equipment Except Trucks 90 0.2
Construction Equipment Except Trucks 11 *
Other Vehicle 47 0.1
Unknown Body Type 1,038 1.7
Total 59,373 100.0
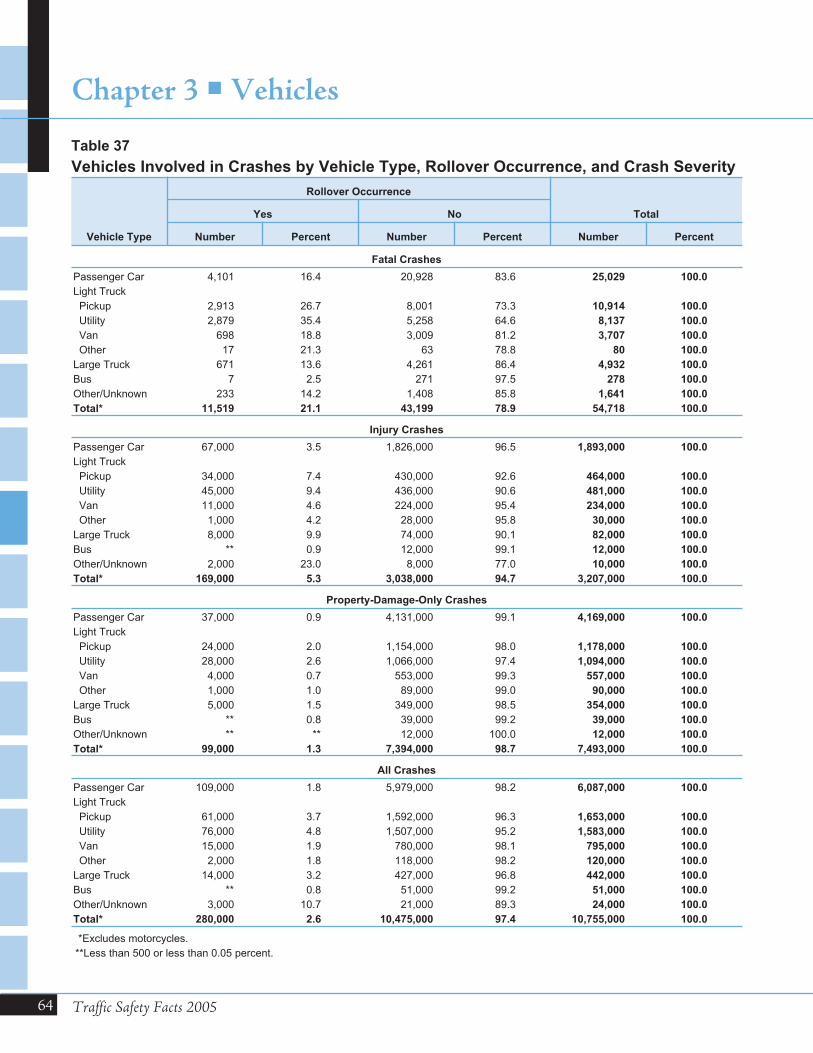
64 Traffic Safety Facts 2005
Chapter 3 �Vehicles
Vehicle Type
Rollover Occurrence
TotalYes No
Number Percent Number Percent Number Percent
Fatal Crashes
Passenger Car 4,101 16.4 20,928 83.6 25,029 100.0
Light Truck
Pickup 2,913 26.7 8,001 73.3 10,914 100.0
Utility 2,879 35.4 5,258 64.6 8,137 100.0
Van 698 18.8 3,009 81.2 3,707 100.0
Other 17 21.3 63 78.8 80 100.0
Large Truck 671 13.6 4,261 86.4 4,932 100.0
Bus 7 2.5 271 97.5 278 100.0
Other/Unknown 233 14.2 1,408 85.8 1,641 100.0
Total* 11,519 21.1 43,199 78.9 54,718 100.0
Injury Crashes
Passenger Car 67,000 3.5 1,826,000 96.5 1,893,000 100.0
Light Truck
Pickup 34,000 7.4 430,000 92.6 464,000 100.0
Utility 45,000 9.4 436,000 90.6 481,000 100.0
Van 11,000 4.6 224,000 95.4 234,000 100.0
Other 1,000 4.2 28,000 95.8 30,000 100.0
Large Truck 8,000 9.9 74,000 90.1 82,000 100.0
Bus ** 0.9 12,000 99.1 12,000 100.0
Other/Unknown 2,000 23.0 8,000 77.0 10,000 100.0
Total* 169,000 5.3 3,038,000 94.7 3,207,000 100.0
Property-Damage-Only Crashes
Passenger Car 37,000 0.9 4,131,000 99.1 4,169,000 100.0
Light Truck
Pickup 24,000 2.0 1,154,000 98.0 1,178,000 100.0
Utility 28,000 2.6 1,066,000 97.4 1,094,000 100.0
Van 4,000 0.7 553,000 99.3 557,000 100.0
Other 1,000 1.0 89,000 99.0 90,000 100.0
Large Truck 5,000 1.5 349,000 98.5 354,000 100.0
Bus ** 0.8 39,000 99.2 39,000 100.0
Other/Unknown ** ** 12,000 100.0 12,000 100.0
Total* 99,000 1.3 7,394,000 98.7 7,493,000 100.0
All Crashes
Passenger Car 109,000 1.8 5,979,000 98.2 6,087,000 100.0
Light Truck
Pickup 61,000 3.7 1,592,000 96.3 1,653,000 100.0
Utility 76,000 4.8 1,507,000 95.2 1,583,000 100.0
Van 15,000 1.9 780,000 98.1 795,000 100.0
Other 2,000 1.8 118,000 98.2 120,000 100.0
Large Truck 14,000 3.2 427,000 96.8 442,000 100.0
Bus ** 0.8 51,000 99.2 51,000 100.0
Other/Unknown 3,000 10.7 21,000 89.3 24,000 100.0
Total* 280,000 2.6 10,475,000 97.4 10,755,000 100.0
*Excludes motorcycles.
**Less than 500 or less than 0.05 percent.
Table 37
Vehicles Involved in Crashes by Vehicle Type, Rollover Occurrence, and Crash Severity
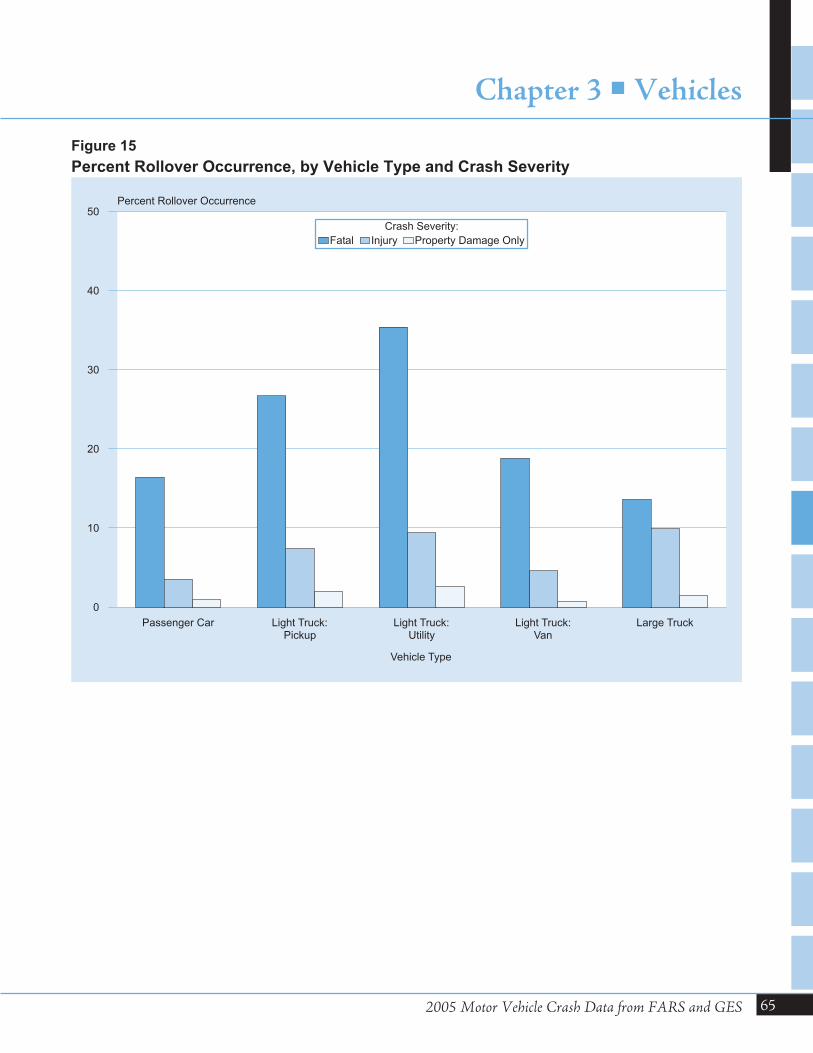
2005 Motor Vehicle Crash Data from FARS and GES
Chapter 3 �Vehicles
65
Passenger Car Light Truck:Pickup
Light Truck:Utility
Light Truck:Van
Large Truck
Vehicle Type
0
10
20
30
40
50Percent Rollover Occurrence
Crash Severity:
Fatal Injury Property Damage Only
Figure 15
Percent Rollover Occurrence, by Vehicle Type and Crash Severity
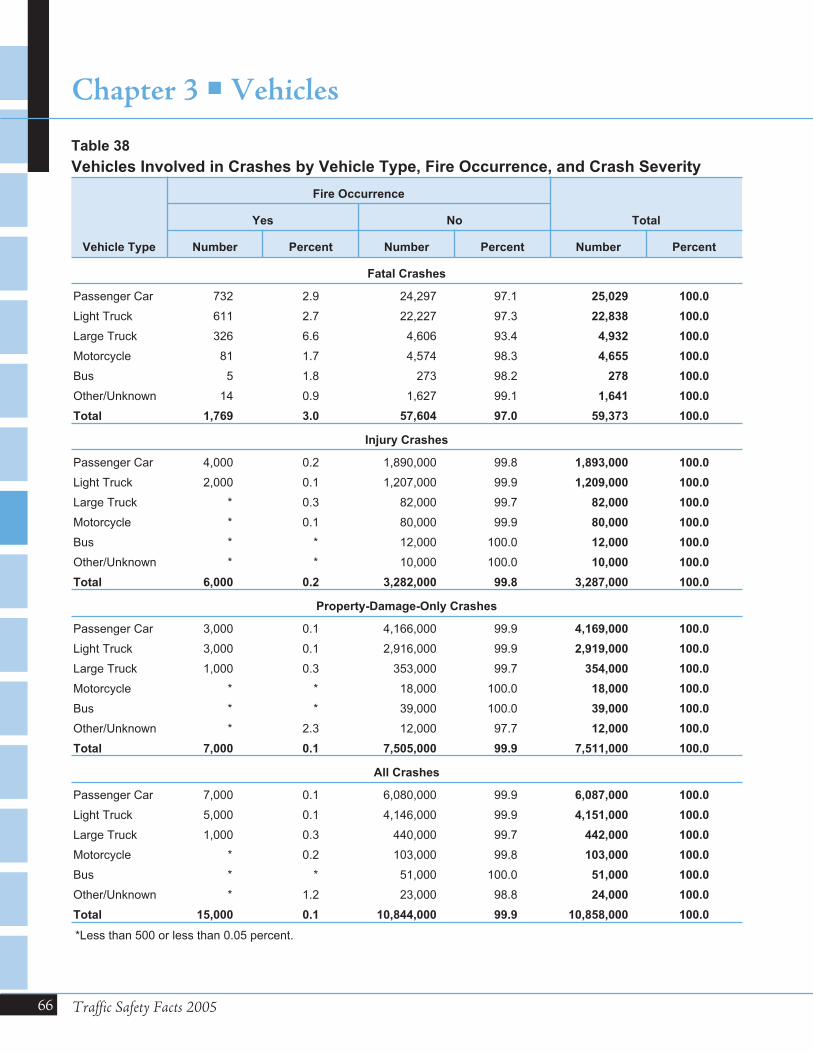
66 Traffic Safety Facts 2005
Chapter 3 �Vehicles
Vehicle Type
Fire Occurrence
TotalYes No
Number Percent Number Percent Number Percent
Fatal Crashes
Passenger Car 732 2.9 24,297 97.1 25,029 100.0
Light Truck 611 2.7 22,227 97.3 22,838 100.0
Large Truck 326 6.6 4,606 93.4 4,932 100.0
Motorcycle 81 1.7 4,574 98.3 4,655 100.0
Bus 5 1.8 273 98.2 278 100.0
Other/Unknown 14 0.9 1,627 99.1 1,641 100.0
Total 1,769 3.0 57,604 97.0 59,373 100.0
Injury Crashes
Passenger Car 4,000 0.2 1,890,000 99.8 1,893,000 100.0
Light Truck 2,000 0.1 1,207,000 99.9 1,209,000 100.0
Large Truck * 0.3 82,000 99.7 82,000 100.0
Motorcycle * 0.1 80,000 99.9 80,000 100.0
Bus * * 12,000 100.0 12,000 100.0
Other/Unknown * * 10,000 100.0 10,000 100.0
Total 6,000 0.2 3,282,000 99.8 3,287,000 100.0
Property-Damage-Only Crashes
Passenger Car 3,000 0.1 4,166,000 99.9 4,169,000 100.0
Light Truck 3,000 0.1 2,916,000 99.9 2,919,000 100.0
Large Truck 1,000 0.3 353,000 99.7 354,000 100.0
Motorcycle * * 18,000 100.0 18,000 100.0
Bus * * 39,000 100.0 39,000 100.0
Other/Unknown * 2.3 12,000 97.7 12,000 100.0
Total 7,000 0.1 7,505,000 99.9 7,511,000 100.0
All Crashes
Passenger Car 7,000 0.1 6,080,000 99.9 6,087,000 100.0
Light Truck 5,000 0.1 4,146,000 99.9 4,151,000 100.0
Large Truck 1,000 0.3 440,000 99.7 442,000 100.0
Motorcycle * 0.2 103,000 99.8 103,000 100.0
Bus * * 51,000 100.0 51,000 100.0
Other/Unknown * 1.2 23,000 98.8 24,000 100.0
Total 15,000 0.1 10,844,000 99.9 10,858,000 100.0
*Less than 500 or less than 0.05 percent.
Table 38
Vehicles Involved in Crashes by Vehicle Type, Fire Occurrence, and Crash Severity
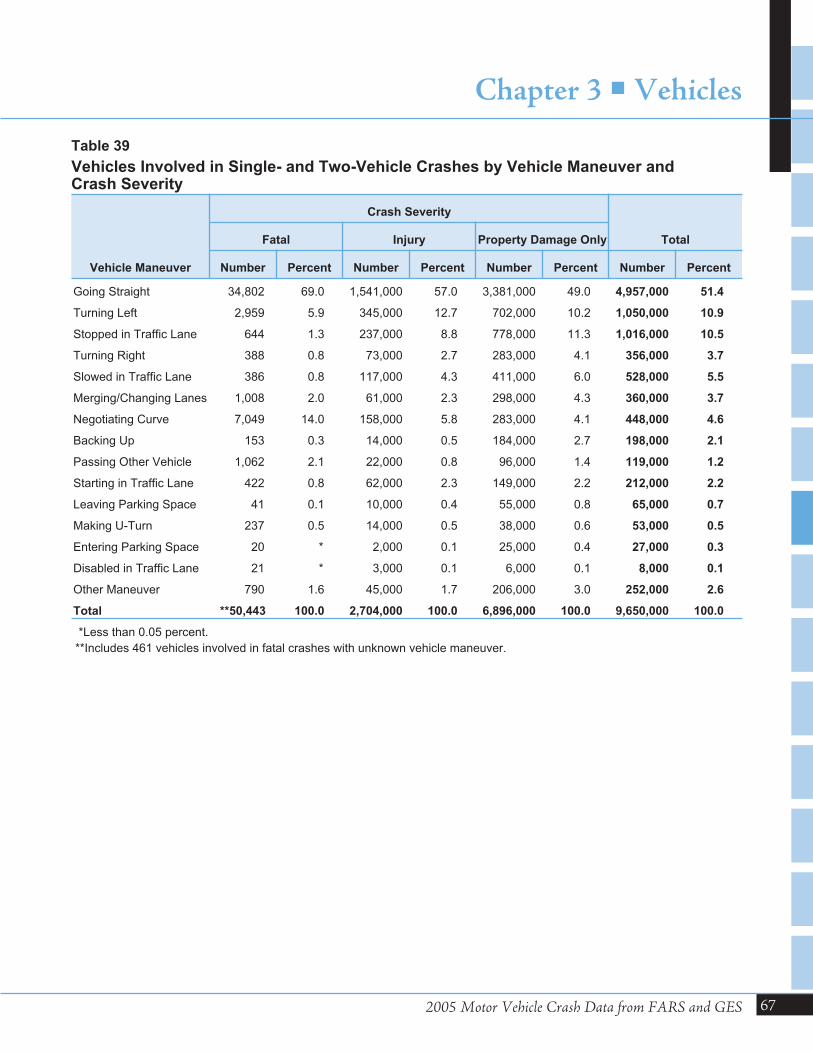
2005 Motor Vehicle Crash Data from FARS and GES
Chapter 3 �Vehicles
67
Vehicle Maneuver
Crash Severity
TotalFatal Injury Property Damage Only
Number Percent Number Percent Number Percent Number Percent
Going Straight 34,802 69.0 1,541,000 57.0 3,381,000 49.0 4,957,000 51.4
Turning Left 2,959 5.9 345,000 12.7 702,000 10.2 1,050,000 10.9
Stopped in Traffic Lane 644 1.3 237,000 8.8 778,000 11.3 1,016,000 10.5
Turning Right 388 0.8 73,000 2.7 283,000 4.1 356,000 3.7
Slowed in Traffic Lane 386 0.8 117,000 4.3 411,000 6.0 528,000 5.5
Merging/Changing Lanes 1,008 2.0 61,000 2.3 298,000 4.3 360,000 3.7
Negotiating Curve 7,049 14.0 158,000 5.8 283,000 4.1 448,000 4.6
Backing Up 153 0.3 14,000 0.5 184,000 2.7 198,000 2.1
Passing Other Vehicle 1,062 2.1 22,000 0.8 96,000 1.4 119,000 1.2
Starting in Traffic Lane 422 0.8 62,000 2.3 149,000 2.2 212,000 2.2
Leaving Parking Space 41 0.1 10,000 0.4 55,000 0.8 65,000 0.7
Making U-Turn 237 0.5 14,000 0.5 38,000 0.6 53,000 0.5
Entering Parking Space 20 * 2,000 0.1 25,000 0.4 27,000 0.3
Disabled in Traffic Lane 21 * 3,000 0.1 6,000 0.1 8,000 0.1
Other Maneuver 790 1.6 45,000 1.7 206,000 3.0 252,000 2.6
Total **50,443 100.0 2,704,000 100.0 6,896,000 100.0 9,650,000 100.0
*Less than 0.05 percent.
**Includes 461 vehicles involved in fatal crashes with unknown vehicle maneuver.
Table 39
Vehicles Involved in Single- and Two-Vehicle Crashes by Vehicle Maneuver andCrash Severity
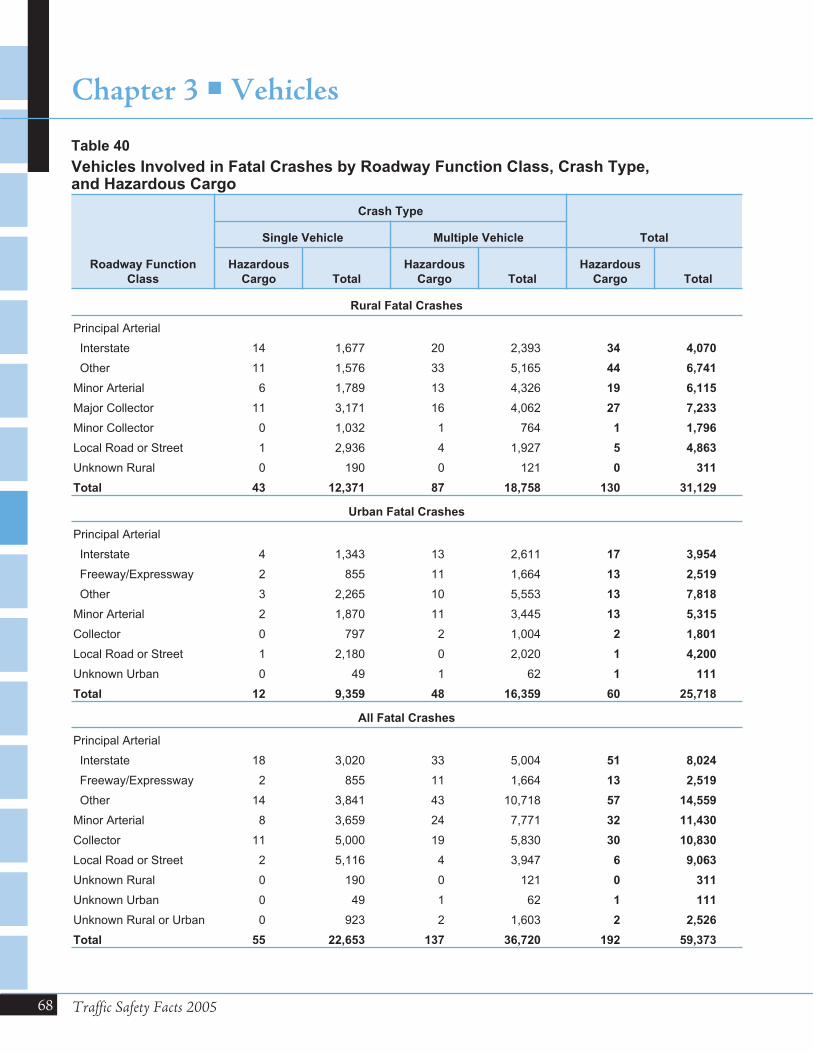
68 Traffic Safety Facts 2005
Chapter 3 �Vehicles
Roadway Function
Class
Crash Type
TotalSingle Vehicle Multiple Vehicle
Hazardous
Cargo Total
Hazardous
Cargo Total
Hazardous
Cargo Total
Rural Fatal Crashes
Principal Arterial
Interstate 14 1,677 20 2,393 34 4,070
Other 11 1,576 33 5,165 44 6,741
Minor Arterial 6 1,789 13 4,326 19 6,115
Major Collector 11 3,171 16 4,062 27 7,233
Minor Collector 0 1,032 1 764 1 1,796
Local Road or Street 1 2,936 4 1,927 5 4,863
Unknown Rural 0 190 0 121 0 311
Total 43 12,371 87 18,758 130 31,129
Urban Fatal Crashes
Principal Arterial
Interstate 4 1,343 13 2,611 17 3,954
Freeway/Expressway 2 855 11 1,664 13 2,519
Other 3 2,265 10 5,553 13 7,818
Minor Arterial 2 1,870 11 3,445 13 5,315
Collector 0 797 2 1,004 2 1,801
Local Road or Street 1 2,180 0 2,020 1 4,200
Unknown Urban 0 49 1 62 1 111
Total 12 9,359 48 16,359 60 25,718
All Fatal Crashes
Principal Arterial
Interstate 18 3,020 33 5,004 51 8,024
Freeway/Expressway 2 855 11 1,664 13 2,519
Other 14 3,841 43 10,718 57 14,559
Minor Arterial 8 3,659 24 7,771 32 11,430
Collector 11 5,000 19 5,830 30 10,830
Local Road or Street 2 5,116 4 3,947 6 9,063
Unknown Rural 0 190 0 121 0 311
Unknown Urban 0 49 1 62 1 111
Unknown Rural or Urban 0 923 2 1,603 2 2,526
Total 55 22,653 137 36,720 192 59,373
Table 40
Vehicles Involved in Fatal Crashes by Roadway Function Class, Crash Type,and Hazardous Cargo
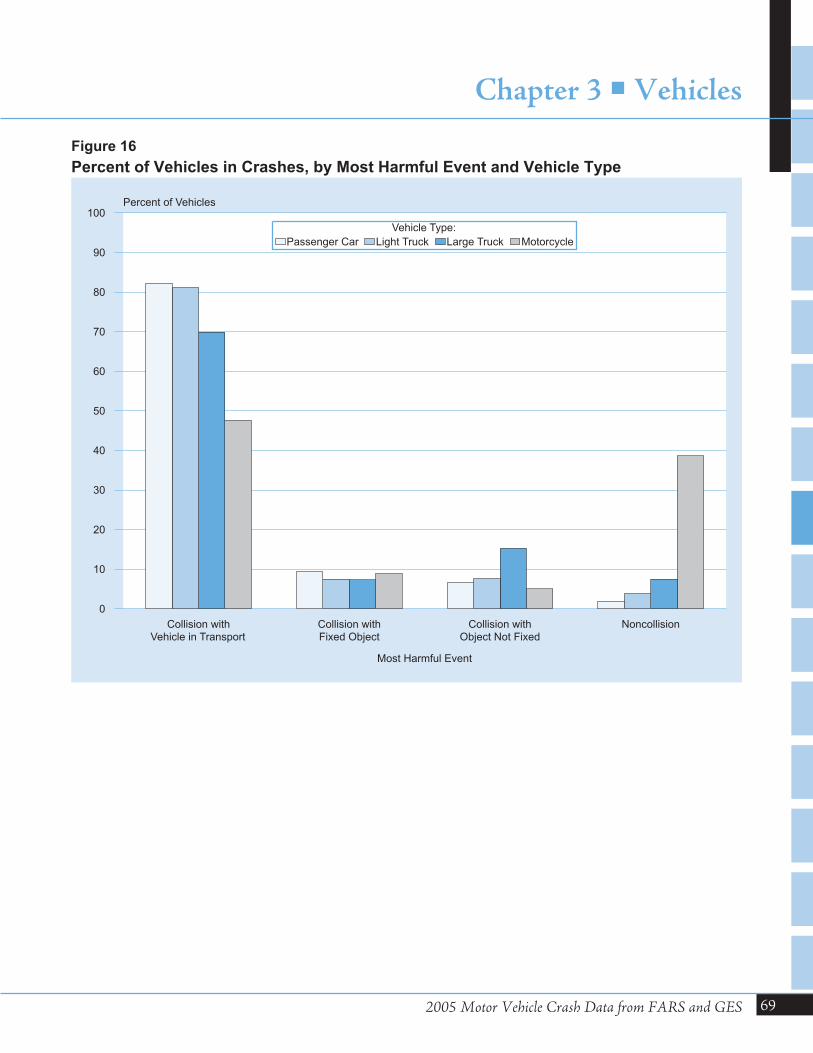
2005 Motor Vehicle Crash Data from FARS and GES
Chapter 3 �Vehicles
69
Collision withVehicle in Transport
Collision withFixed Object
Collision withObject Not Fixed
Noncollision
Most Harmful Event
0
10
20
30
40
50
60
70
80
90
100Percent of Vehicles
Vehicle Type:
Passenger Car Light Truck Large Truck Motorcycle
Figure 16
Percent of Vehicles in Crashes, by Most Harmful Event and Vehicle Type
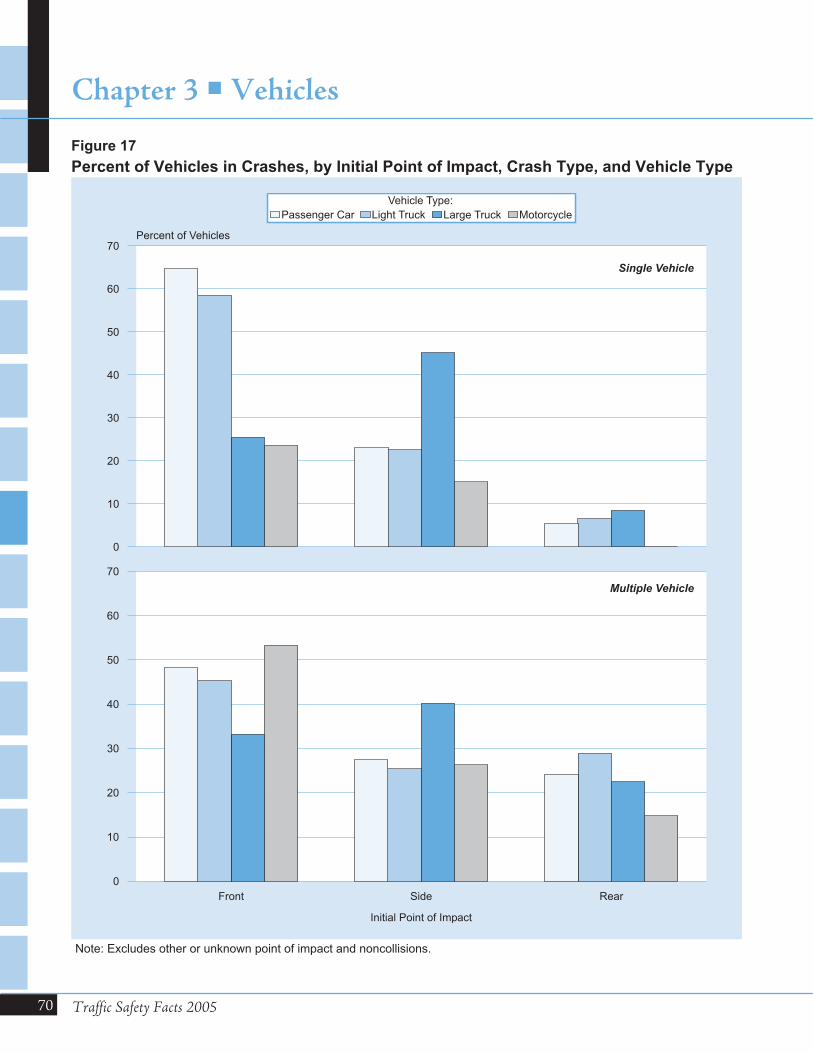
70 Traffic Safety Facts 2005
Chapter 3 �Vehicles
0
10
20
30
40
50
60
70Percent of Vehicles
Vehicle Type:
Passenger Car Light Truck Large Truck Motorcycle
Front Side Rear
Initial Point of Impact
0
10
20
30
40
50
60
70
Multiple Vehicle
Single Vehicle
Figure 17
Percent of Vehicles in Crashes, by Initial Point of Impact, Crash Type, and Vehicle Type
Note: Excludes other or unknown point of impact and noncollisions.

2005 Motor Vehicle Crash Data from FARS and GES
Chapter 3 �Vehicles
71
Most Harmful
Event
Crash Severity
TotalFatal Injury Property Damage Only
Number Percent Number Percent Number Percent Number Percent
Collision with
Motor Vehicle in
Transport by Initial
Point of Impact:
Front 8,243 32.9 786,000 41.5 1,621,000 38.9 2,415,000 39.7
Left Side 2,537 10.1 206,000 10.9 508,000 12.2 717,000 11.8
Right Side 2,095 8.4 180,000 9.5 467,000 11.2 650,000 10.7
Rear 1,201 4.8 388,000 20.5 834,000 20.0 1,224,000 20.1
Other/Unknown 105 0.4 * * * * 1,000 *
Subtotal 14,181 56.7 1,561,000 82.4 3,431,000 82.3 5,006,000 82.2
Collision with
Fixed Object 4,414 17.6 178,000 9.4 388,000 9.3 570,000 9.4
Collision with
Object Not Fixed:
Nonoccupant 2,498 10.0 63,000 3.3 4,000 0.1 69,000 1.1
Other 618 2.5 31,000 1.6 303,000 7.3 335,000 5.5
Subtotal 3,116 12.4 94,000 4.9 307,000 7.4 404,000 6.6
Noncollision 3,313 13.2 61,000 3.2 44,000 1.0 107,000 1.8
Total **25,029 100.0 1,893,000 100.0 4,169,000 100.0 6,087,000 100.0
*Less than 500 or less than 0.05 percent.
**Includes 5 passenger cars involved in fatal crashes with unknown most harmful event.
Table 41
Passenger Cars Involved in Crashes by Most Harmful Event and Crash Severity
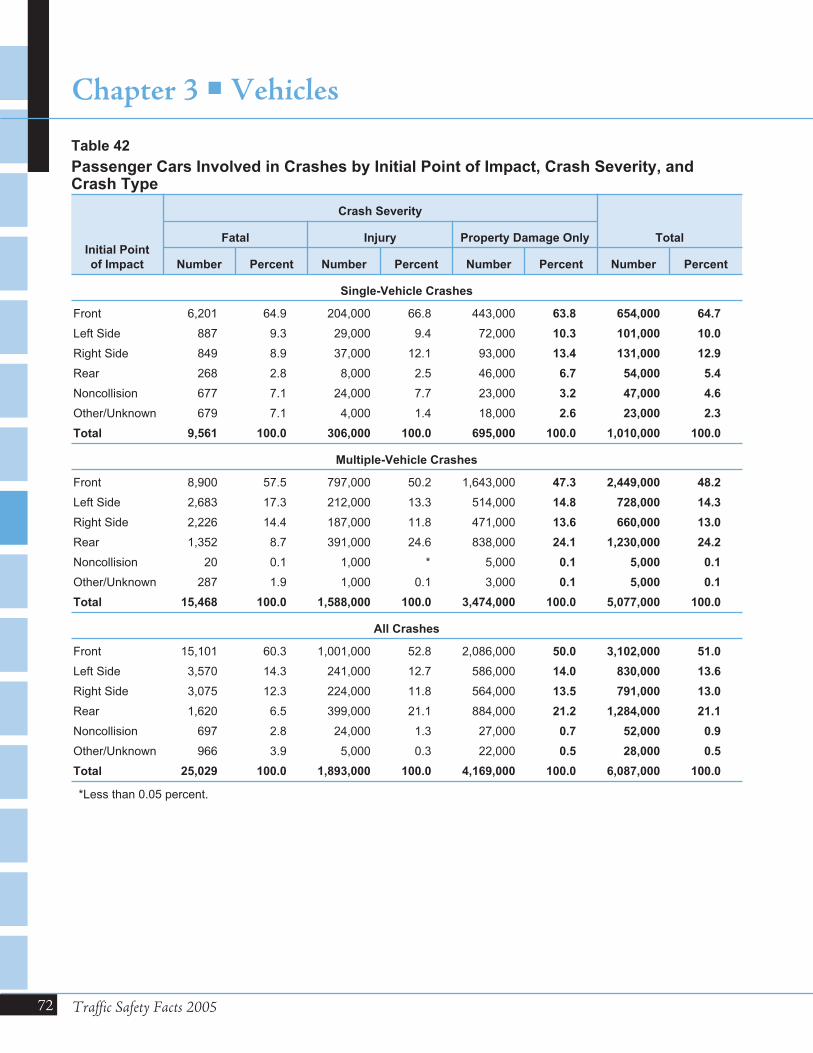
72 Traffic Safety Facts 2005
Chapter 3 �Vehicles
Initial Point
of Impact
Crash Severity
TotalFatal Injury Property Damage Only
Number Percent Number Percent Number Percent Number Percent
Single-Vehicle Crashes
Front 6,201 64.9 204,000 66.8 443,000 63.8 654,000 64.7
Left Side 887 9.3 29,000 9.4 72,000 10.3 101,000 10.0
Right Side 849 8.9 37,000 12.1 93,000 13.4 131,000 12.9
Rear 268 2.8 8,000 2.5 46,000 6.7 54,000 5.4
Noncollision 677 7.1 24,000 7.7 23,000 3.2 47,000 4.6
Other/Unknown 679 7.1 4,000 1.4 18,000 2.6 23,000 2.3
Total 9,561 100.0 306,000 100.0 695,000 100.0 1,010,000 100.0
Multiple-Vehicle Crashes
Front 8,900 57.5 797,000 50.2 1,643,000 47.3 2,449,000 48.2
Left Side 2,683 17.3 212,000 13.3 514,000 14.8 728,000 14.3
Right Side 2,226 14.4 187,000 11.8 471,000 13.6 660,000 13.0
Rear 1,352 8.7 391,000 24.6 838,000 24.1 1,230,000 24.2
Noncollision 20 0.1 1,000 * 5,000 0.1 5,000 0.1
Other/Unknown 287 1.9 1,000 0.1 3,000 0.1 5,000 0.1
Total 15,468 100.0 1,588,000 100.0 3,474,000 100.0 5,077,000 100.0
All Crashes
Front 15,101 60.3 1,001,000 52.8 2,086,000 50.0 3,102,000 51.0
Left Side 3,570 14.3 241,000 12.7 586,000 14.0 830,000 13.6
Right Side 3,075 12.3 224,000 11.8 564,000 13.5 791,000 13.0
Rear 1,620 6.5 399,000 21.1 884,000 21.2 1,284,000 21.1
Noncollision 697 2.8 24,000 1.3 27,000 0.7 52,000 0.9
Other/Unknown 966 3.9 5,000 0.3 22,000 0.5 28,000 0.5
Total 25,029 100.0 1,893,000 100.0 4,169,000 100.0 6,087,000 100.0
*Less than 0.05 percent.
Table 42
Passenger Cars Involved in Crashes by Initial Point of Impact, Crash Severity, andCrash Type
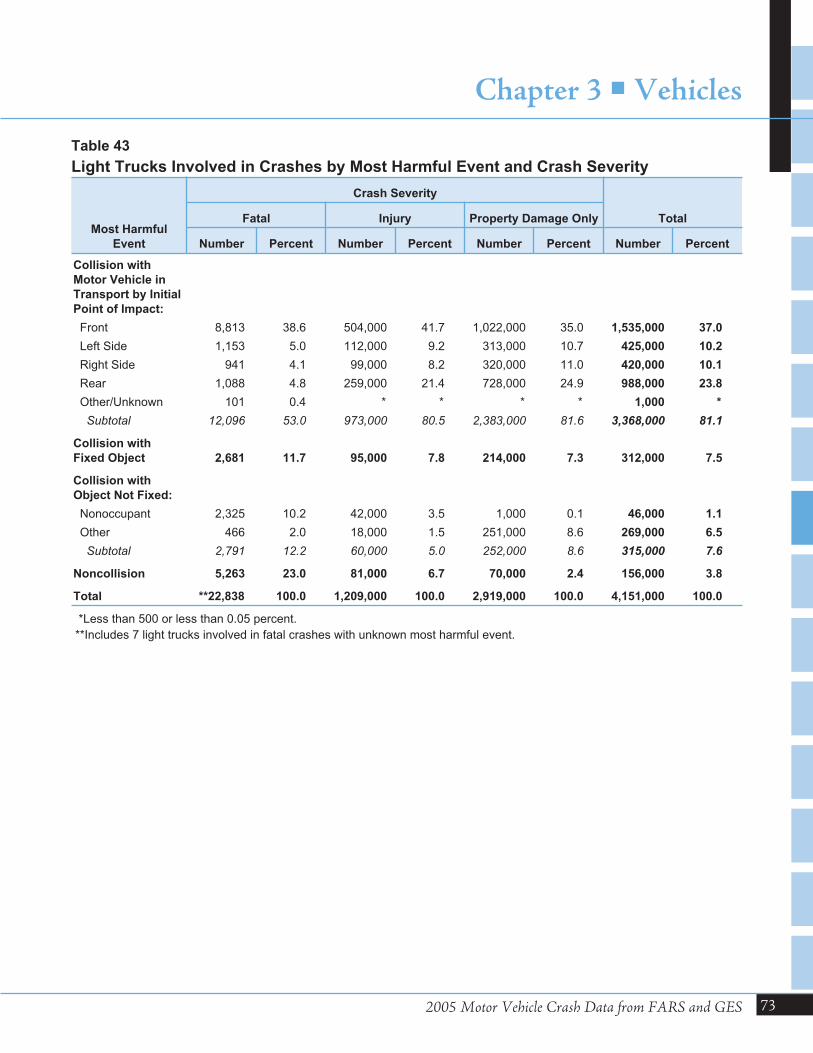
2005 Motor Vehicle Crash Data from FARS and GES
Chapter 3 �Vehicles
73
Most Harmful
Event
Crash Severity
TotalFatal Injury Property Damage Only
Number Percent Number Percent Number Percent Number Percent
Collision with
Motor Vehicle in
Transport by Initial
Point of Impact:
Front 8,813 38.6 504,000 41.7 1,022,000 35.0 1,535,000 37.0
Left Side 1,153 5.0 112,000 9.2 313,000 10.7 425,000 10.2
Right Side 941 4.1 99,000 8.2 320,000 11.0 420,000 10.1
Rear 1,088 4.8 259,000 21.4 728,000 24.9 988,000 23.8
Other/Unknown 101 0.4 * * * * 1,000 *
Subtotal 12,096 53.0 973,000 80.5 2,383,000 81.6 3,368,000 81.1
Collision with
Fixed Object 2,681 11.7 95,000 7.8 214,000 7.3 312,000 7.5
Collision with
Object Not Fixed:
Nonoccupant 2,325 10.2 42,000 3.5 1,000 0.1 46,000 1.1
Other 466 2.0 18,000 1.5 251,000 8.6 269,000 6.5
Subtotal 2,791 12.2 60,000 5.0 252,000 8.6 315,000 7.6
Noncollision 5,263 23.0 81,000 6.7 70,000 2.4 156,000 3.8
Total **22,838 100.0 1,209,000 100.0 2,919,000 100.0 4,151,000 100.0
*Less than 500 or less than 0.05 percent.
**Includes 7 light trucks involved in fatal crashes with unknown most harmful event.
Table 43
Light Trucks Involved in Crashes by Most Harmful Event and Crash Severity

74 Traffic Safety Facts 2005
Chapter 3 �Vehicles
Initial Point
of Impact
Crash Severity
TotalFatal Injury Property Damage Only
Number Percent Number Percent Number Percent Number Percent
Single-Vehicle Crashes
Front 5,471 59.3 119,000 58.9 293,000 58.2 418,000 58.5
Left Side 582 6.3 19,000 9.1 48,000 9.5 67,000 9.4
Right Side 569 6.2 23,000 11.5 70,000 14.0 94,000 13.2
Rear 187 2.0 3,000 1.3 44,000 8.7 47,000 6.6
Noncollision 1,732 18.8 36,000 18.0 40,000 7.9 78,000 10.9
Other/Unknown 684 7.4 2,000 1.1 8,000 1.6 11,000 1.6
Total 9,225 100.0 203,000 100.0 504,000 100.0 716,000 100.0
Multiple-Vehicle Crashes
Front 9,578 70.4 512,000 50.9 1,033,000 42.8 1,555,000 45.3
Left Side 1,325 9.7 119,000 11.9 316,000 13.1 437,000 12.7
Right Side 1,100 8.1 109,000 10.9 325,000 13.5 436,000 12.7
Rear 1,316 9.7 261,000 26.0 729,000 30.2 992,000 28.9
Noncollision 21 0.2 3,000 0.3 11,000 0.5 14,000 0.4
Other/Unknown 273 2.0 1,000 0.1 * * 1,000 *
Total 13,613 100.0 1,006,000 100.0 2,416,000 100.0 3,436,000 100.0
All Crashes
Front 15,049 65.9 632,000 52.3 1,327,000 45.4 1,973,000 47.5
Left Side 1,907 8.4 138,000 11.4 364,000 12.5 504,000 12.1
Right Side 1,669 7.3 133,000 11.0 396,000 13.6 530,000 12.8
Rear 1,503 6.6 264,000 21.8 773,000 26.5 1,039,000 25.0
Noncollision 1,753 7.7 39,000 3.2 51,000 1.7 92,000 2.2
Other/Unknown 957 4.2 3,000 0.2 8,000 0.3 12,000 0.3
Total 22,838 100.0 1,209,000 100.0 2,919,000 100.0 4,151,000 100.0
*Less than 500 or less than 0.05 percent.
Table 44
Light Trucks Involved in Crashes by Initial Point of Impact, Crash Severity, andCrash Type

2005 Motor Vehicle Crash Data from FARS and GES
Chapter 3 �Vehicles
75
Most Harmful
Event
Crash Severity
TotalFatal Injury Property Damage Only
Number Percent Number Percent Number Percent Number Percent
Collision with
Motor Vehicle in
Transport by Initial
Point of Impact:
Front 2,309 46.8 29,000 35.3 74,000 20.8 105,000 23.8
Left Side 417 8.5 12,000 14.7 50,000 14.0 62,000 14.1
Right Side 212 4.3 12,000 14.5 55,000 15.6 67,000 15.2
Rear 740 15.0 14,000 17.6 58,000 16.5 74,000 16.7
Other/Unknown 33 0.7 * 0.3 * 0.1 1,000 0.1
Subtotal 3,711 75.2 68,000 82.3 237,000 66.9 309,000 69.9
Collision with
Fixed Object 175 3.5 2,000 2.9 30,000 8.4 32,000 7.3
Collision with
Object Not Fixed:
Nonoccupant 405 8.2 1,000 1.2 * * 1,000 0.3
Other 119 2.4 1,000 1.4 65,000 18.3 66,000 15.0
Subtotal 524 10.6 2,000 2.5 65,000 18.3 67,000 15.3
Noncollision 522 10.6 10,000 12.3 22,000 6.3 33,000 7.5
Total 4,932 100.0 82,000 100.0 354,000 100.0 442,000 100.0
*Less than 500 or less than 0.05 percent.
Table 45
Large Trucks Involved in Crashes by Most Harmful Event and Crash Severity
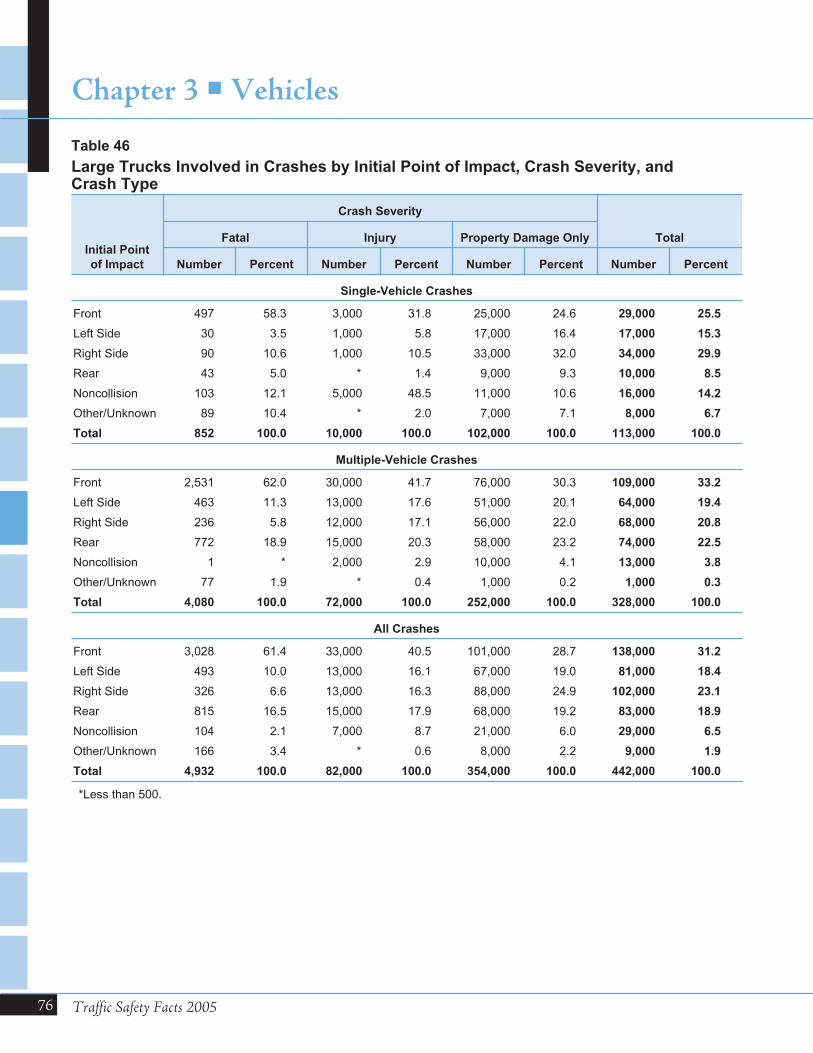
76 Traffic Safety Facts 2005
Chapter 3 �Vehicles
Initial Point
of Impact
Crash Severity
TotalFatal Injury Property Damage Only
Number Percent Number Percent Number Percent Number Percent
Single-Vehicle Crashes
Front 497 58.3 3,000 31.8 25,000 24.6 29,000 25.5
Left Side 30 3.5 1,000 5.8 17,000 16.4 17,000 15.3
Right Side 90 10.6 1,000 10.5 33,000 32.0 34,000 29.9
Rear 43 5.0 * 1.4 9,000 9.3 10,000 8.5
Noncollision 103 12.1 5,000 48.5 11,000 10.6 16,000 14.2
Other/Unknown 89 10.4 * 2.0 7,000 7.1 8,000 6.7
Total 852 100.0 10,000 100.0 102,000 100.0 113,000 100.0
Multiple-Vehicle Crashes
Front 2,531 62.0 30,000 41.7 76,000 30.3 109,000 33.2
Left Side 463 11.3 13,000 17.6 51,000 20.1 64,000 19.4
Right Side 236 5.8 12,000 17.1 56,000 22.0 68,000 20.8
Rear 772 18.9 15,000 20.3 58,000 23.2 74,000 22.5
Noncollision 1 * 2,000 2.9 10,000 4.1 13,000 3.8
Other/Unknown 77 1.9 * 0.4 1,000 0.2 1,000 0.3
Total 4,080 100.0 72,000 100.0 252,000 100.0 328,000 100.0
All Crashes
Front 3,028 61.4 33,000 40.5 101,000 28.7 138,000 31.2
Left Side 493 10.0 13,000 16.1 67,000 19.0 81,000 18.4
Right Side 326 6.6 13,000 16.3 88,000 24.9 102,000 23.1
Rear 815 16.5 15,000 17.9 68,000 19.2 83,000 18.9
Noncollision 104 2.1 7,000 8.7 21,000 6.0 29,000 6.5
Other/Unknown 166 3.4 * 0.6 8,000 2.2 9,000 1.9
Total 4,932 100.0 82,000 100.0 354,000 100.0 442,000 100.0
*Less than 500.
Table 46
Large Trucks Involved in Crashes by Initial Point of Impact, Crash Severity, andCrash Type
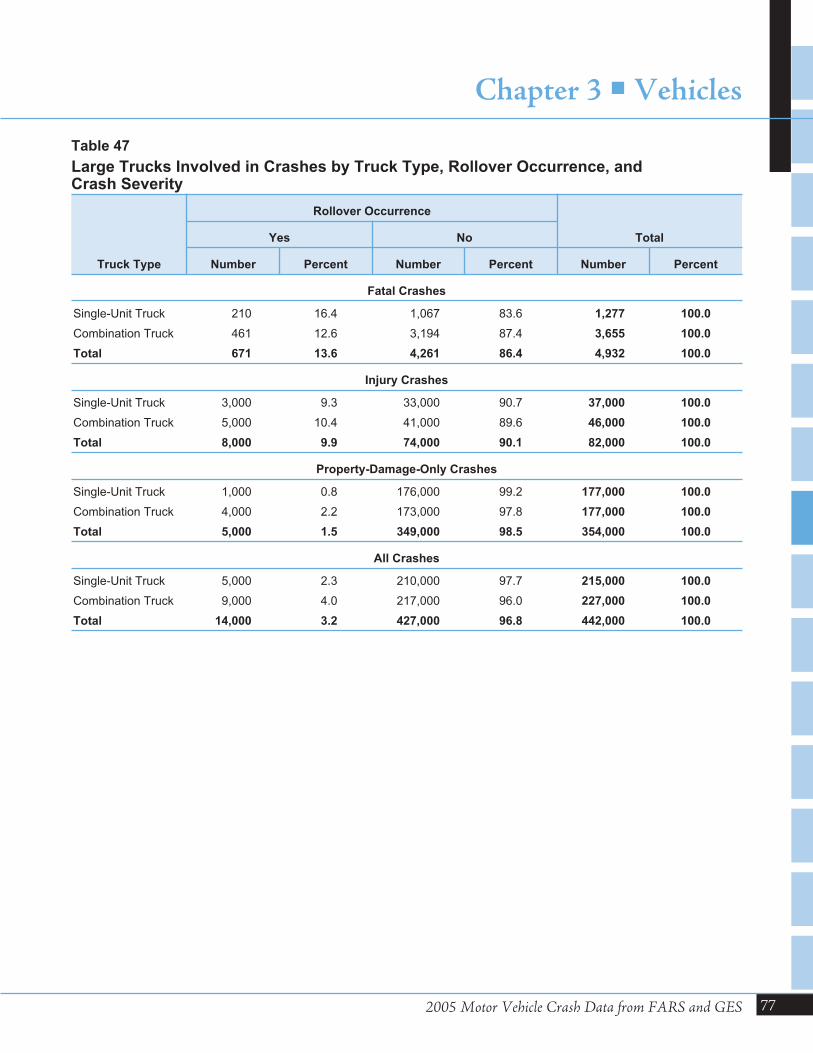
2005 Motor Vehicle Crash Data from FARS and GES
Chapter 3 �Vehicles
77
Truck Type
Rollover Occurrence
TotalYes No
Number Percent Number Percent Number Percent
Fatal Crashes
Single-Unit Truck 210 16.4 1,067 83.6 1,277 100.0
Combination Truck 461 12.6 3,194 87.4 3,655 100.0
Total 671 13.6 4,261 86.4 4,932 100.0
Injury Crashes
Single-Unit Truck 3,000 9.3 33,000 90.7 37,000 100.0
Combination Truck 5,000 10.4 41,000 89.6 46,000 100.0
Total 8,000 9.9 74,000 90.1 82,000 100.0
Property-Damage-Only Crashes
Single-Unit Truck 1,000 0.8 176,000 99.2 177,000 100.0
Combination Truck 4,000 2.2 173,000 97.8 177,000 100.0
Total 5,000 1.5 349,000 98.5 354,000 100.0
All Crashes
Single-Unit Truck 5,000 2.3 210,000 97.7 215,000 100.0
Combination Truck 9,000 4.0 217,000 96.0 227,000 100.0
Total 14,000 3.2 427,000 96.8 442,000 100.0
Table 47
Large Trucks Involved in Crashes by Truck Type, Rollover Occurrence, andCrash Severity
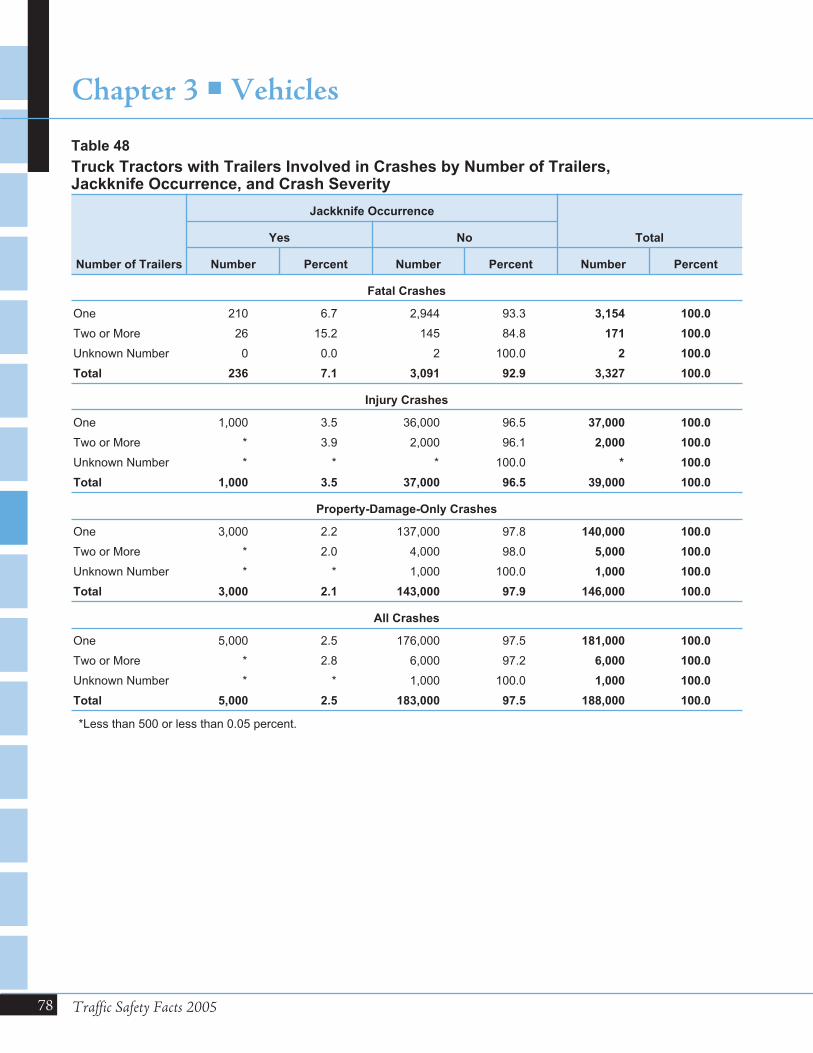
78 Traffic Safety Facts 2005
Chapter 3 �Vehicles
Number of Trailers
Jackknife Occurrence
TotalYes No
Number Percent Number Percent Number Percent
Fatal Crashes
One 210 6.7 2,944 93.3 3,154 100.0
Two or More 26 15.2 145 84.8 171 100.0
Unknown Number 0 0.0 2 100.0 2 100.0
Total 236 7.1 3,091 92.9 3,327 100.0
Injury Crashes
One 1,000 3.5 36,000 96.5 37,000 100.0
Two or More * 3.9 2,000 96.1 2,000 100.0
Unknown Number * * * 100.0 * 100.0
Total 1,000 3.5 37,000 96.5 39,000 100.0
Property-Damage-Only Crashes
One 3,000 2.2 137,000 97.8 140,000 100.0
Two or More * 2.0 4,000 98.0 5,000 100.0
Unknown Number * * 1,000 100.0 1,000 100.0
Total 3,000 2.1 143,000 97.9 146,000 100.0
All Crashes
One 5,000 2.5 176,000 97.5 181,000 100.0
Two or More * 2.8 6,000 97.2 6,000 100.0
Unknown Number * * 1,000 100.0 1,000 100.0
Total 5,000 2.5 183,000 97.5 188,000 100.0
*Less than 500 or less than 0.05 percent.
Table 48
Truck Tractors with Trailers Involved in Crashes by Number of Trailers,Jackknife Occurrence, and Crash Severity

2005 Motor Vehicle Crash Data from FARS and GES
Chapter 3 �Vehicles
79
Most Harmful
Event
Crash Severity
TotalFatal Injury Property Damage Only
Number Percent Number Percent Number Percent Number Percent
Collision with
Motor Vehicle in
Transport by Initial
Point of Impact:
Front 1,818 39.1 19,000 23.9 7,000 36.2 28,000 26.8
Left Side 180 3.9 6,000 7.1 1,000 6.5 7,000 6.9
Right Side 129 2.8 4,000 5.5 2,000 11.6 7,000 6.5
Rear 159 3.4 4,000 4.9 3,000 19.1 8,000 7.3
Other/Unknown 61 1.3 * 0.2 * * * 0.2
Subtotal 2,347 50.4 34,000 41.7 13,000 73.3 49,000 47.6
Collision with
Fixed Object 1,210 26.0 7,000 8.2 1,000 6.7 9,000 8.8
Collision with
Object Not Fixed:
Nonoccupant 34 0.7 * 0.5 * * * 0.4
Other 202 4.3 4,000 4.9 1,000 3.3 5,000 4.6
Subtotal 236 5.1 4,000 5.4 1,000 3.3 5,000 5.0
Noncollision 858 18.4 36,000 44.7 3,000 16.7 40,000 38.6
Total **4,655 100.0 80,000 100.0 18,000 100.0 103,000 100.0
*Less than 500 or less than 0.05 percent.
**Includes 4 motorcycles involved in fatal crashes with unknown most harmful event.
Table 49
Motorcycles Involved in Crashes by Most Harmful Event and Crash Severity
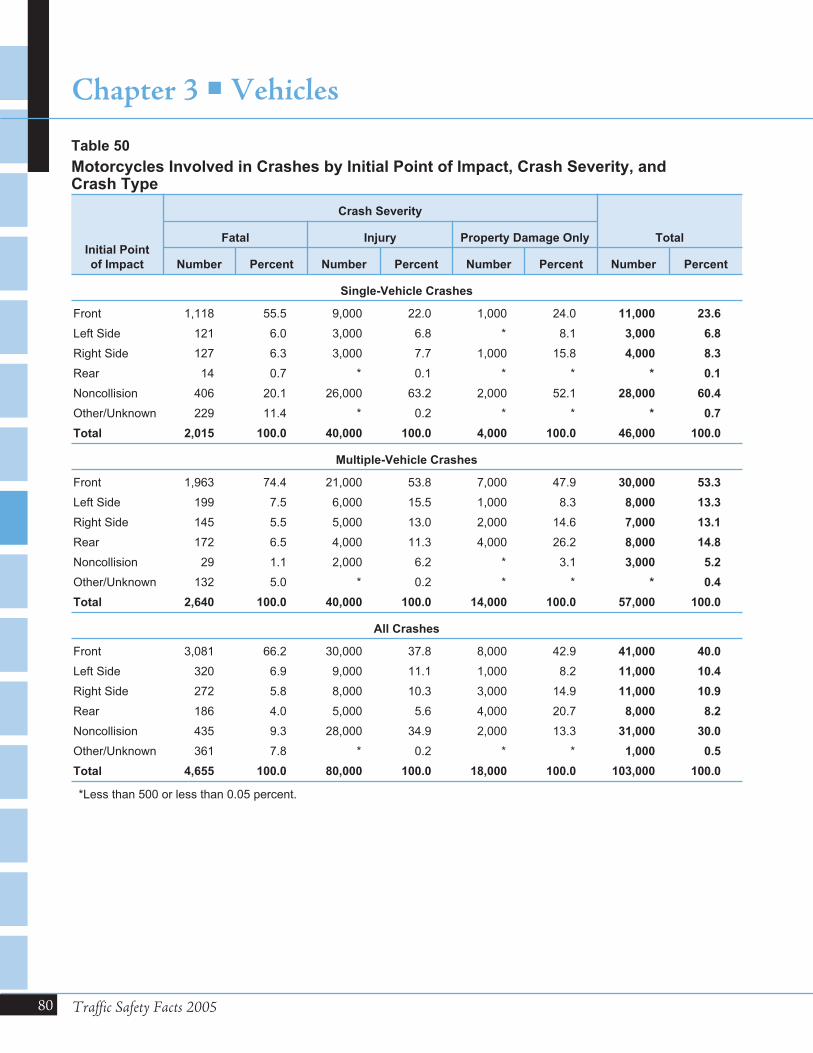
80 Traffic Safety Facts 2005
Chapter 3 �Vehicles
Initial Point
of Impact
Crash Severity
TotalFatal Injury Property Damage Only
Number Percent Number Percent Number Percent Number Percent
Single-Vehicle Crashes
Front 1,118 55.5 9,000 22.0 1,000 24.0 11,000 23.6
Left Side 121 6.0 3,000 6.8 * 8.1 3,000 6.8
Right Side 127 6.3 3,000 7.7 1,000 15.8 4,000 8.3
Rear 14 0.7 * 0.1 * * * 0.1
Noncollision 406 20.1 26,000 63.2 2,000 52.1 28,000 60.4
Other/Unknown 229 11.4 * 0.2 * * * 0.7
Total 2,015 100.0 40,000 100.0 4,000 100.0 46,000 100.0
Multiple-Vehicle Crashes
Front 1,963 74.4 21,000 53.8 7,000 47.9 30,000 53.3
Left Side 199 7.5 6,000 15.5 1,000 8.3 8,000 13.3
Right Side 145 5.5 5,000 13.0 2,000 14.6 7,000 13.1
Rear 172 6.5 4,000 11.3 4,000 26.2 8,000 14.8
Noncollision 29 1.1 2,000 6.2 * 3.1 3,000 5.2
Other/Unknown 132 5.0 * 0.2 * * * 0.4
Total 2,640 100.0 40,000 100.0 14,000 100.0 57,000 100.0
All Crashes
Front 3,081 66.2 30,000 37.8 8,000 42.9 41,000 40.0
Left Side 320 6.9 9,000 11.1 1,000 8.2 11,000 10.4
Right Side 272 5.8 8,000 10.3 3,000 14.9 11,000 10.9
Rear 186 4.0 5,000 5.6 4,000 20.7 8,000 8.2
Noncollision 435 9.3 28,000 34.9 2,000 13.3 31,000 30.0
Other/Unknown 361 7.8 * 0.2 * * 1,000 0.5
Total 4,655 100.0 80,000 100.0 18,000 100.0 103,000 100.0
*Less than 500 or less than 0.05 percent.
Table 50
Motorcycles Involved in Crashes by Initial Point of Impact, Crash Severity, andCrash Type
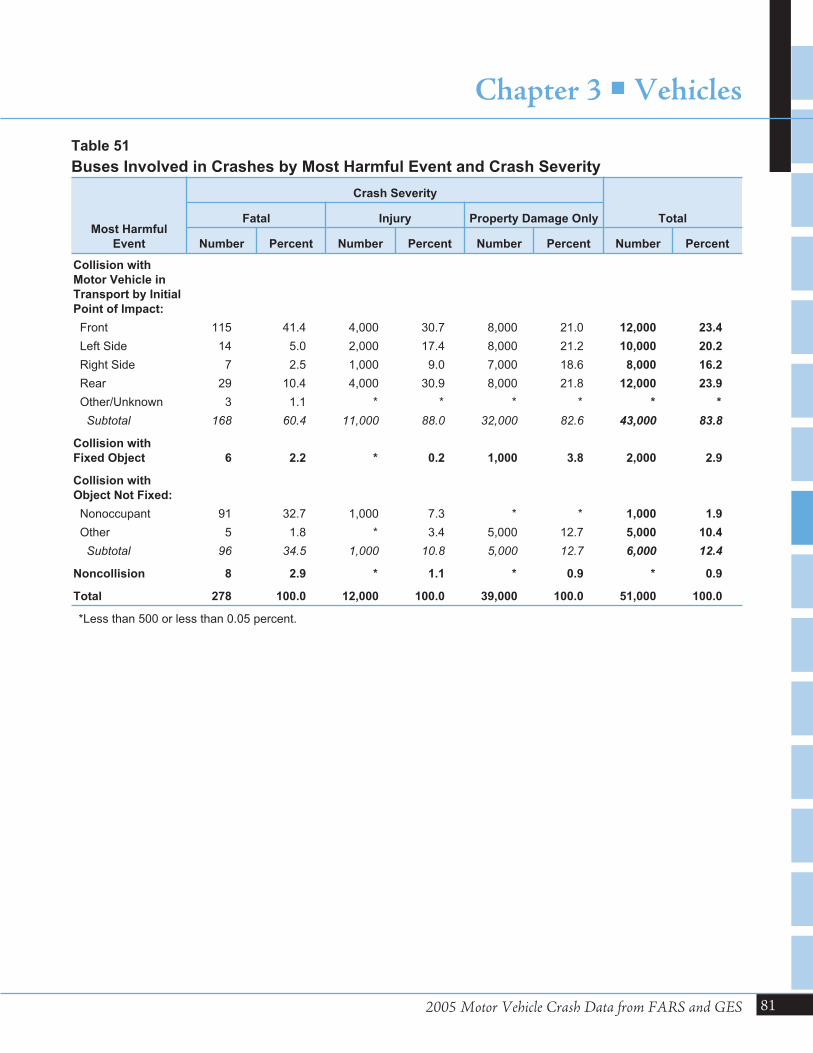
2005 Motor Vehicle Crash Data from FARS and GES
Chapter 3 �Vehicles
81
Most Harmful
Event
Crash Severity
TotalFatal Injury Property Damage Only
Number Percent Number Percent Number Percent Number Percent
Collision with
Motor Vehicle in
Transport by Initial
Point of Impact:
Front 115 41.4 4,000 30.7 8,000 21.0 12,000 23.4
Left Side 14 5.0 2,000 17.4 8,000 21.2 10,000 20.2
Right Side 7 2.5 1,000 9.0 7,000 18.6 8,000 16.2
Rear 29 10.4 4,000 30.9 8,000 21.8 12,000 23.9
Other/Unknown 3 1.1 * * * * * *
Subtotal 168 60.4 11,000 88.0 32,000 82.6 43,000 83.8
Collision with
Fixed Object 6 2.2 * 0.2 1,000 3.8 2,000 2.9
Collision with
Object Not Fixed:
Nonoccupant 91 32.7 1,000 7.3 * * 1,000 1.9
Other 5 1.8 * 3.4 5,000 12.7 5,000 10.4
Subtotal 96 34.5 1,000 10.8 5,000 12.7 6,000 12.4
Noncollision 8 2.9 * 1.1 * 0.9 * 0.9
Total 278 100.0 12,000 100.0 39,000 100.0 51,000 100.0
*Less than 500 or less than 0.05 percent.
Table 51
Buses Involved in Crashes by Most Harmful Event and Crash Severity
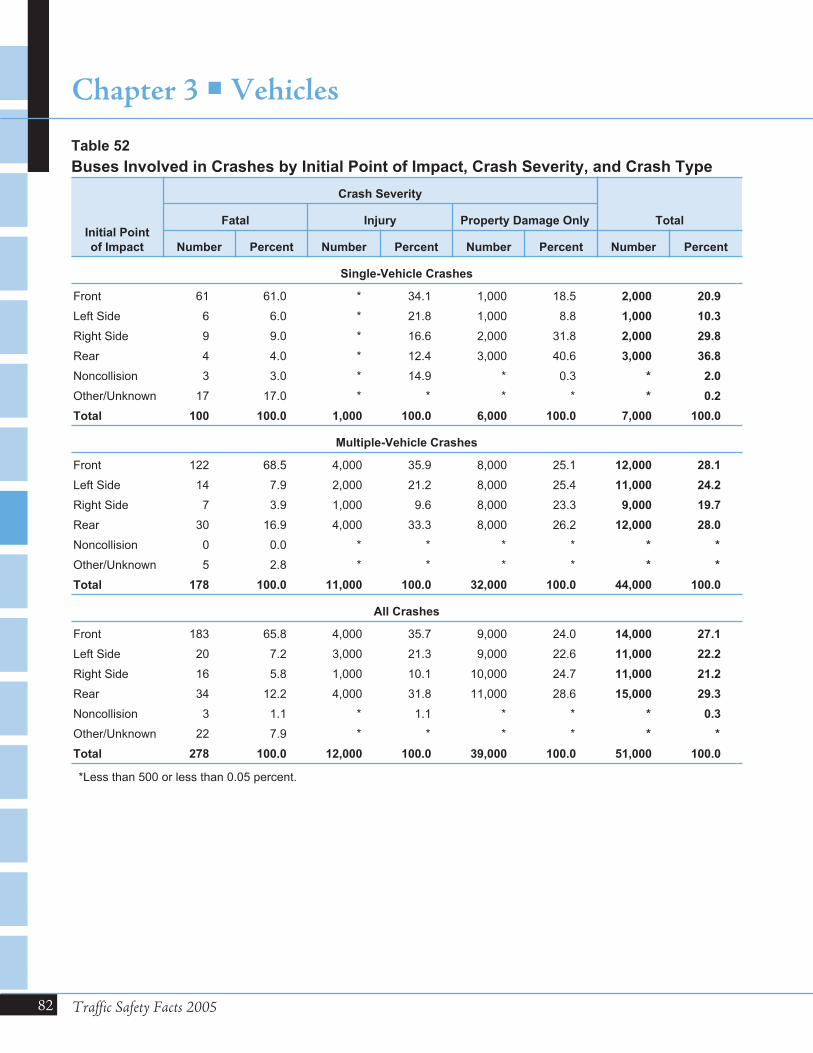
82 Traffic Safety Facts 2005
Chapter 3 �Vehicles
Initial Point
of Impact
Crash Severity
TotalFatal Injury Property Damage Only
Number Percent Number Percent Number Percent Number Percent
Single-Vehicle Crashes
Front 61 61.0 * 34.1 1,000 18.5 2,000 20.9
Left Side 6 6.0 * 21.8 1,000 8.8 1,000 10.3
Right Side 9 9.0 * 16.6 2,000 31.8 2,000 29.8
Rear 4 4.0 * 12.4 3,000 40.6 3,000 36.8
Noncollision 3 3.0 * 14.9 * 0.3 * 2.0
Other/Unknown 17 17.0 * * * * * 0.2
Total 100 100.0 1,000 100.0 6,000 100.0 7,000 100.0
Multiple-Vehicle Crashes
Front 122 68.5 4,000 35.9 8,000 25.1 12,000 28.1
Left Side 14 7.9 2,000 21.2 8,000 25.4 11,000 24.2
Right Side 7 3.9 1,000 9.6 8,000 23.3 9,000 19.7
Rear 30 16.9 4,000 33.3 8,000 26.2 12,000 28.0
Noncollision 0 0.0 * * * * * *
Other/Unknown 5 2.8 * * * * * *
Total 178 100.0 11,000 100.0 32,000 100.0 44,000 100.0
All Crashes
Front 183 65.8 4,000 35.7 9,000 24.0 14,000 27.1
Left Side 20 7.2 3,000 21.3 9,000 22.6 11,000 22.2
Right Side 16 5.8 1,000 10.1 10,000 24.7 11,000 21.2
Rear 34 12.2 4,000 31.8 11,000 28.6 15,000 29.3
Noncollision 3 1.1 * 1.1 * * * 0.3
Other/Unknown 22 7.9 * * * * * *
Total 278 100.0 12,000 100.0 39,000 100.0 51,000 100.0
*Less than 500 or less than 0.05 percent.
Table 52
Buses Involved in Crashes by Initial Point of Impact, Crash Severity, and Crash Type

Chapter 4
PEOPLE

This chapter presents statistics about the Drivers, Passengers, Pedestrians, and Pedalcyclists involved inpolice-reported motor vehicle crashes in 2005. The tables and figures are presented in nine groups: all killed orinjured persons, crash-involved drivers, occupants (drivers and passengers), alcohol, restraints, motorcycle related,school bus related, pedestrians, and pedalcyclists. Below are some of the statistics you will find in this section:
O A total of 43,443 people lost their lives in motor vehicle crashes in 2005. Another 2.7 million people wereinjured.
O The majority of persons killed or injured in traffic crashes were drivers (64 percent), followed by passengers(28 percent), motorcycle riders (3 percent), pedestrians (3 percent), and pedalcyclists (2 percent).
O Per 100,000 population, persons 21 to 24 years old had the highest fatality rate, and persons 16 to 20 years oldhad the highest injury rate. Children under 5 years old had the lowest fatality rate and the lowest injury rate per100,000 population.
O For every age group, the fatality rate per 100,000 population was lower for females than for males. The injuryrate based on population was higher for females than for males in every age group, except for people under 5years old and people over 65 years old.
O Of the persons who were killed in traffic crashes in 2005, 39 percent died in alcohol-related crashes.Nine percent of the injured persons received their injuries in alcohol-related crashes.
2005 Motor Vehicle Crash Data from FARS and GES
CHAPTER 4 � PEOPLE
85
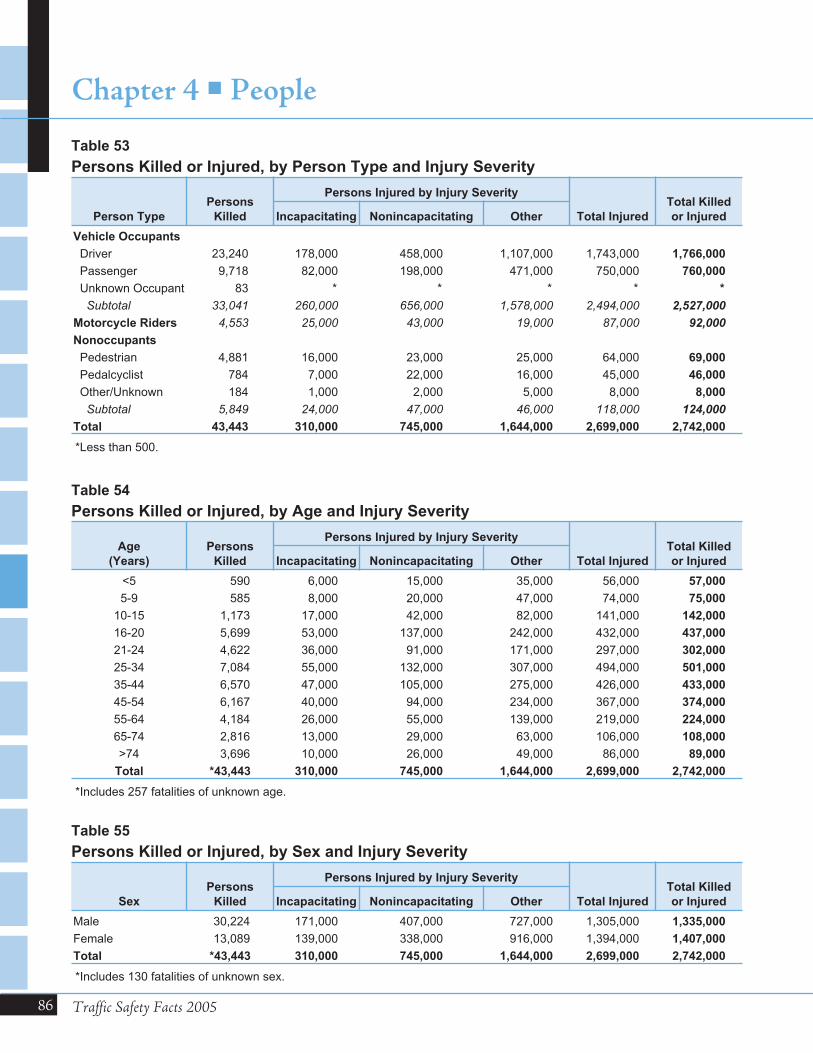
86 Traffic Safety Facts 2005
Chapter 4 � People
Person Type
Persons
Killed
Persons Injured by Injury Severity
Total Injured
Total Killed
or InjuredIncapacitating Nonincapacitating Other
Vehicle Occupants
Driver 23,240 178,000 458,000 1,107,000 1,743,000 1,766,000
Passenger 9,718 82,000 198,000 471,000 750,000 760,000
Unknown Occupant 83 * * * * *
Subtotal 33,041 260,000 656,000 1,578,000 2,494,000 2,527,000
Motorcycle Riders 4,553 25,000 43,000 19,000 87,000 92,000
Nonoccupants
Pedestrian 4,881 16,000 23,000 25,000 64,000 69,000
Pedalcyclist 784 7,000 22,000 16,000 45,000 46,000
Other/Unknown 184 1,000 2,000 5,000 8,000 8,000
Subtotal 5,849 24,000 47,000 46,000 118,000 124,000
Total 43,443 310,000 745,000 1,644,000 2,699,000 2,742,000
*Less than 500.
Table 53
Persons Killed or Injured, by Person Type and Injury Severity
Age
(Years)
Persons
Killed
Persons Injured by Injury Severity
Total Injured
Total Killed
or InjuredIncapacitating Nonincapacitating Other
<5 590 6,000 15,000 35,000 56,000 57,000
5-9 585 8,000 20,000 47,000 74,000 75,000
10-15 1,173 17,000 42,000 82,000 141,000 142,000
16-20 5,699 53,000 137,000 242,000 432,000 437,000
21-24 4,622 36,000 91,000 171,000 297,000 302,000
25-34 7,084 55,000 132,000 307,000 494,000 501,000
35-44 6,570 47,000 105,000 275,000 426,000 433,000
45-54 6,167 40,000 94,000 234,000 367,000 374,000
55-64 4,184 26,000 55,000 139,000 219,000 224,000
65-74 2,816 13,000 29,000 63,000 106,000 108,000
>74 3,696 10,000 26,000 49,000 86,000 89,000
Total *43,443 310,000 745,000 1,644,000 2,699,000 2,742,000
*Includes 257 fatalities of unknown age.
Table 54
Persons Killed or Injured, by Age and Injury Severity
Sex
Persons
Killed
Persons Injured by Injury Severity
Total Injured
Total Killed
or InjuredIncapacitating Nonincapacitating Other
Male 30,224 171,000 407,000 727,000 1,305,000 1,335,000
Female 13,089 139,000 338,000 916,000 1,394,000 1,407,000
Total *43,443 310,000 745,000 1,644,000 2,699,000 2,742,000
*Includes 130 fatalities of unknown sex.
Table 55
Persons Killed or Injured, by Sex and Injury Severity
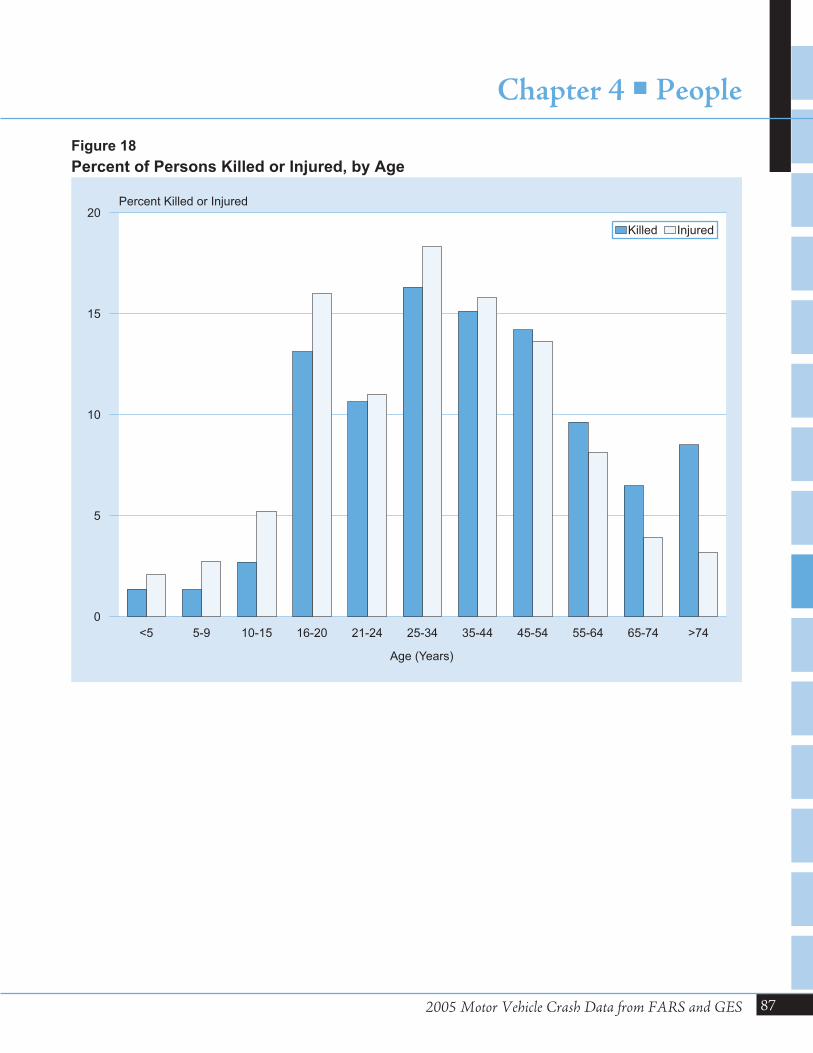
2005 Motor Vehicle Crash Data from FARS and GES
Chapter 4 � People
87
<5 5-9 10-15 16-20 21-24 25-34 35-44 45-54 55-64 65-74 >74
Age (Years)
0
5
10
15
20Percent Killed or Injured
Killed Injured
Figure 18
Percent of Persons Killed or Injured, by Age
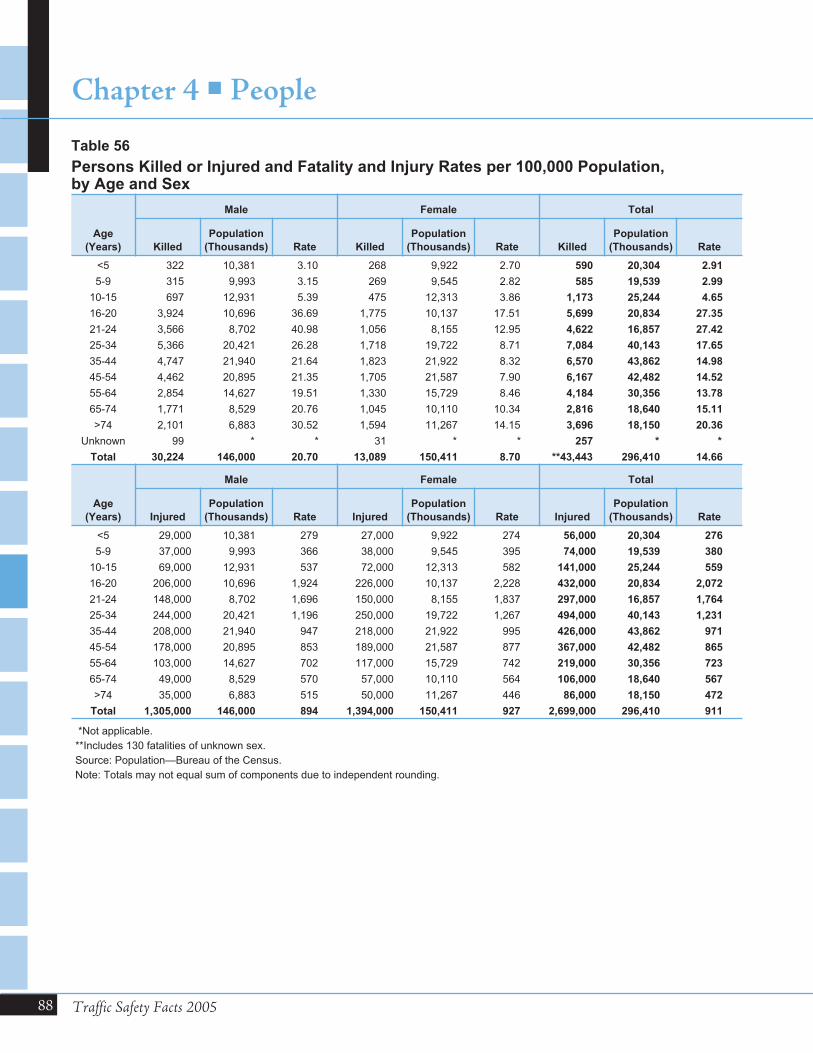
88 Traffic Safety Facts 2005
Chapter 4 � People
Age
(Years)
Male Female Total
Killed
Population
(Thousands) Rate Killed
Population
(Thousands) Rate Killed
Population
(Thousands) Rate
<5 322 10,381 3.10 268 9,922 2.70 590 20,304 2.91
5-9 315 9,993 3.15 269 9,545 2.82 585 19,539 2.99
10-15 697 12,931 5.39 475 12,313 3.86 1,173 25,244 4.65
16-20 3,924 10,696 36.69 1,775 10,137 17.51 5,699 20,834 27.35
21-24 3,566 8,702 40.98 1,056 8,155 12.95 4,622 16,857 27.42
25-34 5,366 20,421 26.28 1,718 19,722 8.71 7,084 40,143 17.65
35-44 4,747 21,940 21.64 1,823 21,922 8.32 6,570 43,862 14.98
45-54 4,462 20,895 21.35 1,705 21,587 7.90 6,167 42,482 14.52
55-64 2,854 14,627 19.51 1,330 15,729 8.46 4,184 30,356 13.78
65-74 1,771 8,529 20.76 1,045 10,110 10.34 2,816 18,640 15.11
>74 2,101 6,883 30.52 1,594 11,267 14.15 3,696 18,150 20.36
Unknown 99 * * 31 * * 257 * *
Total 30,224 146,000 20.70 13,089 150,411 8.70 **43,443 296,410 14.66
Age
(Years)
Male Female Total
Injured
Population
(Thousands) Rate Injured
Population
(Thousands) Rate Injured
Population
(Thousands) Rate
<5 29,000 10,381 279 27,000 9,922 274 56,000 20,304 276
5-9 37,000 9,993 366 38,000 9,545 395 74,000 19,539 380
10-15 69,000 12,931 537 72,000 12,313 582 141,000 25,244 559
16-20 206,000 10,696 1,924 226,000 10,137 2,228 432,000 20,834 2,072
21-24 148,000 8,702 1,696 150,000 8,155 1,837 297,000 16,857 1,764
25-34 244,000 20,421 1,196 250,000 19,722 1,267 494,000 40,143 1,231
35-44 208,000 21,940 947 218,000 21,922 995 426,000 43,862 971
45-54 178,000 20,895 853 189,000 21,587 877 367,000 42,482 865
55-64 103,000 14,627 702 117,000 15,729 742 219,000 30,356 723
65-74 49,000 8,529 570 57,000 10,110 564 106,000 18,640 567
>74 35,000 6,883 515 50,000 11,267 446 86,000 18,150 472
Total 1,305,000 146,000 894 1,394,000 150,411 927 2,699,000 296,410 911
*Not applicable.
**Includes 130 fatalities of unknown sex.
Source: Population—Bureau of the Census.
Note: Totals may not equal sum of components due to independent rounding.
Table 56
Persons Killed or Injured and Fatality and Injury Rates per 100,000 Population,by Age and Sex
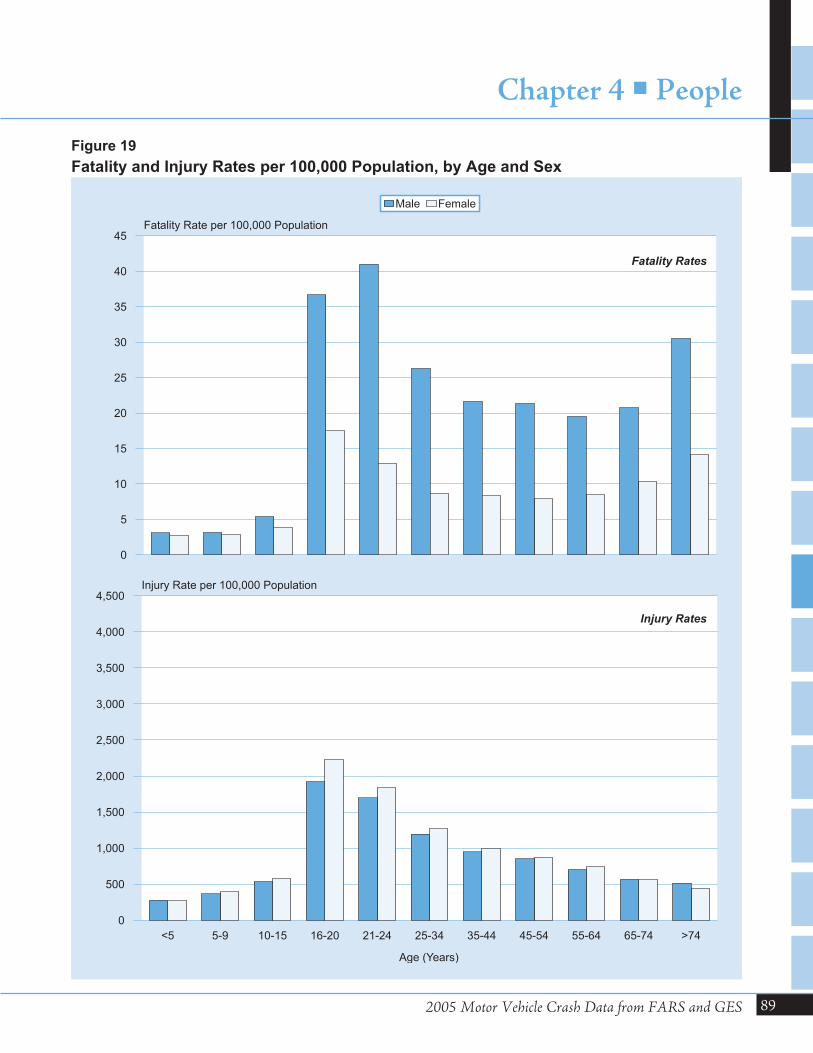
2005 Motor Vehicle Crash Data from FARS and GES
Chapter 4 � People
89
0
5
10
15
20
25
30
35
40
45Fatality Rate per 100,000 Population
Male Female
<5 5-9 10-15 16-20 21-24 25-34 35-44 45-54 55-64 65-74 >74
Age (Years)
0
500
1,000
1,500
2,000
2,500
3,000
3,500
4,000
4,500Injury Rate per 100,000 Population
Injury Rates
Fatality Rates
Figure 19
Fatality and Injury Rates per 100,000 Population, by Age and Sex
0
5
10
15
20
25
30
35
40
45Fatality Rate per 100,000 Population
Male Female
<5 5-9 10-15 16-20 21-24 25-34 35-44 45-54 55-64 65-74 >74
Age (Years)
0
500
1,000
1,500
2,000
2,500
3,000
3,500
4,000
4,500Injury Rate per 100,000 Population
Injury Rates
Fatality Rates
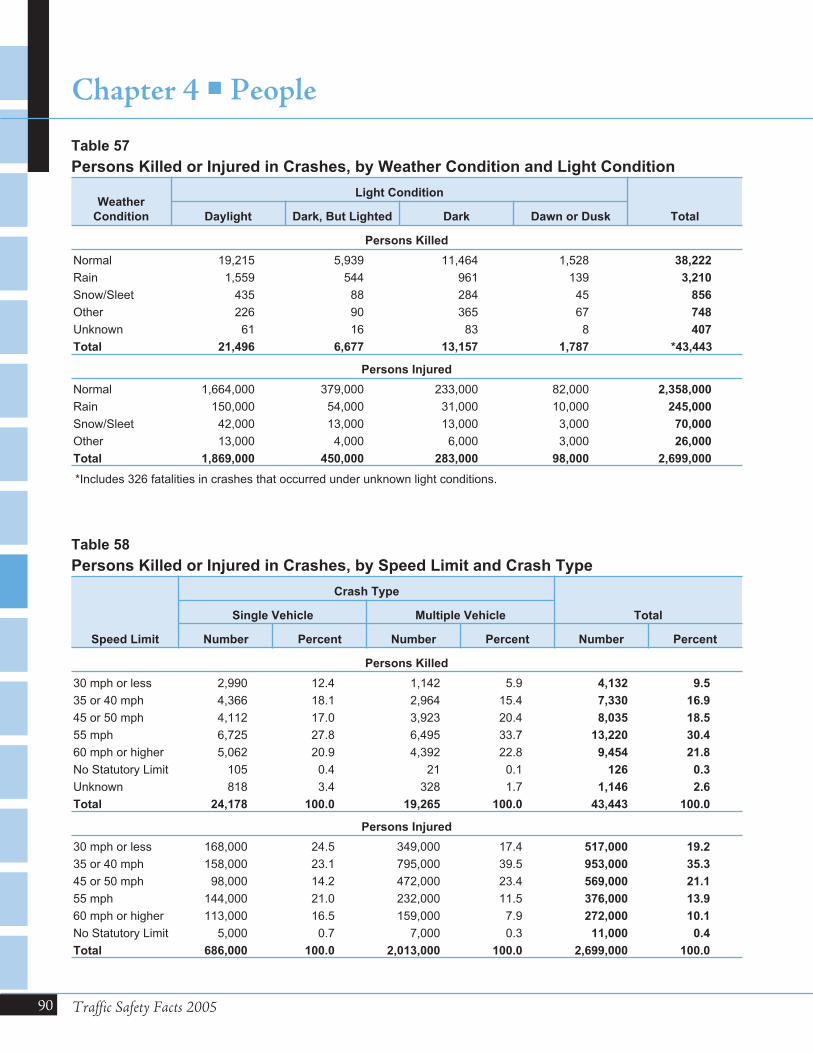
90 Traffic Safety Facts 2005
Chapter 4 � People
Weather
Condition
Light Condition
TotalDaylight Dark, But Lighted Dark Dawn or Dusk
Persons Killed
Normal 19,215 5,939 11,464 1,528 38,222
Rain 1,559 544 961 139 3,210
Snow/Sleet 435 88 284 45 856
Other 226 90 365 67 748
Unknown 61 16 83 8 407
Total 21,496 6,677 13,157 1,787 *43,443
Persons Injured
Normal 1,664,000 379,000 233,000 82,000 2,358,000
Rain 150,000 54,000 31,000 10,000 245,000
Snow/Sleet 42,000 13,000 13,000 3,000 70,000
Other 13,000 4,000 6,000 3,000 26,000
Total 1,869,000 450,000 283,000 98,000 2,699,000
*Includes 326 fatalities in crashes that occurred under unknown light conditions.
Table 57
Persons Killed or Injured in Crashes, by Weather Condition and Light Condition
Speed Limit
Crash Type
TotalSingle Vehicle Multiple Vehicle
Number Percent Number Percent Number Percent
Persons Killed
30 mph or less 2,990 12.4 1,142 5.9 4,132 9.5
35 or 40 mph 4,366 18.1 2,964 15.4 7,330 16.9
45 or 50 mph 4,112 17.0 3,923 20.4 8,035 18.5
55 mph 6,725 27.8 6,495 33.7 13,220 30.4
60 mph or higher 5,062 20.9 4,392 22.8 9,454 21.8
No Statutory Limit 105 0.4 21 0.1 126 0.3
Unknown 818 3.4 328 1.7 1,146 2.6
Total 24,178 100.0 19,265 100.0 43,443 100.0
Persons Injured
30 mph or less 168,000 24.5 349,000 17.4 517,000 19.2
35 or 40 mph 158,000 23.1 795,000 39.5 953,000 35.3
45 or 50 mph 98,000 14.2 472,000 23.4 569,000 21.1
55 mph 144,000 21.0 232,000 11.5 376,000 13.9
60 mph or higher 113,000 16.5 159,000 7.9 272,000 10.1
No Statutory Limit 5,000 0.7 7,000 0.3 11,000 0.4
Total 686,000 100.0 2,013,000 100.0 2,699,000 100.0
Table 58
Persons Killed or Injured in Crashes, by Speed Limit and Crash Type
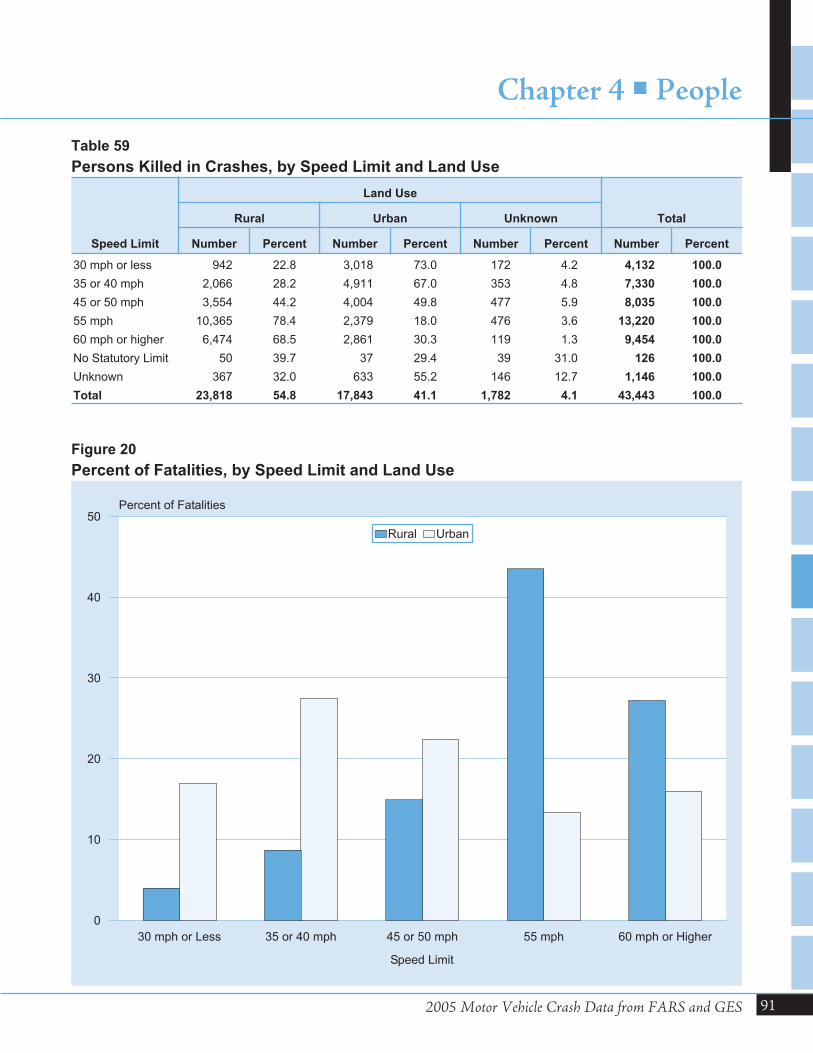
2005 Motor Vehicle Crash Data from FARS and GES
Chapter 4 � People
91
Speed Limit
Land Use
TotalRural Urban Unknown
Number Percent Number Percent Number Percent Number Percent
30 mph or less 942 22.8 3,018 73.0 172 4.2 4,132 100.0
35 or 40 mph 2,066 28.2 4,911 67.0 353 4.8 7,330 100.0
45 or 50 mph 3,554 44.2 4,004 49.8 477 5.9 8,035 100.0
55 mph 10,365 78.4 2,379 18.0 476 3.6 13,220 100.0
60 mph or higher 6,474 68.5 2,861 30.3 119 1.3 9,454 100.0
No Statutory Limit 50 39.7 37 29.4 39 31.0 126 100.0
Unknown 367 32.0 633 55.2 146 12.7 1,146 100.0
Total 23,818 54.8 17,843 41.1 1,782 4.1 43,443 100.0
Table 59
Persons Killed in Crashes, by Speed Limit and Land Use
30 mph or Less 35 or 40 mph 45 or 50 mph 55 mph 60 mph or Higher
Speed Limit
0
10
20
30
40
50Percent of Fatalities
Rural Urban
Figure 20
Percent of Fatalities, by Speed Limit and Land Use
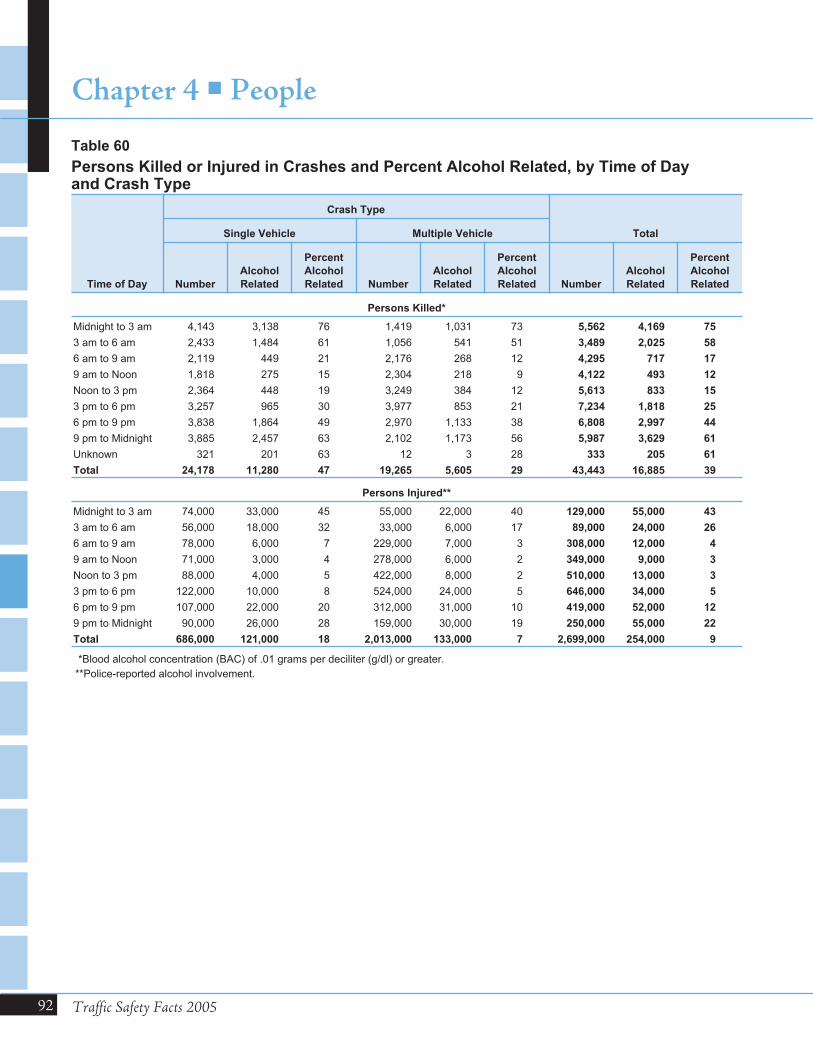
92 Traffic Safety Facts 2005
Chapter 4 � People
Time of Day
Crash Type
TotalSingle Vehicle Multiple Vehicle
Number
Alcohol
Related
Percent
Alcohol
Related Number
Alcohol
Related
Percent
Alcohol
Related Number
Alcohol
Related
Percent
Alcohol
Related
Persons Killed*
Midnight to 3 am 4,143 3,138 76 1,419 1,031 73 5,562 4,169 75
3 am to 6 am 2,433 1,484 61 1,056 541 51 3,489 2,025 58
6 am to 9 am 2,119 449 21 2,176 268 12 4,295 717 17
9 am to Noon 1,818 275 15 2,304 218 9 4,122 493 12
Noon to 3 pm 2,364 448 19 3,249 384 12 5,613 833 15
3 pm to 6 pm 3,257 965 30 3,977 853 21 7,234 1,818 25
6 pm to 9 pm 3,838 1,864 49 2,970 1,133 38 6,808 2,997 44
9 pm to Midnight 3,885 2,457 63 2,102 1,173 56 5,987 3,629 61
Unknown 321 201 63 12 3 28 333 205 61
Total 24,178 11,280 47 19,265 5,605 29 43,443 16,885 39
Persons Injured**
Midnight to 3 am 74,000 33,000 45 55,000 22,000 40 129,000 55,000 43
3 am to 6 am 56,000 18,000 32 33,000 6,000 17 89,000 24,000 26
6 am to 9 am 78,000 6,000 7 229,000 7,000 3 308,000 12,000 4
9 am to Noon 71,000 3,000 4 278,000 6,000 2 349,000 9,000 3
Noon to 3 pm 88,000 4,000 5 422,000 8,000 2 510,000 13,000 3
3 pm to 6 pm 122,000 10,000 8 524,000 24,000 5 646,000 34,000 5
6 pm to 9 pm 107,000 22,000 20 312,000 31,000 10 419,000 52,000 12
9 pm to Midnight 90,000 26,000 28 159,000 30,000 19 250,000 55,000 22
Total 686,000 121,000 18 2,013,000 133,000 7 2,699,000 254,000 9
*Blood alcohol concentration (BAC) of .01 grams per deciliter (g/dl) or greater.
**Police-reported alcohol involvement.
Table 60
Persons Killed or Injured in Crashes and Percent Alcohol Related, by Time of Dayand Crash Type
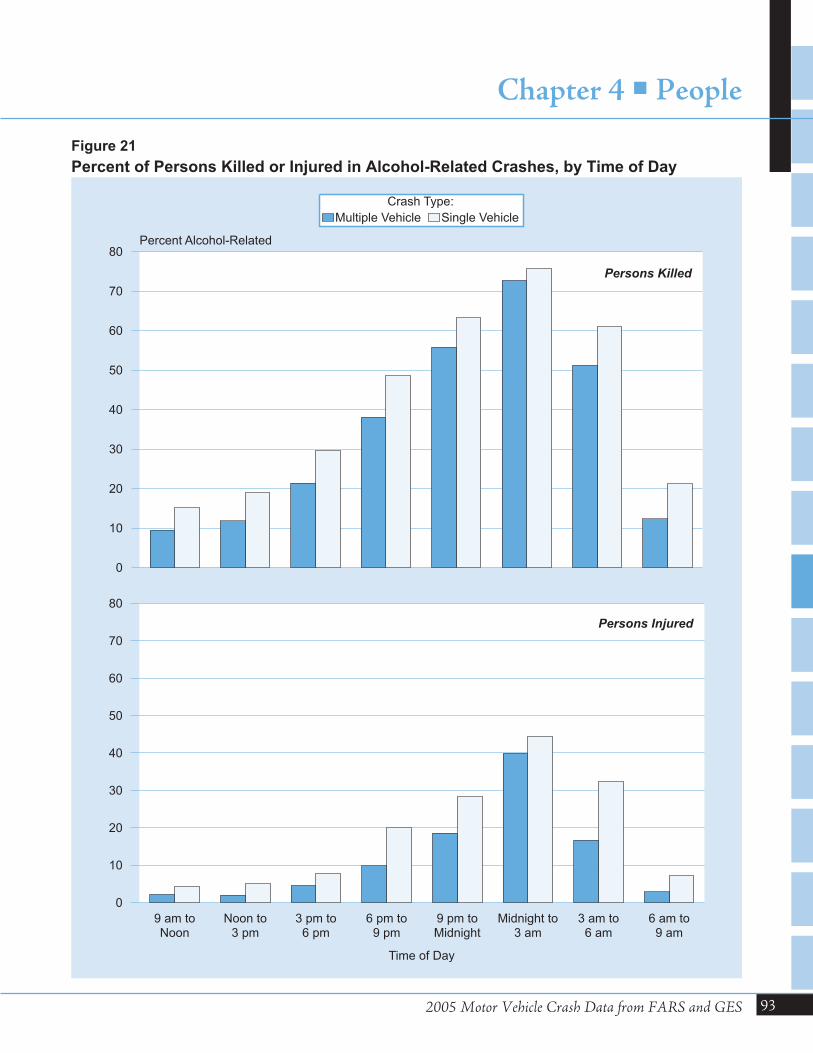
2005 Motor Vehicle Crash Data from FARS and GES
Chapter 4 � People
93
0
10
20
30
40
50
60
70
80Percent Alcohol-Related
Crash Type:
Multiple Vehicle Single Vehicle
9 am toNoon
Noon to3 pm
3 pm to6 pm
6 pm to9 pm
9 pm toMidnight
Midnight to3 am
3 am to6 am
6 am to9 am
Time of Day
0
10
20
30
40
50
60
70
80
Persons Injured
Persons Killed
Figure 21
Percent of Persons Killed or Injured in Alcohol-Related Crashes, by Time of Day
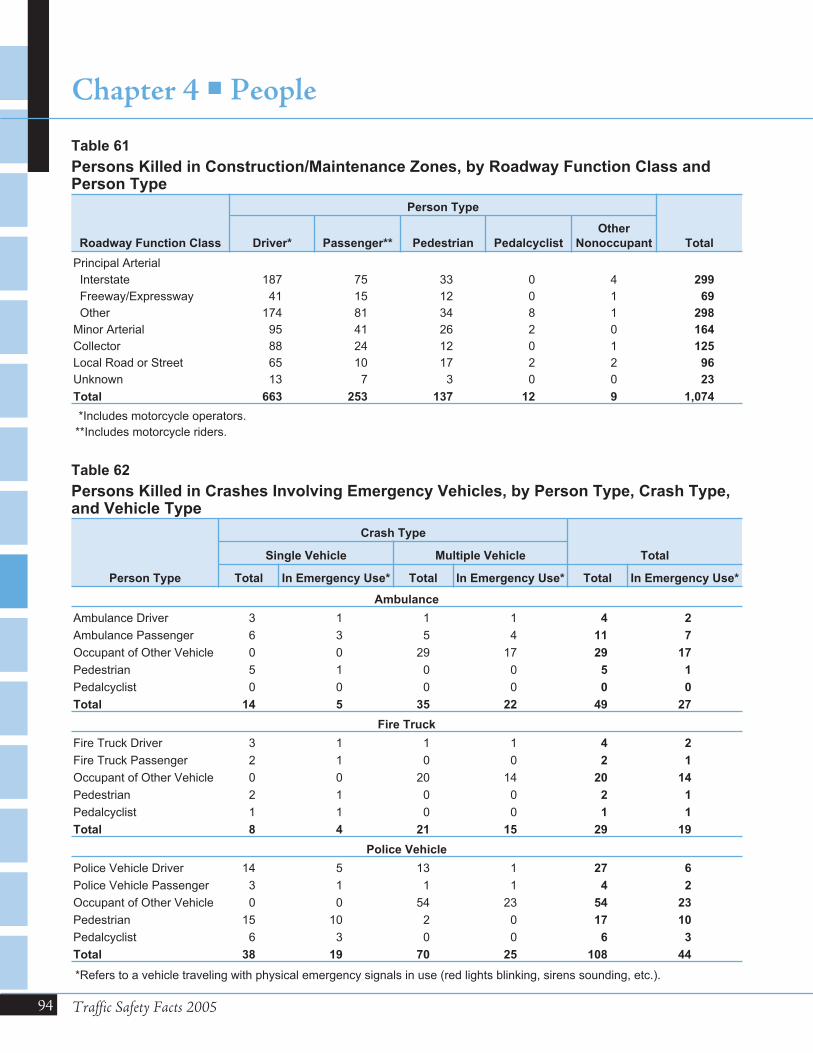
94 Traffic Safety Facts 2005
Chapter 4 � People
Roadway Function Class
Person Type
TotalDriver* Passenger** Pedestrian Pedalcyclist
Other
Nonoccupant
Principal Arterial
Interstate 187 75 33 0 4 299
Freeway/Expressway 41 15 12 0 1 69
Other 174 81 34 8 1 298
Minor Arterial 95 41 26 2 0 164
Collector 88 24 12 0 1 125
Local Road or Street 65 10 17 2 2 96
Unknown 13 7 3 0 0 23
Total 663 253 137 12 9 1,074
*Includes motorcycle operators.
**Includes motorcycle riders.
Table 61
Persons Killed in Construction/Maintenance Zones, by Roadway Function Class andPerson Type
Person Type
Crash Type
TotalSingle Vehicle Multiple Vehicle
Total In Emergency Use* Total In Emergency Use* Total In Emergency Use*
Ambulance
Ambulance Driver 3 1 1 1 4 2
Ambulance Passenger 6 3 5 4 11 7
Occupant of Other Vehicle 0 0 29 17 29 17
Pedestrian 5 1 0 0 5 1
Pedalcyclist 0 0 0 0 0 0
Total 14 5 35 22 49 27
Fire Truck
Fire Truck Driver 3 1 1 1 4 2
Fire Truck Passenger 2 1 0 0 2 1
Occupant of Other Vehicle 0 0 20 14 20 14
Pedestrian 2 1 0 0 2 1
Pedalcyclist 1 1 0 0 1 1
Total 8 4 21 15 29 19
Police Vehicle
Police Vehicle Driver 14 5 13 1 27 6
Police Vehicle Passenger 3 1 1 1 4 2
Occupant of Other Vehicle 0 0 54 23 54 23
Pedestrian 15 10 2 0 17 10
Pedalcyclist 6 3 0 0 6 3
Total 38 19 70 25 108 44
*Refers to a vehicle traveling with physical emergency signals in use (red lights blinking, sirens sounding, etc.).
Table 62
Persons Killed in Crashes Involving Emergency Vehicles, by Person Type, Crash Type,and Vehicle Type
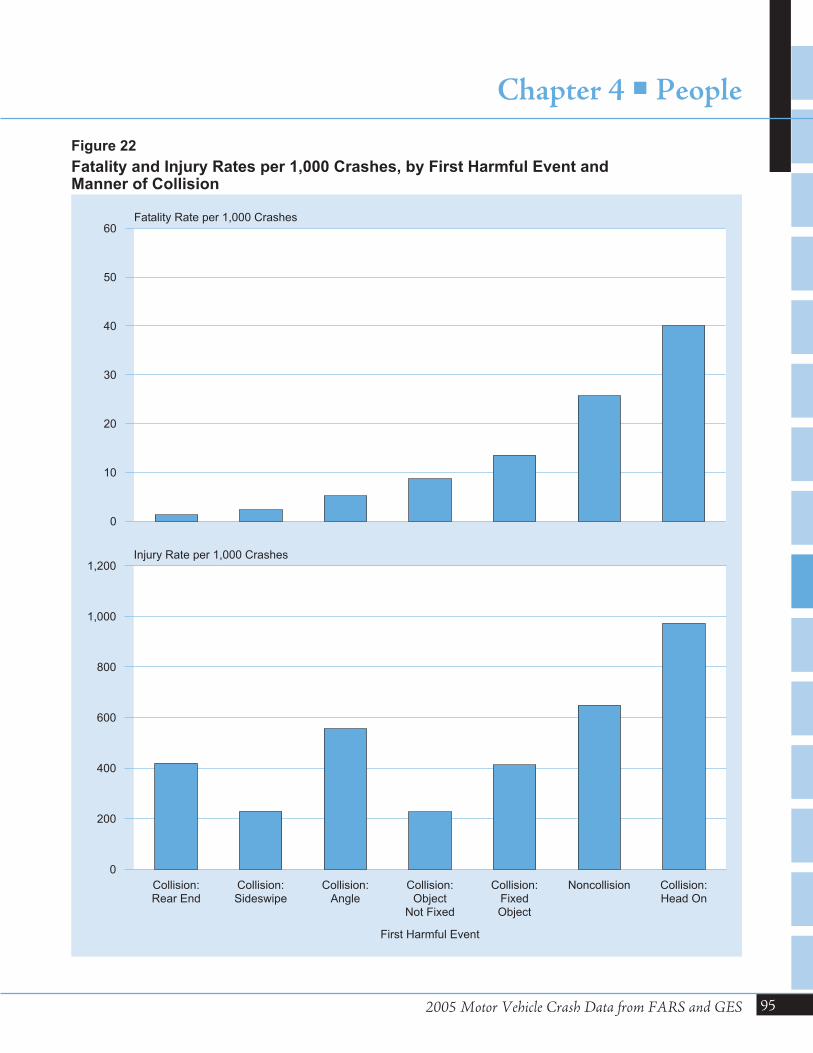
2005 Motor Vehicle Crash Data from FARS and GES
Chapter 4 � People
95
0
10
20
30
40
50
60Fatality Rate per 1,000 Crashes
Collision:Rear End
Collision:Sideswipe
Collision:Angle
Collision:Object
Not Fixed
Collision:FixedObject
Noncollision Collision:Head On
First Harmful Event
0
200
400
600
800
1,000
1,200Injury Rate per 1,000 Crashes
Figure 22
Fatality and Injury Rates per 1,000 Crashes, by First Harmful Event andManner of Collision
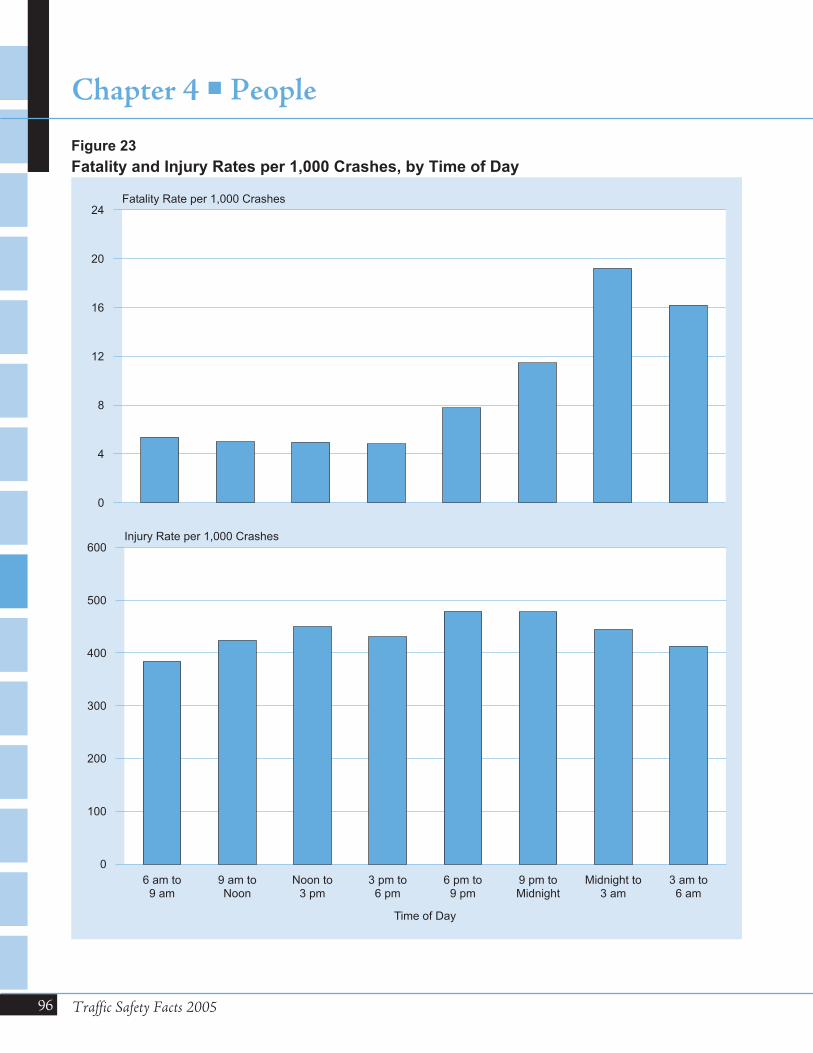
96 Traffic Safety Facts 2005
Chapter 4 � People
0
4
8
12
16
20
24Fatality Rate per 1,000 Crashes
6 am to9 am
9 am toNoon
Noon to3 pm
3 pm to6 pm
6 pm to9 pm
9 pm toMidnight
Midnight to3 am
3 am to6 am
Time of Day
0
100
200
300
400
500
600Injury Rate per 1,000 Crashes
Figure 23
Fatality and Injury Rates per 1,000 Crashes, by Time of Day
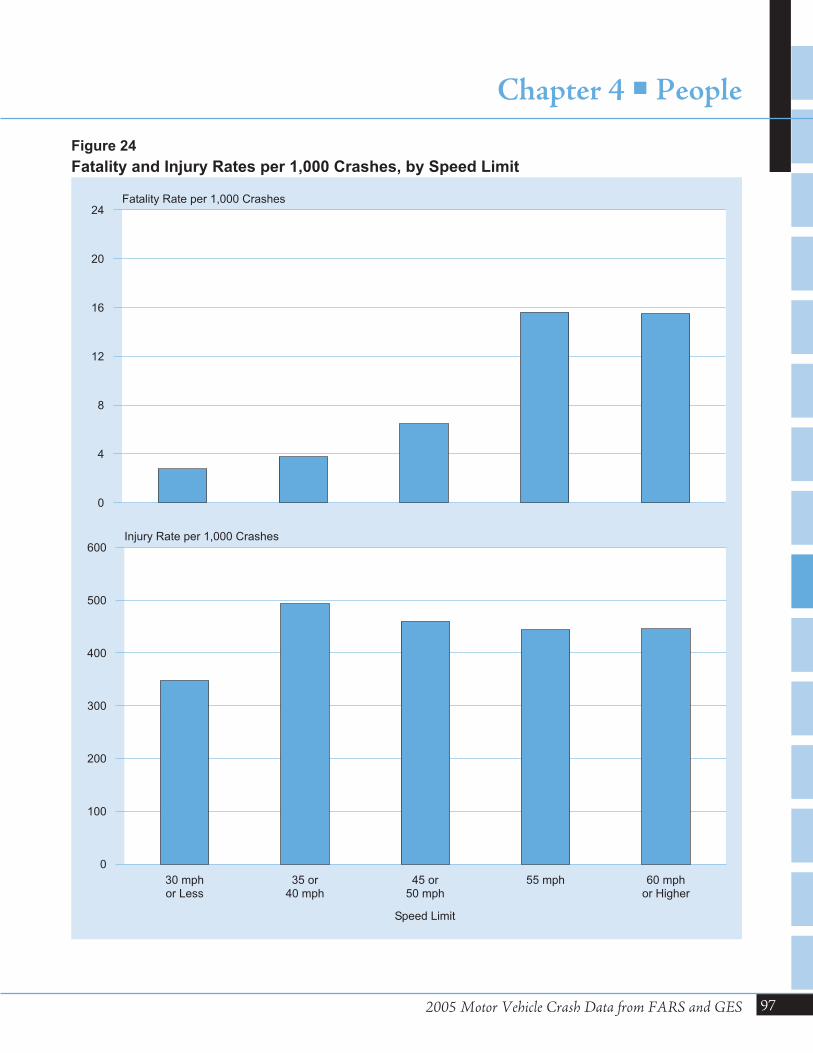
2005 Motor Vehicle Crash Data from FARS and GES
Chapter 4 � People
97
0
4
8
12
16
20
24Fatality Rate per 1,000 Crashes
30 mphor Less
35 or40 mph
45 or50 mph
55 mph 60 mphor Higher
Speed Limit
0
100
200
300
400
500
600Injury Rate per 1,000 Crashes
Figure 24
Fatality and Injury Rates per 1,000 Crashes, by Speed Limit
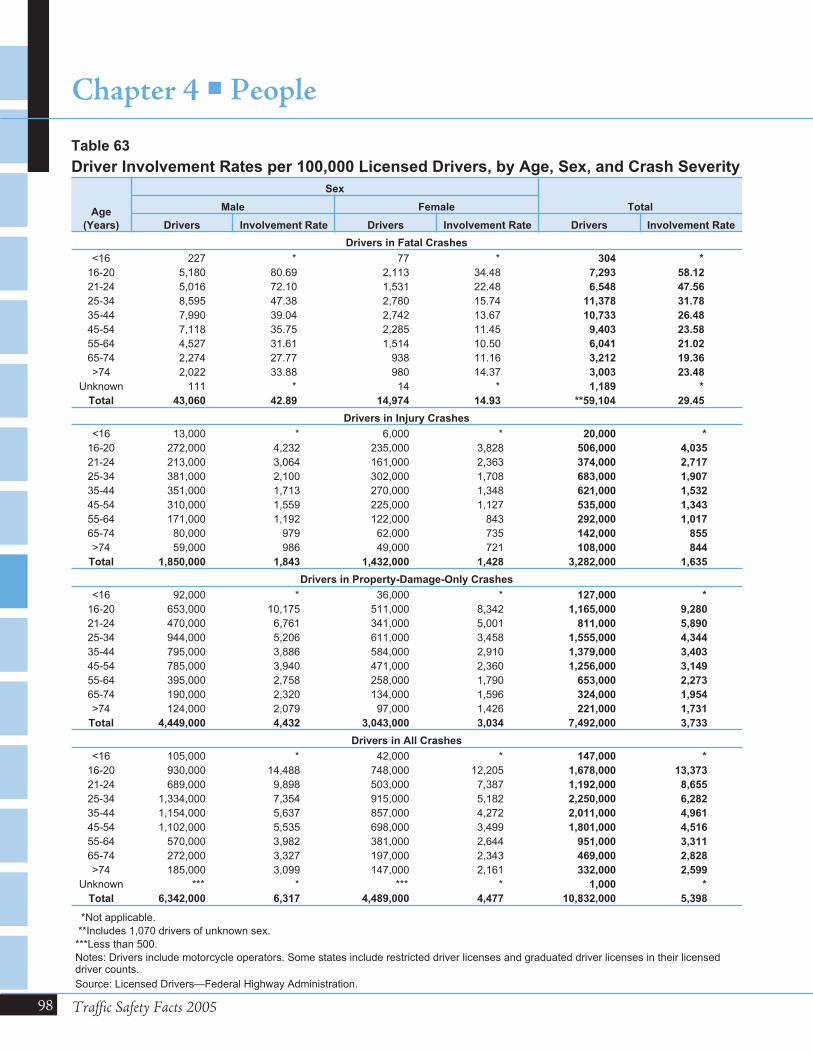
98 Traffic Safety Facts 2005
Chapter 4 � People
Age
(Years)
Sex
TotalMale Female
Drivers Involvement Rate Drivers Involvement Rate Drivers Involvement Rate
Drivers in Fatal Crashes
<16 227 * 77 * 304 *
16-20 5,180 80.69 2,113 34.48 7,293 58.12
21-24 5,016 72.10 1,531 22.48 6,548 47.56
25-34 8,595 47.38 2,780 15.74 11,378 31.78
35-44 7,990 39.04 2,742 13.67 10,733 26.48
45-54 7,118 35.75 2,285 11.45 9,403 23.58
55-64 4,527 31.61 1,514 10.50 6,041 21.02
65-74 2,274 27.77 938 11.16 3,212 19.36
>74 2,022 33.88 980 14.37 3,003 23.48
Unknown 111 * 14 * 1,189 *
Total 43,060 42.89 14,974 14.93 **59,104 29.45
Drivers in Injury Crashes
<16 13,000 * 6,000 * 20,000 *
16-20 272,000 4,232 235,000 3,828 506,000 4,035
21-24 213,000 3,064 161,000 2,363 374,000 2,717
25-34 381,000 2,100 302,000 1,708 683,000 1,907
35-44 351,000 1,713 270,000 1,348 621,000 1,532
45-54 310,000 1,559 225,000 1,127 535,000 1,343
55-64 171,000 1,192 122,000 843 292,000 1,017
65-74 80,000 979 62,000 735 142,000 855
>74 59,000 986 49,000 721 108,000 844
Total 1,850,000 1,843 1,432,000 1,428 3,282,000 1,635
Drivers in Property-Damage-Only Crashes
<16 92,000 * 36,000 * 127,000 *
16-20 653,000 10,175 511,000 8,342 1,165,000 9,280
21-24 470,000 6,761 341,000 5,001 811,000 5,890
25-34 944,000 5,206 611,000 3,458 1,555,000 4,344
35-44 795,000 3,886 584,000 2,910 1,379,000 3,403
45-54 785,000 3,940 471,000 2,360 1,256,000 3,149
55-64 395,000 2,758 258,000 1,790 653,000 2,273
65-74 190,000 2,320 134,000 1,596 324,000 1,954
>74 124,000 2,079 97,000 1,426 221,000 1,731
Total 4,449,000 4,432 3,043,000 3,034 7,492,000 3,733
Drivers in All Crashes
<16 105,000 * 42,000 * 147,000 *
16-20 930,000 14,488 748,000 12,205 1,678,000 13,373
21-24 689,000 9,898 503,000 7,387 1,192,000 8,655
25-34 1,334,000 7,354 915,000 5,182 2,250,000 6,282
35-44 1,154,000 5,637 857,000 4,272 2,011,000 4,961
45-54 1,102,000 5,535 698,000 3,499 1,801,000 4,516
55-64 570,000 3,982 381,000 2,644 951,000 3,311
65-74 272,000 3,327 197,000 2,343 469,000 2,828
>74 185,000 3,099 147,000 2,161 332,000 2,599
Unknown *** * *** * 1,000 *
Total 6,342,000 6,317 4,489,000 4,477 10,832,000 5,398
*Not applicable.
**Includes 1,070 drivers of unknown sex.
***Less than 500.
Notes: Drivers include motorcycle operators. Some states include restricted driver licenses and graduated driver licenses in their licenseddriver counts.
Source: Licensed Drivers—Federal Highway Administration.
Table 63
Driver Involvement Rates per 100,000 Licensed Drivers, by Age, Sex, and Crash Severity
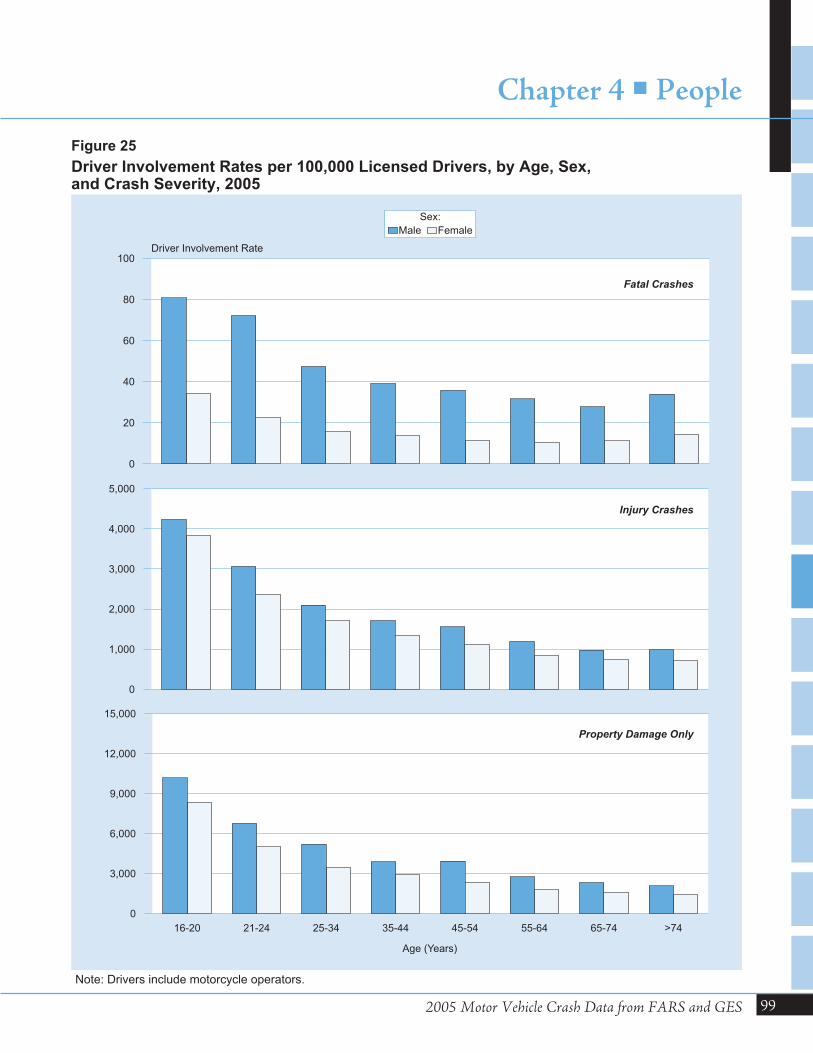
2005 Motor Vehicle Crash Data from FARS and GES
Chapter 4 � People
99
0
20
40
60
80
100Driver Involvement Rate
Sex:
Male Female
16-20 21-24 25-34 35-44 45-54 55-64 65-74 >74
Age (Years)
0
3,000
6,000
9,000
12,000
15,000
Fatal Crashes
0
1,000
2,000
3,000
4,000
5,000
Injury Crashes
Property Damage Only
Figure 25
Driver Involvement Rates per 100,000 Licensed Drivers, by Age, Sex,and Crash Severity, 2005
Note: Drivers include motorcycle operators.
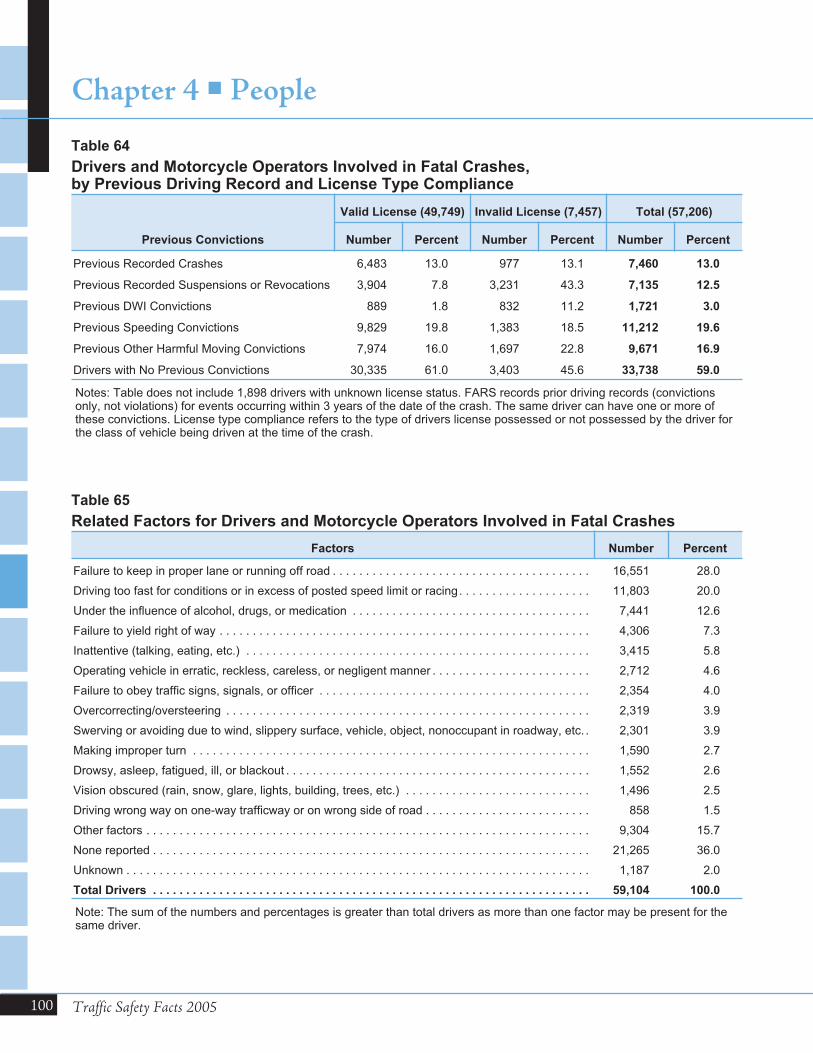
100 Traffic Safety Facts 2005
Chapter 4 � People
Previous Convictions
Valid License (49,749) Invalid License (7,457) Total (57,206)
Number Percent Number Percent Number Percent
Previous Recorded Crashes 6,483 13.0 977 13.1 7,460 13.0
Previous Recorded Suspensions or Revocations 3,904 7.8 3,231 43.3 7,135 12.5
Previous DWI Convictions 889 1.8 832 11.2 1,721 3.0
Previous Speeding Convictions 9,829 19.8 1,383 18.5 11,212 19.6
Previous Other Harmful Moving Convictions 7,974 16.0 1,697 22.8 9,671 16.9
Drivers with No Previous Convictions 30,335 61.0 3,403 45.6 33,738 59.0
Notes: Table does not include 1,898 drivers with unknown license status. FARS records prior driving records (convictionsonly, not violations) for events occurring within 3 years of the date of the crash. The same driver can have one or more ofthese convictions. License type compliance refers to the type of drivers license possessed or not possessed by the driver forthe class of vehicle being driven at the time of the crash.
Table 64
Drivers and Motorcycle Operators Involved in Fatal Crashes,by Previous Driving Record and License Type Compliance
Factors Number Percent
Failure to keep in proper lane or running off road . . . . . . . . . . . . . . . . . . . . . . . . . . . . . . . . . . . . . . . 16,551 28.0
Driving too fast for conditions or in excess of posted speed limit or racing. . . . . . . . . . . . . . . . . . . . 11,803 20.0
Under the influence of alcohol, drugs, or medication . . . . . . . . . . . . . . . . . . . . . . . . . . . . . . . . . . . . 7,441 12.6
Failure to yield right of way . . . . . . . . . . . . . . . . . . . . . . . . . . . . . . . . . . . . . . . . . . . . . . . . . . . . . . . . 4,306 7.3
Inattentive (talking, eating, etc.) . . . . . . . . . . . . . . . . . . . . . . . . . . . . . . . . . . . . . . . . . . . . . . . . . . . . 3,415 5.8
Operating vehicle in erratic, reckless, careless, or negligent manner . . . . . . . . . . . . . . . . . . . . . . . . 2,712 4.6
Failure to obey traffic signs, signals, or officer . . . . . . . . . . . . . . . . . . . . . . . . . . . . . . . . . . . . . . . . . 2,354 4.0
Overcorrecting/oversteering . . . . . . . . . . . . . . . . . . . . . . . . . . . . . . . . . . . . . . . . . . . . . . . . . . . . . . . 2,319 3.9
Swerving or avoiding due to wind, slippery surface, vehicle, object, nonoccupant in roadway, etc. . 2,301 3.9
Making improper turn . . . . . . . . . . . . . . . . . . . . . . . . . . . . . . . . . . . . . . . . . . . . . . . . . . . . . . . . . . . . 1,590 2.7
Drowsy, asleep, fatigued, ill, or blackout . . . . . . . . . . . . . . . . . . . . . . . . . . . . . . . . . . . . . . . . . . . . . . 1,552 2.6
Vision obscured (rain, snow, glare, lights, building, trees, etc.) . . . . . . . . . . . . . . . . . . . . . . . . . . . . 1,496 2.5
Driving wrong way on one-way trafficway or on wrong side of road . . . . . . . . . . . . . . . . . . . . . . . . . 858 1.5
Other factors . . . . . . . . . . . . . . . . . . . . . . . . . . . . . . . . . . . . . . . . . . . . . . . . . . . . . . . . . . . . . . . . . . . 9,304 15.7
None reported . . . . . . . . . . . . . . . . . . . . . . . . . . . . . . . . . . . . . . . . . . . . . . . . . . . . . . . . . . . . . . . . . . 21,265 36.0
Unknown . . . . . . . . . . . . . . . . . . . . . . . . . . . . . . . . . . . . . . . . . . . . . . . . . . . . . . . . . . . . . . . . . . . . . . 1,187 2.0
Total Drivers . . . . . . . . . . . . . . . . . . . . . . . . . . . . . . . . . . . . . . . . . . . . . . . . . . . . . . . . . . . . . . . . . . 59,104 100.0
Note: The sum of the numbers and percentages is greater than total drivers as more than one factor may be present for thesame driver.
Table 65
Related Factors for Drivers and Motorcycle Operators Involved in Fatal Crashes
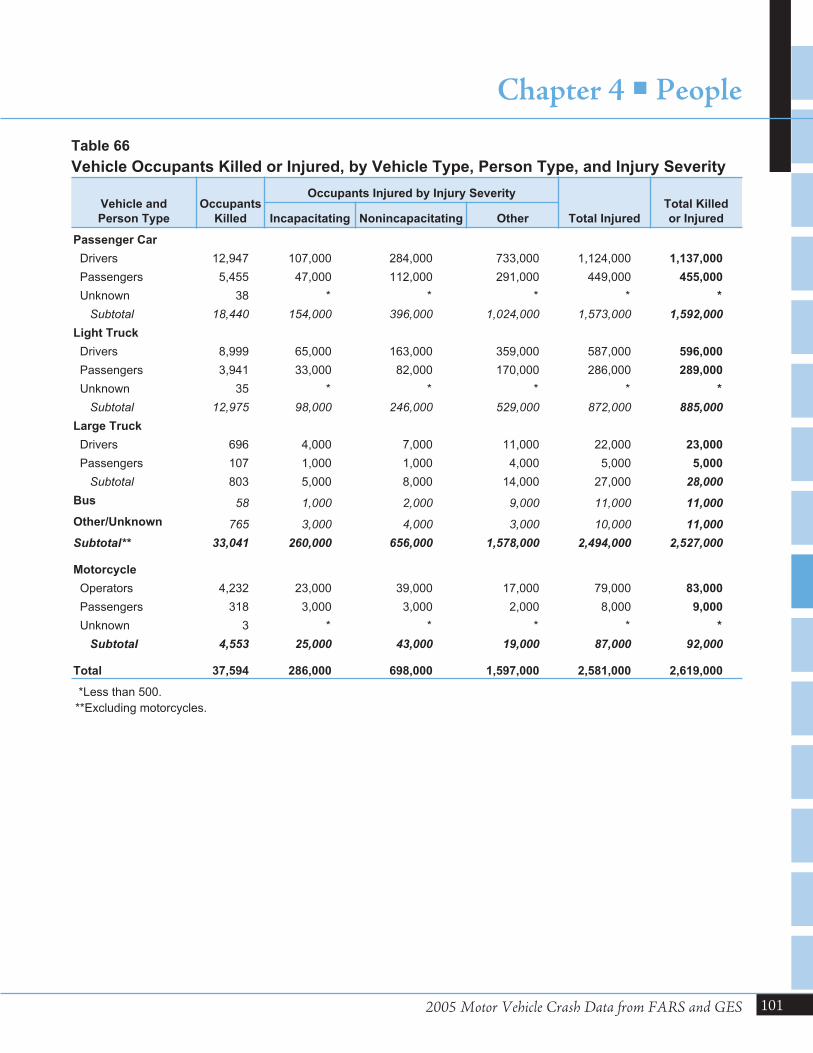
2005 Motor Vehicle Crash Data from FARS and GES
Chapter 4 � People
101
Vehicle and
Person Type
Occupants
Killed
Occupants Injured by Injury Severity
Total Injured
Total Killed
or InjuredIncapacitating Nonincapacitating Other
Passenger Car
Drivers 12,947 107,000 284,000 733,000 1,124,000 1,137,000
Passengers 5,455 47,000 112,000 291,000 449,000 455,000
Unknown 38 * * * * *
Subtotal 18,440 154,000 396,000 1,024,000 1,573,000 1,592,000
Light Truck
Drivers 8,999 65,000 163,000 359,000 587,000 596,000
Passengers 3,941 33,000 82,000 170,000 286,000 289,000
Unknown 35 * * * * *
Subtotal 12,975 98,000 246,000 529,000 872,000 885,000
Large Truck
Drivers 696 4,000 7,000 11,000 22,000 23,000
Passengers 107 1,000 1,000 4,000 5,000 5,000
Subtotal 803 5,000 8,000 14,000 27,000 28,000
Bus 58 1,000 2,000 9,000 11,000 11,000
Other/Unknown 765 3,000 4,000 3,000 10,000 11,000
Subtotal** 33,041 260,000 656,000 1,578,000 2,494,000 2,527,000
Motorcycle
Operators 4,232 23,000 39,000 17,000 79,000 83,000
Passengers 318 3,000 3,000 2,000 8,000 9,000
Unknown 3 * * * * *
Subtotal 4,553 25,000 43,000 19,000 87,000 92,000
Total 37,594 286,000 698,000 1,597,000 2,581,000 2,619,000
*Less than 500.
**Excluding motorcycles.
Table 66
Vehicle Occupants Killed or Injured, by Vehicle Type, Person Type, and Injury Severity
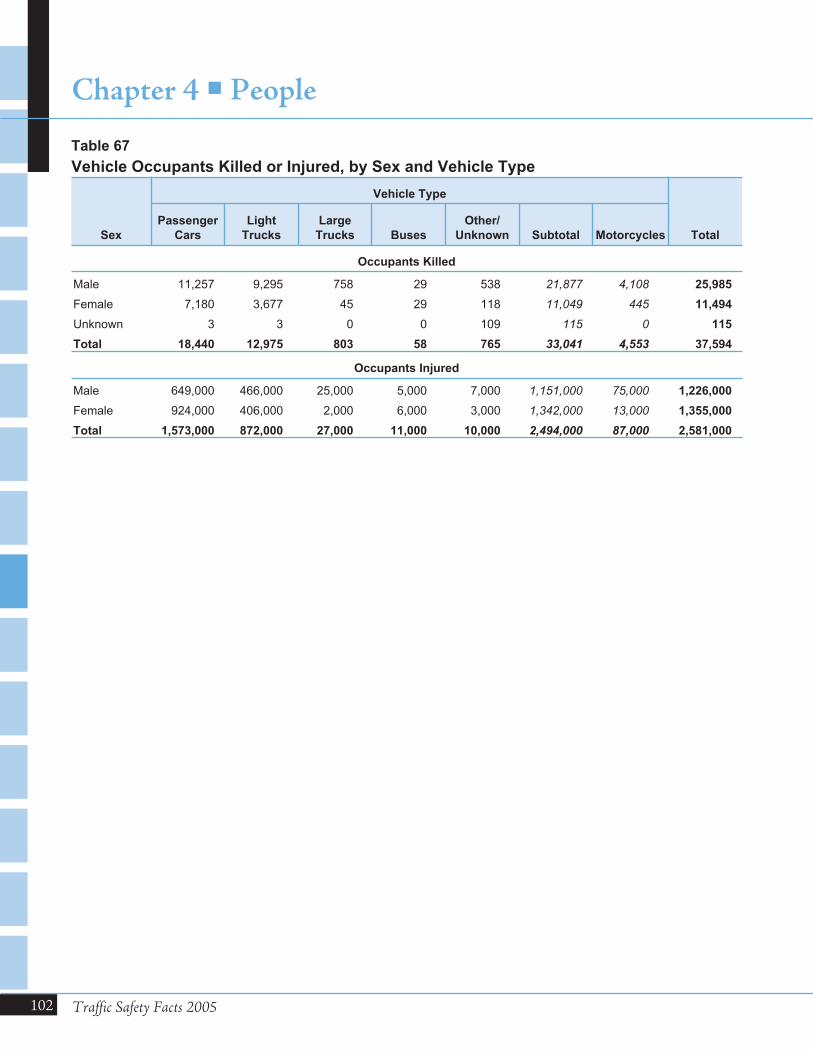
102 Traffic Safety Facts 2005
Chapter 4 � People
Sex
Vehicle Type
Total
Passenger
Cars
Light
Trucks
Large
Trucks Buses
Other/
Unknown Subtotal Motorcycles
Occupants Killed
Male 11,257 9,295 758 29 538 21,877 4,108 25,985
Female 7,180 3,677 45 29 118 11,049 445 11,494
Unknown 3 3 0 0 109 115 0 115
Total 18,440 12,975 803 58 765 33,041 4,553 37,594
Occupants Injured
Male 649,000 466,000 25,000 5,000 7,000 1,151,000 75,000 1,226,000
Female 924,000 406,000 2,000 6,000 3,000 1,342,000 13,000 1,355,000
Total 1,573,000 872,000 27,000 11,000 10,000 2,494,000 87,000 2,581,000
Table 67
Vehicle Occupants Killed or Injured, by Sex and Vehicle Type
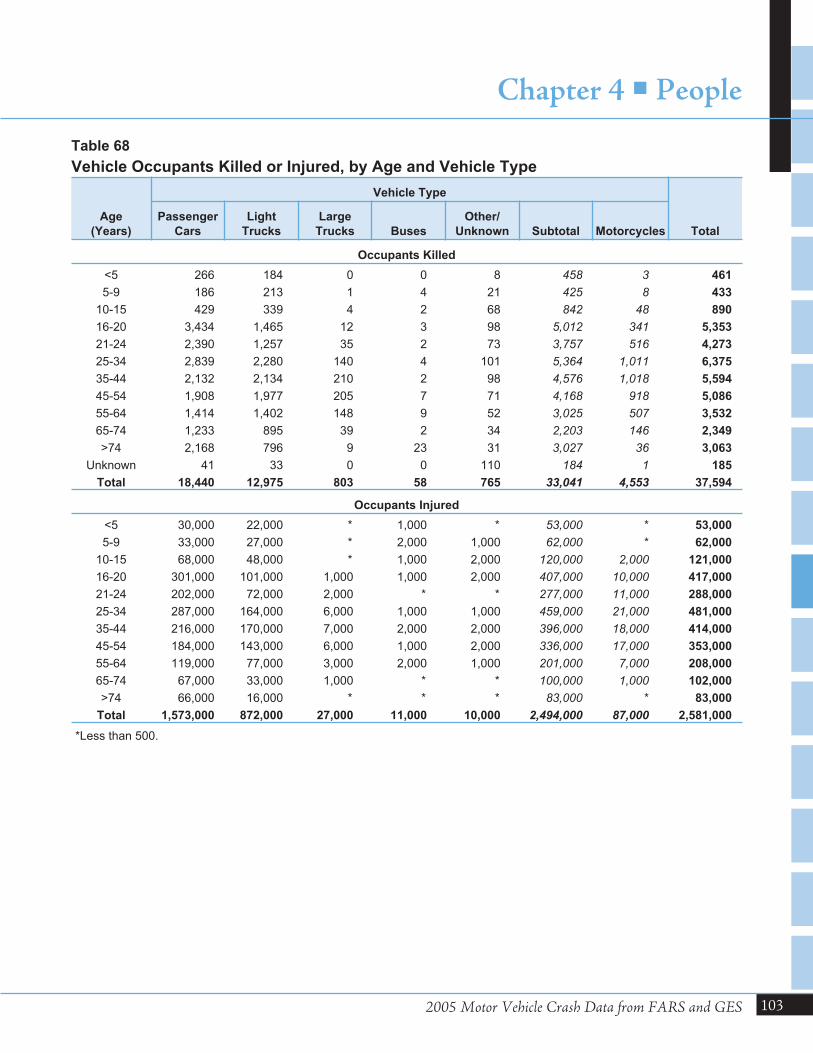
2005 Motor Vehicle Crash Data from FARS and GES
Chapter 4 � People
103
Age
(Years)
Vehicle Type
Total
Passenger
Cars
Light
Trucks
Large
Trucks Buses
Other/
Unknown Subtotal Motorcycles
Occupants Killed
<5 266 184 0 0 8 458 3 461
5-9 186 213 1 4 21 425 8 433
10-15 429 339 4 2 68 842 48 890
16-20 3,434 1,465 12 3 98 5,012 341 5,353
21-24 2,390 1,257 35 2 73 3,757 516 4,273
25-34 2,839 2,280 140 4 101 5,364 1,011 6,375
35-44 2,132 2,134 210 2 98 4,576 1,018 5,594
45-54 1,908 1,977 205 7 71 4,168 918 5,086
55-64 1,414 1,402 148 9 52 3,025 507 3,532
65-74 1,233 895 39 2 34 2,203 146 2,349
>74 2,168 796 9 23 31 3,027 36 3,063
Unknown 41 33 0 0 110 184 1 185
Total 18,440 12,975 803 58 765 33,041 4,553 37,594
Occupants Injured
<5 30,000 22,000 * 1,000 * 53,000 * 53,000
5-9 33,000 27,000 * 2,000 1,000 62,000 * 62,000
10-15 68,000 48,000 * 1,000 2,000 120,000 2,000 121,000
16-20 301,000 101,000 1,000 1,000 2,000 407,000 10,000 417,000
21-24 202,000 72,000 2,000 * * 277,000 11,000 288,000
25-34 287,000 164,000 6,000 1,000 1,000 459,000 21,000 481,000
35-44 216,000 170,000 7,000 2,000 2,000 396,000 18,000 414,000
45-54 184,000 143,000 6,000 1,000 2,000 336,000 17,000 353,000
55-64 119,000 77,000 3,000 2,000 1,000 201,000 7,000 208,000
65-74 67,000 33,000 1,000 * * 100,000 1,000 102,000
>74 66,000 16,000 * * * 83,000 * 83,000
Total 1,573,000 872,000 27,000 11,000 10,000 2,494,000 87,000 2,581,000
*Less than 500.
Table 68
Vehicle Occupants Killed or Injured, by Age and Vehicle Type
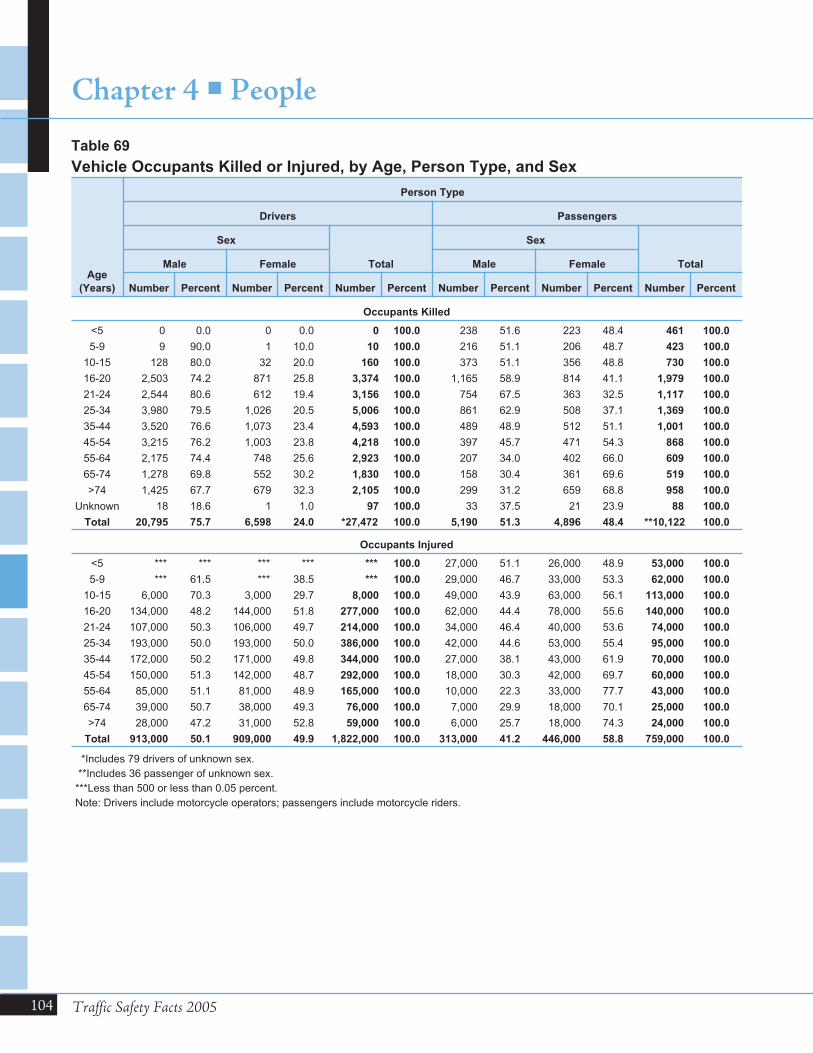
104 Traffic Safety Facts 2005
Chapter 4 � People
Age
(Years)
Person Type
Drivers Passengers
Sex
Total
Sex
TotalMale Female Male Female
Number Percent Number Percent Number Percent Number Percent Number Percent Number Percent
Occupants Killed
<5 0 0.0 0 0.0 0 100.0 238 51.6 223 48.4 461 100.0
5-9 9 90.0 1 10.0 10 100.0 216 51.1 206 48.7 423 100.0
10-15 128 80.0 32 20.0 160 100.0 373 51.1 356 48.8 730 100.0
16-20 2,503 74.2 871 25.8 3,374 100.0 1,165 58.9 814 41.1 1,979 100.0
21-24 2,544 80.6 612 19.4 3,156 100.0 754 67.5 363 32.5 1,117 100.0
25-34 3,980 79.5 1,026 20.5 5,006 100.0 861 62.9 508 37.1 1,369 100.0
35-44 3,520 76.6 1,073 23.4 4,593 100.0 489 48.9 512 51.1 1,001 100.0
45-54 3,215 76.2 1,003 23.8 4,218 100.0 397 45.7 471 54.3 868 100.0
55-64 2,175 74.4 748 25.6 2,923 100.0 207 34.0 402 66.0 609 100.0
65-74 1,278 69.8 552 30.2 1,830 100.0 158 30.4 361 69.6 519 100.0
>74 1,425 67.7 679 32.3 2,105 100.0 299 31.2 659 68.8 958 100.0
Unknown 18 18.6 1 1.0 97 100.0 33 37.5 21 23.9 88 100.0
Total 20,795 75.7 6,598 24.0 *27,472 100.0 5,190 51.3 4,896 48.4 **10,122 100.0
Occupants Injured
<5 *** *** *** *** *** 100.0 27,000 51.1 26,000 48.9 53,000 100.0
5-9 *** 61.5 *** 38.5 *** 100.0 29,000 46.7 33,000 53.3 62,000 100.0
10-15 6,000 70.3 3,000 29.7 8,000 100.0 49,000 43.9 63,000 56.1 113,000 100.0
16-20 134,000 48.2 144,000 51.8 277,000 100.0 62,000 44.4 78,000 55.6 140,000 100.0
21-24 107,000 50.3 106,000 49.7 214,000 100.0 34,000 46.4 40,000 53.6 74,000 100.0
25-34 193,000 50.0 193,000 50.0 386,000 100.0 42,000 44.6 53,000 55.4 95,000 100.0
35-44 172,000 50.2 171,000 49.8 344,000 100.0 27,000 38.1 43,000 61.9 70,000 100.0
45-54 150,000 51.3 142,000 48.7 292,000 100.0 18,000 30.3 42,000 69.7 60,000 100.0
55-64 85,000 51.1 81,000 48.9 165,000 100.0 10,000 22.3 33,000 77.7 43,000 100.0
65-74 39,000 50.7 38,000 49.3 76,000 100.0 7,000 29.9 18,000 70.1 25,000 100.0
>74 28,000 47.2 31,000 52.8 59,000 100.0 6,000 25.7 18,000 74.3 24,000 100.0
Total 913,000 50.1 909,000 49.9 1,822,000 100.0 313,000 41.2 446,000 58.8 759,000 100.0
*Includes 79 drivers of unknown sex.
**Includes 36 passenger of unknown sex.
***Less than 500 or less than 0.05 percent.
Note: Drivers include motorcycle operators; passengers include motorcycle riders.
Table 69
Vehicle Occupants Killed or Injured, by Age, Person Type, and Sex
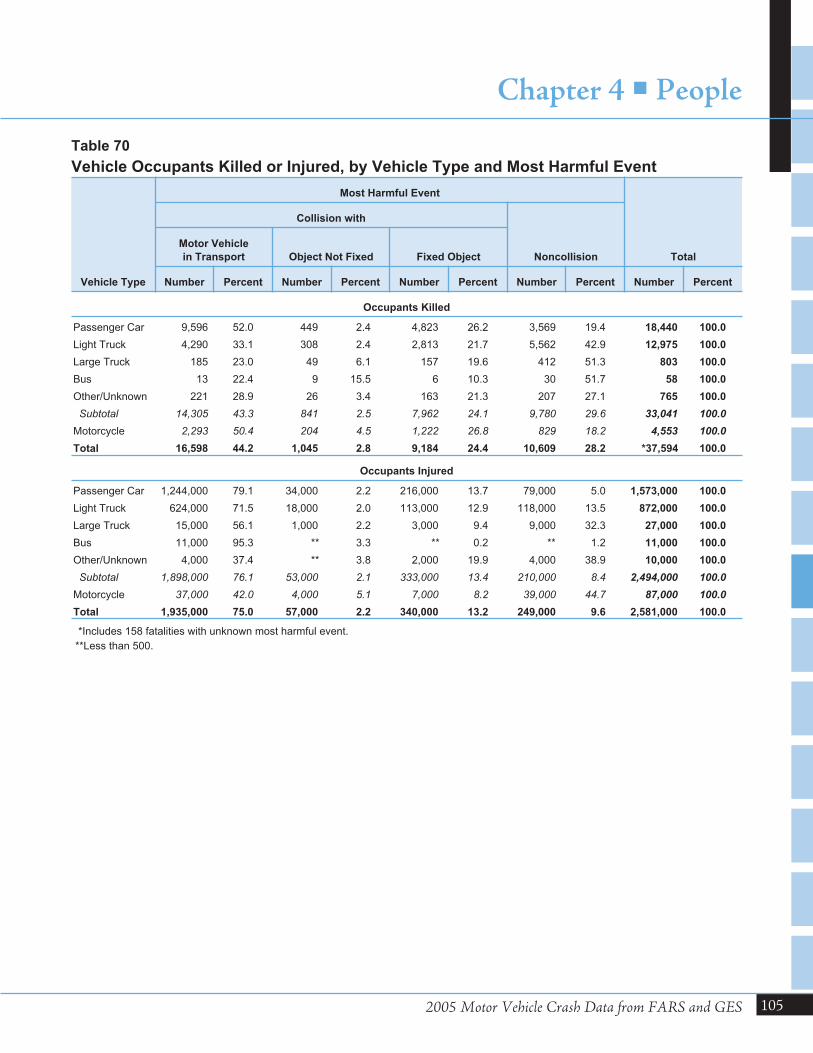
2005 Motor Vehicle Crash Data from FARS and GES
Chapter 4 � People
105
Vehicle Type
Most Harmful Event
Total
Collision with
Noncollision
Motor Vehicle
in Transport Object Not Fixed Fixed Object
Number Percent Number Percent Number Percent Number Percent Number Percent
Occupants Killed
Passenger Car 9,596 52.0 449 2.4 4,823 26.2 3,569 19.4 18,440 100.0
Light Truck 4,290 33.1 308 2.4 2,813 21.7 5,562 42.9 12,975 100.0
Large Truck 185 23.0 49 6.1 157 19.6 412 51.3 803 100.0
Bus 13 22.4 9 15.5 6 10.3 30 51.7 58 100.0
Other/Unknown 221 28.9 26 3.4 163 21.3 207 27.1 765 100.0
Subtotal 14,305 43.3 841 2.5 7,962 24.1 9,780 29.6 33,041 100.0
Motorcycle 2,293 50.4 204 4.5 1,222 26.8 829 18.2 4,553 100.0
Total 16,598 44.2 1,045 2.8 9,184 24.4 10,609 28.2 *37,594 100.0
Occupants Injured
Passenger Car 1,244,000 79.1 34,000 2.2 216,000 13.7 79,000 5.0 1,573,000 100.0
Light Truck 624,000 71.5 18,000 2.0 113,000 12.9 118,000 13.5 872,000 100.0
Large Truck 15,000 56.1 1,000 2.2 3,000 9.4 9,000 32.3 27,000 100.0
Bus 11,000 95.3 ** 3.3 ** 0.2 ** 1.2 11,000 100.0
Other/Unknown 4,000 37.4 ** 3.8 2,000 19.9 4,000 38.9 10,000 100.0
Subtotal 1,898,000 76.1 53,000 2.1 333,000 13.4 210,000 8.4 2,494,000 100.0
Motorcycle 37,000 42.0 4,000 5.1 7,000 8.2 39,000 44.7 87,000 100.0
Total 1,935,000 75.0 57,000 2.2 340,000 13.2 249,000 9.6 2,581,000 100.0
*Includes 158 fatalities with unknown most harmful event.
**Less than 500.
Table 70
Vehicle Occupants Killed or Injured, by Vehicle Type and Most Harmful Event
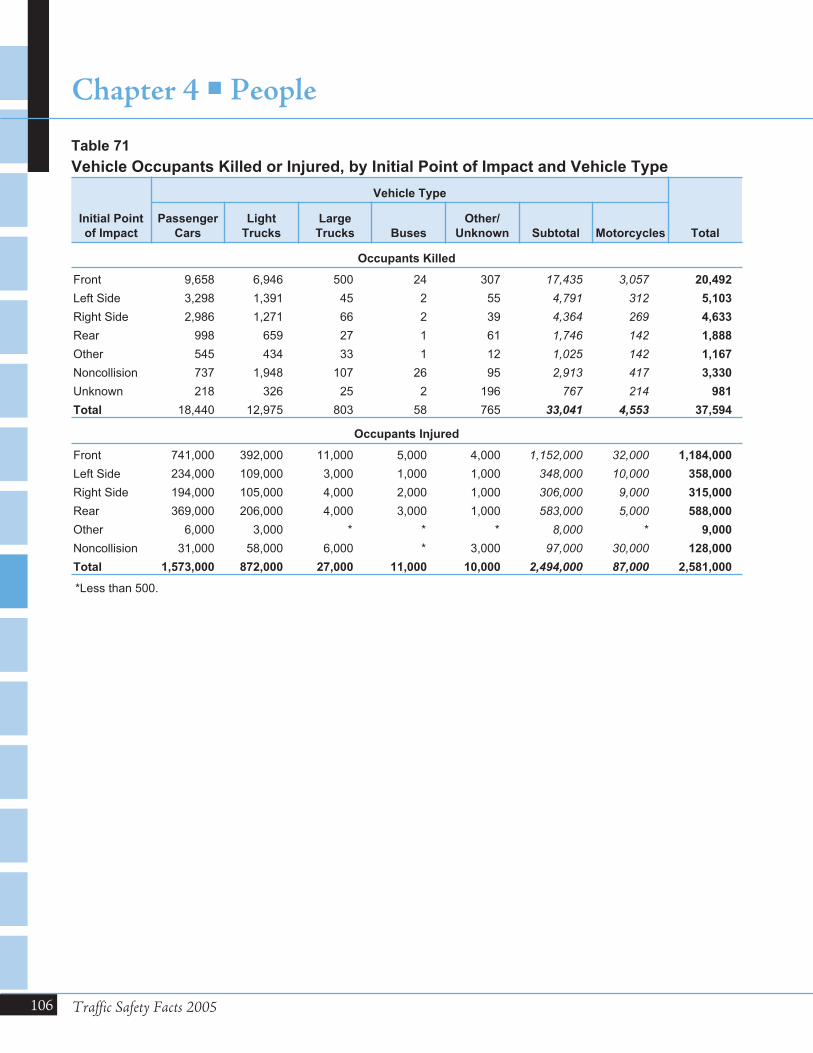
106 Traffic Safety Facts 2005
Chapter 4 � People
Initial Point
of Impact
Vehicle Type
Total
Passenger
Cars
Light
Trucks
Large
Trucks Buses
Other/
Unknown Subtotal Motorcycles
Occupants Killed
Front 9,658 6,946 500 24 307 17,435 3,057 20,492
Left Side 3,298 1,391 45 2 55 4,791 312 5,103
Right Side 2,986 1,271 66 2 39 4,364 269 4,633
Rear 998 659 27 1 61 1,746 142 1,888
Other 545 434 33 1 12 1,025 142 1,167
Noncollision 737 1,948 107 26 95 2,913 417 3,330
Unknown 218 326 25 2 196 767 214 981
Total 18,440 12,975 803 58 765 33,041 4,553 37,594
Occupants Injured
Front 741,000 392,000 11,000 5,000 4,000 1,152,000 32,000 1,184,000
Left Side 234,000 109,000 3,000 1,000 1,000 348,000 10,000 358,000
Right Side 194,000 105,000 4,000 2,000 1,000 306,000 9,000 315,000
Rear 369,000 206,000 4,000 3,000 1,000 583,000 5,000 588,000
Other 6,000 3,000 * * * 8,000 * 9,000
Noncollision 31,000 58,000 6,000 * 3,000 97,000 30,000 128,000
Total 1,573,000 872,000 27,000 11,000 10,000 2,494,000 87,000 2,581,000
*Less than 500.
Table 71
Vehicle Occupants Killed or Injured, by Initial Point of Impact and Vehicle Type
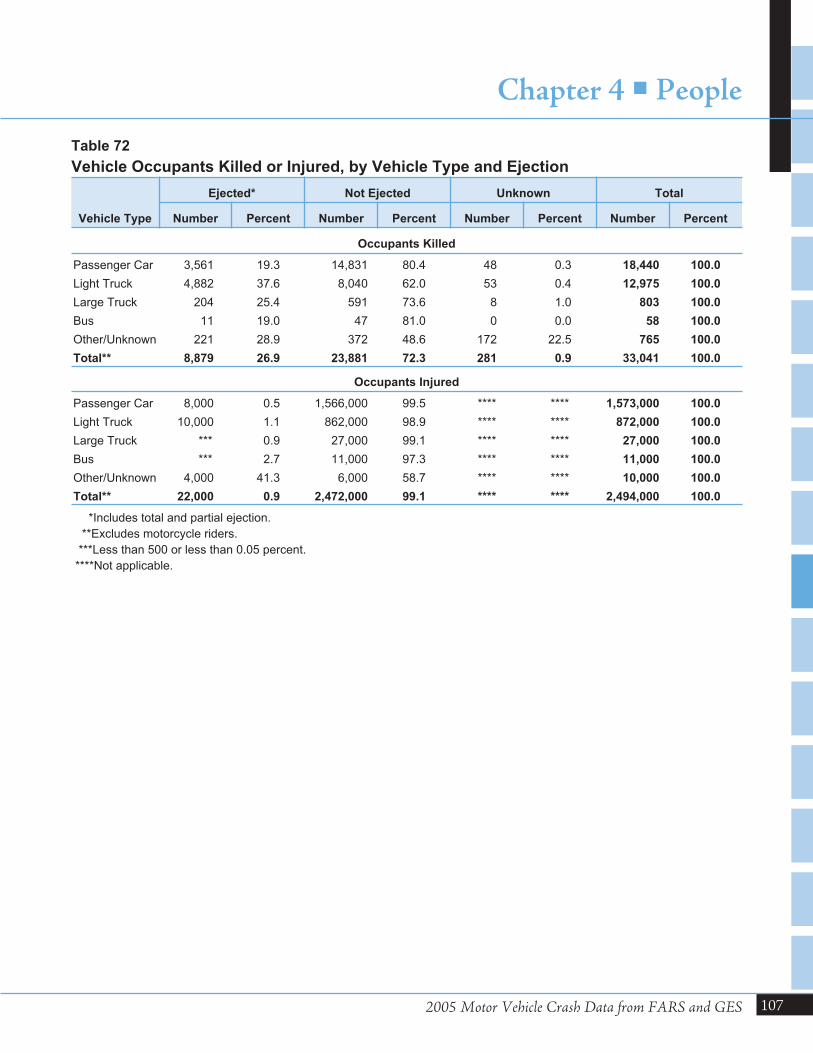
2005 Motor Vehicle Crash Data from FARS and GES
Chapter 4 � People
107
Vehicle Type
Ejected* Not Ejected Unknown Total
Number Percent Number Percent Number Percent Number Percent
Occupants Killed
Passenger Car 3,561 19.3 14,831 80.4 48 0.3 18,440 100.0
Light Truck 4,882 37.6 8,040 62.0 53 0.4 12,975 100.0
Large Truck 204 25.4 591 73.6 8 1.0 803 100.0
Bus 11 19.0 47 81.0 0 0.0 58 100.0
Other/Unknown 221 28.9 372 48.6 172 22.5 765 100.0
Total** 8,879 26.9 23,881 72.3 281 0.9 33,041 100.0
Occupants Injured
Passenger Car 8,000 0.5 1,566,000 99.5 **** **** 1,573,000 100.0
Light Truck 10,000 1.1 862,000 98.9 **** **** 872,000 100.0
Large Truck *** 0.9 27,000 99.1 **** **** 27,000 100.0
Bus *** 2.7 11,000 97.3 **** **** 11,000 100.0
Other/Unknown 4,000 41.3 6,000 58.7 **** **** 10,000 100.0
Total** 22,000 0.9 2,472,000 99.1 **** **** 2,494,000 100.0
*Includes total and partial ejection.
**Excludes motorcycle riders.
***Less than 500 or less than 0.05 percent.
****Not applicable.
Table 72
Vehicle Occupants Killed or Injured, by Vehicle Type and Ejection
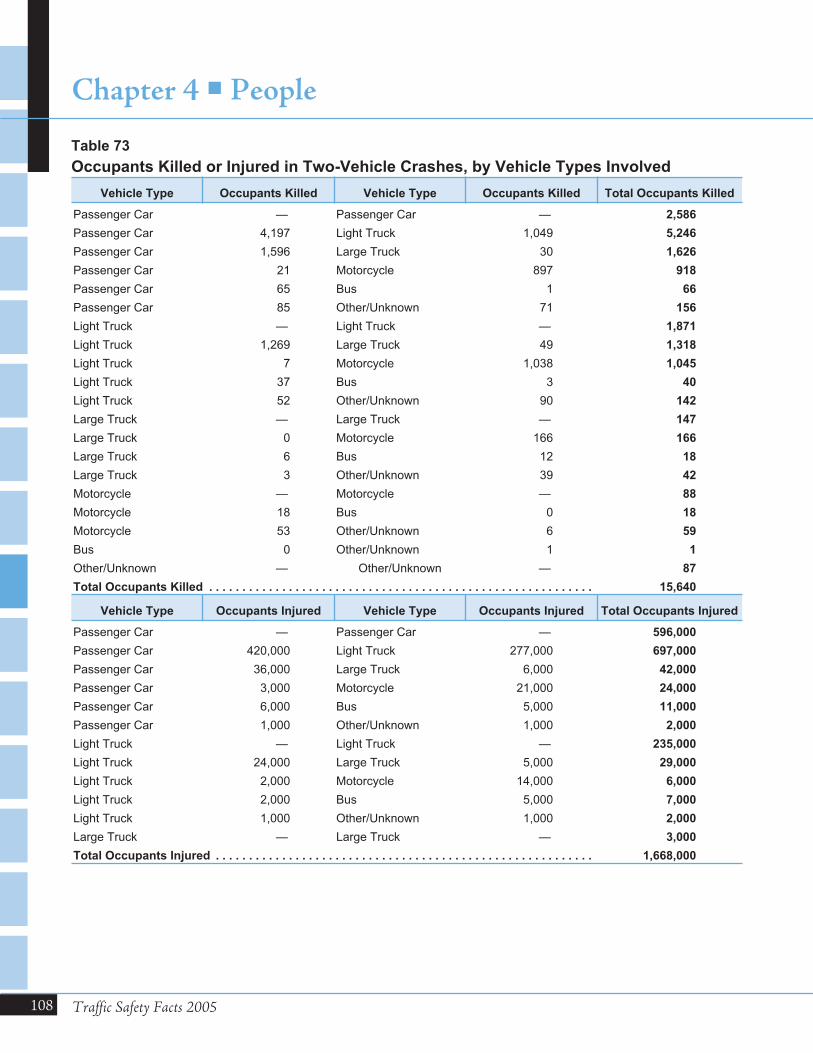
108 Traffic Safety Facts 2005
Chapter 4 � People
Vehicle Type Occupants Killed Vehicle Type Occupants Killed Total Occupants Killed
Passenger Car — Passenger Car — 2,586
Passenger Car 4,197 Light Truck 1,049 5,246
Passenger Car 1,596 Large Truck 30 1,626
Passenger Car 21 Motorcycle 897 918
Passenger Car 65 Bus 1 66
Passenger Car 85 Other/Unknown 71 156
Light Truck — Light Truck — 1,871
Light Truck 1,269 Large Truck 49 1,318
Light Truck 7 Motorcycle 1,038 1,045
Light Truck 37 Bus 3 40
Light Truck 52 Other/Unknown 90 142
Large Truck — Large Truck — 147
Large Truck 0 Motorcycle 166 166
Large Truck 6 Bus 12 18
Large Truck 3 Other/Unknown 39 42
Motorcycle — Motorcycle — 88
Motorcycle 18 Bus 0 18
Motorcycle 53 Other/Unknown 6 59
Bus 0 Other/Unknown 1 1
Other/Unknown — Other/Unknown — 87
Total Occupants Killed . . . . . . . . . . . . . . . . . . . . . . . . . . . . . . . . . . . . . . . . . . . . . . . . . . . . . . . . . . 15,640
Vehicle Type Occupants Injured Vehicle Type Occupants Injured Total Occupants Injured
Passenger Car — Passenger Car — 596,000
Passenger Car 420,000 Light Truck 277,000 697,000
Passenger Car 36,000 Large Truck 6,000 42,000
Passenger Car 3,000 Motorcycle 21,000 24,000
Passenger Car 6,000 Bus 5,000 11,000
Passenger Car 1,000 Other/Unknown 1,000 2,000
Light Truck — Light Truck — 235,000
Light Truck 24,000 Large Truck 5,000 29,000
Light Truck 2,000 Motorcycle 14,000 6,000
Light Truck 2,000 Bus 5,000 7,000
Light Truck 1,000 Other/Unknown 1,000 2,000
Large Truck — Large Truck — 3,000
Total Occupants Injured . . . . . . . . . . . . . . . . . . . . . . . . . . . . . . . . . . . . . . . . . . . . . . . . . . . . . . . . . 1,668,000
Table 73
Occupants Killed or Injured in Two-Vehicle Crashes, by Vehicle Types Involved
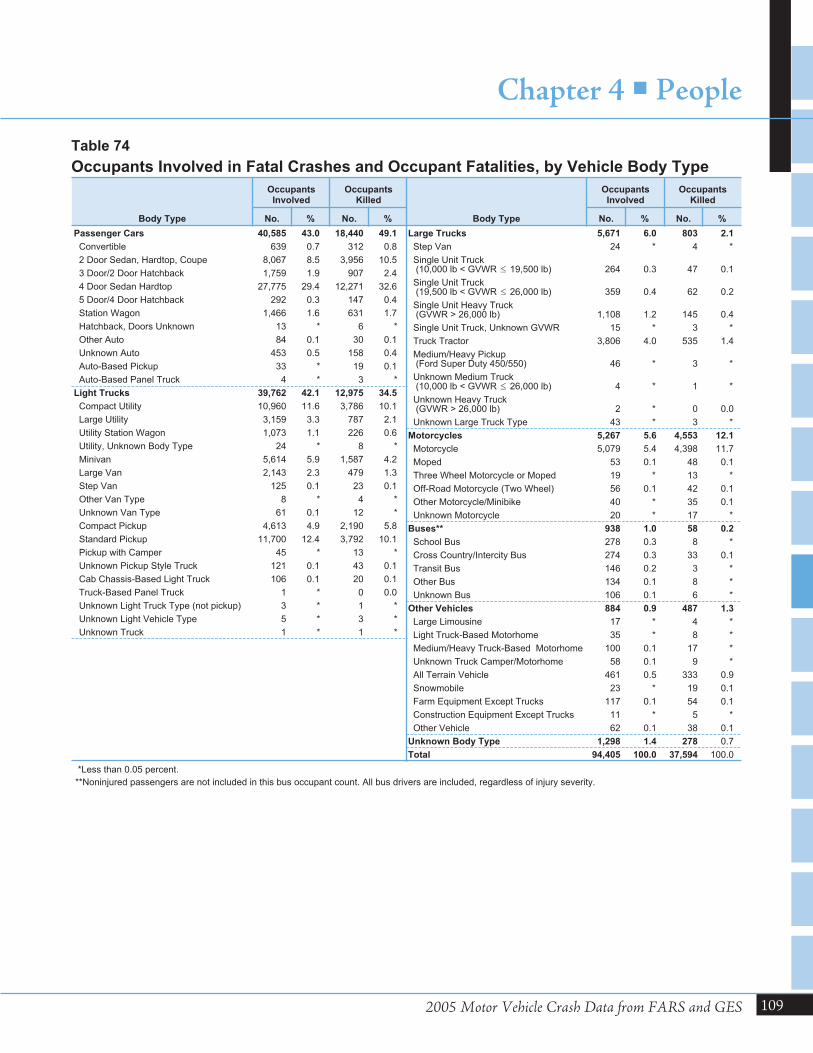
2005 Motor Vehicle Crash Data from FARS and GES
Chapter 4 � People
109
Table 74
Occupants Involved in Fatal Crashes and Occupant Fatalities, by Vehicle Body Type
Body Type
OccupantsInvolved
OccupantsKilled
No. % No. %
Passenger Cars 40,585 43.0 18,440 49.1
Convertible 639 0.7 312 0.8
2 Door Sedan, Hardtop, Coupe 8,067 8.5 3,956 10.5
3 Door/2 Door Hatchback 1,759 1.9 907 2.4
4 Door Sedan Hardtop 27,775 29.4 12,271 32.6
5 Door/4 Door Hatchback 292 0.3 147 0.4
Station Wagon 1,466 1.6 631 1.7
Hatchback, Doors Unknown 13 * 6 *
Other Auto 84 0.1 30 0.1
Unknown Auto 453 0.5 158 0.4
Auto-Based Pickup 33 * 19 0.1
Auto-Based Panel Truck 4 * 3 *
Light Trucks 39,762 42.1 12,975 34.5
Compact Utility 10,960 11.6 3,786 10.1
Large Utility 3,159 3.3 787 2.1
Utility Station Wagon 1,073 1.1 226 0.6
Utility, Unknown Body Type 24 * 8 *
Minivan 5,614 5.9 1,587 4.2
Large Van 2,143 2.3 479 1.3
Step Van 125 0.1 23 0.1
Other Van Type 8 * 4 *
Unknown Van Type 61 0.1 12 *
Compact Pickup 4,613 4.9 2,190 5.8
Standard Pickup 11,700 12.4 3,792 10.1
Pickup with Camper 45 * 13 *
Unknown Pickup Style Truck 121 0.1 43 0.1
Cab Chassis-Based Light Truck 106 0.1 20 0.1
Truck-Based Panel Truck 1 * 0 0.0
Unknown Light Truck Type (not pickup) 3 * 1 *
Unknown Light Vehicle Type 5 * 3 *
Unknown Truck 1 * 1 *
Body Type
OccupantsInvolved
OccupantsKilled
No. % No. %
Large Trucks 5,671 6.0 803 2.1
Step Van 24 * 4 *
Single Unit Truck(10,000 lb < GVWR � 19,500 lb) 264 0.3 47 0.1
Single Unit Truck(19,500 lb < GVWR � 26,000 lb) 359 0.4 62 0.2
Single Unit Heavy Truck(GVWR > 26,000 lb) 1,108 1.2 145 0.4
Single Unit Truck, Unknown GVWR 15 * 3 *
Truck Tractor 3,806 4.0 535 1.4
Medium/Heavy Pickup(Ford Super Duty 450/550) 46 * 3 *
Unknown Medium Truck(10,000 lb < GVWR � 26,000 lb) 4 * 1 *
Unknown Heavy Truck(GVWR > 26,000 lb) 2 * 0 0.0
Unknown Large Truck Type 43 * 3 *
Motorcycles 5,267 5.6 4,553 12.1
Motorcycle 5,079 5.4 4,398 11.7
Moped 53 0.1 48 0.1
Three Wheel Motorcycle or Moped 19 * 13 *
Off-Road Motorcycle (Two Wheel) 56 0.1 42 0.1
Other Motorcycle/Minibike 40 * 35 0.1
Unknown Motorcycle 20 * 17 *
Buses** 938 1.0 58 0.2
School Bus 278 0.3 8 *
Cross Country/Intercity Bus 274 0.3 33 0.1
Transit Bus 146 0.2 3 *
Other Bus 134 0.1 8 *
Unknown Bus 106 0.1 6 *
Other Vehicles 884 0.9 487 1.3
Large Limousine 17 * 4 *
Light Truck-Based Motorhome 35 * 8 *
Medium/Heavy Truck-Based Motorhome 100 0.1 17 *
Unknown Truck Camper/Motorhome 58 0.1 9 *
All Terrain Vehicle 461 0.5 333 0.9
Snowmobile 23 * 19 0.1
Farm Equipment Except Trucks 117 0.1 54 0.1
Construction Equipment Except Trucks 11 * 5 *
Other Vehicle 62 0.1 38 0.1
Unknown Body Type 1,298 1.4 278 0.7
Total 94,405 100.0 37,594 100.0
*Less than 0.05 percent.
**Noninjured passengers are not included in this bus occupant count. All bus drivers are included, regardless of injury severity.
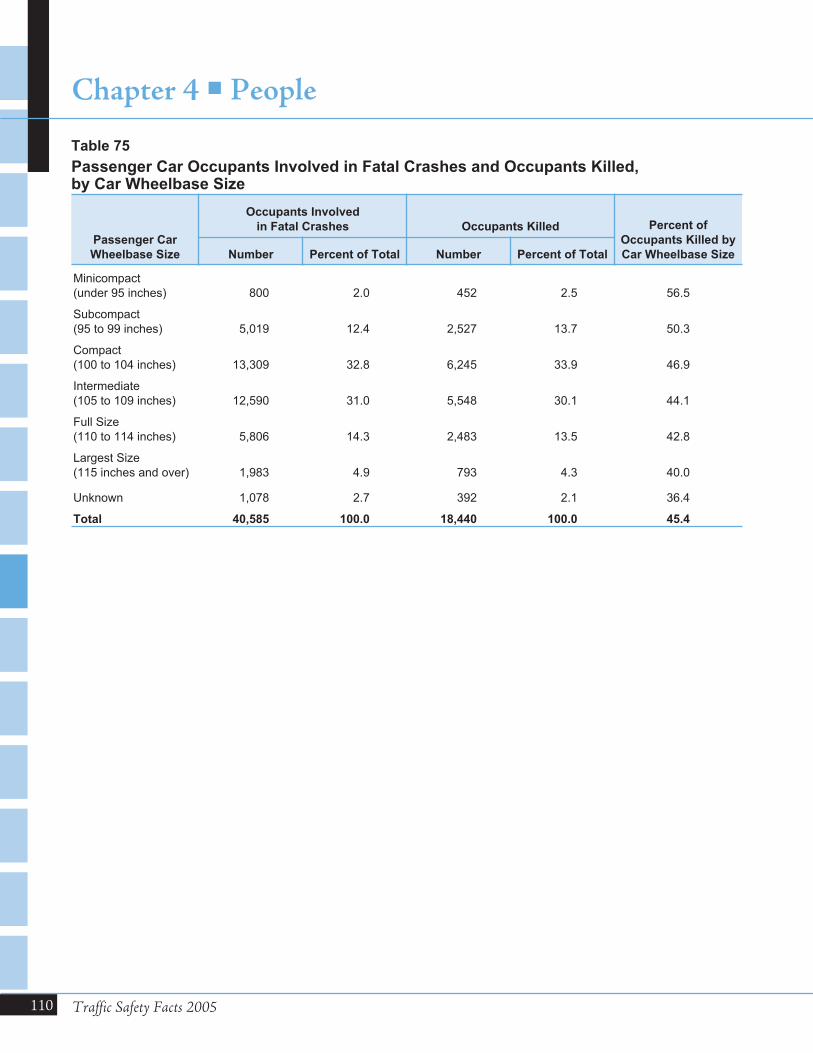
110 Traffic Safety Facts 2005
Chapter 4 � People
Passenger Car
Wheelbase Size
Occupants Involved
in Fatal Crashes Occupants Killed Percent of
Occupants Killed by
Car Wheelbase SizeNumber Percent of Total Number Percent of Total
Minicompact(under 95 inches) 800 2.0 452 2.5 56.5
Subcompact(95 to 99 inches) 5,019 12.4 2,527 13.7 50.3
Compact(100 to 104 inches) 13,309 32.8 6,245 33.9 46.9
Intermediate(105 to 109 inches) 12,590 31.0 5,548 30.1 44.1
Full Size(110 to 114 inches) 5,806 14.3 2,483 13.5 42.8
Largest Size(115 inches and over) 1,983 4.9 793 4.3 40.0
Unknown 1,078 2.7 392 2.1 36.4
Total 40,585 100.0 18,440 100.0 45.4
Table 75
Passenger Car Occupants Involved in Fatal Crashes and Occupants Killed,by Car Wheelbase Size
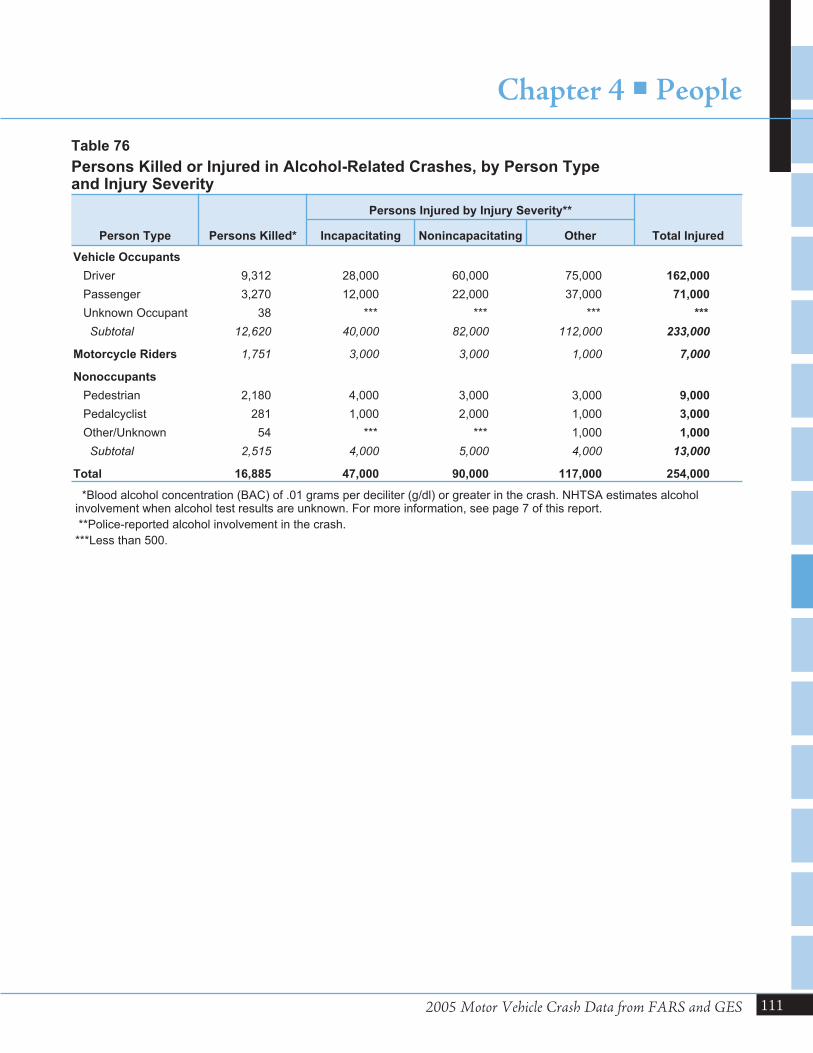
2005 Motor Vehicle Crash Data from FARS and GES
Chapter 4 � People
111
Person Type Persons Killed*
Persons Injured by Injury Severity**
Total InjuredIncapacitating Nonincapacitating Other
Vehicle Occupants
Driver 9,312 28,000 60,000 75,000 162,000
Passenger 3,270 12,000 22,000 37,000 71,000
Unknown Occupant 38 *** *** *** ***
Subtotal 12,620 40,000 82,000 112,000 233,000
Motorcycle Riders 1,751 3,000 3,000 1,000 7,000
Nonoccupants
Pedestrian 2,180 4,000 3,000 3,000 9,000
Pedalcyclist 281 1,000 2,000 1,000 3,000
Other/Unknown 54 *** *** 1,000 1,000
Subtotal 2,515 4,000 5,000 4,000 13,000
Total 16,885 47,000 90,000 117,000 254,000
*Blood alcohol concentration (BAC) of .01 grams per deciliter (g/dl) or greater in the crash. NHTSA estimates alcoholinvolvement when alcohol test results are unknown. For more information, see page 7 of this report.
**Police-reported alcohol involvement in the crash.
***Less than 500.
Table 76
Persons Killed or Injured in Alcohol-Related Crashes, by Person Typeand Injury Severity
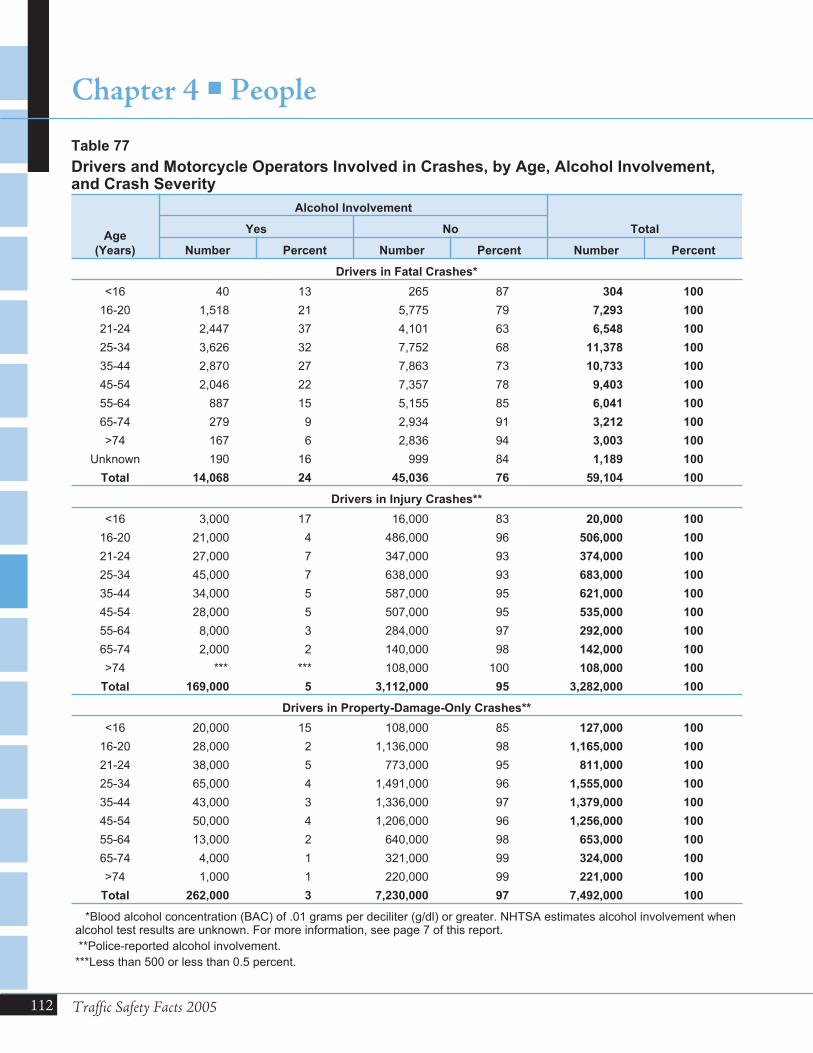
112 Traffic Safety Facts 2005
Chapter 4 � People
Age
(Years)
Alcohol Involvement
TotalYes No
Number Percent Number Percent Number Percent
Drivers in Fatal Crashes*
<16 40 13 265 87 304 100
16-20 1,518 21 5,775 79 7,293 100
21-24 2,447 37 4,101 63 6,548 100
25-34 3,626 32 7,752 68 11,378 100
35-44 2,870 27 7,863 73 10,733 100
45-54 2,046 22 7,357 78 9,403 100
55-64 887 15 5,155 85 6,041 100
65-74 279 9 2,934 91 3,212 100
>74 167 6 2,836 94 3,003 100
Unknown 190 16 999 84 1,189 100
Total 14,068 24 45,036 76 59,104 100
Drivers in Injury Crashes**
<16 3,000 17 16,000 83 20,000 100
16-20 21,000 4 486,000 96 506,000 100
21-24 27,000 7 347,000 93 374,000 100
25-34 45,000 7 638,000 93 683,000 100
35-44 34,000 5 587,000 95 621,000 100
45-54 28,000 5 507,000 95 535,000 100
55-64 8,000 3 284,000 97 292,000 100
65-74 2,000 2 140,000 98 142,000 100
>74 *** *** 108,000 100 108,000 100
Total 169,000 5 3,112,000 95 3,282,000 100
Drivers in Property-Damage-Only Crashes**
<16 20,000 15 108,000 85 127,000 100
16-20 28,000 2 1,136,000 98 1,165,000 100
21-24 38,000 5 773,000 95 811,000 100
25-34 65,000 4 1,491,000 96 1,555,000 100
35-44 43,000 3 1,336,000 97 1,379,000 100
45-54 50,000 4 1,206,000 96 1,256,000 100
55-64 13,000 2 640,000 98 653,000 100
65-74 4,000 1 321,000 99 324,000 100
>74 1,000 1 220,000 99 221,000 100
Total 262,000 3 7,230,000 97 7,492,000 100
*Blood alcohol concentration (BAC) of .01 grams per deciliter (g/dl) or greater. NHTSA estimates alcohol involvement whenalcohol test results are unknown. For more information, see page 7 of this report.
**Police-reported alcohol involvement.
***Less than 500 or less than 0.5 percent.
Table 77
Drivers and Motorcycle Operators Involved in Crashes, by Age, Alcohol Involvement,and Crash Severity
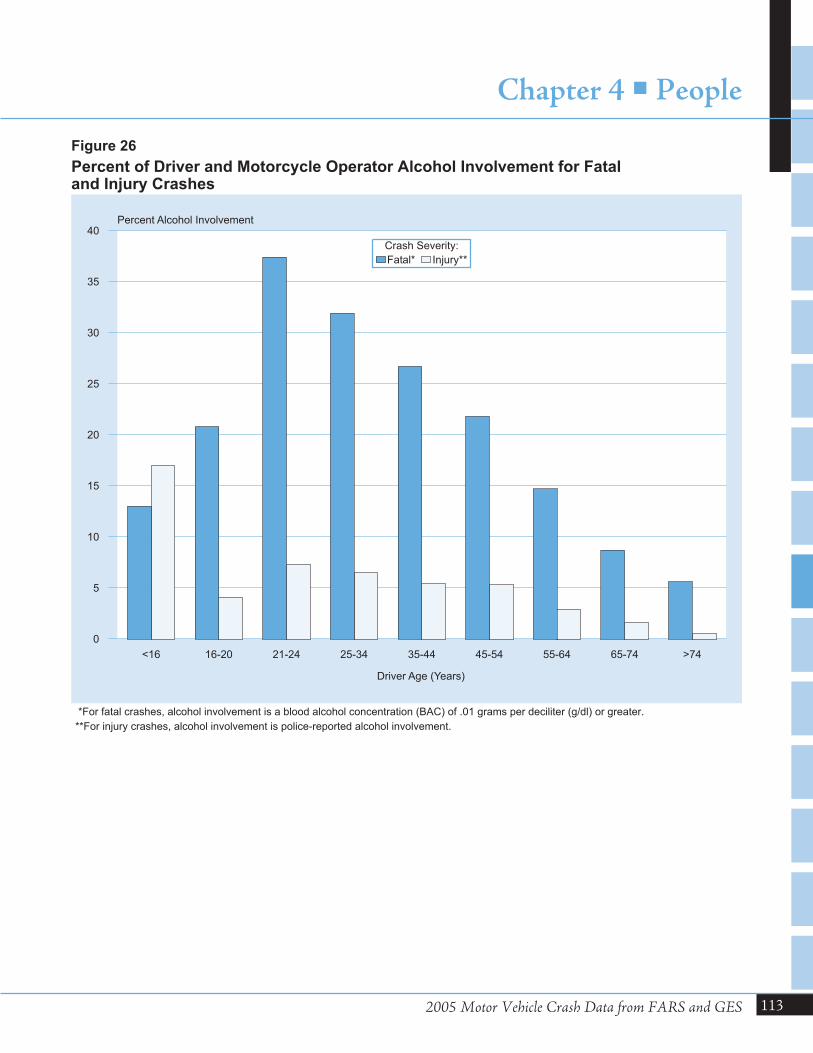
2005 Motor Vehicle Crash Data from FARS and GES
Chapter 4 � People
113
<16 16-20 21-24 25-34 35-44 45-54 55-64 65-74 >74
Driver Age (Years)
0
5
10
15
20
25
30
35
40Percent Alcohol Involvement
Crash Severity:
Fatal* Injury**
Figure 26
Percent of Driver and Motorcycle Operator Alcohol Involvement for Fataland Injury Crashes
*For fatal crashes, alcohol involvement is a blood alcohol concentration (BAC) of .01 grams per deciliter (g/dl) or greater.
**For injury crashes, alcohol involvement is police-reported alcohol involvement.
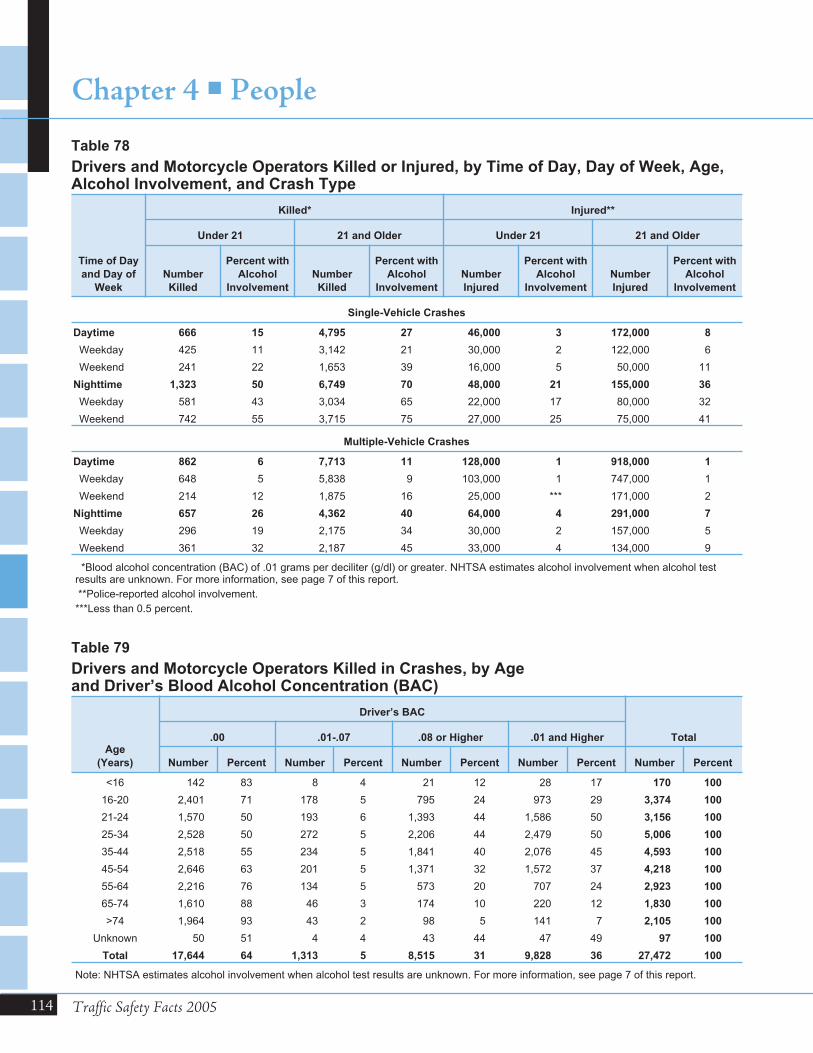
114 Traffic Safety Facts 2005
Chapter 4 � People
Time of Day
and Day of
Week
Killed* Injured**
Under 21 21 and Older Under 21 21 and Older
Number
Killed
Percent with
Alcohol
Involvement
Number
Killed
Percent with
Alcohol
Involvement
Number
Injured
Percent with
Alcohol
Involvement
Number
Injured
Percent with
Alcohol
Involvement
Single-Vehicle Crashes
Daytime 666 15 4,795 27 46,000 3 172,000 8
Weekday 425 11 3,142 21 30,000 2 122,000 6
Weekend 241 22 1,653 39 16,000 5 50,000 11
Nighttime 1,323 50 6,749 70 48,000 21 155,000 36
Weekday 581 43 3,034 65 22,000 17 80,000 32
Weekend 742 55 3,715 75 27,000 25 75,000 41
Multiple-Vehicle Crashes
Daytime 862 6 7,713 11 128,000 1 918,000 1
Weekday 648 5 5,838 9 103,000 1 747,000 1
Weekend 214 12 1,875 16 25,000 *** 171,000 2
Nighttime 657 26 4,362 40 64,000 4 291,000 7
Weekday 296 19 2,175 34 30,000 2 157,000 5
Weekend 361 32 2,187 45 33,000 4 134,000 9
*Blood alcohol concentration (BAC) of .01 grams per deciliter (g/dl) or greater. NHTSA estimates alcohol involvement when alcohol testresults are unknown. For more information, see page 7 of this report.
**Police-reported alcohol involvement.
***Less than 0.5 percent.
Table 78
Drivers and Motorcycle Operators Killed or Injured, by Time of Day, Day of Week, Age,Alcohol Involvement, and Crash Type
Age
(Years)
Driver’s BAC
Total.00 .01-.07 .08 or Higher .01 and Higher
Number Percent Number Percent Number Percent Number Percent Number Percent
<16 142 83 8 4 21 12 28 17 170 100
16-20 2,401 71 178 5 795 24 973 29 3,374 100
21-24 1,570 50 193 6 1,393 44 1,586 50 3,156 100
25-34 2,528 50 272 5 2,206 44 2,479 50 5,006 100
35-44 2,518 55 234 5 1,841 40 2,076 45 4,593 100
45-54 2,646 63 201 5 1,371 32 1,572 37 4,218 100
55-64 2,216 76 134 5 573 20 707 24 2,923 100
65-74 1,610 88 46 3 174 10 220 12 1,830 100
>74 1,964 93 43 2 98 5 141 7 2,105 100
Unknown 50 51 4 4 43 44 47 49 97 100
Total 17,644 64 1,313 5 8,515 31 9,828 36 27,472 100
Note: NHTSA estimates alcohol involvement when alcohol test results are unknown. For more information, see page 7 of this report.
Table 79
Drivers and Motorcycle Operators Killed in Crashes, by Ageand Driver’s Blood Alcohol Concentration (BAC)
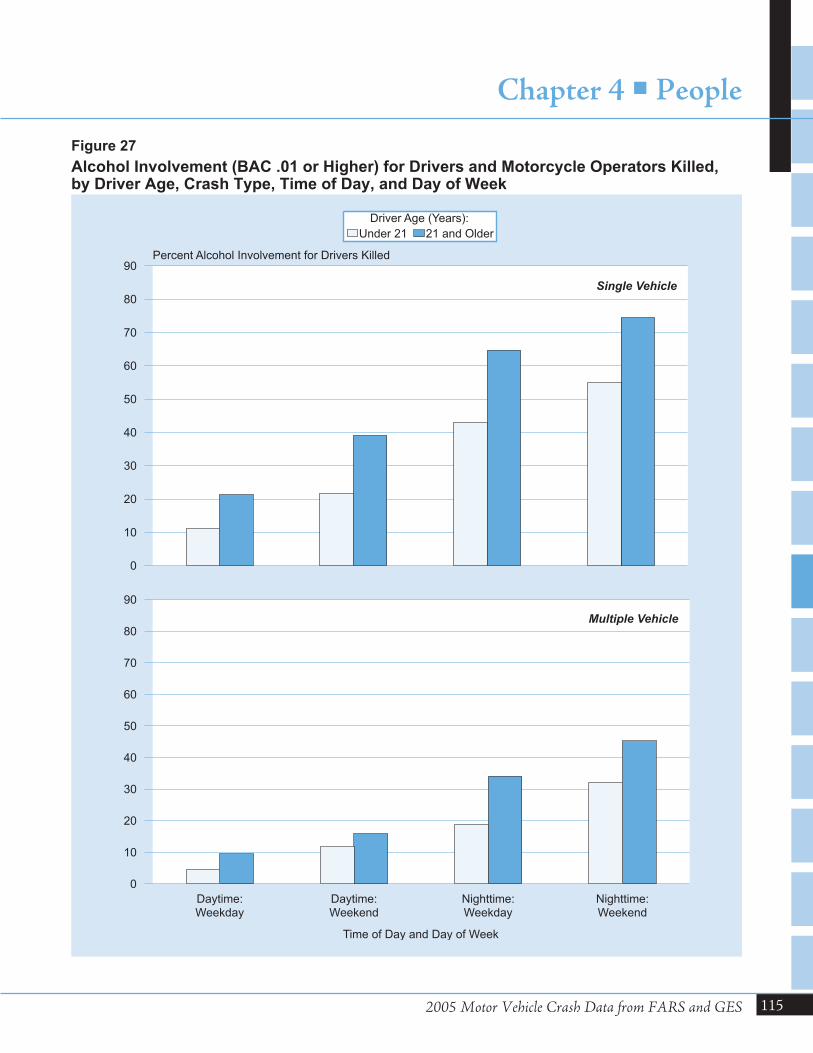
2005 Motor Vehicle Crash Data from FARS and GES
Chapter 4 � People
115
0
10
20
30
40
50
60
70
80
90Percent Alcohol Involvement for Drivers Killed
Driver Age (Years):
Under 21 21 and Older
Daytime:Weekday
Daytime:Weekend
Nighttime:Weekday
Nighttime:Weekend
Time of Day and Day of Week
0
10
20
30
40
50
60
70
80
90
Multiple Vehicle
Single Vehicle
Figure 27
Alcohol Involvement (BAC .01 or Higher) for Drivers and Motorcycle Operators Killed,by Driver Age, Crash Type, Time of Day, and Day of Week
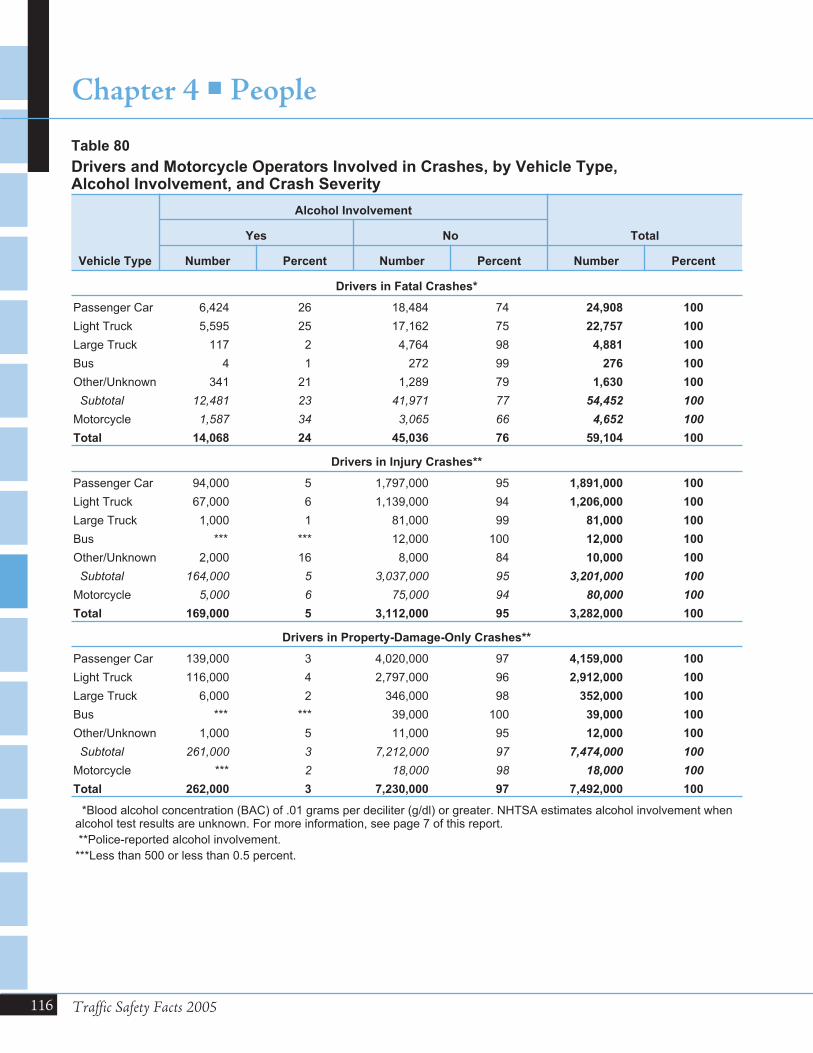
116 Traffic Safety Facts 2005
Chapter 4 � People
Vehicle Type
Alcohol Involvement
TotalYes No
Number Percent Number Percent Number Percent
Drivers in Fatal Crashes*
Passenger Car 6,424 26 18,484 74 24,908 100
Light Truck 5,595 25 17,162 75 22,757 100
Large Truck 117 2 4,764 98 4,881 100
Bus 4 1 272 99 276 100
Other/Unknown 341 21 1,289 79 1,630 100
Subtotal 12,481 23 41,971 77 54,452 100
Motorcycle 1,587 34 3,065 66 4,652 100
Total 14,068 24 45,036 76 59,104 100
Drivers in Injury Crashes**
Passenger Car 94,000 5 1,797,000 95 1,891,000 100
Light Truck 67,000 6 1,139,000 94 1,206,000 100
Large Truck 1,000 1 81,000 99 81,000 100
Bus *** *** 12,000 100 12,000 100
Other/Unknown 2,000 16 8,000 84 10,000 100
Subtotal 164,000 5 3,037,000 95 3,201,000 100
Motorcycle 5,000 6 75,000 94 80,000 100
Total 169,000 5 3,112,000 95 3,282,000 100
Drivers in Property-Damage-Only Crashes**
Passenger Car 139,000 3 4,020,000 97 4,159,000 100
Light Truck 116,000 4 2,797,000 96 2,912,000 100
Large Truck 6,000 2 346,000 98 352,000 100
Bus *** *** 39,000 100 39,000 100
Other/Unknown 1,000 5 11,000 95 12,000 100
Subtotal 261,000 3 7,212,000 97 7,474,000 100
Motorcycle *** 2 18,000 98 18,000 100
Total 262,000 3 7,230,000 97 7,492,000 100
*Blood alcohol concentration (BAC) of .01 grams per deciliter (g/dl) or greater. NHTSA estimates alcohol involvement whenalcohol test results are unknown. For more information, see page 7 of this report.
**Police-reported alcohol involvement.
***Less than 500 or less than 0.5 percent.
Table 80
Drivers and Motorcycle Operators Involved in Crashes, by Vehicle Type,Alcohol Involvement, and Crash Severity
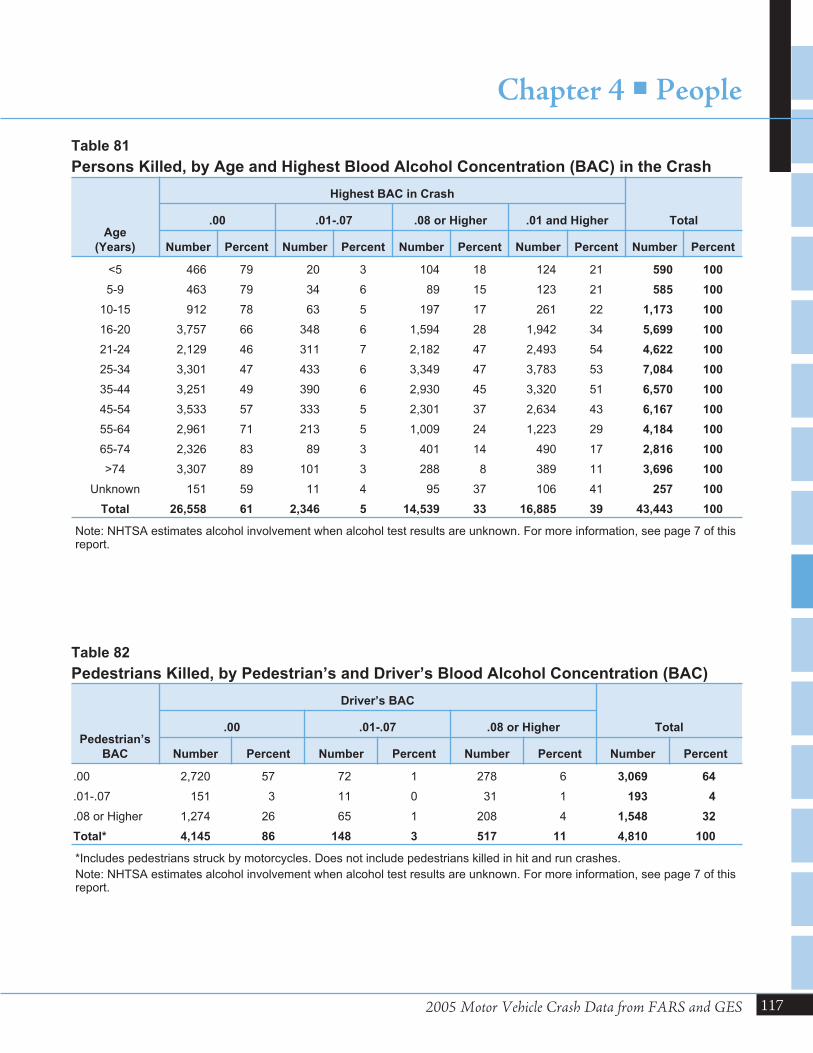
2005 Motor Vehicle Crash Data from FARS and GES
Chapter 4 � People
117
Age
(Years)
Highest BAC in Crash
Total.00 .01-.07 .08 or Higher .01 and Higher
Number Percent Number Percent Number Percent Number Percent Number Percent
<5 466 79 20 3 104 18 124 21 590 100
5-9 463 79 34 6 89 15 123 21 585 100
10-15 912 78 63 5 197 17 261 22 1,173 100
16-20 3,757 66 348 6 1,594 28 1,942 34 5,699 100
21-24 2,129 46 311 7 2,182 47 2,493 54 4,622 100
25-34 3,301 47 433 6 3,349 47 3,783 53 7,084 100
35-44 3,251 49 390 6 2,930 45 3,320 51 6,570 100
45-54 3,533 57 333 5 2,301 37 2,634 43 6,167 100
55-64 2,961 71 213 5 1,009 24 1,223 29 4,184 100
65-74 2,326 83 89 3 401 14 490 17 2,816 100
>74 3,307 89 101 3 288 8 389 11 3,696 100
Unknown 151 59 11 4 95 37 106 41 257 100
Total 26,558 61 2,346 5 14,539 33 16,885 39 43,443 100
Note: NHTSA estimates alcohol involvement when alcohol test results are unknown. For more information, see page 7 of thisreport.
Table 81
Persons Killed, by Age and Highest Blood Alcohol Concentration (BAC) in the Crash
Pedestrian’s
BAC
Driver’s BAC
Total.00 .01-.07 .08 or Higher
Number Percent Number Percent Number Percent Number Percent
.00 2,720 57 72 1 278 6 3,069 64
.01-.07 151 3 11 0 31 1 193 4
.08 or Higher 1,274 26 65 1 208 4 1,548 32
Total* 4,145 86 148 3 517 11 4,810 100
*Includes pedestrians struck by motorcycles. Does not include pedestrians killed in hit and run crashes.
Note: NHTSA estimates alcohol involvement when alcohol test results are unknown. For more information, see page 7 of thisreport.
Table 82
Pedestrians Killed, by Pedestrian’s and Driver’s Blood Alcohol Concentration (BAC)
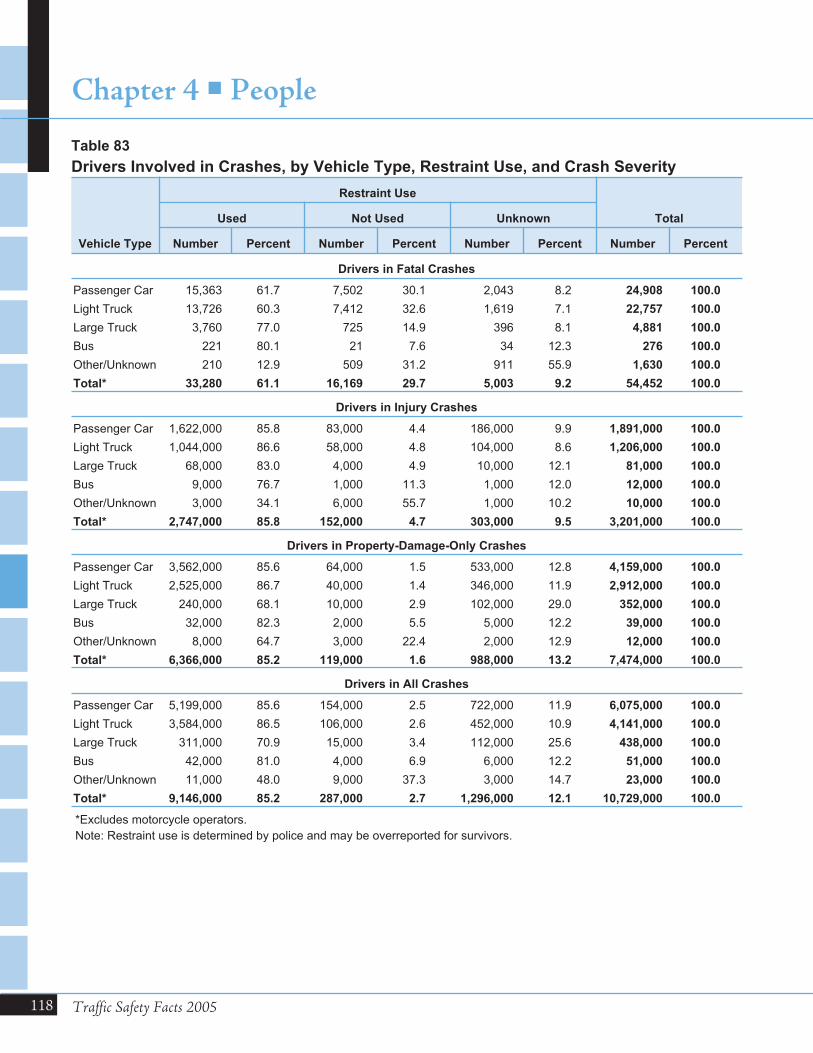
118 Traffic Safety Facts 2005
Chapter 4 � People
Vehicle Type
Restraint Use
TotalUsed Not Used Unknown
Number Percent Number Percent Number Percent Number Percent
Drivers in Fatal Crashes
Passenger Car 15,363 61.7 7,502 30.1 2,043 8.2 24,908 100.0
Light Truck 13,726 60.3 7,412 32.6 1,619 7.1 22,757 100.0
Large Truck 3,760 77.0 725 14.9 396 8.1 4,881 100.0
Bus 221 80.1 21 7.6 34 12.3 276 100.0
Other/Unknown 210 12.9 509 31.2 911 55.9 1,630 100.0
Total* 33,280 61.1 16,169 29.7 5,003 9.2 54,452 100.0
Drivers in Injury Crashes
Passenger Car 1,622,000 85.8 83,000 4.4 186,000 9.9 1,891,000 100.0
Light Truck 1,044,000 86.6 58,000 4.8 104,000 8.6 1,206,000 100.0
Large Truck 68,000 83.0 4,000 4.9 10,000 12.1 81,000 100.0
Bus 9,000 76.7 1,000 11.3 1,000 12.0 12,000 100.0
Other/Unknown 3,000 34.1 6,000 55.7 1,000 10.2 10,000 100.0
Total* 2,747,000 85.8 152,000 4.7 303,000 9.5 3,201,000 100.0
Drivers in Property-Damage-Only Crashes
Passenger Car 3,562,000 85.6 64,000 1.5 533,000 12.8 4,159,000 100.0
Light Truck 2,525,000 86.7 40,000 1.4 346,000 11.9 2,912,000 100.0
Large Truck 240,000 68.1 10,000 2.9 102,000 29.0 352,000 100.0
Bus 32,000 82.3 2,000 5.5 5,000 12.2 39,000 100.0
Other/Unknown 8,000 64.7 3,000 22.4 2,000 12.9 12,000 100.0
Total* 6,366,000 85.2 119,000 1.6 988,000 13.2 7,474,000 100.0
Drivers in All Crashes
Passenger Car 5,199,000 85.6 154,000 2.5 722,000 11.9 6,075,000 100.0
Light Truck 3,584,000 86.5 106,000 2.6 452,000 10.9 4,141,000 100.0
Large Truck 311,000 70.9 15,000 3.4 112,000 25.6 438,000 100.0
Bus 42,000 81.0 4,000 6.9 6,000 12.2 51,000 100.0
Other/Unknown 11,000 48.0 9,000 37.3 3,000 14.7 23,000 100.0
Total* 9,146,000 85.2 287,000 2.7 1,296,000 12.1 10,729,000 100.0
*Excludes motorcycle operators.
Note: Restraint use is determined by police and may be overreported for survivors.
Table 83
Drivers Involved in Crashes, by Vehicle Type, Restraint Use, and Crash Severity
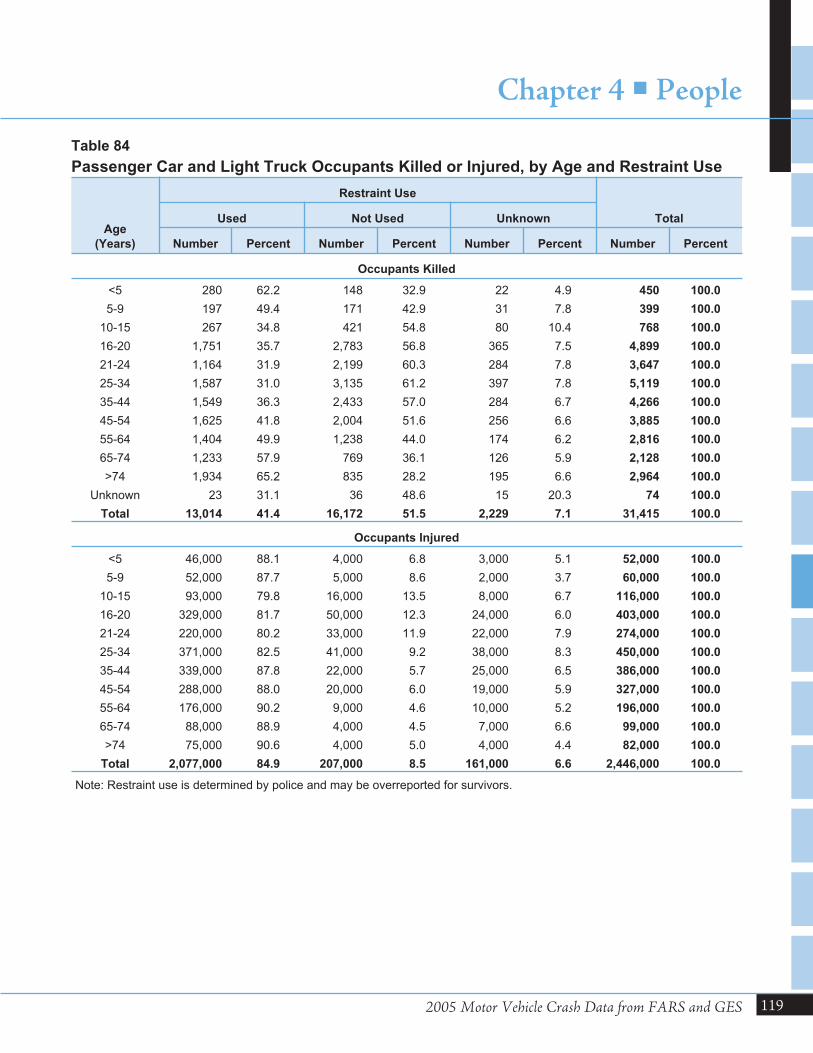
2005 Motor Vehicle Crash Data from FARS and GES
Chapter 4 � People
119
Age
(Years)
Restraint Use
TotalUsed Not Used Unknown
Number Percent Number Percent Number Percent Number Percent
Occupants Killed
<5 280 62.2 148 32.9 22 4.9 450 100.0
5-9 197 49.4 171 42.9 31 7.8 399 100.0
10-15 267 34.8 421 54.8 80 10.4 768 100.0
16-20 1,751 35.7 2,783 56.8 365 7.5 4,899 100.0
21-24 1,164 31.9 2,199 60.3 284 7.8 3,647 100.0
25-34 1,587 31.0 3,135 61.2 397 7.8 5,119 100.0
35-44 1,549 36.3 2,433 57.0 284 6.7 4,266 100.0
45-54 1,625 41.8 2,004 51.6 256 6.6 3,885 100.0
55-64 1,404 49.9 1,238 44.0 174 6.2 2,816 100.0
65-74 1,233 57.9 769 36.1 126 5.9 2,128 100.0
>74 1,934 65.2 835 28.2 195 6.6 2,964 100.0
Unknown 23 31.1 36 48.6 15 20.3 74 100.0
Total 13,014 41.4 16,172 51.5 2,229 7.1 31,415 100.0
Occupants Injured
<5 46,000 88.1 4,000 6.8 3,000 5.1 52,000 100.0
5-9 52,000 87.7 5,000 8.6 2,000 3.7 60,000 100.0
10-15 93,000 79.8 16,000 13.5 8,000 6.7 116,000 100.0
16-20 329,000 81.7 50,000 12.3 24,000 6.0 403,000 100.0
21-24 220,000 80.2 33,000 11.9 22,000 7.9 274,000 100.0
25-34 371,000 82.5 41,000 9.2 38,000 8.3 450,000 100.0
35-44 339,000 87.8 22,000 5.7 25,000 6.5 386,000 100.0
45-54 288,000 88.0 20,000 6.0 19,000 5.9 327,000 100.0
55-64 176,000 90.2 9,000 4.6 10,000 5.2 196,000 100.0
65-74 88,000 88.9 4,000 4.5 7,000 6.6 99,000 100.0
>74 75,000 90.6 4,000 5.0 4,000 4.4 82,000 100.0
Total 2,077,000 84.9 207,000 8.5 161,000 6.6 2,446,000 100.0
Note: Restraint use is determined by police and may be overreported for survivors.
Table 84
Passenger Car and Light Truck Occupants Killed or Injured, by Age and Restraint Use
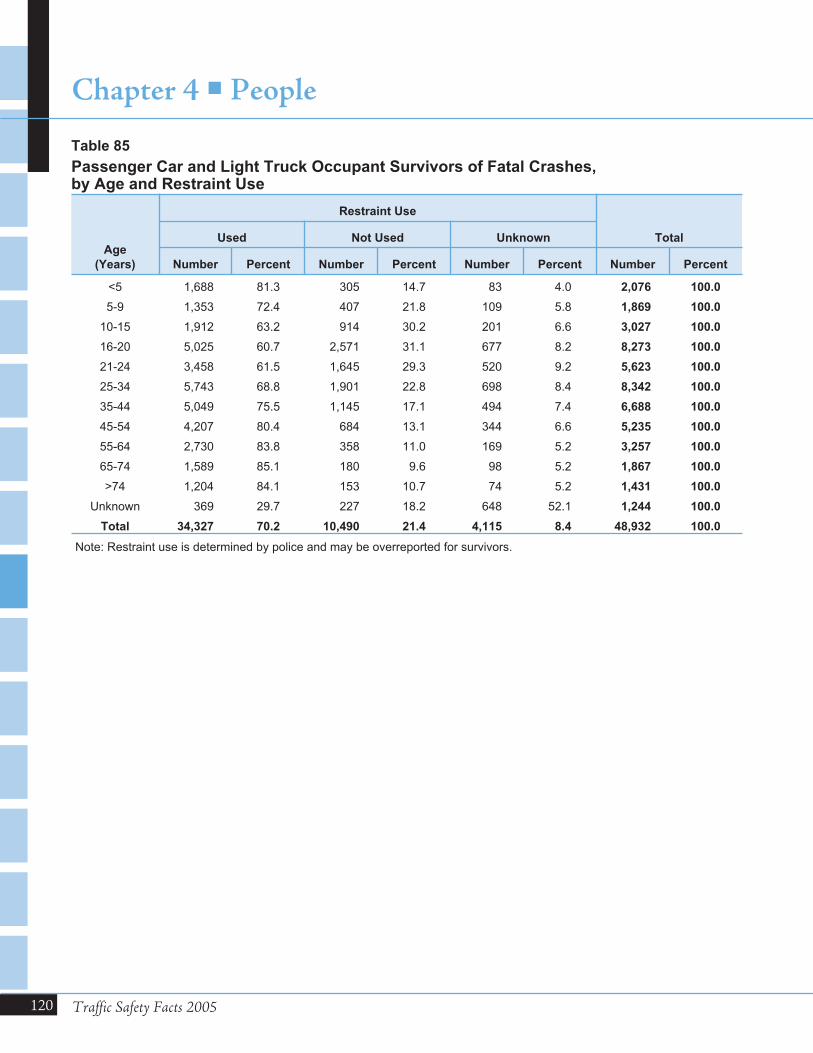
120 Traffic Safety Facts 2005
Chapter 4 � People
Age
(Years)
Restraint Use
TotalUsed Not Used Unknown
Number Percent Number Percent Number Percent Number Percent
<5 1,688 81.3 305 14.7 83 4.0 2,076 100.0
5-9 1,353 72.4 407 21.8 109 5.8 1,869 100.0
10-15 1,912 63.2 914 30.2 201 6.6 3,027 100.0
16-20 5,025 60.7 2,571 31.1 677 8.2 8,273 100.0
21-24 3,458 61.5 1,645 29.3 520 9.2 5,623 100.0
25-34 5,743 68.8 1,901 22.8 698 8.4 8,342 100.0
35-44 5,049 75.5 1,145 17.1 494 7.4 6,688 100.0
45-54 4,207 80.4 684 13.1 344 6.6 5,235 100.0
55-64 2,730 83.8 358 11.0 169 5.2 3,257 100.0
65-74 1,589 85.1 180 9.6 98 5.2 1,867 100.0
>74 1,204 84.1 153 10.7 74 5.2 1,431 100.0
Unknown 369 29.7 227 18.2 648 52.1 1,244 100.0
Total 34,327 70.2 10,490 21.4 4,115 8.4 48,932 100.0
Note: Restraint use is determined by police and may be overreported for survivors.
Table 85
Passenger Car and Light Truck Occupant Survivors of Fatal Crashes,by Age and Restraint Use
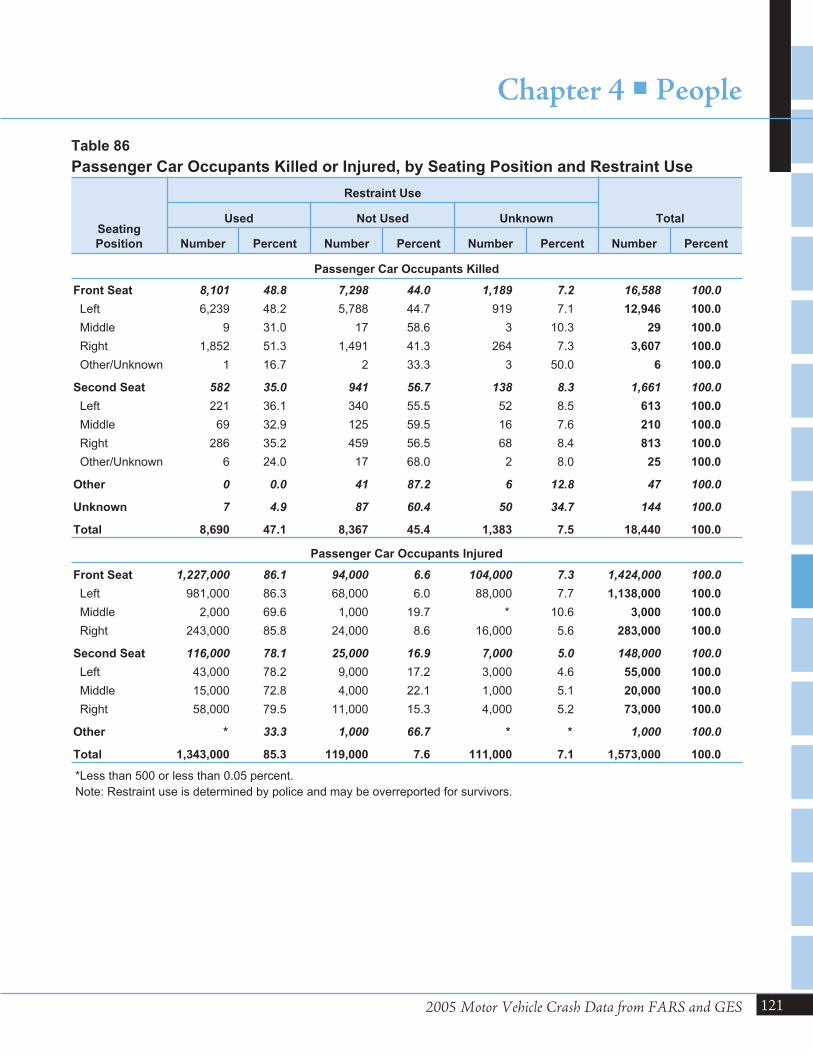
2005 Motor Vehicle Crash Data from FARS and GES
Chapter 4 � People
121
Seating
Position
Restraint Use
TotalUsed Not Used Unknown
Number Percent Number Percent Number Percent Number Percent
Passenger Car Occupants Killed
Front Seat 8,101 48.8 7,298 44.0 1,189 7.2 16,588 100.0
Left 6,239 48.2 5,788 44.7 919 7.1 12,946 100.0
Middle 9 31.0 17 58.6 3 10.3 29 100.0
Right 1,852 51.3 1,491 41.3 264 7.3 3,607 100.0
Other/Unknown 1 16.7 2 33.3 3 50.0 6 100.0
Second Seat 582 35.0 941 56.7 138 8.3 1,661 100.0
Left 221 36.1 340 55.5 52 8.5 613 100.0
Middle 69 32.9 125 59.5 16 7.6 210 100.0
Right 286 35.2 459 56.5 68 8.4 813 100.0
Other/Unknown 6 24.0 17 68.0 2 8.0 25 100.0
Other 0 0.0 41 87.2 6 12.8 47 100.0
Unknown 7 4.9 87 60.4 50 34.7 144 100.0
Total 8,690 47.1 8,367 45.4 1,383 7.5 18,440 100.0
Passenger Car Occupants Injured
Front Seat 1,227,000 86.1 94,000 6.6 104,000 7.3 1,424,000 100.0
Left 981,000 86.3 68,000 6.0 88,000 7.7 1,138,000 100.0
Middle 2,000 69.6 1,000 19.7 * 10.6 3,000 100.0
Right 243,000 85.8 24,000 8.6 16,000 5.6 283,000 100.0
Second Seat 116,000 78.1 25,000 16.9 7,000 5.0 148,000 100.0
Left 43,000 78.2 9,000 17.2 3,000 4.6 55,000 100.0
Middle 15,000 72.8 4,000 22.1 1,000 5.1 20,000 100.0
Right 58,000 79.5 11,000 15.3 4,000 5.2 73,000 100.0
Other * 33.3 1,000 66.7 * * 1,000 100.0
Total 1,343,000 85.3 119,000 7.6 111,000 7.1 1,573,000 100.0
*Less than 500 or less than 0.05 percent.
Note: Restraint use is determined by police and may be overreported for survivors.
Table 86
Passenger Car Occupants Killed or Injured, by Seating Position and Restraint Use
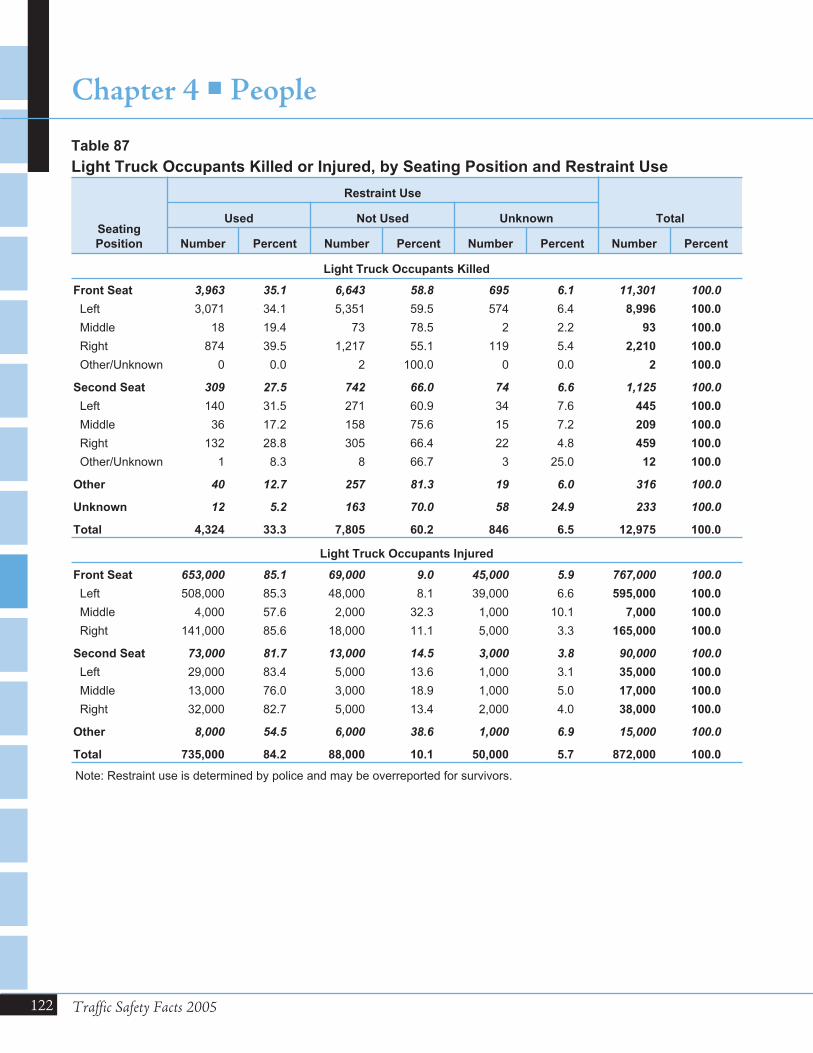
122 Traffic Safety Facts 2005
Chapter 4 � People
Seating
Position
Restraint Use
TotalUsed Not Used Unknown
Number Percent Number Percent Number Percent Number Percent
Light Truck Occupants Killed
Front Seat 3,963 35.1 6,643 58.8 695 6.1 11,301 100.0
Left 3,071 34.1 5,351 59.5 574 6.4 8,996 100.0
Middle 18 19.4 73 78.5 2 2.2 93 100.0
Right 874 39.5 1,217 55.1 119 5.4 2,210 100.0
Other/Unknown 0 0.0 2 100.0 0 0.0 2 100.0
Second Seat 309 27.5 742 66.0 74 6.6 1,125 100.0
Left 140 31.5 271 60.9 34 7.6 445 100.0
Middle 36 17.2 158 75.6 15 7.2 209 100.0
Right 132 28.8 305 66.4 22 4.8 459 100.0
Other/Unknown 1 8.3 8 66.7 3 25.0 12 100.0
Other 40 12.7 257 81.3 19 6.0 316 100.0
Unknown 12 5.2 163 70.0 58 24.9 233 100.0
Total 4,324 33.3 7,805 60.2 846 6.5 12,975 100.0
Light Truck Occupants Injured
Front Seat 653,000 85.1 69,000 9.0 45,000 5.9 767,000 100.0
Left 508,000 85.3 48,000 8.1 39,000 6.6 595,000 100.0
Middle 4,000 57.6 2,000 32.3 1,000 10.1 7,000 100.0
Right 141,000 85.6 18,000 11.1 5,000 3.3 165,000 100.0
Second Seat 73,000 81.7 13,000 14.5 3,000 3.8 90,000 100.0
Left 29,000 83.4 5,000 13.6 1,000 3.1 35,000 100.0
Middle 13,000 76.0 3,000 18.9 1,000 5.0 17,000 100.0
Right 32,000 82.7 5,000 13.4 2,000 4.0 38,000 100.0
Other 8,000 54.5 6,000 38.6 1,000 6.9 15,000 100.0
Total 735,000 84.2 88,000 10.1 50,000 5.7 872,000 100.0
Note: Restraint use is determined by police and may be overreported for survivors.
Table 87
Light Truck Occupants Killed or Injured, by Seating Position and Restraint Use
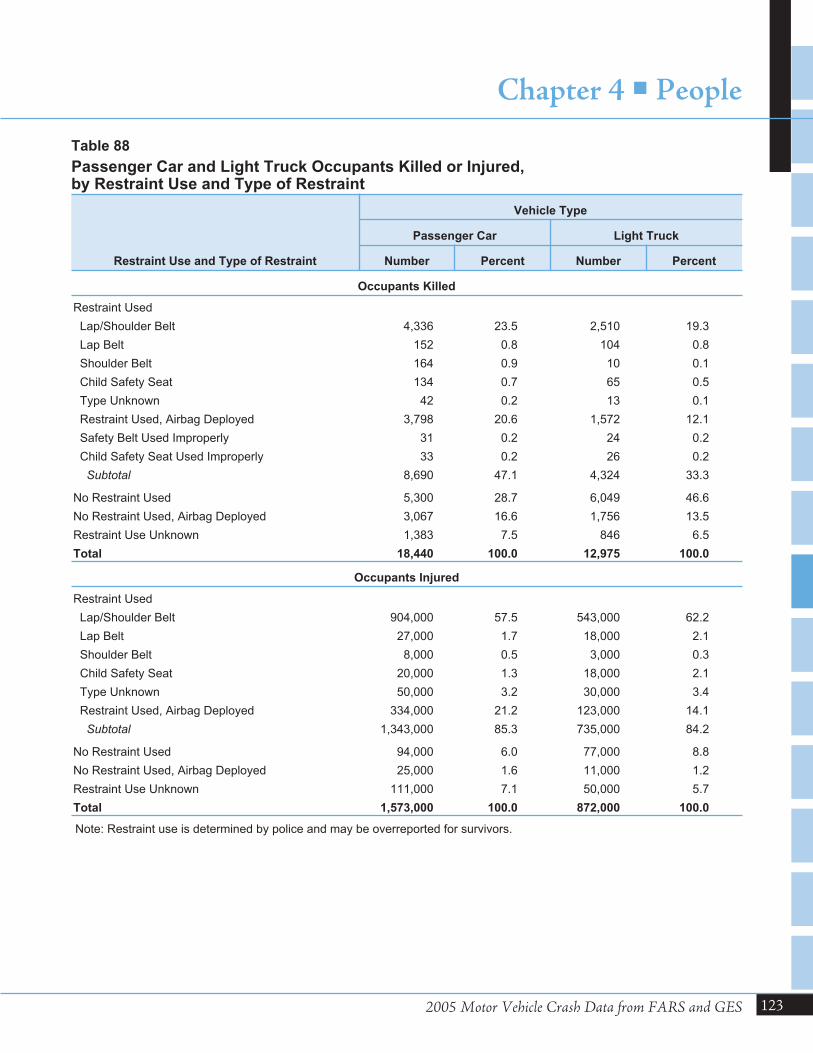
2005 Motor Vehicle Crash Data from FARS and GES
Chapter 4 � People
123
Restraint Use and Type of Restraint
Vehicle Type
Passenger Car Light Truck
Number Percent Number Percent
Occupants Killed
Restraint Used
Lap/Shoulder Belt 4,336 23.5 2,510 19.3
Lap Belt 152 0.8 104 0.8
Shoulder Belt 164 0.9 10 0.1
Child Safety Seat 134 0.7 65 0.5
Type Unknown 42 0.2 13 0.1
Restraint Used, Airbag Deployed 3,798 20.6 1,572 12.1
Safety Belt Used Improperly 31 0.2 24 0.2
Child Safety Seat Used Improperly 33 0.2 26 0.2
Subtotal 8,690 47.1 4,324 33.3
No Restraint Used 5,300 28.7 6,049 46.6
No Restraint Used, Airbag Deployed 3,067 16.6 1,756 13.5
Restraint Use Unknown 1,383 7.5 846 6.5
Total 18,440 100.0 12,975 100.0
Occupants Injured
Restraint Used
Lap/Shoulder Belt 904,000 57.5 543,000 62.2
Lap Belt 27,000 1.7 18,000 2.1
Shoulder Belt 8,000 0.5 3,000 0.3
Child Safety Seat 20,000 1.3 18,000 2.1
Type Unknown 50,000 3.2 30,000 3.4
Restraint Used, Airbag Deployed 334,000 21.2 123,000 14.1
Subtotal 1,343,000 85.3 735,000 84.2
No Restraint Used 94,000 6.0 77,000 8.8
No Restraint Used, Airbag Deployed 25,000 1.6 11,000 1.2
Restraint Use Unknown 111,000 7.1 50,000 5.7
Total 1,573,000 100.0 872,000 100.0
Note: Restraint use is determined by police and may be overreported for survivors.
Table 88
Passenger Car and Light Truck Occupants Killed or Injured,by Restraint Use and Type of Restraint
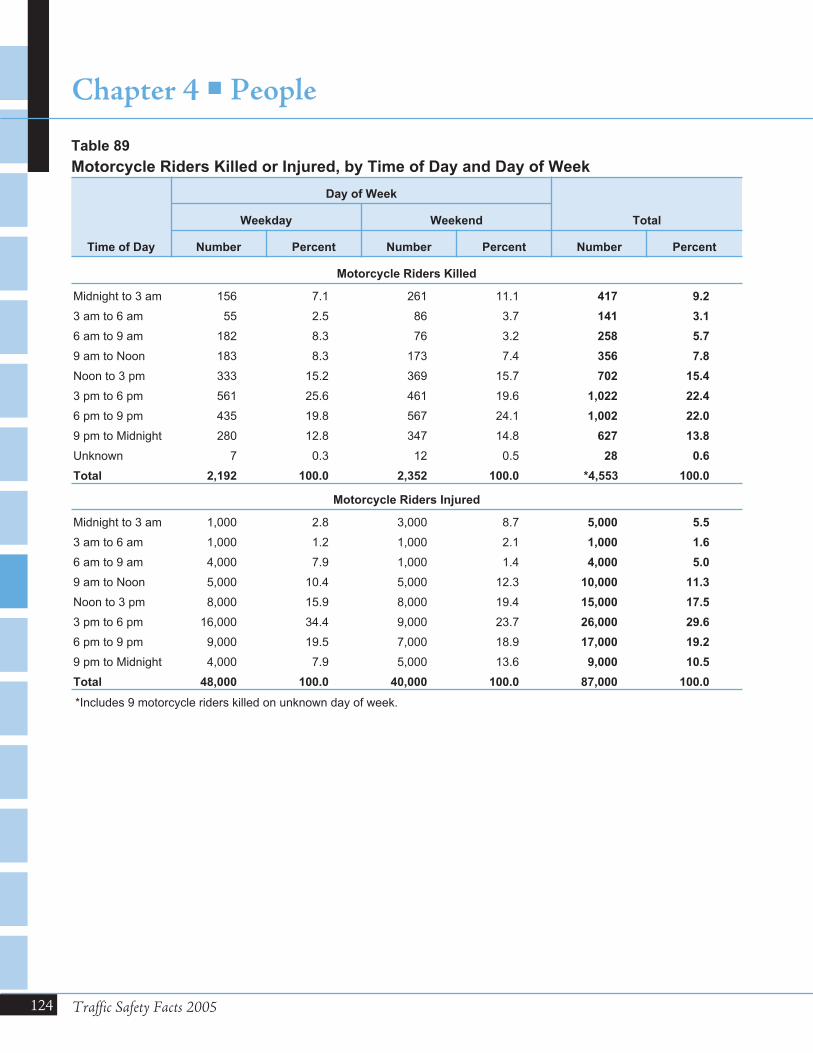
124 Traffic Safety Facts 2005
Chapter 4 � People
Time of Day
Day of Week
TotalWeekday Weekend
Number Percent Number Percent Number Percent
Motorcycle Riders Killed
Midnight to 3 am 156 7.1 261 11.1 417 9.2
3 am to 6 am 55 2.5 86 3.7 141 3.1
6 am to 9 am 182 8.3 76 3.2 258 5.7
9 am to Noon 183 8.3 173 7.4 356 7.8
Noon to 3 pm 333 15.2 369 15.7 702 15.4
3 pm to 6 pm 561 25.6 461 19.6 1,022 22.4
6 pm to 9 pm 435 19.8 567 24.1 1,002 22.0
9 pm to Midnight 280 12.8 347 14.8 627 13.8
Unknown 7 0.3 12 0.5 28 0.6
Total 2,192 100.0 2,352 100.0 *4,553 100.0
Motorcycle Riders Injured
Midnight to 3 am 1,000 2.8 3,000 8.7 5,000 5.5
3 am to 6 am 1,000 1.2 1,000 2.1 1,000 1.6
6 am to 9 am 4,000 7.9 1,000 1.4 4,000 5.0
9 am to Noon 5,000 10.4 5,000 12.3 10,000 11.3
Noon to 3 pm 8,000 15.9 8,000 19.4 15,000 17.5
3 pm to 6 pm 16,000 34.4 9,000 23.7 26,000 29.6
6 pm to 9 pm 9,000 19.5 7,000 18.9 17,000 19.2
9 pm to Midnight 4,000 7.9 5,000 13.6 9,000 10.5
Total 48,000 100.0 40,000 100.0 87,000 100.0
*Includes 9 motorcycle riders killed on unknown day of week.
Table 89
Motorcycle Riders Killed or Injured, by Time of Day and Day of Week
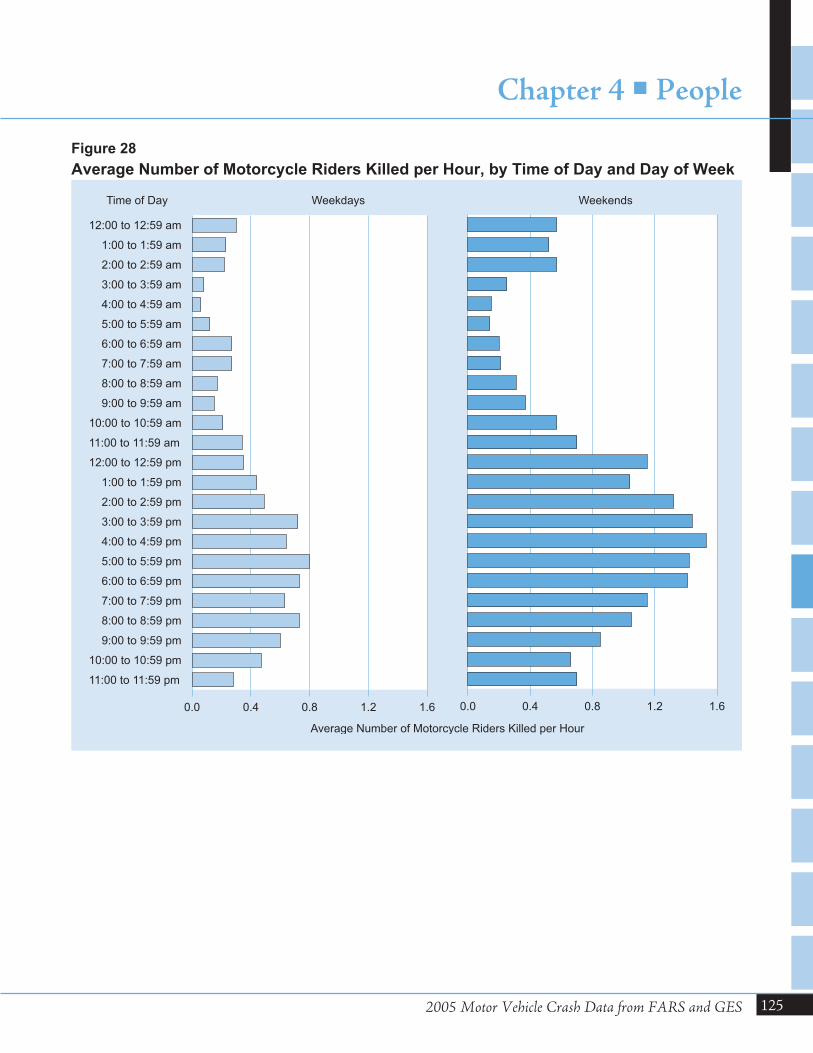
2005 Motor Vehicle Crash Data from FARS and GES
Chapter 4 � People
125
12:00 to 12:59 am
1:00 to 1:59 am
2:00 to 2:59 am
3:00 to 3:59 am
4:00 to 4:59 am
5:00 to 5:59 am
6:00 to 6:59 am
7:00 to 7:59 am
8:00 to 8:59 am
9:00 to 9:59 am
10:00 to 10:59 am
11:00 to 11:59 am
12:00 to 12:59 pm
1:00 to 1:59 pm
2:00 to 2:59 pm
3:00 to 3:59 pm
4:00 to 4:59 pm
5:00 to 5:59 pm
6:00 to 6:59 pm
7:00 to 7:59 pm
8:00 to 8:59 pm
9:00 to 9:59 pm
10:00 to 10:59 pm
11:00 to 11:59 pm
0.0 0.4 0.8 1.2 1.6 0.0 0.4 0.8 1.2 1.6
Average Number of Motorcycle Riders Killed per Hour
Weekdays WeekendsTime of Day
Figure 28
Average Number of Motorcycle Riders Killed per Hour, by Time of Day and Day of Week
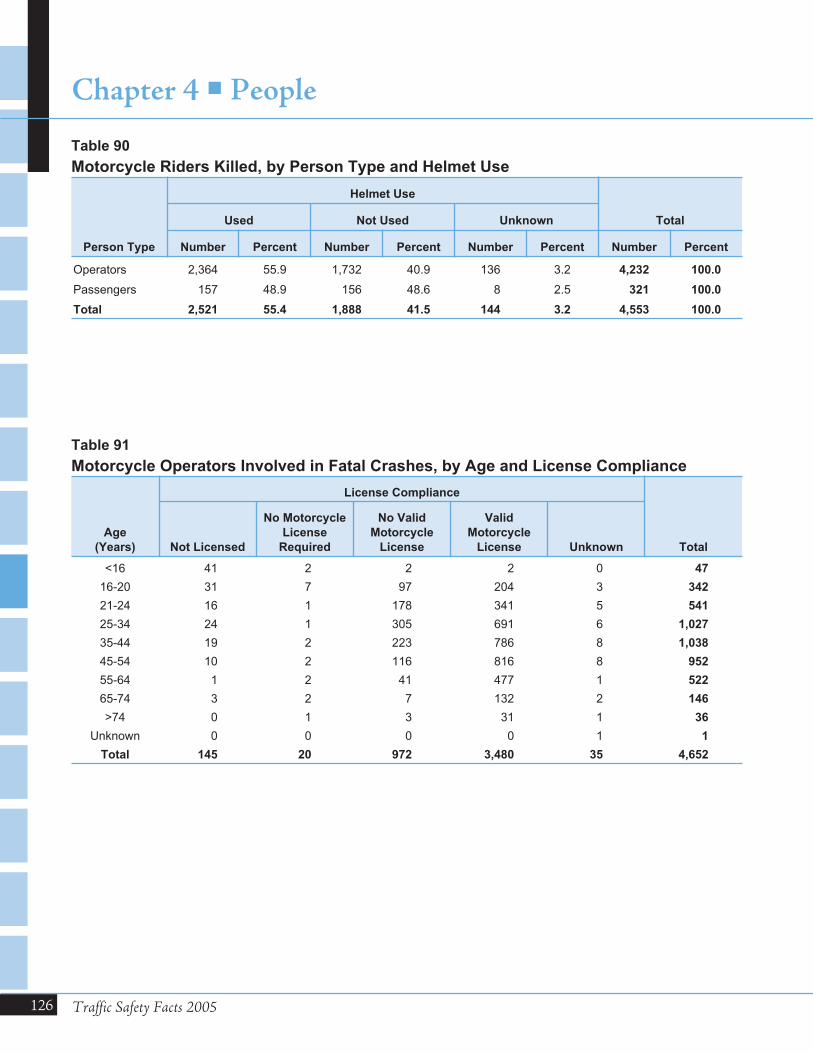
126 Traffic Safety Facts 2005
Chapter 4 � People
Person Type
Helmet Use
TotalUsed Not Used Unknown
Number Percent Number Percent Number Percent Number Percent
Operators 2,364 55.9 1,732 40.9 136 3.2 4,232 100.0
Passengers 157 48.9 156 48.6 8 2.5 321 100.0
Total 2,521 55.4 1,888 41.5 144 3.2 4,553 100.0
Table 90
Motorcycle Riders Killed, by Person Type and Helmet Use
Age
(Years)
License Compliance
TotalNot Licensed
No Motorcycle
License
Required
No Valid
Motorcycle
License
Valid
Motorcycle
License Unknown
<16 41 2 2 2 0 47
16-20 31 7 97 204 3 342
21-24 16 1 178 341 5 541
25-34 24 1 305 691 6 1,027
35-44 19 2 223 786 8 1,038
45-54 10 2 116 816 8 952
55-64 1 2 41 477 1 522
65-74 3 2 7 132 2 146
>74 0 1 3 31 1 36
Unknown 0 0 0 0 1 1
Total 145 20 972 3,480 35 4,652
Table 91
Motorcycle Operators Involved in Fatal Crashes, by Age and License Compliance
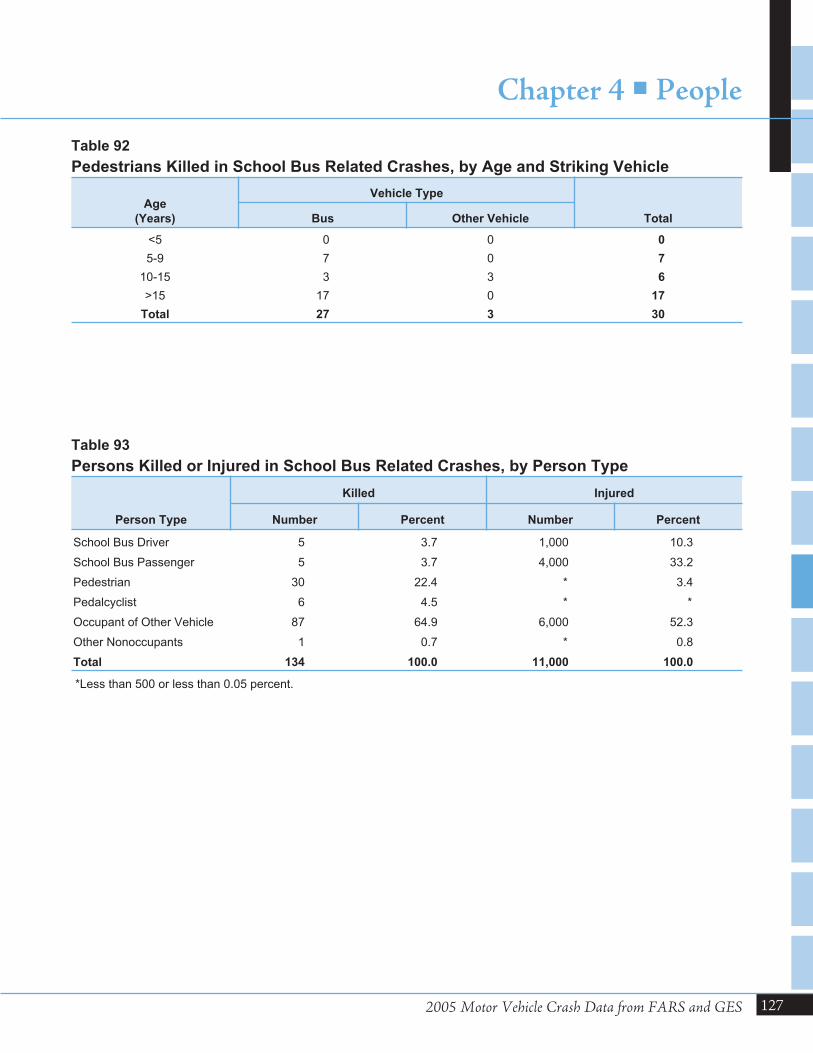
2005 Motor Vehicle Crash Data from FARS and GES
Chapter 4 � People
127
Age
(Years)
Vehicle Type
TotalBus Other Vehicle
<5 0 0 0
5-9 7 0 7
10-15 3 3 6
>15 17 0 17
Total 27 3 30
Table 92
Pedestrians Killed in School Bus Related Crashes, by Age and Striking Vehicle
Person Type
Killed Injured
Number Percent Number Percent
School Bus Driver 5 3.7 1,000 10.3
School Bus Passenger 5 3.7 4,000 33.2
Pedestrian 30 22.4 * 3.4
Pedalcyclist 6 4.5 * *
Occupant of Other Vehicle 87 64.9 6,000 52.3
Other Nonoccupants 1 0.7 * 0.8
Total 134 100.0 11,000 100.0
*Less than 500 or less than 0.05 percent.
Table 93
Persons Killed or Injured in School Bus Related Crashes, by Person Type
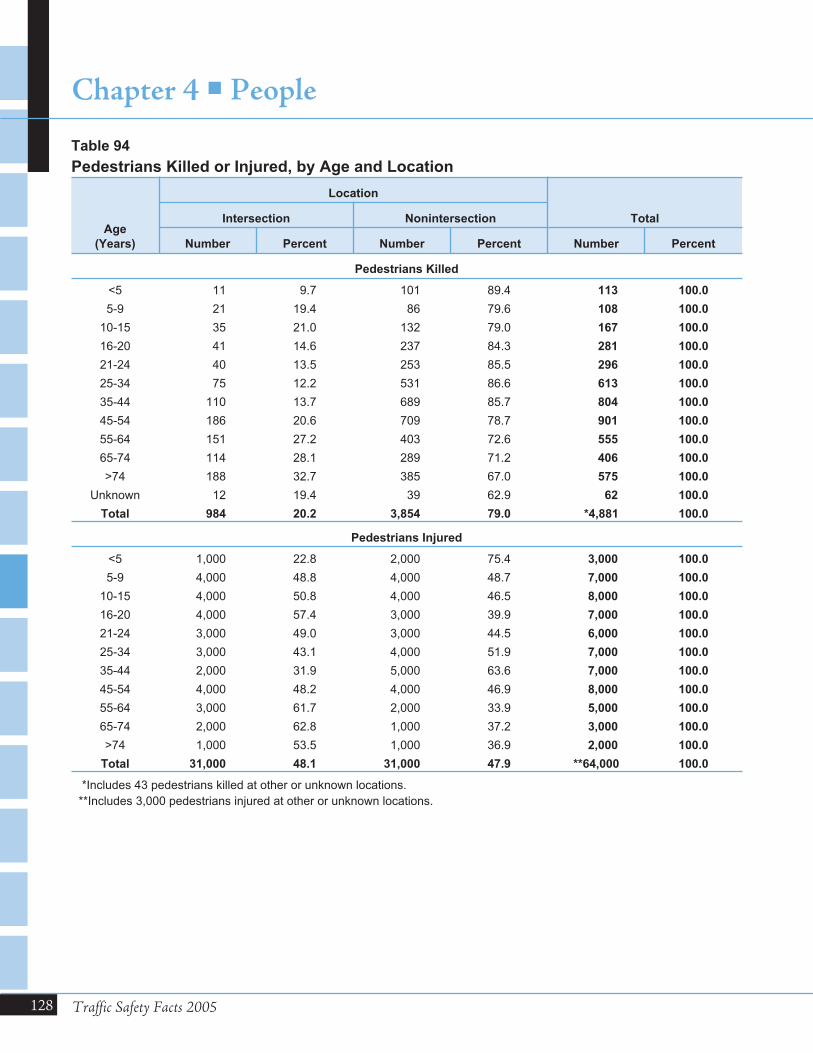
128 Traffic Safety Facts 2005
Chapter 4 � People
Age
(Years)
Location
TotalIntersection Nonintersection
Number Percent Number Percent Number Percent
Pedestrians Killed
<5 11 9.7 101 89.4 113 100.0
5-9 21 19.4 86 79.6 108 100.0
10-15 35 21.0 132 79.0 167 100.0
16-20 41 14.6 237 84.3 281 100.0
21-24 40 13.5 253 85.5 296 100.0
25-34 75 12.2 531 86.6 613 100.0
35-44 110 13.7 689 85.7 804 100.0
45-54 186 20.6 709 78.7 901 100.0
55-64 151 27.2 403 72.6 555 100.0
65-74 114 28.1 289 71.2 406 100.0
>74 188 32.7 385 67.0 575 100.0
Unknown 12 19.4 39 62.9 62 100.0
Total 984 20.2 3,854 79.0 *4,881 100.0
Pedestrians Injured
<5 1,000 22.8 2,000 75.4 3,000 100.0
5-9 4,000 48.8 4,000 48.7 7,000 100.0
10-15 4,000 50.8 4,000 46.5 8,000 100.0
16-20 4,000 57.4 3,000 39.9 7,000 100.0
21-24 3,000 49.0 3,000 44.5 6,000 100.0
25-34 3,000 43.1 4,000 51.9 7,000 100.0
35-44 2,000 31.9 5,000 63.6 7,000 100.0
45-54 4,000 48.2 4,000 46.9 8,000 100.0
55-64 3,000 61.7 2,000 33.9 5,000 100.0
65-74 2,000 62.8 1,000 37.2 3,000 100.0
>74 1,000 53.5 1,000 36.9 2,000 100.0
Total 31,000 48.1 31,000 47.9 **64,000 100.0
*Includes 43 pedestrians killed at other or unknown locations.
**Includes 3,000 pedestrians injured at other or unknown locations.
Table 94
Pedestrians Killed or Injured, by Age and Location
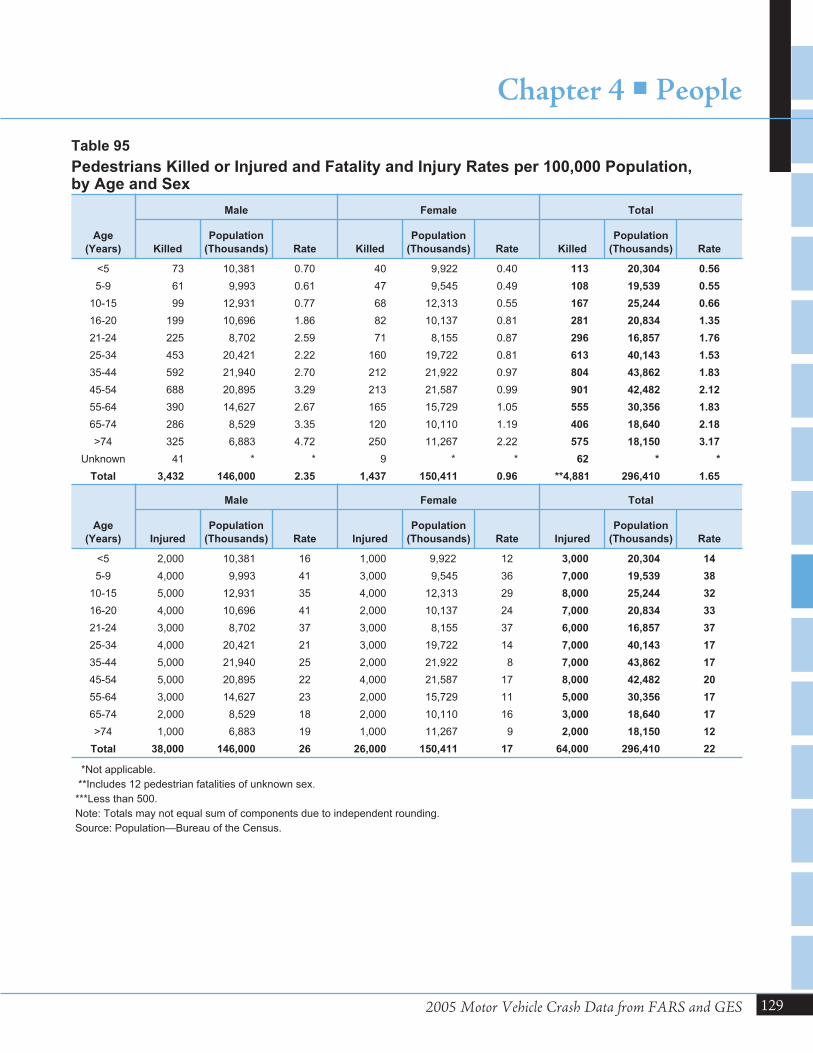
2005 Motor Vehicle Crash Data from FARS and GES
Chapter 4 � People
129
Age
(Years)
Male Female Total
Killed
Population
(Thousands) Rate Killed
Population
(Thousands) Rate Killed
Population
(Thousands) Rate
<5 73 10,381 0.70 40 9,922 0.40 113 20,304 0.56
5-9 61 9,993 0.61 47 9,545 0.49 108 19,539 0.55
10-15 99 12,931 0.77 68 12,313 0.55 167 25,244 0.66
16-20 199 10,696 1.86 82 10,137 0.81 281 20,834 1.35
21-24 225 8,702 2.59 71 8,155 0.87 296 16,857 1.76
25-34 453 20,421 2.22 160 19,722 0.81 613 40,143 1.53
35-44 592 21,940 2.70 212 21,922 0.97 804 43,862 1.83
45-54 688 20,895 3.29 213 21,587 0.99 901 42,482 2.12
55-64 390 14,627 2.67 165 15,729 1.05 555 30,356 1.83
65-74 286 8,529 3.35 120 10,110 1.19 406 18,640 2.18
>74 325 6,883 4.72 250 11,267 2.22 575 18,150 3.17
Unknown 41 * * 9 * * 62 * *
Total 3,432 146,000 2.35 1,437 150,411 0.96 **4,881 296,410 1.65
Age
(Years)
Male Female Total
Injured
Population
(Thousands) Rate Injured
Population
(Thousands) Rate Injured
Population
(Thousands) Rate
<5 2,000 10,381 16 1,000 9,922 12 3,000 20,304 14
5-9 4,000 9,993 41 3,000 9,545 36 7,000 19,539 38
10-15 5,000 12,931 35 4,000 12,313 29 8,000 25,244 32
16-20 4,000 10,696 41 2,000 10,137 24 7,000 20,834 33
21-24 3,000 8,702 37 3,000 8,155 37 6,000 16,857 37
25-34 4,000 20,421 21 3,000 19,722 14 7,000 40,143 17
35-44 5,000 21,940 25 2,000 21,922 8 7,000 43,862 17
45-54 5,000 20,895 22 4,000 21,587 17 8,000 42,482 20
55-64 3,000 14,627 23 2,000 15,729 11 5,000 30,356 17
65-74 2,000 8,529 18 2,000 10,110 16 3,000 18,640 17
>74 1,000 6,883 19 1,000 11,267 9 2,000 18,150 12
Total 38,000 146,000 26 26,000 150,411 17 64,000 296,410 22
*Not applicable.
**Includes 12 pedestrian fatalities of unknown sex.
***Less than 500.
Note: Totals may not equal sum of components due to independent rounding.
Source: Population—Bureau of the Census.
Table 95
Pedestrians Killed or Injured and Fatality and Injury Rates per 100,000 Population,by Age and Sex

130 Traffic Safety Facts 2005
Chapter 4 � People
Time of Day
Day of Week
TotalWeekday Weekend
Number Percent Number Percent Number Percent
Pedestrians Killed
Midnight to 3 am 225 8.0 395 19.2 620 12.7
3 am to 6 am 182 6.5 255 12.4 437 9.0
6 am to 9 am 360 12.8 73 3.6 433 8.9
9 am to Noon 233 8.3 56 2.7 289 5.9
Noon to 3 pm 241 8.5 81 3.9 322 6.6
3 pm to 6 pm 441 15.6 127 6.2 568 11.6
6 pm to 9 pm 627 22.2 550 26.8 1,177 24.1
9 pm to Midnight 498 17.7 509 24.8 1,007 20.6
Unknown 12 0.4 9 0.4 28 0.6
Total 2,819 100.0 2,055 100.0 *4,881 100.0
Pedestrians Injured
Midnight to 3 am 1,000 1.2 2,000 9.0 2,000 3.6
3 am to 6 am ** 0.7 1,000 5.4 1,000 2.2
6 am to 9 am 8,000 17.2 1,000 3.6 8,000 12.9
9 am to Noon 4,000 9.1 1,000 3.1 5,000 7.2
Noon to 3 pm 7,000 15.4 2,000 12.3 9,000 14.4
3 pm to 6 pm 14,000 31.2 3,000 13.0 16,000 25.5
6 pm to 9 pm 7,000 16.0 7,000 35.2 14,000 22.0
9 pm to Midnight 4,000 9.3 4,000 18.4 8,000 12.1
Total 44,000 100.0 20,000 100.0 64,000 100.0
*Includes 7 pedestrians killed at unknown time of day and day of week.
**Less than 500.
Table 96
Pedestrians Killed or Injured, by Time of Day and Day of Week
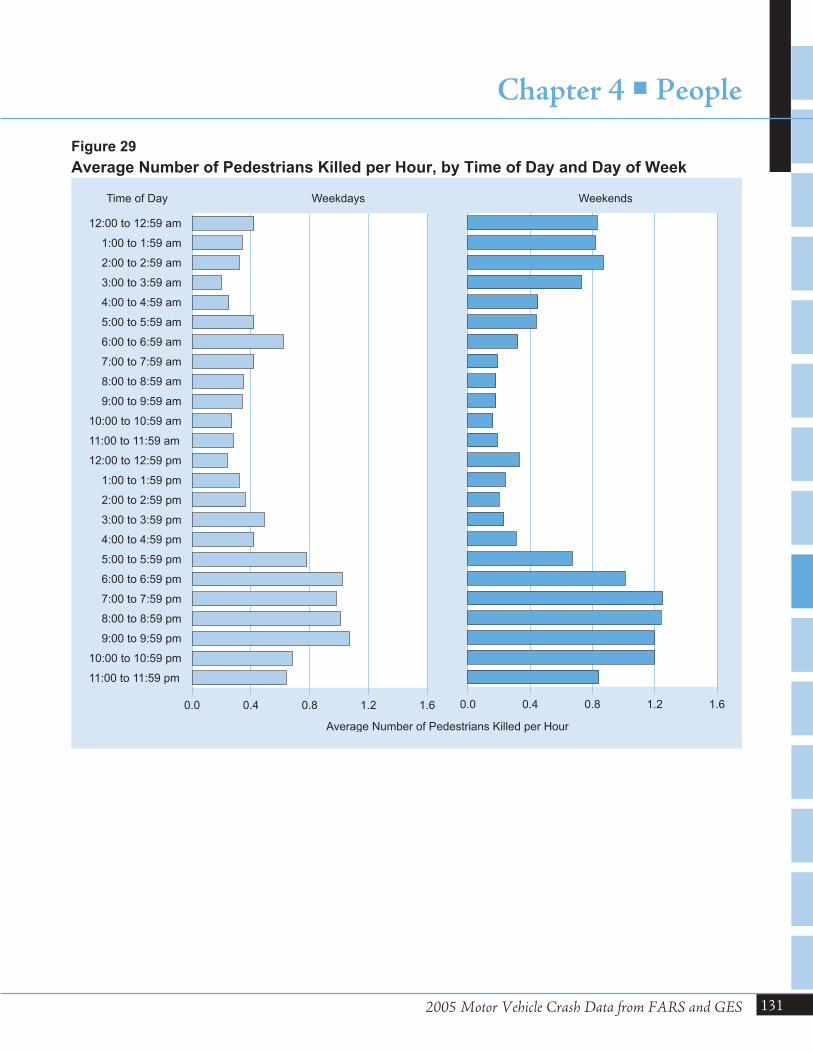
2005 Motor Vehicle Crash Data from FARS and GES
Chapter 4 � People
131
12:00 to 12:59 am
1:00 to 1:59 am
2:00 to 2:59 am
3:00 to 3:59 am
4:00 to 4:59 am
5:00 to 5:59 am
6:00 to 6:59 am
7:00 to 7:59 am
8:00 to 8:59 am
9:00 to 9:59 am
10:00 to 10:59 am
11:00 to 11:59 am
12:00 to 12:59 pm
1:00 to 1:59 pm
2:00 to 2:59 pm
3:00 to 3:59 pm
4:00 to 4:59 pm
5:00 to 5:59 pm
6:00 to 6:59 pm
7:00 to 7:59 pm
8:00 to 8:59 pm
9:00 to 9:59 pm
10:00 to 10:59 pm
11:00 to 11:59 pm
0.0 0.4 0.8 1.2 1.6 0.0 0.4 0.8 1.2 1.6
Average Number of Pedestrians Killed per Hour
Weekdays WeekendsTime of Day
Figure 29
Average Number of Pedestrians Killed per Hour, by Time of Day and Day of Week
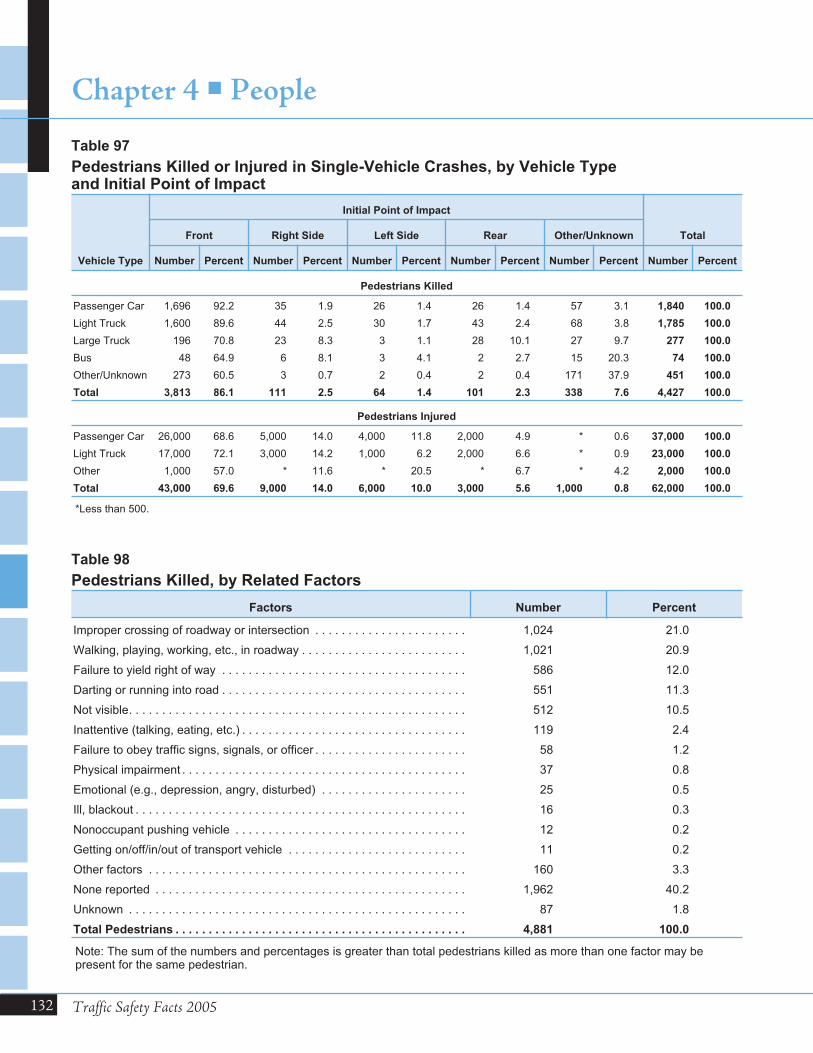
132 Traffic Safety Facts 2005
Chapter 4 � People
Vehicle Type
Initial Point of Impact
TotalFront Right Side Left Side Rear Other/Unknown
Number Percent Number Percent Number Percent Number Percent Number Percent Number Percent
Pedestrians Killed
Passenger Car 1,696 92.2 35 1.9 26 1.4 26 1.4 57 3.1 1,840 100.0
Light Truck 1,600 89.6 44 2.5 30 1.7 43 2.4 68 3.8 1,785 100.0
Large Truck 196 70.8 23 8.3 3 1.1 28 10.1 27 9.7 277 100.0
Bus 48 64.9 6 8.1 3 4.1 2 2.7 15 20.3 74 100.0
Other/Unknown 273 60.5 3 0.7 2 0.4 2 0.4 171 37.9 451 100.0
Total 3,813 86.1 111 2.5 64 1.4 101 2.3 338 7.6 4,427 100.0
Pedestrians Injured
Passenger Car 26,000 68.6 5,000 14.0 4,000 11.8 2,000 4.9 * 0.6 37,000 100.0
Light Truck 17,000 72.1 3,000 14.2 1,000 6.2 2,000 6.6 * 0.9 23,000 100.0
Other 1,000 57.0 * 11.6 * 20.5 * 6.7 * 4.2 2,000 100.0
Total 43,000 69.6 9,000 14.0 6,000 10.0 3,000 5.6 1,000 0.8 62,000 100.0
*Less than 500.
Table 97
Pedestrians Killed or Injured in Single-Vehicle Crashes, by Vehicle Typeand Initial Point of Impact
Factors Number Percent
Improper crossing of roadway or intersection . . . . . . . . . . . . . . . . . . . . . . . 1,024 21.0
Walking, playing, working, etc., in roadway . . . . . . . . . . . . . . . . . . . . . . . . . 1,021 20.9
Failure to yield right of way . . . . . . . . . . . . . . . . . . . . . . . . . . . . . . . . . . . . . 586 12.0
Darting or running into road . . . . . . . . . . . . . . . . . . . . . . . . . . . . . . . . . . . . . 551 11.3
Not visible. . . . . . . . . . . . . . . . . . . . . . . . . . . . . . . . . . . . . . . . . . . . . . . . . . . 512 10.5
Inattentive (talking, eating, etc.) . . . . . . . . . . . . . . . . . . . . . . . . . . . . . . . . . . 119 2.4
Failure to obey traffic signs, signals, or officer . . . . . . . . . . . . . . . . . . . . . . . 58 1.2
Physical impairment . . . . . . . . . . . . . . . . . . . . . . . . . . . . . . . . . . . . . . . . . . . 37 0.8
Emotional (e.g., depression, angry, disturbed) . . . . . . . . . . . . . . . . . . . . . . 25 0.5
Ill, blackout . . . . . . . . . . . . . . . . . . . . . . . . . . . . . . . . . . . . . . . . . . . . . . . . . . 16 0.3
Nonoccupant pushing vehicle . . . . . . . . . . . . . . . . . . . . . . . . . . . . . . . . . . . 12 0.2
Getting on/off/in/out of transport vehicle . . . . . . . . . . . . . . . . . . . . . . . . . . . 11 0.2
Other factors . . . . . . . . . . . . . . . . . . . . . . . . . . . . . . . . . . . . . . . . . . . . . . . . 160 3.3
None reported . . . . . . . . . . . . . . . . . . . . . . . . . . . . . . . . . . . . . . . . . . . . . . . 1,962 40.2
Unknown . . . . . . . . . . . . . . . . . . . . . . . . . . . . . . . . . . . . . . . . . . . . . . . . . . . 87 1.8
Total Pedestrians . . . . . . . . . . . . . . . . . . . . . . . . . . . . . . . . . . . . . . . . . . . . 4,881 100.0
Note: The sum of the numbers and percentages is greater than total pedestrians killed as more than one factor may bepresent for the same pedestrian.
Table 98
Pedestrians Killed, by Related Factors
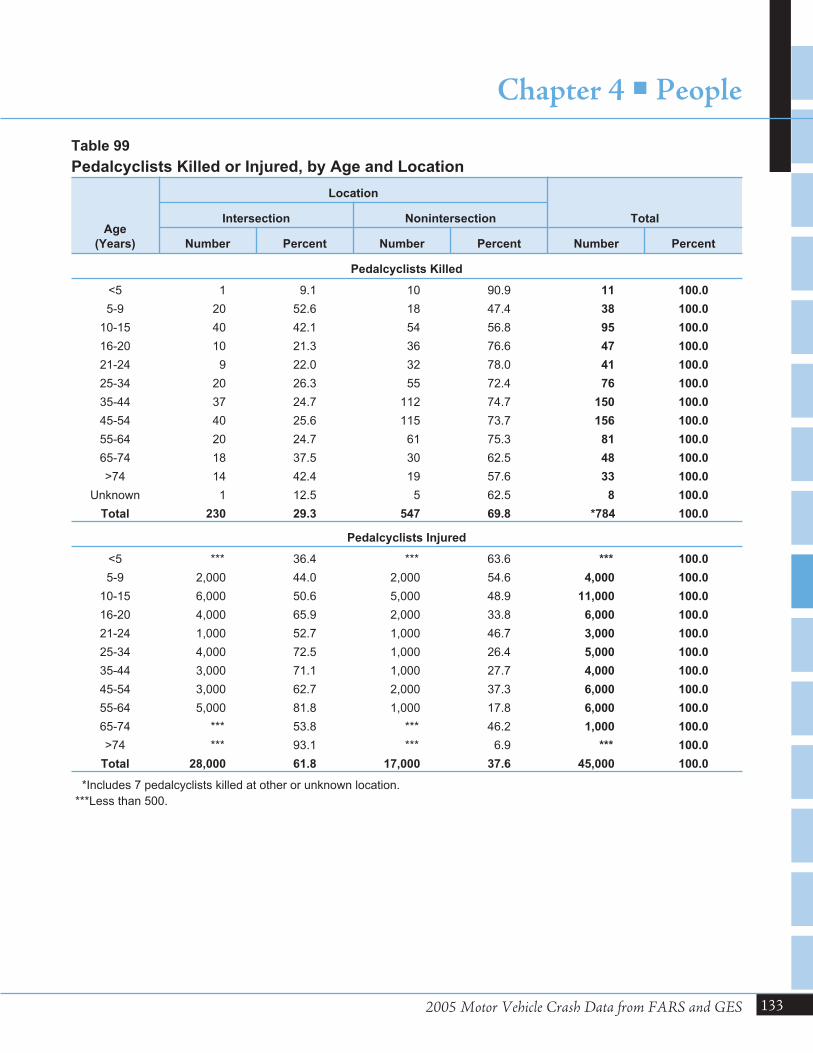
2005 Motor Vehicle Crash Data from FARS and GES
Chapter 4 � People
133
Age
(Years)
Location
TotalIntersection Nonintersection
Number Percent Number Percent Number Percent
Pedalcyclists Killed
<5 1 9.1 10 90.9 11 100.0
5-9 20 52.6 18 47.4 38 100.0
10-15 40 42.1 54 56.8 95 100.0
16-20 10 21.3 36 76.6 47 100.0
21-24 9 22.0 32 78.0 41 100.0
25-34 20 26.3 55 72.4 76 100.0
35-44 37 24.7 112 74.7 150 100.0
45-54 40 25.6 115 73.7 156 100.0
55-64 20 24.7 61 75.3 81 100.0
65-74 18 37.5 30 62.5 48 100.0
>74 14 42.4 19 57.6 33 100.0
Unknown 1 12.5 5 62.5 8 100.0
Total 230 29.3 547 69.8 *784 100.0
Pedalcyclists Injured
<5 *** 36.4 *** 63.6 *** 100.0
5-9 2,000 44.0 2,000 54.6 4,000 100.0
10-15 6,000 50.6 5,000 48.9 11,000 100.0
16-20 4,000 65.9 2,000 33.8 6,000 100.0
21-24 1,000 52.7 1,000 46.7 3,000 100.0
25-34 4,000 72.5 1,000 26.4 5,000 100.0
35-44 3,000 71.1 1,000 27.7 4,000 100.0
45-54 3,000 62.7 2,000 37.3 6,000 100.0
55-64 5,000 81.8 1,000 17.8 6,000 100.0
65-74 *** 53.8 *** 46.2 1,000 100.0
>74 *** 93.1 *** 6.9 *** 100.0
Total 28,000 61.8 17,000 37.6 45,000 100.0
*Includes 7 pedalcyclists killed at other or unknown location.
***Less than 500.
Table 99
Pedalcyclists Killed or Injured, by Age and Location
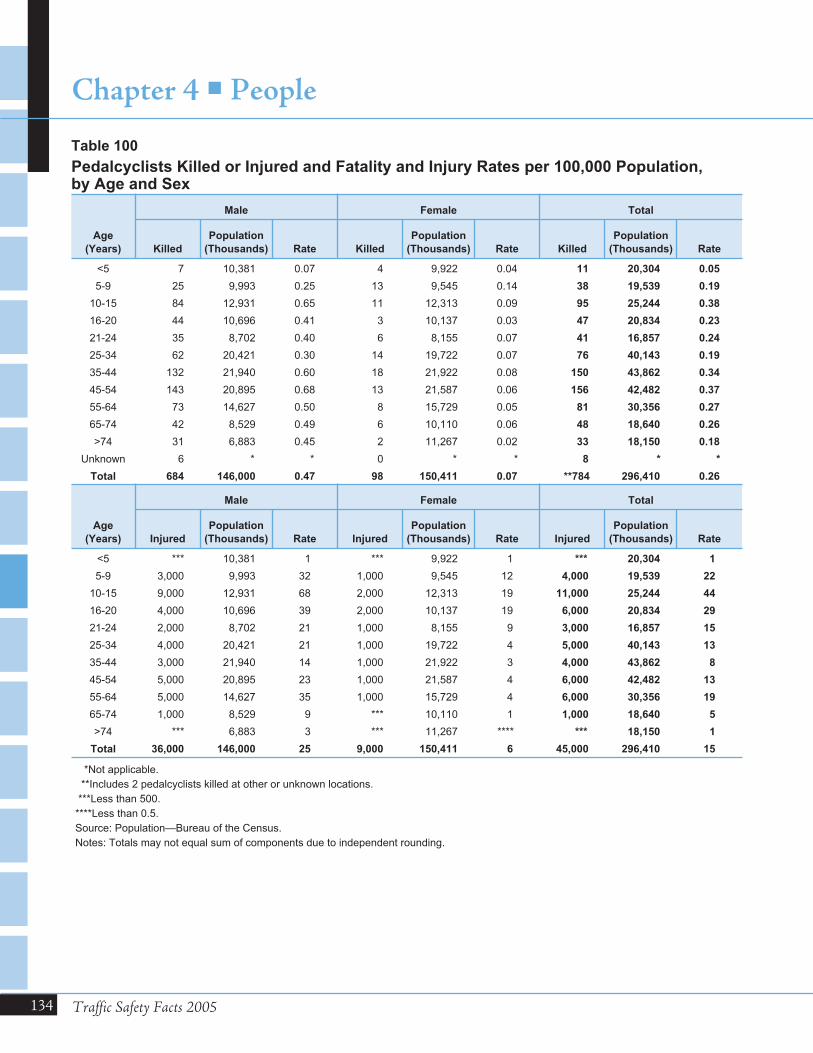
134 Traffic Safety Facts 2005
Chapter 4 � People
Age
(Years)
Male Female Total
Killed
Population
(Thousands) Rate Killed
Population
(Thousands) Rate Killed
Population
(Thousands) Rate
<5 7 10,381 0.07 4 9,922 0.04 11 20,304 0.05
5-9 25 9,993 0.25 13 9,545 0.14 38 19,539 0.19
10-15 84 12,931 0.65 11 12,313 0.09 95 25,244 0.38
16-20 44 10,696 0.41 3 10,137 0.03 47 20,834 0.23
21-24 35 8,702 0.40 6 8,155 0.07 41 16,857 0.24
25-34 62 20,421 0.30 14 19,722 0.07 76 40,143 0.19
35-44 132 21,940 0.60 18 21,922 0.08 150 43,862 0.34
45-54 143 20,895 0.68 13 21,587 0.06 156 42,482 0.37
55-64 73 14,627 0.50 8 15,729 0.05 81 30,356 0.27
65-74 42 8,529 0.49 6 10,110 0.06 48 18,640 0.26
>74 31 6,883 0.45 2 11,267 0.02 33 18,150 0.18
Unknown 6 * * 0 * * 8 * *
Total 684 146,000 0.47 98 150,411 0.07 **784 296,410 0.26
Age
(Years)
Male Female Total
Injured
Population
(Thousands) Rate Injured
Population
(Thousands) Rate Injured
Population
(Thousands) Rate
<5 *** 10,381 1 *** 9,922 1 *** 20,304 1
5-9 3,000 9,993 32 1,000 9,545 12 4,000 19,539 22
10-15 9,000 12,931 68 2,000 12,313 19 11,000 25,244 44
16-20 4,000 10,696 39 2,000 10,137 19 6,000 20,834 29
21-24 2,000 8,702 21 1,000 8,155 9 3,000 16,857 15
25-34 4,000 20,421 21 1,000 19,722 4 5,000 40,143 13
35-44 3,000 21,940 14 1,000 21,922 3 4,000 43,862 8
45-54 5,000 20,895 23 1,000 21,587 4 6,000 42,482 13
55-64 5,000 14,627 35 1,000 15,729 4 6,000 30,356 19
65-74 1,000 8,529 9 *** 10,110 1 1,000 18,640 5
>74 *** 6,883 3 *** 11,267 **** *** 18,150 1
Total 36,000 146,000 25 9,000 150,411 6 45,000 296,410 15
*Not applicable.
**Includes 2 pedalcyclists killed at other or unknown locations.
***Less than 500.
****Less than 0.5.
Source: Population—Bureau of the Census.
Notes: Totals may not equal sum of components due to independent rounding.
Table 100
Pedalcyclists Killed or Injured and Fatality and Injury Rates per 100,000 Population,by Age and Sex
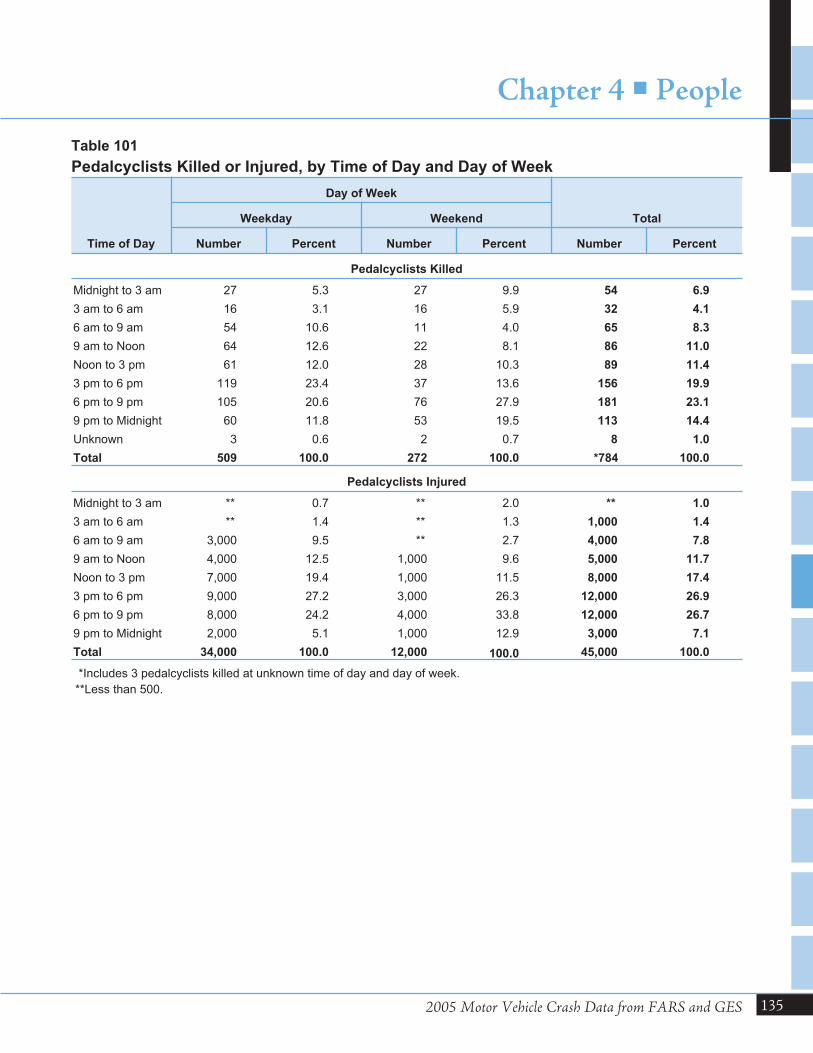
2005 Motor Vehicle Crash Data from FARS and GES
Chapter 4 � People
135
Time of Day
Day of Week
TotalWeekday Weekend
Number Percent Number Percent Number Percent
Pedalcyclists Killed
Midnight to 3 am 27 5.3 27 9.9 54 6.9
3 am to 6 am 16 3.1 16 5.9 32 4.1
6 am to 9 am 54 10.6 11 4.0 65 8.3
9 am to Noon 64 12.6 22 8.1 86 11.0
Noon to 3 pm 61 12.0 28 10.3 89 11.4
3 pm to 6 pm 119 23.4 37 13.6 156 19.9
6 pm to 9 pm 105 20.6 76 27.9 181 23.1
9 pm to Midnight 60 11.8 53 19.5 113 14.4
Unknown 3 0.6 2 0.7 8 1.0
Total 509 100.0 272 100.0 *784 100.0
Pedalcyclists Injured
Midnight to 3 am ** 0.7 ** 2.0 ** 1.0
3 am to 6 am ** 1.4 ** 1.3 1,000 1.4
6 am to 9 am 3,000 9.5 ** 2.7 4,000 7.8
9 am to Noon 4,000 12.5 1,000 9.6 5,000 11.7
Noon to 3 pm 7,000 19.4 1,000 11.5 8,000 17.4
3 pm to 6 pm 9,000 27.2 3,000 26.3 12,000 26.9
6 pm to 9 pm 8,000 24.2 4,000 33.8 12,000 26.7
9 pm to Midnight 2,000 5.1 1,000 12.9 3,000 7.1
Total 34,000 100.0 12,000 100.0 45,000 100.0
*Includes 3 pedalcyclists killed at unknown time of day and day of week.
**Less than 500.
Table 101
Pedalcyclists Killed or Injured, by Time of Day and Day of Week
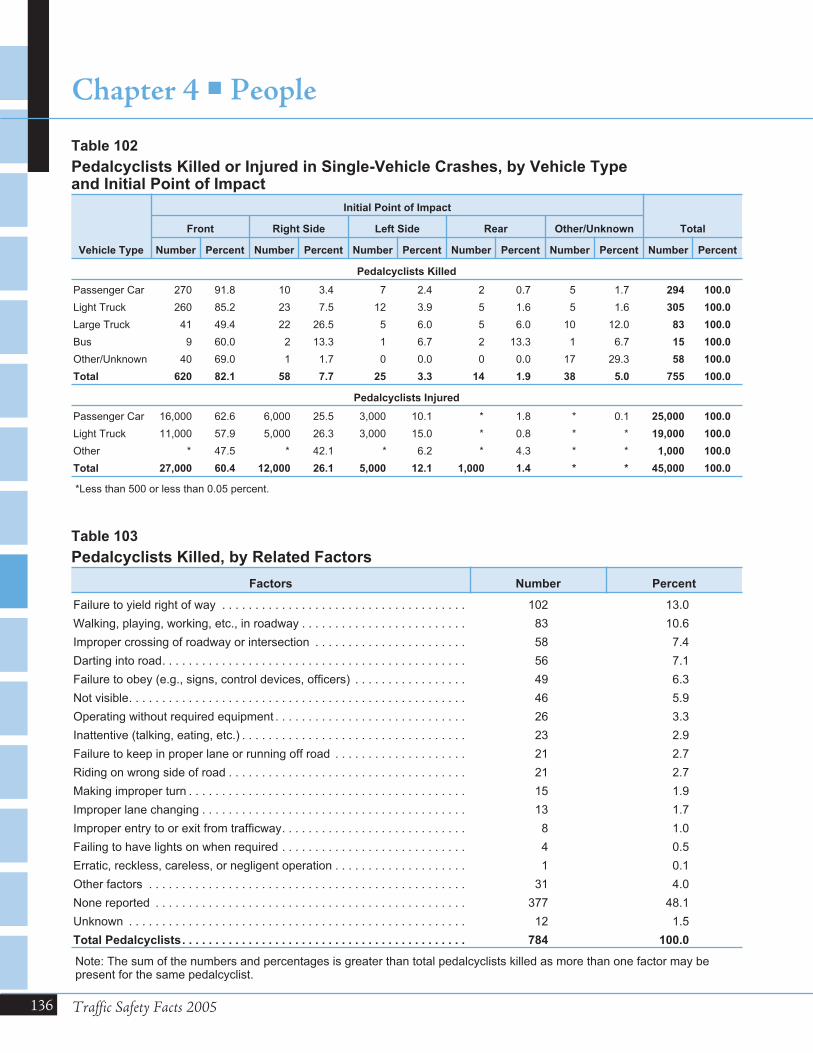
136 Traffic Safety Facts 2005
Chapter 4 � People
Vehicle Type
Initial Point of Impact
TotalFront Right Side Left Side Rear Other/Unknown
Number Percent Number Percent Number Percent Number Percent Number Percent Number Percent
Pedalcyclists Killed
Passenger Car 270 91.8 10 3.4 7 2.4 2 0.7 5 1.7 294 100.0
Light Truck 260 85.2 23 7.5 12 3.9 5 1.6 5 1.6 305 100.0
Large Truck 41 49.4 22 26.5 5 6.0 5 6.0 10 12.0 83 100.0
Bus 9 60.0 2 13.3 1 6.7 2 13.3 1 6.7 15 100.0
Other/Unknown 40 69.0 1 1.7 0 0.0 0 0.0 17 29.3 58 100.0
Total 620 82.1 58 7.7 25 3.3 14 1.9 38 5.0 755 100.0
Pedalcyclists Injured
Passenger Car 16,000 62.6 6,000 25.5 3,000 10.1 * 1.8 * 0.1 25,000 100.0
Light Truck 11,000 57.9 5,000 26.3 3,000 15.0 * 0.8 * * 19,000 100.0
Other * 47.5 * 42.1 * 6.2 * 4.3 * * 1,000 100.0
Total 27,000 60.4 12,000 26.1 5,000 12.1 1,000 1.4 * * 45,000 100.0
*Less than 500 or less than 0.05 percent.
Table 102
Pedalcyclists Killed or Injured in Single-Vehicle Crashes, by Vehicle Typeand Initial Point of Impact
Factors Number Percent
Failure to yield right of way . . . . . . . . . . . . . . . . . . . . . . . . . . . . . . . . . . . . . 102 13.0
Walking, playing, working, etc., in roadway . . . . . . . . . . . . . . . . . . . . . . . . . 83 10.6
Improper crossing of roadway or intersection . . . . . . . . . . . . . . . . . . . . . . . 58 7.4
Darting into road. . . . . . . . . . . . . . . . . . . . . . . . . . . . . . . . . . . . . . . . . . . . . . 56 7.1
Failure to obey (e.g., signs, control devices, officers) . . . . . . . . . . . . . . . . . 49 6.3
Not visible. . . . . . . . . . . . . . . . . . . . . . . . . . . . . . . . . . . . . . . . . . . . . . . . . . . 46 5.9
Operating without required equipment . . . . . . . . . . . . . . . . . . . . . . . . . . . . . 26 3.3
Inattentive (talking, eating, etc.) . . . . . . . . . . . . . . . . . . . . . . . . . . . . . . . . . . 23 2.9
Failure to keep in proper lane or running off road . . . . . . . . . . . . . . . . . . . . 21 2.7
Riding on wrong side of road . . . . . . . . . . . . . . . . . . . . . . . . . . . . . . . . . . . . 21 2.7
Making improper turn . . . . . . . . . . . . . . . . . . . . . . . . . . . . . . . . . . . . . . . . . . 15 1.9
Improper lane changing . . . . . . . . . . . . . . . . . . . . . . . . . . . . . . . . . . . . . . . . 13 1.7
Improper entry to or exit from trafficway. . . . . . . . . . . . . . . . . . . . . . . . . . . . 8 1.0
Failing to have lights on when required . . . . . . . . . . . . . . . . . . . . . . . . . . . . 4 0.5
Erratic, reckless, careless, or negligent operation . . . . . . . . . . . . . . . . . . . . 1 0.1
Other factors . . . . . . . . . . . . . . . . . . . . . . . . . . . . . . . . . . . . . . . . . . . . . . . . 31 4.0
None reported . . . . . . . . . . . . . . . . . . . . . . . . . . . . . . . . . . . . . . . . . . . . . . . 377 48.1
Unknown . . . . . . . . . . . . . . . . . . . . . . . . . . . . . . . . . . . . . . . . . . . . . . . . . . . 12 1.5
Total Pedalcyclists. . . . . . . . . . . . . . . . . . . . . . . . . . . . . . . . . . . . . . . . . . . 784 100.0
Note: The sum of the numbers and percentages is greater than total pedalcyclists killed as more than one factor may bepresent for the same pedalcyclist.
Table 103
Pedalcyclists Killed, by Related Factors

Chapter 5
STATES

Fatal crash and fatality statistics for each of the 50 states, the District of Columbia, and Puerto Rico arepresented in this chapter. Several tables display state fatality rates based on population, licensed drivers, andregistered vehicles. The last three tables describe each state’s occupant restraint laws, motorcycle helmet laws, anddriver’s blood alcohol concentration laws. Below are some of the state statistics you will find in this chapter:
O Traffic fatalities increased by 1.4 percent from 2004 to 2005 for the nation as a whole. Twenty-six states and theDistrict of Columbia showed increases, ranging from less than 1 percent to as much as 23 percent.
O The pedestrian fatality rate per 100,000 population was 1.65 for the nation. Florida had the highest rate (3.24)and New Hampshire had the lowest (0.38).
O About 1.8 percent of all traffic crash fatalities in 2005 were pedalcyclists. South Dakota and Vermont reportedno pedalcyclists killed.
O In 2005, all 50 states, the District of Columbia, and Puerto Rico had safety belt use laws. All 50 states, theDistrict of Columbia, and Puerto Rico also had laws requiring children of certain ages to be restrained in childsafety seats.
O Motorcycle helmets were required for all riders in 20 states, the District of Columbia, and Puerto Rico in 2005.Twenty-seven states had helmet requirements with exceptions (age, rider type, roadway type), and three statesdid not require helmets at all.
O In 2005, it was a criminal offense to operate a motor vehicle at a blood alcohol concentration (BAC) of .08 g/dlor above in all 50 states, the District of Columbia, and Puerto Rico.
2005 Motor Vehicle Crash Data from FARS and GES
CHAPTER 5 � STATES
139
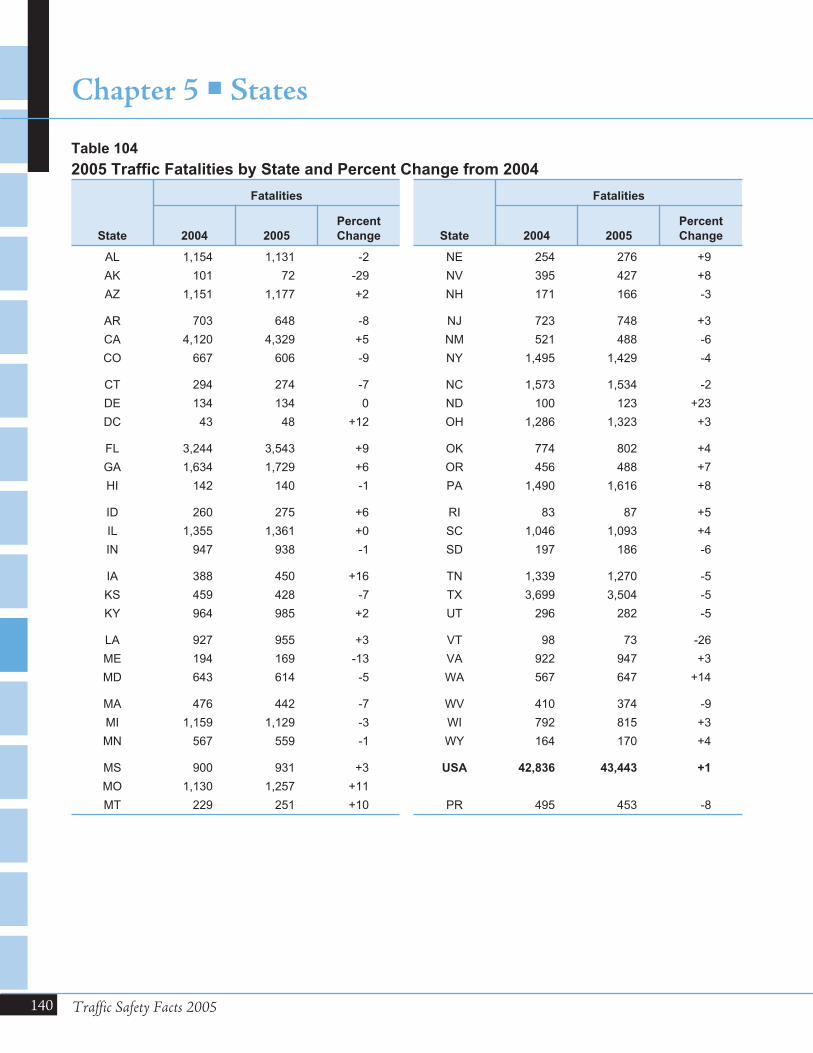
140 Traffic Safety Facts 2005
Chapter 5 � States
State
Fatalities
State
Fatalities
2004 2005
Percent
Change 2004 2005
Percent
Change
AL 1,154 1,131 -2 NE 254 276 +9
AK 101 72 -29 NV 395 427 +8
AZ 1,151 1,177 +2 NH 171 166 -3
AR 703 648 -8 NJ 723 748 +3
CA 4,120 4,329 +5 NM 521 488 -6
CO 667 606 -9 NY 1,495 1,429 -4
CT 294 274 -7 NC 1,573 1,534 -2
DE 134 134 0 ND 100 123 +23
DC 43 48 +12 OH 1,286 1,323 +3
FL 3,244 3,543 +9 OK 774 802 +4
GA 1,634 1,729 +6 OR 456 488 +7
HI 142 140 -1 PA 1,490 1,616 +8
ID 260 275 +6 RI 83 87 +5
IL 1,355 1,361 +0 SC 1,046 1,093 +4
IN 947 938 -1 SD 197 186 -6
IA 388 450 +16 TN 1,339 1,270 -5
KS 459 428 -7 TX 3,699 3,504 -5
KY 964 985 +2 UT 296 282 -5
LA 927 955 +3 VT 98 73 -26
ME 194 169 -13 VA 922 947 +3
MD 643 614 -5 WA 567 647 +14
MA 476 442 -7 WV 410 374 -9
MI 1,159 1,129 -3 WI 792 815 +3
MN 567 559 -1 WY 164 170 +4
MS 900 931 +3 USA 42,836 43,443 +1
MO 1,130 1,257 +11
MT 229 251 +10 PR 495 453 -8
Table 104
2005 Traffic Fatalities by State and Percent Change from 2004
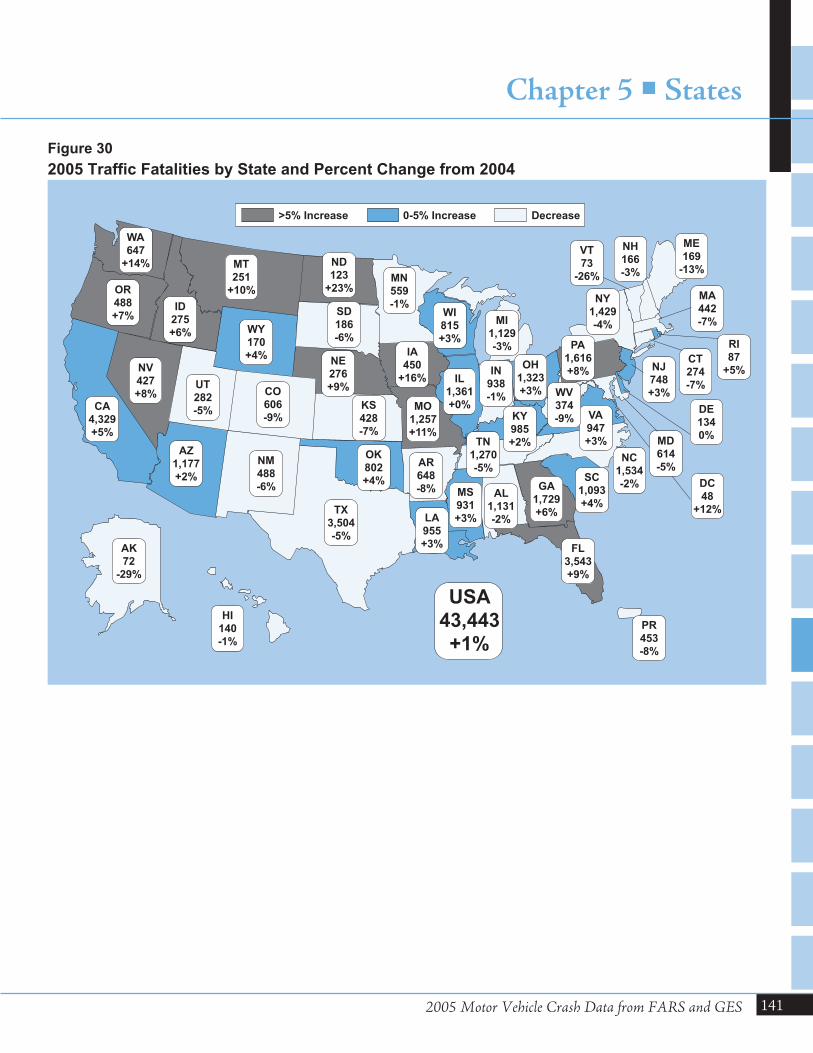
2005 Motor Vehicle Crash Data from FARS and GES
Chapter 5 � States
141
>5% Increase 0-5% Increase Decrease
AL
1,131
-2%
AK
72
-29%
AZ
1,177
+2%
AR
648
-8%
CA
4,329
+5%
CO
606
-9%
CT
274
-7%
DE
134
0%
DC
48
+12%
FL
3,543
+9%
GA
1,729
+6%
HI
140
-1%
ID
275
+6%
IL
1,361
+0%
IN
938
-1%
IA
450
+16%
KS
428
-7%
KY
985
+2%
LA
955
+3%
ME
169
-13%
MD
614
-5%
MA
442
-7%MI
1,129
-3%
MN
559
-1%
MS
931
+3%
MO
1,257
+11%
MT
251
+10%
NE
276
+9%
NV
427
+8%
NH
166
-3%
NJ
748
+3%
NM
488
-6%
NY
1,429
-4%
NC
1,534
-2%
ND
123
+23%
OH
1,323
+3%
OK
802
+4%
OR
488
+7%
PA
1,616
+8%
RI
87
+5%
SC
1,093
+4%
SD
186
-6%
TN
1,270
-5%
TX
3,504
-5%
UT
282
-5%
VT
73
-26%
VA
947
+3%
WA
647
+14%
WV
374
-9%
WI
815
+3%WY
170
+4%
USA
43,443
+1%PR
453
-8%
Figure 30
2005 Traffic Fatalities by State and Percent Change from 2004
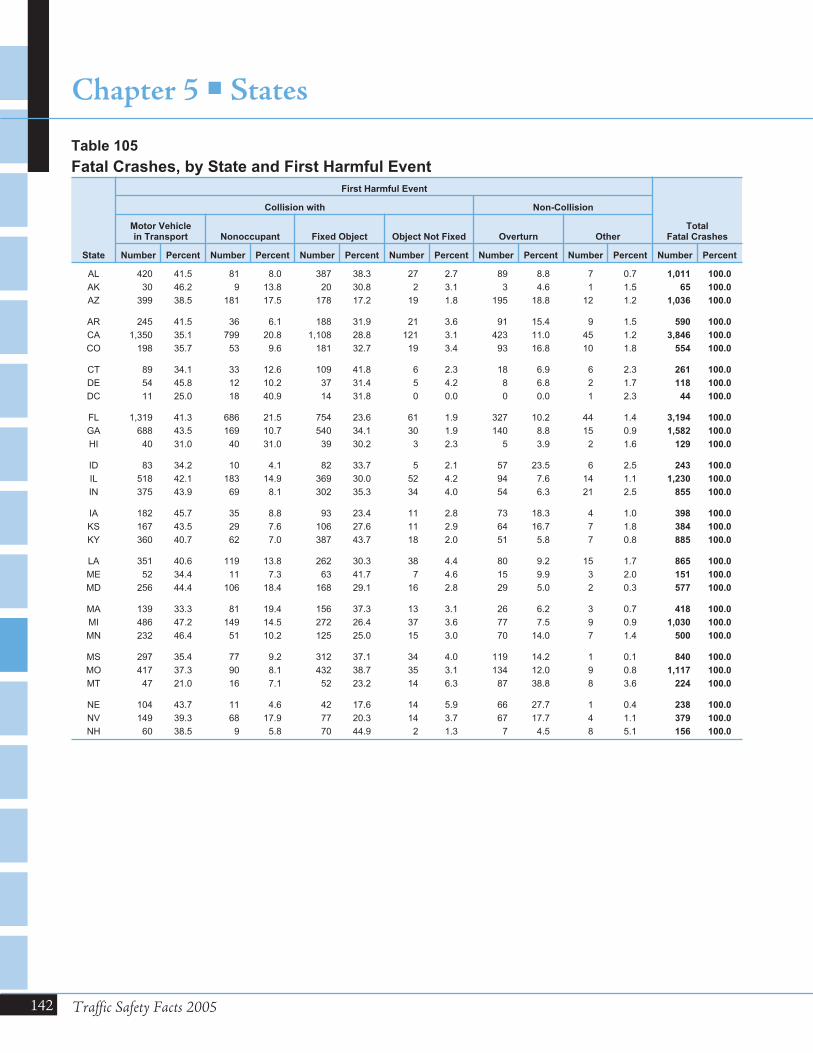
142 Traffic Safety Facts 2005
Chapter 5 � States
State
First Harmful Event
TotalFatal Crashes
Collision with Non-Collision
Motor Vehiclein Transport Nonoccupant Fixed Object Object Not Fixed Overturn Other
Number Percent Number Percent Number Percent Number Percent Number Percent Number Percent Number Percent
AL 420 41.5 81 8.0 387 38.3 27 2.7 89 8.8 7 0.7 1,011 100.0
AK 30 46.2 9 13.8 20 30.8 2 3.1 3 4.6 1 1.5 65 100.0
AZ 399 38.5 181 17.5 178 17.2 19 1.8 195 18.8 12 1.2 1,036 100.0
AR 245 41.5 36 6.1 188 31.9 21 3.6 91 15.4 9 1.5 590 100.0
CA 1,350 35.1 799 20.8 1,108 28.8 121 3.1 423 11.0 45 1.2 3,846 100.0
CO 198 35.7 53 9.6 181 32.7 19 3.4 93 16.8 10 1.8 554 100.0
CT 89 34.1 33 12.6 109 41.8 6 2.3 18 6.9 6 2.3 261 100.0
DE 54 45.8 12 10.2 37 31.4 5 4.2 8 6.8 2 1.7 118 100.0
DC 11 25.0 18 40.9 14 31.8 0 0.0 0 0.0 1 2.3 44 100.0
FL 1,319 41.3 686 21.5 754 23.6 61 1.9 327 10.2 44 1.4 3,194 100.0
GA 688 43.5 169 10.7 540 34.1 30 1.9 140 8.8 15 0.9 1,582 100.0
HI 40 31.0 40 31.0 39 30.2 3 2.3 5 3.9 2 1.6 129 100.0
ID 83 34.2 10 4.1 82 33.7 5 2.1 57 23.5 6 2.5 243 100.0
IL 518 42.1 183 14.9 369 30.0 52 4.2 94 7.6 14 1.1 1,230 100.0
IN 375 43.9 69 8.1 302 35.3 34 4.0 54 6.3 21 2.5 855 100.0
IA 182 45.7 35 8.8 93 23.4 11 2.8 73 18.3 4 1.0 398 100.0
KS 167 43.5 29 7.6 106 27.6 11 2.9 64 16.7 7 1.8 384 100.0
KY 360 40.7 62 7.0 387 43.7 18 2.0 51 5.8 7 0.8 885 100.0
LA 351 40.6 119 13.8 262 30.3 38 4.4 80 9.2 15 1.7 865 100.0
ME 52 34.4 11 7.3 63 41.7 7 4.6 15 9.9 3 2.0 151 100.0
MD 256 44.4 106 18.4 168 29.1 16 2.8 29 5.0 2 0.3 577 100.0
MA 139 33.3 81 19.4 156 37.3 13 3.1 26 6.2 3 0.7 418 100.0
MI 486 47.2 149 14.5 272 26.4 37 3.6 77 7.5 9 0.9 1,030 100.0
MN 232 46.4 51 10.2 125 25.0 15 3.0 70 14.0 7 1.4 500 100.0
MS 297 35.4 77 9.2 312 37.1 34 4.0 119 14.2 1 0.1 840 100.0
MO 417 37.3 90 8.1 432 38.7 35 3.1 134 12.0 9 0.8 1,117 100.0
MT 47 21.0 16 7.1 52 23.2 14 6.3 87 38.8 8 3.6 224 100.0
NE 104 43.7 11 4.6 42 17.6 14 5.9 66 27.7 1 0.4 238 100.0
NV 149 39.3 68 17.9 77 20.3 14 3.7 67 17.7 4 1.1 379 100.0
NH 60 38.5 9 5.8 70 44.9 2 1.3 7 4.5 8 5.1 156 100.0
Table 105
Fatal Crashes, by State and First Harmful Event
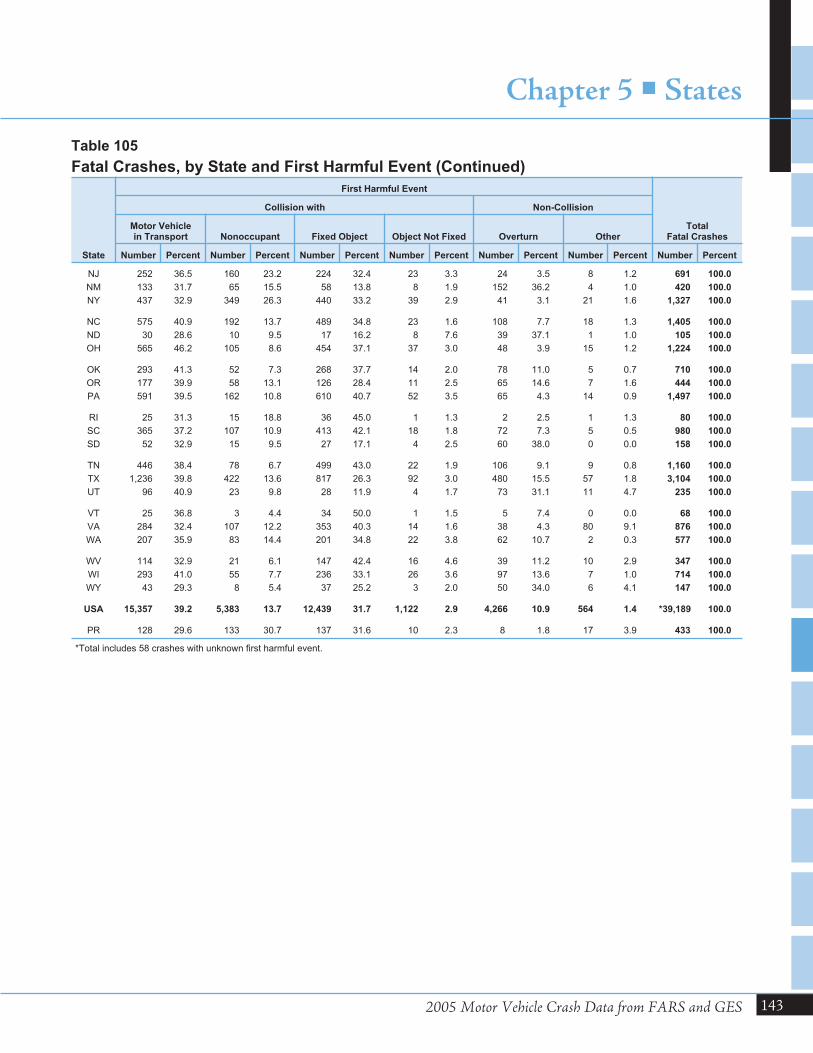
2005 Motor Vehicle Crash Data from FARS and GES
Chapter 5 � States
143
State
First Harmful Event
TotalFatal Crashes
Collision with Non-Collision
Motor Vehiclein Transport Nonoccupant Fixed Object Object Not Fixed Overturn Other
Number Percent Number Percent Number Percent Number Percent Number Percent Number Percent Number Percent
NJ 252 36.5 160 23.2 224 32.4 23 3.3 24 3.5 8 1.2 691 100.0
NM 133 31.7 65 15.5 58 13.8 8 1.9 152 36.2 4 1.0 420 100.0
NY 437 32.9 349 26.3 440 33.2 39 2.9 41 3.1 21 1.6 1,327 100.0
NC 575 40.9 192 13.7 489 34.8 23 1.6 108 7.7 18 1.3 1,405 100.0
ND 30 28.6 10 9.5 17 16.2 8 7.6 39 37.1 1 1.0 105 100.0
OH 565 46.2 105 8.6 454 37.1 37 3.0 48 3.9 15 1.2 1,224 100.0
OK 293 41.3 52 7.3 268 37.7 14 2.0 78 11.0 5 0.7 710 100.0
OR 177 39.9 58 13.1 126 28.4 11 2.5 65 14.6 7 1.6 444 100.0
PA 591 39.5 162 10.8 610 40.7 52 3.5 65 4.3 14 0.9 1,497 100.0
RI 25 31.3 15 18.8 36 45.0 1 1.3 2 2.5 1 1.3 80 100.0
SC 365 37.2 107 10.9 413 42.1 18 1.8 72 7.3 5 0.5 980 100.0
SD 52 32.9 15 9.5 27 17.1 4 2.5 60 38.0 0 0.0 158 100.0
TN 446 38.4 78 6.7 499 43.0 22 1.9 106 9.1 9 0.8 1,160 100.0
TX 1,236 39.8 422 13.6 817 26.3 92 3.0 480 15.5 57 1.8 3,104 100.0
UT 96 40.9 23 9.8 28 11.9 4 1.7 73 31.1 11 4.7 235 100.0
VT 25 36.8 3 4.4 34 50.0 1 1.5 5 7.4 0 0.0 68 100.0
VA 284 32.4 107 12.2 353 40.3 14 1.6 38 4.3 80 9.1 876 100.0
WA 207 35.9 83 14.4 201 34.8 22 3.8 62 10.7 2 0.3 577 100.0
WV 114 32.9 21 6.1 147 42.4 16 4.6 39 11.2 10 2.9 347 100.0
WI 293 41.0 55 7.7 236 33.1 26 3.6 97 13.6 7 1.0 714 100.0
WY 43 29.3 8 5.4 37 25.2 3 2.0 50 34.0 6 4.1 147 100.0
USA 15,357 39.2 5,383 13.7 12,439 31.7 1,122 2.9 4,266 10.9 564 1.4 *39,189 100.0
PR 128 29.6 133 30.7 137 31.6 10 2.3 8 1.8 17 3.9 433 100.0
*Total includes 58 crashes with unknown first harmful event.
Table 105
Fatal Crashes, by State and First Harmful Event (Continued)
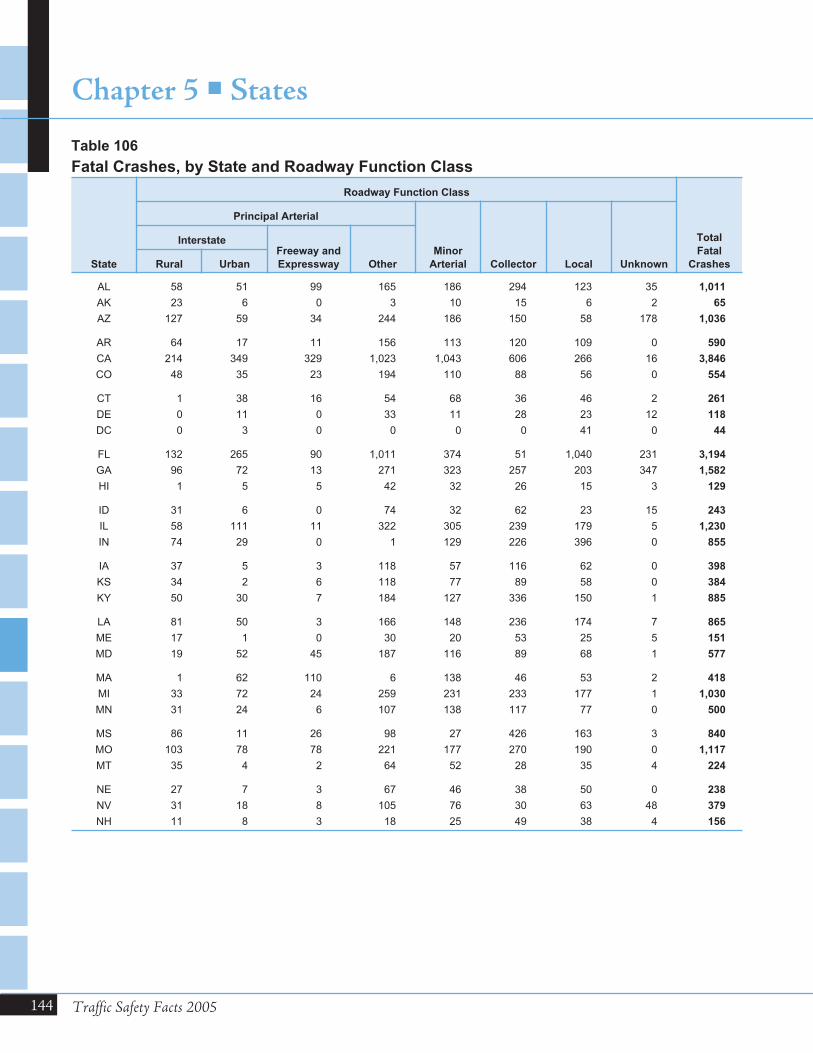
144 Traffic Safety Facts 2005
Chapter 5 � States
State
Roadway Function Class
Total
Fatal
Crashes
Principal Arterial
Minor
Arterial Collector Local Unknown
InterstateFreeway and
Expressway OtherRural Urban
AL 58 51 99 165 186 294 123 35 1,011
AK 23 6 0 3 10 15 6 2 65
AZ 127 59 34 244 186 150 58 178 1,036
AR 64 17 11 156 113 120 109 0 590
CA 214 349 329 1,023 1,043 606 266 16 3,846
CO 48 35 23 194 110 88 56 0 554
CT 1 38 16 54 68 36 46 2 261
DE 0 11 0 33 11 28 23 12 118
DC 0 3 0 0 0 0 41 0 44
FL 132 265 90 1,011 374 51 1,040 231 3,194
GA 96 72 13 271 323 257 203 347 1,582
HI 1 5 5 42 32 26 15 3 129
ID 31 6 0 74 32 62 23 15 243
IL 58 111 11 322 305 239 179 5 1,230
IN 74 29 0 1 129 226 396 0 855
IA 37 5 3 118 57 116 62 0 398
KS 34 2 6 118 77 89 58 0 384
KY 50 30 7 184 127 336 150 1 885
LA 81 50 3 166 148 236 174 7 865
ME 17 1 0 30 20 53 25 5 151
MD 19 52 45 187 116 89 68 1 577
MA 1 62 110 6 138 46 53 2 418
MI 33 72 24 259 231 233 177 1 1,030
MN 31 24 6 107 138 117 77 0 500
MS 86 11 26 98 27 426 163 3 840
MO 103 78 78 221 177 270 190 0 1,117
MT 35 4 2 64 52 28 35 4 224
NE 27 7 3 67 46 38 50 0 238
NV 31 18 8 105 76 30 63 48 379
NH 11 8 3 18 25 49 38 4 156
Table 106
Fatal Crashes, by State and Roadway Function Class

2005 Motor Vehicle Crash Data from FARS and GES
Chapter 5 � States
145
State
Roadway Function Class
Total
Fatal
Crashes
Principal Arterial
Minor
Arterial Collector Local Unknown
InterstateFreeway and
Expressway OtherRural Urban
NJ 18 68 57 228 143 80 97 0 691
NM 125 9 12 52 68 72 25 57 420
NY 36 49 83 327 305 262 261 4 1,327
NC 64 58 18 225 178 397 465 0 1,405
ND 14 1 0 25 19 13 33 0 105
OH 58 81 111 140 201 391 239 3 1,224
OK 56 36 17 150 137 132 182 0 710
OR 25 8 3 153 105 107 42 1 444
PA 77 45 44 372 373 307 276 3 1,497
RI 2 12 9 29 20 5 3 0 80
SC 109 11 7 221 266 305 0 61 980
SD 20 1 1 43 27 36 30 0 158
TN 71 72 2 33 43 27 20 892 1,160
TX 215 301 183 626 357 587 829 6 3,104
UT 58 25 0 11 66 1 74 0 235
VT 5 0 2 16 12 17 16 0 68
VA 56 67 13 198 192 214 134 2 876
WA 34 19 11 148 117 142 103 3 577
WV 45 11 6 83 57 100 45 0 347
WI 25 19 15 192 132 198 133 0 714
WY 38 3 0 42 22 26 13 3 147
USA 2,674 2,377 1,549 8,655 7,217 7,773 6,987 1,957 39,189
PR 32 43 14 89 101 105 49 0 433
Table 106
Fatal Crashes, by State and Roadway Function Class (Continued)
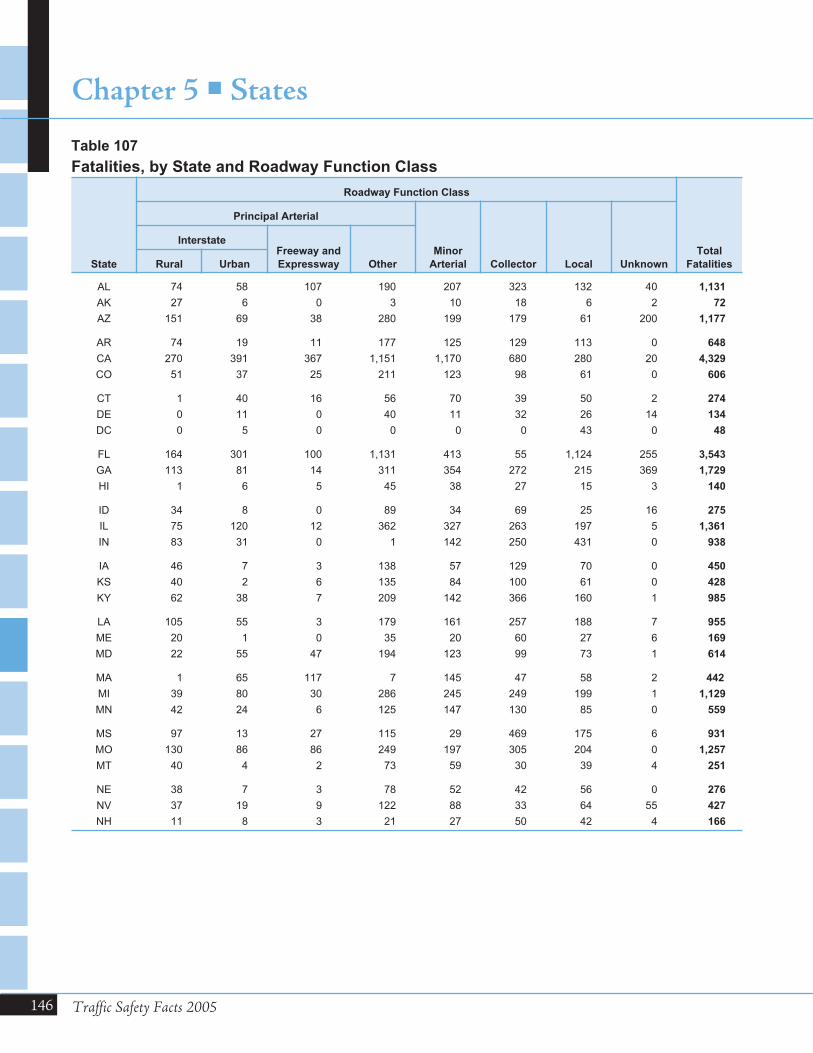
146 Traffic Safety Facts 2005
Chapter 5 � States
State
Roadway Function Class
Total
Fatalities
Principal Arterial
Minor
Arterial Collector Local Unknown
InterstateFreeway and
Expressway OtherRural Urban
AL 74 58 107 190 207 323 132 40 1,131
AK 27 6 0 3 10 18 6 2 72
AZ 151 69 38 280 199 179 61 200 1,177
AR 74 19 11 177 125 129 113 0 648
CA 270 391 367 1,151 1,170 680 280 20 4,329
CO 51 37 25 211 123 98 61 0 606
CT 1 40 16 56 70 39 50 2 274
DE 0 11 0 40 11 32 26 14 134
DC 0 5 0 0 0 0 43 0 48
FL 164 301 100 1,131 413 55 1,124 255 3,543
GA 113 81 14 311 354 272 215 369 1,729
HI 1 6 5 45 38 27 15 3 140
ID 34 8 0 89 34 69 25 16 275
IL 75 120 12 362 327 263 197 5 1,361
IN 83 31 0 1 142 250 431 0 938
IA 46 7 3 138 57 129 70 0 450
KS 40 2 6 135 84 100 61 0 428
KY 62 38 7 209 142 366 160 1 985
LA 105 55 3 179 161 257 188 7 955
ME 20 1 0 35 20 60 27 6 169
MD 22 55 47 194 123 99 73 1 614
MA 1 65 117 7 145 47 58 2 442
MI 39 80 30 286 245 249 199 1 1,129
MN 42 24 6 125 147 130 85 0 559
MS 97 13 27 115 29 469 175 6 931
MO 130 86 86 249 197 305 204 0 1,257
MT 40 4 2 73 59 30 39 4 251
NE 38 7 3 78 52 42 56 0 276
NV 37 19 9 122 88 33 64 55 427
NH 11 8 3 21 27 50 42 4 166
Table 107
Fatalities, by State and Roadway Function Class

2005 Motor Vehicle Crash Data from FARS and GES
Chapter 5 � States
147
State
Roadway Function Class
Total
Fatalities
Principal Arterial
Minor
Arterial Collector Local Unknown
InterstateFreeway and
Expressway OtherRural Urban
NJ 18 74 62 248 160 84 102 0 748
NM 152 9 12 64 82 86 25 58 488
NY 46 54 99 345 329 274 278 4 1,429
NC 79 64 18 263 190 428 492 0 1,534
ND 15 1 0 36 20 14 37 0 123
OH 68 84 112 158 215 426 257 3 1,323
OK 66 41 19 174 154 140 208 0 802
OR 30 8 3 172 114 113 46 2 488
PA 81 51 46 407 403 327 295 6 1,616
RI 2 13 10 32 22 5 3 0 87
SC 117 11 7 251 301 339 0 67 1,093
SD 23 1 1 52 30 46 33 0 186
TN 84 78 2 36 48 29 23 970 1,270
TX 262 360 205 705 418 652 895 7 3,504
UT 82 30 0 12 76 1 81 0 282
VT 5 0 3 19 12 17 17 0 73
VA 63 71 13 218 210 232 138 2 947
WA 42 19 11 171 132 159 107 6 647
WV 53 13 6 90 61 106 45 0 374
WI 34 25 17 223 151 211 154 0 815
WY 46 4 0 48 27 26 15 4 170
USA 3,216 2,658 1,690 9,737 7,954 8,515 7,531 2,142 43,443
PR 39 45 15 89 104 110 51 0 453
Table 107
Fatalities, by State and Roadway Function Class (Continued)

148 Traffic Safety Facts 2005
Chapter 5 � States
State
Licensed
Drivers
(Thousands)
Fatalities
per 100,000
Drivers
Registered
Vehicles
(Thousands)
Fatalities
per 100,000
Registered
Vehicles
Population
(Thousands)
Fatalities
per 100,000
Population Total Killed
AL 3,637 31.09 4,638 24.39 4,558 24.81 1,131
AK 483 14.92 695 10.36 664 10.85 72
AZ 3,943 29.85 4,070 28.92 5,939 19.82 1,177
AR 2,024 32.01 1,990 32.57 2,779 23.32 648
CA 22,896 18.91 33,163 13.05 36,132 11.98 4,329
CO 3,341 18.14 1,925 31.48 4,665 12.99 606
CT 2,740 10.00 3,124 8.77 3,510 7.81 274
DE 534 25.10 756 17.74 844 15.89 134
DC 330 14.53 238 20.13 551 8.72 48
FL 13,374 26.49 16,208 21.86 17,790 19.92 3,543
GA 5,940 29.11 8,205 21.07 9,073 19.06 1,729
HI 856 16.35 972 14.40 1,275 10.98 140
ID 978 28.11 1,431 19.22 1,429 19.24 275
IL 7,871 17.29 9,749 13.96 12,763 10.66 1,361
IN 4,521 20.75 5,103 18.38 6,272 14.96 938
IA 2,033 22.13 3,544 12.70 2,966 15.17 450
KS 1,974 21.68 2,435 17.58 2,745 15.59 428
KY 2,861 34.43 3,484 28.27 4,173 23.60 985
LA 3,084 30.97 3,874 24.65 4,524 21.11 955
ME 1,004 16.83 1,115 15.15 1,322 12.79 169
MD 3,710 16.55 4,398 13.96 5,600 10.96 614
MA 4,613 9.58 5,560 7.95 6,399 6.91 442
MI 7,105 15.89 8,512 13.26 10,121 11.16 1,129
MN 3,084 18.13 4,848 11.53 5,133 10.89 559
MS 1,965 47.37 2,005 46.42 2,921 31.87 931
MO 4,135 30.40 4,671 26.91 5,800 21.67 1,257
MT 716 35.08 1,057 23.75 936 26.83 251
NE 1,321 20.90 1,734 15.91 1,759 15.69 276
NV 1,596 26.75 1,400 30.50 2,415 17.68 427
NH 986 16.84 1,243 13.35 1,310 12.67 166
Table 108
Persons Killed, Licensed Drivers, Registered Vehicles, Population, and Fatality Ratesby State
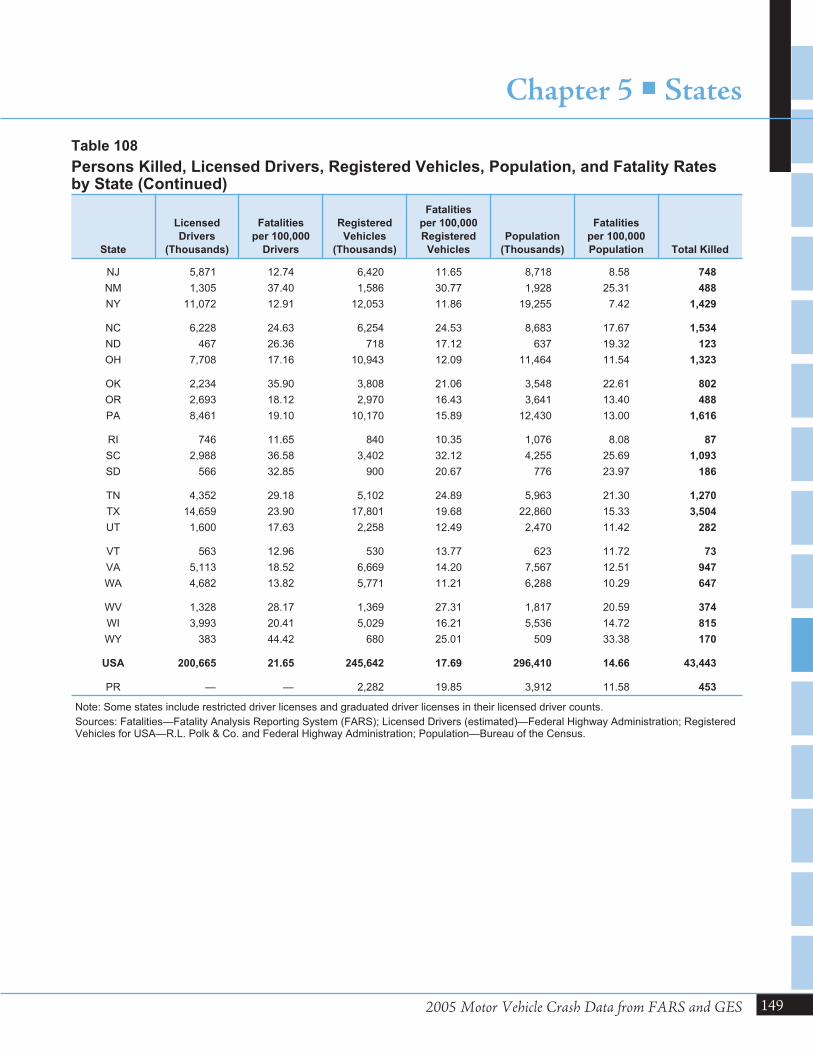
2005 Motor Vehicle Crash Data from FARS and GES
Chapter 5 � States
149
State
Licensed
Drivers
(Thousands)
Fatalities
per 100,000
Drivers
Registered
Vehicles
(Thousands)
Fatalities
per 100,000
Registered
Vehicles
Population
(Thousands)
Fatalities
per 100,000
Population Total Killed
NJ 5,871 12.74 6,420 11.65 8,718 8.58 748
NM 1,305 37.40 1,586 30.77 1,928 25.31 488
NY 11,072 12.91 12,053 11.86 19,255 7.42 1,429
NC 6,228 24.63 6,254 24.53 8,683 17.67 1,534
ND 467 26.36 718 17.12 637 19.32 123
OH 7,708 17.16 10,943 12.09 11,464 11.54 1,323
OK 2,234 35.90 3,808 21.06 3,548 22.61 802
OR 2,693 18.12 2,970 16.43 3,641 13.40 488
PA 8,461 19.10 10,170 15.89 12,430 13.00 1,616
RI 746 11.65 840 10.35 1,076 8.08 87
SC 2,988 36.58 3,402 32.12 4,255 25.69 1,093
SD 566 32.85 900 20.67 776 23.97 186
TN 4,352 29.18 5,102 24.89 5,963 21.30 1,270
TX 14,659 23.90 17,801 19.68 22,860 15.33 3,504
UT 1,600 17.63 2,258 12.49 2,470 11.42 282
VT 563 12.96 530 13.77 623 11.72 73
VA 5,113 18.52 6,669 14.20 7,567 12.51 947
WA 4,682 13.82 5,771 11.21 6,288 10.29 647
WV 1,328 28.17 1,369 27.31 1,817 20.59 374
WI 3,993 20.41 5,029 16.21 5,536 14.72 815
WY 383 44.42 680 25.01 509 33.38 170
USA 200,665 21.65 245,642 17.69 296,410 14.66 43,443
PR — — 2,282 19.85 3,912 11.58 453
Note: Some states include restricted driver licenses and graduated driver licenses in their licensed driver counts.
Sources: Fatalities—Fatality Analysis Reporting System (FARS); Licensed Drivers (estimated)—Federal Highway Administration; RegisteredVehicles for USA—R.L. Polk & Co. and Federal Highway Administration; Population—Bureau of the Census.
Table 108
Persons Killed, Licensed Drivers, Registered Vehicles, Population, and Fatality Ratesby State (Continued)
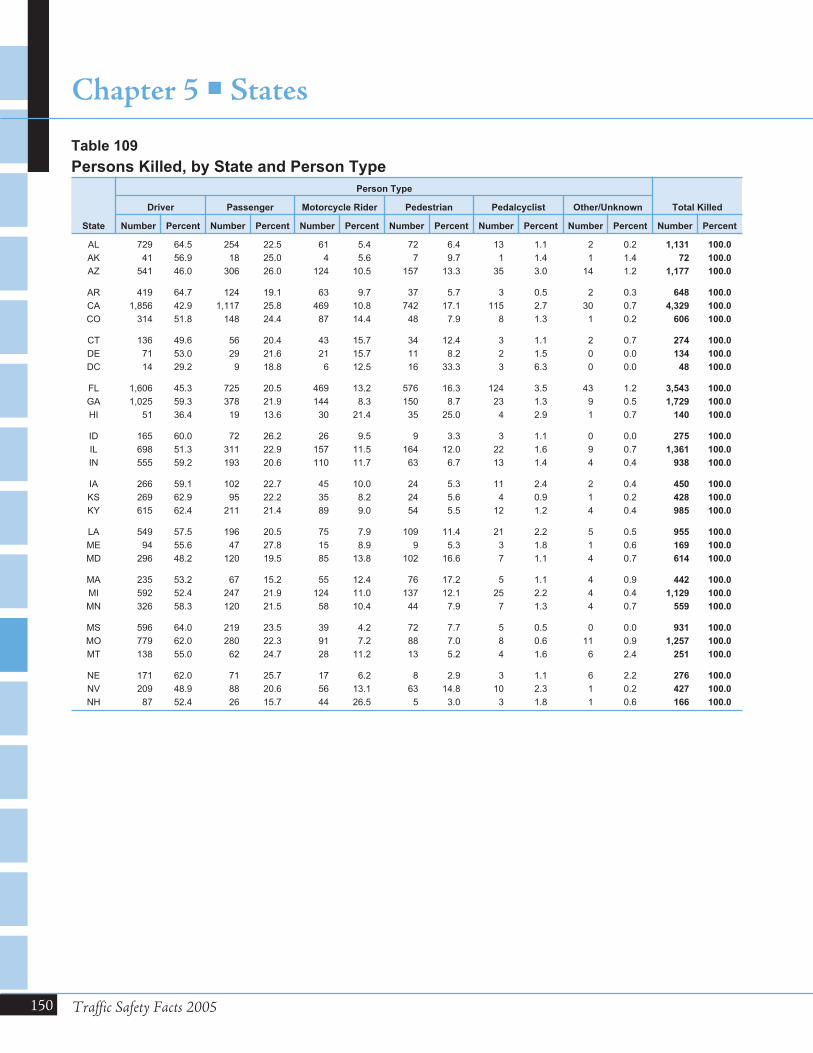
150 Traffic Safety Facts 2005
Chapter 5 � States
State
Person Type
Total KilledDriver Passenger Motorcycle Rider Pedestrian Pedalcyclist Other/Unknown
Number Percent Number Percent Number Percent Number Percent Number Percent Number Percent Number Percent
AL 729 64.5 254 22.5 61 5.4 72 6.4 13 1.1 2 0.2 1,131 100.0
AK 41 56.9 18 25.0 4 5.6 7 9.7 1 1.4 1 1.4 72 100.0
AZ 541 46.0 306 26.0 124 10.5 157 13.3 35 3.0 14 1.2 1,177 100.0
AR 419 64.7 124 19.1 63 9.7 37 5.7 3 0.5 2 0.3 648 100.0
CA 1,856 42.9 1,117 25.8 469 10.8 742 17.1 115 2.7 30 0.7 4,329 100.0
CO 314 51.8 148 24.4 87 14.4 48 7.9 8 1.3 1 0.2 606 100.0
CT 136 49.6 56 20.4 43 15.7 34 12.4 3 1.1 2 0.7 274 100.0
DE 71 53.0 29 21.6 21 15.7 11 8.2 2 1.5 0 0.0 134 100.0
DC 14 29.2 9 18.8 6 12.5 16 33.3 3 6.3 0 0.0 48 100.0
FL 1,606 45.3 725 20.5 469 13.2 576 16.3 124 3.5 43 1.2 3,543 100.0
GA 1,025 59.3 378 21.9 144 8.3 150 8.7 23 1.3 9 0.5 1,729 100.0
HI 51 36.4 19 13.6 30 21.4 35 25.0 4 2.9 1 0.7 140 100.0
ID 165 60.0 72 26.2 26 9.5 9 3.3 3 1.1 0 0.0 275 100.0
IL 698 51.3 311 22.9 157 11.5 164 12.0 22 1.6 9 0.7 1,361 100.0
IN 555 59.2 193 20.6 110 11.7 63 6.7 13 1.4 4 0.4 938 100.0
IA 266 59.1 102 22.7 45 10.0 24 5.3 11 2.4 2 0.4 450 100.0
KS 269 62.9 95 22.2 35 8.2 24 5.6 4 0.9 1 0.2 428 100.0
KY 615 62.4 211 21.4 89 9.0 54 5.5 12 1.2 4 0.4 985 100.0
LA 549 57.5 196 20.5 75 7.9 109 11.4 21 2.2 5 0.5 955 100.0
ME 94 55.6 47 27.8 15 8.9 9 5.3 3 1.8 1 0.6 169 100.0
MD 296 48.2 120 19.5 85 13.8 102 16.6 7 1.1 4 0.7 614 100.0
MA 235 53.2 67 15.2 55 12.4 76 17.2 5 1.1 4 0.9 442 100.0
MI 592 52.4 247 21.9 124 11.0 137 12.1 25 2.2 4 0.4 1,129 100.0
MN 326 58.3 120 21.5 58 10.4 44 7.9 7 1.3 4 0.7 559 100.0
MS 596 64.0 219 23.5 39 4.2 72 7.7 5 0.5 0 0.0 931 100.0
MO 779 62.0 280 22.3 91 7.2 88 7.0 8 0.6 11 0.9 1,257 100.0
MT 138 55.0 62 24.7 28 11.2 13 5.2 4 1.6 6 2.4 251 100.0
NE 171 62.0 71 25.7 17 6.2 8 2.9 3 1.1 6 2.2 276 100.0
NV 209 48.9 88 20.6 56 13.1 63 14.8 10 2.3 1 0.2 427 100.0
NH 87 52.4 26 15.7 44 26.5 5 3.0 3 1.8 1 0.6 166 100.0
Table 109
Persons Killed, by State and Person Type
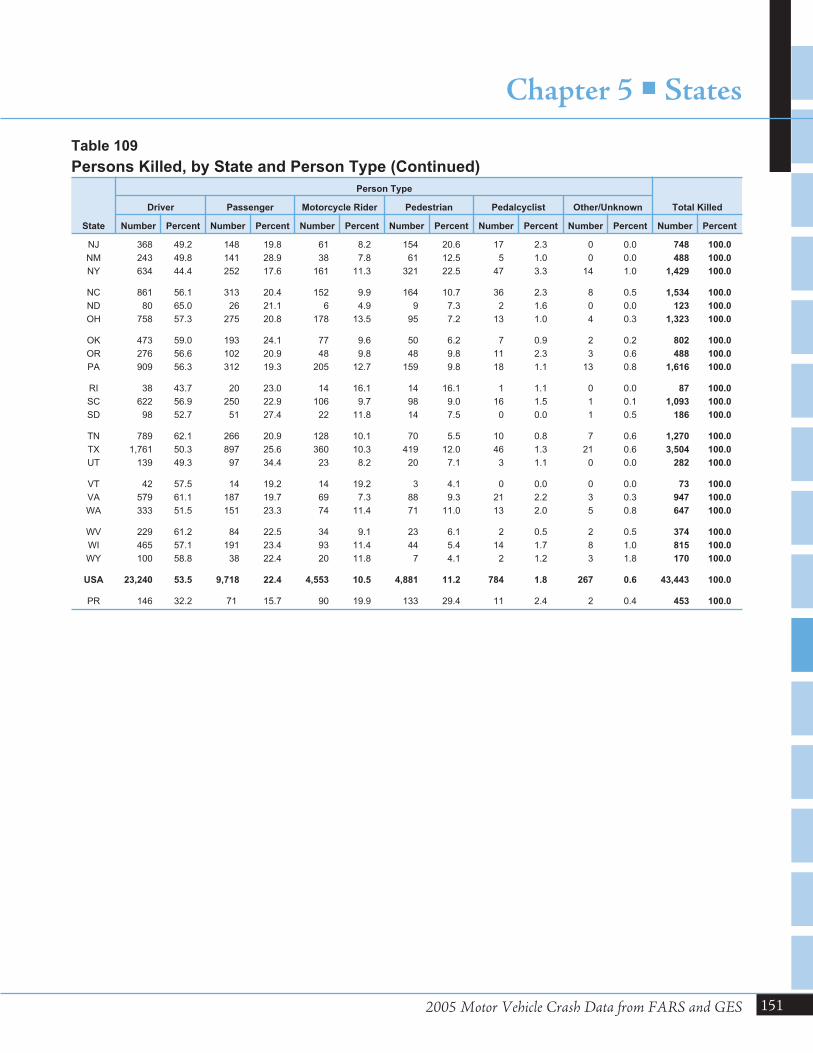
2005 Motor Vehicle Crash Data from FARS and GES
Chapter 5 � States
151
State
Person Type
Total KilledDriver Passenger Motorcycle Rider Pedestrian Pedalcyclist Other/Unknown
Number Percent Number Percent Number Percent Number Percent Number Percent Number Percent Number Percent
NJ 368 49.2 148 19.8 61 8.2 154 20.6 17 2.3 0 0.0 748 100.0
NM 243 49.8 141 28.9 38 7.8 61 12.5 5 1.0 0 0.0 488 100.0
NY 634 44.4 252 17.6 161 11.3 321 22.5 47 3.3 14 1.0 1,429 100.0
NC 861 56.1 313 20.4 152 9.9 164 10.7 36 2.3 8 0.5 1,534 100.0
ND 80 65.0 26 21.1 6 4.9 9 7.3 2 1.6 0 0.0 123 100.0
OH 758 57.3 275 20.8 178 13.5 95 7.2 13 1.0 4 0.3 1,323 100.0
OK 473 59.0 193 24.1 77 9.6 50 6.2 7 0.9 2 0.2 802 100.0
OR 276 56.6 102 20.9 48 9.8 48 9.8 11 2.3 3 0.6 488 100.0
PA 909 56.3 312 19.3 205 12.7 159 9.8 18 1.1 13 0.8 1,616 100.0
RI 38 43.7 20 23.0 14 16.1 14 16.1 1 1.1 0 0.0 87 100.0
SC 622 56.9 250 22.9 106 9.7 98 9.0 16 1.5 1 0.1 1,093 100.0
SD 98 52.7 51 27.4 22 11.8 14 7.5 0 0.0 1 0.5 186 100.0
TN 789 62.1 266 20.9 128 10.1 70 5.5 10 0.8 7 0.6 1,270 100.0
TX 1,761 50.3 897 25.6 360 10.3 419 12.0 46 1.3 21 0.6 3,504 100.0
UT 139 49.3 97 34.4 23 8.2 20 7.1 3 1.1 0 0.0 282 100.0
VT 42 57.5 14 19.2 14 19.2 3 4.1 0 0.0 0 0.0 73 100.0
VA 579 61.1 187 19.7 69 7.3 88 9.3 21 2.2 3 0.3 947 100.0
WA 333 51.5 151 23.3 74 11.4 71 11.0 13 2.0 5 0.8 647 100.0
WV 229 61.2 84 22.5 34 9.1 23 6.1 2 0.5 2 0.5 374 100.0
WI 465 57.1 191 23.4 93 11.4 44 5.4 14 1.7 8 1.0 815 100.0
WY 100 58.8 38 22.4 20 11.8 7 4.1 2 1.2 3 1.8 170 100.0
USA 23,240 53.5 9,718 22.4 4,553 10.5 4,881 11.2 784 1.8 267 0.6 43,443 100.0
PR 146 32.2 71 15.7 90 19.9 133 29.4 11 2.4 2 0.4 453 100.0
Table 109
Persons Killed, by State and Person Type (Continued)
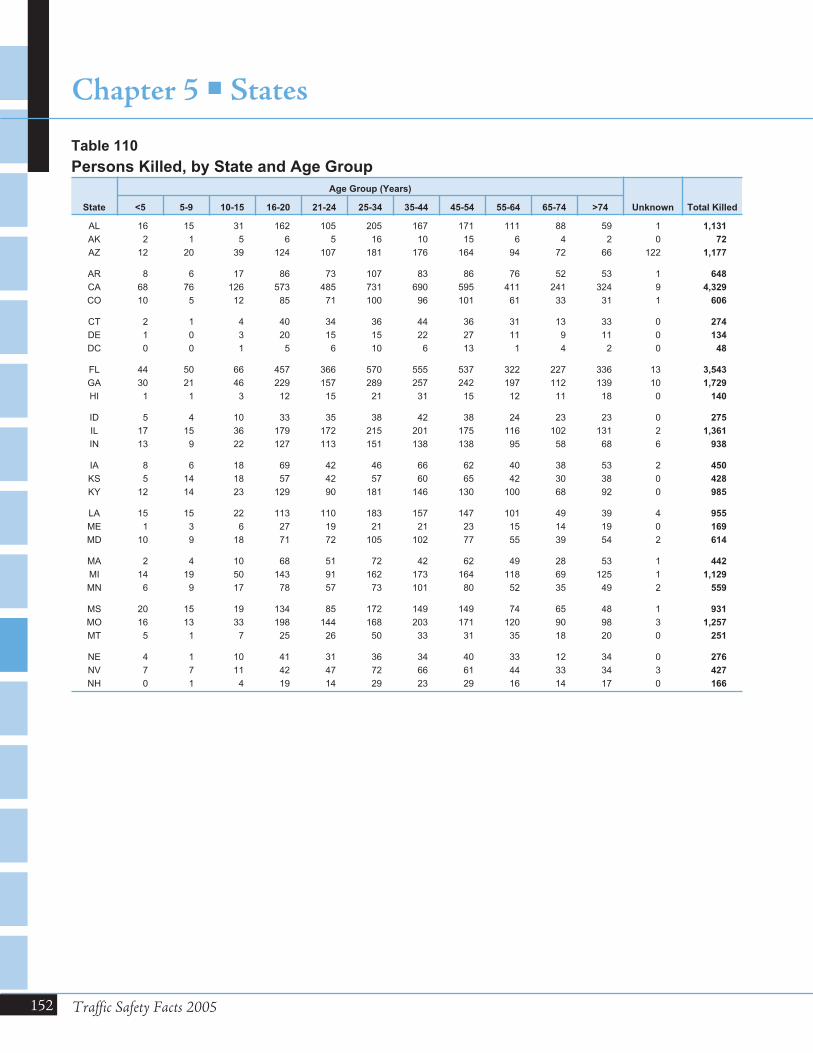
152 Traffic Safety Facts 2005
Chapter 5 � States
State
Age Group (Years)
Unknown Total Killed<5 5-9 10-15 16-20 21-24 25-34 35-44 45-54 55-64 65-74 >74
AL 16 15 31 162 105 205 167 171 111 88 59 1 1,131
AK 2 1 5 6 5 16 10 15 6 4 2 0 72
AZ 12 20 39 124 107 181 176 164 94 72 66 122 1,177
AR 8 6 17 86 73 107 83 86 76 52 53 1 648
CA 68 76 126 573 485 731 690 595 411 241 324 9 4,329
CO 10 5 12 85 71 100 96 101 61 33 31 1 606
CT 2 1 4 40 34 36 44 36 31 13 33 0 274
DE 1 0 3 20 15 15 22 27 11 9 11 0 134
DC 0 0 1 5 6 10 6 13 1 4 2 0 48
FL 44 50 66 457 366 570 555 537 322 227 336 13 3,543
GA 30 21 46 229 157 289 257 242 197 112 139 10 1,729
HI 1 1 3 12 15 21 31 15 12 11 18 0 140
ID 5 4 10 33 35 38 42 38 24 23 23 0 275
IL 17 15 36 179 172 215 201 175 116 102 131 2 1,361
IN 13 9 22 127 113 151 138 138 95 58 68 6 938
IA 8 6 18 69 42 46 66 62 40 38 53 2 450
KS 5 14 18 57 42 57 60 65 42 30 38 0 428
KY 12 14 23 129 90 181 146 130 100 68 92 0 985
LA 15 15 22 113 110 183 157 147 101 49 39 4 955
ME 1 3 6 27 19 21 21 23 15 14 19 0 169
MD 10 9 18 71 72 105 102 77 55 39 54 2 614
MA 2 4 10 68 51 72 42 62 49 28 53 1 442
MI 14 19 50 143 91 162 173 164 118 69 125 1 1,129
MN 6 9 17 78 57 73 101 80 52 35 49 2 559
MS 20 15 19 134 85 172 149 149 74 65 48 1 931
MO 16 13 33 198 144 168 203 171 120 90 98 3 1,257
MT 5 1 7 25 26 50 33 31 35 18 20 0 251
NE 4 1 10 41 31 36 34 40 33 12 34 0 276
NV 7 7 11 42 47 72 66 61 44 33 34 3 427
NH 0 1 4 19 14 29 23 29 16 14 17 0 166
Table 110
Persons Killed, by State and Age Group
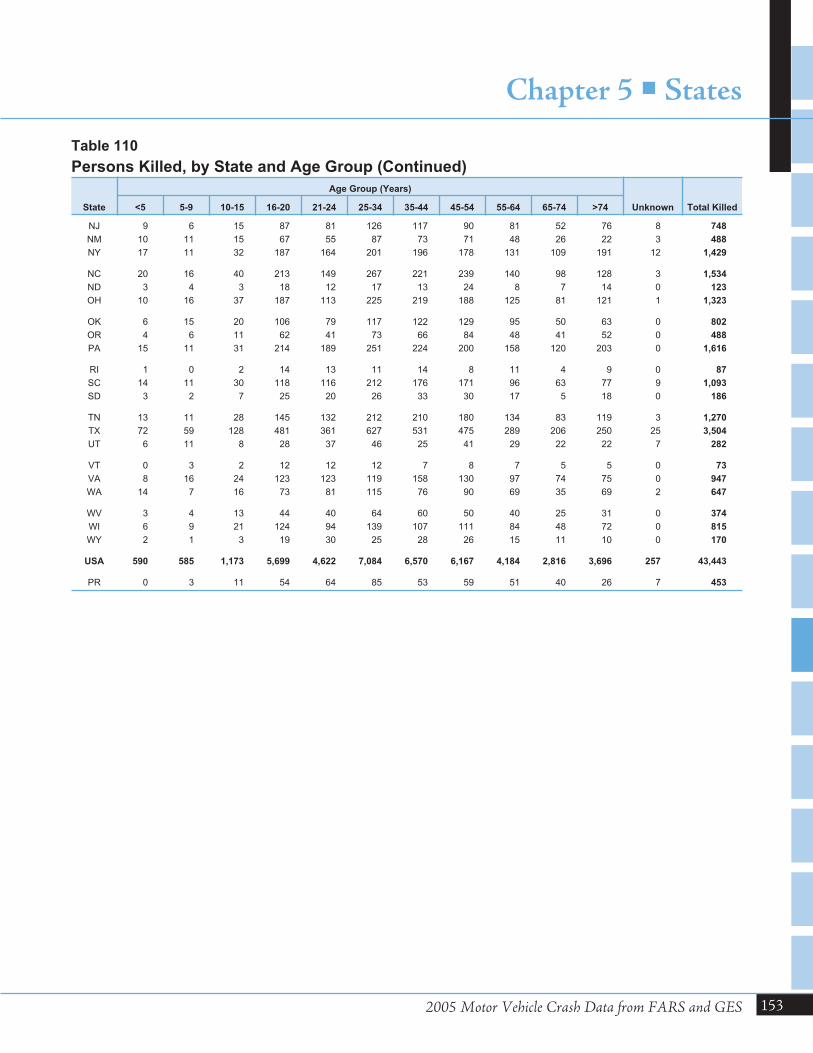
2005 Motor Vehicle Crash Data from FARS and GES
Chapter 5 � States
153
State
Age Group (Years)
Unknown Total Killed<5 5-9 10-15 16-20 21-24 25-34 35-44 45-54 55-64 65-74 >74
NJ 9 6 15 87 81 126 117 90 81 52 76 8 748
NM 10 11 15 67 55 87 73 71 48 26 22 3 488
NY 17 11 32 187 164 201 196 178 131 109 191 12 1,429
NC 20 16 40 213 149 267 221 239 140 98 128 3 1,534
ND 3 4 3 18 12 17 13 24 8 7 14 0 123
OH 10 16 37 187 113 225 219 188 125 81 121 1 1,323
OK 6 15 20 106 79 117 122 129 95 50 63 0 802
OR 4 6 11 62 41 73 66 84 48 41 52 0 488
PA 15 11 31 214 189 251 224 200 158 120 203 0 1,616
RI 1 0 2 14 13 11 14 8 11 4 9 0 87
SC 14 11 30 118 116 212 176 171 96 63 77 9 1,093
SD 3 2 7 25 20 26 33 30 17 5 18 0 186
TN 13 11 28 145 132 212 210 180 134 83 119 3 1,270
TX 72 59 128 481 361 627 531 475 289 206 250 25 3,504
UT 6 11 8 28 37 46 25 41 29 22 22 7 282
VT 0 3 2 12 12 12 7 8 7 5 5 0 73
VA 8 16 24 123 123 119 158 130 97 74 75 0 947
WA 14 7 16 73 81 115 76 90 69 35 69 2 647
WV 3 4 13 44 40 64 60 50 40 25 31 0 374
WI 6 9 21 124 94 139 107 111 84 48 72 0 815
WY 2 1 3 19 30 25 28 26 15 11 10 0 170
USA 590 585 1,173 5,699 4,622 7,084 6,570 6,167 4,184 2,816 3,696 257 43,443
PR 0 3 11 54 64 85 53 59 51 40 26 7 453
Table 110
Persons Killed, by State and Age Group (Continued)
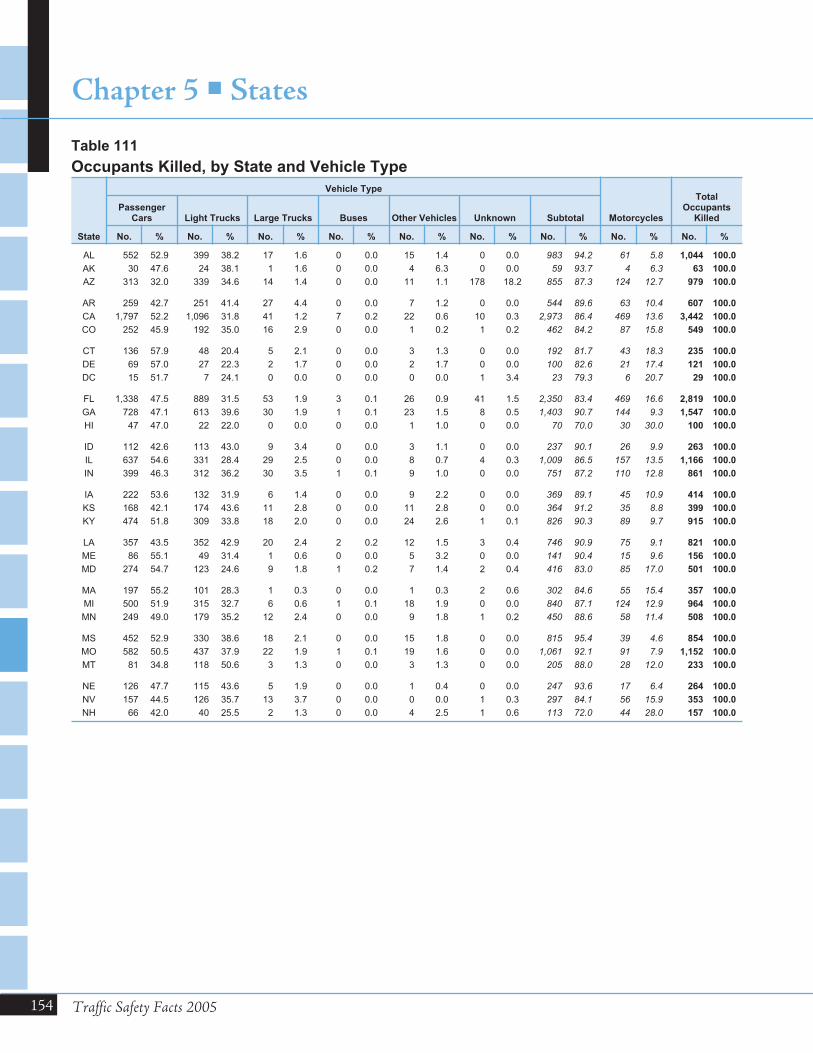
154 Traffic Safety Facts 2005
Chapter 5 � States
State
Vehicle Type
Motorcycles
TotalOccupants
KilledPassenger
Cars Light Trucks Large Trucks Buses Other Vehicles Unknown Subtotal
No. % No. % No. % No. % No. % No. % No. % No. % No. %
AL 552 52.9 399 38.2 17 1.6 0 0.0 15 1.4 0 0.0 983 94.2 61 5.8 1,044 100.0
AK 30 47.6 24 38.1 1 1.6 0 0.0 4 6.3 0 0.0 59 93.7 4 6.3 63 100.0
AZ 313 32.0 339 34.6 14 1.4 0 0.0 11 1.1 178 18.2 855 87.3 124 12.7 979 100.0
AR 259 42.7 251 41.4 27 4.4 0 0.0 7 1.2 0 0.0 544 89.6 63 10.4 607 100.0
CA 1,797 52.2 1,096 31.8 41 1.2 7 0.2 22 0.6 10 0.3 2,973 86.4 469 13.6 3,442 100.0
CO 252 45.9 192 35.0 16 2.9 0 0.0 1 0.2 1 0.2 462 84.2 87 15.8 549 100.0
CT 136 57.9 48 20.4 5 2.1 0 0.0 3 1.3 0 0.0 192 81.7 43 18.3 235 100.0
DE 69 57.0 27 22.3 2 1.7 0 0.0 2 1.7 0 0.0 100 82.6 21 17.4 121 100.0
DC 15 51.7 7 24.1 0 0.0 0 0.0 0 0.0 1 3.4 23 79.3 6 20.7 29 100.0
FL 1,338 47.5 889 31.5 53 1.9 3 0.1 26 0.9 41 1.5 2,350 83.4 469 16.6 2,819 100.0
GA 728 47.1 613 39.6 30 1.9 1 0.1 23 1.5 8 0.5 1,403 90.7 144 9.3 1,547 100.0
HI 47 47.0 22 22.0 0 0.0 0 0.0 1 1.0 0 0.0 70 70.0 30 30.0 100 100.0
ID 112 42.6 113 43.0 9 3.4 0 0.0 3 1.1 0 0.0 237 90.1 26 9.9 263 100.0
IL 637 54.6 331 28.4 29 2.5 0 0.0 8 0.7 4 0.3 1,009 86.5 157 13.5 1,166 100.0
IN 399 46.3 312 36.2 30 3.5 1 0.1 9 1.0 0 0.0 751 87.2 110 12.8 861 100.0
IA 222 53.6 132 31.9 6 1.4 0 0.0 9 2.2 0 0.0 369 89.1 45 10.9 414 100.0
KS 168 42.1 174 43.6 11 2.8 0 0.0 11 2.8 0 0.0 364 91.2 35 8.8 399 100.0
KY 474 51.8 309 33.8 18 2.0 0 0.0 24 2.6 1 0.1 826 90.3 89 9.7 915 100.0
LA 357 43.5 352 42.9 20 2.4 2 0.2 12 1.5 3 0.4 746 90.9 75 9.1 821 100.0
ME 86 55.1 49 31.4 1 0.6 0 0.0 5 3.2 0 0.0 141 90.4 15 9.6 156 100.0
MD 274 54.7 123 24.6 9 1.8 1 0.2 7 1.4 2 0.4 416 83.0 85 17.0 501 100.0
MA 197 55.2 101 28.3 1 0.3 0 0.0 1 0.3 2 0.6 302 84.6 55 15.4 357 100.0
MI 500 51.9 315 32.7 6 0.6 1 0.1 18 1.9 0 0.0 840 87.1 124 12.9 964 100.0
MN 249 49.0 179 35.2 12 2.4 0 0.0 9 1.8 1 0.2 450 88.6 58 11.4 508 100.0
MS 452 52.9 330 38.6 18 2.1 0 0.0 15 1.8 0 0.0 815 95.4 39 4.6 854 100.0
MO 582 50.5 437 37.9 22 1.9 1 0.1 19 1.6 0 0.0 1,061 92.1 91 7.9 1,152 100.0
MT 81 34.8 118 50.6 3 1.3 0 0.0 3 1.3 0 0.0 205 88.0 28 12.0 233 100.0
NE 126 47.7 115 43.6 5 1.9 0 0.0 1 0.4 0 0.0 247 93.6 17 6.4 264 100.0
NV 157 44.5 126 35.7 13 3.7 0 0.0 0 0.0 1 0.3 297 84.1 56 15.9 353 100.0
NH 66 42.0 40 25.5 2 1.3 0 0.0 4 2.5 1 0.6 113 72.0 44 28.0 157 100.0
Table 111
Occupants Killed, by State and Vehicle Type
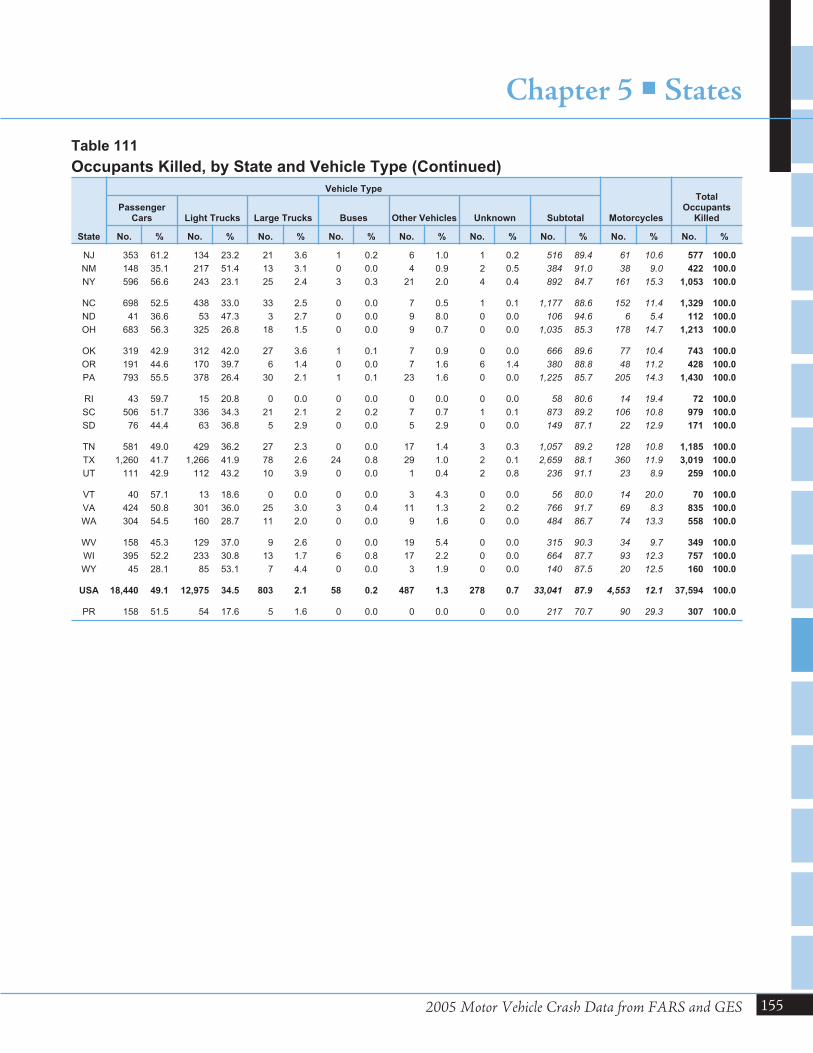
2005 Motor Vehicle Crash Data from FARS and GES
Chapter 5 � States
155
State
Vehicle Type
Motorcycles
TotalOccupants
KilledPassenger
Cars Light Trucks Large Trucks Buses Other Vehicles Unknown Subtotal
No. % No. % No. % No. % No. % No. % No. % No. % No. %
NJ 353 61.2 134 23.2 21 3.6 1 0.2 6 1.0 1 0.2 516 89.4 61 10.6 577 100.0
NM 148 35.1 217 51.4 13 3.1 0 0.0 4 0.9 2 0.5 384 91.0 38 9.0 422 100.0
NY 596 56.6 243 23.1 25 2.4 3 0.3 21 2.0 4 0.4 892 84.7 161 15.3 1,053 100.0
NC 698 52.5 438 33.0 33 2.5 0 0.0 7 0.5 1 0.1 1,177 88.6 152 11.4 1,329 100.0
ND 41 36.6 53 47.3 3 2.7 0 0.0 9 8.0 0 0.0 106 94.6 6 5.4 112 100.0
OH 683 56.3 325 26.8 18 1.5 0 0.0 9 0.7 0 0.0 1,035 85.3 178 14.7 1,213 100.0
OK 319 42.9 312 42.0 27 3.6 1 0.1 7 0.9 0 0.0 666 89.6 77 10.4 743 100.0
OR 191 44.6 170 39.7 6 1.4 0 0.0 7 1.6 6 1.4 380 88.8 48 11.2 428 100.0
PA 793 55.5 378 26.4 30 2.1 1 0.1 23 1.6 0 0.0 1,225 85.7 205 14.3 1,430 100.0
RI 43 59.7 15 20.8 0 0.0 0 0.0 0 0.0 0 0.0 58 80.6 14 19.4 72 100.0
SC 506 51.7 336 34.3 21 2.1 2 0.2 7 0.7 1 0.1 873 89.2 106 10.8 979 100.0
SD 76 44.4 63 36.8 5 2.9 0 0.0 5 2.9 0 0.0 149 87.1 22 12.9 171 100.0
TN 581 49.0 429 36.2 27 2.3 0 0.0 17 1.4 3 0.3 1,057 89.2 128 10.8 1,185 100.0
TX 1,260 41.7 1,266 41.9 78 2.6 24 0.8 29 1.0 2 0.1 2,659 88.1 360 11.9 3,019 100.0
UT 111 42.9 112 43.2 10 3.9 0 0.0 1 0.4 2 0.8 236 91.1 23 8.9 259 100.0
VT 40 57.1 13 18.6 0 0.0 0 0.0 3 4.3 0 0.0 56 80.0 14 20.0 70 100.0
VA 424 50.8 301 36.0 25 3.0 3 0.4 11 1.3 2 0.2 766 91.7 69 8.3 835 100.0
WA 304 54.5 160 28.7 11 2.0 0 0.0 9 1.6 0 0.0 484 86.7 74 13.3 558 100.0
WV 158 45.3 129 37.0 9 2.6 0 0.0 19 5.4 0 0.0 315 90.3 34 9.7 349 100.0
WI 395 52.2 233 30.8 13 1.7 6 0.8 17 2.2 0 0.0 664 87.7 93 12.3 757 100.0
WY 45 28.1 85 53.1 7 4.4 0 0.0 3 1.9 0 0.0 140 87.5 20 12.5 160 100.0
USA 18,440 49.1 12,975 34.5 803 2.1 58 0.2 487 1.3 278 0.7 33,041 87.9 4,553 12.1 37,594 100.0
PR 158 51.5 54 17.6 5 1.6 0 0.0 0 0.0 0 0.0 217 70.7 90 29.3 307 100.0
Table 111
Occupants Killed, by State and Vehicle Type (Continued)
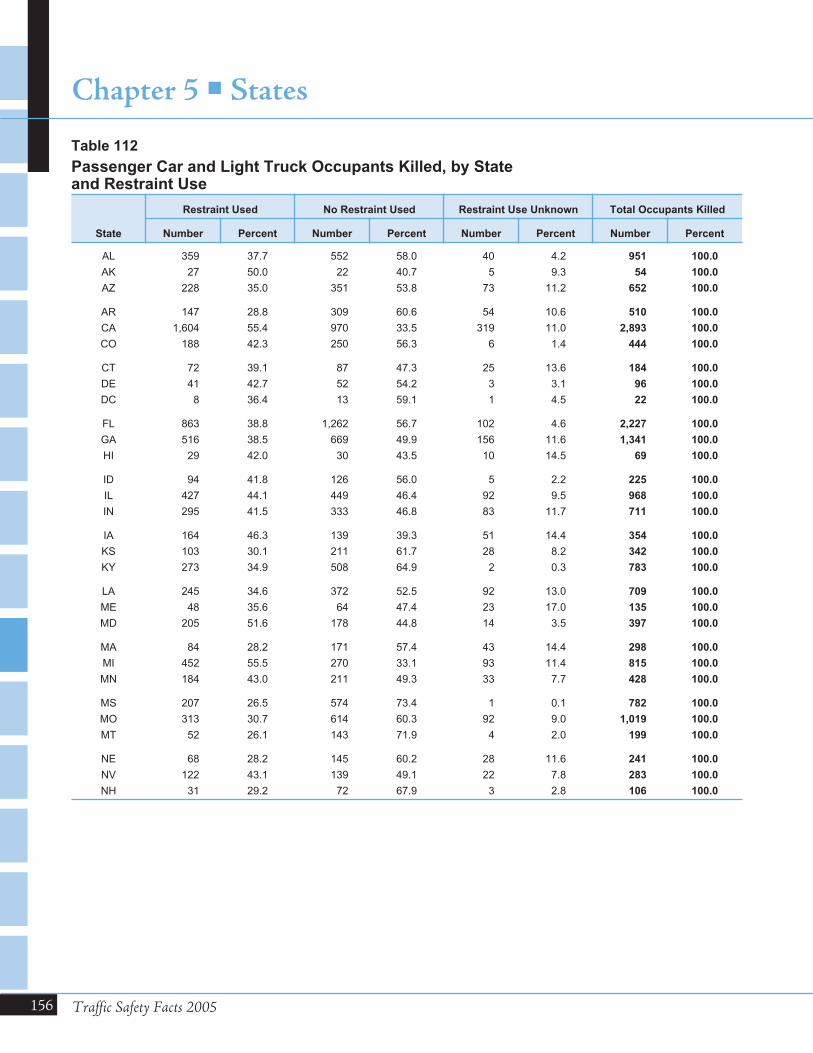
156 Traffic Safety Facts 2005
Chapter 5 � States
State
Restraint Used No Restraint Used Restraint Use Unknown Total Occupants Killed
Number Percent Number Percent Number Percent Number Percent
AL 359 37.7 552 58.0 40 4.2 951 100.0
AK 27 50.0 22 40.7 5 9.3 54 100.0
AZ 228 35.0 351 53.8 73 11.2 652 100.0
AR 147 28.8 309 60.6 54 10.6 510 100.0
CA 1,604 55.4 970 33.5 319 11.0 2,893 100.0
CO 188 42.3 250 56.3 6 1.4 444 100.0
CT 72 39.1 87 47.3 25 13.6 184 100.0
DE 41 42.7 52 54.2 3 3.1 96 100.0
DC 8 36.4 13 59.1 1 4.5 22 100.0
FL 863 38.8 1,262 56.7 102 4.6 2,227 100.0
GA 516 38.5 669 49.9 156 11.6 1,341 100.0
HI 29 42.0 30 43.5 10 14.5 69 100.0
ID 94 41.8 126 56.0 5 2.2 225 100.0
IL 427 44.1 449 46.4 92 9.5 968 100.0
IN 295 41.5 333 46.8 83 11.7 711 100.0
IA 164 46.3 139 39.3 51 14.4 354 100.0
KS 103 30.1 211 61.7 28 8.2 342 100.0
KY 273 34.9 508 64.9 2 0.3 783 100.0
LA 245 34.6 372 52.5 92 13.0 709 100.0
ME 48 35.6 64 47.4 23 17.0 135 100.0
MD 205 51.6 178 44.8 14 3.5 397 100.0
MA 84 28.2 171 57.4 43 14.4 298 100.0
MI 452 55.5 270 33.1 93 11.4 815 100.0
MN 184 43.0 211 49.3 33 7.7 428 100.0
MS 207 26.5 574 73.4 1 0.1 782 100.0
MO 313 30.7 614 60.3 92 9.0 1,019 100.0
MT 52 26.1 143 71.9 4 2.0 199 100.0
NE 68 28.2 145 60.2 28 11.6 241 100.0
NV 122 43.1 139 49.1 22 7.8 283 100.0
NH 31 29.2 72 67.9 3 2.8 106 100.0
Table 112
Passenger Car and Light Truck Occupants Killed, by Stateand Restraint Use
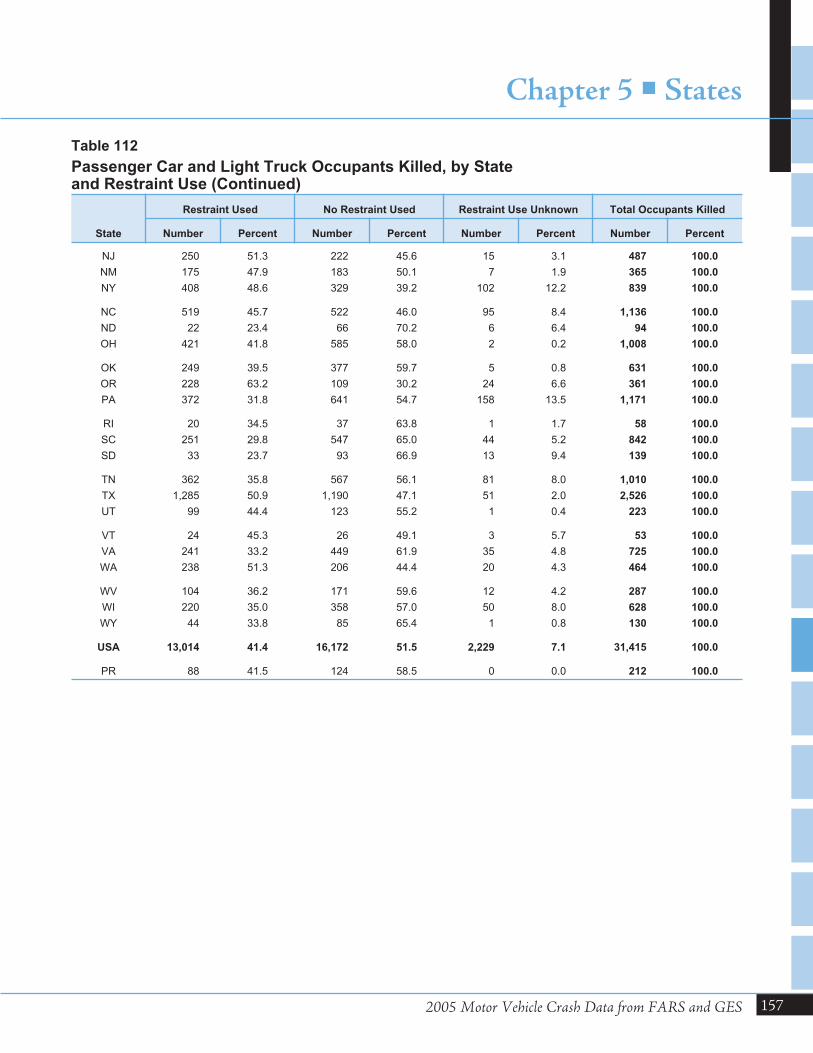
2005 Motor Vehicle Crash Data from FARS and GES
Chapter 5 � States
157
State
Restraint Used No Restraint Used Restraint Use Unknown Total Occupants Killed
Number Percent Number Percent Number Percent Number Percent
NJ 250 51.3 222 45.6 15 3.1 487 100.0
NM 175 47.9 183 50.1 7 1.9 365 100.0
NY 408 48.6 329 39.2 102 12.2 839 100.0
NC 519 45.7 522 46.0 95 8.4 1,136 100.0
ND 22 23.4 66 70.2 6 6.4 94 100.0
OH 421 41.8 585 58.0 2 0.2 1,008 100.0
OK 249 39.5 377 59.7 5 0.8 631 100.0
OR 228 63.2 109 30.2 24 6.6 361 100.0
PA 372 31.8 641 54.7 158 13.5 1,171 100.0
RI 20 34.5 37 63.8 1 1.7 58 100.0
SC 251 29.8 547 65.0 44 5.2 842 100.0
SD 33 23.7 93 66.9 13 9.4 139 100.0
TN 362 35.8 567 56.1 81 8.0 1,010 100.0
TX 1,285 50.9 1,190 47.1 51 2.0 2,526 100.0
UT 99 44.4 123 55.2 1 0.4 223 100.0
VT 24 45.3 26 49.1 3 5.7 53 100.0
VA 241 33.2 449 61.9 35 4.8 725 100.0
WA 238 51.3 206 44.4 20 4.3 464 100.0
WV 104 36.2 171 59.6 12 4.2 287 100.0
WI 220 35.0 358 57.0 50 8.0 628 100.0
WY 44 33.8 85 65.4 1 0.8 130 100.0
USA 13,014 41.4 16,172 51.5 2,229 7.1 31,415 100.0
PR 88 41.5 124 58.5 0 0.0 212 100.0
Table 112
Passenger Car and Light Truck Occupants Killed, by Stateand Restraint Use (Continued)
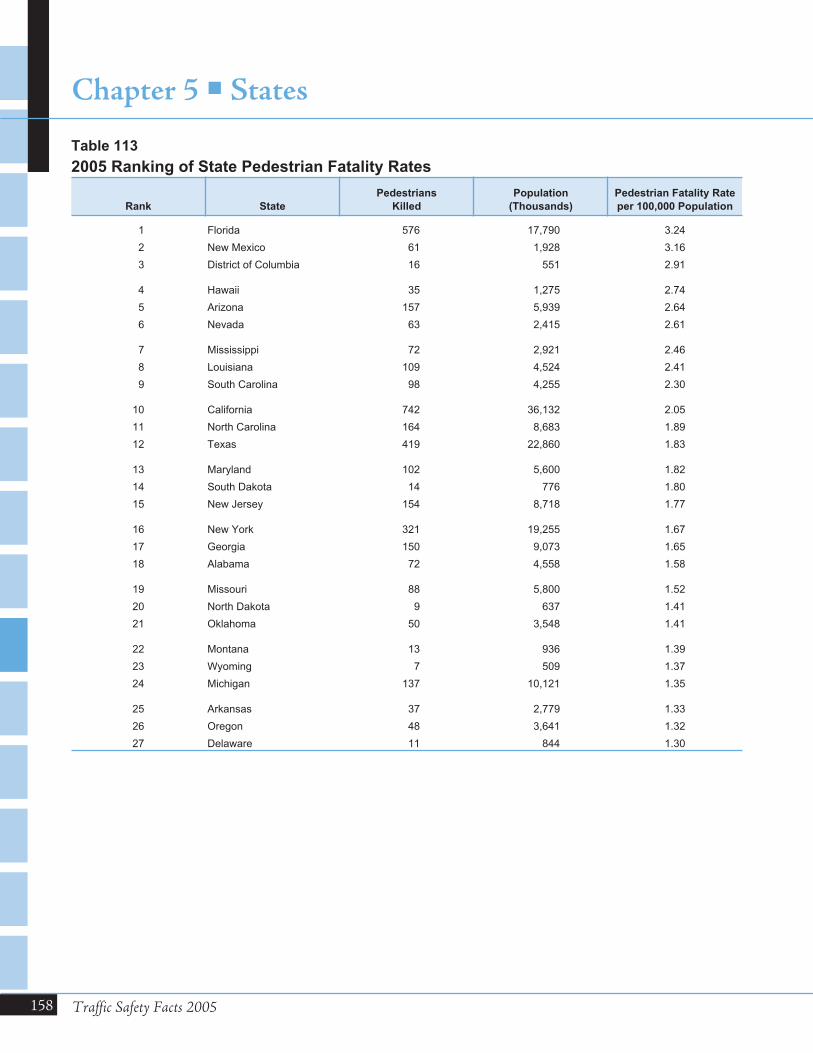
158 Traffic Safety Facts 2005
Chapter 5 � States
Rank State
Pedestrians
Killed
Population
(Thousands)
Pedestrian Fatality Rate
per 100,000 Population
1 Florida 576 17,790 3.24
2 New Mexico 61 1,928 3.16
3 District of Columbia 16 551 2.91
4 Hawaii 35 1,275 2.74
5 Arizona 157 5,939 2.64
6 Nevada 63 2,415 2.61
7 Mississippi 72 2,921 2.46
8 Louisiana 109 4,524 2.41
9 South Carolina 98 4,255 2.30
10 California 742 36,132 2.05
11 North Carolina 164 8,683 1.89
12 Texas 419 22,860 1.83
13 Maryland 102 5,600 1.82
14 South Dakota 14 776 1.80
15 New Jersey 154 8,718 1.77
16 New York 321 19,255 1.67
17 Georgia 150 9,073 1.65
18 Alabama 72 4,558 1.58
19 Missouri 88 5,800 1.52
20 North Dakota 9 637 1.41
21 Oklahoma 50 3,548 1.41
22 Montana 13 936 1.39
23 Wyoming 7 509 1.37
24 Michigan 137 10,121 1.35
25 Arkansas 37 2,779 1.33
26 Oregon 48 3,641 1.32
27 Delaware 11 844 1.30
Table 113
2005 Ranking of State Pedestrian Fatality Rates
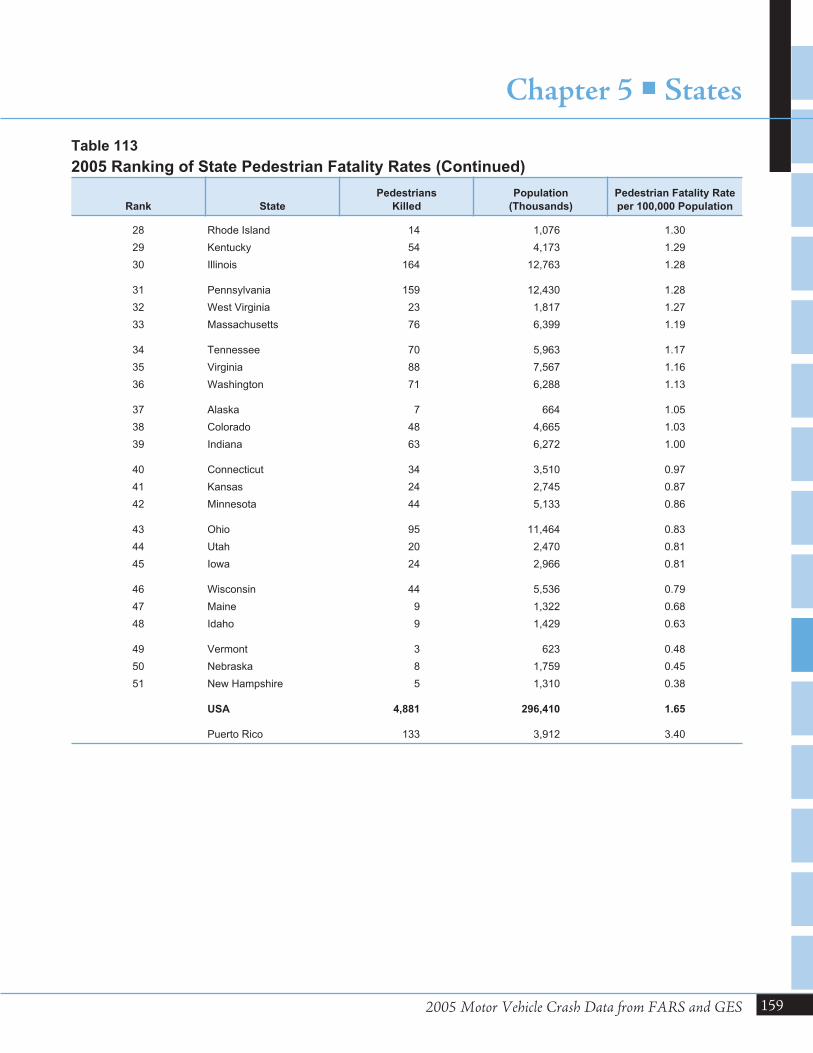
2005 Motor Vehicle Crash Data from FARS and GES
Chapter 5 � States
159
Rank State
Pedestrians
Killed
Population
(Thousands)
Pedestrian Fatality Rate
per 100,000 Population
28 Rhode Island 14 1,076 1.30
29 Kentucky 54 4,173 1.29
30 Illinois 164 12,763 1.28
31 Pennsylvania 159 12,430 1.28
32 West Virginia 23 1,817 1.27
33 Massachusetts 76 6,399 1.19
34 Tennessee 70 5,963 1.17
35 Virginia 88 7,567 1.16
36 Washington 71 6,288 1.13
37 Alaska 7 664 1.05
38 Colorado 48 4,665 1.03
39 Indiana 63 6,272 1.00
40 Connecticut 34 3,510 0.97
41 Kansas 24 2,745 0.87
42 Minnesota 44 5,133 0.86
43 Ohio 95 11,464 0.83
44 Utah 20 2,470 0.81
45 Iowa 24 2,966 0.81
46 Wisconsin 44 5,536 0.79
47 Maine 9 1,322 0.68
48 Idaho 9 1,429 0.63
49 Vermont 3 623 0.48
50 Nebraska 8 1,759 0.45
51 New Hampshire 5 1,310 0.38
USA 4,881 296,410 1.65
Puerto Rico 133 3,912 3.40
Table 113
2005 Ranking of State Pedestrian Fatality Rates (Continued)
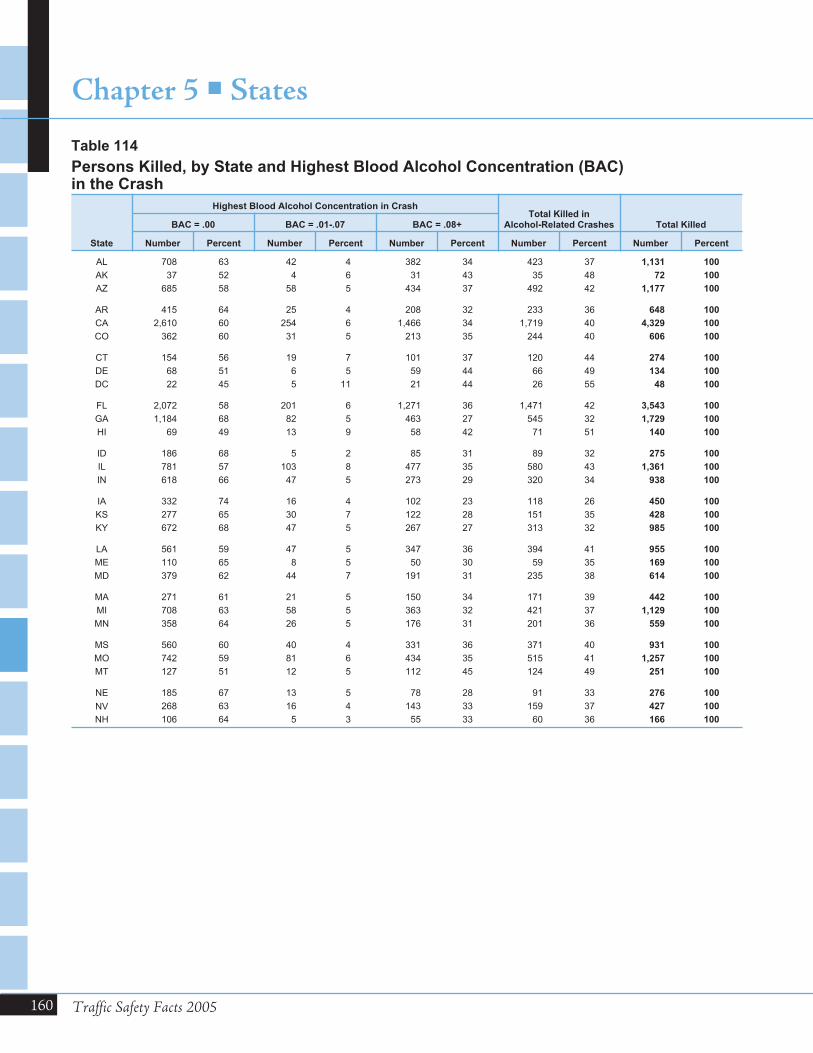
160 Traffic Safety Facts 2005
Chapter 5 � States
State
Highest Blood Alcohol Concentration in CrashTotal Killed in
Alcohol-Related Crashes Total KilledBAC = .00 BAC = .01-.07 BAC = .08+
Number Percent Number Percent Number Percent Number Percent Number Percent
AL 708 63 42 4 382 34 423 37 1,131 100
AK 37 52 4 6 31 43 35 48 72 100
AZ 685 58 58 5 434 37 492 42 1,177 100
AR 415 64 25 4 208 32 233 36 648 100
CA 2,610 60 254 6 1,466 34 1,719 40 4,329 100
CO 362 60 31 5 213 35 244 40 606 100
CT 154 56 19 7 101 37 120 44 274 100
DE 68 51 6 5 59 44 66 49 134 100
DC 22 45 5 11 21 44 26 55 48 100
FL 2,072 58 201 6 1,271 36 1,471 42 3,543 100
GA 1,184 68 82 5 463 27 545 32 1,729 100
HI 69 49 13 9 58 42 71 51 140 100
ID 186 68 5 2 85 31 89 32 275 100
IL 781 57 103 8 477 35 580 43 1,361 100
IN 618 66 47 5 273 29 320 34 938 100
IA 332 74 16 4 102 23 118 26 450 100
KS 277 65 30 7 122 28 151 35 428 100
KY 672 68 47 5 267 27 313 32 985 100
LA 561 59 47 5 347 36 394 41 955 100
ME 110 65 8 5 50 30 59 35 169 100
MD 379 62 44 7 191 31 235 38 614 100
MA 271 61 21 5 150 34 171 39 442 100
MI 708 63 58 5 363 32 421 37 1,129 100
MN 358 64 26 5 176 31 201 36 559 100
MS 560 60 40 4 331 36 371 40 931 100
MO 742 59 81 6 434 35 515 41 1,257 100
MT 127 51 12 5 112 45 124 49 251 100
NE 185 67 13 5 78 28 91 33 276 100
NV 268 63 16 4 143 33 159 37 427 100
NH 106 64 5 3 55 33 60 36 166 100
Table 114
Persons Killed, by State and Highest Blood Alcohol Concentration (BAC)in the Crash
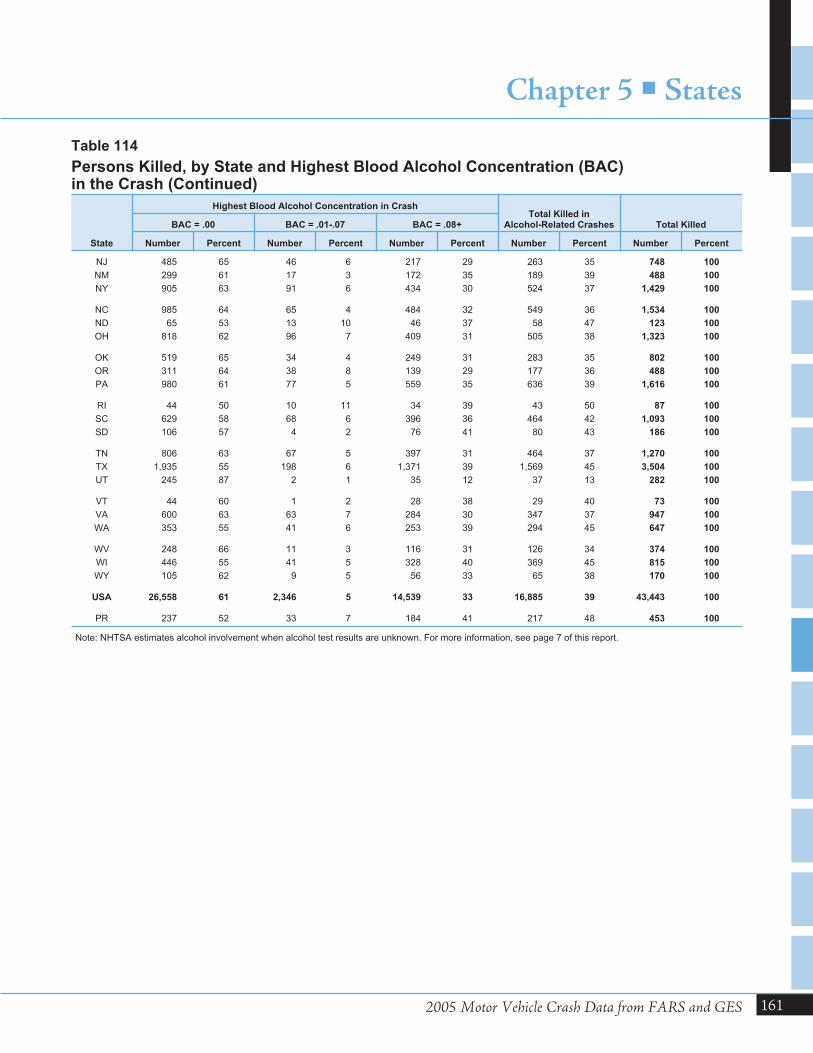
2005 Motor Vehicle Crash Data from FARS and GES
Chapter 5 � States
161
State
Highest Blood Alcohol Concentration in CrashTotal Killed in
Alcohol-Related Crashes Total KilledBAC = .00 BAC = .01-.07 BAC = .08+
Number Percent Number Percent Number Percent Number Percent Number Percent
NJ 485 65 46 6 217 29 263 35 748 100
NM 299 61 17 3 172 35 189 39 488 100
NY 905 63 91 6 434 30 524 37 1,429 100
NC 985 64 65 4 484 32 549 36 1,534 100
ND 65 53 13 10 46 37 58 47 123 100
OH 818 62 96 7 409 31 505 38 1,323 100
OK 519 65 34 4 249 31 283 35 802 100
OR 311 64 38 8 139 29 177 36 488 100
PA 980 61 77 5 559 35 636 39 1,616 100
RI 44 50 10 11 34 39 43 50 87 100
SC 629 58 68 6 396 36 464 42 1,093 100
SD 106 57 4 2 76 41 80 43 186 100
TN 806 63 67 5 397 31 464 37 1,270 100
TX 1,935 55 198 6 1,371 39 1,569 45 3,504 100
UT 245 87 2 1 35 12 37 13 282 100
VT 44 60 1 2 28 38 29 40 73 100
VA 600 63 63 7 284 30 347 37 947 100
WA 353 55 41 6 253 39 294 45 647 100
WV 248 66 11 3 116 31 126 34 374 100
WI 446 55 41 5 328 40 369 45 815 100
WY 105 62 9 5 56 33 65 38 170 100
USA 26,558 61 2,346 5 14,539 33 16,885 39 43,443 100
PR 237 52 33 7 184 41 217 48 453 100
Note: NHTSA estimates alcohol involvement when alcohol test results are unknown. For more information, see page 7 of this report.
Table 114
Persons Killed, by State and Highest Blood Alcohol Concentration (BAC)in the Crash (Continued)
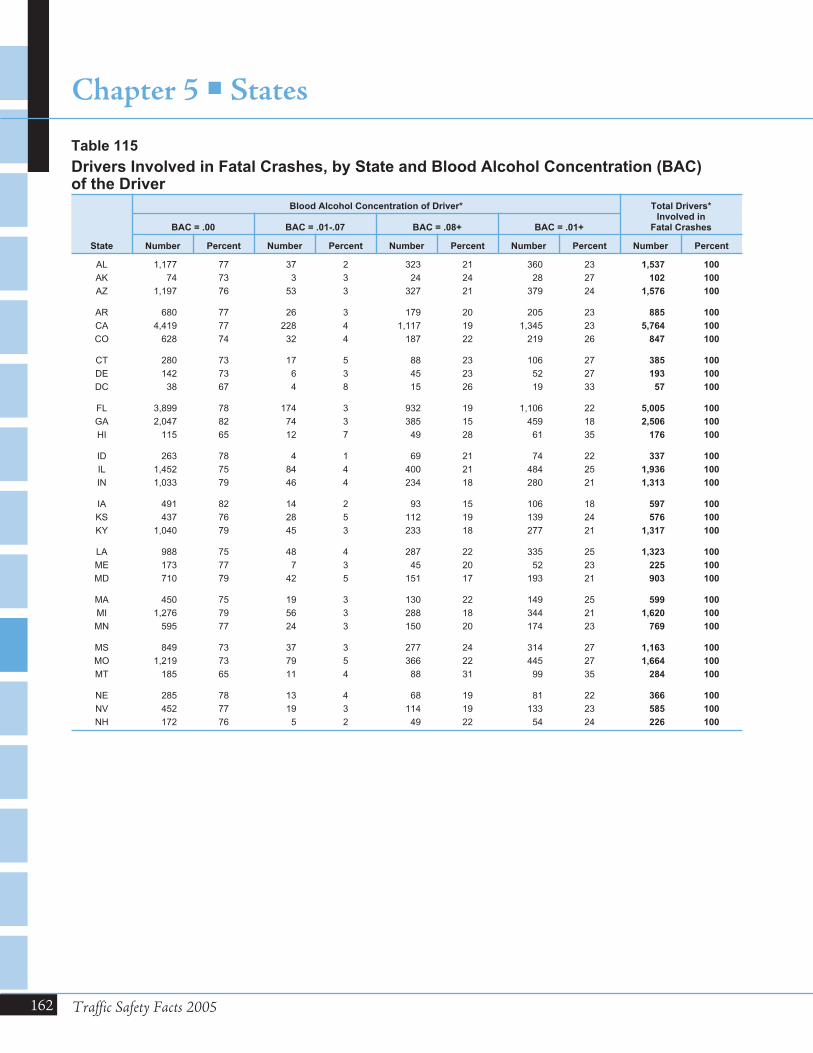
162 Traffic Safety Facts 2005
Chapter 5 � States
State
Blood Alcohol Concentration of Driver* Total Drivers*Involved in
Fatal CrashesBAC = .00 BAC = .01-.07 BAC = .08+ BAC = .01+
Number Percent Number Percent Number Percent Number Percent Number Percent
AL 1,177 77 37 2 323 21 360 23 1,537 100
AK 74 73 3 3 24 24 28 27 102 100
AZ 1,197 76 53 3 327 21 379 24 1,576 100
AR 680 77 26 3 179 20 205 23 885 100
CA 4,419 77 228 4 1,117 19 1,345 23 5,764 100
CO 628 74 32 4 187 22 219 26 847 100
CT 280 73 17 5 88 23 106 27 385 100
DE 142 73 6 3 45 23 52 27 193 100
DC 38 67 4 8 15 26 19 33 57 100
FL 3,899 78 174 3 932 19 1,106 22 5,005 100
GA 2,047 82 74 3 385 15 459 18 2,506 100
HI 115 65 12 7 49 28 61 35 176 100
ID 263 78 4 1 69 21 74 22 337 100
IL 1,452 75 84 4 400 21 484 25 1,936 100
IN 1,033 79 46 4 234 18 280 21 1,313 100
IA 491 82 14 2 93 15 106 18 597 100
KS 437 76 28 5 112 19 139 24 576 100
KY 1,040 79 45 3 233 18 277 21 1,317 100
LA 988 75 48 4 287 22 335 25 1,323 100
ME 173 77 7 3 45 20 52 23 225 100
MD 710 79 42 5 151 17 193 21 903 100
MA 450 75 19 3 130 22 149 25 599 100
MI 1,276 79 56 3 288 18 344 21 1,620 100
MN 595 77 24 3 150 20 174 23 769 100
MS 849 73 37 3 277 24 314 27 1,163 100
MO 1,219 73 79 5 366 22 445 27 1,664 100
MT 185 65 11 4 88 31 99 35 284 100
NE 285 78 13 4 68 19 81 22 366 100
NV 452 77 19 3 114 19 133 23 585 100
NH 172 76 5 2 49 22 54 24 226 100
Table 115
Drivers Involved in Fatal Crashes, by State and Blood Alcohol Concentration (BAC)of the Driver
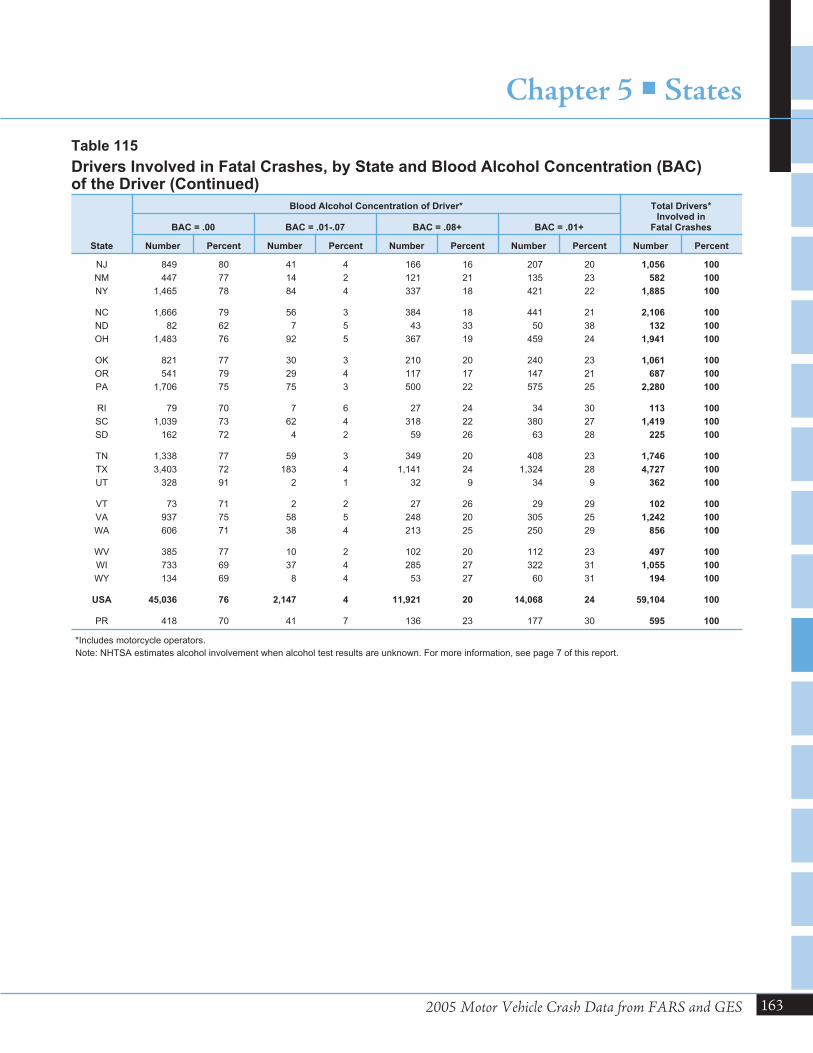
2005 Motor Vehicle Crash Data from FARS and GES
Chapter 5 � States
163
State
Blood Alcohol Concentration of Driver* Total Drivers*Involved in
Fatal CrashesBAC = .00 BAC = .01-.07 BAC = .08+ BAC = .01+
Number Percent Number Percent Number Percent Number Percent Number Percent
NJ 849 80 41 4 166 16 207 20 1,056 100
NM 447 77 14 2 121 21 135 23 582 100
NY 1,465 78 84 4 337 18 421 22 1,885 100
NC 1,666 79 56 3 384 18 441 21 2,106 100
ND 82 62 7 5 43 33 50 38 132 100
OH 1,483 76 92 5 367 19 459 24 1,941 100
OK 821 77 30 3 210 20 240 23 1,061 100
OR 541 79 29 4 117 17 147 21 687 100
PA 1,706 75 75 3 500 22 575 25 2,280 100
RI 79 70 7 6 27 24 34 30 113 100
SC 1,039 73 62 4 318 22 380 27 1,419 100
SD 162 72 4 2 59 26 63 28 225 100
TN 1,338 77 59 3 349 20 408 23 1,746 100
TX 3,403 72 183 4 1,141 24 1,324 28 4,727 100
UT 328 91 2 1 32 9 34 9 362 100
VT 73 71 2 2 27 26 29 29 102 100
VA 937 75 58 5 248 20 305 25 1,242 100
WA 606 71 38 4 213 25 250 29 856 100
WV 385 77 10 2 102 20 112 23 497 100
WI 733 69 37 4 285 27 322 31 1,055 100
WY 134 69 8 4 53 27 60 31 194 100
USA 45,036 76 2,147 4 11,921 20 14,068 24 59,104 100
PR 418 70 41 7 136 23 177 30 595 100
*Includes motorcycle operators.
Note: NHTSA estimates alcohol involvement when alcohol test results are unknown. For more information, see page 7 of this report.
Table 115
Drivers Involved in Fatal Crashes, by State and Blood Alcohol Concentration (BAC)of the Driver (Continued)
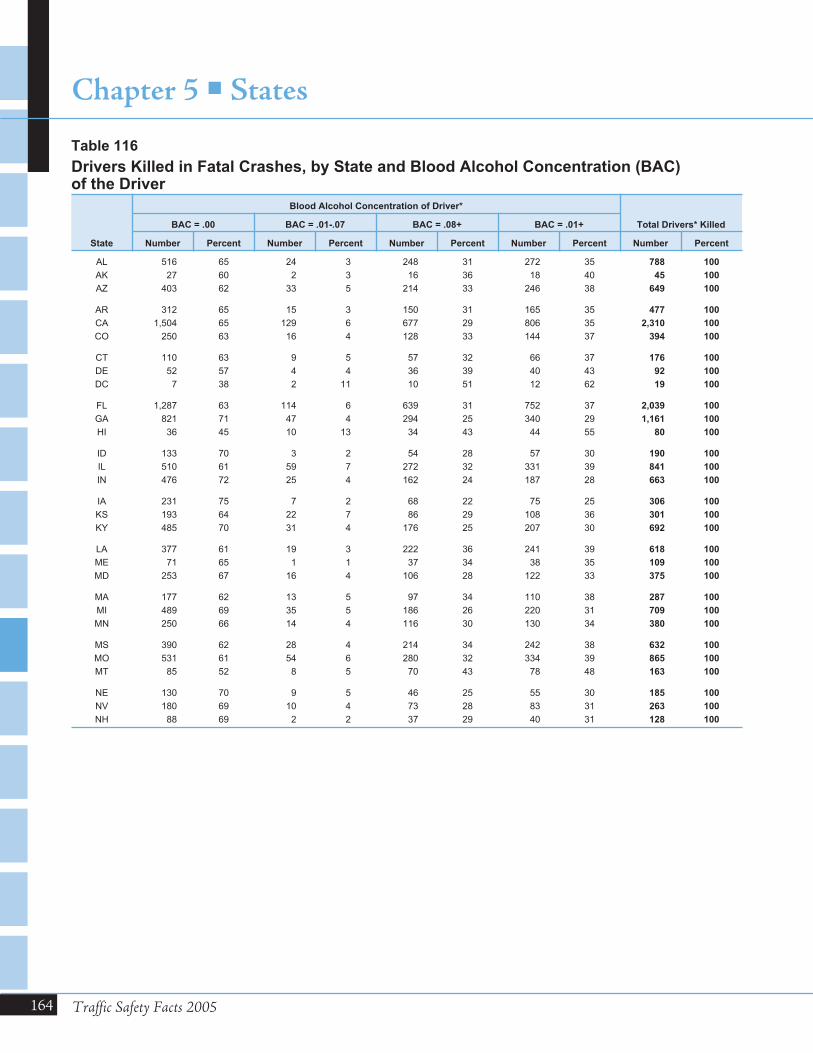
164 Traffic Safety Facts 2005
Chapter 5 � States
State
Blood Alcohol Concentration of Driver*
Total Drivers* KilledBAC = .00 BAC = .01-.07 BAC = .08+ BAC = .01+
Number Percent Number Percent Number Percent Number Percent Number Percent
AL 516 65 24 3 248 31 272 35 788 100
AK 27 60 2 3 16 36 18 40 45 100
AZ 403 62 33 5 214 33 246 38 649 100
AR 312 65 15 3 150 31 165 35 477 100
CA 1,504 65 129 6 677 29 806 35 2,310 100
CO 250 63 16 4 128 33 144 37 394 100
CT 110 63 9 5 57 32 66 37 176 100
DE 52 57 4 4 36 39 40 43 92 100
DC 7 38 2 11 10 51 12 62 19 100
FL 1,287 63 114 6 639 31 752 37 2,039 100
GA 821 71 47 4 294 25 340 29 1,161 100
HI 36 45 10 13 34 43 44 55 80 100
ID 133 70 3 2 54 28 57 30 190 100
IL 510 61 59 7 272 32 331 39 841 100
IN 476 72 25 4 162 24 187 28 663 100
IA 231 75 7 2 68 22 75 25 306 100
KS 193 64 22 7 86 29 108 36 301 100
KY 485 70 31 4 176 25 207 30 692 100
LA 377 61 19 3 222 36 241 39 618 100
ME 71 65 1 1 37 34 38 35 109 100
MD 253 67 16 4 106 28 122 33 375 100
MA 177 62 13 5 97 34 110 38 287 100
MI 489 69 35 5 186 26 220 31 709 100
MN 250 66 14 4 116 30 130 34 380 100
MS 390 62 28 4 214 34 242 38 632 100
MO 531 61 54 6 280 32 334 39 865 100
MT 85 52 8 5 70 43 78 48 163 100
NE 130 70 9 5 46 25 55 30 185 100
NV 180 69 10 4 73 28 83 31 263 100
NH 88 69 2 2 37 29 40 31 128 100
Table 116
Drivers Killed in Fatal Crashes, by State and Blood Alcohol Concentration (BAC)of the Driver

2005 Motor Vehicle Crash Data from FARS and GES
Chapter 5 � States
165
State
Blood Alcohol Concentration of Driver*
Total Drivers* KilledBAC = .00 BAC = .01-.07 BAC = .08+ BAC = .01+
Number Percent Number Percent Number Percent Number Percent Number Percent
NJ 296 69 26 6 105 25 131 31 427 100
NM 185 67 8 3 85 31 92 33 277 100
NY 512 65 53 7 220 28 273 35 785 100
NC 696 70 30 3 275 27 306 30 1,002 100
ND 45 52 5 6 36 42 41 48 86 100
OH 567 62 67 7 285 31 351 38 918 100
OK 375 69 17 3 154 28 171 31 546 100
OR 211 66 19 6 89 28 107 34 318 100
PA 705 64 33 3 366 33 399 36 1,104 100
RI 23 47 6 12 20 41 26 53 49 100
SC 412 57 51 7 259 36 309 43 721 100
SD 76 66 2 2 37 32 39 34 115 100
TN 587 65 40 4 278 31 317 35 904 100
TX 1,204 58 99 5 791 38 890 42 2,094 100
UT 141 87 1 0 20 12 20 13 161 100
VT 35 64 0 0 20 36 20 36 55 100
VA 412 64 45 7 187 29 231 36 643 100
WA 233 58 22 5 148 37 169 42 402 100
WV 175 67 6 2 81 31 87 33 262 100
WI 315 58 21 4 212 39 233 42 548 100
WY 67 57 6 5 45 38 51 43 118 100
USA 17,644 64 1,313 5 8,515 31 9,828 36 27,472 100
PR 124 53 19 8 90 39 109 47 233 100
*Includes motorcycle operators.
Note: NHTSA estimates alcohol involvement when alcohol test results are unknown. For more information, see page 7 of this report.
Table 116
Drivers Killed in Fatal Crashes, by State and Blood Alcohol Concentration (BAC)of the Driver (Continued)
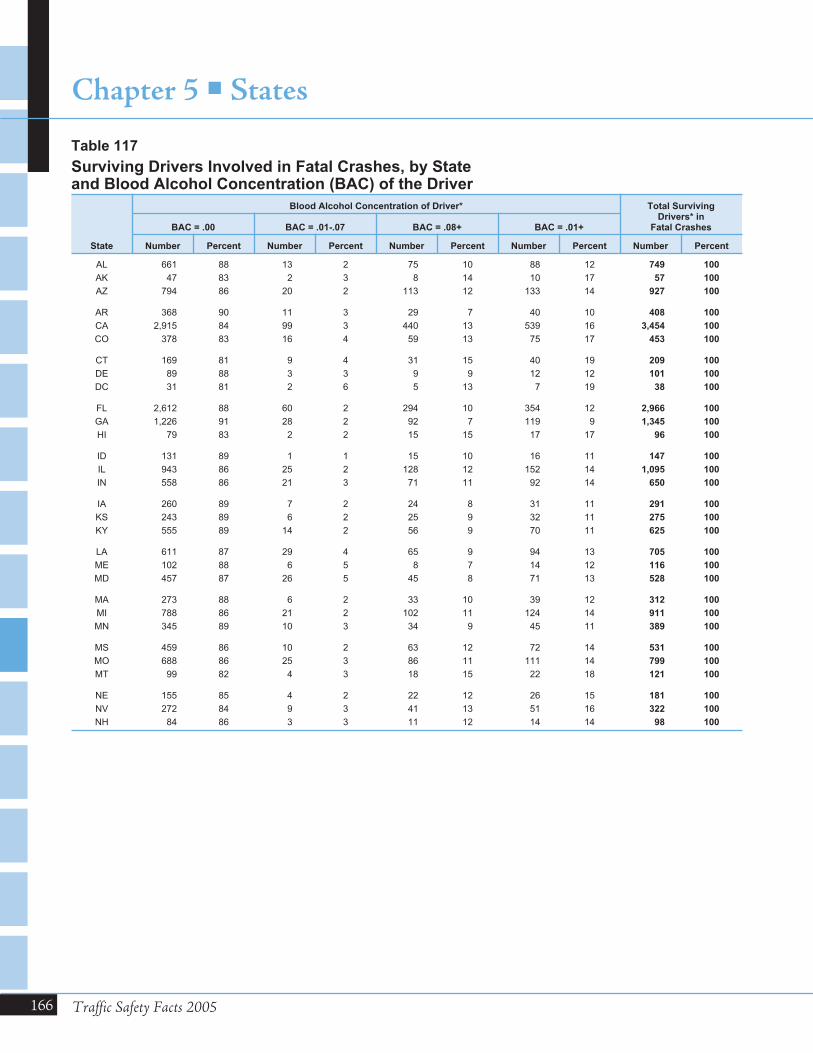
166 Traffic Safety Facts 2005
Chapter 5 � States
State
Blood Alcohol Concentration of Driver* Total SurvivingDrivers* in
Fatal CrashesBAC = .00 BAC = .01-.07 BAC = .08+ BAC = .01+
Number Percent Number Percent Number Percent Number Percent Number Percent
AL 661 88 13 2 75 10 88 12 749 100
AK 47 83 2 3 8 14 10 17 57 100
AZ 794 86 20 2 113 12 133 14 927 100
AR 368 90 11 3 29 7 40 10 408 100
CA 2,915 84 99 3 440 13 539 16 3,454 100
CO 378 83 16 4 59 13 75 17 453 100
CT 169 81 9 4 31 15 40 19 209 100
DE 89 88 3 3 9 9 12 12 101 100
DC 31 81 2 6 5 13 7 19 38 100
FL 2,612 88 60 2 294 10 354 12 2,966 100
GA 1,226 91 28 2 92 7 119 9 1,345 100
HI 79 83 2 2 15 15 17 17 96 100
ID 131 89 1 1 15 10 16 11 147 100
IL 943 86 25 2 128 12 152 14 1,095 100
IN 558 86 21 3 71 11 92 14 650 100
IA 260 89 7 2 24 8 31 11 291 100
KS 243 89 6 2 25 9 32 11 275 100
KY 555 89 14 2 56 9 70 11 625 100
LA 611 87 29 4 65 9 94 13 705 100
ME 102 88 6 5 8 7 14 12 116 100
MD 457 87 26 5 45 8 71 13 528 100
MA 273 88 6 2 33 10 39 12 312 100
MI 788 86 21 2 102 11 124 14 911 100
MN 345 89 10 3 34 9 45 11 389 100
MS 459 86 10 2 63 12 72 14 531 100
MO 688 86 25 3 86 11 111 14 799 100
MT 99 82 4 3 18 15 22 18 121 100
NE 155 85 4 2 22 12 26 15 181 100
NV 272 84 9 3 41 13 51 16 322 100
NH 84 86 3 3 11 12 14 14 98 100
Table 117
Surviving Drivers Involved in Fatal Crashes, by Stateand Blood Alcohol Concentration (BAC) of the Driver

2005 Motor Vehicle Crash Data from FARS and GES
Chapter 5 � States
167
State
Blood Alcohol Concentration of Driver* Total SurvivingDrivers* in
Fatal CrashesBAC = .00 BAC = .01-.07 BAC = .08+ BAC = .01+
Number Percent Number Percent Number Percent Number Percent Number Percent
NJ 553 88 16 3 61 10 77 12 629 100
NM 262 86 7 2 36 12 43 14 305 100
NY 952 87 31 3 117 11 148 13 1,100 100
NC 969 88 26 2 109 10 135 12 1,104 100
ND 37 81 1 3 7 16 9 19 46 100
OH 916 90 25 2 82 8 107 10 1,023 100
OK 447 87 13 2 56 11 69 13 515 100
OR 330 89 11 3 29 8 39 11 369 100
PA 1,001 85 41 3 134 11 175 15 1,176 100
RI 56 87 1 1 8 12 8 13 64 100
SC 627 90 12 2 59 8 71 10 698 100
SD 86 78 2 2 22 20 24 22 110 100
TN 751 89 20 2 71 8 91 11 842 100
TX 2,199 84 84 3 350 13 434 16 2,633 100
UT 187 93 2 1 12 6 14 7 201 100
VT 38 81 2 4 7 15 9 19 47 100
VA 525 88 13 2 61 10 74 12 599 100
WA 373 82 16 4 65 14 81 18 454 100
WV 210 89 4 2 21 9 25 11 235 100
WI 418 82 16 3 74 15 90 18 507 100
WY 67 88 1 2 8 10 9 12 76 100
USA 27,393 87 834 3 3,406 11 4,240 13 31,632 100
PR 294 81 23 6 46 13 68 19 362 100
*Includes motorcycle operators.
Note: NHTSA estimates alcohol involvement when alcohol test results are unknown. For more information, see page 7 of this report.
Table 117
Surviving Drivers Involved in Fatal Crashes, by Stateand Blood Alcohol Concentration (BAC) of the Driver (Continued)
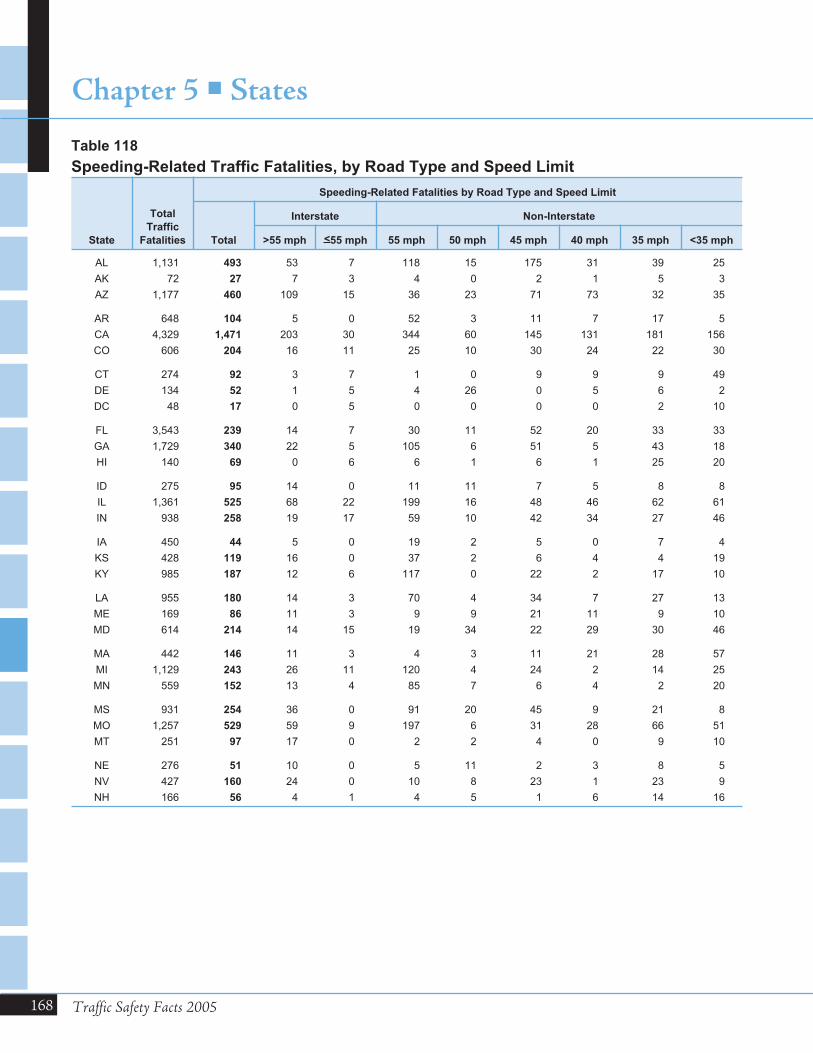
168 Traffic Safety Facts 2005
Chapter 5 � States
State
Total
Traffic
Fatalities
Speeding-Related Fatalities by Road Type and Speed Limit
Total
Interstate Non-Interstate
>55 mph <55 mph 55 mph 50 mph 45 mph 40 mph 35 mph <35 mph
AL 1,131 493 53 7 118 15 175 31 39 25
AK 72 27 7 3 4 0 2 1 5 3
AZ 1,177 460 109 15 36 23 71 73 32 35
AR 648 104 5 0 52 3 11 7 17 5
CA 4,329 1,471 203 30 344 60 145 131 181 156
CO 606 204 16 11 25 10 30 24 22 30
CT 274 92 3 7 1 0 9 9 9 49
DE 134 52 1 5 4 26 0 5 6 2
DC 48 17 0 5 0 0 0 0 2 10
FL 3,543 239 14 7 30 11 52 20 33 33
GA 1,729 340 22 5 105 6 51 5 43 18
HI 140 69 0 6 6 1 6 1 25 20
ID 275 95 14 0 11 11 7 5 8 8
IL 1,361 525 68 22 199 16 48 46 62 61
IN 938 258 19 17 59 10 42 34 27 46
IA 450 44 5 0 19 2 5 0 7 4
KS 428 119 16 0 37 2 6 4 4 19
KY 985 187 12 6 117 0 22 2 17 10
LA 955 180 14 3 70 4 34 7 27 13
ME 169 86 11 3 9 9 21 11 9 10
MD 614 214 14 15 19 34 22 29 30 46
MA 442 146 11 3 4 3 11 21 28 57
MI 1,129 243 26 11 120 4 24 2 14 25
MN 559 152 13 4 85 7 6 4 2 20
MS 931 254 36 0 91 20 45 9 21 8
MO 1,257 529 59 9 197 6 31 28 66 51
MT 251 97 17 0 2 2 4 0 9 10
NE 276 51 10 0 5 11 2 3 8 5
NV 427 160 24 0 10 8 23 1 23 9
NH 166 56 4 1 4 5 1 6 14 16
Table 118
Speeding-Related Traffic Fatalities, by Road Type and Speed Limit
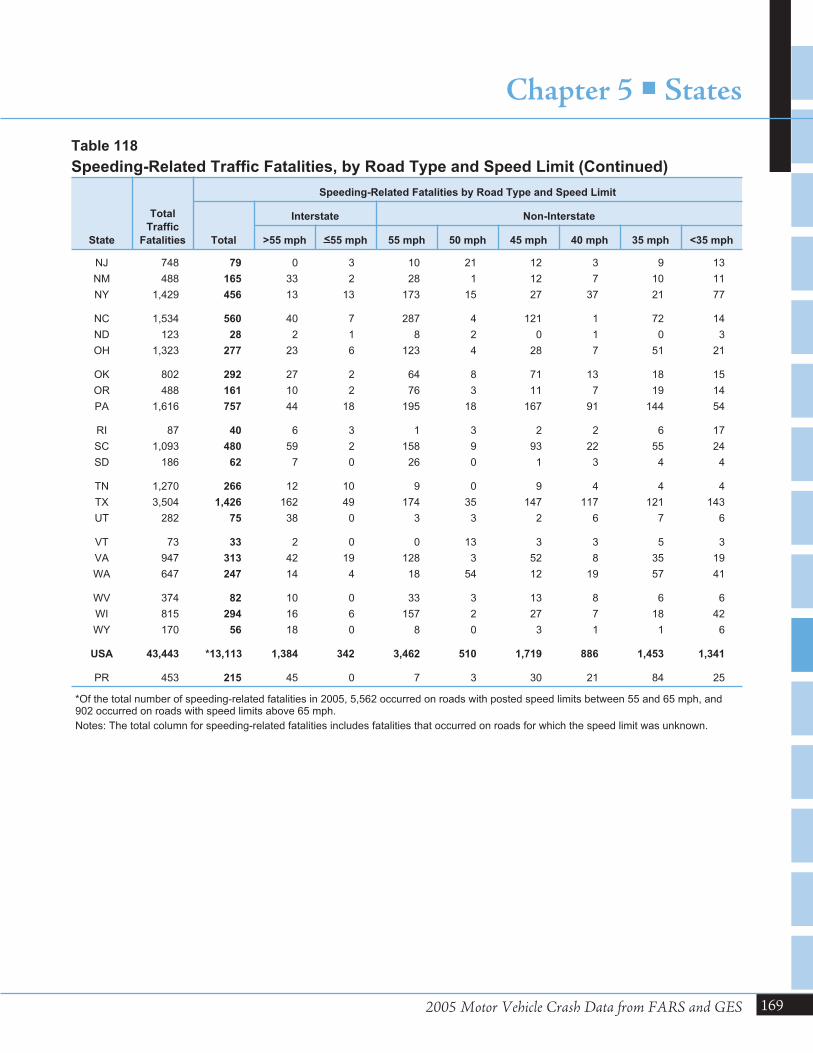
2005 Motor Vehicle Crash Data from FARS and GES
Chapter 5 � States
169
State
Total
Traffic
Fatalities
Speeding-Related Fatalities by Road Type and Speed Limit
Total
Interstate Non-Interstate
>55 mph <55 mph 55 mph 50 mph 45 mph 40 mph 35 mph <35 mph
NJ 748 79 0 3 10 21 12 3 9 13
NM 488 165 33 2 28 1 12 7 10 11
NY 1,429 456 13 13 173 15 27 37 21 77
NC 1,534 560 40 7 287 4 121 1 72 14
ND 123 28 2 1 8 2 0 1 0 3
OH 1,323 277 23 6 123 4 28 7 51 21
OK 802 292 27 2 64 8 71 13 18 15
OR 488 161 10 2 76 3 11 7 19 14
PA 1,616 757 44 18 195 18 167 91 144 54
RI 87 40 6 3 1 3 2 2 6 17
SC 1,093 480 59 2 158 9 93 22 55 24
SD 186 62 7 0 26 0 1 3 4 4
TN 1,270 266 12 10 9 0 9 4 4 4
TX 3,504 1,426 162 49 174 35 147 117 121 143
UT 282 75 38 0 3 3 2 6 7 6
VT 73 33 2 0 0 13 3 3 5 3
VA 947 313 42 19 128 3 52 8 35 19
WA 647 247 14 4 18 54 12 19 57 41
WV 374 82 10 0 33 3 13 8 6 6
WI 815 294 16 6 157 2 27 7 18 42
WY 170 56 18 0 8 0 3 1 1 6
USA 43,443 *13,113 1,384 342 3,462 510 1,719 886 1,453 1,341
PR 453 215 45 0 7 3 30 21 84 25
*Of the total number of speeding-related fatalities in 2005, 5,562 occurred on roads with posted speed limits between 55 and 65 mph, and902 occurred on roads with speed limits above 65 mph.
Notes: The total column for speeding-related fatalities includes fatalities that occurred on roads for which the speed limit was unknown.
Table 118
Speeding-Related Traffic Fatalities, by Road Type and Speed Limit (Continued)
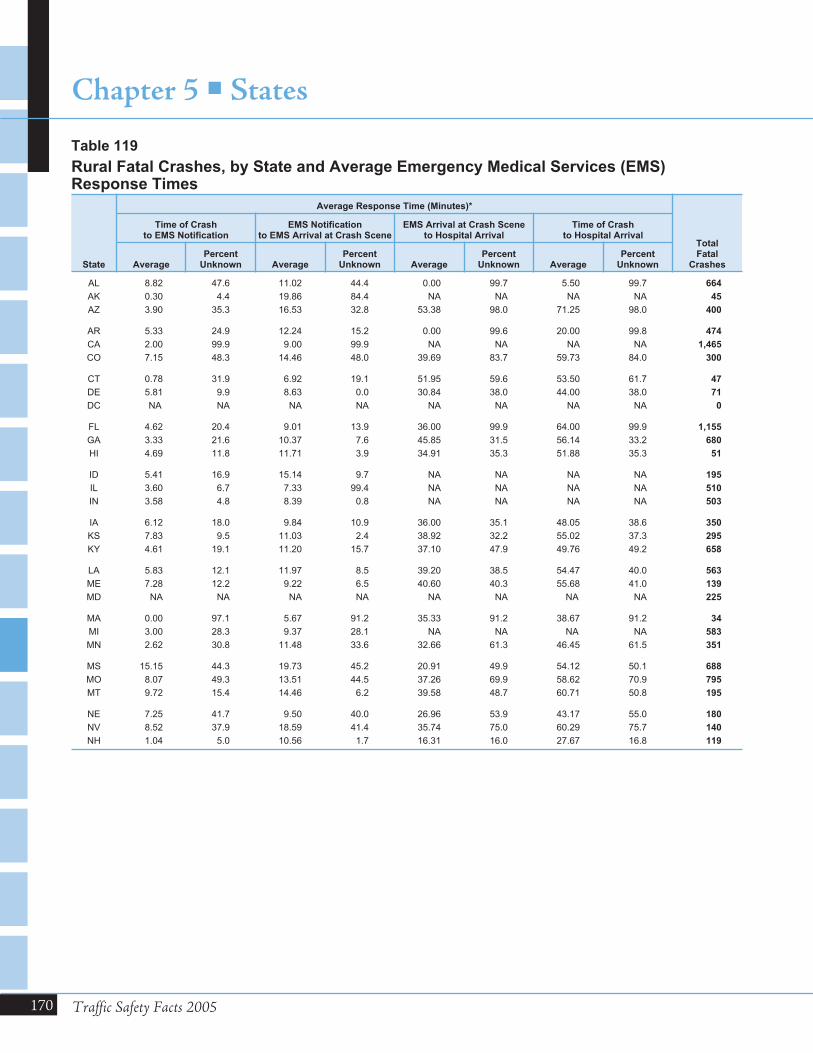
170 Traffic Safety Facts 2005
Chapter 5 � States
State
Average Response Time (Minutes)*
TotalFatal
Crashes
Time of Crashto EMS Notification
EMS Notificationto EMS Arrival at Crash Scene
EMS Arrival at Crash Sceneto Hospital Arrival
Time of Crashto Hospital Arrival
AveragePercent
Unknown AveragePercent
Unknown AveragePercent
Unknown AveragePercent
Unknown
AL 8.82 47.6 11.02 44.4 0.00 99.7 5.50 99.7 664
AK 0.30 4.4 19.86 84.4 NA NA NA NA 45
AZ 3.90 35.3 16.53 32.8 53.38 98.0 71.25 98.0 400
AR 5.33 24.9 12.24 15.2 0.00 99.6 20.00 99.8 474
CA 2.00 99.9 9.00 99.9 NA NA NA NA 1,465
CO 7.15 48.3 14.46 48.0 39.69 83.7 59.73 84.0 300
CT 0.78 31.9 6.92 19.1 51.95 59.6 53.50 61.7 47
DE 5.81 9.9 8.63 0.0 30.84 38.0 44.00 38.0 71
DC NA NA NA NA NA NA NA NA 0
FL 4.62 20.4 9.01 13.9 36.00 99.9 64.00 99.9 1,155
GA 3.33 21.6 10.37 7.6 45.85 31.5 56.14 33.2 680
HI 4.69 11.8 11.71 3.9 34.91 35.3 51.88 35.3 51
ID 5.41 16.9 15.14 9.7 NA NA NA NA 195
IL 3.60 6.7 7.33 99.4 NA NA NA NA 510
IN 3.58 4.8 8.39 0.8 NA NA NA NA 503
IA 6.12 18.0 9.84 10.9 36.00 35.1 48.05 38.6 350
KS 7.83 9.5 11.03 2.4 38.92 32.2 55.02 37.3 295
KY 4.61 19.1 11.20 15.7 37.10 47.9 49.76 49.2 658
LA 5.83 12.1 11.97 8.5 39.20 38.5 54.47 40.0 563
ME 7.28 12.2 9.22 6.5 40.60 40.3 55.68 41.0 139
MD NA NA NA NA NA NA NA NA 225
MA 0.00 97.1 5.67 91.2 35.33 91.2 38.67 91.2 34
MI 3.00 28.3 9.37 28.1 NA NA NA NA 583
MN 2.62 30.8 11.48 33.6 32.66 61.3 46.45 61.5 351
MS 15.15 44.3 19.73 45.2 20.91 49.9 54.12 50.1 688
MO 8.07 49.3 13.51 44.5 37.26 69.9 58.62 70.9 795
MT 9.72 15.4 14.46 6.2 39.58 48.7 60.71 50.8 195
NE 7.25 41.7 9.50 40.0 26.96 53.9 43.17 55.0 180
NV 8.52 37.9 18.59 41.4 35.74 75.0 60.29 75.7 140
NH 1.04 5.0 10.56 1.7 16.31 16.0 27.67 16.8 119
Table 119
Rural Fatal Crashes, by State and Average Emergency Medical Services (EMS)Response Times
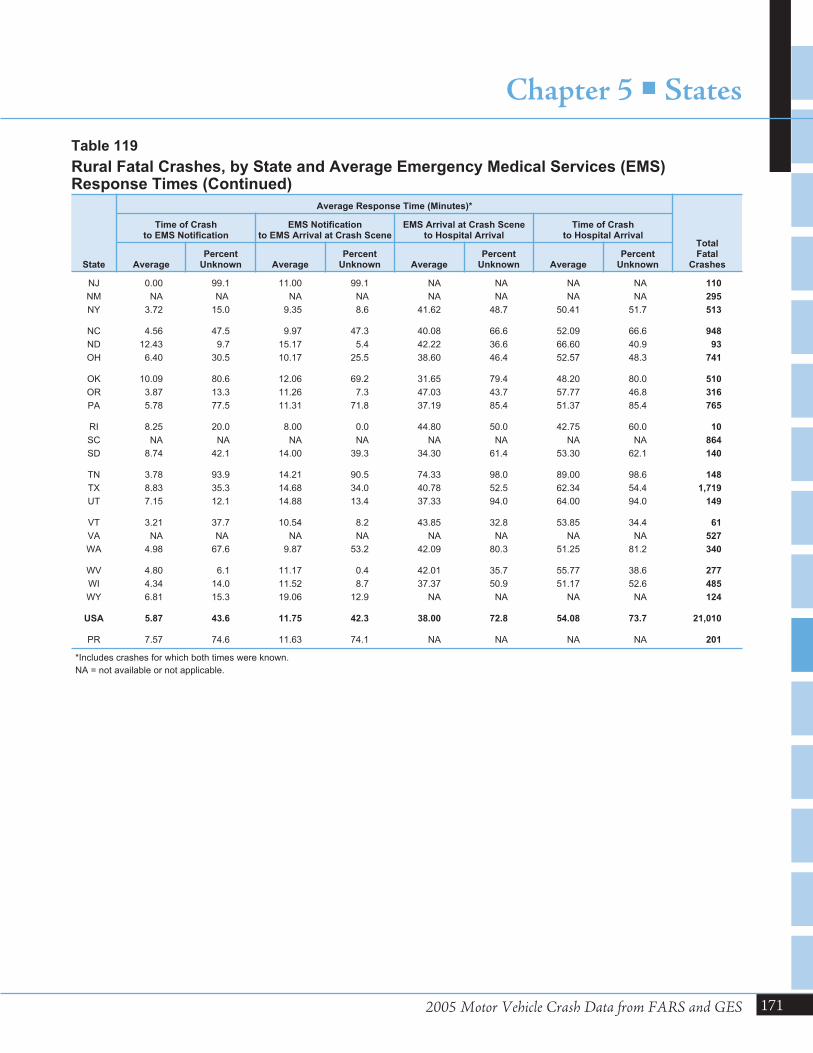
2005 Motor Vehicle Crash Data from FARS and GES
Chapter 5 � States
171
State
Average Response Time (Minutes)*
TotalFatal
Crashes
Time of Crashto EMS Notification
EMS Notificationto EMS Arrival at Crash Scene
EMS Arrival at Crash Sceneto Hospital Arrival
Time of Crashto Hospital Arrival
AveragePercent
Unknown AveragePercent
Unknown AveragePercent
Unknown AveragePercent
Unknown
NJ 0.00 99.1 11.00 99.1 NA NA NA NA 110
NM NA NA NA NA NA NA NA NA 295
NY 3.72 15.0 9.35 8.6 41.62 48.7 50.41 51.7 513
NC 4.56 47.5 9.97 47.3 40.08 66.6 52.09 66.6 948
ND 12.43 9.7 15.17 5.4 42.22 36.6 66.60 40.9 93
OH 6.40 30.5 10.17 25.5 38.60 46.4 52.57 48.3 741
OK 10.09 80.6 12.06 69.2 31.65 79.4 48.20 80.0 510
OR 3.87 13.3 11.26 7.3 47.03 43.7 57.77 46.8 316
PA 5.78 77.5 11.31 71.8 37.19 85.4 51.37 85.4 765
RI 8.25 20.0 8.00 0.0 44.80 50.0 42.75 60.0 10
SC NA NA NA NA NA NA NA NA 864
SD 8.74 42.1 14.00 39.3 34.30 61.4 53.30 62.1 140
TN 3.78 93.9 14.21 90.5 74.33 98.0 89.00 98.6 148
TX 8.83 35.3 14.68 34.0 40.78 52.5 62.34 54.4 1,719
UT 7.15 12.1 14.88 13.4 37.33 94.0 64.00 94.0 149
VT 3.21 37.7 10.54 8.2 43.85 32.8 53.85 34.4 61
VA NA NA NA NA NA NA NA NA 527
WA 4.98 67.6 9.87 53.2 42.09 80.3 51.25 81.2 340
WV 4.80 6.1 11.17 0.4 42.01 35.7 55.77 38.6 277
WI 4.34 14.0 11.52 8.7 37.37 50.9 51.17 52.6 485
WY 6.81 15.3 19.06 12.9 NA NA NA NA 124
USA 5.87 43.6 11.75 42.3 38.00 72.8 54.08 73.7 21,010
PR 7.57 74.6 11.63 74.1 NA NA NA NA 201
*Includes crashes for which both times were known.
NA = not available or not applicable.
Table 119
Rural Fatal Crashes, by State and Average Emergency Medical Services (EMS)Response Times (Continued)
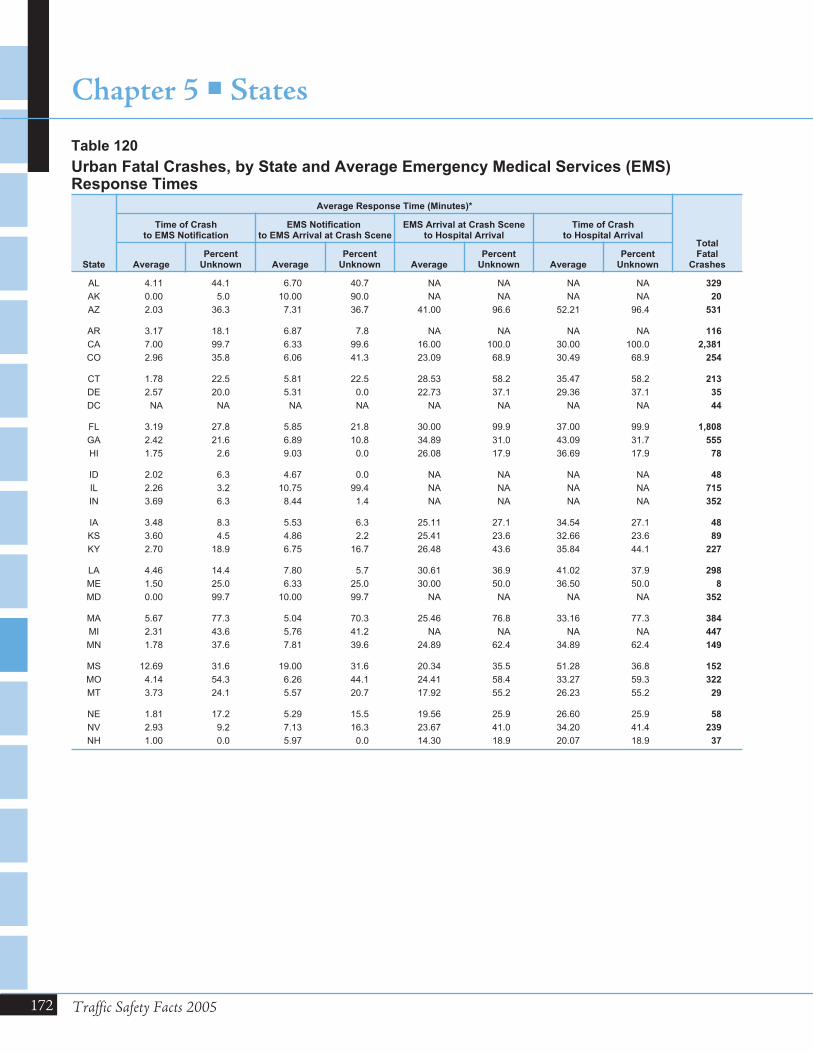
172 Traffic Safety Facts 2005
Chapter 5 � States
State
Average Response Time (Minutes)*
TotalFatal
Crashes
Time of Crashto EMS Notification
EMS Notificationto EMS Arrival at Crash Scene
EMS Arrival at Crash Sceneto Hospital Arrival
Time of Crashto Hospital Arrival
AveragePercent
Unknown AveragePercent
Unknown AveragePercent
Unknown AveragePercent
Unknown
AL 4.11 44.1 6.70 40.7 NA NA NA NA 329
AK 0.00 5.0 10.00 90.0 NA NA NA NA 20
AZ 2.03 36.3 7.31 36.7 41.00 96.6 52.21 96.4 531
AR 3.17 18.1 6.87 7.8 NA NA NA NA 116
CA 7.00 99.7 6.33 99.6 16.00 100.0 30.00 100.0 2,381
CO 2.96 35.8 6.06 41.3 23.09 68.9 30.49 68.9 254
CT 1.78 22.5 5.81 22.5 28.53 58.2 35.47 58.2 213
DE 2.57 20.0 5.31 0.0 22.73 37.1 29.36 37.1 35
DC NA NA NA NA NA NA NA NA 44
FL 3.19 27.8 5.85 21.8 30.00 99.9 37.00 99.9 1,808
GA 2.42 21.6 6.89 10.8 34.89 31.0 43.09 31.7 555
HI 1.75 2.6 9.03 0.0 26.08 17.9 36.69 17.9 78
ID 2.02 6.3 4.67 0.0 NA NA NA NA 48
IL 2.26 3.2 10.75 99.4 NA NA NA NA 715
IN 3.69 6.3 8.44 1.4 NA NA NA NA 352
IA 3.48 8.3 5.53 6.3 25.11 27.1 34.54 27.1 48
KS 3.60 4.5 4.86 2.2 25.41 23.6 32.66 23.6 89
KY 2.70 18.9 6.75 16.7 26.48 43.6 35.84 44.1 227
LA 4.46 14.4 7.80 5.7 30.61 36.9 41.02 37.9 298
ME 1.50 25.0 6.33 25.0 30.00 50.0 36.50 50.0 8
MD 0.00 99.7 10.00 99.7 NA NA NA NA 352
MA 5.67 77.3 5.04 70.3 25.46 76.8 33.16 77.3 384
MI 2.31 43.6 5.76 41.2 NA NA NA NA 447
MN 1.78 37.6 7.81 39.6 24.89 62.4 34.89 62.4 149
MS 12.69 31.6 19.00 31.6 20.34 35.5 51.28 36.8 152
MO 4.14 54.3 6.26 44.1 24.41 58.4 33.27 59.3 322
MT 3.73 24.1 5.57 20.7 17.92 55.2 26.23 55.2 29
NE 1.81 17.2 5.29 15.5 19.56 25.9 26.60 25.9 58
NV 2.93 9.2 7.13 16.3 23.67 41.0 34.20 41.4 239
NH 1.00 0.0 5.97 0.0 14.30 18.9 20.07 18.9 37
Table 120
Urban Fatal Crashes, by State and Average Emergency Medical Services (EMS)Response Times

2005 Motor Vehicle Crash Data from FARS and GES
Chapter 5 � States
173
State
Average Response Time (Minutes)*
TotalFatal
Crashes
Time of Crashto EMS Notification
EMS Notificationto EMS Arrival at Crash Scene
EMS Arrival at Crash Sceneto Hospital Arrival
Time of Crashto Hospital Arrival
AveragePercent
Unknown AveragePercent
Unknown AveragePercent
Unknown AveragePercent
Unknown
NJ 1.00 99.8 7.00 99.8 NA NA NA NA 581
NM NA NA NA NA NA NA NA NA 124
NY 2.31 57.8 6.87 56.5 29.29 73.6 37.22 74.5 812
NC 3.36 42.0 6.77 42.7 29.50 59.1 39.89 59.3 457
ND 7.92 0.0 4.67 0.0 28.20 16.7 34.30 16.7 12
OH 3.87 29.2 5.30 25.7 25.68 42.0 34.50 42.4 483
OK 4.28 71.0 5.62 63.0 22.75 69.5 30.50 70.0 200
OR 1.26 5.5 5.46 2.3 28.23 42.2 34.64 42.2 128
PA 2.74 77.9 6.73 73.0 29.33 82.2 38.09 82.2 730
RI 3.83 42.9 3.99 0.0 26.77 18.6 31.65 18.6 70
SC NA NA NA NA NA NA NA NA 116
SD 2.00 11.1 5.06 5.6 24.00 16.7 30.80 16.7 18
TN 33.50 98.3 6.33 97.5 27.00 99.2 42.00 99.2 120
TX 4.89 35.0 7.75 33.3 27.83 52.1 39.37 52.2 1,379
UT 3.93 18.6 7.57 20.9 22.11 89.5 33.11 89.5 86
VT 5.33 14.3 5.00 14.3 21.20 28.6 30.40 28.6 7
VA NA NA NA NA NA NA NA NA 347
WA 1.71 57.2 5.52 48.7 31.09 72.0 36.71 72.0 236
WV 4.55 4.3 6.70 0.0 32.49 30.0 43.31 30.0 70
WI 2.49 8.7 6.79 4.8 30.95 33.2 39.61 34.1 229
WY 3.09 4.3 7.48 0.0 NA NA NA NA 23
USA 3.29 50.5 6.76 51.9 27.86 77.9 37.59 78.1 16,546
PR 7.19 71.1 10.01 70.3 NA NA NA NA 232
*Includes crashes for which both times were known.
NA = not available or not applicable.
Table 120
Urban Fatal Crashes, by State and Average Emergency Medical Services (EMS)Response Times (Continued)
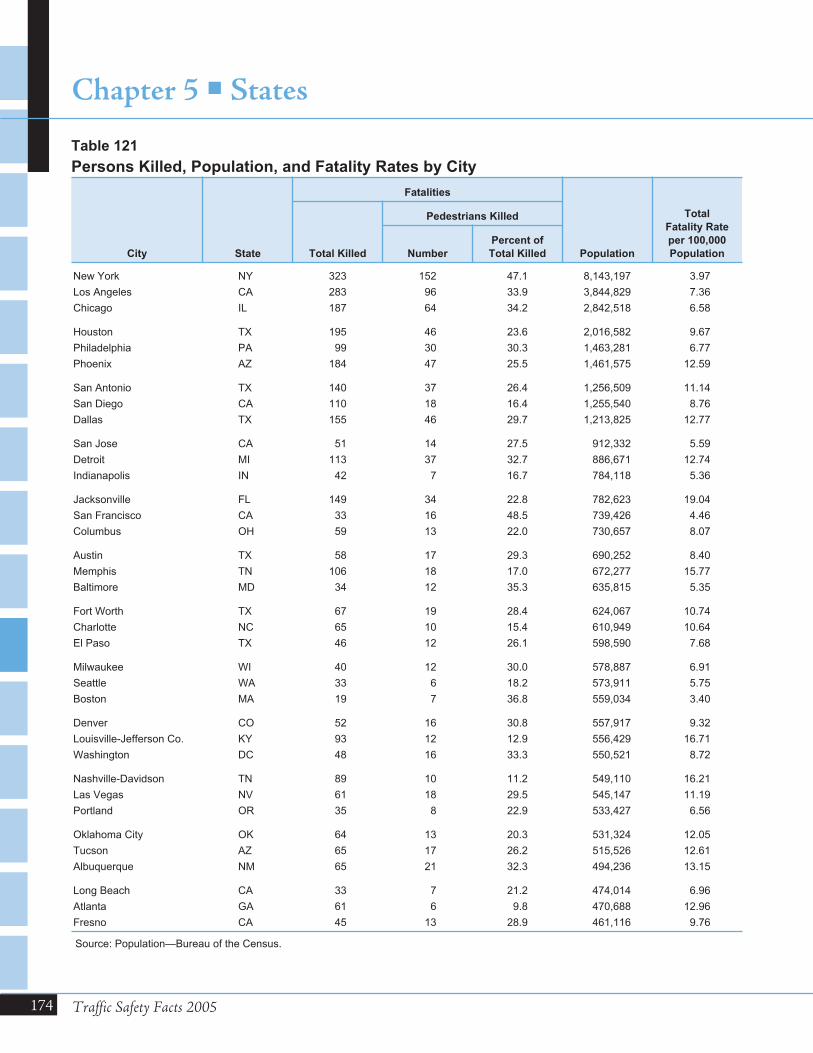
174 Traffic Safety Facts 2005
Chapter 5 � States
City State
Fatalities
Population
Total
Fatality Rate
per 100,000
PopulationTotal Killed
Pedestrians Killed
Number
Percent of
Total Killed
New York NY 323 152 47.1 8,143,197 3.97
Los Angeles CA 283 96 33.9 3,844,829 7.36
Chicago IL 187 64 34.2 2,842,518 6.58
Houston TX 195 46 23.6 2,016,582 9.67
Philadelphia PA 99 30 30.3 1,463,281 6.77
Phoenix AZ 184 47 25.5 1,461,575 12.59
San Antonio TX 140 37 26.4 1,256,509 11.14
San Diego CA 110 18 16.4 1,255,540 8.76
Dallas TX 155 46 29.7 1,213,825 12.77
San Jose CA 51 14 27.5 912,332 5.59
Detroit MI 113 37 32.7 886,671 12.74
Indianapolis IN 42 7 16.7 784,118 5.36
Jacksonville FL 149 34 22.8 782,623 19.04
San Francisco CA 33 16 48.5 739,426 4.46
Columbus OH 59 13 22.0 730,657 8.07
Austin TX 58 17 29.3 690,252 8.40
Memphis TN 106 18 17.0 672,277 15.77
Baltimore MD 34 12 35.3 635,815 5.35
Fort Worth TX 67 19 28.4 624,067 10.74
Charlotte NC 65 10 15.4 610,949 10.64
El Paso TX 46 12 26.1 598,590 7.68
Milwaukee WI 40 12 30.0 578,887 6.91
Seattle WA 33 6 18.2 573,911 5.75
Boston MA 19 7 36.8 559,034 3.40
Denver CO 52 16 30.8 557,917 9.32
Louisville-Jefferson Co. KY 93 12 12.9 556,429 16.71
Washington DC 48 16 33.3 550,521 8.72
Nashville-Davidson TN 89 10 11.2 549,110 16.21
Las Vegas NV 61 18 29.5 545,147 11.19
Portland OR 35 8 22.9 533,427 6.56
Oklahoma City OK 64 13 20.3 531,324 12.05
Tucson AZ 65 17 26.2 515,526 12.61
Albuquerque NM 65 21 32.3 494,236 13.15
Long Beach CA 33 7 21.2 474,014 6.96
Atlanta GA 61 6 9.8 470,688 12.96
Fresno CA 45 13 28.9 461,116 9.76
Source: Population—Bureau of the Census.
Table 121
Persons Killed, Population, and Fatality Rates by City
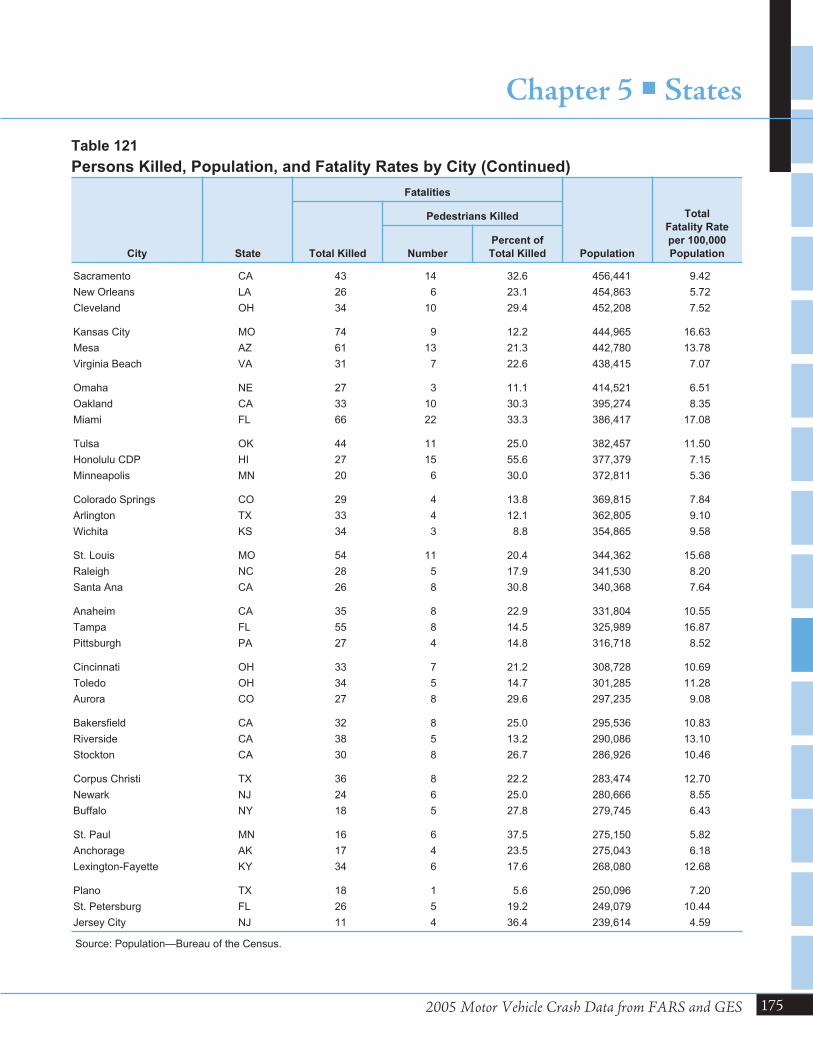
2005 Motor Vehicle Crash Data from FARS and GES
Chapter 5 � States
175
City State
Fatalities
Population
Total
Fatality Rate
per 100,000
PopulationTotal Killed
Pedestrians Killed
Number
Percent of
Total Killed
Sacramento CA 43 14 32.6 456,441 9.42
New Orleans LA 26 6 23.1 454,863 5.72
Cleveland OH 34 10 29.4 452,208 7.52
Kansas City MO 74 9 12.2 444,965 16.63
Mesa AZ 61 13 21.3 442,780 13.78
Virginia Beach VA 31 7 22.6 438,415 7.07
Omaha NE 27 3 11.1 414,521 6.51
Oakland CA 33 10 30.3 395,274 8.35
Miami FL 66 22 33.3 386,417 17.08
Tulsa OK 44 11 25.0 382,457 11.50
Honolulu CDP HI 27 15 55.6 377,379 7.15
Minneapolis MN 20 6 30.0 372,811 5.36
Colorado Springs CO 29 4 13.8 369,815 7.84
Arlington TX 33 4 12.1 362,805 9.10
Wichita KS 34 3 8.8 354,865 9.58
St. Louis MO 54 11 20.4 344,362 15.68
Raleigh NC 28 5 17.9 341,530 8.20
Santa Ana CA 26 8 30.8 340,368 7.64
Anaheim CA 35 8 22.9 331,804 10.55
Tampa FL 55 8 14.5 325,989 16.87
Pittsburgh PA 27 4 14.8 316,718 8.52
Cincinnati OH 33 7 21.2 308,728 10.69
Toledo OH 34 5 14.7 301,285 11.28
Aurora CO 27 8 29.6 297,235 9.08
Bakersfield CA 32 8 25.0 295,536 10.83
Riverside CA 38 5 13.2 290,086 13.10
Stockton CA 30 8 26.7 286,926 10.46
Corpus Christi TX 36 8 22.2 283,474 12.70
Newark NJ 24 6 25.0 280,666 8.55
Buffalo NY 18 5 27.8 279,745 6.43
St. Paul MN 16 6 37.5 275,150 5.82
Anchorage AK 17 4 23.5 275,043 6.18
Lexington-Fayette KY 34 6 17.6 268,080 12.68
Plano TX 18 1 5.6 250,096 7.20
St. Petersburg FL 26 5 19.2 249,079 10.44
Jersey City NJ 11 4 36.4 239,614 4.59
Source: Population—Bureau of the Census.
Table 121
Persons Killed, Population, and Fatality Rates by City (Continued)
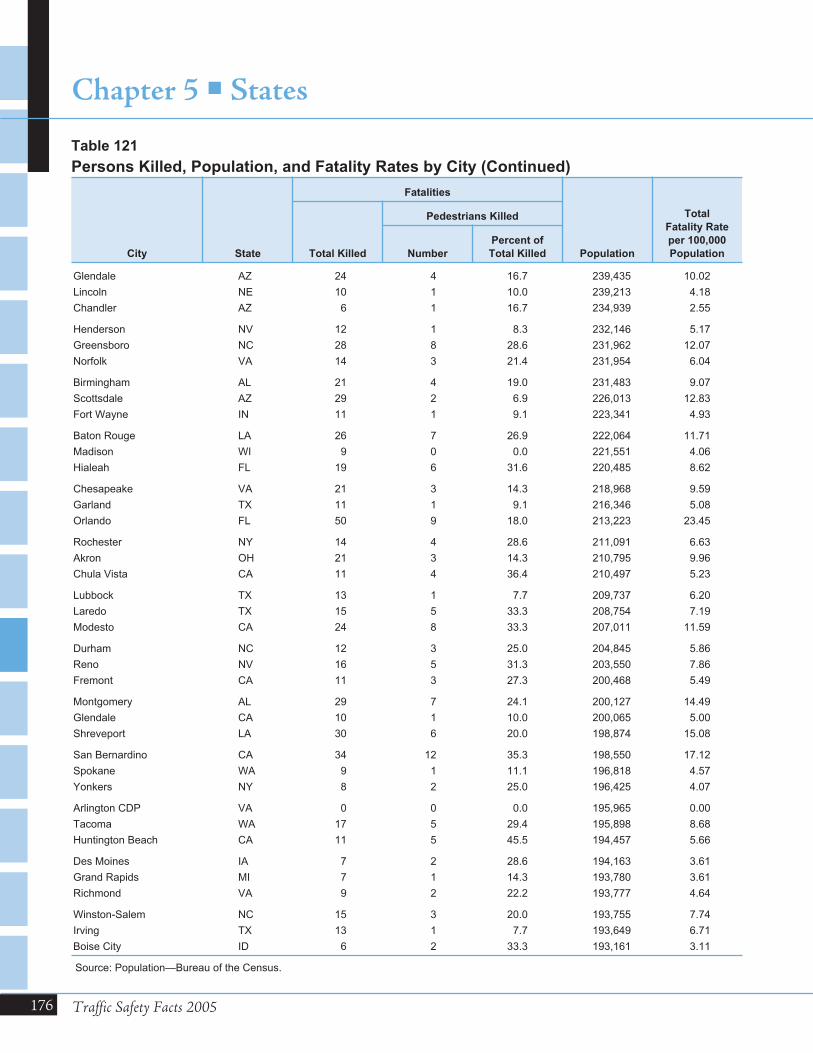
176 Traffic Safety Facts 2005
Chapter 5 � States
City State
Fatalities
Population
Total
Fatality Rate
per 100,000
PopulationTotal Killed
Pedestrians Killed
Number
Percent of
Total Killed
Glendale AZ 24 4 16.7 239,435 10.02
Lincoln NE 10 1 10.0 239,213 4.18
Chandler AZ 6 1 16.7 234,939 2.55
Henderson NV 12 1 8.3 232,146 5.17
Greensboro NC 28 8 28.6 231,962 12.07
Norfolk VA 14 3 21.4 231,954 6.04
Birmingham AL 21 4 19.0 231,483 9.07
Scottsdale AZ 29 2 6.9 226,013 12.83
Fort Wayne IN 11 1 9.1 223,341 4.93
Baton Rouge LA 26 7 26.9 222,064 11.71
Madison WI 9 0 0.0 221,551 4.06
Hialeah FL 19 6 31.6 220,485 8.62
Chesapeake VA 21 3 14.3 218,968 9.59
Garland TX 11 1 9.1 216,346 5.08
Orlando FL 50 9 18.0 213,223 23.45
Rochester NY 14 4 28.6 211,091 6.63
Akron OH 21 3 14.3 210,795 9.96
Chula Vista CA 11 4 36.4 210,497 5.23
Lubbock TX 13 1 7.7 209,737 6.20
Laredo TX 15 5 33.3 208,754 7.19
Modesto CA 24 8 33.3 207,011 11.59
Durham NC 12 3 25.0 204,845 5.86
Reno NV 16 5 31.3 203,550 7.86
Fremont CA 11 3 27.3 200,468 5.49
Montgomery AL 29 7 24.1 200,127 14.49
Glendale CA 10 1 10.0 200,065 5.00
Shreveport LA 30 6 20.0 198,874 15.08
San Bernardino CA 34 12 35.3 198,550 17.12
Spokane WA 9 1 11.1 196,818 4.57
Yonkers NY 8 2 25.0 196,425 4.07
Arlington CDP VA 0 0 0.0 195,965 0.00
Tacoma WA 17 5 29.4 195,898 8.68
Huntington Beach CA 11 5 45.5 194,457 5.66
Des Moines IA 7 2 28.6 194,163 3.61
Grand Rapids MI 7 1 14.3 193,780 3.61
Richmond VA 9 2 22.2 193,777 4.64
Winston-Salem NC 15 3 20.0 193,755 7.74
Irving TX 13 1 7.7 193,649 6.71
Boise City ID 6 2 33.3 193,161 3.11
Source: Population—Bureau of the Census.
Table 121
Persons Killed, Population, and Fatality Rates by City (Continued)

2005 Motor Vehicle Crash Data from FARS and GES
Chapter 5 � States
177
City State
Fatalities
Population
Total
Fatality Rate
per 100,000
PopulationTotal Killed
Pedestrians Killed
Number
Percent of
Total Killed
Mobile AL 23 3 13.0 191,544 12.01
Augusta-Richmond Co. GA 22 2 9.1 190,782 11.53
Irvine CA 11 0 0.0 186,852 5.89
Columbus GA 25 5 20.0 185,271 13.49
Little Rock AR 22 3 13.6 184,564 11.92
Oxnard CA 11 0 0.0 183,628 5.99
Amarillo TX 28 7 25.0 183,021 15.30
Knoxville TN 38 0 0.0 180,130 21.10
Newport News VA 14 4 28.6 179,899 7.78
Moreno Valley CA 9 1 11.1 178,367 5.05
Salt Lake City UT 29 6 20.7 178,097 16.28
Jackson MS 33 13 39.4 177,977 18.54
Providence RI 14 5 35.7 176,862 7.92
North Las Vegas NV 16 2 12.5 176,635 9.06
Worcester MA 9 2 22.2 175,898 5.12
Gilbert town AZ 11 1 9.1 173,989 6.32
Ontario CA 28 3 10.7 172,679 16.22
Rancho Cucamonga CA 11 1 9.1 169,353 6.50
Santa Clarita CA 4 1 25.0 168,253 2.38
Aurora IL 7 1 14.3 168,181 4.16
Brownsville TX 9 1 11.1 167,493 5.37
Fort Lauderdale FL 31 9 29.0 167,380 18.52
Huntsville AL 30 3 10.0 166,313 18.04
Oceanside CA 15 7 46.7 166,108 9.03
Garden Grove CA 7 3 42.9 166,075 4.21
Overland Park KS 5 0 0.0 164,811 3.03
Fontana CA 19 2 10.5 163,860 11.60
Tempe AZ 14 5 35.7 161,143 8.69
Dayton OH 23 4 17.4 158,873 14.48
Tallahassee FL 27 4 14.8 158,500 17.03
Vancouver WA 5 0 0.0 157,493 3.17
Chattanooga TN 28 5 17.9 154,762 18.09
Pomona CA 20 4 20.0 153,787 13.01
Santa Rosa CA 13 3 23.1 153,158 8.49
Rockford IL 17 3 17.6 152,916 11.12
Springfield MA 12 6 50.0 151,732 7.91
Pembroke Pines FL 13 0 0.0 150,380 8.64
Springfield MO 23 2 8.7 150,298 15.30
Source: Population—Bureau of the Census.
Table 121
Persons Killed, Population, and Fatality Rates by City (Continued)
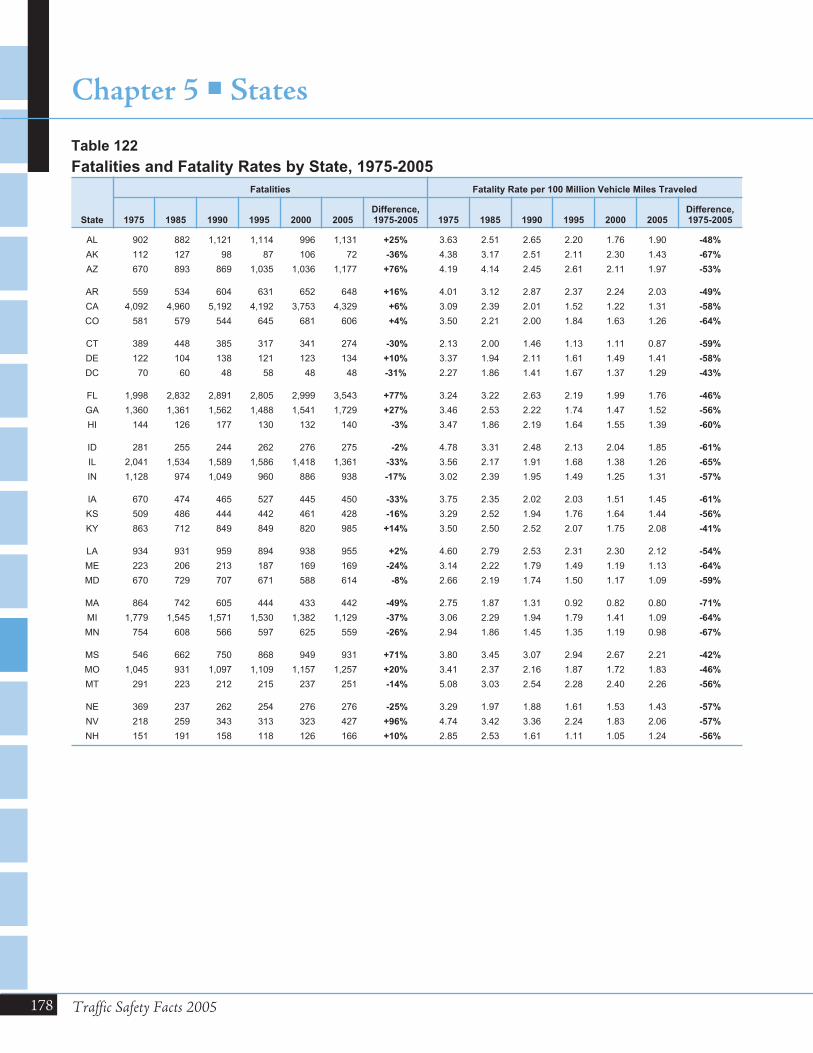
178 Traffic Safety Facts 2005
Chapter 5 � States
State
Fatalities Fatality Rate per 100 Million Vehicle Miles Traveled
1975 1985 1990 1995 2000 2005Difference,1975-2005 1975 1985 1990 1995 2000 2005
Difference,1975-2005
AL 902 882 1,121 1,114 996 1,131 +25% 3.63 2.51 2.65 2.20 1.76 1.90 -48%
AK 112 127 98 87 106 72 -36% 4.38 3.17 2.51 2.11 2.30 1.43 -67%
AZ 670 893 869 1,035 1,036 1,177 +76% 4.19 4.14 2.45 2.61 2.11 1.97 -53%
AR 559 534 604 631 652 648 +16% 4.01 3.12 2.87 2.37 2.24 2.03 -49%
CA 4,092 4,960 5,192 4,192 3,753 4,329 +6% 3.09 2.39 2.01 1.52 1.22 1.31 -58%
CO 581 579 544 645 681 606 +4% 3.50 2.21 2.00 1.84 1.63 1.26 -64%
CT 389 448 385 317 341 274 -30% 2.13 2.00 1.46 1.13 1.11 0.87 -59%
DE 122 104 138 121 123 134 +10% 3.37 1.94 2.11 1.61 1.49 1.41 -58%
DC 70 60 48 58 48 48 -31% 2.27 1.86 1.41 1.67 1.37 1.29 -43%
FL 1,998 2,832 2,891 2,805 2,999 3,543 +77% 3.24 3.22 2.63 2.19 1.99 1.76 -46%
GA 1,360 1,361 1,562 1,488 1,541 1,729 +27% 3.46 2.53 2.22 1.74 1.47 1.52 -56%
HI 144 126 177 130 132 140 -3% 3.47 1.86 2.19 1.64 1.55 1.39 -60%
ID 281 255 244 262 276 275 -2% 4.78 3.31 2.48 2.13 2.04 1.85 -61%
IL 2,041 1,534 1,589 1,586 1,418 1,361 -33% 3.56 2.17 1.91 1.68 1.38 1.26 -65%
IN 1,128 974 1,049 960 886 938 -17% 3.02 2.39 1.95 1.49 1.25 1.31 -57%
IA 670 474 465 527 445 450 -33% 3.75 2.35 2.02 2.03 1.51 1.45 -61%
KS 509 486 444 442 461 428 -16% 3.29 2.52 1.94 1.76 1.64 1.44 -56%
KY 863 712 849 849 820 985 +14% 3.50 2.50 2.52 2.07 1.75 2.08 -41%
LA 934 931 959 894 938 955 +2% 4.60 2.79 2.53 2.31 2.30 2.12 -54%
ME 223 206 213 187 169 169 -24% 3.14 2.22 1.79 1.49 1.19 1.13 -64%
MD 670 729 707 671 588 614 -8% 2.66 2.19 1.74 1.50 1.17 1.09 -59%
MA 864 742 605 444 433 442 -49% 2.75 1.87 1.31 0.92 0.82 0.80 -71%
MI 1,779 1,545 1,571 1,530 1,382 1,129 -37% 3.06 2.29 1.94 1.79 1.41 1.09 -64%
MN 754 608 566 597 625 559 -26% 2.94 1.86 1.45 1.35 1.19 0.98 -67%
MS 546 662 750 868 949 931 +71% 3.80 3.45 3.07 2.94 2.67 2.21 -42%
MO 1,045 931 1,097 1,109 1,157 1,257 +20% 3.41 2.37 2.16 1.87 1.72 1.83 -46%
MT 291 223 212 215 237 251 -14% 5.08 3.03 2.54 2.28 2.40 2.26 -56%
NE 369 237 262 254 276 276 -25% 3.29 1.97 1.88 1.61 1.53 1.43 -57%
NV 218 259 343 313 323 427 +96% 4.74 3.42 3.36 2.24 1.83 2.06 -57%
NH 151 191 158 118 126 166 +10% 2.85 2.53 1.61 1.11 1.05 1.24 -56%
Table 122
Fatalities and Fatality Rates by State, 1975-2005
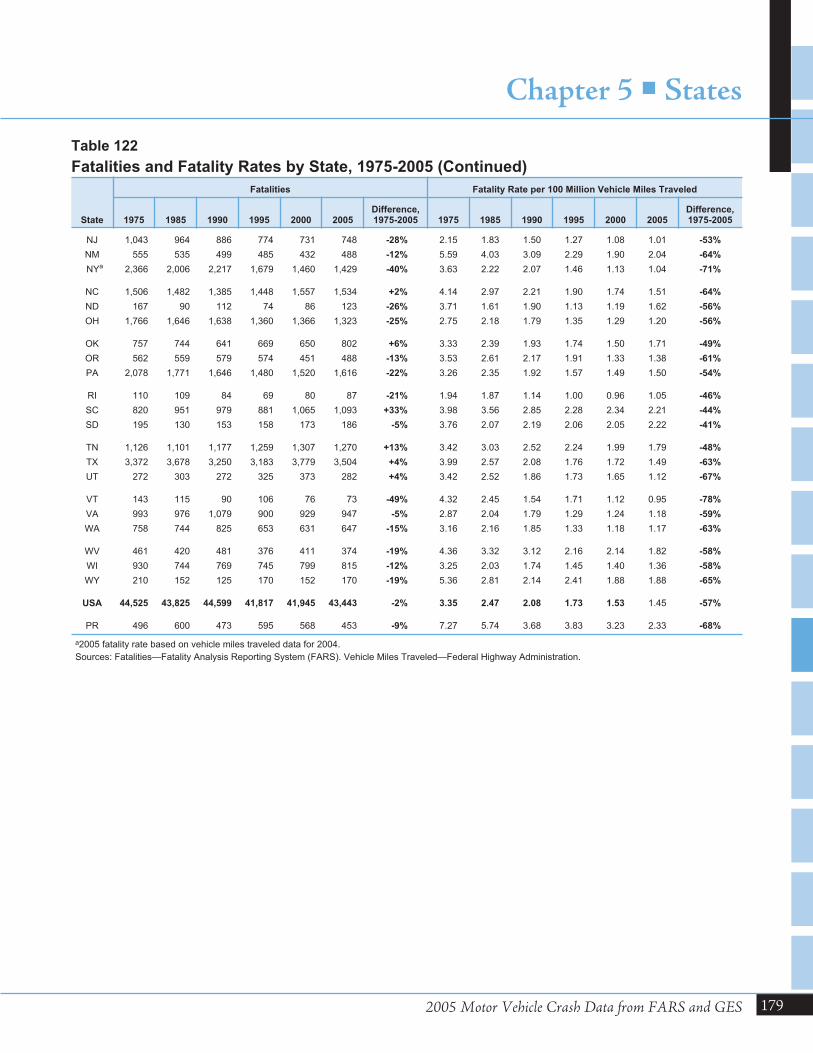
2005 Motor Vehicle Crash Data from FARS and GES
Chapter 5 � States
179
State
Fatalities Fatality Rate per 100 Million Vehicle Miles Traveled
1975 1985 1990 1995 2000 2005Difference,1975-2005 1975 1985 1990 1995 2000 2005
Difference,1975-2005
NJ 1,043 964 886 774 731 748 -28% 2.15 1.83 1.50 1.27 1.08 1.01 -53%
NM 555 535 499 485 432 488 -12% 5.59 4.03 3.09 2.29 1.90 2.04 -64%
NYa 2,366 2,006 2,217 1,679 1,460 1,429 -40% 3.63 2.22 2.07 1.46 1.13 1.04 -71%
NC 1,506 1,482 1,385 1,448 1,557 1,534 +2% 4.14 2.97 2.21 1.90 1.74 1.51 -64%
ND 167 90 112 74 86 123 -26% 3.71 1.61 1.90 1.13 1.19 1.62 -56%
OH 1,766 1,646 1,638 1,360 1,366 1,323 -25% 2.75 2.18 1.79 1.35 1.29 1.20 -56%
OK 757 744 641 669 650 802 +6% 3.33 2.39 1.93 1.74 1.50 1.71 -49%
OR 562 559 579 574 451 488 -13% 3.53 2.61 2.17 1.91 1.33 1.38 -61%
PA 2,078 1,771 1,646 1,480 1,520 1,616 -22% 3.26 2.35 1.92 1.57 1.49 1.50 -54%
RI 110 109 84 69 80 87 -21% 1.94 1.87 1.14 1.00 0.96 1.05 -46%
SC 820 951 979 881 1,065 1,093 +33% 3.98 3.56 2.85 2.28 2.34 2.21 -44%
SD 195 130 153 158 173 186 -5% 3.76 2.07 2.19 2.06 2.05 2.22 -41%
TN 1,126 1,101 1,177 1,259 1,307 1,270 +13% 3.42 3.03 2.52 2.24 1.99 1.79 -48%
TX 3,372 3,678 3,250 3,183 3,779 3,504 +4% 3.99 2.57 2.08 1.76 1.72 1.49 -63%
UT 272 303 272 325 373 282 +4% 3.42 2.52 1.86 1.73 1.65 1.12 -67%
VT 143 115 90 106 76 73 -49% 4.32 2.45 1.54 1.71 1.12 0.95 -78%
VA 993 976 1,079 900 929 947 -5% 2.87 2.04 1.79 1.29 1.24 1.18 -59%
WA 758 744 825 653 631 647 -15% 3.16 2.16 1.85 1.33 1.18 1.17 -63%
WV 461 420 481 376 411 374 -19% 4.36 3.32 3.12 2.16 2.14 1.82 -58%
WI 930 744 769 745 799 815 -12% 3.25 2.03 1.74 1.45 1.40 1.36 -58%
WY 210 152 125 170 152 170 -19% 5.36 2.81 2.14 2.41 1.88 1.88 -65%
USA 44,525 43,825 44,599 41,817 41,945 43,443 -2% 3.35 2.47 2.08 1.73 1.53 1.45 -57%
PR 496 600 473 595 568 453 -9% 7.27 5.74 3.68 3.83 3.23 2.33 -68%
a2005 fatality rate based on vehicle miles traveled data for 2004.
Sources: Fatalities—Fatality Analysis Reporting System (FARS). Vehicle Miles Traveled—Federal Highway Administration.
Table 122
Fatalities and Fatality Rates by State, 1975-2005 (Continued)
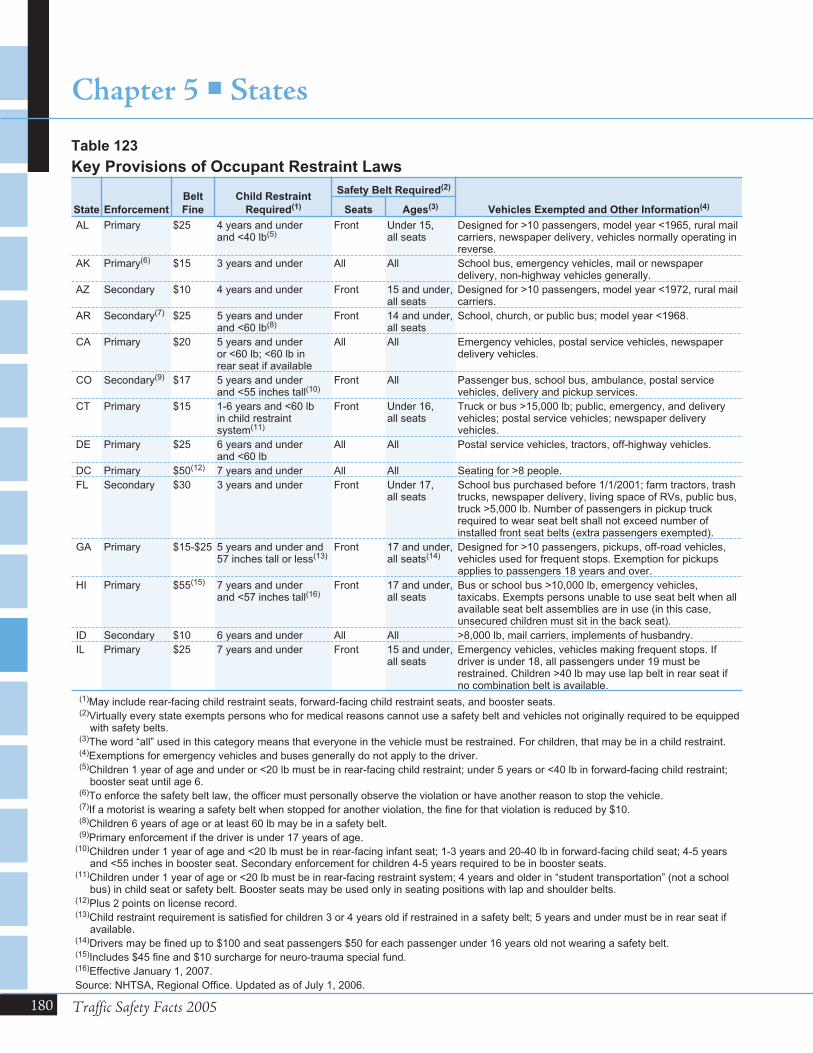
180 Traffic Safety Facts 2005
Chapter 5 � States
State Enforcement
Belt
Fine
Child Restraint
Required(1)
Safety Belt Required(2)
Vehicles Exempted and Other Information(4)Seats Ages(3)
AL Primary $25 4 years and underand <40 lb(5)
Front Under 15,all seats
Designed for >10 passengers, model year <1965, rural mailcarriers, newspaper delivery, vehicles normally operating inreverse.
AK Primary(6) $15 3 years and under All All School bus, emergency vehicles, mail or newspaperdelivery, non-highway vehicles generally.
AZ Secondary $10 4 years and under Front 15 and under,all seats
Designed for >10 passengers, model year <1972, rural mailcarriers.
AR Secondary(7) $25 5 years and underand <60 lb(8)
Front 14 and under,all seats
School, church, or public bus; model year <1968.
CA Primary $20 5 years and underor <60 lb; <60 lb inrear seat if available
All All Emergency vehicles, postal service vehicles, newspaperdelivery vehicles.
CO Secondary(9) $17 5 years and underand <55 inches tall(10)
Front All Passenger bus, school bus, ambulance, postal servicevehicles, delivery and pickup services.
CT Primary $15 1-6 years and <60 lbin child restraintsystem(11)
Front Under 16,all seats
Truck or bus >15,000 lb; public, emergency, and deliveryvehicles; postal service vehicles; newspaper deliveryvehicles.
DE Primary $25 6 years and underand <60 lb
All All Postal service vehicles, tractors, off-highway vehicles.
DC Primary $50(12) 7 years and under All All Seating for >8 people.
FL Secondary $30 3 years and under Front Under 17,all seats
School bus purchased before 1/1/2001; farm tractors, trashtrucks, newspaper delivery, living space of RVs, public bus,truck >5,000 lb. Number of passengers in pickup truckrequired to wear seat belt shall not exceed number ofinstalled front seat belts (extra passengers exempted).
GA Primary $15-$25 5 years and under and57 inches tall or less(13)
Front 17 and under,all seats(14)
Designed for >10 passengers, pickups, off-road vehicles,vehicles used for frequent stops. Exemption for pickupsapplies to passengers 18 years and over.
HI Primary $55(15) 7 years and underand <57 inches tall(16)
Front 17 and under,all seats
Bus or school bus >10,000 lb, emergency vehicles,taxicabs. Exempts persons unable to use seat belt when allavailable seat belt assemblies are in use (in this case,unsecured children must sit in the back seat).
ID Secondary $10 6 years and under All All >8,000 lb, mail carriers, implements of husbandry.
IL Primary $25 7 years and under Front 15 and under,all seats
Emergency vehicles, vehicles making frequent stops. Ifdriver is under 18, all passengers under 19 must berestrained. Children >40 lb may use lap belt in rear seat ifno combination belt is available.
(1)May include rear-facing child restraint seats, forward-facing child restraint seats, and booster seats.(2)Virtually every state exempts persons who for medical reasons cannot use a safety belt and vehicles not originally required to be equipped
with safety belts.(3)The word “all” used in this category means that everyone in the vehicle must be restrained. For children, that may be in a child restraint.(4)Exemptions for emergency vehicles and buses generally do not apply to the driver.(5)Children 1 year of age and under or <20 lb must be in rear-facing child restraint; under 5 years or <40 lb in forward-facing child restraint;
booster seat until age 6.(6)To enforce the safety belt law, the officer must personally observe the violation or have another reason to stop the vehicle.(7)If a motorist is wearing a safety belt when stopped for another violation, the fine for that violation is reduced by $10.(8)Children 6 years of age or at least 60 lb may be in a safety belt.(9)Primary enforcement if the driver is under 17 years of age.
(10)Children under 1 year of age and <20 lb must be in rear-facing infant seat; 1-3 years and 20-40 lb in forward-facing child seat; 4-5 yearsand <55 inches in booster seat. Secondary enforcement for children 4-5 years required to be in booster seats.
(11)Children under 1 year of age or <20 lb must be in rear-facing restraint system; 4 years and older in “student transportation” (not a schoolbus) in child seat or safety belt. Booster seats may be used only in seating positions with lap and shoulder belts.
(12)Plus 2 points on license record.(13)Child restraint requirement is satisfied for children 3 or 4 years old if restrained in a safety belt; 5 years and under must be in rear seat if
available.(14)Drivers may be fined up to $100 and seat passengers $50 for each passenger under 16 years old not wearing a safety belt.(15)Includes $45 fine and $10 surcharge for neuro-trauma special fund.(16)Effective January 1, 2007.
Source: NHTSA, Regional Office. Updated as of July 1, 2006.
Table 123
Key Provisions of Occupant Restraint Laws
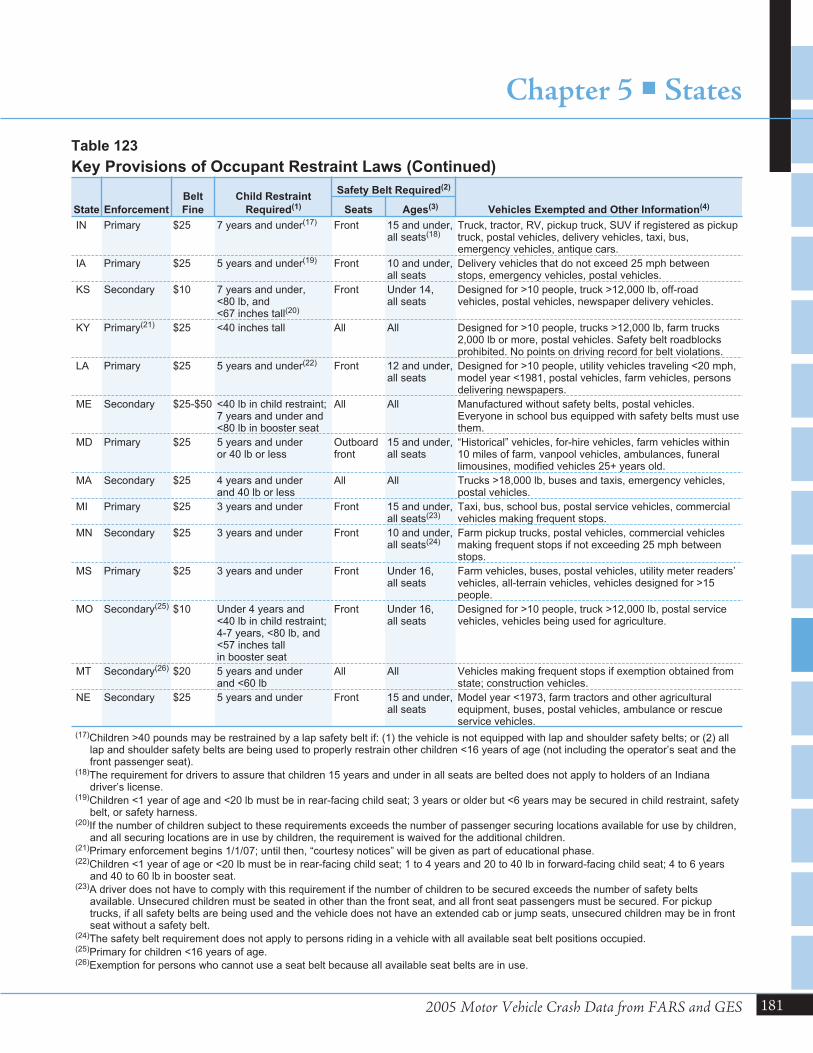
2005 Motor Vehicle Crash Data from FARS and GES
Chapter 5 � States
181
State Enforcement
Belt
Fine
Child Restraint
Required(1)
Safety Belt Required(2)
Vehicles Exempted and Other Information(4)Seats Ages(3)
IN Primary $25 7 years and under(17) Front 15 and under,all seats(18)
Truck, tractor, RV, pickup truck, SUV if registered as pickuptruck, postal vehicles, delivery vehicles, taxi, bus,emergency vehicles, antique cars.
IA Primary $25 5 years and under(19) Front 10 and under,all seats
Delivery vehicles that do not exceed 25 mph betweenstops, emergency vehicles, postal vehicles.
KS Secondary $10 7 years and under,<80 lb, and<67 inches tall(20)
Front Under 14,all seats
Designed for >10 people, truck >12,000 lb, off-roadvehicles, postal vehicles, newspaper delivery vehicles.
KY Primary(21) $25 <40 inches tall All All Designed for >10 people, trucks >12,000 lb, farm trucks2,000 lb or more, postal vehicles. Safety belt roadblocksprohibited. No points on driving record for belt violations.
LA Primary $25 5 years and under(22) Front 12 and under,all seats
Designed for >10 people, utility vehicles traveling <20 mph,model year <1981, postal vehicles, farm vehicles, personsdelivering newspapers.
ME Secondary $25-$50 <40 lb in child restraint;7 years and under and<80 lb in booster seat
All All Manufactured without safety belts, postal vehicles.Everyone in school bus equipped with safety belts must usethem.
MD Primary $25 5 years and underor 40 lb or less
Outboardfront
15 and under,all seats
“Historical” vehicles, for-hire vehicles, farm vehicles within10 miles of farm, vanpool vehicles, ambulances, funerallimousines, modified vehicles 25+ years old.
MA Secondary $25 4 years and underand 40 lb or less
All All Trucks >18,000 lb, buses and taxis, emergency vehicles,postal vehicles.
MI Primary $25 3 years and under Front 15 and under,all seats(23)
Taxi, bus, school bus, postal service vehicles, commercialvehicles making frequent stops.
MN Secondary $25 3 years and under Front 10 and under,all seats(24)
Farm pickup trucks, postal vehicles, commercial vehiclesmaking frequent stops if not exceeding 25 mph betweenstops.
MS Primary $25 3 years and under Front Under 16,all seats
Farm vehicles, buses, postal vehicles, utility meter readers’vehicles, all-terrain vehicles, vehicles designed for >15people.
MO Secondary(25) $10 Under 4 years and<40 lb in child restraint;4-7 years, <80 lb, and<57 inches tallin booster seat
Front Under 16,all seats
Designed for >10 people, truck >12,000 lb, postal servicevehicles, vehicles being used for agriculture.
MT Secondary(26) $20 5 years and underand <60 lb
All All Vehicles making frequent stops if exemption obtained fromstate; construction vehicles.
NE Secondary $25 5 years and under Front 15 and under,all seats
Model year <1973, farm tractors and other agriculturalequipment, buses, postal vehicles, ambulance or rescueservice vehicles.
(17)Children >40 pounds may be restrained by a lap safety belt if: (1) the vehicle is not equipped with lap and shoulder safety belts; or (2) alllap and shoulder safety belts are being used to properly restrain other children <16 years of age (not including the operator’s seat and thefront passenger seat).
(18)The requirement for drivers to assure that children 15 years and under in all seats are belted does not apply to holders of an Indianadriver’s license.
(19)Children <1 year of age and <20 lb must be in rear-facing child seat; 3 years or older but <6 years may be secured in child restraint, safetybelt, or safety harness.
(20)If the number of children subject to these requirements exceeds the number of passenger securing locations available for use by children,and all securing locations are in use by children, the requirement is waived for the additional children.
(21)Primary enforcement begins 1/1/07; until then, “courtesy notices” will be given as part of educational phase.(22)Children <1 year of age or <20 lb must be in rear-facing child seat; 1 to 4 years and 20 to 40 lb in forward-facing child seat; 4 to 6 years
and 40 to 60 lb in booster seat.(23)A driver does not have to comply with this requirement if the number of children to be secured exceeds the number of safety belts
available. Unsecured children must be seated in other than the front seat, and all front seat passengers must be secured. For pickuptrucks, if all safety belts are being used and the vehicle does not have an extended cab or jump seats, unsecured children may be in frontseat without a safety belt.
(24)The safety belt requirement does not apply to persons riding in a vehicle with all available seat belt positions occupied.(25)Primary for children <16 years of age.(26)Exemption for persons who cannot use a seat belt because all available seat belts are in use.
Table 123
Key Provisions of Occupant Restraint Laws (Continued)
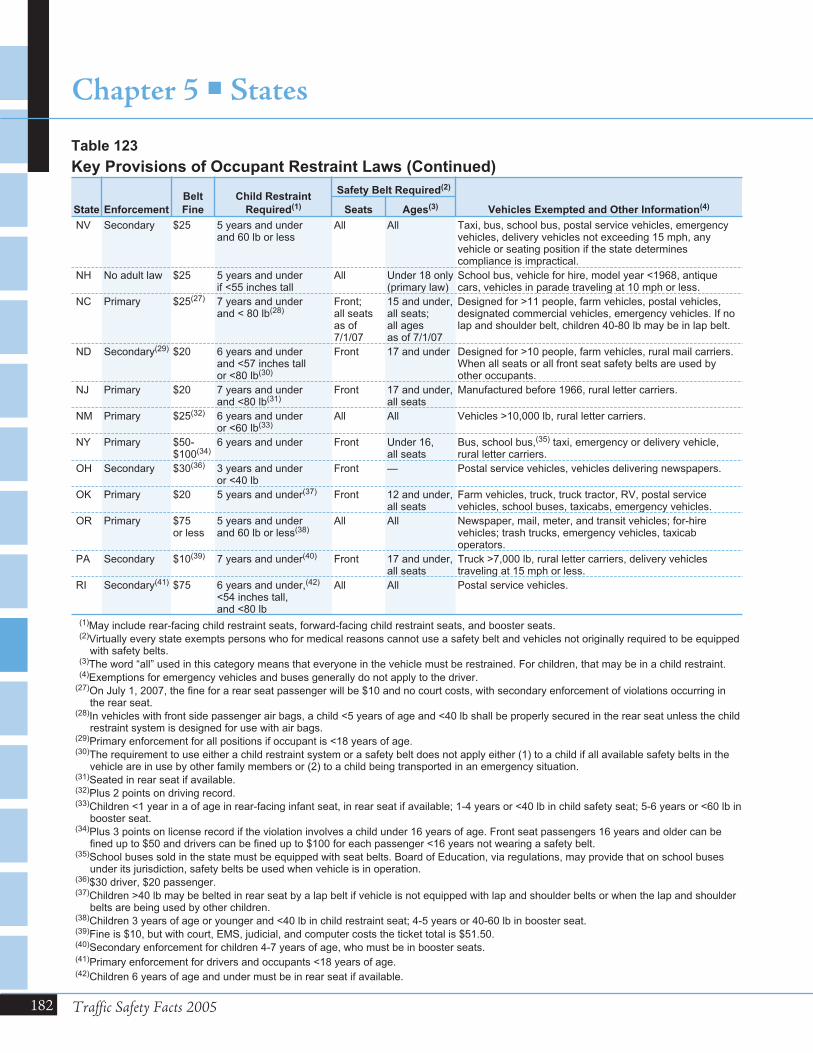
182 Traffic Safety Facts 2005
Chapter 5 � States
State Enforcement
Belt
Fine
Child Restraint
Required(1)
Safety Belt Required(2)
Vehicles Exempted and Other Information(4)Seats Ages(3)
NV Secondary $25 5 years and underand 60 lb or less
All All Taxi, bus, school bus, postal service vehicles, emergencyvehicles, delivery vehicles not exceeding 15 mph, anyvehicle or seating position if the state determinescompliance is impractical.
NH No adult law $25 5 years and underif <55 inches tall
All Under 18 only(primary law)
School bus, vehicle for hire, model year <1968, antiquecars, vehicles in parade traveling at 10 mph or less.
NC Primary $25(27) 7 years and underand < 80 lb(28)
Front;all seatsas of7/1/07
15 and under,all seats;all agesas of 7/1/07
Designed for >11 people, farm vehicles, postal vehicles,designated commercial vehicles, emergency vehicles. If nolap and shoulder belt, children 40-80 lb may be in lap belt.
ND Secondary(29) $20 6 years and underand <57 inches tallor <80 lb(30)
Front 17 and under Designed for >10 people, farm vehicles, rural mail carriers.When all seats or all front seat safety belts are used byother occupants.
NJ Primary $20 7 years and underand <80 lb(31)
Front 17 and under,all seats
Manufactured before 1966, rural letter carriers.
NM Primary $25(32) 6 years and underor <60 lb(33)
All All Vehicles >10,000 lb, rural letter carriers.
NY Primary $50-$100(34)
6 years and under Front Under 16,all seats
Bus, school bus,(35) taxi, emergency or delivery vehicle,rural letter carriers.
OH Secondary $30(36) 3 years and underor <40 lb
Front — Postal service vehicles, vehicles delivering newspapers.
OK Primary $20 5 years and under(37) Front 12 and under,all seats
Farm vehicles, truck, truck tractor, RV, postal servicevehicles, school buses, taxicabs, emergency vehicles.
OR Primary $75or less
5 years and underand 60 lb or less(38)
All All Newspaper, mail, meter, and transit vehicles; for-hirevehicles; trash trucks, emergency vehicles, taxicaboperators.
PA Secondary $10(39) 7 years and under(40) Front 17 and under,all seats
Truck >7,000 lb, rural letter carriers, delivery vehiclestraveling at 15 mph or less.
RI Secondary(41) $75 6 years and under,(42)
<54 inches tall,and <80 lb
All All Postal service vehicles.
(1)May include rear-facing child restraint seats, forward-facing child restraint seats, and booster seats.(2)Virtually every state exempts persons who for medical reasons cannot use a safety belt and vehicles not originally required to be equipped
with safety belts.(3)The word “all” used in this category means that everyone in the vehicle must be restrained. For children, that may be in a child restraint.(4)Exemptions for emergency vehicles and buses generally do not apply to the driver.
(27)On July 1, 2007, the fine for a rear seat passenger will be $10 and no court costs, with secondary enforcement of violations occurring inthe rear seat.
(28)In vehicles with front side passenger air bags, a child <5 years of age and <40 lb shall be properly secured in the rear seat unless the childrestraint system is designed for use with air bags.
(29)Primary enforcement for all positions if occupant is <18 years of age.(30)The requirement to use either a child restraint system or a safety belt does not apply either (1) to a child if all available safety belts in the
vehicle are in use by other family members or (2) to a child being transported in an emergency situation.(31)Seated in rear seat if available.(32)Plus 2 points on driving record.(33)Children <1 year in a of age in rear-facing infant seat, in rear seat if available; 1-4 years or <40 lb in child safety seat; 5-6 years or <60 lb in
booster seat.(34)Plus 3 points on license record if the violation involves a child under 16 years of age. Front seat passengers 16 years and older can be
fined up to $50 and drivers can be fined up to $100 for each passenger <16 years not wearing a safety belt.(35)School buses sold in the state must be equipped with seat belts. Board of Education, via regulations, may provide that on school buses
under its jurisdiction, safety belts be used when vehicle is in operation.(36)$30 driver, $20 passenger.(37)Children >40 lb may be belted in rear seat by a lap belt if vehicle is not equipped with lap and shoulder belts or when the lap and shoulder
belts are being used by other children.(38)Children 3 years of age or younger and <40 lb in child restraint seat; 4-5 years or 40-60 lb in booster seat.(39)Fine is $10, but with court, EMS, judicial, and computer costs the ticket total is $51.50.(40)Secondary enforcement for children 4-7 years of age, who must be in booster seats.(41)Primary enforcement for drivers and occupants <18 years of age.(42)Children 6 years of age and under must be in rear seat if available.
Table 123
Key Provisions of Occupant Restraint Laws (Continued)
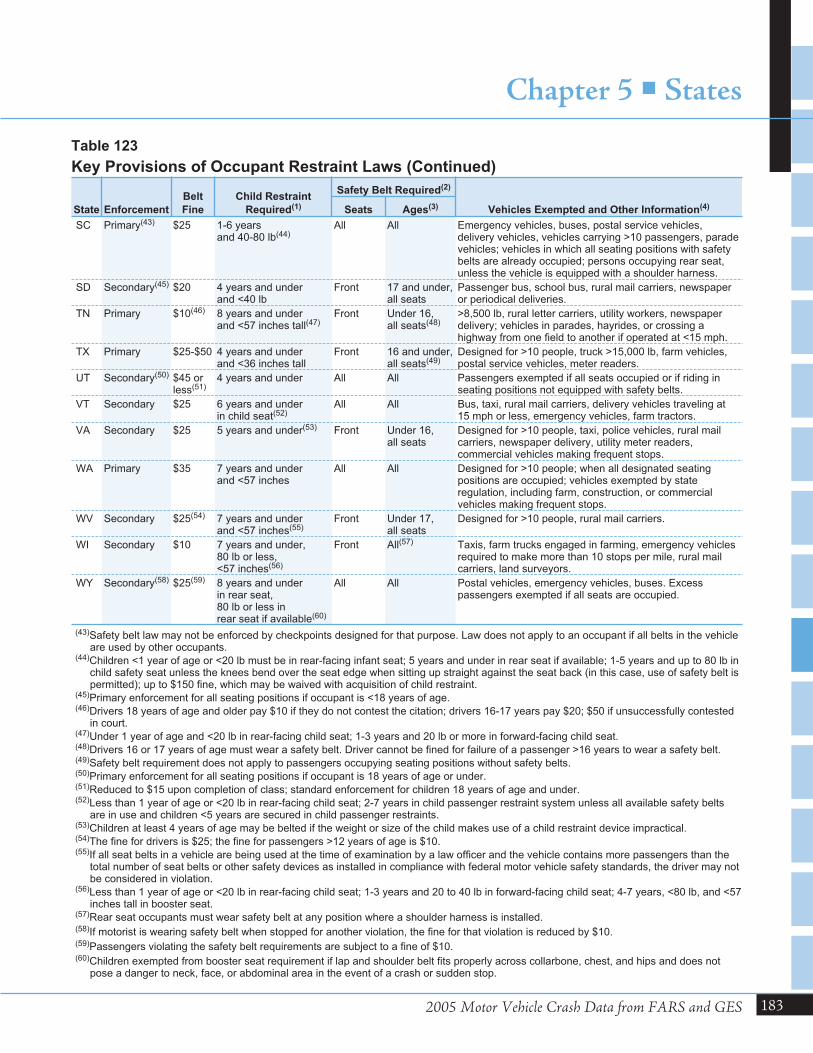
2005 Motor Vehicle Crash Data from FARS and GES
Chapter 5 � States
183
State Enforcement
Belt
Fine
Child Restraint
Required(1)
Safety Belt Required(2)
Vehicles Exempted and Other Information(4)Seats Ages(3)
SC Primary(43) $25 1-6 yearsand 40-80 lb(44)
All All Emergency vehicles, buses, postal service vehicles,delivery vehicles, vehicles carrying >10 passengers, paradevehicles; vehicles in which all seating positions with safetybelts are already occupied; persons occupying rear seat,unless the vehicle is equipped with a shoulder harness.
SD Secondary(45) $20 4 years and underand <40 lb
Front 17 and under,all seats
Passenger bus, school bus, rural mail carriers, newspaperor periodical deliveries.
TN Primary $10(46) 8 years and underand <57 inches tall(47)
Front Under 16,all seats(48)
>8,500 lb, rural letter carriers, utility workers, newspaperdelivery; vehicles in parades, hayrides, or crossing ahighway from one field to another if operated at <15 mph.
TX Primary $25-$50 4 years and underand <36 inches tall
Front 16 and under,all seats(49)
Designed for >10 people, truck >15,000 lb, farm vehicles,postal service vehicles, meter readers.
UT Secondary(50) $45 orless(51)
4 years and under All All Passengers exempted if all seats occupied or if riding inseating positions not equipped with safety belts.
VT Secondary $25 6 years and underin child seat(52)
All All Bus, taxi, rural mail carriers, delivery vehicles traveling at15 mph or less, emergency vehicles, farm tractors.
VA Secondary $25 5 years and under(53) Front Under 16,all seats
Designed for >10 people, taxi, police vehicles, rural mailcarriers, newspaper delivery, utility meter readers,commercial vehicles making frequent stops.
WA Primary $35 7 years and underand <57 inches
All All Designed for >10 people; when all designated seatingpositions are occupied; vehicles exempted by stateregulation, including farm, construction, or commercialvehicles making frequent stops.
WV Secondary $25(54) 7 years and underand <57 inches(55)
Front Under 17,all seats
Designed for >10 people, rural mail carriers.
WI Secondary $10 7 years and under,80 lb or less,<57 inches(56)
Front All(57) Taxis, farm trucks engaged in farming, emergency vehiclesrequired to make more than 10 stops per mile, rural mailcarriers, land surveyors.
WY Secondary(58) $25(59) 8 years and underin rear seat,80 lb or less inrear seat if available(60)
All All Postal vehicles, emergency vehicles, buses. Excesspassengers exempted if all seats are occupied.
(43)Safety belt law may not be enforced by checkpoints designed for that purpose. Law does not apply to an occupant if all belts in the vehicleare used by other occupants.
(44)Children <1 year of age or <20 lb must be in rear-facing infant seat; 5 years and under in rear seat if available; 1-5 years and up to 80 lb inchild safety seat unless the knees bend over the seat edge when sitting up straight against the seat back (in this case, use of safety belt ispermitted); up to $150 fine, which may be waived with acquisition of child restraint.
(45)Primary enforcement for all seating positions if occupant is <18 years of age.(46)Drivers 18 years of age and older pay $10 if they do not contest the citation; drivers 16-17 years pay $20; $50 if unsuccessfully contested
in court.(47)Under 1 year of age and <20 lb in rear-facing child seat; 1-3 years and 20 lb or more in forward-facing child seat.(48)Drivers 16 or 17 years of age must wear a safety belt. Driver cannot be fined for failure of a passenger >16 years to wear a safety belt.(49)Safety belt requirement does not apply to passengers occupying seating positions without safety belts.(50)Primary enforcement for all seating positions if occupant is 18 years of age or under.(51)Reduced to $15 upon completion of class; standard enforcement for children 18 years of age and under.(52)Less than 1 year of age or <20 lb in rear-facing child seat; 2-7 years in child passenger restraint system unless all available safety belts
are in use and children <5 years are secured in child passenger restraints.(53)Children at least 4 years of age may be belted if the weight or size of the child makes use of a child restraint device impractical.(54)The fine for drivers is $25; the fine for passengers >12 years of age is $10.(55)If all seat belts in a vehicle are being used at the time of examination by a law officer and the vehicle contains more passengers than the
total number of seat belts or other safety devices as installed in compliance with federal motor vehicle safety standards, the driver may notbe considered in violation.
(56)Less than 1 year of age or <20 lb in rear-facing child seat; 1-3 years and 20 to 40 lb in forward-facing child seat; 4-7 years, <80 lb, and <57inches tall in booster seat.
(57)Rear seat occupants must wear safety belt at any position where a shoulder harness is installed.(58)If motorist is wearing safety belt when stopped for another violation, the fine for that violation is reduced by $10.(59)Passengers violating the safety belt requirements are subject to a fine of $10.(60)Children exempted from booster seat requirement if lap and shoulder belt fits properly across collarbone, chest, and hips and does not
pose a danger to neck, face, or abdominal area in the event of a crash or sudden stop.
Table 123
Key Provisions of Occupant Restraint Laws (Continued)
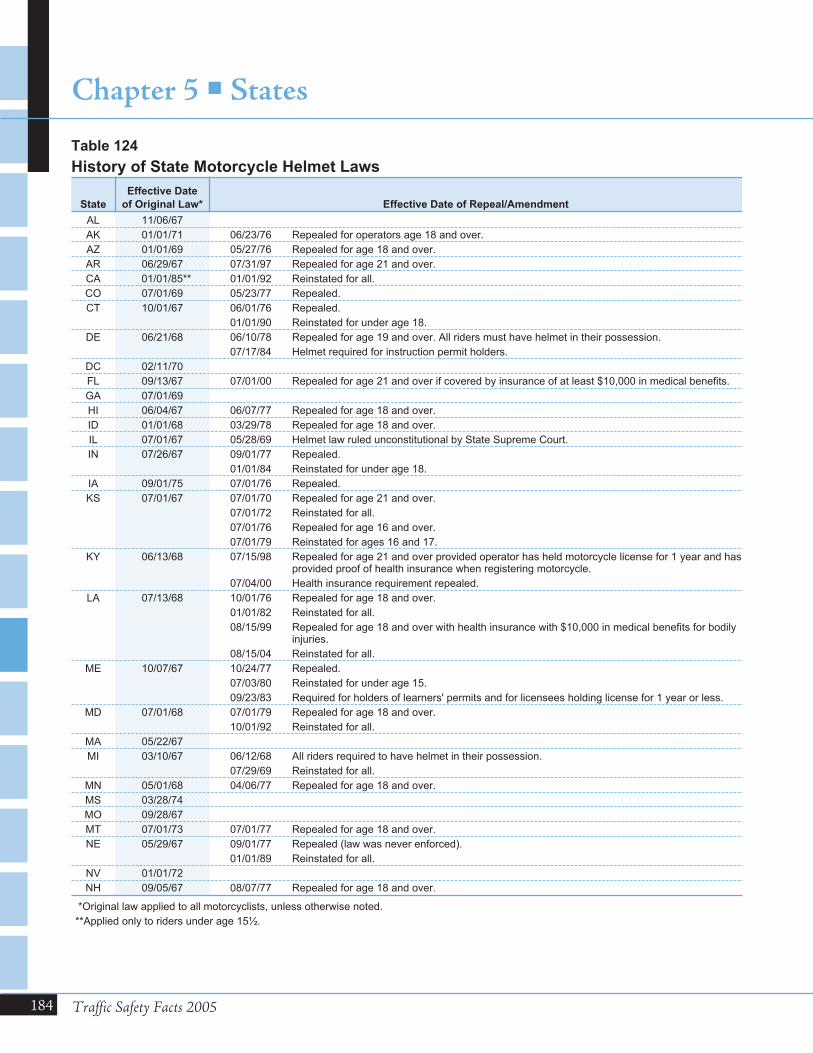
184 Traffic Safety Facts 2005
Chapter 5 � States
State
Effective Date
of Original Law* Effective Date of Repeal/Amendment
AL 11/06/67
AK 01/01/71 06/23/76 Repealed for operators age 18 and over.
AZ 01/01/69 05/27/76 Repealed for age 18 and over.
AR 06/29/67 07/31/97 Repealed for age 21 and over.
CA 01/01/85** 01/01/92 Reinstated for all.
CO 07/01/69 05/23/77 Repealed.
CT 10/01/67 06/01/76 Repealed.
01/01/90 Reinstated for under age 18.
DE 06/21/68 06/10/78 Repealed for age 19 and over. All riders must have helmet in their possession.
07/17/84 Helmet required for instruction permit holders.
DC 02/11/70
FL 09/13/67 07/01/00 Repealed for age 21 and over if covered by insurance of at least $10,000 in medical benefits.
GA 07/01/69
HI 06/04/67 06/07/77 Repealed for age 18 and over.
ID 01/01/68 03/29/78 Repealed for age 18 and over.
IL 07/01/67 05/28/69 Helmet law ruled unconstitutional by State Supreme Court.
IN 07/26/67 09/01/77 Repealed.
01/01/84 Reinstated for under age 18.
IA 09/01/75 07/01/76 Repealed.
KS 07/01/67 07/01/70 Repealed for age 21 and over.
07/01/72 Reinstated for all.
07/01/76 Repealed for age 16 and over.
07/01/79 Reinstated for ages 16 and 17.
KY 06/13/68 07/15/98 Repealed for age 21 and over provided operator has held motorcycle license for 1 year and hasprovided proof of health insurance when registering motorcycle.
07/04/00 Health insurance requirement repealed.
LA 07/13/68 10/01/76 Repealed for age 18 and over.
01/01/82 Reinstated for all.
08/15/99 Repealed for age 18 and over with health insurance with $10,000 in medical benefits for bodilyinjuries.
08/15/04 Reinstated for all.
ME 10/07/67 10/24/77 Repealed.
07/03/80 Reinstated for under age 15.
09/23/83 Required for holders of learners' permits and for licensees holding license for 1 year or less.
MD 07/01/68 07/01/79 Repealed for age 18 and over.
10/01/92 Reinstated for all.
MA 05/22/67
MI 03/10/67 06/12/68 All riders required to have helmet in their possession.
07/29/69 Reinstated for all.
MN 05/01/68 04/06/77 Repealed for age 18 and over.
MS 03/28/74
MO 09/28/67
MT 07/01/73 07/01/77 Repealed for age 18 and over.
NE 05/29/67 09/01/77 Repealed (law was never enforced).
01/01/89 Reinstated for all.
NV 01/01/72
NH 09/05/67 08/07/77 Repealed for age 18 and over.
*Original law applied to all motorcyclists, unless otherwise noted.
**Applied only to riders under age 15½.
Table 124
History of State Motorcycle Helmet Laws
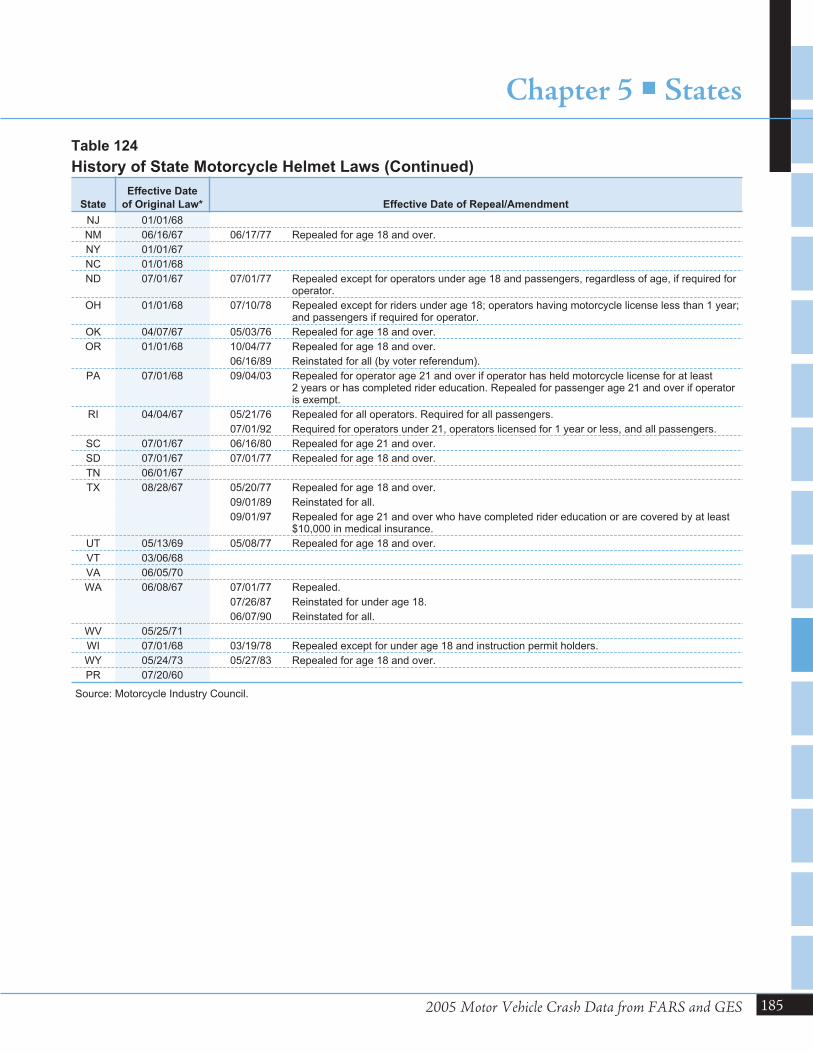
2005 Motor Vehicle Crash Data from FARS and GES
Chapter 5 � States
185
State
Effective Date
of Original Law* Effective Date of Repeal/Amendment
NJ 01/01/68
NM 06/16/67 06/17/77 Repealed for age 18 and over.
NY 01/01/67
NC 01/01/68
ND 07/01/67 07/01/77 Repealed except for operators under age 18 and passengers, regardless of age, if required foroperator.
OH 01/01/68 07/10/78 Repealed except for riders under age 18; operators having motorcycle license less than 1 year;and passengers if required for operator.
OK 04/07/67 05/03/76 Repealed for age 18 and over.
OR 01/01/68 10/04/77 Repealed for age 18 and over.
06/16/89 Reinstated for all (by voter referendum).
PA 07/01/68 09/04/03 Repealed for operator age 21 and over if operator has held motorcycle license for at least2 years or has completed rider education. Repealed for passenger age 21 and over if operatoris exempt.
RI 04/04/67 05/21/76 Repealed for all operators. Required for all passengers.
07/01/92 Required for operators under 21, operators licensed for 1 year or less, and all passengers.
SC 07/01/67 06/16/80 Repealed for age 21 and over.
SD 07/01/67 07/01/77 Repealed for age 18 and over.
TN 06/01/67
TX 08/28/67 05/20/77 Repealed for age 18 and over.
09/01/89 Reinstated for all.
09/01/97 Repealed for age 21 and over who have completed rider education or are covered by at least$10,000 in medical insurance.
UT 05/13/69 05/08/77 Repealed for age 18 and over.
VT 03/06/68
VA 06/05/70
WA 06/08/67 07/01/77 Repealed.
07/26/87 Reinstated for under age 18.
06/07/90 Reinstated for all.
WV 05/25/71
WI 07/01/68 03/19/78 Repealed except for under age 18 and instruction permit holders.
WY 05/24/73 05/27/83 Repealed for age 18 and over.
PR 07/20/60
Source: Motorcycle Industry Council.
Table 124
History of State Motorcycle Helmet Laws (Continued)
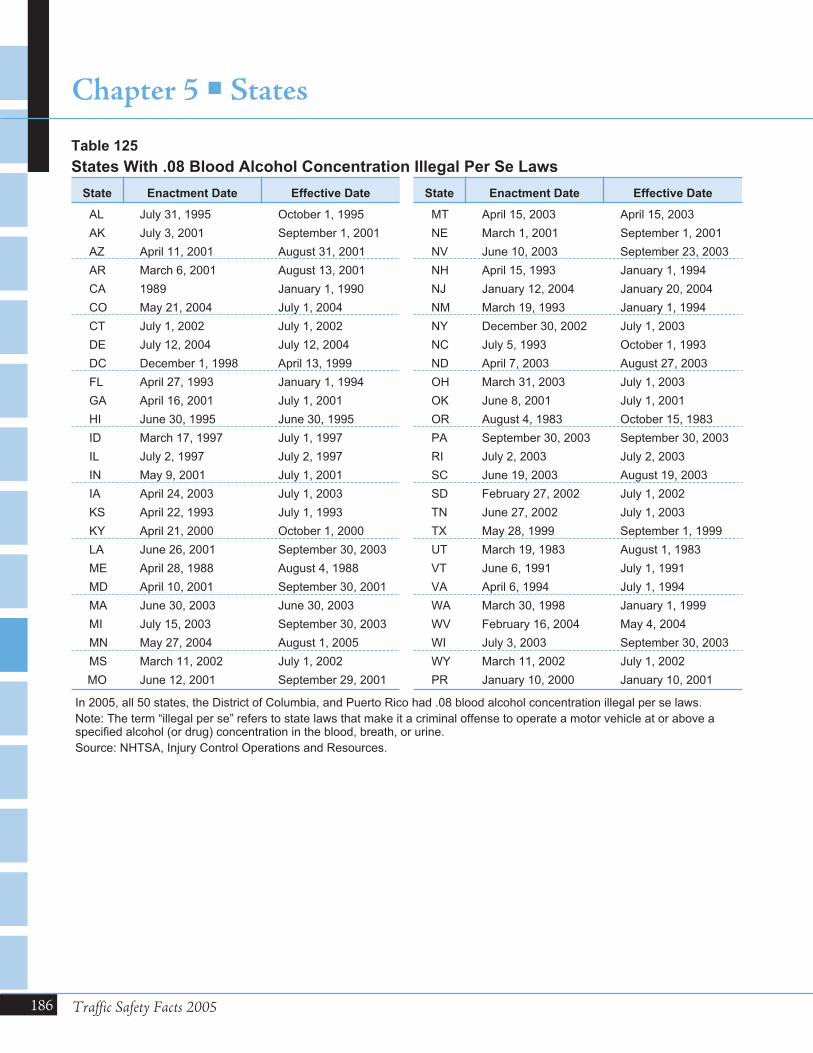
186 Traffic Safety Facts 2005
Chapter 5 � States
State Enactment Date Effective Date State Enactment Date Effective Date
AL July 31, 1995 October 1, 1995 MT April 15, 2003 April 15, 2003
AK July 3, 2001 September 1, 2001 NE March 1, 2001 September 1, 2001
AZ April 11, 2001 August 31, 2001 NV June 10, 2003 September 23, 2003
AR March 6, 2001 August 13, 2001 NH April 15, 1993 January 1, 1994
CA 1989 January 1, 1990 NJ January 12, 2004 January 20, 2004
CO May 21, 2004 July 1, 2004 NM March 19, 1993 January 1, 1994
CT July 1, 2002 July 1, 2002 NY December 30, 2002 July 1, 2003
DE July 12, 2004 July 12, 2004 NC July 5, 1993 October 1, 1993
DC December 1, 1998 April 13, 1999 ND April 7, 2003 August 27, 2003
FL April 27, 1993 January 1, 1994 OH March 31, 2003 July 1, 2003
GA April 16, 2001 July 1, 2001 OK June 8, 2001 July 1, 2001
HI June 30, 1995 June 30, 1995 OR August 4, 1983 October 15, 1983
ID March 17, 1997 July 1, 1997 PA September 30, 2003 September 30, 2003
IL July 2, 1997 July 2, 1997 RI July 2, 2003 July 2, 2003
IN May 9, 2001 July 1, 2001 SC June 19, 2003 August 19, 2003
IA April 24, 2003 July 1, 2003 SD February 27, 2002 July 1, 2002
KS April 22, 1993 July 1, 1993 TN June 27, 2002 July 1, 2003
KY April 21, 2000 October 1, 2000 TX May 28, 1999 September 1, 1999
LA June 26, 2001 September 30, 2003 UT March 19, 1983 August 1, 1983
ME April 28, 1988 August 4, 1988 VT June 6, 1991 July 1, 1991
MD April 10, 2001 September 30, 2001 VA April 6, 1994 July 1, 1994
MA June 30, 2003 June 30, 2003 WA March 30, 1998 January 1, 1999
MI July 15, 2003 September 30, 2003 WV February 16, 2004 May 4, 2004
MN May 27, 2004 August 1, 2005 WI July 3, 2003 September 30, 2003
MS March 11, 2002 July 1, 2002 WY March 11, 2002 July 1, 2002
MO June 12, 2001 September 29, 2001 PR January 10, 2000 January 10, 2001
In 2005, all 50 states, the District of Columbia, and Puerto Rico had .08 blood alcohol concentration illegal per se laws.
Note: The term “illegal per se” refers to state laws that make it a criminal offense to operate a motor vehicle at or above aspecified alcohol (or drug) concentration in the blood, breath, or urine.
Source: NHTSA, Injury Control Operations and Resources.
Table 125
States With .08 Blood Alcohol Concentration Illegal Per Se Laws

APPENDIXES

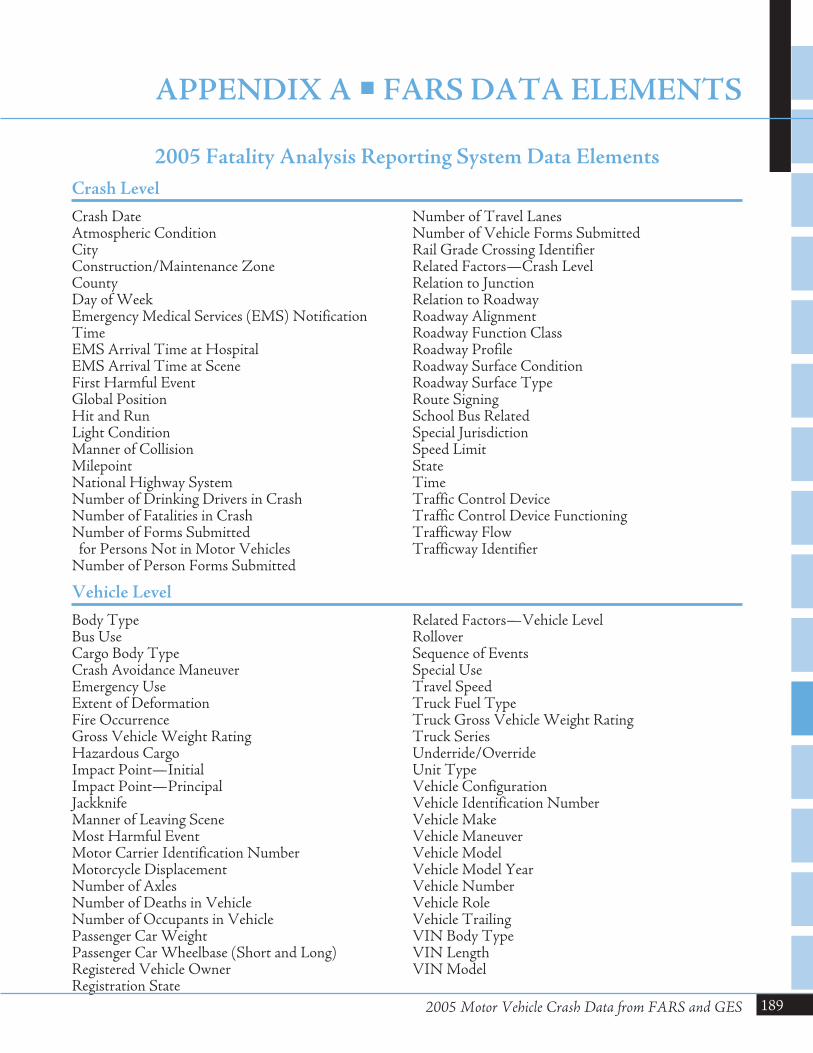
2005 Fatality Analysis Reporting System Data ElementsCrash LevelCrash DateAtmospheric ConditionCityConstruction/Maintenance ZoneCountyDay of WeekEmergency Medical Services (EMS) NotificationTimeEMS Arrival Time at HospitalEMS Arrival Time at SceneFirst Harmful EventGlobal PositionHit and RunLight ConditionManner of CollisionMilepointNational Highway SystemNumber of Drinking Drivers in CrashNumber of Fatalities in CrashNumber of Forms Submittedfor Persons Not in Motor Vehicles
Number of Person Forms Submitted
Number of Travel LanesNumber of Vehicle Forms SubmittedRail Grade Crossing IdentifierRelated Factors—Crash LevelRelation to JunctionRelation to RoadwayRoadway AlignmentRoadway Function ClassRoadway ProfileRoadway Surface ConditionRoadway Surface TypeRoute SigningSchool Bus RelatedSpecial JurisdictionSpeed LimitStateTimeTraffic Control DeviceTraffic Control Device FunctioningTrafficway FlowTrafficway Identifier
Vehicle LevelBody TypeBus UseCargo Body TypeCrash Avoidance ManeuverEmergency UseExtent of DeformationFire OccurrenceGross Vehicle Weight RatingHazardous CargoImpact Point—InitialImpact Point—PrincipalJackknifeManner of Leaving SceneMost Harmful EventMotor Carrier Identification NumberMotorcycle DisplacementNumber of AxlesNumber of Deaths in VehicleNumber of Occupants in VehiclePassenger Car WeightPassenger Car Wheelbase (Short and Long)Registered Vehicle OwnerRegistration State
Related Factors—Vehicle LevelRolloverSequence of EventsSpecial UseTravel SpeedTruck Fuel TypeTruck Gross Vehicle Weight RatingTruck SeriesUnderride/OverrideUnit TypeVehicle ConfigurationVehicle Identification NumberVehicle MakeVehicle ManeuverVehicle ModelVehicle Model YearVehicle NumberVehicle RoleVehicle TrailingVIN Body TypeVIN LengthVIN Model
2005 Motor Vehicle Crash Data from FARS and GES
APPENDIX A � FARS DATA ELEMENTS
189
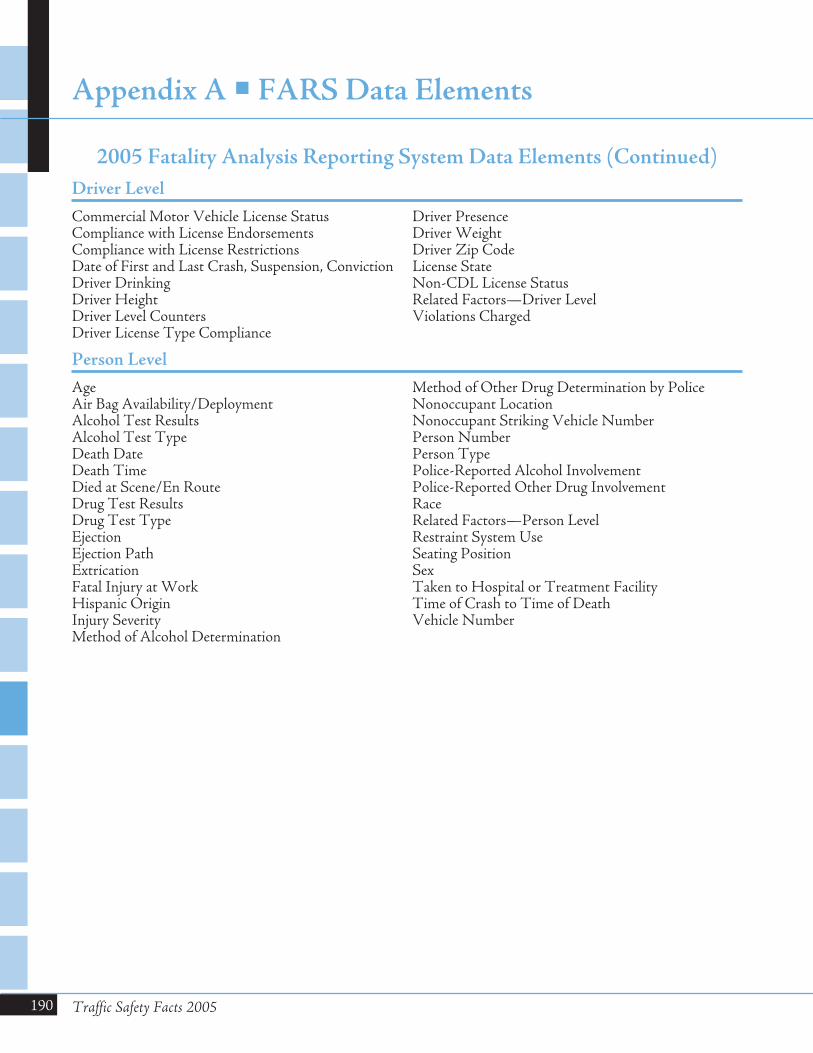
190
2005 Fatality Analysis Reporting System Data Elements (Continued)Driver LevelCommercial Motor Vehicle License StatusCompliance with License EndorsementsCompliance with License RestrictionsDate of First and Last Crash, Suspension, ConvictionDriver DrinkingDriver HeightDriver Level CountersDriver License Type Compliance
Driver PresenceDriver WeightDriver Zip CodeLicense StateNon-CDL License StatusRelated Factors—Driver LevelViolations Charged
Person LevelAgeAir Bag Availability/DeploymentAlcohol Test ResultsAlcohol Test TypeDeath DateDeath TimeDied at Scene/En RouteDrug Test ResultsDrug Test TypeEjectionEjection PathExtricationFatal Injury at WorkHispanic OriginInjury SeverityMethod of Alcohol Determination
Method of Other Drug Determination by PoliceNonoccupant LocationNonoccupant Striking Vehicle NumberPerson NumberPerson TypePolice-Reported Alcohol InvolvementPolice-Reported Other Drug InvolvementRaceRelated Factors—Person LevelRestraint System UseSeating PositionSexTaken to Hospital or Treatment FacilityTime of Crash to Time of DeathVehicle Number
Traffic Safety Facts 2005
Appendix A � FARS Data Elements
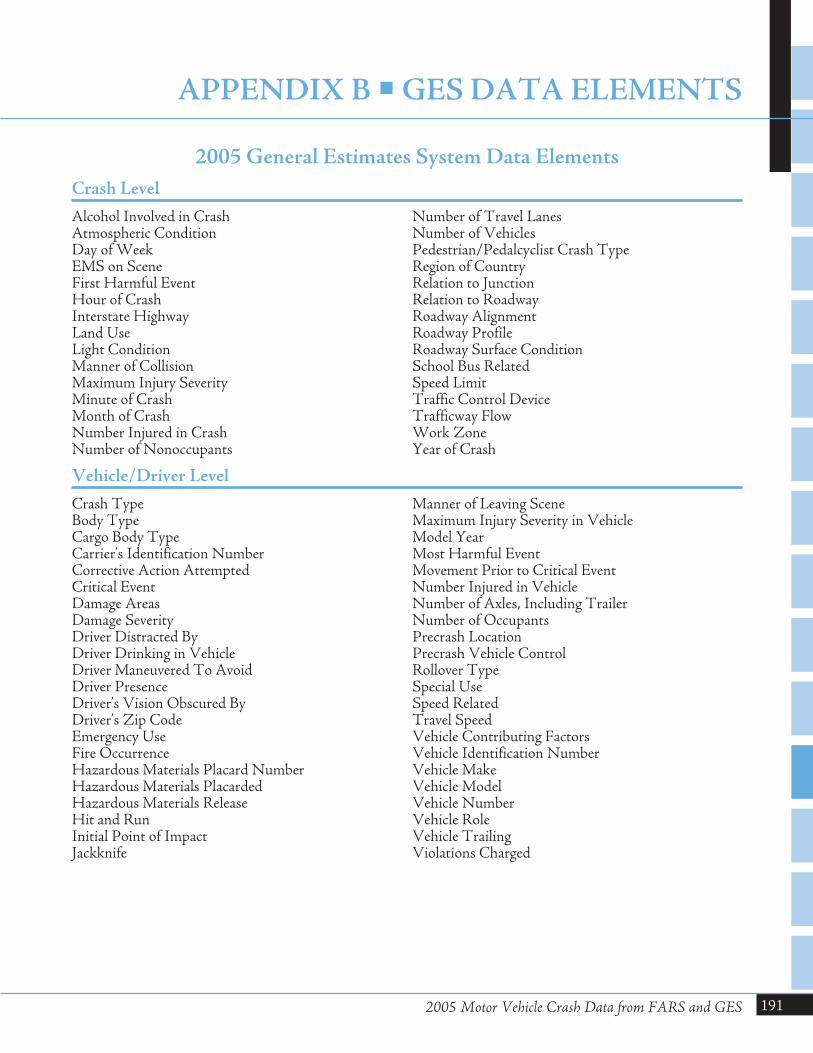
2005 General Estimates System Data ElementsCrash LevelAlcohol Involved in CrashAtmospheric ConditionDay of WeekEMS on SceneFirst Harmful EventHour of CrashInterstate HighwayLand UseLight ConditionManner of CollisionMaximum Injury SeverityMinute of CrashMonth of CrashNumber Injured in CrashNumber of Nonoccupants
Number of Travel LanesNumber of VehiclesPedestrian/Pedalcyclist Crash TypeRegion of CountryRelation to JunctionRelation to RoadwayRoadway AlignmentRoadway ProfileRoadway Surface ConditionSchool Bus RelatedSpeed LimitTraffic Control DeviceTrafficway FlowWork ZoneYear of Crash
Vehicle/Driver LevelCrash TypeBody TypeCargo Body TypeCarrier’s Identification NumberCorrective Action AttemptedCritical EventDamage AreasDamage SeverityDriver Distracted ByDriver Drinking in VehicleDriver Maneuvered To AvoidDriver PresenceDriver’s Vision Obscured ByDriver’s Zip CodeEmergency UseFire OccurrenceHazardous Materials Placard NumberHazardous Materials PlacardedHazardous Materials ReleaseHit and RunInitial Point of ImpactJackknife
Manner of Leaving SceneMaximum Injury Severity in VehicleModel YearMost Harmful EventMovement Prior to Critical EventNumber Injured in VehicleNumber of Axles, Including TrailerNumber of OccupantsPrecrash LocationPrecrash Vehicle ControlRollover TypeSpecial UseSpeed RelatedTravel SpeedVehicle Contributing FactorsVehicle Identification NumberVehicle MakeVehicle ModelVehicle NumberVehicle RoleVehicle TrailingViolations Charged
2005 Motor Vehicle Crash Data from FARS and GES
APPENDIX B �GES DATA ELEMENTS
191
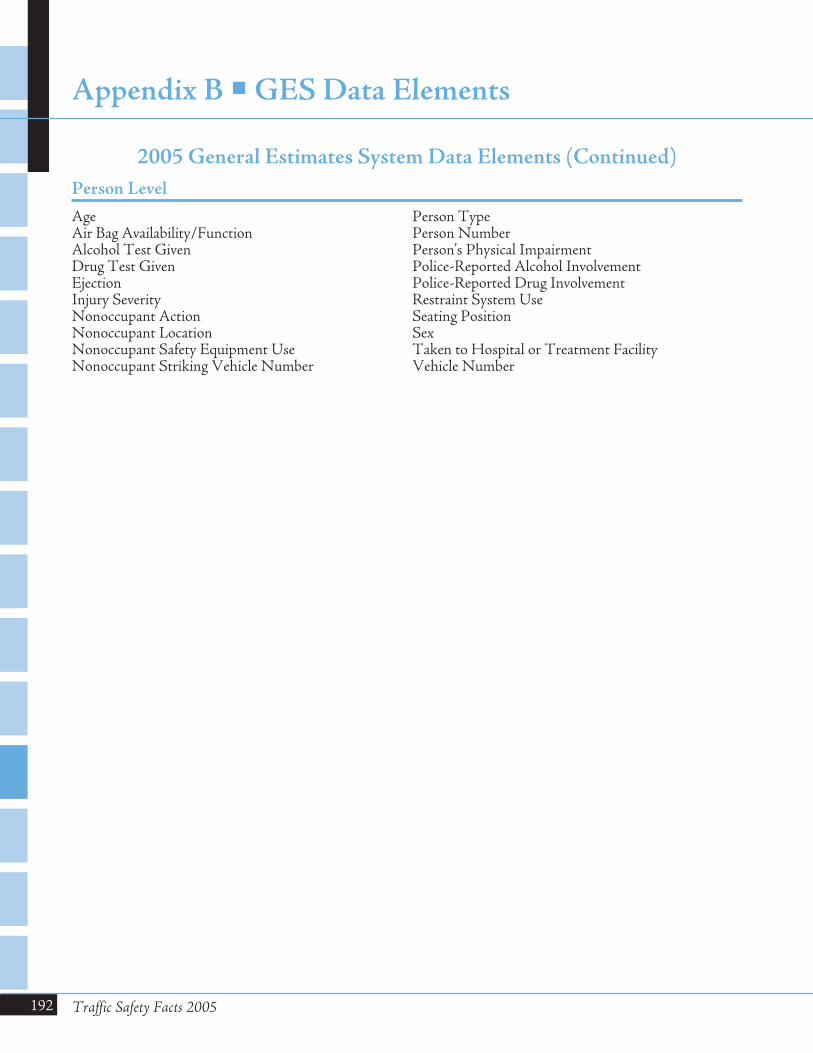
192 Traffic Safety Facts 2005
Appendix B �GES Data Elements
2005 General Estimates System Data Elements (Continued)Person LevelAgeAir Bag Availability/FunctionAlcohol Test GivenDrug Test GivenEjectionInjury SeverityNonoccupant ActionNonoccupant LocationNonoccupant Safety Equipment UseNonoccupant Striking Vehicle Number
Person TypePerson NumberPerson’s Physical ImpairmentPolice-Reported Alcohol InvolvementPolice-Reported Drug InvolvementRestraint System UseSeating PositionSexTaken to Hospital or Treatment FacilityVehicle Number
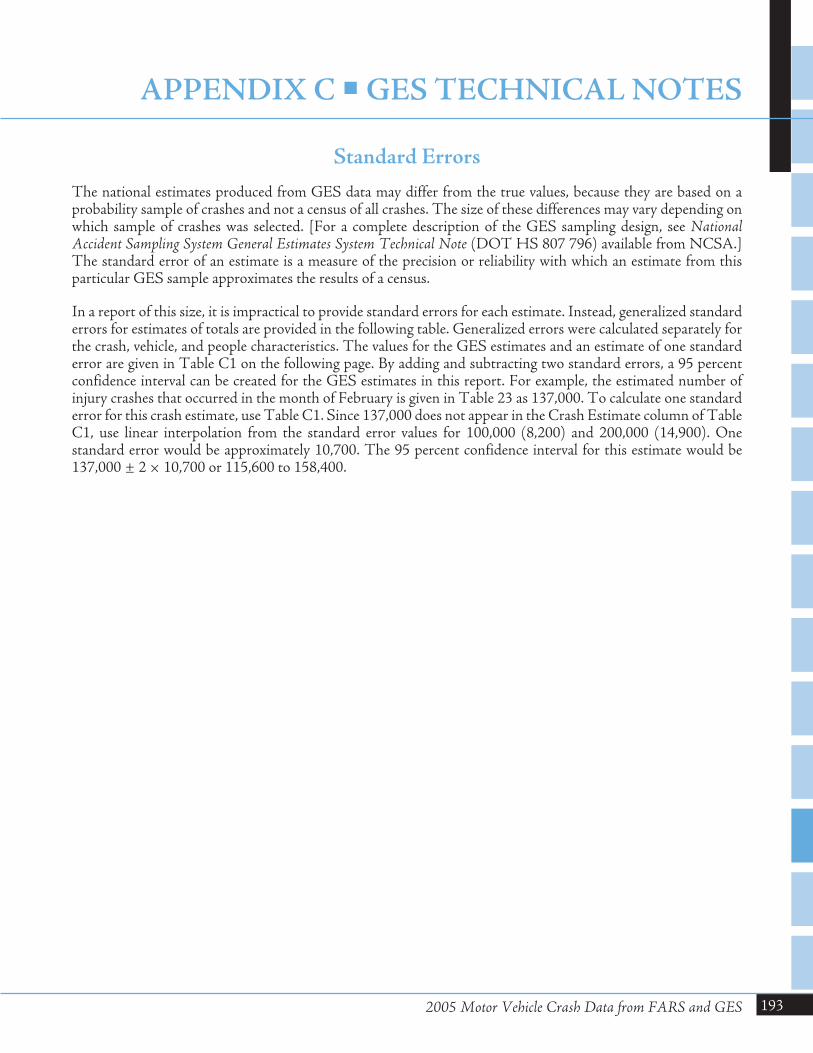
Standard Errors
The national estimates produced from GES data may differ from the true values, because they are based on aprobability sample of crashes and not a census of all crashes. The size of these differences may vary depending onwhich sample of crashes was selected. [For a complete description of the GES sampling design, see NationalAccident Sampling System General Estimates System Technical Note (DOT HS 807 796) available from NCSA.]The standard error of an estimate is a measure of the precision or reliability with which an estimate from thisparticular GES sample approximates the results of a census.
In a report of this size, it is impractical to provide standard errors for each estimate. Instead, generalized standarderrors for estimates of totals are provided in the following table. Generalized errors were calculated separately forthe crash, vehicle, and people characteristics. The values for the GES estimates and an estimate of one standarderror are given in Table C1 on the following page. By adding and subtracting two standard errors, a 95 percentconfidence interval can be created for the GES estimates in this report. For example, the estimated number ofinjury crashes that occurred in the month of February is given in Table 23 as 137,000. To calculate one standarderror for this crash estimate, use Table C1. Since 137,000 does not appear in the Crash Estimate column of TableC1, use linear interpolation from the standard error values for 100,000 (8,200) and 200,000 (14,900). Onestandard error would be approximately 10,700. The 95 percent confidence interval for this estimate would be137,000 ± 2 × 10,700 or 115,600 to 158,400.
2005 Motor Vehicle Crash Data from FARS and GES
APPENDIX C �GES TECHNICAL NOTES
193
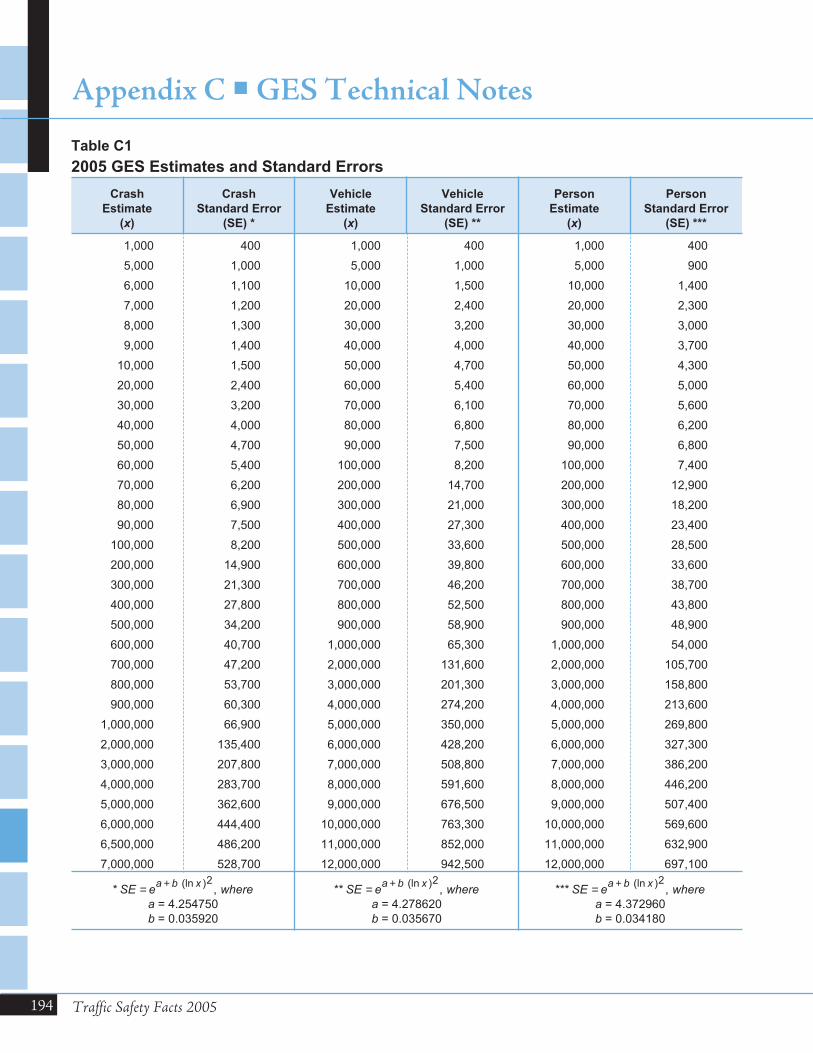
194 Traffic Safety Facts 2005
Appendix C �GES Technical Notes
Crash
Estimate
(x)
Crash
Standard Error
(SE) *
Vehicle
Estimate
(x)
Vehicle
Standard Error
(SE) **
Person
Estimate
(x)
Person
Standard Error
(SE) ***
1,000 400 1,000 400 1,000 400
5,000 1,000 5,000 1,000 5,000 900
6,000 1,100 10,000 1,500 10,000 1,400
7,000 1,200 20,000 2,400 20,000 2,300
8,000 1,300 30,000 3,200 30,000 3,000
9,000 1,400 40,000 4,000 40,000 3,700
10,000 1,500 50,000 4,700 50,000 4,300
20,000 2,400 60,000 5,400 60,000 5,000
30,000 3,200 70,000 6,100 70,000 5,600
40,000 4,000 80,000 6,800 80,000 6,200
50,000 4,700 90,000 7,500 90,000 6,800
60,000 5,400 100,000 8,200 100,000 7,400
70,000 6,200 200,000 14,700 200,000 12,900
80,000 6,900 300,000 21,000 300,000 18,200
90,000 7,500 400,000 27,300 400,000 23,400
100,000 8,200 500,000 33,600 500,000 28,500
200,000 14,900 600,000 39,800 600,000 33,600
300,000 21,300 700,000 46,200 700,000 38,700
400,000 27,800 800,000 52,500 800,000 43,800
500,000 34,200 900,000 58,900 900,000 48,900
600,000 40,700 1,000,000 65,300 1,000,000 54,000
700,000 47,200 2,000,000 131,600 2,000,000 105,700
800,000 53,700 3,000,000 201,300 3,000,000 158,800
900,000 60,300 4,000,000 274,200 4,000,000 213,600
1,000,000 66,900 5,000,000 350,000 5,000,000 269,800
2,000,000 135,400 6,000,000 428,200 6,000,000 327,300
3,000,000 207,800 7,000,000 508,800 7,000,000 386,200
4,000,000 283,700 8,000,000 591,600 8,000,000 446,200
5,000,000 362,600 9,000,000 676,500 9,000,000 507,400
6,000,000 444,400 10,000,000 763,300 10,000,000 569,600
6,500,000 486,200 11,000,000 852,000 11,000,000 632,900
7,000,000 528,700 12,000,000 942,500 12,000,000 697,100
* SE e wherea b x= + (ln )
,2
a = 4.254750b = 0.035920
** SE e wherea b x= + (ln )
,2
a = 4.278620b = 0.035670
*** SE e wherea b x= + (ln )
,2
a = 4.372960b = 0.034180
Table C1
2005 GES Estimates and Standard Errors
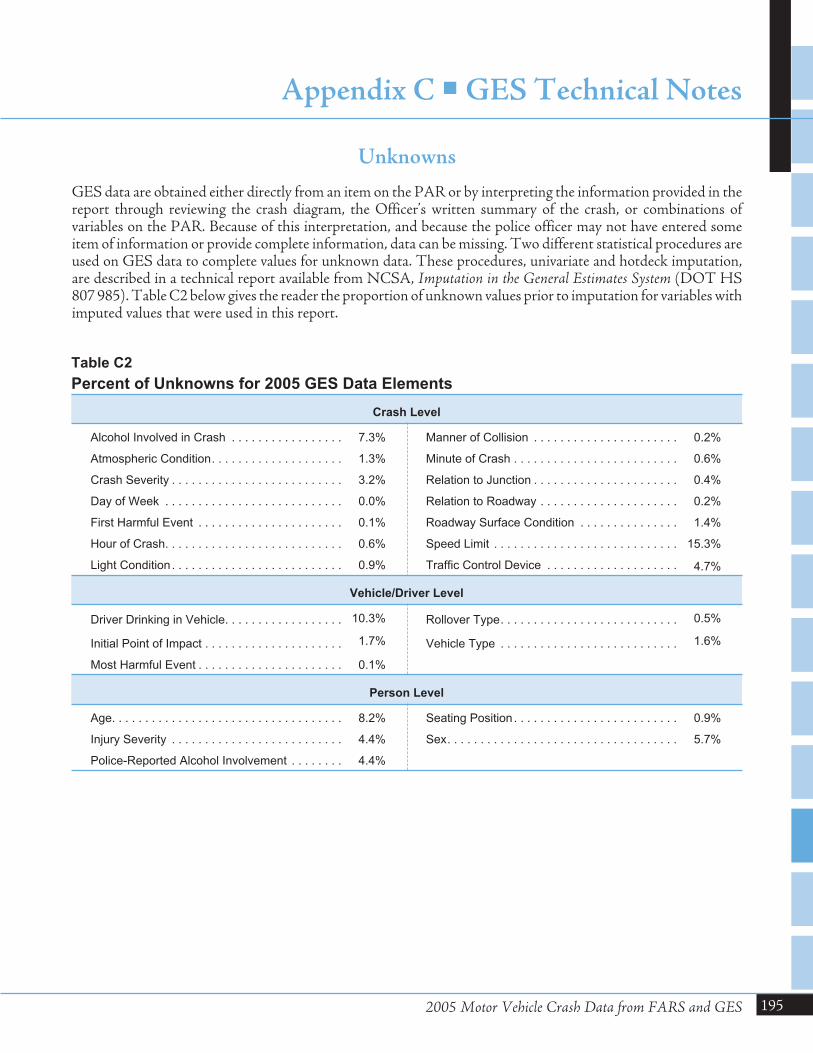
Unknowns
GES data are obtained either directly from an item on the PAR or by interpreting the information provided in thereport through reviewing the crash diagram, the Officer’s written summary of the crash, or combinations ofvariables on the PAR. Because of this interpretation, and because the police officer may not have entered someitem of information or provide complete information, data can be missing. Two different statistical procedures areused on GES data to complete values for unknown data. These procedures, univariate and hotdeck imputation,are described in a technical report available from NCSA, Imputation in the General Estimates System (DOT HS807 985). Table C2 below gives the reader the proportion of unknown values prior to imputation for variables withimputed values that were used in this report.
2005 Motor Vehicle Crash Data from FARS and GES
Appendix C �GES Technical Notes
195
Crash Level
Alcohol Involved in Crash . . . . . . . . . . . . . . . . . 7.3% Manner of Collision . . . . . . . . . . . . . . . . . . . . . . 0.2%
Atmospheric Condition. . . . . . . . . . . . . . . . . . . . 1.3% Minute of Crash . . . . . . . . . . . . . . . . . . . . . . . . . 0.6%
Crash Severity . . . . . . . . . . . . . . . . . . . . . . . . . . 3.2% Relation to Junction . . . . . . . . . . . . . . . . . . . . . . 0.4%
Day of Week . . . . . . . . . . . . . . . . . . . . . . . . . . . 0.0% Relation to Roadway . . . . . . . . . . . . . . . . . . . . . 0.2%
First Harmful Event . . . . . . . . . . . . . . . . . . . . . . 0.1% Roadway Surface Condition . . . . . . . . . . . . . . . 1.4%
Hour of Crash. . . . . . . . . . . . . . . . . . . . . . . . . . . 0.6% Speed Limit . . . . . . . . . . . . . . . . . . . . . . . . . . . . 15.3%
Light Condition . . . . . . . . . . . . . . . . . . . . . . . . . . 0.9% Traffic Control Device . . . . . . . . . . . . . . . . . . . . 4.7%
Vehicle/Driver Level
Driver Drinking in Vehicle. . . . . . . . . . . . . . . . . . 10.3% Rollover Type. . . . . . . . . . . . . . . . . . . . . . . . . . . 0.5%
Initial Point of Impact . . . . . . . . . . . . . . . . . . . . . 1.7% Vehicle Type . . . . . . . . . . . . . . . . . . . . . . . . . . . 1.6%
Most Harmful Event . . . . . . . . . . . . . . . . . . . . . . 0.1%
Person Level
Age. . . . . . . . . . . . . . . . . . . . . . . . . . . . . . . . . . . 8.2% Seating Position . . . . . . . . . . . . . . . . . . . . . . . . . 0.9%
Injury Severity . . . . . . . . . . . . . . . . . . . . . . . . . . 4.4% Sex. . . . . . . . . . . . . . . . . . . . . . . . . . . . . . . . . . . 5.7%
Police-Reported Alcohol Involvement . . . . . . . . 4.4%
Table C2
Percent of Unknowns for 2005 GES Data Elements

Alcohol InvolvementNHTSA defines a fatal crash as alcohol-related or al-cohol-involved if at least one driver or nonoccupant(such as a pedestrian or pedalcyclist) involved in thecrash is determined to have had a Blood AlcoholConcentration (BAC) of .01 gram per deciliter (g/dl)or higher. Thus, any fatality that occurs in an alco-hol-related crash is considered an alcohol-related fa-tality.
NHTSA defines a nonfatal crash as alcohol-relatedor alcohol-involved if police indicate on the police ac-cident report that there is evidence of alcohol present.The code does not necessarily mean that a driver ornonoccupant was tested for alcohol.
The term “alcohol-related” or “alcohol-involved” doesnot indicate that a crash or fatality was caused by thepresence of alcohol.
Blood Alcohol ConcentrationThe BAC is measured as a percentage by weight of al-cohol in the blood (grams/deciliter). A positive BAClevel (.01 g/dl and higher) indicates that alcohol wasconsumed by the person tested; a BAC level of .01 to.07 g/dl indicates that the person was impaired; aBAC level of .08 g/dl or more indicates that the per-son was intoxicated.
Body TypeDetailed type of motor vehicle within a vehicle type.
BusLarge motor vehicles used to carry more than ten pas-sengers, including school buses, inter-city buses, andtransit buses.
Combination TruckA truck tractor not pulling a trailer; a tractor pullingat least one full or semi-trailer; or a single-unit truckpulling at least one trailer.
Construction/Maintenance ZoneAn area, usually marked by signs, barricades, or otherdevices indicating that highway construction or high-way maintenance activities are ongoing.
CrashAn event that produces injury and/or property dam-age, involves a motor vehicle in transport, and occurson a trafficway or while the vehicle is still in motionafter running off the trafficway.
Crash Severity1. Fatal Crash. A police-reported crash involving a
motor vehicle in transport on a trafficway in whichat least one person dies within 30 days of the crash.
2. Injury Crash. A police-reported crash that in-volves a motor vehicle in transport on a trafficwayin which no one died but at least one person wasreported to have: (1) an incapacitating injury; (2) avisible but not incapacitating injury; (3) a possible,not visible injury; or (4) an injury of unknown se-verity.
3. Property-Damage-Only Crash. A police-reportedcrash involving a motor vehicle in transport on atrafficway in which no one involved in the crashsuffered any injuries.
Crash TypeSingle-vehicle or multiple-vehicle crash.
DayFrom 6 a.m. to 5:59 p.m.
DriverAn occupant of a vehicle who is in physical control ofa motor vehicle in transport, or for an out-of-controlvehicle, an occupant who was in control until controlwas lost.
EjectionRefers to occupants being totally or partially thrownfrom the vehicle as a result of an impact or rollover.
First Harmful EventThe first event during a crash that caused injury orproperty damage.
Fixed ObjectStationary structures or substantial vegetation at-tached to the terrain.
2005 Motor Vehicle Crash Data from FARS and GES
GLOSSARY
197
198
Gross Vehicle Weight Rating (GVWR)The maximum rated capacity of a vehicle, includingthe weight of the base vehicle, all added equipment,driver and passengers, and all cargo loaded into or onthe vehicle. Actual weight may be less than or greaterthan GVWR.
Initial Impact PointThe first impact point that produced personal injuryor property damage, regardless of First or MostHarmful Event.
Injury SeverityThe police-reported injury severity of the person (i.e.,occupant, pedestrian, or pedalcyclist).
1. Killed (Fatal)2. Injured (Incapacitating injury, evident injury but
not incapacitating, complaint of injury, or injured,severity unknown).
3. No injury.
JackknifeJackknife can occur at any time during the crash se-quence. In this report, jackknifing is restricted totruck tractors pulling a trailing unit in which the trail-ing unit and the pulling vehicle rotate with respect toeach other.
JunctionArea formed by the connection of two roadways, in-cluding intersections, interchange areas, and en-trance/exit ramps.
Land UseThe crash location (urban or rural).
Large TrucksTrucks over 10,000 pounds gross vehicle weight rat-ing, including single unit trucks and truck tractors.
Light TrucksTrucks of 10,000 pounds gross vehicle weight ratingor less, including pickups, vans, truck-based stationwagons, and utility vehicles.
Manner of CollisionA classification for crashes in which the first harmfulevent was a collision between two motor vehicles intransport and is described as one of the following:
Angle. Collisions which are not head-on, rear-end,rear-to-rear, or sideswipe.Head-on. Refers to a collision where the front end ofone vehicle collides with the front-end of anothervehicle while the two vehicles are traveling in oppo-site directions.Rear-end. A collision in which one vehicle collideswith the rear of another vehicle.Sideswipe. A collision in which the sides of both ve-hicles sustain minimal engagements.
Most Harmful EventThe event during a crash for a particular vehicle thatis judged to have produced the greatest personal in-jury or property damage.
MotorcycleA two- or three-wheeled motor vehicle designed totransport one or two people, including motor-scooters, minibikes, and mopeds.
Motor Vehicle in TransportA motor vehicle in motion on the trafficway or anyother motor vehicle on the roadway, includingstalled, disabled, or abandoned vehicles.
NightFrom 6 p.m. to 5:59 a.m.
NoncollisionA class of crash in which the first harmful event doesnot involve a collision with a fixed object, nonfixedobject, or a motor vehicle. This includes overturn,fire/explosion, falls from a vehicle, and injuries in avehicle.
Traffic Safety Facts 2005
Glossary
NonoccupantAny person who is not an occupant of a motor vehiclein transport and includes the following:1. Pedestrians2. Pedalcyclists3. Occupants of parked motor vehicles4. Others such as joggers, skateboard riders, people
riding on animals, and persons riding in animal-drawn conveyances.
Nonoccupant LocationThe location of nonoccupants at time of impact. In-tersection locations are coded only if nonoccupantswere struck in the area formed by a junction oftwo or more trafficways. Non-intersection locationmay include nonoccupants struck on a junctionof a driveway/alley access and a named trafficway.Nonoccupants who are occupants of motor vehiclesnot in transport are coded with respect to the locationof the vehicle.
Objects Not FixedObjects that are movable or moving but are not mo-tor vehicles. Includes pedestrians, pedalcyclists, ani-mals, or trains (e.g., spilled cargo in roadway).
OccupantAny person who is in or upon a motor vehicle intransport. Includes the driver, passengers, and per-sons riding on the exterior of a motor vehicle.
Other VehicleConsists of the following types of vehicles:1. Large limousine (more than four side doors or
stretched chassis)2. Three-wheel automobile or automobile derivative3. Van-based motorhome4. Light-truck-based motorhome (chassis mounted)5. Large-truck-based motorhome6. ATV (all terrain vehicle, including dune/swamp
buggy) and ATC (all terrain cycle)7. Snowmobile8. Farm equipment other than trucks9. Construction equipment other than trucks (in-
cludes graders)10. Other type vehicle (includes go-cart, fork lift, city
streetsweeper).
PassengerAny occupant of a motor vehicle who is not a driver.
Passenger CarMotor vehicles used primarily for carrying passen-gers, including convertibles, sedans, and station wag-ons.
PedalcyclistA person on a vehicle that is powered solely by pedals.
PedestrianAny person not in or upon a motor vehicle or othervehicle.
Restraint UseThe occupant’s use of available vehicle restraints in-cluding lap belt, shoulder belt, or automatic belt.
RoadwayThat part of a trafficway designed, improved, and or-dinarily used for motor vehicle travel.
Roadway Function ClassThe classification describing the character of servicethe street or highway is intended to provide. Includesthe following:
Interstates. Limited access divided facilities of atleast four lanes designated by the Federal HighwayAdministration as part of the Interstate System.Other Freeways and Expressways. All urban princi-pal arterial with limited control of access not on theInterstate system.Other Principal Arterials. Major streets or high-ways, many with multi-lane or freeway design, serv-ing high-volume traffic corridor movements thatconnect major generators of travel.Minor Arterials. Streets and highways linking citiesand larger towns in rural areas in distributing tripsto small geographic areas in urban areas (not pene-trating identifiable neighborhoods).Collectors. In rural areas, routes serving intra-county, rather than statewide travel. In urban areas,streets providing direct access to neighborhoods aswell as direct access to arterials.Local Streets and Roads. Streets whose primarypurpose is feeding higher order systems, providingdirect access with little or no through traffic.
2005 Motor Vehicle Crash Data from FARS and GES
Glossary
199
200
RolloverRollover is defined as any vehicle rotation of 90 de-grees or more about any true longitudinal or lateralaxis. Includes rollovers occurring as a first harmfulevent or subsequent event.
Seating PositionThe location of the occupants in the vehicle. Morethan one can be assigned the same seat position; how-ever, this is allowed only when a person is sitting onsomeone’s lap.
School Bus-Related CrashAny crash in which a vehicle, regardless of body de-sign, used as a school bus is directly or indirectly in-volved, such as a crash involving school childrenalighting from a vehicle.
Single-Unit TruckA medium or heavy truck in which the engine, cab,drive train, and cargo area are all on one chassis.
TrafficwayAny road, street, or highway open to the public as amatter of right or custom for moving persons orproperty from one place to another.
VehicleSee Motor Vehicle in Transport.
Vehicle TypeA series of motor vehicle body types that have beengrouped together because of their design similarities.The principal vehicle types used in this report arepassenger car, light truck, large truck, motorcycle,bus, and other vehicle. See the definition of each ofthe vehicle types elsewhere in this glossary.
WeekdayFrom 6 a.m. Monday to 5:59 p.m. Friday.
WeekendFrom 6 p.m. Friday to 5:59 a.m. Monday.
Traffic Safety Facts 2005
Glossary
AAge
Alcohol 36, 37, 112, 113, 114, 115, 117Crash Type 114, 115Day of Week 114Injury Severity 86Occupant 103, 126Person Type 104, 128, 129, 133, 134Rates 21, 31, 88, 89, 98, 99, 129, 134Restraint Use 119, 120School Bus Related 127Sex 88, 89, 98, 99, 104, 129, 134State 152-153Time of Day 114, 115
Airbag 123Alcohol
Age 36, 37, 112, 113, 114, 115, 117Crash Type 56, 92, 114, 115Day of Week 114, 115Driver Survival Status 38, 162-167Holiday 33Illegal Per Se Laws 184Injury Severity 111Pedestrian 38, 117Person Type 111Sex 34State 160-167Time of Day 34, 56, 57, 92, 114, 115Vehicle Type 35, 116Year 32
Ambulance 94
BBody Type 63, 109Bus 63, 64, 81, 82, 101, 102, 103, 106-109, 116, 118
CCity 174-177Construction/Maintenance Zone 94
Crash TypeAlcohol 56, 92, 114Day of Week 114Driver Age 114Emergency Vehicle 94Hazardous Cargo 68Impact Point 70, 72, 74, 76, 80, 82Relation to Roadway 49Roadway Function Class 68Speed Limit 90Time of Day 56, 92, 114, 115Vehicle Type 30, 70, 72, 74, 76, 80, 82, 94
DDay of Week 45, 114, 115, 124, 125, 130, 131, 135Driver
Age 36, 98, 99, 104, 114, 115Alcohol 34, 35, 36, 37, 112, 113, 114-117, 162-167Injury Severity 86, 101, 111License Compliance 126License Status 100Previous Driving Record 100Rates 19, 20, 98Related Factors 100Restraint Use 39, 118Sex 34, 98, 104State 148-149, 162-167
EEjection 107Emergency Medical Services 48, 170-171, 172-173Emergency Vehicle 94
FFire 66Fire Truck 94First Harmful Event 54, 142-143
2005 Motor Vehicle Crash Data from FARS and GES
INDEX
201
202
HHazardous Cargo 68Helmet Use 126, 183Holiday 33
IImpact Point 70, 71, 72, 73, 74, 75, 76, 79, 80, 81,
82, 106, 132, 136Intersection 50, 128, 133
JJackknife 78
LLand Use 48, 52, 68, 91, 170-171, 172-173Large Truck
Alcohol 35, 116Crash Type 30, 70, 76Ejection 107Fire 66Impact Point 70, 75, 76, 106Jackknife 78Most Harmful Event 69, 75, 105Number of Trailers 78Occupant 26, 27, 30, 101, 102, 103Rates 17, 26, 27Restraint Use 118Rollover 64, 77State 154-155Year 17, 26, 30
License Compliance 126License Status 100Licensed Drivers 15, 19, 148-149Light Condition 47, 90Light Truck
Alcohol 35, 116Crash Type 70, 74Ejection 107Fire 66Impact Point 70, 73, 74, 106Most Harmful Event 69, 73, 105Occupant 24, 25, 101, 102, 103
Rates 17, 24, 25Restraint Use 118, 122, 123Rollover 64Seating Position 122State 154-155Year 17, 24
Location (Nonoccupant) 128, 133
MManner of Collision 54Month 44Most Harmful Event 69, 71, 73, 75, 79, 81, 105Motorcycle
Age 126Alcohol 35, 116Crash Type 70, 80Day of Week 124, 125Fire 66Helmet Use 126Helmet Use Requirements 183Impact Point 70, 79, 80, 106License Compliance 126Most Harmful Event 69, 79, 105Occupant 28, 29, 101, 102, 103Rates 17, 28, 29State 154-155Time of Day 124, 125Year 17, 28
NNumber of Lanes 53
OOccupant
Age 21, 103, 104Body Type 109Ejection 107Injury Severity 86, 101, 111Restraint Use 40Sex 102, 104Vehicle Type 18, 94, 101, 102, 103, 106, 108, 109,
154-155Year 18
Traffic Safety Facts 2005
Index
PPassenger 86, 101, 104, 111, 126, 127, 150-151Passenger Car
Alcohol 35, 116Crash Type 70, 72Ejection 107Fire 66Impact Point 70, 71, 72, 106Most Harmful Event 69, 71, 105Occupant 22, 23, 101, 102, 103, 105,106, 107, 108, 109, 110Rates 17, 22, 23Restraint Use 121, 123Rollover 64Seating Position 121State 154-155, 156-157Wheelbase Size 110Year 17, 22, 23
PedalcyclistAge 133, 134Alcohol 111Day of Week 135Impact Point on Striking Vehicle 136Injury Severity 86, 111Location 133Rates 134Related Factors 136Sex 134State 150-151Striking Vehicle Type 136Time of Day 135Year 18
PedestrianAge 127, 128, 129Alcohol 38, 111, 117City 174-177Day of Week 130, 131Impact Point on Striking Vehicle 132Injury Severity 86, 111Location 128Rates 129, 158-159Related Factors 132
School Bus Related 127Sex 129State 150-151, 174-177Striking Vehicle Type 132Time of Day 130, 131Year 18
Police Vehicle 94Population
Age 21, 31, 88, 89, 129, 134City 174-177Rates 15, 21, 88, 89, 129, 134, 148-149, 174-177Sex 88, 89, 129, 134State 148-149Year 15, 21, 31
Previous Driving Record 100
RRates: Licensed Drivers
Age 15, 19, 20, 98, 99Sex 19, 20, 98, 99State 148-149Year 15, 19, 20
Rates: PopulationAge 21, 31, 88, 89, 129, 134City 174-177Pedestrian 129, 158-159Sex 88, 89, 129, 134State 148-149, 158-159Year 15
Rates: Registered VehiclesState 148-149Vehicle Type 17, 22, 24, 26, 28Year 15, 17
Rates: Vehicle Miles of TravelMonth 44State 178-179Vehicle Type 17, 22, 23, 24, 25, 26, 27, 28, 29Year 15, 16, 17
Registered Vehicles 15, 17, 22, 24, 26, 28, 148-149Relation to Junction 50Relation to Roadway 49
2005 Motor Vehicle Crash Data from FARS and GES
Index
203
204
Restraint UseAge 119, 120Child Passenger Protection Laws 182Driver 39, 118Restraint Type 123Safety Belt Use Laws 180-181Seating Position 121, 122State 156-157Vehicle Type 118Year 39, 40
Roadway Function Class 68, 94, 144-145, 146-147Rollover 64, 77
SSchool Bus Related 127Seating Position 121, 122Sex
Age 88, 89, 98, 99, 129, 134Alcohol 34Injury Severity 86Person Type 104, 129, 134Rates 19, 20, 88, 89, 98, 99, 129, 134Vehicle Type 102
Speed Limit 51, 52, 90, 91, 97, 168-169
TTime of Day 34, 45, 46, 56, 57, 92, 96, 114, 115, 124,
125Traffic Control Device 50Trafficway Flow 53
VVehicle Maneuver 67Vehicle Miles of Travel 15, 16, 17, 22, 23, 24, 25, 26,
27, 28, 29Vehicle Type
Alcohol 35, 116Body Type 63, 109Ejection 107Fire 66Impact Point 70, 72, 74, 76, 80, 82, 106, 132, 136Injury Severity 101Most Harmful Event 69, 71, 73, 75, 79, 81, 105Occupant Age 103Occupant Sex 102Restraint Use 118Rollover 64State 154-155Two-Vehicle Crash 55, 108Year 17, 18
WWeather Condition 47, 90
Traffic Safety Facts 2005
Index
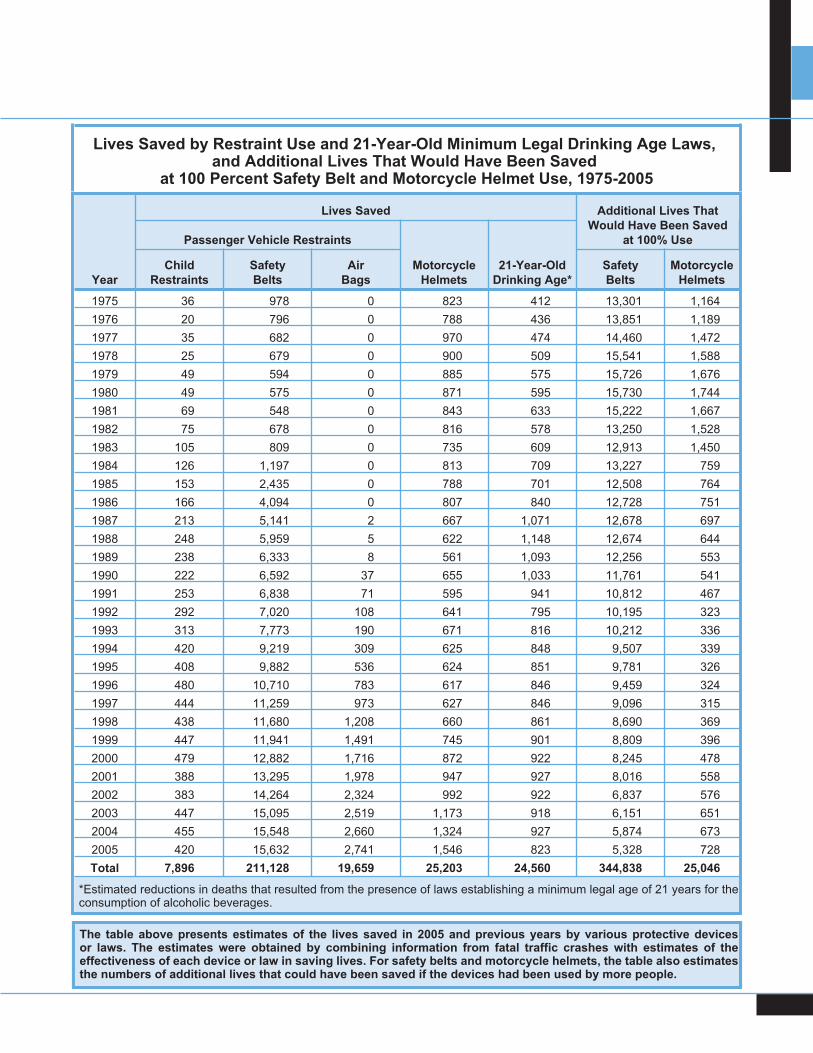
Year
Lives Saved Additional Lives That
Would Have Been Saved
at 100% UsePassenger Vehicle Restraints
Motorcycle
Helmets
21-Year-Old
Drinking Age*
Child
Restraints
Safety
Belts
Air
Bags
Safety
Belts
Motorcycle
Helmets
1975 36 978 0 823 412 13,301 1,164
1976 20 796 0 788 436 13,851 1,189
1977 35 682 0 970 474 14,460 1,472
1978 25 679 0 900 509 15,541 1,588
1979 49 594 0 885 575 15,726 1,676
1980 49 575 0 871 595 15,730 1,744
1981 69 548 0 843 633 15,222 1,667
1982 75 678 0 816 578 13,250 1,528
1983 105 809 0 735 609 12,913 1,450
1984 126 1,197 0 813 709 13,227 759
1985 153 2,435 0 788 701 12,508 764
1986 166 4,094 0 807 840 12,728 751
1987 213 5,141 2 667 1,071 12,678 697
1988 248 5,959 5 622 1,148 12,674 644
1989 238 6,333 8 561 1,093 12,256 553
1990 222 6,592 37 655 1,033 11,761 541
1991 253 6,838 71 595 941 10,812 467
1992 292 7,020 108 641 795 10,195 323
1993 313 7,773 190 671 816 10,212 336
1994 420 9,219 309 625 848 9,507 339
1995 408 9,882 536 624 851 9,781 326
1996 480 10,710 783 617 846 9,459 324
1997 444 11,259 973 627 846 9,096 315
1998 438 11,680 1,208 660 861 8,690 369
1999 447 11,941 1,491 745 901 8,809 396
2000 479 12,882 1,716 872 922 8,245 478
2001 388 13,295 1,978 947 927 8,016 558
2002 383 14,264 2,324 992 922 6,837 576
2003 447 15,095 2,519 1,173 918 6,151 651
2004 455 15,548 2,660 1,324 927 5,874 673
2005 420 15,632 2,741 1,546 823 5,328 728
Total 7,896 211,128 19,659 25,203 24,560 344,838 25,046
*Estimated reductions in deaths that resulted from the presence of laws establishing a minimum legal age of 21 years for theconsumption of alcoholic beverages.
Lives Saved by Restraint Use and 21-Year-Old Minimum Legal Drinking Age Laws,and Additional Lives That Would Have Been Saved
at 100 Percent Safety Belt and Motorcycle Helmet Use, 1975-2005
The table above presents estimates of the lives saved in 2005 and previous years by various protective devicesor laws. The estimates were obtained by combining information from fatal traffic crashes with estimates of theeffectiveness of each device or law in saving lives. For safety belts and motorcycle helmets, the table also estimatesthe numbers of additional lives that could have been saved if the devices had been used by more people.
Index
Glossary
GES Technical Notes
GES Data Elements
FARS Data Elements
Chapter 5 � States
Chapter 4 � People
Chapter 3 �Vehicles
Chapter 2 � Crashes
Chapter 1 �Trends
Data Availability
About This Report
GES Operations
FARS Operations
Introduction
DOT HS 810 631


