44
Training on STR Typing Using Commercial Kits and ABI 310/3100 Margaret C. Kline, Janette W. Redman, John M. Butler National Institute of Standards and Technology October 22-26, 2001
Training on STR Typing Using Commercial Kits and
ABI 310/3100Margaret C. Kline, Janette W. Redman,
John M. ButlerNational Institute of Standards and Technology
October 22-26, 2001
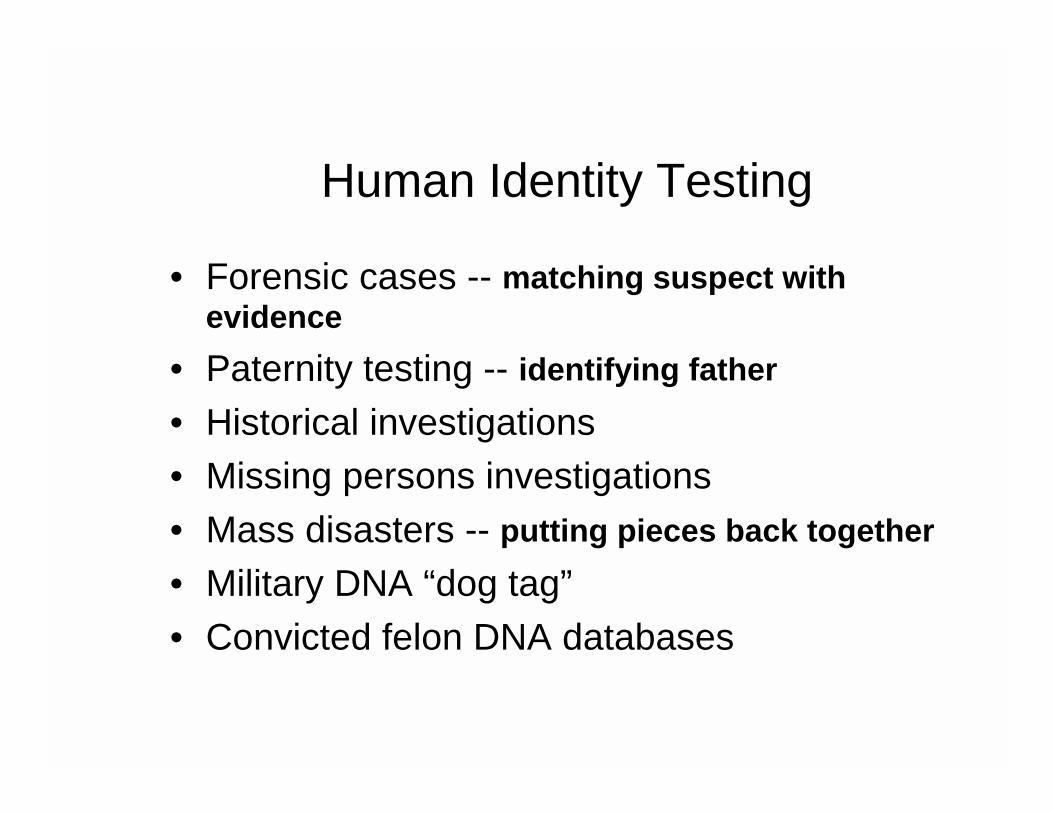
Human Identity Testing
• Forensic cases -- matching suspect with evidence
• Paternity testing -- identifying father• Historical investigations• Missing persons investigations• Mass disasters -- putting pieces back together• Military DNA “dog tag”• Convicted felon DNA databases

DNA Quantitation using Slot Blot
AMEL
D3
TH01 TPOX
Penta DPenta E
FGAD21 D18
CSFD16D7
D13D5VWA D8
PCR Amplification with Fluorescent STR Kits and Separation with Capillary Electrophoresis
Blood Stain
Overview of Steps Involved in DNA Typing
Genotyping by Comparison to Allelic Ladder

Sample Obtained from Crime Scene or Paternity
Investigation
DNAExtraction
DNAExtraction
DNAQuantitation
DNAQuantitation
PCR Amplificationof Multiple STR markers
PCR Amplificationof Multiple STR markers
Biology
Separation and Detection of PCR Products(STR Alleles)
TechnologySample Genotype
Determination
GeneticsComparison of Sample
Genotype to Other Sample Results
If match occurs, comparison of DNA profile to population
databases
Generation of Case Report with Probability
of Random Match
Steps in Sample Processing

Calculation of DNA Quantities in Genomic DNA
Important values for calculations:1 bp = 618 g/mol A: 313 g/mol; T: 304 g/mol; A-T base pairs = 617 g/mol
G: 329 g/mol; C: 289 g/mol; G-C base pairs = 618 g/mol
1 genome copy = ~3 x 10⁹ bp = 23 chromosomes (one member of each pair)
1 mole = 6.02 x 10²³ molecules
Standard DNA typing protocols with PCR amplification of STR markers typically ask for 1 ng of DNA template. How many actual copies of each STR locus exist in 1 ng?
1 genome copy = (~3 x 10⁹ bp) x (618 g/mol/bp) = 1.85 x 10¹² g/mol
= (1.85 x 10¹² g/mol) x (1 mole/6.02 x 1023 molecules)
= 3.08 x 10⁻¹² g = 3.08 picograms (pg)
Since a diploid human cell contains two copies of each chromosome, then
each diploid human cell contains ~6 pg genomic DNA
∴∴∴∴ 1 ng genomic DNA (1000 pg) = ~333 copies of each locus (2 per 167 diploid genomes)

PCR Process
Separate strands
(denature)
Repeat Cycle, Copying DNA Exponentially
Make copies (extend primers)
Starting DNA Template
5’
5’
3’
3’
Add primers (anneal)5’
5’
5’3’ 3’
3’3’5’
Forward primer
Reverse primer
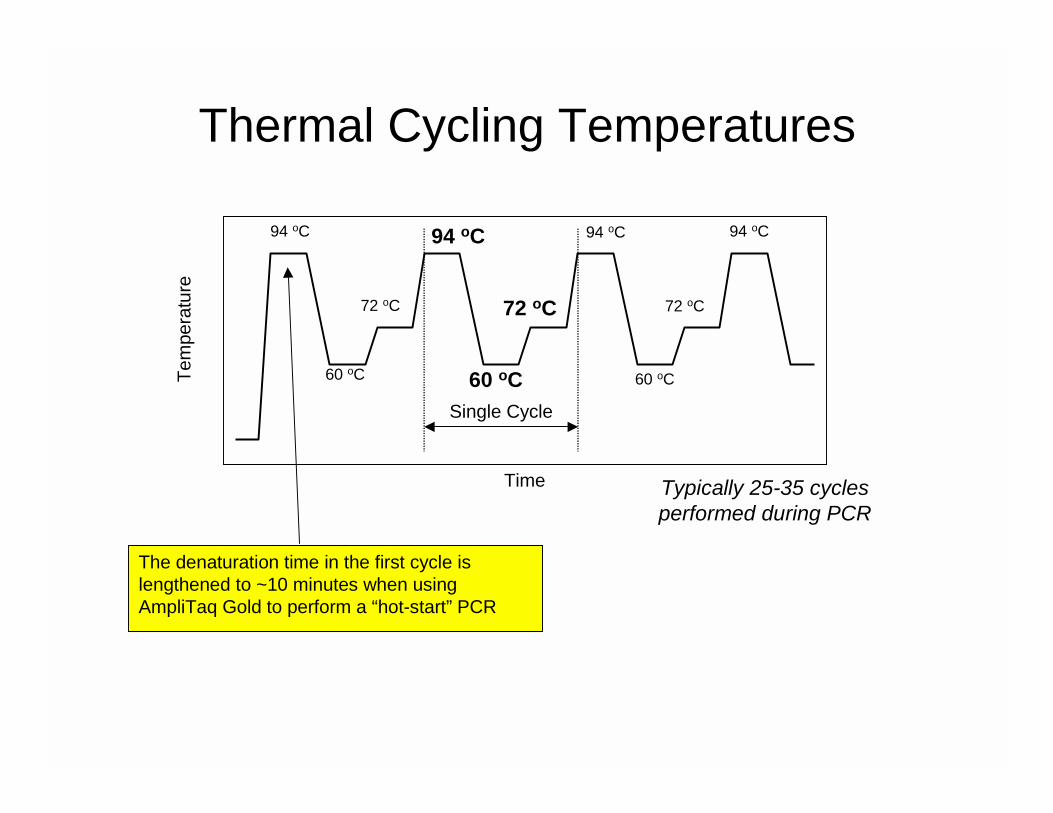
Thermal Cycling Temperatures
94 oC
60 oC
72 oC
Time
Tem
pera
ture
Single Cycle
Typically 25-35 cycles performed during PCR
94 oC 94 oC 94 oC
60 oC60 oC
72 oC72 oC
The denaturation time in the first cycle is lengthened to ~10 minutes when usingAmpliTaq Gold to perform a “hot-start” PCR

Thermal Cycling Parameters
Initial Incubation 95 oC for 11 minutes 95 oC for 11 minutes
Thermal Cycling 28 cycles 30 cyclesa
Denature 94 oC for 1 minute 94 oC for 30 seconds (cycle 1-10)90 oC for 30 seconds (cycle 11-30)
Anneal 59 oC for 1 minute 60 oC for 30 seconds
Extend 72 oC for 1 minute 70 oC for 45 seconds
Final Extension 60 oC for 45 minutes 60 oC for 30 minutes
Final Soak 25 oC (until samples removed)
4 oC (until samples removed)
a) The first 10 cycles are run with a denaturation temperature of 94 oC and the last 20 cycles are run at 90 oC instead. The Promega PowerPlex 1.1 and 2.1 kits also use specific ramp times between the different temperature steps that differ from the conventional 1 oC/second.
Step in Protocol AmpFlSTR® kits(Applied Biosystems)
GenePrint® STR kits(Promega Corporation)

Advantages of PCR
• Minute amounts of DNA template may be used from as little as a single cell.
• DNA degraded to fragments only a few hundred base pairs in length can serve as effective templates for amplification.
• Large numbers of copies of specific DNA sequences can be amplified simultaneously with multiplex PCR reactions.
• Contaminant DNA, such as fungal and bacterial sources, will not amplify because human-specific primers are used.
• Commercial kits are now available for easy PCR reaction setup and amplification.
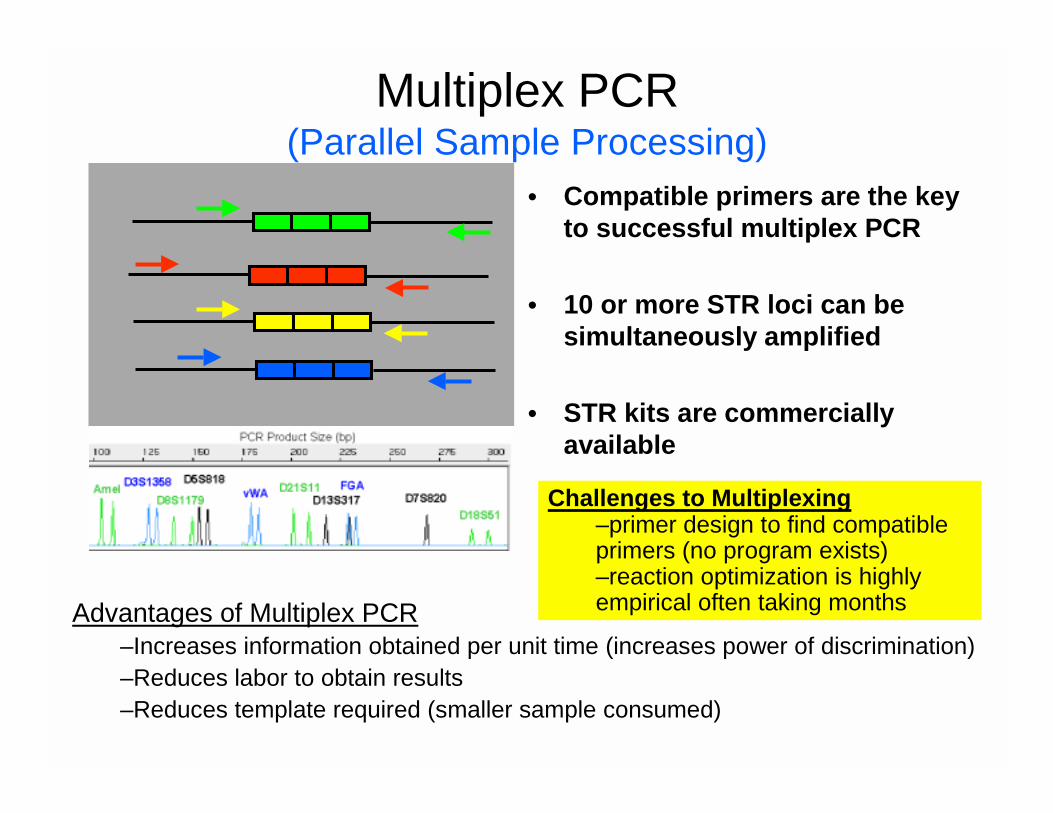
Multiplex PCR (Parallel Sample Processing)
• Compatible primers are the key to successful multiplex PCR
• 10 or more STR loci can be simultaneously amplified
• STR kits are commercially available
Advantages of Multiplex PCR–Increases information obtained per unit time (increases power of discrimination)–Reduces labor to obtain results–Reduces template required (smaller sample consumed)
Challenges to Multiplexing–primer design to find compatible primers (no program exists)–reaction optimization is highly empirical often taking months

Potential Pitfalls of PCR• The target DNA template may not amplify due to the
presence of PCR inhibitors in the extracted DNA
• Amplification may fail due to sequence changes in the primer binding region of the genomic DNA template
• Contamination from other human DNA sources besides the forensic evidence at hand or previously amplified DNA samples is possible without careful laboratory technique and validated protocols
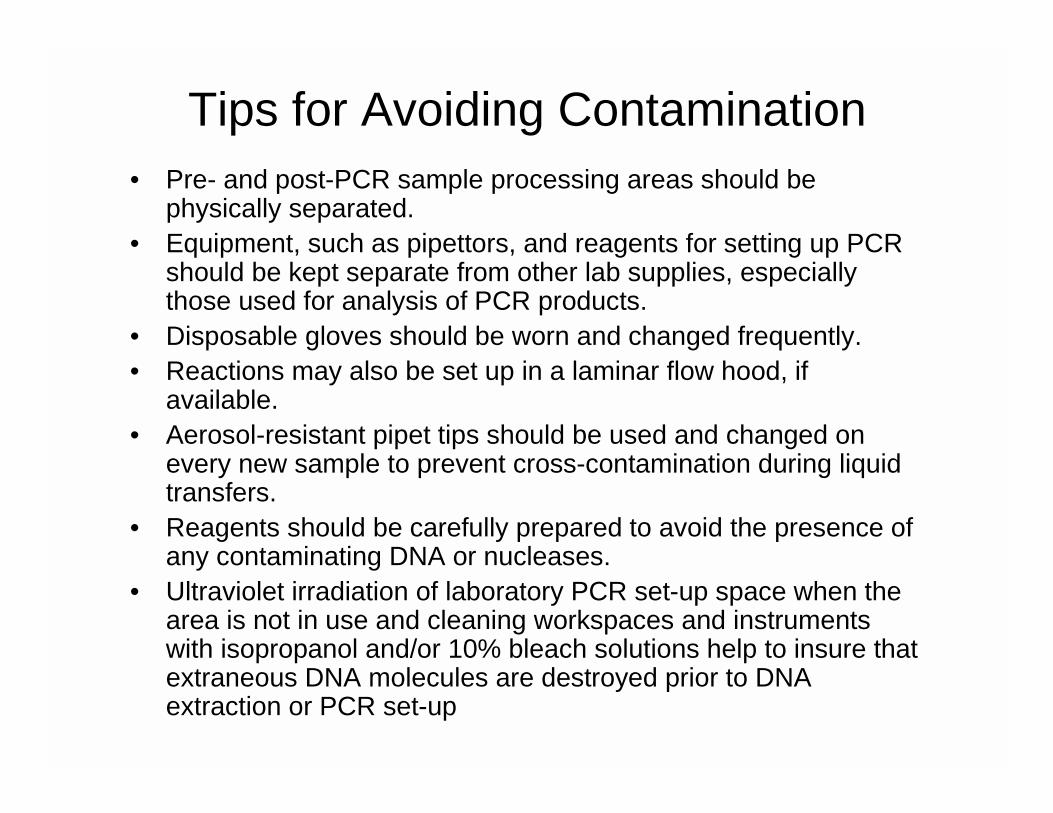
Tips for Avoiding Contamination• Pre- and post-PCR sample processing areas should be
physically separated. • Equipment, such as pipettors, and reagents for setting up PCR
should be kept separate from other lab supplies, especially those used for analysis of PCR products.
• Disposable gloves should be worn and changed frequently.• Reactions may also be set up in a laminar flow hood, if
available.• Aerosol-resistant pipet tips should be used and changed on
every new sample to prevent cross-contamination during liquid transfers.
• Reagents should be carefully prepared to avoid the presence of any contaminating DNA or nucleases.
• Ultraviolet irradiation of laboratory PCR set-up space when the area is not in use and cleaning workspaces and instruments with isopropanol and/or 10% bleach solutions help to insure that extraneous DNA molecules are destroyed prior to DNA extraction or PCR set-up
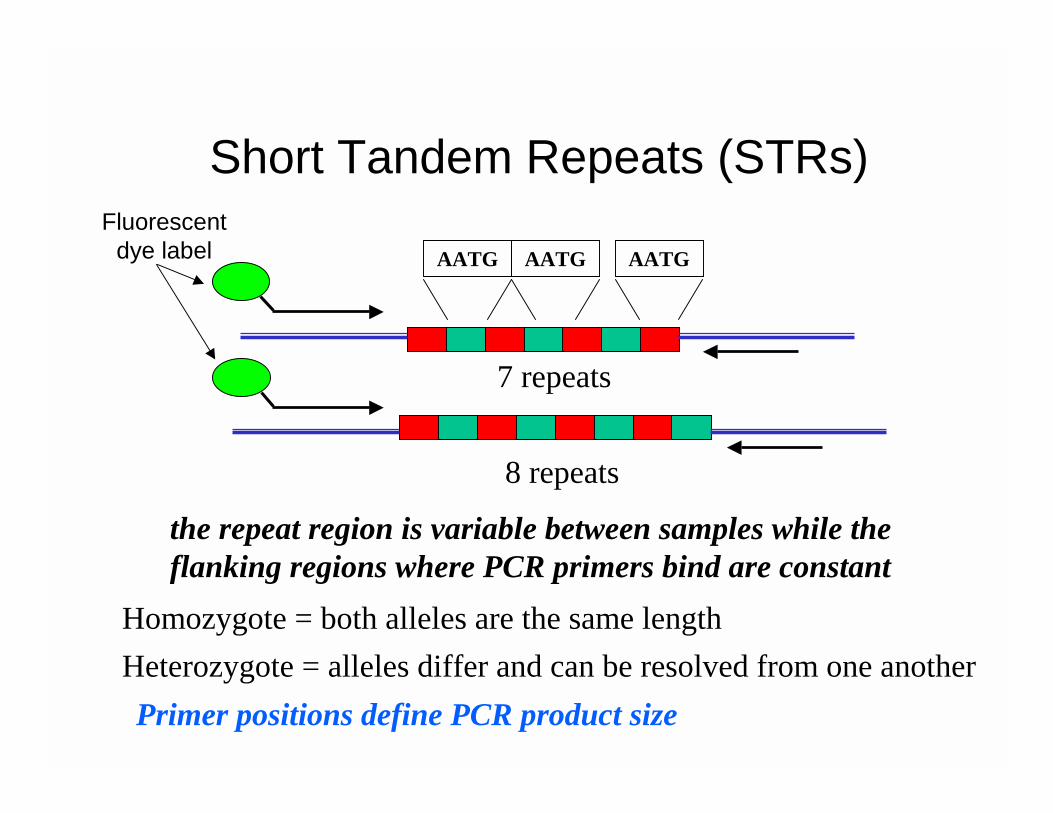
Short Tandem Repeats (STRs)
the repeat region is variable between samples while the flanking regions where PCR primers bind are constant
AATG
7 repeats
8 repeats
AATG AATG
Homozygote = both alleles are the same lengthHeterozygote = alleles differ and can be resolved from one anotherPrimer positions define PCR product size
Fluorescent dye label
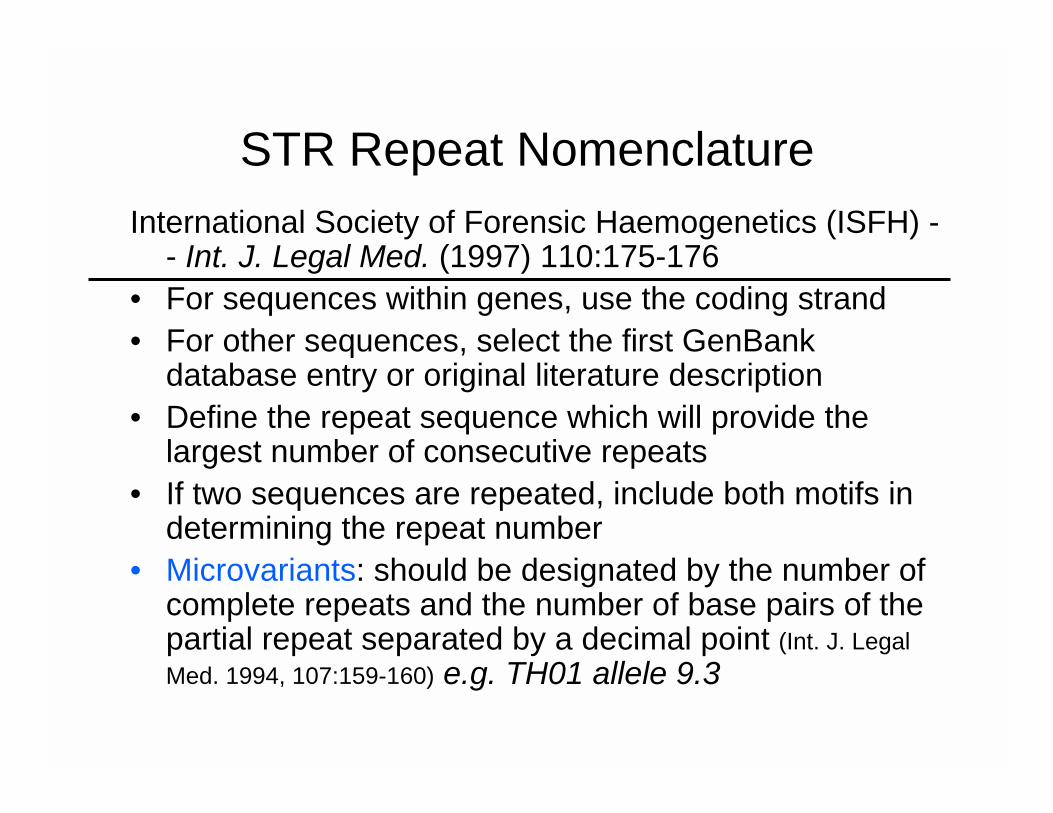
STR Repeat NomenclatureInternational Society of Forensic Haemogenetics (ISFH) -
- Int. J. Legal Med. (1997) 110:175-176• For sequences within genes, use the coding strand• For other sequences, select the first GenBank
database entry or original literature description• Define the repeat sequence which will provide the
largest number of consecutive repeats• If two sequences are repeated, include both motifs in
determining the repeat number• Microvariants: should be designated by the number of
complete repeats and the number of base pairs of the partial repeat separated by a decimal point (Int. J. Legal Med. 1994, 107:159-160) e.g. TH01 allele 9.3

Why STRs are Preferred Genetic Markers
• Rapid processing is attainable• Abundant throughout the genome• Highly variable within various populations• Small size range allows multiplex development• Discrete alleles allow digital record of data• Allelic ladders simplify interpretation• PCR allows use of small amounts of DNA material• Small product size compatible with degraded DNA

Microvariant allele
STR genotyping is performed by comparison of sample data to allelic ladders

Allelic Ladder FormationSeparate PCR products from various samples amplified with primers targeted to a particular STR locus
Combine
Re-amplify
Find representative alleles spanning population variation
Polyacrylamide Gel
CSF1PO
D5S818
D21S11
TH01
TPOX
D13S317
D7S820
D16S539 D18S51
D8S1179
D3S1358
FGAVWA
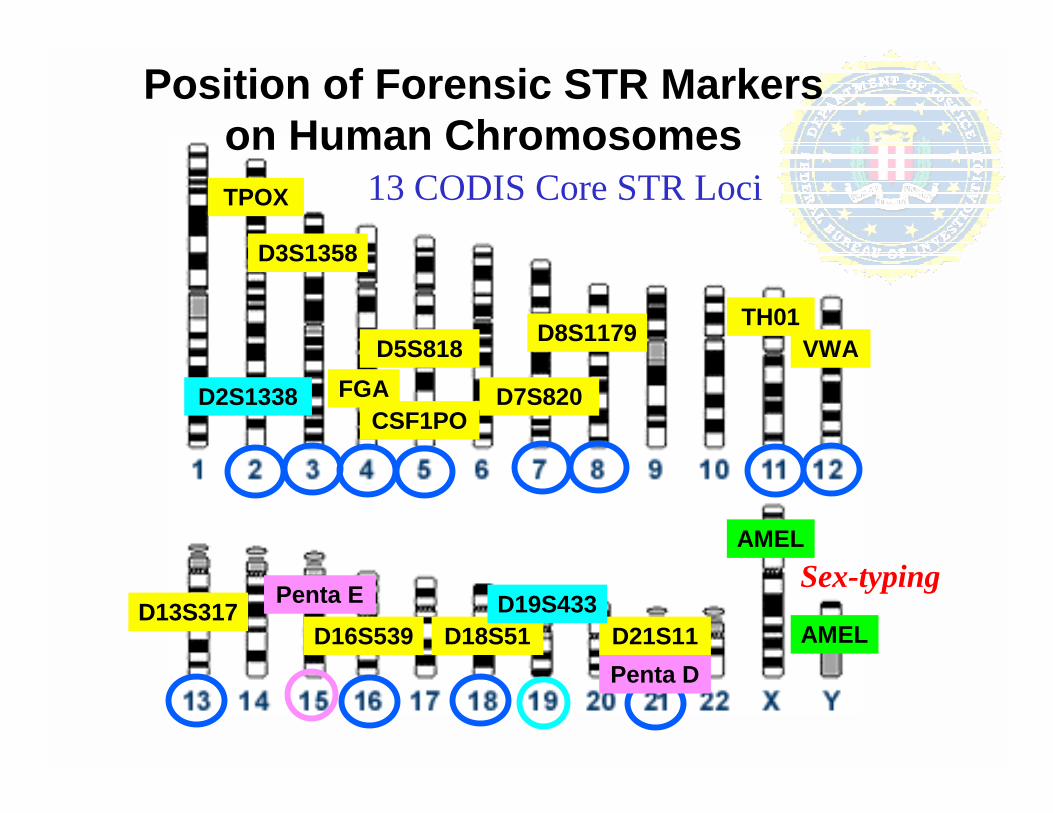
13 CODIS Core STR Loci
AMEL
AMEL
Sex-typing
Position of Forensic STR Markers on Human Chromosomes
Penta E
Penta D
D2S1338
D19S433

Information on 13 CODIS STRs
D18S51 18q21.3 AGAA L18333 13 7-27 43
Locus Name
Chromosomal Location
Repeat MotifISFH format
GenBankAccession
Allele inGenBank
Allele Range
Number of Alleles Seen
CSF1PO 5q33.3-34 TAGA X14720 12 6-16 15
FGA 4q28 CTTT M64982 21 15-51.2 69
TH01 11p15.5 TCAT D00269 9 3-14 20
TPOX 2p23-pter GAAT M68651 11 6-13 10
VWA 12p12-pter [TCTG][TCTA] M25858 18 10-24 28
D3S1358 3p [TCTG][TCTA] NT_005997 18 9-20 20
D5S818 5q21-31 AGAT G08446 11 7-16 10
D7S820 7q11.21-22 GATA G08616 12 6-15 22
D8S1179 8 [TCTA][TCTG] G08710 12 8-19 13
D13S317 13q22-31 TATC G09017 13 5-15 14
D16S539 16q24-qter GATA G07925 11 5-15 10
D21S11 21q21 Complex [TCTA][TCTG]
AP000433 29 24-38 70
*
* Butler, Forensic DNA Typing, Appendix 1
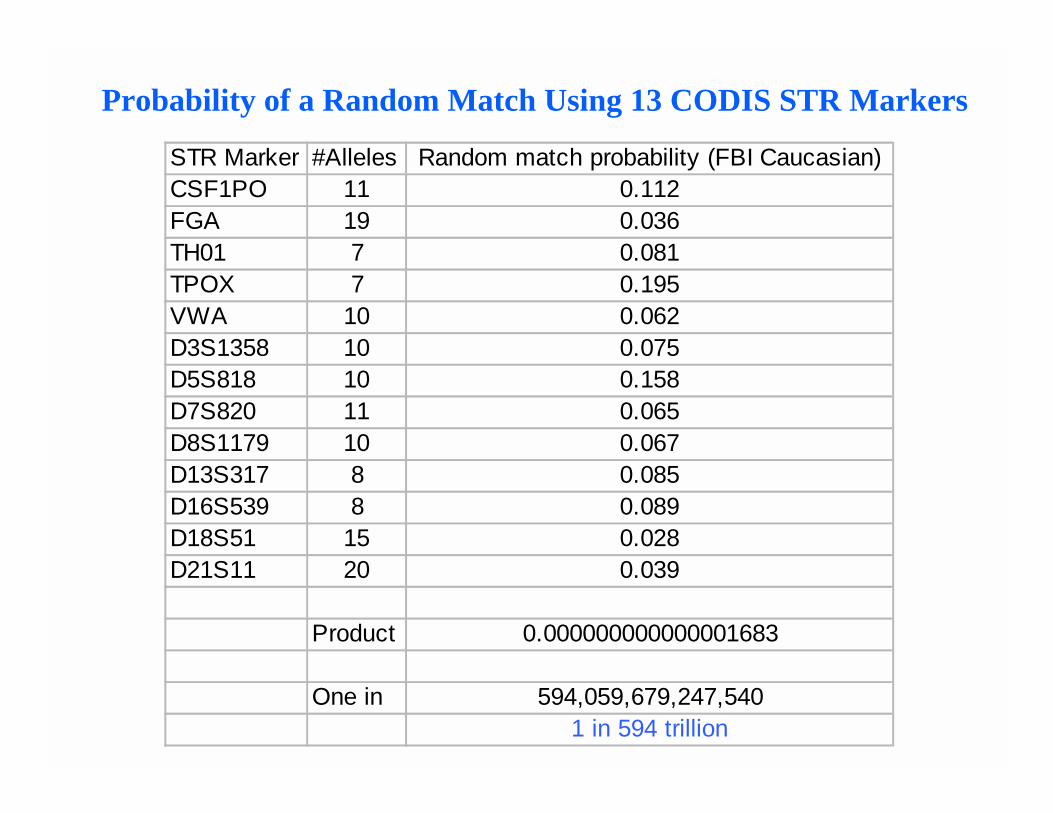
STR Marker #Alleles Random match probability (FBI Caucasian)CSF1PO 11 0.112FGA 19 0.036TH01 7 0.081TPOX 7 0.195VWA 10 0.062D3S1358 10 0.075D5S818 10 0.158D7S820 11 0.065D8S1179 10 0.067D13S317 8 0.085D16S539 8 0.089D18S51 15 0.028D21S11 20 0.039
Product 0.000000000000001683
One in 594,059,679,247,5401 in 594 trillion
Probability of a Random Match Using 13 CODIS STR Markers
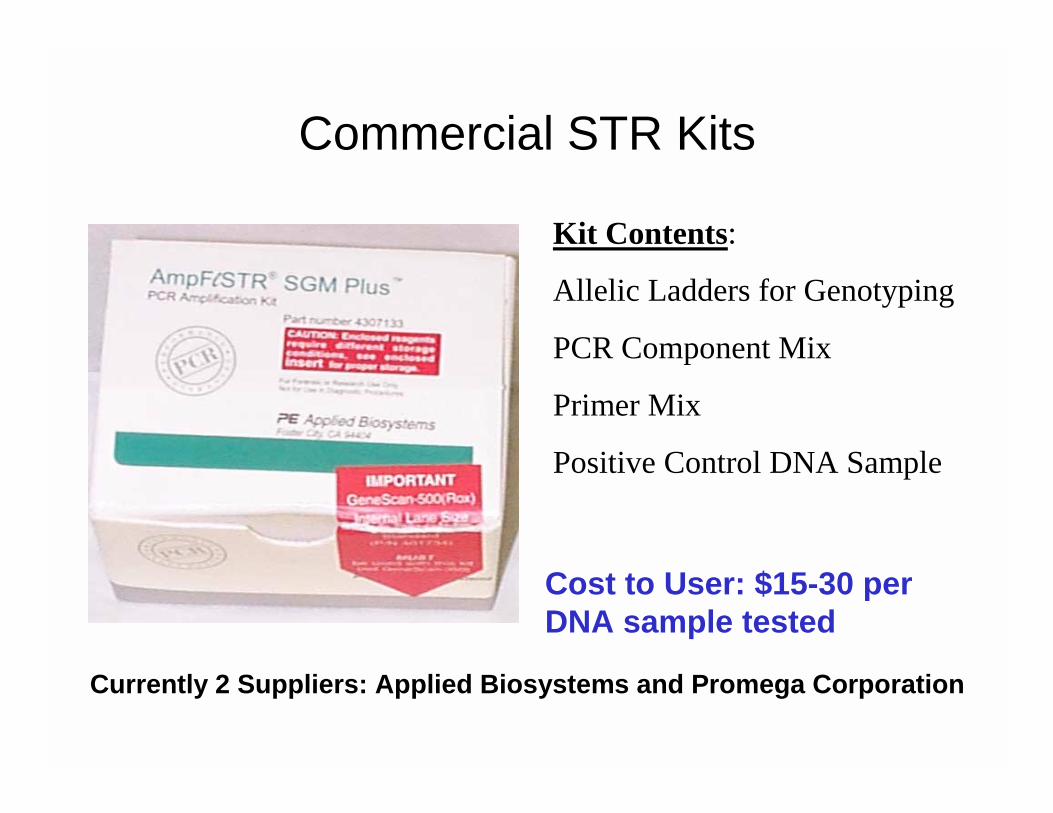
Commercial STR Kits
Kit Contents:
Allelic Ladders for Genotyping
PCR Component Mix
Primer Mix
Positive Control DNA Sample
Currently 2 Suppliers: Applied Biosystems and Promega Corporation
Cost to User: $15-30 per DNA sample tested

Value of STR KitsAdvantages• Quality control of materials is in the hands of the
manufacturer• Improves consistency in results across laboratories –
same allelic ladders used• Common loci and PCR conditions used – aids DNA
databasing efforts• Simpler for the user to obtain results
Disadvantages• Contents may not be completely known to the user
(e.g., primer sequences)• Higher cost to obtain results FSS: 5X higher cost
with SGM Plus kitFSS: 5X higher cost with SGM Plus kit
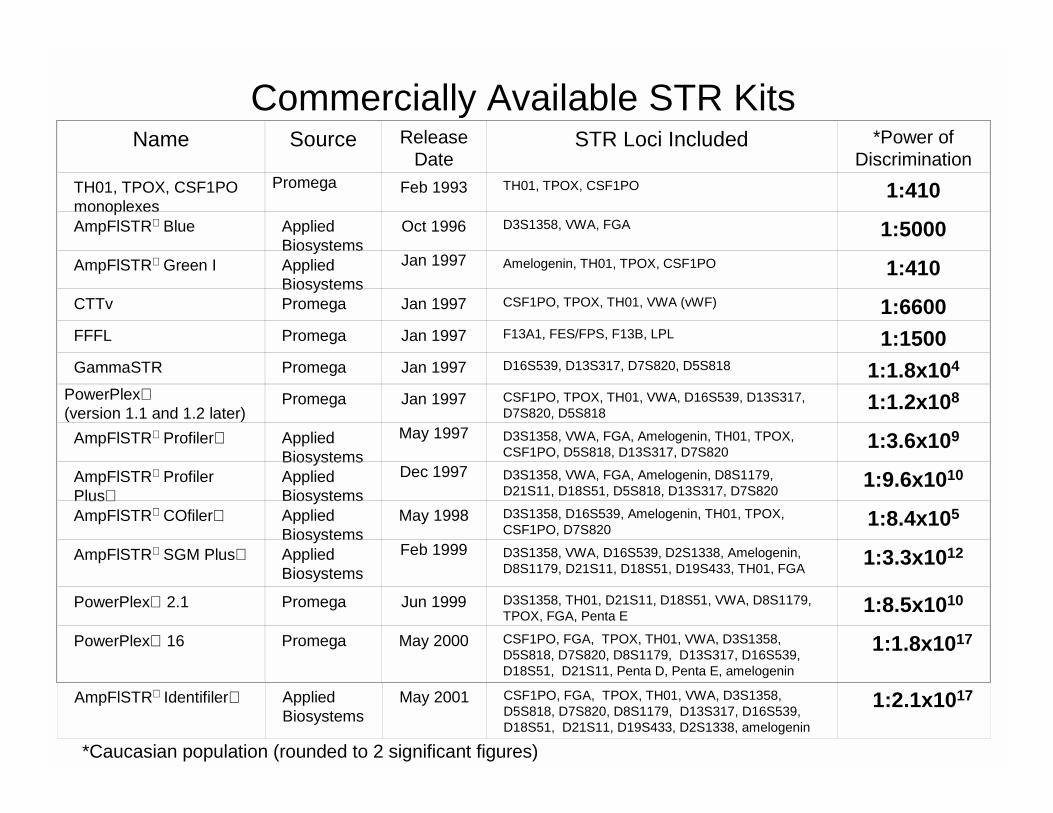
Commercially Available STR Kits
*Caucasian population (rounded to 2 significant figures)
Name Source Release Date
STR Loci Included *Power of Discrimination
TH01, TPOX, CSF1PO monoplexes
Promega Feb 1993 TH01, TPOX, CSF1PO 1:410AmpFlSTR Blue Applied
BiosystemsOct 1996 D3S1358, VWA, FGA 1:5000
AmpFlSTR Green I Applied Biosystems
Jan 1997 Amelogenin, TH01, TPOX, CSF1PO 1:410CTTv Promega Jan 1997 CSF1PO, TPOX, TH01, VWA (vWF) 1:6600FFFL Promega Jan 1997 F13A1, FES/FPS, F13B, LPL 1:1500GammaSTR Promega Jan 1997 D16S539, D13S317, D7S820, D5S818 1:1.8x10⁴
PowerPlex(version 1.1 and 1.2 later)
Promega Jan 1997 CSF1PO, TPOX, TH01, VWA, D16S539, D13S317, D7S820, D5S818 1:1.2x10⁸
AmpFlSTR Profiler Applied Biosystems
May 1997 D3S1358, VWA, FGA, Amelogenin, TH01, TPOX, CSF1PO, D5S818, D13S317, D7S820 1:3.6x10⁹
AmpFlSTR Profiler Plus
Applied Biosystems
Dec 1997 D3S1358, VWA, FGA, Amelogenin, D8S1179, D21S11, D18S51, D5S818, D13S317, D7S820 1:9.6x10¹⁰
AmpFlSTR COfiler Applied Biosystems
May 1998 D3S1358, D16S539, Amelogenin, TH01, TPOX, CSF1PO, D7S820 1:8.4x10⁵
AmpFlSTR SGM Plus Applied Biosystems
Feb 1999 D3S1358, VWA, D16S539, D2S1338, Amelogenin, D8S1179, D21S11, D18S51, D19S433, TH01, FGA 1:3.3x10¹²
PowerPlex 2.1 Promega Jun 1999 D3S1358, TH01, D21S11, D18S51, VWA, D8S1179, TPOX, FGA, Penta E 1:8.5x10¹⁰
PowerPlex 16 Promega May 2000 CSF1PO, FGA, TPOX, TH01, VWA, D3S1358, D5S818, D7S820, D8S1179, D13S317, D16S539, D18S51, D21S11, Penta D, Penta E, amelogenin
1:1.8x10¹⁷
AmpFlSTR Identifiler AppliedBiosystems
May 2001 CSF1PO, FGA, TPOX, TH01, VWA, D3S1358, D5S818, D7S820, D8S1179, D13S317, D16S539, D18S51, D21S11, D19S433, D2S1338, amelogenin
1:2.1x10¹⁷

Profiler Plus
COfiler
SGM Plus
Green I
Profiler
Blue
TH01
Amel D16S539D7S820
CSF1POTPOX
D3S1358
D16S539 D18S51D21S11
Amel
Amel
D3S1358
D3S1358
D18S51D21S11
D8S1179
D7S820
D13S317D5S818
D19S433 D2S1338
FGAvWA
vWA
FGA
TH01
D3S1358 vWA FGA
D7S820D5S818D13S317
TH01CSF1POTPOX
D8S1179
vWATH01 CSF1PO
TPOXAmel FGAD3S1358
Amel
PCR Product Size (bp) Same DNA Sample Run with Each of the ABI STR Kits
Power of Discrimination1:5000
1:410
1:3.6 x 10⁹
1:9.6 x 10¹⁰
1:8.4 x 10⁵
1:3.3 x 10¹²
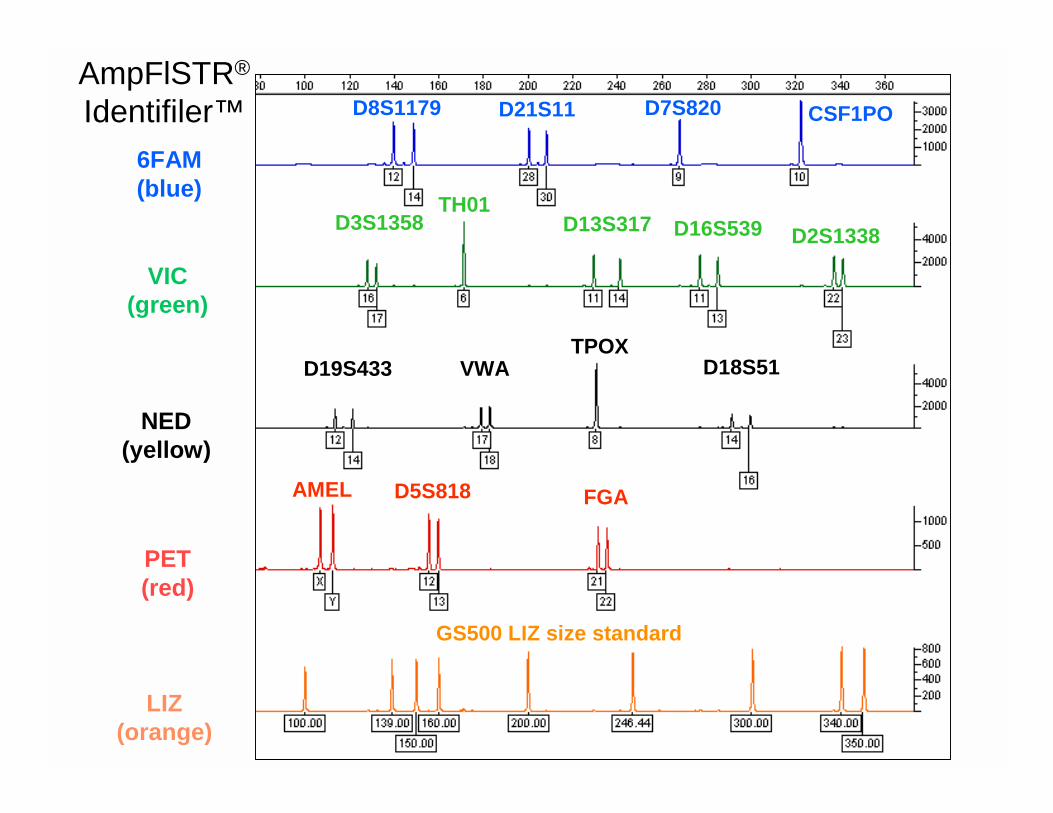
D8S1179 D21S11 D7S820 CSF1PO
D3S1358TH01
D13S317 D16S539 D2S1338
D19S433 D18S51TPOX
VWA
AMEL D5S818 FGA
GS500 LIZ size standard
6FAM (blue)
VIC (green)
NED (yellow)
PET (red)
LIZ (orange)
AmpFlSTR®
Identifiler™

Requirements for Accurate STR Typing
• High precision (to permit comparison of allelic ladders to sequentially processed STR samples)
• Color separation of different dye sets used (to avoid bleed through between different colors)
• Resolution of at least 1 bp to >300 bp (to detect microvariants)
• Reliable sizing over 75-450 bp region
Accurate typing can be achieved with ABI 310Accurate typing can be achieved with ABI 310

Components of ABI 310
• Chemistry– STR kits, fluorescent dyes, matrix samples,
capillary, buffers, polymer, formamide• Hardware
– CCD camera, laser, electrodes, pump block, hot plate for temperature control, autosampler
• Software– Data collection, color separation, peak sizing &
calling, genotyping, stutter removal
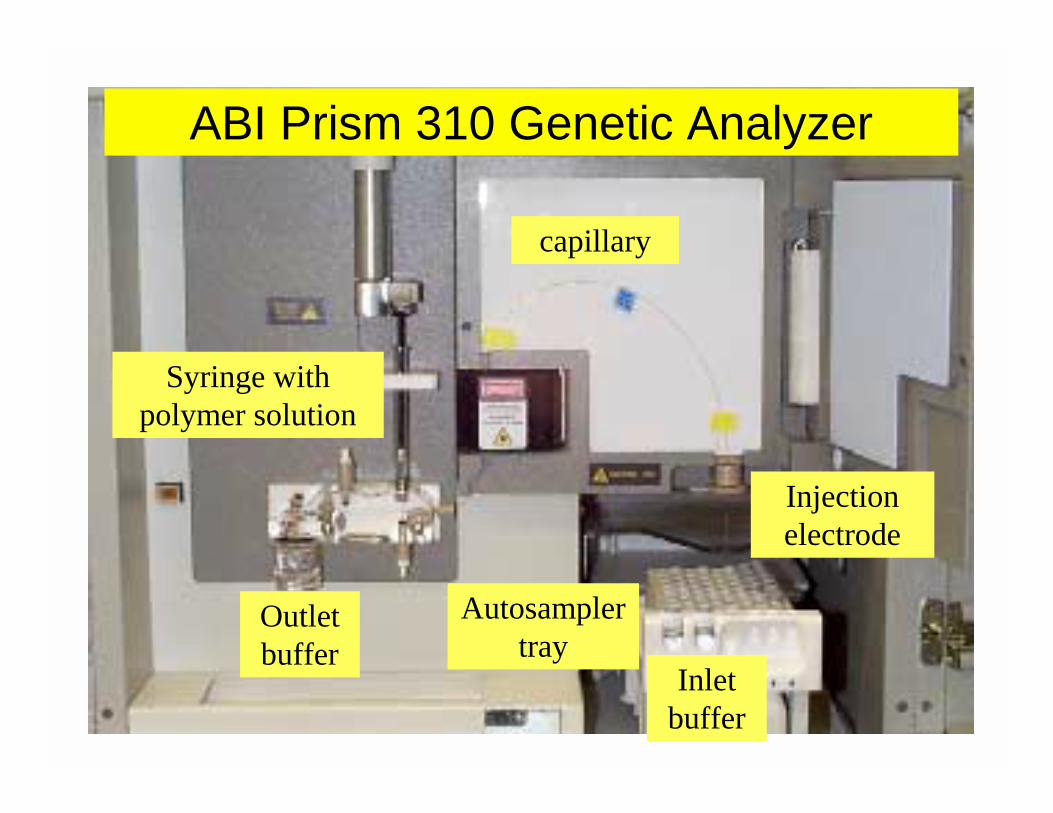
ABI Prism 310 Genetic Analyzer
capillary
Syringe with polymer solution
Autosampler tray
Outlet buffer
Injection electrode
Inlet buffer

Sample Detection
CCD Panel
ColorSeparation
Ar+ LASER (488 nm)
Fluorescence ABI Prism spectrograph
Capillary or Gel Lane
Size Separation
Labeled DNA fragments (PCR products)
Detection region
Principles of Sample Separation and Detection
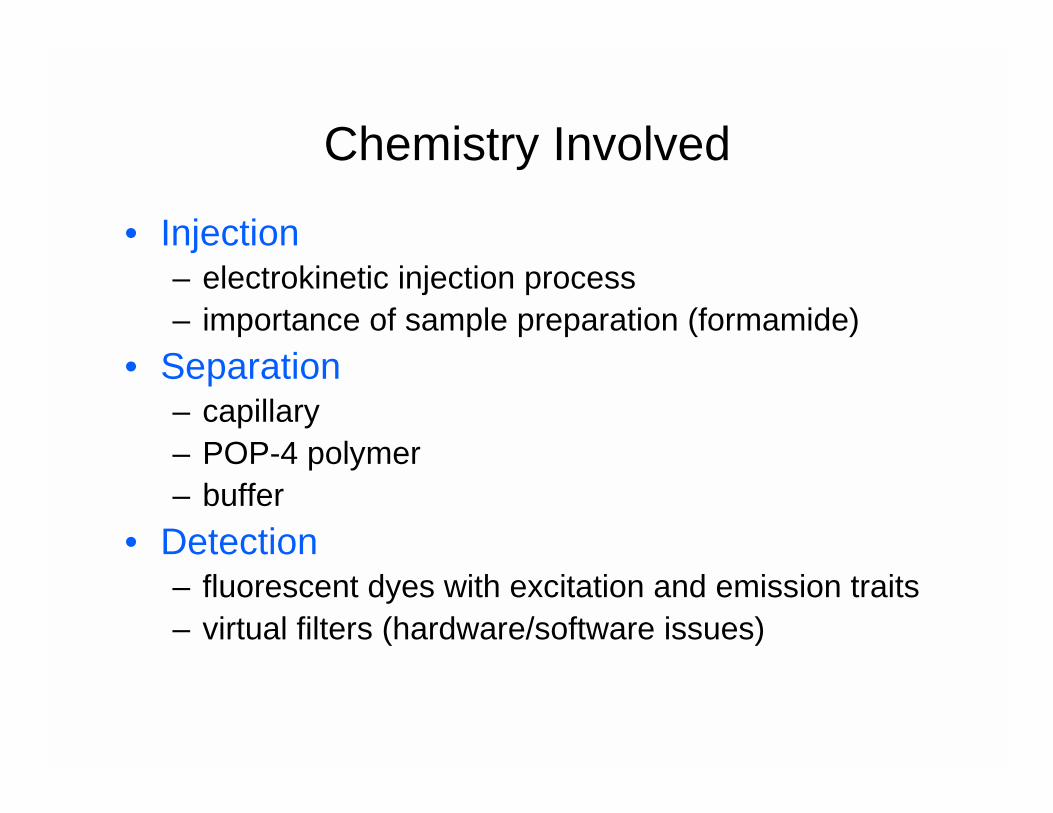
Chemistry Involved
• Injection– electrokinetic injection process– importance of sample preparation (formamide)
• Separation– capillary– POP-4 polymer– buffer
• Detection– fluorescent dyes with excitation and emission traits – virtual filters (hardware/software issues)
Sample Tube
DNA-
-
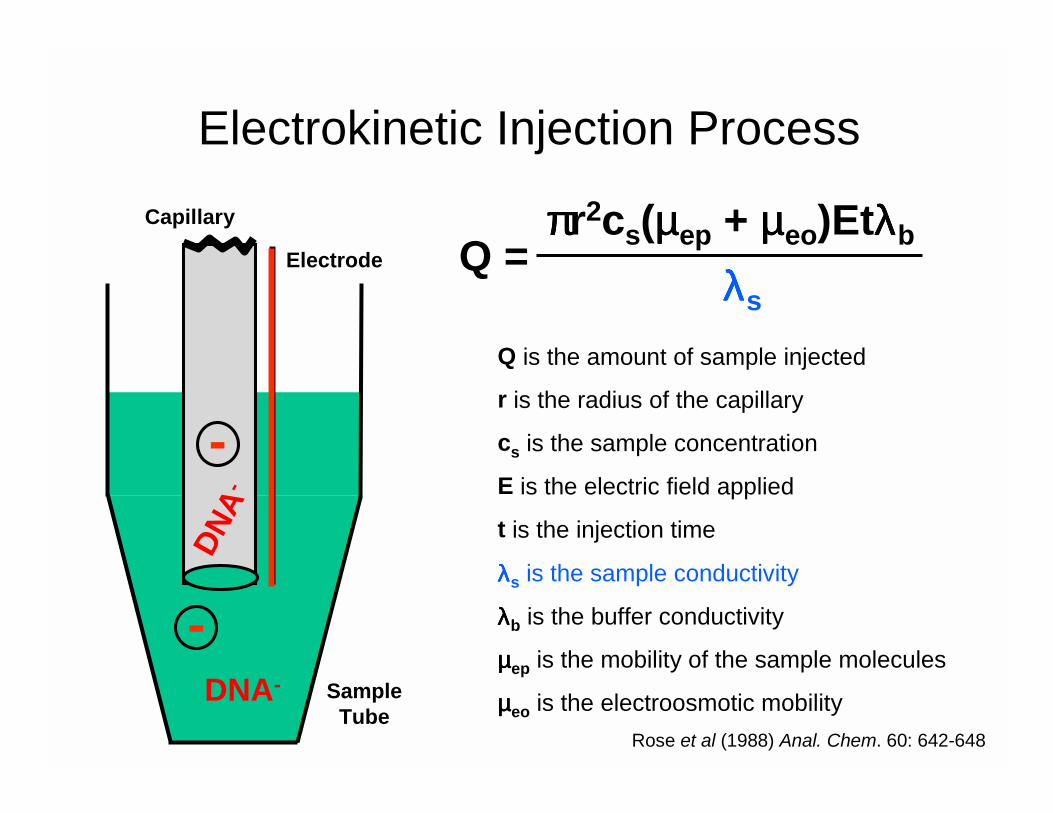
Electrokinetic Injection Process
Electrode
CapillaryDN
A-
-
Q is the amount of sample injected
r is the radius of the capillary
cs is the sample concentration
E is the electric field applied
t is the injection time
λλλλs is the sample conductivity
λλλλb is the buffer conductivity
µµµµep is the mobility of the sample molecules
µµµµeo is the electroosmotic mobilityRose et al (1988) Anal. Chem. 60: 642-648
Q =λλλλs
ππππr2cs(µµµµep + µµµµeo)Etλλλλb

Comments on Sample Preparation
• Use high quality formamide (<100 µS/cm)!– ABI sells Hi-Di formamide– regular formamide can be made more pure with ion exchange
resin
• Deionized water vs. formamide– Biega and Duceman (1999) J. Forensic Sci. 44: 1029-1031– water works fine but samples are not stable as long as with
formamide
• Denaturation with heating and snap cooling– use 480 cycler for heating (holds 0.5 mL tubes) and cold
aluminum block for snap cooling (instead of ice)– heat/cool denaturation step is not always necessary...
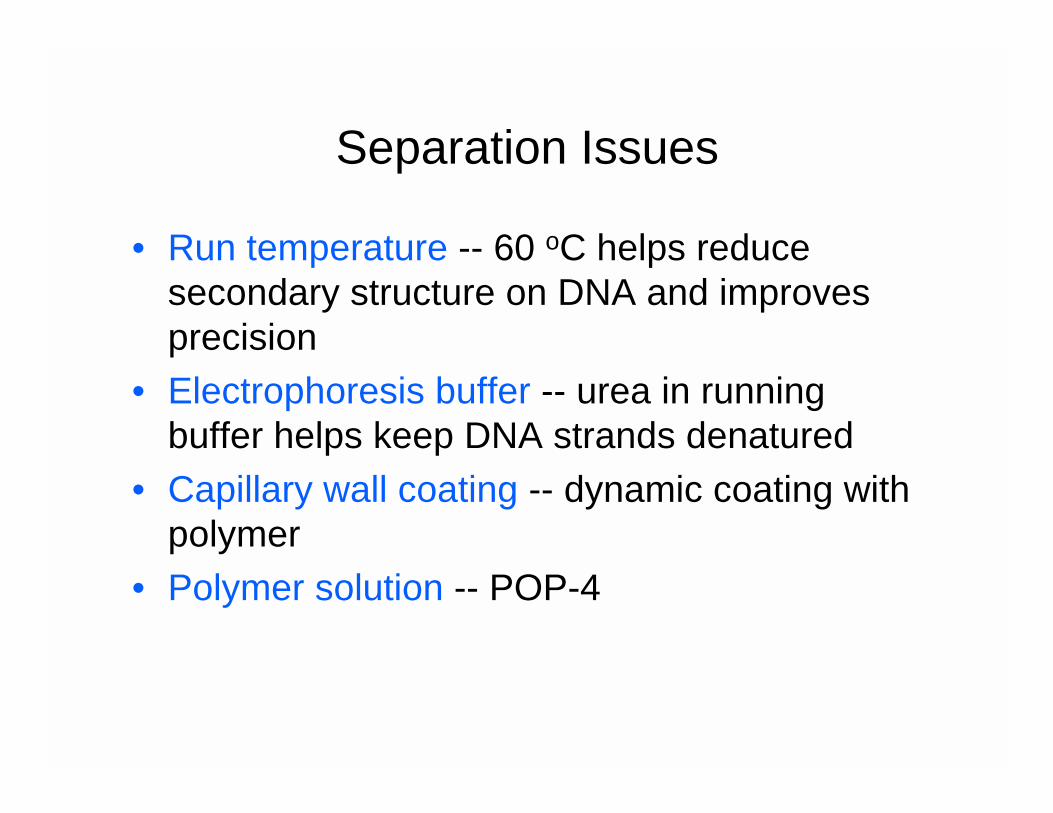
Separation Issues
• Run temperature -- 60 oC helps reduce secondary structure on DNA and improves precision
• Electrophoresis buffer -- urea in running buffer helps keep DNA strands denatured
• Capillary wall coating -- dynamic coating with polymer
• Polymer solution -- POP-4

DNA Separation Mechanism
+- DNA-DNA-
DNA-DNA- DNA-
• Size based separation due to interaction of DNA molecules with entangled polymer strands
• Polymers are not cross-linked (as in slab gels)• “Gel” is not attached to the capillary wall• Pumpable -- can be replaced after each run• Polymer length and concentration determine the separation
characteristics
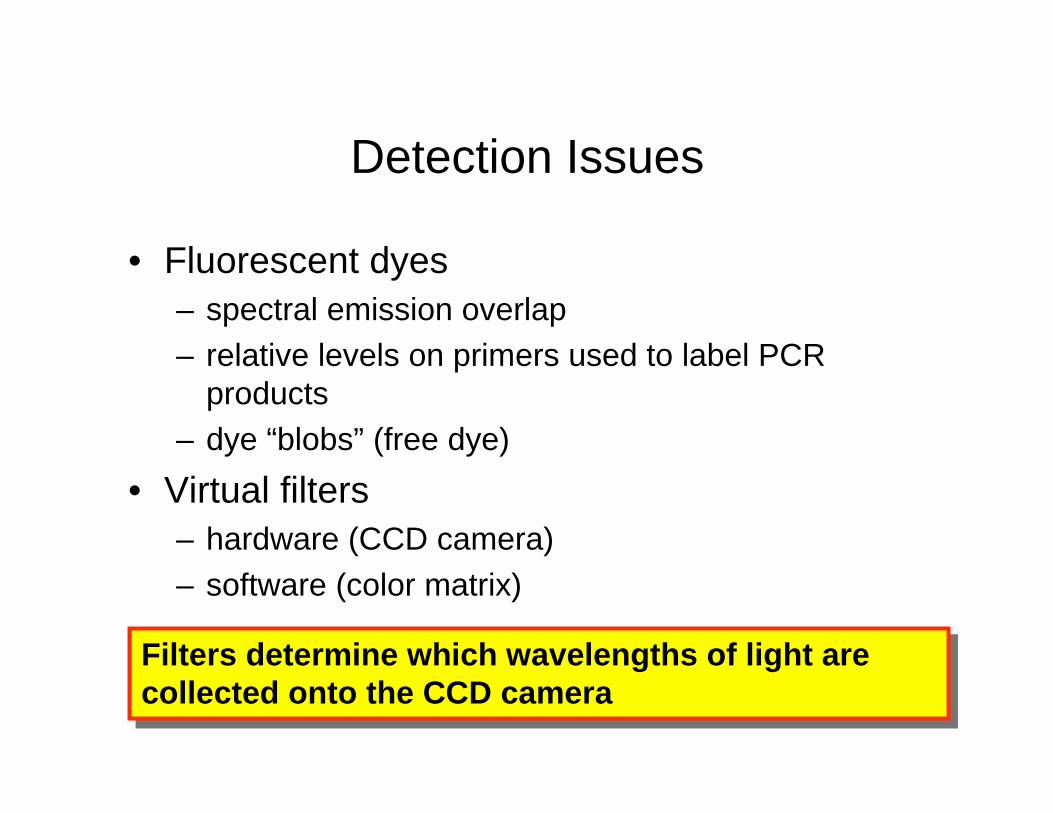
Detection Issues
• Fluorescent dyes– spectral emission overlap– relative levels on primers used to label PCR
products– dye “blobs” (free dye)
• Virtual filters– hardware (CCD camera)– software (color matrix)
Filters determine which wavelengths of light are collected onto the CCD cameraFilters determine which wavelengths of light are collected onto the CCD camera

Laser Used in ABI 310
• Argon Ion Laser• 488 nm and 514.5 nm for excitation of dyes• 10 mW power• Lifetime ~5,000 hours (1 year of full-time use)• Cost to replace ~$5,500• Leads to highest degree of variability between
instruments and is most replaced part• Color separation matrix is specific to laser used
on the instrument

Fluorescent Labeling of PCR Products
• Dyes are attached to one primer in a pair used to amplify a STR marker
• Dyes are coupled to oligonucleotides (primers) through NHS-esters and amine linkages on the 5’end of the primer usually through a 6-carbon spacer ---Dye-(CH2)6-primer
• Dye-labeled oligonucleotide is incorporated into PCR product during multiplex PCR amplification giving a specific color “tag” to each PCR product
• Dyes can be spectrally distinguished using virtual filters and CCD imaging to yield different colored peaks in ABI 310 electropherogram

Dye Blobs
DYS392
DYS438
HEXHEXDYS392
DYS438DYS437
PCR product size (bp)
DYS437Dye blobPoor primer purity
Poor primer purity
• Free dye (not coupled to primer) can be injected into the CE capillary and interfere with detection of true STR alleles
• Dye blobs are wider and usually of less intensity than true STR alleles (amount depends on the purity of the primers used)
• Dye blobs usually appear at an apparent size that is unique for each dye (e.g., HEX ~170 bp)

Fluorescent Dyes Used in 4-Color DetectionFAM (Blue) JOE (Green)
TAMRA (Yellow) ROX (Red)NED
FL
CXR

ABI 310 Filter Set FABI 310 Filter Set F
520 540 560 580 600 620 640WAVELENGTH (nm)
100
80
60
40
20
0
5-FAM JOE NED ROX
Laser excitation(488, 514.5 nm)Laser excitation(488, 514.5 nm)
Nor
mal
ized
Flu
ores
cent
In
tens
ity
Fluorescent Emission Spectra for ABI Dyes
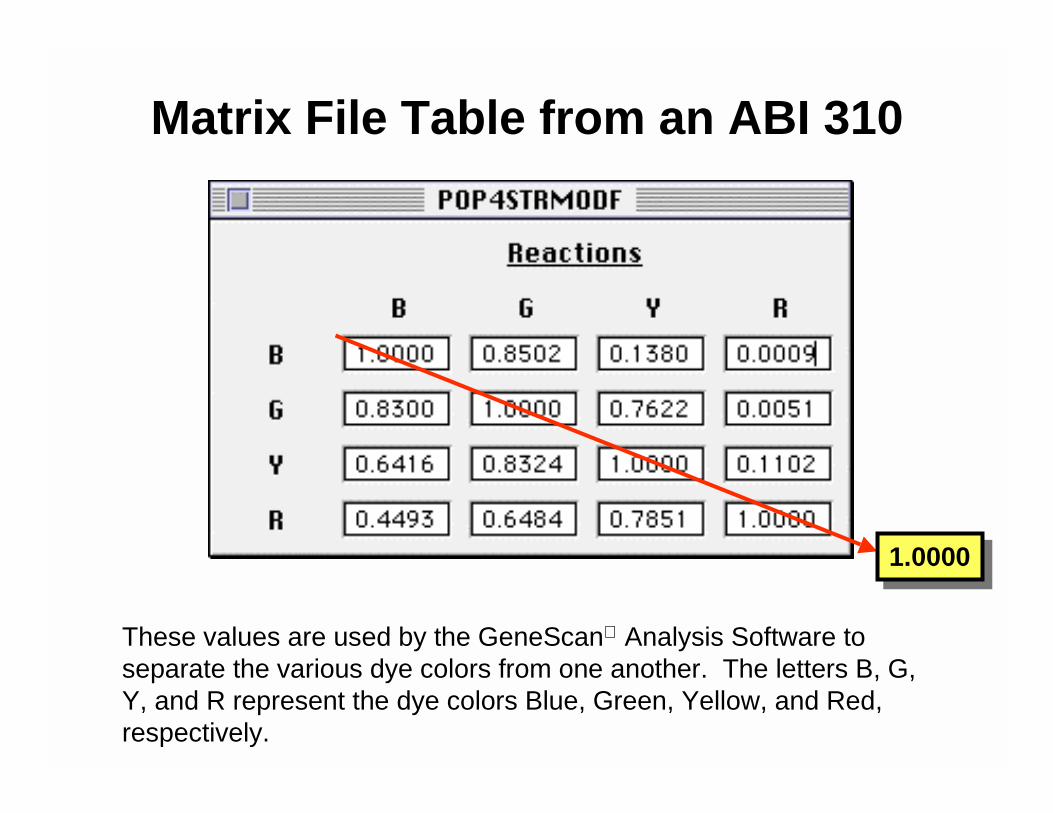
These values are used by the GeneScan Analysis Software to separate the various dye colors from one another. The letters B, G, Y, and R represent the dye colors Blue, Green, Yellow, and Red, respectively.
Matrix File Table from an ABI 310
1.00001.0000
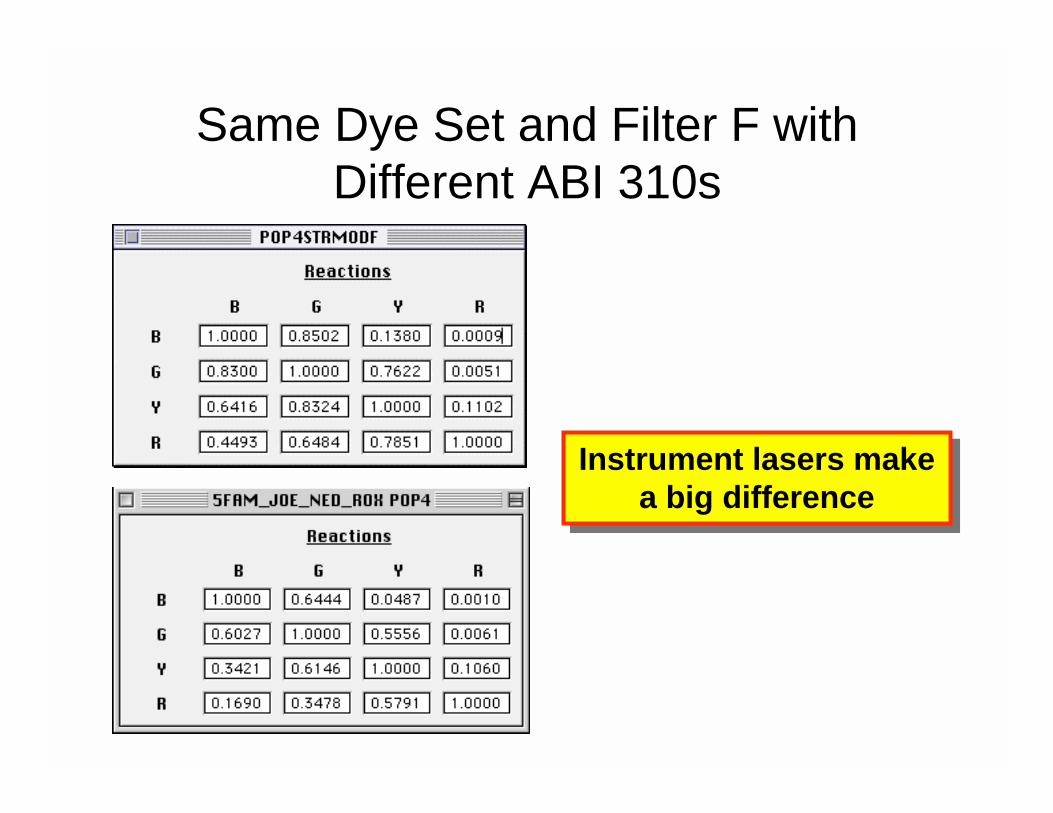
Same Dye Set and Filter F with Different ABI 310s
Instrument lasers make a big difference
Instrument lasers make a big difference

Primary Filter Sets on the ABI 310
Filter AFilter A Filter CFilter C
Filter FFilter F

If Wrong Filter Is Used…Y STR 10plex labeled with FAM, TET, HEX dyes
Filter A
Filter A
Filter F
Filter F
Filter C
Filter C
Peaks change “colors”
Peaks change “colors”


