79
Traitement de première ligne du lymphome folliculaire F Morschhauser DES, 17 novembre ,2017 Centre Hospitalier Universitaire de Lille, France

Traitement de première ligne du
lymphome folliculaire
F Morschhauser
DES, 17 novembre ,2017
Centre Hospitalier Universitaire de Lille, France

What do I say to a newly diagnosed FL patient ?

Until the end of the 20th century:
FL was considered as incurable
Until the end of the 90’s, FL natural history was thought not
to be influenced by any therapeutic strategy 1, 2, 3
1. Horning SJ. Semin Oncol 1993; 20 (Suppl. 5):75–88.2. Swenson WT et al., J Clin Oncol 2005; 23:5019-5026.
3. Lister TA, J Clin Oncol, 2005; 25:4830-31.
Pro
babili
ty (
%)
Years
1960–1976 (195)
1976–1987 (513)
1987–1992 (314)80
60
40
0
0 5 10 15 20 25
20
100
30
Pro
babili
ty (
%)
Months following diagnosis
1993–1999 (5,601)
1986–1999 (4,714)
1978–1985 (4,249)80
60
40
0
0 50 100 150 200 250
20
100
300
Log-rank
P=.006
Log-rank
P=.047

After 2000,
a new hope for FL patients
• Improved overall survival with anti-CD20 antibodies:
─ Multiple randomized trials and series1, plus 1 meta-analysis2
─ Epidemiological surveys: substantial OS improvement3
1. Fisher RI et al, J Clin Oncol 2005;23:8447–52
2. Schulz H et al., Cochrane Database of Systematic Reviews 2007; 4:CD003805.
3. Pulte D et al; Arch Intern Med. 2008;168:469-476.
Observation period
5-year
survival
Probability
(SD)
10-year
Survival
Probability
(SD)
1992-1994 70.7 (1.3) 52.2 (1.6)
2002-2004 84.9 (0.9) 71.5 (1.4)
CHOP + antibody
ProMACE
CHOP
0 2 4 6 8 10
p <0.0001
0
20
40
60
80
100
Overa
ll s
urv
iva
l %
Years

Survival of FL patients in the rituximab era
French 10 year OS: 79.8%
USA 10 year OS: 76.6%Lymphoma: 10 year
estimate: 10.4%
Cause of death
Sarkozy et al, ICML 2017, Abstr 016
OS
N = 1655

Follicular Lymphomaa very heterogeneous lymphoma
• Patients focussed on “I have Stage IV”
Dr Google
• Physician focussed on:– multiple FLIPI & FLIPI2 prognostic factors:
B2M, LDH, Stage, Hb, LODLIN, age, # nodal sites– Treatment criteria (GELF / BNLI) – patient age and comorbidities …– Emerging combined prognostic index ( m7 FLIPI, POD24 PI, PET MTV) which affect timing, choice and outcome of therapy.

When are we going to start
a cytotoxic treatment ?
GELA criteria BNLI criteria
✓ Rapid disease progression in
the preceding 3 months
✓ Life threatening organ
involvement
✓ Renal or liver infiltration
✓ Bone lesions
✓ Systemic symptoms or pruritus
✓ Hb<10 g/dL or WBC< 3.0×10⁹/L
or Plat.<100×109/L ; related to
marrow involvement
✓ High tumor bulk defined by either:
- a tumor > 7 cm
- 3 nodes in 3 distinct areas
each > 3 cm
- symptomatic splenic enlargement
- organ compression
- ascites or pleural effusion
✓ Presence of systemic symptoms
✓ Serum LDH or β2-microglobulin
above normal values

GELF Criteria
GELF86 GELF 94 FL2000 PRIMA
B symptoms + + + +
PS > 1 + +
LDH > N + + +
β2-micro > N > 3 mg/L > 3 mg/L > N
Compression, effusion,
spleen + + + +
Cytopenia +
Tumor diameter > 7 cm + + + +
3+ lymph nodes > 3 cm + + +

Tumor
BurdenLow
High
P=0.003
0.0
0.2
0.4
0.6
0.8
1.0
Years0 4 8 12
GELF Criteria

Follicular Lymphoma TreatmentFirst line 2017
Stagingevaluation
LocalizedW&W
radiotherapy
Advancedindolent
W&W
Rituximab
Advanced
withsymptoms
R-chemo
G-chemo
no-chemo?

PFS of rigorously staged patients with stage I
follicular lymphoma by treatment modality
. Compared with patients treated with radiation therapy, patients treated with rituximab-
containing chemotherapy (R-chemotherapy) or systemic therapy and radiation therapy had
significantly better PFS. Friedberg et al J Clin Oncol. 2012 Sep 20; 30(27): 3368–3375

Modern Standard of Care of
Follicular lymphoma
Low tumor burden or
Advanced indolent or
No need for therapy

Rituximab monotherapy: M39006
Colombat P et al, Ann Oncol 2012; 23: 2380-2385
Control arm alongside W&W?

Compulsory
CT scan
Compulsory
CT scanCT scan
only if
clinical CR
Bone marrow for histology and MRD only if CT shows cCR
R
A
N
D
O
M
I
S
A
T
I
O
N
ARM A
Watch and Wait
ARM B
Rituximab Induction
ARM C
Rituximab Induction
& maintenance
Continued
follow up
Progressive disease
requiring therapy
stops protocol
treatment
Clinic visits
RWW Study(Ardeshna et al)
cc

RWW (NCRI)
W&W versus RTX in asymptomatic FL
Ardeshna KM, et al. Lancet Oncol. 2014;15:424-435.
100
75
50
25
00 1 2 3 4 5 6 7
HR: 0.21 (95% CI: 0.14-0.31;
log-rank P < .0001)
Pts at Risk, n
Watch and wait
Maintenance
rituximab
187
192
139
184
111
176
66
146
33
59
6
10
1
1
0
0
Time to Start of New Treatment
No
Ne
w T
rea
tmen
t (%
)
100
75
50
25
00 1 2 3 4 5 6 7
Pts at Risk, n
Watch and wait
Maintenance
rituximab
187
192
181
189
175
186
130
163
68
72
18
16
4
3
0
0
OS
Yrs From Randomization
100
75
50
25
00 1 2 3 4 5 6 7
187
192
121
183
92
165
54
138
28
56
6
9
1
1
0
0
PFS
PF
S (
%)
HR: 0.23 (95% CI: 0.16-0.32;
log-rank P < .0001)
HR: 0.62 (95% CI: 0.31-1.26;
log-rank P = .19)
100
75
50
25
00 1 2 3 4 5 6 7
187
192
177
187
168
182
121
158
64
69
15
15
4
3
0
0
Time to Histological Transformation
No
His
tolo
gic
al
Tra
ns
form
ati
on
(%
)HR: 0.73 (95% CI: 0.34-1.54;
log-rank P = .40)
OS
(%
)
Yrs From Randomization

16
E4402 (RESORT) Schema
Rituximabre-treatment atprogression*375 mg/m2 qw 4
R
A
N
D
O
M
I
Z
E
Rituximab375 mg/m2 qw
4
CR or PR
Rituximab
Maintenance*375 mg/m2
q 3 months
*Continue until treatment failure
No response to retreatment or PD within 6 months of R
Initiation of cytotoxic therapy or Inability to complete rx

RESORT trial
Primary Endpoint: Time to Treatment Failure
Treatment failure: no response to retreatment or PD within 6 months of R,
Initiation of an alternative therapy or Inability to complete planned therapy
Kahl BS, et al. J Clin Oncol. 2014;32:3096-3102.

RESORT Conclusions
• Both strategies appear to delay time to chemotherapy compared to historical controls
• How to interpret?
– Given the excellent outcomes with RR
▪ 86% chemotherapy free at 3 years
– Given the lack of QOL difference
– Given fewer AE failures
– Given fewer R doses required with RR
• Rituximab retreatment is our recommended strategy if opting for Rituximab monotherapy in LTB FL
Kahl BS, et al. J Clin Oncol. 2014;32:3096-3102.

Cytotoxic CD8+ T cellEffector CD4+ T cell
TCR
MHC class IMHC class II
Dendritic cell
Tumor peptide
Cross-presentation.
SC route improves exposure and may improve
anti-lymphoma imunity
Cartron G et al, Blood 2004; 104: 2634-2642
FcgRIIIa
FcgRIIa
CD11b

FLIRT Trial
Rituximab iv 375 mg/m2
Rituximab sc 1400 mg
J1 J8 J15 J21
J1 J8 J15 J21
M3 M5 M7 M9
Control arm
Experimental arm
E
E
E
E
E Evaluation
R
Endpoint: PFSHypothesis: Control arm: median 23.5 m vs median 45 month in experimental arm: Number of patients: 210First patient: Q1-Q2 2014

• Ancillary studies
– FCGRT and FcRn
– Rituximab PK and variability
– Immunity against FL Ag
– Prognostic value of t(14;18)
Ancillary studies
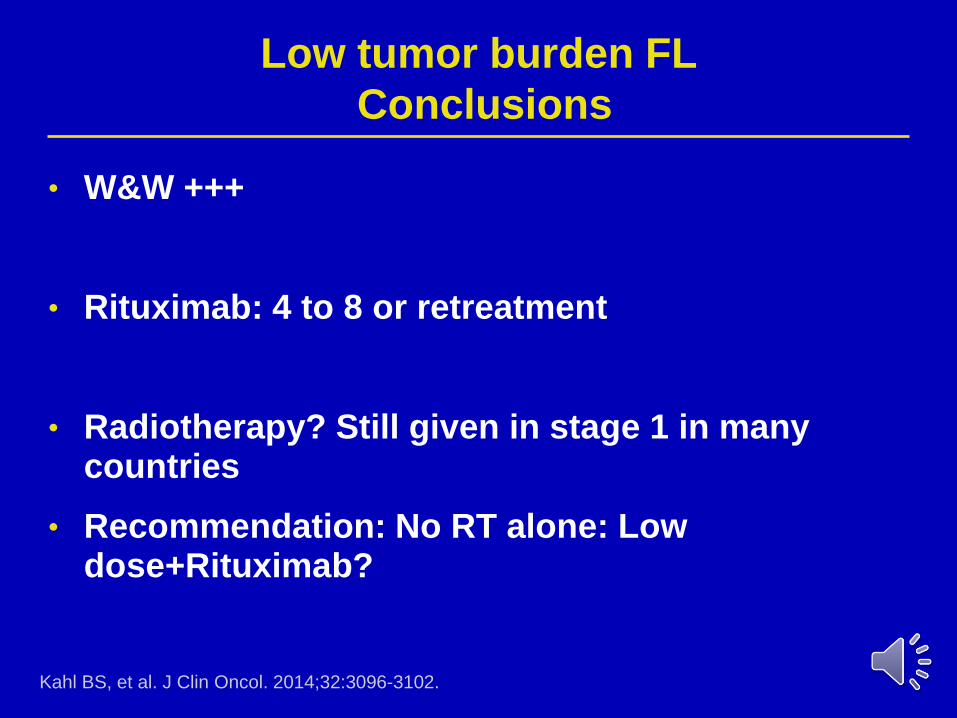
Low tumor burden FL
Conclusions
• W&W +++
• Rituximab: 4 to 8 or retreatment
• Radiotherapy? Still given in stage 1 in many countries
• Recommendation: No RT alone: Low dose+Rituximab?
Kahl BS, et al. J Clin Oncol. 2014;32:3096-3102.

Modern Standard of Care of
Follicular lymphoma
High tumor burden
Or Need for therapy

What are the relevant questions?
What is the best induction regimen?
What is the best treatment schedule following induction?
What is the best anti-CD20?
─ Does the choice of the anti-CD20 impact the choice of induction chemotherapy?
Is chemo-free an option?

FOLL05 Study
R-CVP vs R-CHOP vs R-FC
0.00
0.25
0.50
0.75
1.00
Prob
ab
ility
0 1 2 3 4 5 6 7 8 9
Years
R-CVP R-CHOP R-FM
ITT HR *(95CI) P
R-CHOP 0.73 (0.55-0.98) 0.033
R-FM 0.70 (0.52-0.93) 0.016
TTF
0.00
0.25
0.50
0.75
1.00
Prob
ab
ility
0 1 2 3 4 5 6 7 8 9
Years
R-CVP R-CHOP R-FM
OS
N = 500, median FU 7 years
Luminari et al, ICML 2017, abstr 15

FOLL05 Conclusions
❖ R-CHOP and R-FM are both superior to R-CVP in termsof TTF (Primary endpoint of the study)
❖ R-CHOP and R-FM have similar anti-lymphoma activity
❖ R-CHOP and R-CVP are less toxic than R-FM
❖ R-CHOP is associated with the best efficacy/toxicityratio

FL: StiL vs BRIGHT study (PFS)
Rummel MJ, et al. Lancet 2013.
0 12 24 36 48 60 72 84 96Time (months)
Hawkins et al. ICML 2017; abstract 131.
At Risk
1. 187 182 176 170 165 163 160 156 151 139 134 129 122 116 110 34 0
2. 186 175 172 168 165 162 159 149 135 126 118 107 101 97 92 11 0
0 2 4 6 8 10 12 18 24 30 36 42 48 54 60 66 72
iNHL†1.0
0.9
0.8
0.7
0.6
0.5
0.4
0.3
0.2
0.1
0.0
1 = BR
2 = R-CHOP/R-CVP
Surv
ival
Dis
trib
uti
on
Fu
nct
ion
▪ 5-yr rate % (95% CI): 70.3 (62.8, 76.5) vs 62.0 (54.1, 68.9)▪ HR = 0.70 (0.49-1.01; P = 0.0582)
BR
R-CHOP-CVP

Benda versus CHOP
Stil-NHL1 2003PRIMA:PFS -R-CHOP arm
Median for R-CHOP+ observation : 54,7 moMedian for R-CHOP+ observation : 40.9 mo
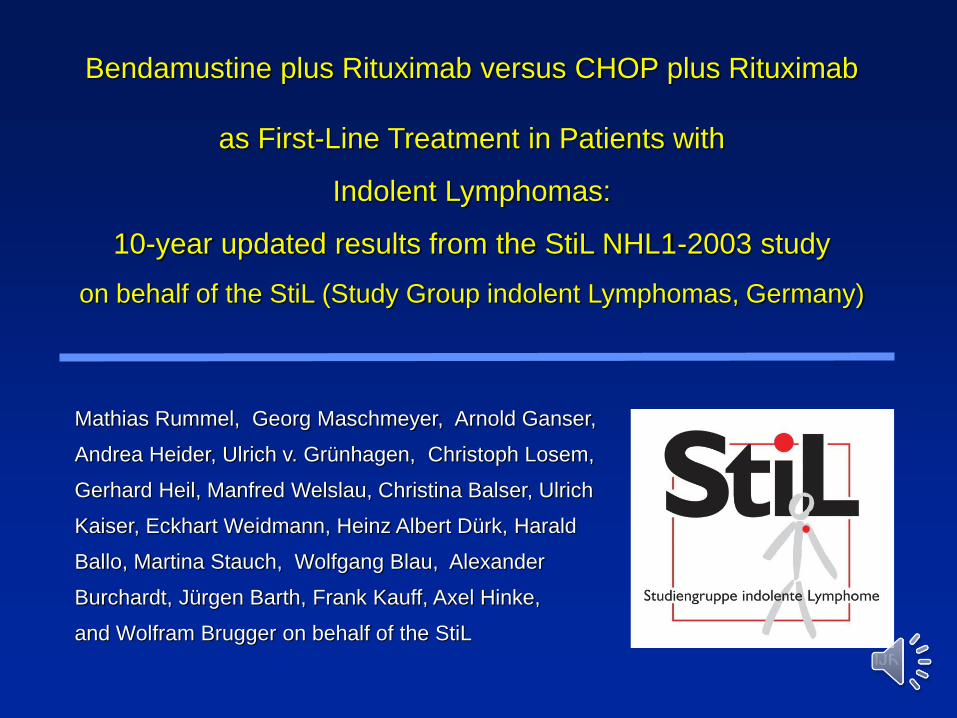
MJR
Bendamustine plus Rituximab versus CHOP plus Rituximab
as First-Line Treatment in Patients with
Indolent Lymphomas:
10-year updated results from the StiL NHL1-2003 study
on behalf of the StiL (Study Group indolent Lymphomas, Germany)
Mathias Rummel, Georg Maschmeyer, Arnold Ganser,
Andrea Heider, Ulrich v. Grünhagen, Christoph Losem,
Gerhard Heil, Manfred Welslau, Christina Balser, Ulrich
Kaiser, Eckhart Weidmann, Heinz Albert Dürk, Harald
Ballo, Martina Stauch, Wolfgang Blau, Alexander
Burchardt, Jürgen Barth, Frank Kauff, Axel Hinke,
and Wolfram Brugger on behalf of the StiL

MJR
Time to next treatment (117 months follow-up)
0
0,25
0,5
0,75
1
0 12 24 36 48 60 72 84 96 108 120 132 144 156 168
Time (months)
Pro
bab
ility
Hazard ratio, 0.55 (95% CI 0.41 - 0.73)
p < 0.0001
months salvage
(median) (events)
B-R n. y. r. 77
CHOP-R 56.0 109

MJR
Overall survival according to entities
0
0,25
0,5
0,75
1
0 12 24 36 48 60 72 84 96 108 120 132 144 156 168
Follicular
0
0,25
0,5
0,75
1
0 12 24 36 48 60 72 84 96 108 120 132 144 156 168
Waldenstroem
0
0,25
0,5
0,75
1
0 12 24 36 48 60 72 84 96 108 120 132 144 156 168
Small lymphocytic
0
0,25
0,5
0,75
1
0 12 24 36 48 60 72 84 96 108 120 132 144 156 168
Marginal zone
B-R
CHOP-R
B-R
CHOP-R
B-R
CHOP-R
B-R
CHOP-R

MJR
Overall survival: LDH elevated ( > 240 U/l )
0
0,25
0,5
0,75
1
0 12 24 36 48 60 72 84 96 108 120 132 144 156 168
Time (months)
Pro
bab
ility
Hazard ratio, 1.01 (95% CI 0.63 - 1.63)
p = 0.9576
median deaths
B-R 130 mo 37 (44%)
CHOP-R 127 mo 31 (46%)

MJR
OS: follicular, FLIPI high (3-5) (n=127)
0
0,25
0,5
0,75
1
0 12 24 36 48 60 72 84 96 108 120 132 144 156 168
Time (months)
Pro
bab
ility
Hazard ratio, 1.04 (95% CI 0.61 - 1.79)
p = 0.8747
10 yrs deaths
B-R 56.3% 26 (41%)
CHOP-R 59.3% 27 (42%)

B-R vs CHOP-R - secondary malignancies (2nd-NPL)
B-R (n=215) CHOP-R (n=205)
Pat. with 2nd-NPL * 37 40
2nd-NPL 39 47
- Prostate 3 7
- Colon/gastric 6 6
- Bronchial 2 5
- Kidney / urothel 4 5
- Pancreatic - 1
- Breast 4 4
- Other carcinoma 18 16
- MDS 2 2
- AML - 1
* Patients may have reported
more than 1 new malignancy

Conclusion: B-R vs CHOP-R
➢ Prolonged TTNT for B-R
➢ No difference in Overall Survival
➢ Fewer salvage treatments needed after initial B-R
➢ No increased rate of 2nd NPL after B-R compared to CHOP-R
➢ Achieving a CR resulted in a longer overall survival
➢ Hint for a longer OS for B-R in the subgroup with initial low LDH
➢ OS rate at 10 years is 70% with 6 x B-R (without R-maintenance)

Symptomatic, high burden FL
Top 5 Regimens for FL From 2012 to 2014
*1396 pts with FL met the inclusion/exclusion criteria and started LOT1 regimens between 6/2012-
6/2014.
Market Connect: McKesson Specialty Health. 2014.
Bendamustine + rituximab
(n = 489, 35.0%)
Rituximab (n = 431, 30.9%)
R-CHOP (n = 266, 19.1%)
R-CVP (n = 153, 11.0%)
Other (n = 57, 4.1%)
Follicular Lymphoma LOT1 Top 5 Regimens
35%
31%
19%
11%
4%

Treatment options following R-Chemo
induction
6 – 8 x
R-ChemoMaintenance with
rituximab ?PRIMA study
Consolidate with
ASCT ?
Consolidate with
RIT ?FIT, SWOG study

FIT Study Schema
First-line therapy with
chlorambucil, CVP,CHOP,
CHOP-like, fludarabine
combination, or rituximab
combination
INDUCTION
90Y-ibritumomab
(n = 207)Rituximab 250 mg/m2 IV
on day −7 and day 0 +90Y-ibritumomab
14.8 MBq/kg
(0.4 mCi/kg) on day 0
CONSOLIDATION
NRPD
CR/CRu or PR
NOT ELIGIBLE
R
A
N
D
O
M
I
Z
A
T
I
O
N
No further
treatment
(n = 202)
CONTROL
Start of study
CHOP = cyclophosphamide, doxorubicin, vincristine, prednisone; CVP = cyclophosphamide,
vincristine, prednisone; NR = no response; PD = progressive disease.
Morschhauser et al. J Clin Oncol. 2008;26:5156-5164.
6-12 weeks after
last dose of induction
Patients with previously
untreated follicular lymphoma

Overall PFS for Treatment Groups
90Y-ibritumomab
N FControl 202 15190Y-ibritumomab 207 119
At risk:
202
207
81
132
62
98
48
89
16
24
0
25
50
75
100
Years
0 2 4 6 8
Control
Cu
mu
lati
ve
pe
rce
nta
ge
Hazard ratio, 0.44
95% CI, 0.35-0.57
P < 0.001
90Y-Ibritumomab n = 207
Median PFS = 4.1 y
8-y PFS = 41%
Control n = 202
Median PFS = 1.1 y
8-y PFS = 22%

HR = 0.47
(95% CI: 0.36 – 0.61)
P < 0.001
0
25
50
75
100
0 2 4 6 8
Control n = 202
Median TTNT = 3.0 y
Years
90Y-Ibritumomab n = 207
Median TTNT = 8.1 y
N FControl 202 12890Y-ibritumomab 207 93
Cu
mu
lati
ve
pe
rce
nta
ge
At risk:
202
207
117
165
78
120
57
106
20
30
Control90Y-ibritumomab
Time to Next Treatment (TTNT)

Incidence of Secondary Malignancies
• Median time from study registration to incidence of secondary
AML/MDS was 4.6 y for Control vs 4.8 y for 90Y-Ibritumomab
• No additional late toxicities or congenital malformations were detected
Secondary Malignancies,
n (%)
Control
(n=202)
90Y-Ibritumomab
(n=207)
Total
(N=409)
Overall total (P = 0.086) 14 (7) 26 (13) 40 (10)
AML/MDS 1* (0.5) 7 (3) 8 (2)
Pancreas − 3 (1) 3 (1)
Prostate − 3 (1) 3 (1)
Other 13 (6) 13 (6) 26 (6)
*Patient received 90Y-Ibritumomab during follow-up, followed by secondary AML/MDS 2.9 years later.

SWOG study
Progression Free Survival
0%
20%
40%
60%
80%
100%
0 2 4 6 8 10
Years from Registration
CHOP -RIT
CHOP-R
At Risk
265
267
Relapse
or Death
86
106
2-Year
Estimate
80%
76%
2-sided, multivariate p = .11
S0016
CHOP-RIT
CHOP-RMedian FU 4.9 yr

High tumor burden FL
PRIMA 6 years follow-upProgression free survival from randomization
Median follow-up since randomisation : 73 months
6 years = 42.7%
6 years = 59.2%
HR= 0.57
P<0001

PRIMA 6 years follow-upOverall survival
Median follow-up since randomisation : 73 months
6 years = 87.4%
6 years = 88.7%
HR= 1.027
P=.885

PDs/SDs
off study
Rituximab Maintenance
1 dose every 8 weeks
for 24 months
90Y-Ibritumomab
tiuxetan
1 dose
R* CR/PRR-CHOP
x 6
Untreated
FL
stages II–IV
Registration
ZAR study: Design
Induction Consolidation / Maintenance
ClinicalTrials.gov: NCT00662948
Follow-up
5 years
*Stratification by response (CR / PR)
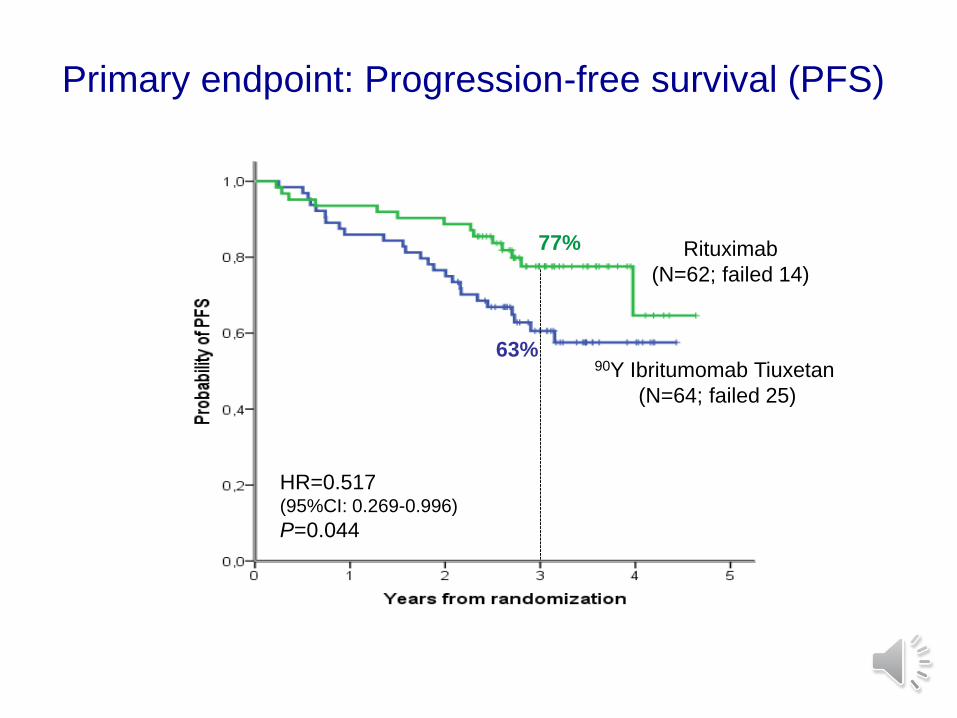
Primary endpoint: Progression-free survival (PFS)
Rituximab
(N=62; failed 14)
90Y Ibritumomab Tiuxetan
(N=64; failed 25)
77%
63%
HR=0.517(95%CI: 0.269-0.996)
P=0.044

Time to next treatment (TTNT) by arm
P=NS
90Y Ibritumomab Tiuxetan
Rituximab

Overall survival (OS)
Causes of death: progression (6), GVHD (1)
90Y Ibritumomab Tiuxetan
Rituximab

Gallium: challenging rituximab in
indolent lymphomas
ASH 2016 – Marcus R, abstract 6
Bendamustine : 827, CHOP : 433, CVP : 141

52
INV-assessed PFS (FL; primary endpoint)
0.8
0.6
0.4
0.2
0
1.0
Pro
ba
bili
ty
R-chemo (N=601)
G-chemo (N=601)
+
Time (months)
12 18 24 30 36 42 48 5460
No. of patients at risk
R-chemo
G-chemo
505
536
463
502
378
405
266
278
160
168
68
75
10
13
562
570
601
601
0
0
R-chemo,
n=601
G-chemo,
n=601
Pts with event,
n (%)
144
(24.0)
101
(16.8)
3-yr PFS,
% (95% CI)
73.3
(68.8, 77.2)
80.0
(75.9, 83.6)
HR (95% CI),
p-value*
0.66 (0.51, 0.85),
p=0.0012
Median follow-up: 34.5 months
Censored
*Stratified analysis; stratification factors: chemotherapy regimen, FLIPI risk group, geographic region

53
Pts at risk, n
R-chemo
G-chemo
OS (FL)
R-chemo,
n=601
G-chemo,
n=601
Pts with event,
n (%)
46
(7.7)
35
(5.8)
3-yr OS,
% (95% CI)
92.1
(89.5, 94.1)
94.0
(91.6, 95.7)
HR (95% CI),
p-value*
0.75 (0.49, 1.17),
p=0.21
588
584
566
573
527
549
399
416
265
271
160
161
58
55
2549
563
12 18 24 30 36 42 48 546 60
0.8
0.6
0.4
0.2
0
1.0
Pro
ba
bili
ty
0
R-chemo (N=601)
G-chemo (N=601)
Censored+
601
601
Time (months)
*Stratified analysis; stratification factors: chemotherapy regimen, FLIPI risk group, geographic region
Median follow-up: 34.5 months

54
INV-assessed PFS by chemo regimen (FL)
Post-hoc analysis: study not powered to detect differences between chemotherapy
regimens in either treatment arm
No. of patients at risk
G-B
G-CHOP
G-CVP
345
196
60
322
188
60
304
176
56
285
165
52
239
124
42
180
70
28
113
41
14
56
12
7
9
3
1
G-B (N=345)
G-CHOP (N=196)
G-CVP (N=60)
Time (months)
0.8
0.6
0.4
0.2
0
1.0
Pro
ba
bili
ty
12 18 24 30 36 42 48 5460
No. of patients at risk
R-B
R-CHOP
R-CVP
341
203
57
319
194
49
283
181
41
260
164
39
217
128
33
164
77
25
108
42
10
49
14
5
G-chemo arm
9
1
R-B (N=341)
R-CHOP (N=203)
R-CVP (N=57)
Time (months)
0.8
0.6
0.4
0.2
0
1.0P
rob
ab
ility
12 18 24 30 36 42 48 5460
R-chemo arm HR*
(95% CI)
G-B vs R-B0.61
(0.43, 0.86)
G-CHOP vs R-CHOP0.77
(0.50,1.20)
G-CVP vs R-CVP0.63
(0.32, 1.21)
*Unstratified analysis

Gallium: MRD and PFS
25% relapse
ASH 2016 – Marcus R, abstract 6, and Pott C, abstract 613
PFS according to MRD at the end of induction

56
Safety summary (FL)
% (n)
R-chemo
(n=597)
G-chemo
(n=595)
Any AE 98.3% (587) 99.5% (592)
Grade ≥3 AEs (≥5% in either arm) 67.8% (405) 74.6% (444)
Neutropenia 37.9% (226) 43.9% (261)
Leucopenia 8.4% (50) 8.6% (51)
Febrile neutropenia 4.9% (29) 6.9% (41)
IRRs* 3.7% (22) 6.7% (40)
Thrombocytopenia 2.7% (16) 6.1% (36)
Grade ≥3 AEs of special interest by category (selected)
Infections† 15.6% (93) 20.0% (119)
IRRs‡ 6.7% (40) 12.4% (74)
Second neoplasms§ 2.7% (16) 4.7% (28)
SAEs 39.9% (238) 46.1% (274)
AEs causing treatment discontinuation 14.2% (85) 16.3% (97)
Grade 5 (fatal) AEs 3.4% (20) 4.0% (24)**
Median (range) change from baseline in IgG levels at end of induction, g/l¶ -1.46 (-16.4–9.1)†† -1.50 (-22.3–6.5) ‡‡
*As MedDRA preferred term; †All events in MedDRA System Organ Class ‘Infections and Infestations’; ‡Any AE occurring during or within 24h of infusion of G or R and considered
drug-related; §Standardized MedDRA query for malignant or unspecified tumors starting 6 mo after treatment start; ¶Ig levels were measured during screening, at EOI and end of
maintenance and during follow-up; **Includes patient who died after clinical cut-off date from AE starting before cut-off date; ††n=472; ‡‡n=462

57
0 100 200 300 400 500 600 700 800 900 1000 1100 1200 1300 1400
Induction Maintenance Follow-up
Grade 5 (fatal) AEs by treatment (FL)*
*Includes only pts who died before clinical cut-off date; †this patient (G-B group) was initially assigned three causes of death (Clostridium difficile colitis, prostate cancer, and myelodysplastic syndrome);
Clostridium difficile colitis was the most acute, so the patient has been assigned to the ‘Infections and infestations’ category and the number of fatal AEs in G-B pts in neoplasms SOC reduced from 5 to 3
1500
†
Number of days from Cycle 1, Day 1
Total Infections
G-B
N=33719 (5.6%) 9 (2.7%)
R-B
N=33815 (4.4%) 2 (0.6%)
G-CHOP
N=1913 (1.6%) 1 (0.5%)
R-CHOP
N=2014 (2.0%)
G-CVP
N=611 (1.6%)
R-CVP
N=561 (1.8%)
Infections and infestations General disorders and
administration site conditions
Cardiac disorders Gastrointestinal disorders
Neoplasms benign,
malignant, and unspecified
Nervous system disorders Respiratory, thoracic, and
mediastinal disorders
Metabolism and nutrition
disorders

Does everyone need maintenance?
Decision based on PET/MRD results?

Meta-analysis:toxicities of R-maintenance
Event Pts RR (95% CI)
Grade 3-4 AE 1598 1.60 (1.29-1.99)
AEs with D/C 1433 2.72 (1.30-5.68)
Infections 1656 1.67 (1.40-2.0)
Grade 3-4 Infections
1656 3.55 (1.88-6.69)
Vidal et al, JNCI 103:1799, 2011

Effect of MR after R-CHOP or BR
▪ STIL BR better than R-CHOP
no maintenance
▪ BRIGHT BR a little better than R-CHOP
half of patients with maintenance
▪ GALLIUM BR same as R-CHOP
all had maintenance

Hypothesis
▪ Maintenance improves prognosis after CVP and CHOP, but not after Bendamustine
▪ Reasons could be:
▪ R needs an intact immune system to be active
▪ R is too toxic after immunosupressive chemo

R-bendamustine and lymphopenia
1160 pts with indolent lymphoma
R-benda x 6 + R-maintenance
WBC 6’600/ul 3’800/ul
Lympho 1’500/ul 500/ul
CD4 555/ul 118/ul
IgM 0.76 g/l 0.42 g/l
124 infections (44 pneumonia, 3 pneumocystis)
17 toxic deaths (1.4 %)
Burchardt, et al., abstr. 32, ICML-12, 2013

GALLIUM: Selected grade 3–5 AEs by chemo
n (%) of pts reporting 1 event
R-benda,n=338
G-benda,n=338
R-CHOP,n=203
G-CHOP,n=193
R-CVP,n=56
G-CVP,n=61
Cardiac events 12 (3.6) 13 (3.8) 5 (2.5) 6 (3.1) 0 (0.0) 4 (6.6)
Neutropenia 107 (31.7) 107 (31.7) 115 (56.7) 142 (73.6) 14 (25.0) 29 (47.5)
Febrile neutropenia 13 (3.8) 18 (5.3) 14 (6.9) 22 (11.4) 2 (3.6) 2 (3.3)
Second malignancies† 12 (3.6) 21 (6.2) 7 (3.4) 7 (3.6) 2 (3.6) 1 (1.6)
Other solid tumours 9 (2.7) 11 (3.3) 7 (3.4) 4 (2.1) 2 (3.6) 0
Hematological tumours‡ 0 3 (0.9) 0 3 (1.6) 0 0
Non-melanoma skin cancer
3 (0.9) 7 (2.1) 0 0 0 1 (1.6)
Infections 66 (19.5) 89 (26.3) 25 (12.3) 23 (11.9) 7 (12.5) 8 (13.1)
Opportunistic infections§ 6 (1.8) 10 (3.0) 2 (1.0) 5 (2.6) 0 0
Hiddemann et al, ICML 2017, abstr 107

Grade 3–5 infections by chemo and by phase
n (%) of pts reporting 1 event
R-benda,n=338
G-benda,n=338
R-CHOP,n=203
G-CHOP,n=193
R-CVP,n=56
G-CVP,n=61
All study periods 66 (19.5) 89 (26.3) 25 (12.3) 23 (11.9) 7 (12.5) 8 (13.1)
Induction 26 (7.7) 27 (8.0) 13 (6.4) 14 (7.3) 4 (7.1) 3 (4.9)
Maintenance 39 (13.0) 51 (16.7) 11 (5.9) 7 (3.9) 1 (2.5) 5 (8.8)
Observation 12 (3.8) 28 (8.8) 6 (3.1) 3 (1.6) 3 (5.7) 1 (1.7)
N (%) of pts receiving G-CSF prophylaxis
48 (14.2) 54 (16.0) 108 (53.2) 112 (58.0) 13 (23.2) 10 (16.4)
*Safety population
Hiddemann et al, ICML 2017, abstr 107

CD4 T-cell counts over timeC
D3+
CD
4+ (
cells
/µl)
Mo
30
Mo
36
Mo
18
EOIC
4/C
5
C1
/C2
BL
Mo
30
Mo
36
Mo
18
EOIC
4/C
5
C1
/C2
BL
Mo
30
Mo
36
Mo
18
EOIC
4/C
5
C1
/C2
BL
Mo
30
Mo
36
Mo
18C
4/C
5
C1
/C2
BL
Hiddemann et al, ICML 2017, abstr 107
BENDAMUSTINE CHOP CVP

Postinduction PET status (cut-off ≥4) and
Outcome
PFS Score ≥4 OS Score ≥4
HR 3.9 (95% CI 2.5-5.9, p<.0001)
Median PFS:16.9 (10.8-31.4) vs.
74.0 mo (54.7-NR)
63%
23%
HR 6.7, 95% CI 2.4-18.5, p=0.0002
Median OS: 79 months vs. NR
87%
97%

FOLL12 TRIAL DESIGN Maintenance
INDUCTIONtherapy
Standardarm
Experimentalarm
R Maintenanceevery 2 months x 2yrs
CR,PR
<PR Salvage
Rituximabweekly x 4
PET-
PET+
Salvage
Neg
Pos
Observation
(90)Y Ibritumomab Tiuxetan +R Maintenance
every 2 months x 2yrs
<PR
MRD
Patients with no molecular markers

Towards a chemo-free first-line treatment in FL?

45% of chemo-naïveresponders still in first remission at 8 years
SAKK 35/98 – Long term outcomeR-maintenance after single agent rituximab
EFS in previously untreated patients responding to the induction treatment
Martinelli et al. JCO 2010; 28:4480-4

FL cells
TFH
Treg/TFR
Th
CD8
Tgd
NK
Stromal cells
Blood vessels
Anti-PD-1 mAb
CXCR4 antagonistsBtk/Syk inhibitors
Anti-VLA4 mAb
Anti-CTLA4 mAbAnti-PD-1 mAb
IMiDsAnti-CD137 mAb
IMiDsAnti-CD137 mAbAnti-PD-1 mAb
BrHPP/IL-2
ITKs
Anti-tumoral microenvironmentThe good guys
Pro-tumoral microenvironmentThe bad guys
TAM
IMIDsAnti-CD47 mAb
Btk/Syk inhibitors
The u
gly g
uys
Amé-Thomas Semin Cancer Biol 2014;24: 23

Pre-clinical rationale for lenalidomide in FL
Lenalidomide is able to repair FL T-cell immunologic synapse dysfunction with autologous tumor cells in
vitro (Ramsay et al., Blood 2009)
CD
3
-
sAg
CD
3
+sA
g
CD
3
-
sAg
CD3
+sA
g
706050403020100
P < .05
P < .01
Untreated (UT)
Lenalidomide (Len.)
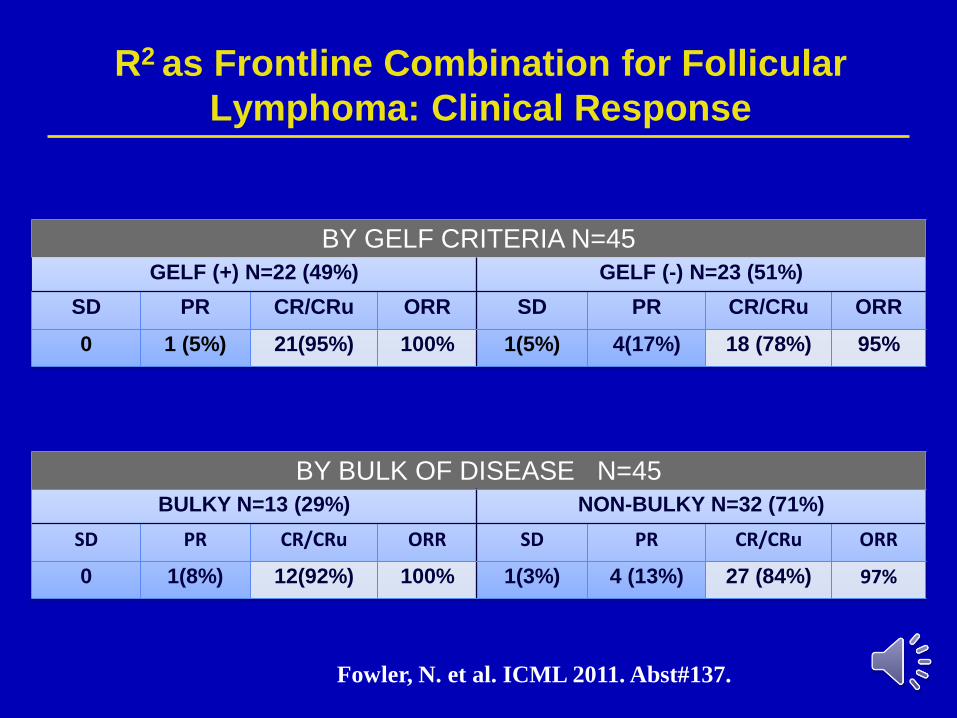
R2 as Frontline Combination for Follicular
Lymphoma: Clinical Response
BY GELF CRITERIA N=45
GELF (+) N=22 (49%) GELF (-) N=23 (51%)
SD PR CR/CRu ORR SD PR CR/CRu ORR
0 1 (5%) 21(95%) 100% 1(5%) 4(17%) 18 (78%) 95%
BY BULK OF DISEASE N=45
BULKY N=13 (29%) NON-BULKY N=32 (71%)
SD PR CR/CRu ORR SD PR CR/CRu ORR
0 1(8%) 12(92%) 100% 1(3%) 4 (13%) 27 (84%) 97%
Fowler, N. et al. ICML 2011. Abst#137.

R2 as Frontline therapy in FL: PFS
PFS (months)
Perc
en
t su
rviv
al
0 12 24 360
20
40
60
80
100
N=4636 mo PFS: 81%
N=46
36 mo PFS: 81%
Fowler, N. et al. ASH 2012.

Eva Kimby - December 9, 201479NLG
SAKK-Nordic 35/10 Trial design
1:1
Randomization
1 3 5 7 9 11 13 15 22-24Wks.
Ritux i.v.375 mg/m2
Lenalidomide 15 mg daily
Firs
t res
tag
ing
Fo
llow
-up
Ritux i.v.375 mg/m2
10S
ec
on
d re
sta
gin
g
Therapy
off-protocolNo CR/PR/MR MR >25% decrease in SPD
2 wks pre-phase 2 wks post-phase
Stratification:• FL grade 1-2 vs 3A
• Bulky vs no bulk
• FLIPI score 1+2 vs >3
• Center

Eva Kimby - December 9, 201480NLG
Assessment of primary endpoint [CR/CRu] at week 23
Addition of lenalidomide to rituximab results in a significantly higher
CR/CRu rate (IRR: 61% vs 36%) with increased but manageable
toxicityKimby et al. Blood 2014.124 (21):799, Zucca et al. Hematol Oncol 2015. 33 (s1):105
Now the analysis of secondary endpoints
at a median follow-up of 3.5 years ▪ Progression-free survival (PFS)
▪ Time to next anti-lymphoma treatment (TTNT)
▪ CR/CRu duration
▪ CR/CRu rate at 30 months (CR30)
▪ Overall survival (OS)
Results

Eva Kimby - December 9, 201481NLG
Progression-free survival
Rituximab + Lenalidomide
Rituximab
HR (95% CI) = 0.58 (0.36-0.94)
Log-Rank test p-value = 0.03
Median
PFS
not reached
vs
2.3 years

Eva Kimby - December 9, 201482NLG
Time to new therapy
Rituximab + Lenalidomide
Rituximab
HR (95% CI) = 0.56 (0.35-0.89)
Log-Rank test p-value = 0.01
Median
TTNT
not reached
vs
2.1 years

FLASH: Follicular Lymphoma Analysis of Surrogate
Hypotheses Group
Study Conclusions
83
Principal candidate CR30 met the surrogacy
qualification criteria for PFS overall and within trial types
Correlation of treatment effects on PFS and CR30
was more marked in patients with advanced disease
or high FLIPI score
CR30 may be considered an appropriate primary
endpoint in future first-line FL studies
Sargent et a, ICML 2015

Eva Kimby - December 9, 201484NLG
A significantly improved CR30 in RL
– RL: 42% (95% CI 30-53%)
– R: 19% (95% CI 11-30%)
OS rates at 3 years similar between the arms
– RL: 93% (95% CI 85-97%)
– R: 92% (95% CI 82-96%)
CR30 and OS
(p=0.001)

The “RELEVANCE” Trial
R2 maintenance(lenalidomide 1 yr + rituximab 2 yrs)
Rituximab maintenance(2 yrs)
R
24 mos.
R2
R-Chemo
6 mos.
CR, CRu, PR
CR, CRu, PR
1st line
FL
N=1000
R-Chemo: Investigator choice of R-CHOP, R-CVP, or R-B
Eligibility: Patients who need treatment (GELF criteria)
Stratification: FLIPI (0-1 v 2 v 3-5), Age (>60 v ≤ 60), diameter of largest node (> 6 v ≤ 6 cm)
Endpoints: PFS, CR/CRu? At 30 months
R2 Regimen:
Rituximab weekly x 4, then day 1 of each cycle 2 to cycle 6, 8 weeks later responding patients continue every 8 weeks for 12 cycles
Lenalidomide 20 mg x 6 cycles
- CR-10 mg lenalidomide 10 mg for 12 cycles
- PR- 20 mg lenalidomide 3-6 months then, 10 mg ≤18 cycle

Conclusions
– R-Benda is equivalent to R-CHOP
– G-chemo + maintenance superior to R-chemo + maintenance in
untreated advanced FL
• Clinically meaningful improvement in PFS: 34% reduction in risk;
HR=0.66
• Non-fatal AEs were higher in the G arm
• Fatal AEs more common in patients on bendamustine in both arms
– PET and MRD? to decide upon maintenance duration
– R2 has made chemo-free therapy a near future reality but is it
appropriate for all first-line FL in need of treatment?
– Elaborate on better frontline molecular markers to select patients
– Surrogate endpoint (for median PFS) adapted to chemo-free
approaches needed


