Transcriptional Sensitivity of Southern Ocean Plankton Communities to Changes in Temperature and Micronutrient Availability Photo: Jeff McQuaid Andrew Allen Erin Bertrand John McCrow Hong Zheng Ahmed Moustafa Jeff McQuaid SIO and JCVI David Hutchins Kai Xu Nathan Walworth USC Deborah Bronk Rachel Sipler Jenna Spackeen VIMS Mak Saito Dawn Moran Abigail Noble WHOI
Transcript
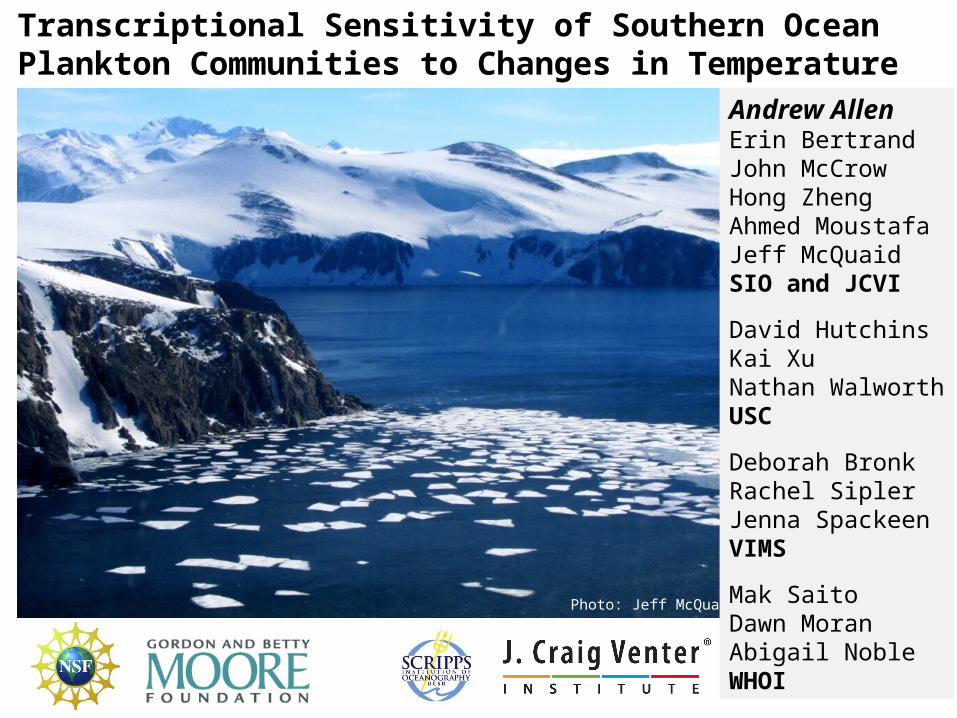
Transcriptional Sensitivity of Southern Ocean Plankton Communities to Changes in Temperature and Micronutrient Availability
Photo: Jeff McQuaid
Andrew AllenErin BertrandJohn McCrowHong ZhengAhmed MoustafaJeff McQuaidSIO and JCVI
David HutchinsKai XuNathan WalworthUSC
Deborah BronkRachel SiplerJenna SpackeenVIMS
Mak SaitoDawn MoranAbigail NobleWHOI
Change and Projected Change in the Ross Sea
Sea Surface Temperature:• Slight negative SST trend over past ~20-30 years; expected to continue 2-3 decades
(Mayewski et al 2009, Comiso et al 2000, Lebedev 2007) • Then expected to warm substantially by the end of the next century (Bracegirdle
and Stephenson, 2012); specific projections difficult (Smith et al 2014)
Iron: • Relative magnitude of sources still unclear
• Shelf sediments, dust, sea ice• Result: change is likely but difficult to predict- direction and magnitude (Smith et al 2012, 2014)
Change is coming: understand diversity and transcriptional baselines, response of existing communities
Photos: Jeff McQuaid, Dawn Moran
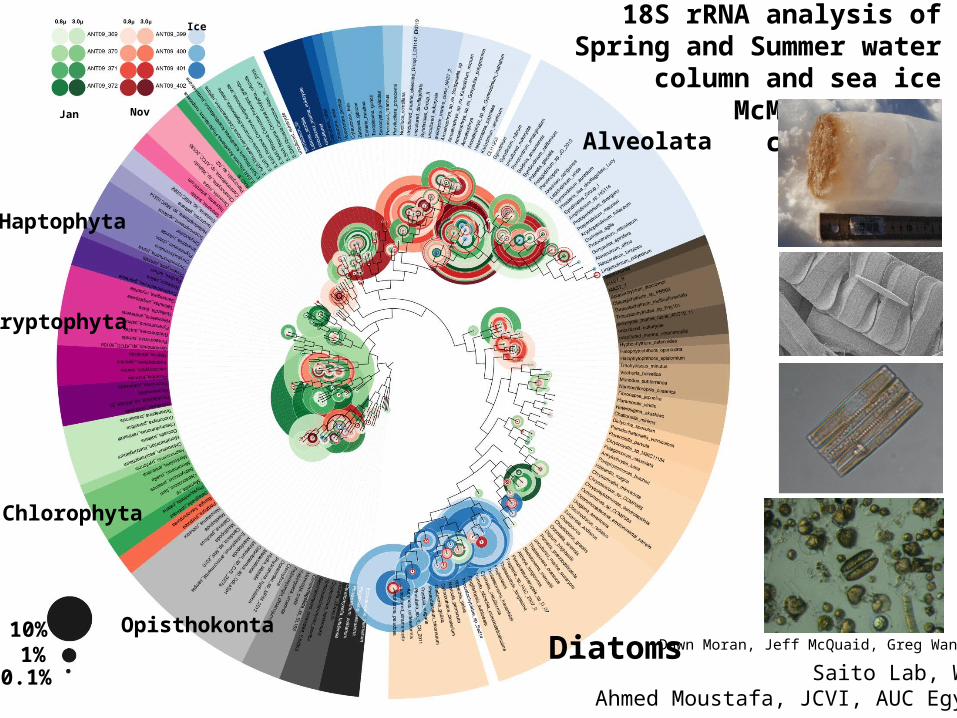
Jan Nov
Ice
Diatoms
18S rRNA analysis of Spring and Summer water column and sea ice
McMurdo Sound communities
Alveolata
Chlorophyta
Haptophyta
Saito Lab, WHOIAhmed Moustafa, JCVI, AUC Egypt
Cryptophyta
Dawn Moran, Jeff McQuaid, Greg WangerOpisthokonta10%
1%0.1%
Alphaproteobacteria
Gammaproteobacteria
CFB
Jan Nov
Ice 16S rRNA analysis of Spring and
Summer water column McMurdo
Sound communities
Saito Lab, WHOIAhmed Moustafa, JCVI, AUC Egypt
2 µm
Sea Ice diatom and bacteria(Greg Wanger)
Question: What is the transcriptional response of McMurdo Sound phytoplankton and bacterial communities to changes in temperature, iron, and vitamin B12 availability?
Approach: Manipulative experiments, late summer McMurdo Sound of the Ross Sea, Jan 2013
Photos: Erin Bertrand, Jeff McQuaid
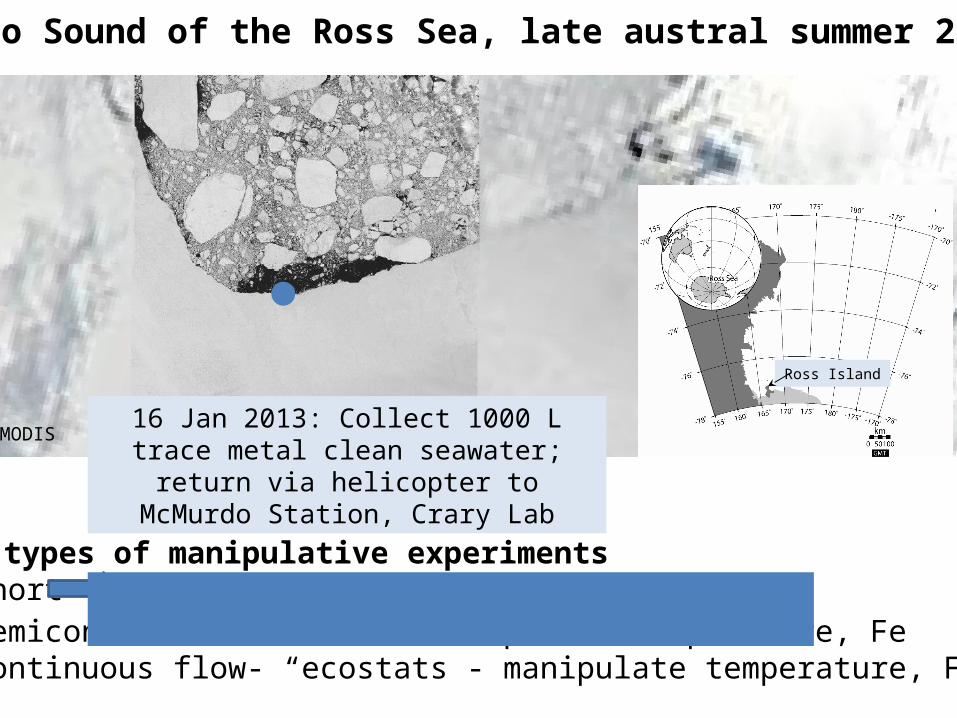
Three types of manipulative experiments• Short term batch- manipulate Fe, B12
Transcriptome differences reflect changes in gene expression levels within the community, NOT community composition changes
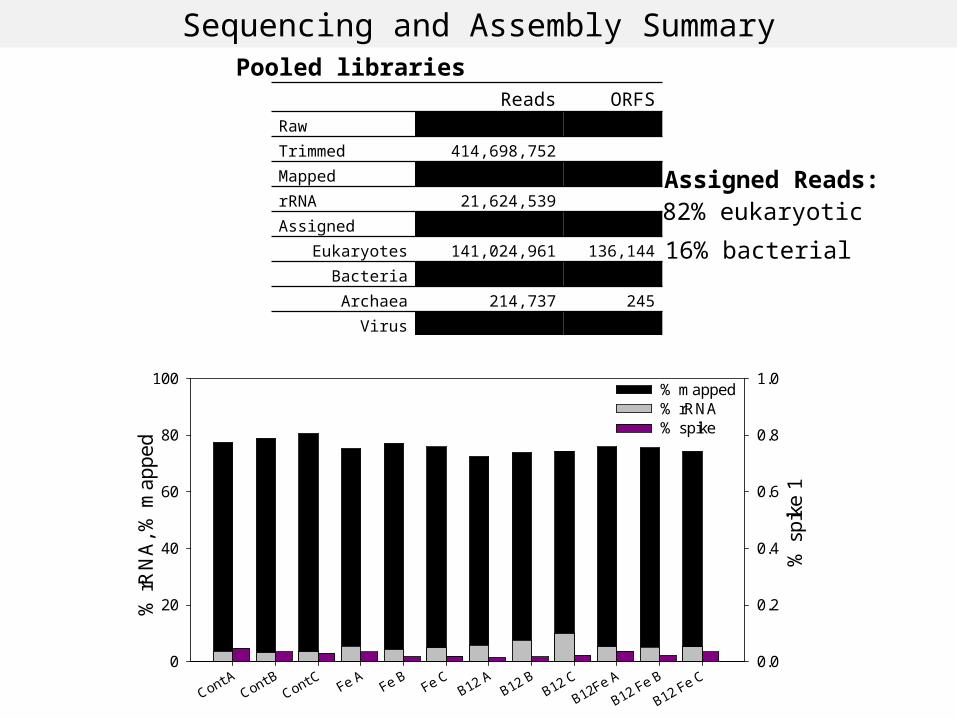
Eukaryotes Bacteria and Archaea
% of diatom reads assigned
0 10 20 30 40 50 60
Fragilariopsis
Pseudo-nitzchia
other pennate
Chaetoceros
Thalassiosira
Coscinodiscophyceae
other centricControl+Fe+B
12
+B12Fe
C.
Error bars: 1SD, triplicates
% of reads assigned to eukaryotes
0 10 20 30 40 50 60
Pennate Diatom
Centric Diatom
Pelagophyte
Other Stramenopiles
Ciliophora
Dinophyta
Chlorophyta
Streptophyta
Cryptophyta
Haptophyta
Fungi
Metazoa
Other Eukayotes Control+Fe+B12
+B12Fe
A.
Community contributions to mRNA pool
Fragilariopsis- dominated diatom community, no significant differences: changes reflect transcriptome responses to micronutrients, not community composition changes
Eukaryotes Diatoms
Transcriptional changes induced by micronutrient additions
B12 exhibits strong influence on short term transcriptional response across all three most abundant groups per kingdom
Diatom responses to changes in B12 availability
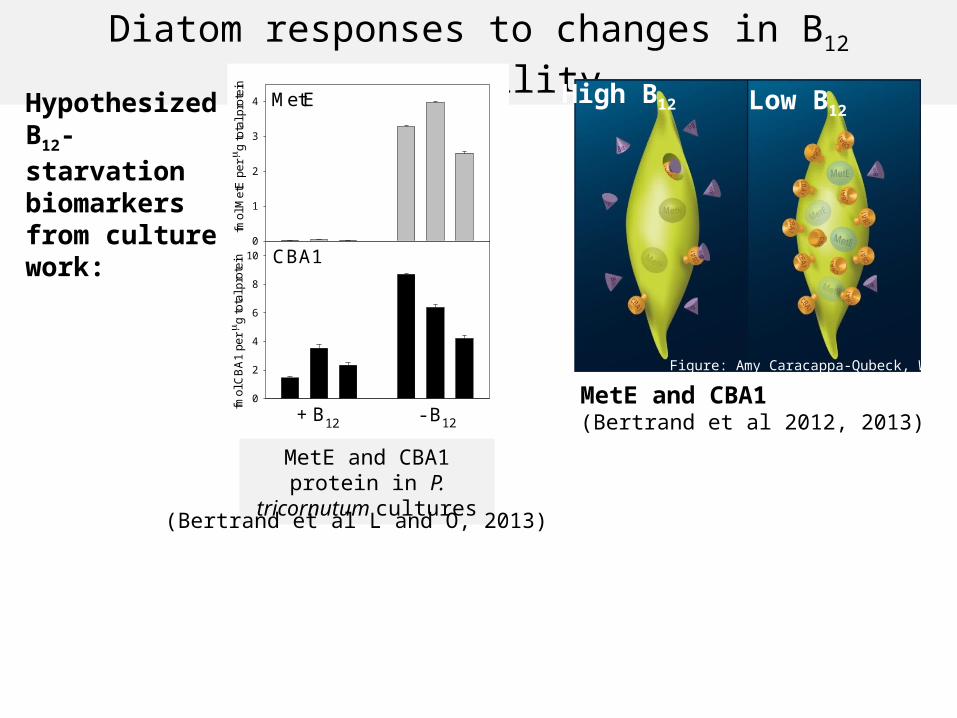
MetE and CBA1(Bertrand et al 2012, 2013)
High B12 Low B12
Figure: Amy Caracappa-Qubeck, WHOI
MetE
fmol
Met
E p
er
g to
tal p
rote
in0
1
2
3
4
CBA1
+ B12
fmol
CB
A1
per g
tota
l pro
tein
0
2
4
6
8
10
- B12
MetE and CBA1 protein in P. tricornutum cultures
Hypothesized B12- starvation biomarkers from culture work:
(Bertrand et al L and O, 2013)
MetE
log
2(t
rea
tme
nt/co
ntr
ol)
-10
-5
0
5
10
Fe/controlB12/controlB12Fe/control
CBA1
log
2(t
rea
tme
nt/co
ntr
ol)
-6
-4
-2
0
2
4
6 Fe/controlB12/controlB12Fe/Fe
Showing three log 2 fold change values for each ORF annotated as diatom MetE, CBA1 with >50 total reads mapped
MetE and CBA1: repressed by B12 and not driven by iron- confirmed as biomarkers for B12 starvation
Diatom responses to changes in B12 availability
High B12 Low B12
Figure: Amy Caracappa-Qubeck, WHOI
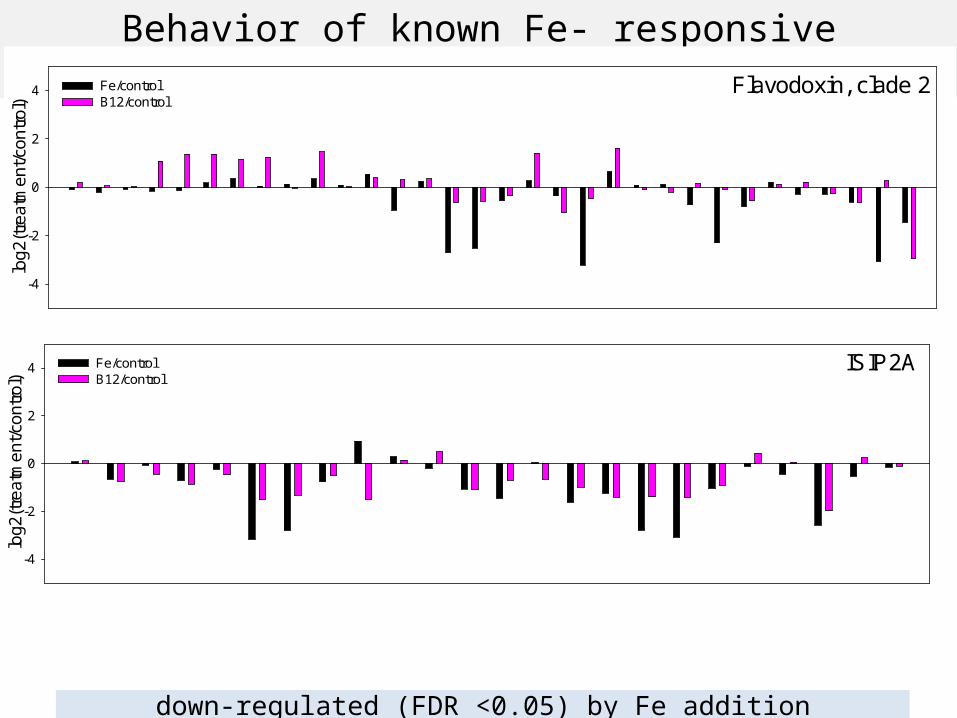
Flavodoxin, clade 2
log2
(tre
atm
ent/c
ontr
ol)
-4
-2
0
2
4 Fe/controlB12/control
ISIP2A
log
2(t
rea
tme
nt/c
on
tro
l)
-4
-2
0
2
4 Fe/controlB12/control
12% of flavodoxin c2 ORFs , 16% of ISIP2A ORFS with > 500 reads assigned:down-regulated (FDR <0.05) by Fe addition
Behavior of known Fe- responsive transcripts
% of reads assigned to bacteria and archaea
0 10 20 30 40 50 60
Actinobacteria
Bacteroidetes/Chlorobi
Cyanobacteria
Firmicutes
Alphaproteobacteria
Gammaproteobacteria
Betaproteobacteria
Other Bacteria
Archaea Control+Fe+B
12
+B12Fe
B.
Dominated by phyla we expect for the season(Ghiglione and Murray 2012; Williams et al 2012; Williams et al 2013; Grzymski et al 2012; Brown et al 2012)
McMurdo Sound of the Ross Sea, late austral summer 2012/13
MODIS
Ross Island
16 Jan 2013: Collect 1000 L trace metal clean seawater; return via helicopter to McMurdo
Station, Crary Lab
McMurdo Sound Semicontinuous Experiment
Iron: +/- I nM FeTemperature: 4°C or 0°CTriplicates, outdoor incubationat 15% of ambient light
t=0 same as short term Fe and B12 addition experiment
Dilute at arrows (1:6 to 1:2)
Short term B12 and Fe experiment (t = 0)
Sequence transcriptomes
Days
2 4 6 8 10 12 14 16 18
Ch
l a (
g/L
)
0
5
10
15
20
0 C cont0 C +Fe4 C cont4 C +Fe
Temperature and Iron: strong drivers of
phytoplankton growth
Transcriptomes to assess:• Identity and physiology of major groups responding favorably to temperature increase
• Micronutrient nutritional status and interaction changes
Viruses
Archaea
Bacteria
Eukaryotes nuclear
Chloroplast
Mitochondria
% a
ssig
ned
read
s
0
20
40
60
80
t = 00C, low Fe0C, high Fe4C, low Fe4C, high Fe
McMurdo Sound Semicontinuous Experiment: Community mRNA contributions
High temperature: Eukaryotes make a larger contribution to mRNA pool at the expense of Bacteria
t = 0: all 12 libraries from short term experiment
Pseudo-nitzchia/Nitzchia
Chaetoceros
Fragilariopsis
% O
RF
s S
igni
fican
tly
Diff
eren
t (F
DR
< 0
.05)
0
10
20
30
40
50
4C -Fe vs 0C -Fe4C +Fe vs 0C +Fe+Fe 0C vs -Fe 0C+Fe 4C vs -Fe 4C
Diatom gene expression shifts
EdgeR pairwise comparisons; triplicate treatments
• Temperature has a larger influence than Fe on Pseudo-nitzchia and Chaetoceros gene expression
• Iron is a more important factor for Fragilariopsis gene expression than the other diatoms
• Suggests different sensitivities/ capabilities for handling change
Down
Up
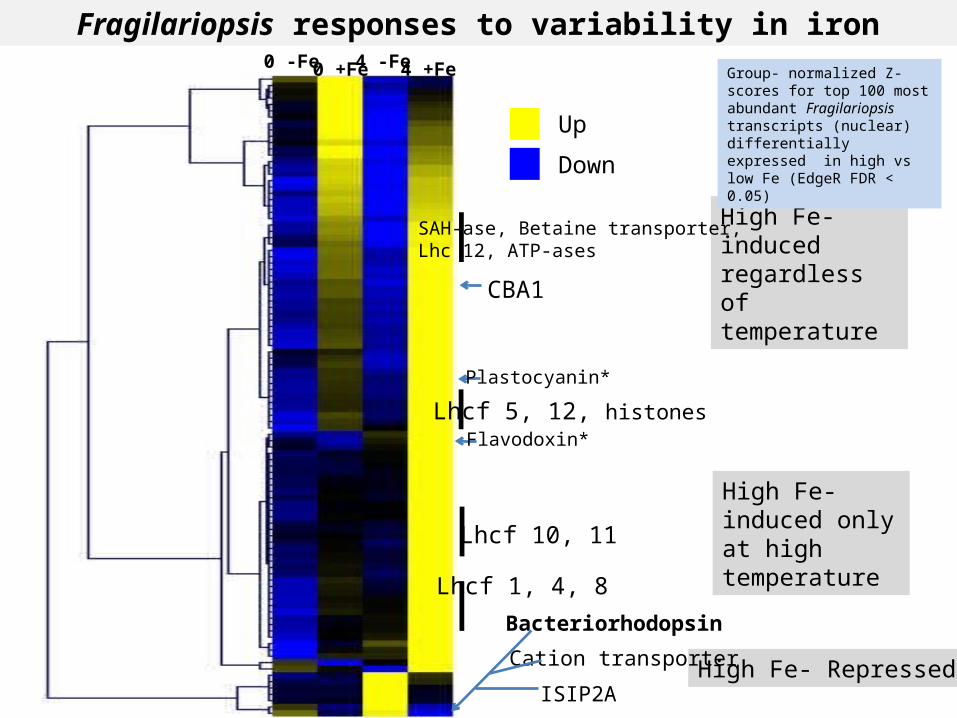
High Fe- induced regardless of temperature
High Fe- Repressed
Fragilariopsis responses to variability in iron
CBA1
Plastocyanin*
Bacteriorhodopsin
Cation transporter
ISIP2A
Lhcf 1, 4, 8
Lhcf 10, 11
Lhcf 5, 12, histones
SAH-ase, Betaine transporter, Lhc 12, ATP-ases
0 -Fe 0 +Fe 4 -Fe 4 +Fe Group- normalized Z- scores for top 100 most abundant Fragilariopsis transcripts (nuclear)differentially expressed in high vs low Fe (EdgeR FDR < 0.05)
Flavodoxin*
High Fe- induced only at high temperature
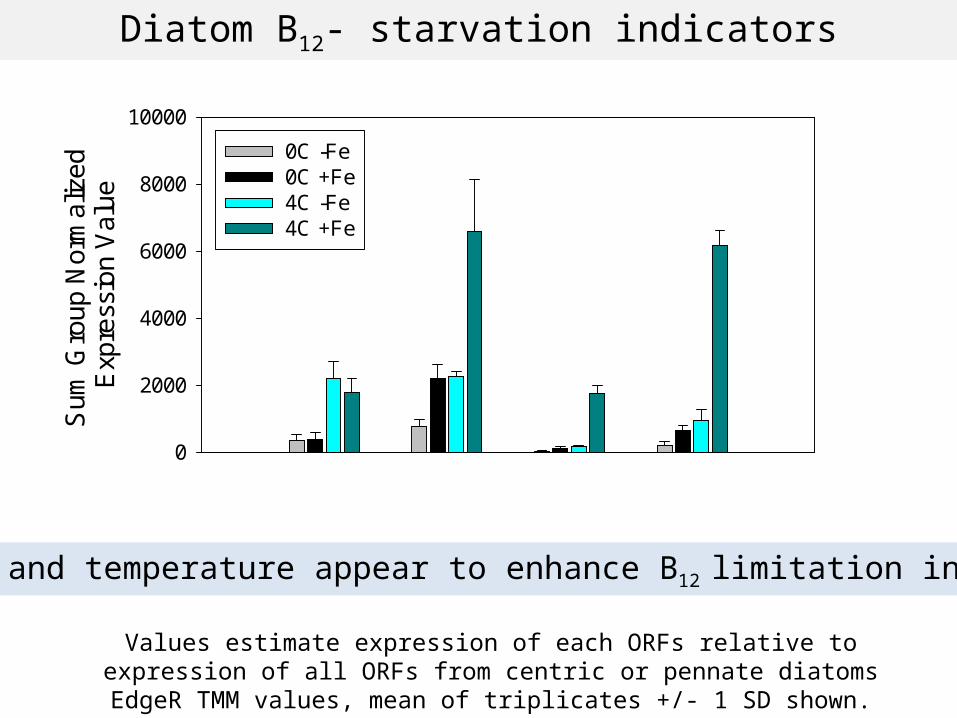
Diatom B12- starvation indicators
High Fe and temperature appear to enhance B12 limitation in diatoms
Sum
Gro
up
Nor
mal
ized
E
xpre
ssio
n V
alue
0
2000
4000
6000
8000
10000
0C -Fe0C +Fe4C -Fe4C +Fe
CBA1Centric
CBA1Pennate
MetECentric
MetEPennate
Values estimate expression of each ORFs relative to expression of all ORFs from centric or pennate diatoms
EdgeR TMM values, mean of triplicates +/- 1 SD shown.
0 2 4 6 8 10 120
1020304050607080
10 nM B1 + 0 B12
0 B1 + 100 pM B12
10 nM B1 + 100 pM B12
Days
Fluo
resc
ence
Preliminary data, post antibiotic treatment, not axenic
One Pseudo- nitzchia isolate is a confirmed B12 auxotroph
Mixed community, Arrow: MCM Pseudo-nitzchiaImage Credit: Jeff McQuaid
Pseudo-nitzchia dominate at high Fe high temp despite documented B12 limitation• Bacterial partners?• Strain variability?
Short term B12 and Fe experiment• B12 and iron limitation of phytoplankton
growth
• Confirmation of diatom molecular markers for B12 limitation
• Gammaproteobacterial B12 source?
• Interactive micronutrient dynamics: Fe limitation of B12 production and use
Semicontinuous Fe and Temperature experiment
• Strong temperature impact on phytoplankton growth, community composition, and gene expression
Pseudo-nitzchia
• Imbalance in bacterial and phytoplankton response
• Implications for future impact of temperature on micronutrient dynamics
Towards understanding diversity and transcriptional baselines and sensitivities of Antarctic marine microbial communities - three approaches• Cultures• Manipulative experiments• Surveys
• Powerful synergy developing
o Future work: further exploration of temperature and micronutrient interactions in co-cultures and manipulative experiments
o Better and temporally extended microbial surveys: LR-AUV technology with automated microbial sampling platforms
o Influence of temperature on sea ice algae life cycles and viruseso Viruses and domoic acid (DA) producing phytoplankton (HABs)