Journal of Accounting, Finance and Economics Vol. 6. No. 2. September 2016 Issue. Pp. 108 – 122 Transfer Pricing: The Case of Saudi Arabia Ali Faya Alhassan 1 This study examines transfer pricing behaviour for the purpose of shifting profits between national tax jurisdictions with different rates of profit tax in the context of the Saudi oil and gas sector as well as that of several other countries (i.e., Australia, Canada, Czech Republic, France, Korea, Japan, Kuwait, Norway, Poland, Sweden, UK and US). The methodology of the Bartelsman and Beetsma (2003) is proposed as the basis for testing the hypothesis. The results of this study show that the Bartelsman and Beetsma (2003) model when applied to the Saudi Arabia oil and gas sector does not detect transfer pricing behaviour for the purpose of shifting profit. However, the Bartelsman and Beetsma (2003) model when applied to other countries such as Japan, Korea, Norway, Poland, and the United Kingdom does show results that suggests the presence of transfer pricing behaviour for the purpose of shifting profits. Keywords: Corporate tax rates; Income splitting; transfer pricing 1. The Introduction The research problem arises from the perspective of national tax authorities when firms that are part of the same MNC group are subject to different rates of profit tax because of their location in different tax jurisdictions (Hoonsawat, 2007). The managements of multinational companies operate internationally and, in this manner, strive to minimise the overall tax payment (liabilities) of the multinational group as a whole, across the countries in which they operate. Apart from developing acceptable tax minimisation strategies for this purpose, various studies have identified management behaviour that is considered by tax authorities to be outside the realm of tax minimisation and into the realm of shifting profits between tax jurisdictions. A range of studies have has identified that the setting of transfer prices has been utilized by management, in such situations as a mechanism, to shift profits from an MNC’s operations in high tax jurisdictions to their operat ions in low tax jurisdictions, as can be seen from a range of studies (Harris et al. 1991; Johnson & Kirsh 1991; Borkowski 1992; Grubert, Goodspeed & Sivenson 1993; Borkowski 1997; Oyelere & Emmanuel 1998; Mehafdi 2000; Eden& Kudrle 2005). The research question at the center of this study is: Does the management of multinational companies in the Saudi Arabia the oil and gas sector reflect transfer price setting behaviour posited by Bartlesman and Beetsma’s (2003) model?. This question will be explored using a number of propositions and hypotheses which are derived from the core objective of this study as follows: * Dr. Ali Faya Alhassan, Assistant professor at College of Administrative and Financial Sciences, King Khalid University, Saudi Arabia, Email: [email protected]
Transcript
Journal of Accounting, Finance and Economics
Vol. 6. No. 2. September 2016 Issue. Pp. 108 – 122
Transfer Pricing: The Case of Saudi Arabia
Ali Faya Alhassan1
This study examines transfer pricing behaviour for the purpose of shifting profits between national tax jurisdictions with different rates of profit tax in the context of the Saudi oil and gas sector as well as that of several other countries (i.e., Australia, Canada, Czech Republic, France, Korea, Japan, Kuwait, Norway, Poland, Sweden, UK and US). The methodology of the Bartelsman and Beetsma (2003) is proposed as the basis for testing the hypothesis. The results of this study show that the Bartelsman and Beetsma (2003) model when applied to the Saudi Arabia oil and gas sector does not detect transfer pricing behaviour for the purpose of shifting profit. However, the Bartelsman and Beetsma (2003) model when applied to other countries such as Japan, Korea, Norway, Poland, and the United Kingdom does show results that suggests the presence of transfer pricing behaviour for the purpose of shifting profits.
Keywords: Corporate tax rates; Income splitting; transfer pricing
1. The Introduction The research problem arises from the perspective of national tax authorities when firms that are part of the same MNC group are subject to different rates of profit tax because of their location in different tax jurisdictions (Hoonsawat, 2007). The managements of multinational companies operate internationally and, in this manner, strive to minimise the overall tax payment (liabilities) of the multinational group as a whole, across the countries in which they operate. Apart from developing acceptable tax minimisation strategies for this purpose, various studies have identified management behaviour that is considered by tax authorities to be outside the realm of tax minimisation and into the realm of shifting profits between tax jurisdictions. A range of studies have has identified that the setting of transfer prices has been utilized by management, in such situations as a mechanism, to shift profits from an MNC’s operations in high tax jurisdictions to their operations in low tax jurisdictions, as can be seen from a range of studies (Harris et al. 1991; Johnson & Kirsh 1991; Borkowski 1992; Grubert, Goodspeed & Sivenson 1993; Borkowski 1997; Oyelere & Emmanuel 1998; Mehafdi 2000; Eden& Kudrle 2005). The research question at the center of this study is: Does the management of multinational companies in the Saudi Arabia the oil and gas sector reflect transfer price setting behaviour posited by Bartlesman and Beetsma’s (2003) model?. This question will be explored using a number of propositions and hypotheses which are derived from the core objective of this study as follows:
* Dr. Ali Faya Alhassan, Assistant professor at College of Administrative and Financial Sciences, King Khalid University, Saudi Arabia, Email: [email protected]
Proposition a: The management of multinational companies operates in such a fashion so as to minimise the overall tax liability of the multinational company. Proposition b: The management of multinational companies strives to minimise the overall tax liability of the multinational group as a whole by the use of transfer pricing. From the above propositions, the following hypotheses are tested in this paper: Hypothesis a: The management of multinational companies uses transfer pricing to shift profits from their operations in high tax jurisdictions to their operations in low tax jurisdictions. Hypothesis b: The management of multinational companies in the Saudi Arabian oil and gas sector uses transfer pricing to shift profits from their operations in high tax jurisdictions to their operations in the low tax jurisdiction of Saudi Arabia. Although there were some studies that centred on the oil sector globally and the issue of transfer pricing, the literature review revealed that there were no studies that dealt with the issue of transfer pricing in relation to the Saudi Arabian oil and gas sector. The study makes several contributions to the literature. First, it investigates whether the Bartelsman and Beetsma (2003) model detects if the Saudi oil and gas companies may be using transfer pricing in a manner that is consistent with shifting profits from high to low tax jurisdictions. It provides an incremental contribution to the literature on the topic of transfer pricing internationally. Consequently, this study develops an adaptation of the Bartelsman and Beetsma (2003) model to test for the transfer pricing behaviour in the specific field e.g. oil and gas sector. As a consequence this study opens up a line of research to further test the adapted Bartelsman and Beetsma (2003) model for other national tax jurisdictions and thereby provide results that will enable comparisons and further refinement of the model if necessary. This study can be used as a basis for examining and developing further the methodology for identifying and gauging any transfer pricing behaviour with the purpose of shifting profits in relation to the oil and gas sector in other countries.. This paper proceeds as follows: A literature review is summarised in Section 2; Section 3 discusses methodology and model; Findings are presented in section 4; Section 5 addresses the Summary and Conclusions.
2. Literature Review Although there are several models that have been developed, such as Silva (1999), Grubert and Mutti (1991), Hines and Rice (1994), Nielsen, Raimondos-Møller, and Schelderup (2001), to identify the use of transfer pricing for the purpose of profit shifting. However, the necessary variables were not available in the Saudi market for the use of such mathematical models as is the case in the US companies. Silva (1999) described a simple statistical model to predict the arm’s length profit margin of a corporate tax payer as a function of the operating expense ratio and random factors, quantified by residual error. The model was validated using data from publicly traded U.S. companies engaged in drugs, toiletry, and cosmetics, and perfumes. The aim of this study was to determine if the same model could be fitted to a set of corresponding data applying to the Sabic Company in the Saudi Arabia between 1999 and 2008. However, the required
Alhassan
110
variables were not available in the Saudi market for the use of such mathematical models as is the case in the US companies. A commonly used model of transfer pricing in multinational firms is the model of Grubert and Mutti (1991). This model provides an empirical economic treatment of the issue of transfer pricing and offers quantitative analysis in three areas, including the ability to shift profits between countries with tax gradients, impact of host country taxes and tariffs on distribution of real capital, and influence of tax and tariff policies in international trade patterns. Grubert and Mutti’s (1991) model can be used to explain this transfer pricing in terms of effects. This model also does not require complex regression building, but is instead focused on simple microeconomic models and well-known constructions, including profit maximization, demand for capital, and analysis of capital distribution. This makes this model of analysis simple to use and well suited to the overall structure of the current report. However, the required variables were not available in the Saudi market for this model as the case in the US companies. Hines and Rice’s (1994) exhaustive study of the issues involved in the use of tax havens by American companies cited the Grubert and Mutti study as a basis for assertion that tax benefits are one of the most common reasons for the use of transfer pricing and tax havens by American firms. This study provided great insight into the significance of the model’s assertions as well as describing how they fit into a greater structure. The results of this study were also used to construct a model to examine transfer pricing in Puerto Rico, which used a structural equation model (SEM) to examine the issue at hand (Grubert & Slemrod, 1998). However, the required variables were not available in the Saudi market for this model as the case in the US companies. One potential model of transfer pricing that could be used to detect transfer pricing in the financial statements of firms in the oil and gas industry as well as other publicly available information is that described by Nielsen, Raimondos-Møller, and Schelderup (2001). This model examines transfer pricing under market conditions of oligopolistic competition, which makes it appropriate for the current industrial focus. However, the required variables were not available in the Saudi market as is the case in the US companies. The Bartelsman and Beetsma (2003) model is currently constructed as a time series analysis of a longer time frame, which consists of data ranging from 1979 to 1997. The model was focused on the analysis of data from OECD countries, and as such this was a reliable period of time for which data was available. Additionally, this model did not rely on construction of an understanding of transfer pricing in any particular industry, and as such the data set could be constructed such that the model took into account any number of industries for which there were information for a period of time. This yielded a robust and effective model that provided definite evidence of transfer pricing. The Bartelsman and Beetsma (2003) model was used in this paper for the following reasons:
The model examines the available public data at industry level, which is available for most developed, developing, and tax-haven countries;
The model uses the headline tax rate and reported profit levels within an industry to detect transfer pricing for most developed, developing, and tax-haven countries;
Alhassan
111
The model is acknowledged by researchers in the field to reliably identify transfer pricing simply and efficiently.
A complete description of the model is available for use and adaptation by other researchers.
In essence, the Bartelsman and Beetsma (2003) model was designed to use an estimate of how much the value added/labour ratio (value-labour), officially reported by tax authorities and national statistics authorities, was lost or deflated by income shifting via transfer pricing. It is assumed that the value-added revenue from production is understated for countries with high tax rates where multinational companies claim lower than market prices for international cross-border business transactions. Conversely, it is assumed that the value-added is overstated for countries with low tax rates where multinational companies claim higher than market prices for cross-border transactions between their related entities. Consequently, the reported value-added statistics are distorted to the extent that the results of the prohibited transfer pricing behaviour are embodied in the reported data.
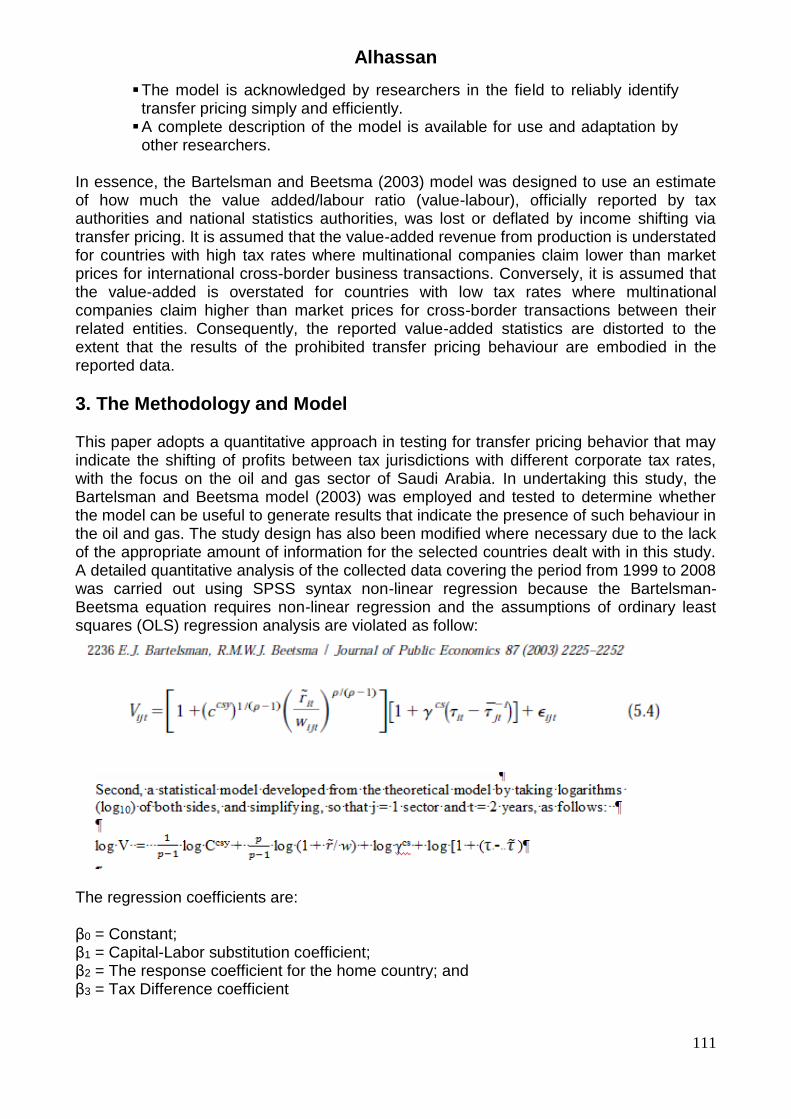
3. The Methodology and Model This paper adopts a quantitative approach in testing for transfer pricing behavior that may indicate the shifting of profits between tax jurisdictions with different corporate tax rates, with the focus on the oil and gas sector of Saudi Arabia. In undertaking this study, the Bartelsman and Beetsma model (2003) was employed and tested to determine whether the model can be useful to generate results that indicate the presence of such behaviour in the oil and gas. The study design has also been modified where necessary due to the lack of the appropriate amount of information for the selected countries dealt with in this study. A detailed quantitative analysis of the collected data covering the period from 1999 to 2008 was carried out using SPSS syntax non-linear regression because the Bartelsman-Beetsma equation requires non-linear regression and the assumptions of ordinary least squares (OLS) regression analysis are violated as follow:
The regression coefficients are: β0 = Constant; β1 = Capital-Labor substitution coefficient; β2 = The response coefficient for the home country; and β3 = Tax Difference coefficient
Alhassan
112
If the p value (Sig) of the t test statistic is less than .05, and if the 95.0% confidence intervals do not include zero then the regression coefficient is significantly different from zero. If the p value (Sig) of the t test statistic is greater than .05, and if the 95.0% confidence intervals include zero, then the regression coefficient is not significantly different from zero.
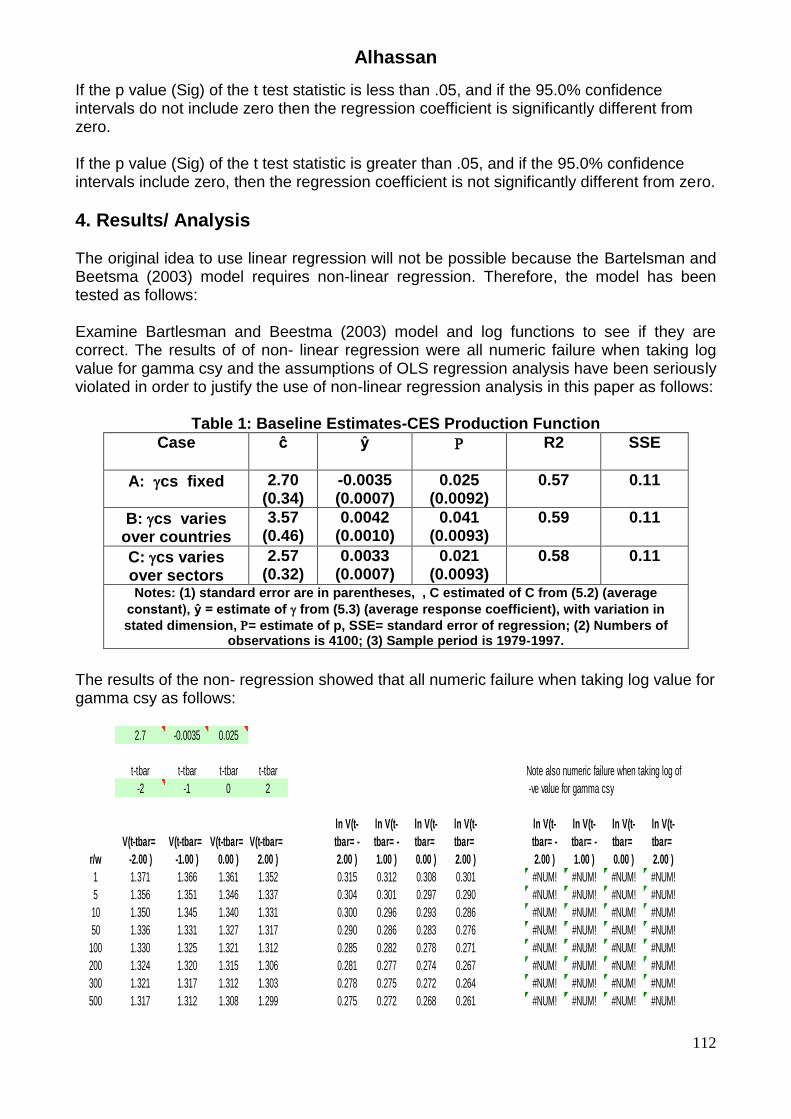
4. Results/ Analysis The original idea to use linear regression will not be possible because the Bartelsman and Beetsma (2003) model requires non-linear regression. Therefore, the model has been tested as follows: Examine Bartlesman and Beestma (2003) model and log functions to see if they are correct. The results of of non- linear regression were all numeric failure when taking log value for gamma csy and the assumptions of OLS regression analysis have been seriously violated in order to justify the use of non-linear regression analysis in this paper as follows:
Table 1: Baseline Estimates-CES Production Function
SSE R2
ŷ ĉ Case
0.11 0.57 0.025 (0.0092)
-0.0035 (0.0007)
2.70 (0.34)
A: cs fixed
0.11 0.59 0.041 (0.0093)
0.0042 (0.0010)
3.57 (0.46)
B: cs varies over countries
0.11 0.58 0.021 (0.0093)
0.0033 (0.0007)
2.57 (0.32)
C: cs varies over sectors Notes: (1) standard error are in parentheses, , C estimated of C from (5.2) (average
constant), ŷ = estimate of from (5.3) (average response coefficient), with variation in
stated dimension, = estimate of p, SSE= standard error of regression; (2) Numbers of observations is 4100; (3) Sample period is 1979-1997.
The results of the non- regression showed that all numeric failure when taking log value for gamma csy as follows:
2.7 -0.0035 0.025
t-tbar t-tbar t-tbar t-tbar Note also numeric failure when taking log of
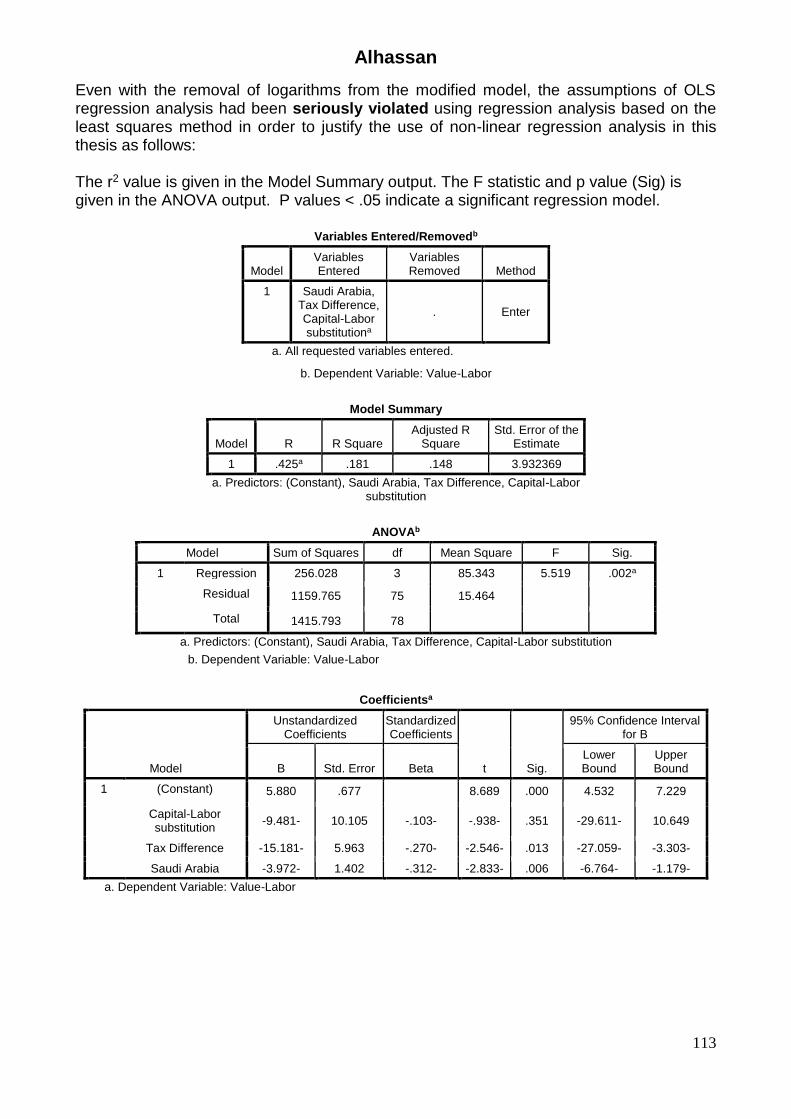
Even with the removal of logarithms from the modified model, the assumptions of OLS regression analysis had been seriously violated using regression analysis based on the least squares method in order to justify the use of non-linear regression analysis in this thesis as follows:
The r2 value is given in the Model Summary output. The F statistic and p value (Sig) is given in the ANOVA output. P values < .05 indicate a significant regression model.
Variables Entered/Removedb
Model Variables Entered
Variables Removed Method
1 Saudi Arabia, Tax Difference, Capital-Labor substitutiona
. Enter
a. All requested variables entered.
b. Dependent Variable: Value-Labor
Model Summary
Model R R Square Adjusted R
Square Std. Error of the
Estimate
1 .425a .181 .148 3.932369
a. Predictors: (Constant), Saudi Arabia, Tax Difference, Capital-Labor substitution
ANOVAb
Model Sum of Squares df Mean Square F Sig.
1 Regression 256.028 3 85.343 5.519 .002a
Residual 1159.765 75 15.464
Total 1415.793 78
a. Predictors: (Constant), Saudi Arabia, Tax Difference, Capital-Labor substitution
Saudi Arabia -3.972- 1.402 -.312- -2.833- .006 -6.764- -1.179-
a. Dependent Variable: Value-Labor
Alhassan
114
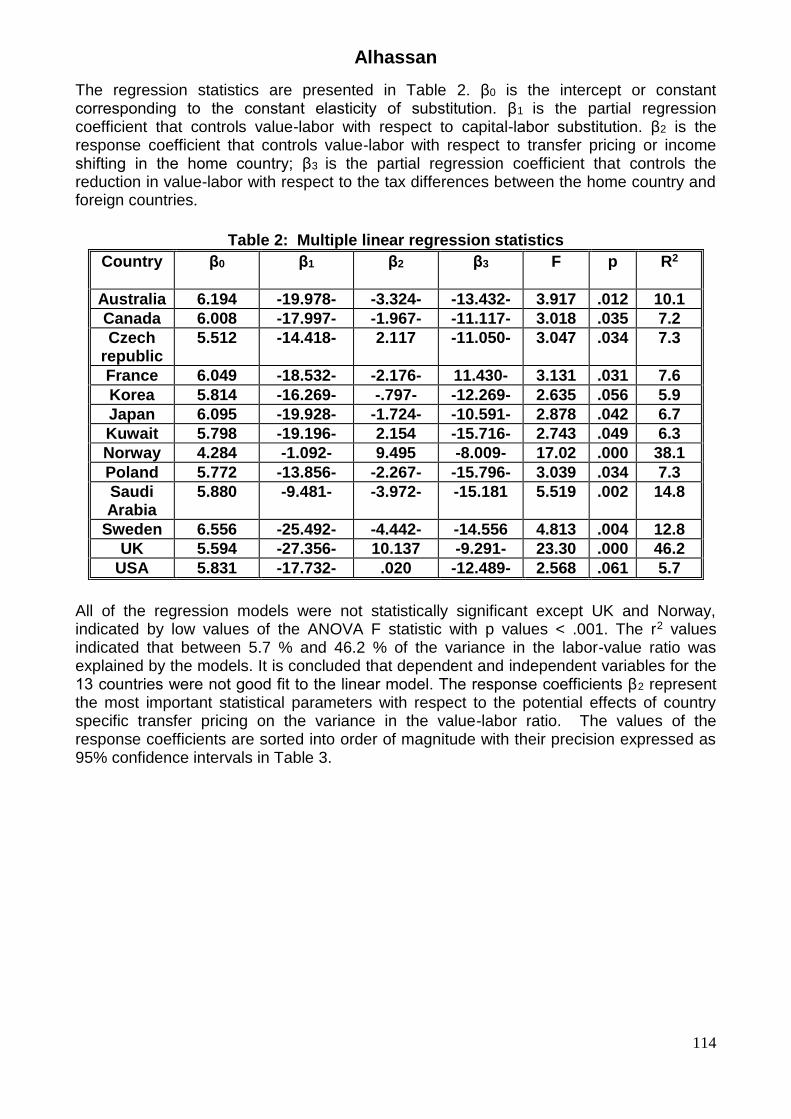
The regression statistics are presented in Table 2. β0 is the intercept or constant corresponding to the constant elasticity of substitution. β1 is the partial regression coefficient that controls value-labor with respect to capital-labor substitution. β2 is the response coefficient that controls value-labor with respect to transfer pricing or income shifting in the home country; β3 is the partial regression coefficient that controls the reduction in value-labor with respect to the tax differences between the home country and foreign countries.
Table 2: Multiple linear regression statistics
Country β0
β1
β2
β3
F p R2
Australia 6.194 -19.978- -3.324- -13.432- 3.917 .012 10.1
Sweden 6.556 -25.492- -4.442- -14.556 4.813 .004 12.8
UK 5.594 -27.356- 10.137 -9.291- 23.30 .000 46.2
USA 5.831 -17.732- .020 -12.489- 2.568 .061 5.7
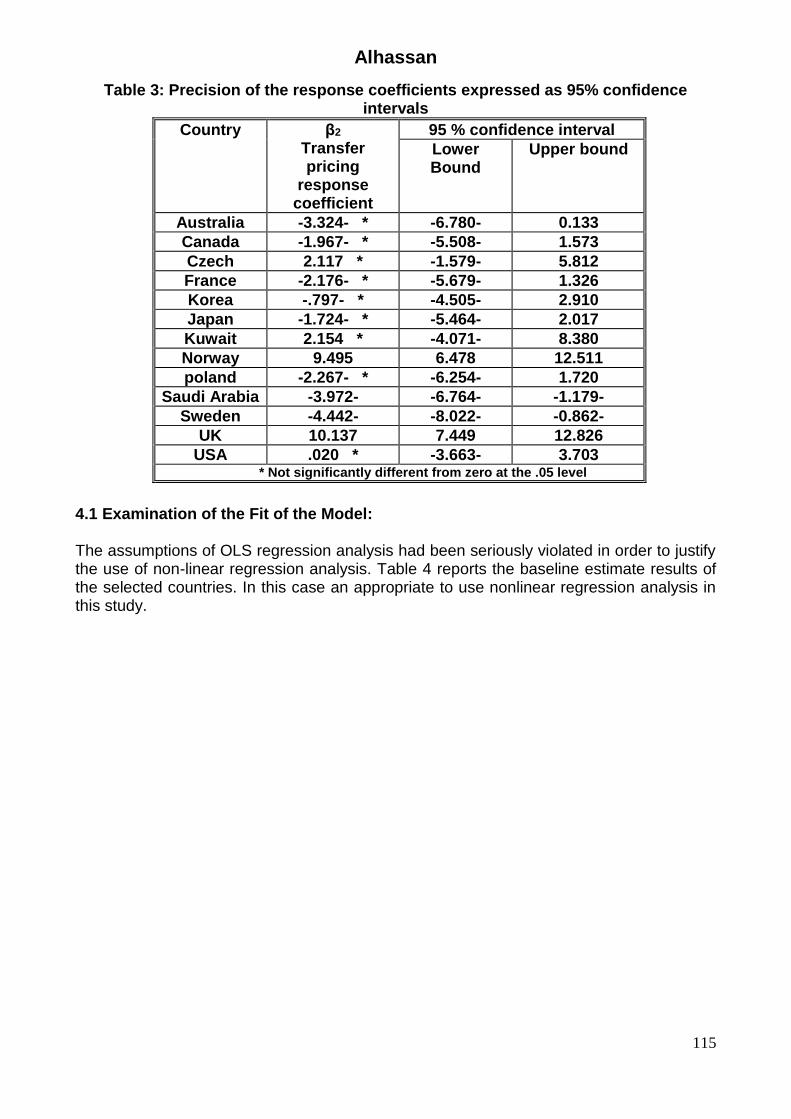
All of the regression models were not statistically significant except UK and Norway, indicated by low values of the ANOVA F statistic with p values < .001. The r2 values indicated that between 5.7 % and 46.2 % of the variance in the labor-value ratio was explained by the models. It is concluded that dependent and independent variables for the 13 countries were not good fit to the linear model. The response coefficients β2 represent the most important statistical parameters with respect to the potential effects of country specific transfer pricing on the variance in the value-labor ratio. The values of the response coefficients are sorted into order of magnitude with their precision expressed as 95% confidence intervals in Table 3.
Alhassan
115
Table 3: Precision of the response coefficients expressed as 95% confidence intervals
95 % confidence interval β2
Transfer pricing
response coefficient
Country
Upper bound Lower Bound
0.133 -6.780- -3.324- * Australia
1.573 -5.508- -1.967- * Canada
5.812 -1.579- 2.117 * Czech
1.326 -5.679- -2.176- * France
2.910 -4.505- -.797- * Korea
2.017 -5.464- -1.724- * Japan
8.380 -4.071- 2.154 * Kuwait
12.511 6.478 9.495 Norway
1.720 -6.254- -2.267- * poland
-1.179- -6.764- -3.972- Saudi Arabia
-0.862- -8.022- -4.442- Sweden
12.826 7.449 10.137 UK
3.703 -3.663- .020 * USA * Not significantly different from zero at the .05 level
4.1 Examination of the Fit of the Model:
The assumptions of OLS regression analysis had been seriously violated in order to justify the use of non-linear regression analysis. Table 4 reports the baseline estimate results of the selected countries. In this case an appropriate to use nonlinear regression analysis in this study.
Alhassan
116
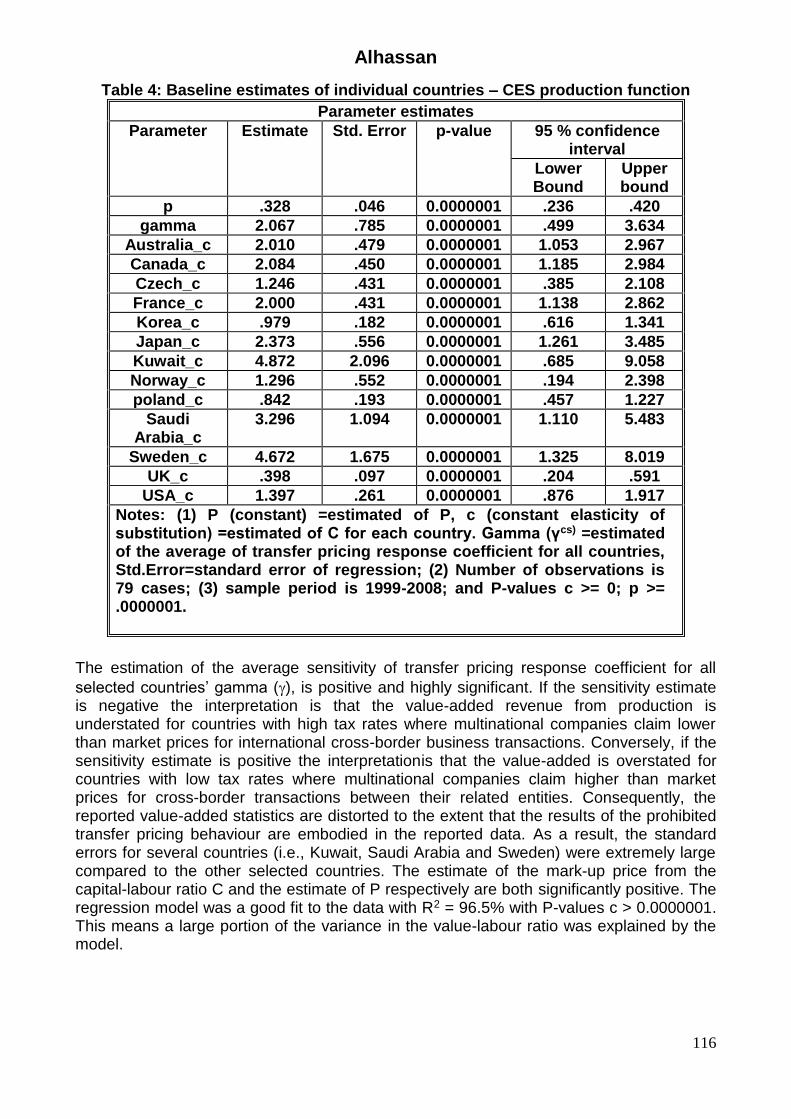
Table 4: Baseline estimates of individual countries – CES production function
Parameter estimates
95 % confidence interval
p-value Std. Error Estimate Parameter
Upper bound
Lower Bound
.420 .236 0.0000001 .046 .328 p
3.634 .499 0.0000001 .785 2.067 gamma
2.967 1.053 0.0000001 .479 2.010 Australia_c
2.984 1.185 0.0000001 .450 2.084 Canada_c
2.108 .385 0.0000001 .431 1.246 Czech_c
2.862 1.138 0.0000001 .431 2.000 France_c
1.341 .616 0.0000001 .182 .979 Korea_c
3.485 1.261 0.0000001 .556 2.373 Japan_c
9.058 .685 0.0000001 2.096 4.872 Kuwait_c
2.398 .194 0.0000001 .552 1.296 Norway_c
1.227 .457 0.0000001 .193 .842 poland_c
5.483 1.110 0.0000001 1.094 3.296 Saudi Arabia_c
8.019 1.325 0.0000001 1.675 4.672 Sweden_c
.591 .204 0.0000001 .097 .398 UK_c
1.917 .876 0.0000001 .261 1.397 USA_c
Notes: (1) P (constant) =estimated of P, c (constant elasticity of substitution) =estimated of C for each country. Gamma (γcs) =estimated of the average of transfer pricing response coefficient for all countries, Std.Error=standard error of regression; (2) Number of observations is 79 cases; (3) sample period is 1999-2008; and P-values c >= 0; p >= .0000001.
The estimation of the average sensitivity of transfer pricing response coefficient for all
selected countries’ gamma (), is positive and highly significant. If the sensitivity estimate is negative the interpretation is that the value-added revenue from production is understated for countries with high tax rates where multinational companies claim lower than market prices for international cross-border business transactions. Conversely, if the sensitivity estimate is positive the interpretationis that the value-added is overstated for countries with low tax rates where multinational companies claim higher than market prices for cross-border transactions between their related entities. Consequently, the reported value-added statistics are distorted to the extent that the results of the prohibited transfer pricing behaviour are embodied in the reported data. As a result, the standard errors for several countries (i.e., Kuwait, Saudi Arabia and Sweden) were extremely large compared to the other selected countries. The estimate of the mark-up price from the capital-labour ratio C and the estimate of P respectively are both significantly positive. The regression model was a good fit to the data with R2 = 96.5% with P-values c > 0.0000001. This means a large portion of the variance in the value-labour ratio was explained by the model.
Alhassan
117
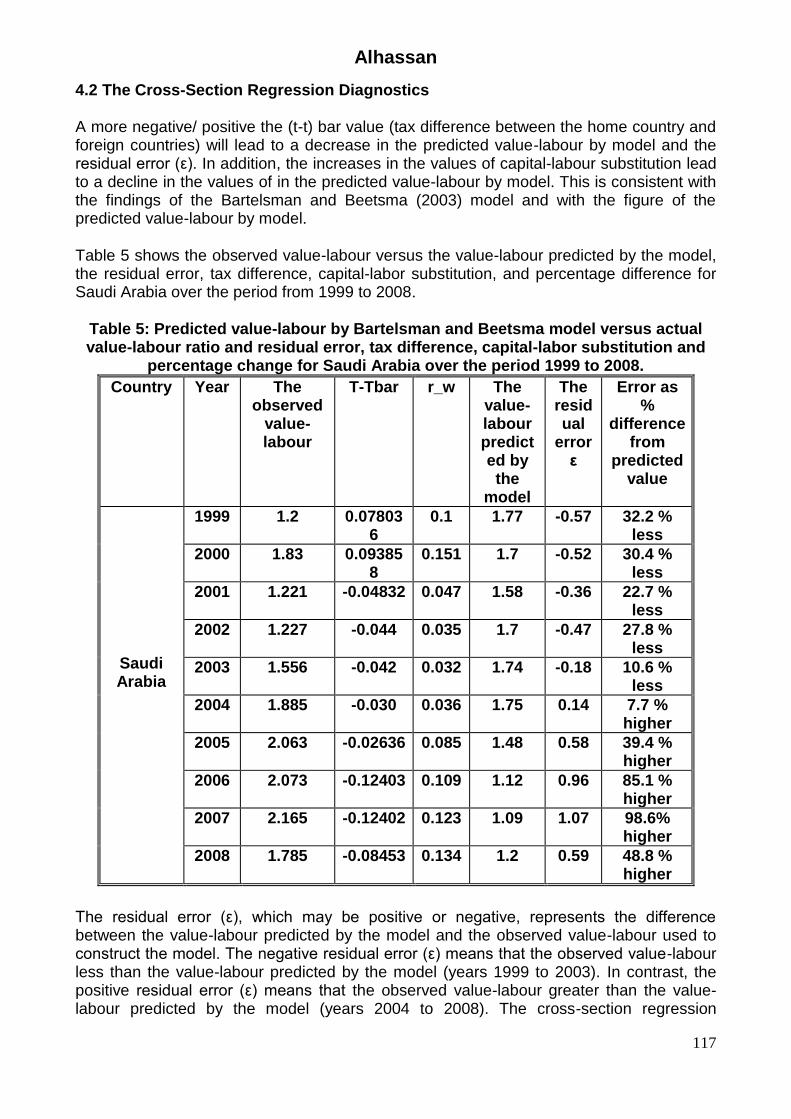
4.2 The Cross-Section Regression Diagnostics A more negative/ positive the (t-t) bar value (tax difference between the home country and foreign countries) will lead to a decrease in the predicted value-labour by model and the residual error (ε). In addition, the increases in the values of capital-labour substitution lead to a decline in the values of in the predicted value-labour by model. This is consistent with the findings of the Bartelsman and Beetsma (2003) model and with the figure of the predicted value-labour by model.
Table 5 shows the observed value-labour versus the value-labour predicted by the model, the residual error, tax difference, capital-labor substitution, and percentage difference for Saudi Arabia over the period from 1999 to 2008.
Table 5: Predicted value-labour by Bartelsman and Beetsma model versus actual value-labour ratio and residual error, tax difference, capital-labor substitution and
percentage change for Saudi Arabia over the period 1999 to 2008.
Error as %
difference from
predicted value
The residual
error ε
The value-labour predicted by the
model
r_w
T-Tbar The observed
value-labour
Year Country
32.2 % less
-0.57 1.77 0.1 0.078036
1.2 1999
Saudi Arabia
30.4 % less
-0.52 1.7 0.151 0.093858
1.83 2000
22.7 % less
-0.36 1.58 0.047 -0.04832 1.221 2001
27.8 % less
-0.47 1.7 0.035 -0.044 1.227 2002
10.6 % less
-0.18 1.74 0.032 -0.042 1.556 2003
7.7 % higher
0.14 1.75 0.036 -0.030 1.885 2004
39.4 % higher
0.58 1.48 0.085 -0.02636 2.063 2005
85.1 % higher
0.96 1.12 0.109 -0.12403 2.073 2006
98.6% higher
1.07 1.09 0.123 -0.12402 2.165 2007
48.8 % higher
0.59 1.2 0.134 -0.08453 1.785 2008
The residual error (ε), which may be positive or negative, represents the difference between the value-labour predicted by the model and the observed value-labour used to construct the model. The negative residual error (ε) means that the observed value-labour less than the value-labour predicted by the model (years 1999 to 2003). In contrast, the positive residual error (ε) means that the observed value-labour greater than the value-labour predicted by the model (years 2004 to 2008). The cross-section regression
Alhassan
118
diagnostics show that the residual error (ε) changes from negative (years 1999 to 2003) to positive (years 2004 to 2008). The predicted value–labour did not decrease over the period 2001-2005 possibly due to the value the capital-labour substitution in Saudi Arabia (r/ w) in 1999 and 2000 with positive t-t bar. The capital-labour substitution (r/ w) in 1999 and 2000 was compared with the value–labour in 2002 to 2005 and it was found that the values increased. Therefore, a more negative/ positive the (t-t) bar value (tax difference between the home country and foreign countries) will lead to a decrease in the predicted value-labour by model and the residual error (ε) (years 2005, 2006, 2007, and 2008). In addition, the increases in the values of capital-labour substitution lead to a decline in the values of in the predicted value-labour by model. This is consistent with the findings of the Bartelsman and Beetsma (2003) model and with the figure of the predicted value-labour by model of this study, but in (years 1999 to 2004) it was not reflected in the predicted values due to the value the capital-labour substitution in Saudi Arabia due to a significant change in the corporate tax policy in Saudi Arabia over the period from 1999 to 2008 with the headline corporate tax rates of companies being reduced significantly in two stages. In the period from 1999 to 2000 the tax rate was 45%. In the period from 2001 to 2005 the tax rate fell to 30%. In the period from 2006 to 2008, the tax rate fell to 20% as shown in (KPMG 2009).
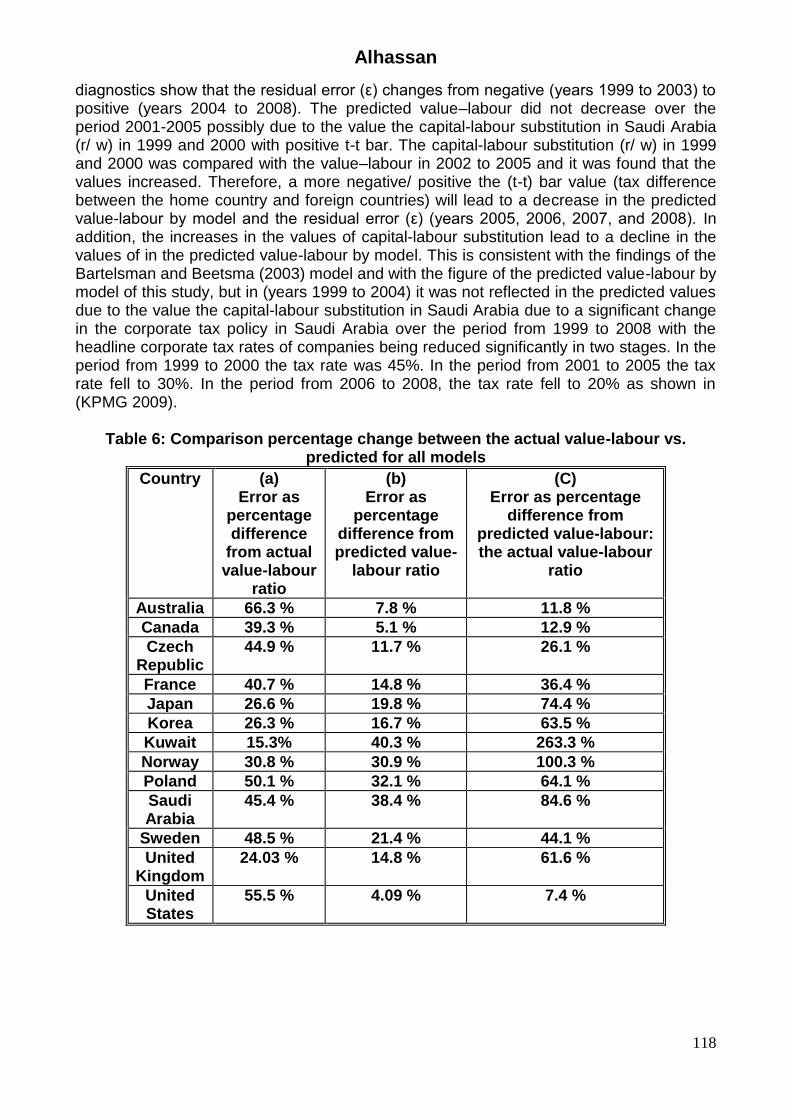
Table 6: Comparison percentage change between the actual value-labour vs. predicted for all models
Country
(a) Error as
percentage difference
from actual value-labour
ratio
(b) Error as
percentage difference from predicted value-
labour ratio
(C) Error as percentage
difference from predicted value-labour: the actual value-labour
ratio
Australia 66.3 % 7.8 % 11.8 %
Canada 39.3 % 5.1 % 12.9 %
Czech Republic
44.9 % 11.7 % 26.1 %
France 40.7 % 14.8 % 36.4 %
Japan 26.6 % 19.8 % 74.4 %
Korea 26.3 % 16.7 % 63.5 %
Kuwait 15.3% 40.3 % 263.3 %
Norway 30.8 % 30.9 % 100.3 %
Poland 50.1 % 32.1 % 64.1 %
Saudi Arabia
45.4 % 38.4 % 84.6 %
Sweden 48.5 % 21.4 % 44.1 %
United Kingdom
24.03 % 14.8 % 61.6 %
United States
55.5 % 4.09 % 7.4 %
Alhassan
119
Table 6 shows comparison percentage change between the actual value-labour vs. predicted for
all models. Column (a) displays error as percentage differences from actual value-labour ratio for this study for all selected grouping countries. Column (b) displays error as percentage difference from predicted value-labour ratio for this studyfor all selected grouping countries. Column (c) shows error as percentage difference from predicted value-labour to the actual value-labour ratio for this study for this study for all selected grouping countries. For example, in Saudi Arabia, the percentage of predicted value-labour ratio 38.4 %compared to the percentage of actual value-labour ratio 45.4 %. To calculate error as percentage difference from predicted value-labour to the actual value-labour ratio for this study in the column (c) as follow: (error as percentage difference from predicted value-labour ratio for this study column (b) /as percentage difference from actual value-labour ratio for this study column (a) * 100%). Therefore, error as percentage difference from predicted value-labour to the actual value-labour ratio for this study in in Saudi Arabia column (c) = 7.8/66.3 x 100% = 84.6 %.
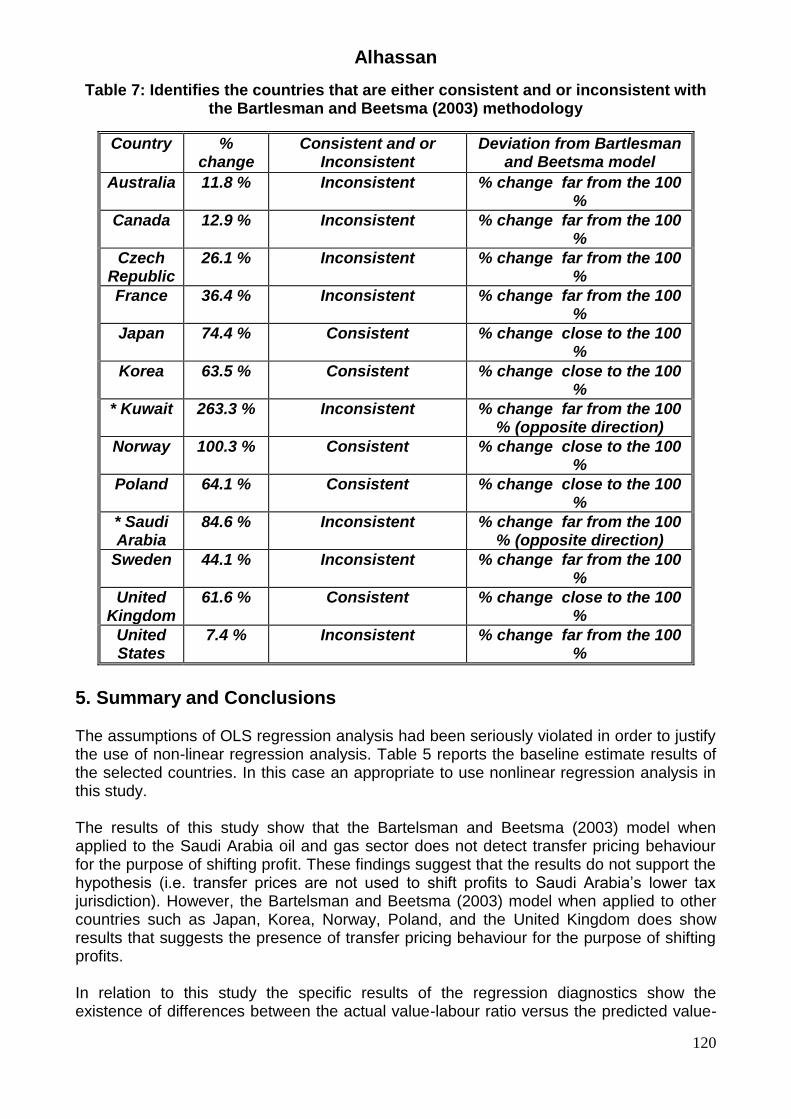
In the columns (b), the differences between the value of the largest and smallest value from predicted value-labour ratio for all selected grouping countries for this study calculated as follows: (a) finding the difference between the two numbers (subtraction). (b) Writing the answer as a fraction over the larger number (c) multiplying (b) by 100 (percentage). For example, the value-labour predicted by the model in Saudi Arabia in this study over the period from 1999 to 2008 Table 3=[1.77–1.09] / 1.77 = 0.384*100 = 38.4 %. Error as percentage difference from predicted value-labour ratio for the Bartelsman and Beetsma (2003) from our dataset = [1.33 – 1.31] / 1.33 = 0.015*100 = 1.5 %. These ratios incolumn (c) (error as percentage difference from predicted value-labour: the actual value-labour ratio) are considered good indicator wheneverthe percentage change of predicted value-labour for this study is compared to the actual value-labour ratio closeto100% in the same direction, with the exception of Saudi Arabia and Kuwait (opposite direction). Table 7 illustrates is that only 5 of the 13 countries consistent with the Bartlesman and Beetsma (2003) methodology. The Bartelsman and Beetsma (2003) method Imposes that every increase in the variable (t-t) bar value (tax difference between the home country and foreign countries) (negative or positive) and the variable capital-labour substitution leads to a decrease lead to a decline in the values of in the predicted value-labour by model. The second column shows the percentage change between predicted value-labour and the actual value-labour ratio, which was used as an indicator to see the countries that are consistent with the Bartelsman and Beetsma (2003) model.
Alhassan
120
Table 7: Identifies the countries that are either consistent and or inconsistent with the Bartlesman and Beetsma (2003) methodology
Country % change
Consistent and or Inconsistent
Deviation from Bartlesman and Beetsma model
Australia 11.8 % Inconsistent % change far from the 100 %
Canada 12.9 % Inconsistent % change far from the 100 %
Czech Republic
26.1 % Inconsistent % change far from the 100 %
France 36.4 % Inconsistent % change far from the 100 %
Japan 74.4 % Consistent % change close to the 100 %
Korea 63.5 % Consistent % change close to the 100 %
* Kuwait 263.3 % Inconsistent % change far from the 100 % (opposite direction)
Norway 100.3 % Consistent % change close to the 100 %
Poland 64.1 % Consistent % change close to the 100 %
* Saudi Arabia
84.6 % Inconsistent % change far from the 100 % (opposite direction)
Sweden 44.1 % Inconsistent % change far from the 100 %
United Kingdom
61.6 % Consistent % change close to the 100 %
United States
7.4 % Inconsistent % change far from the 100 %
5. Summary and Conclusions The assumptions of OLS regression analysis had been seriously violated in order to justify the use of non-linear regression analysis. Table 5 reports the baseline estimate results of the selected countries. In this case an appropriate to use nonlinear regression analysis in this study. The results of this study show that the Bartelsman and Beetsma (2003) model when applied to the Saudi Arabia oil and gas sector does not detect transfer pricing behaviour for the purpose of shifting profit. These findings suggest that the results do not support the hypothesis (i.e. transfer prices are not used to shift profits to Saudi Arabia’s lower tax jurisdiction). However, the Bartelsman and Beetsma (2003) model when applied to other countries such as Japan, Korea, Norway, Poland, and the United Kingdom does show results that suggests the presence of transfer pricing behaviour for the purpose of shifting profits. In relation to this study the specific results of the regression diagnostics show the existence of differences between the actual value-labour ratio versus the predicted value-
Alhassan
121
labour by Bartelsman and Beetsma (2003) model, as shown in Table 6. The value-labour figures predicted by the model are inflated compared to the actual value-labour figures during the period from 1999 to 2003, whilst the value-labour figures predicted by the model are deflated compared to the actual value-labour figures during the period from 2004 to 2008. These findings suggest that the results of this thesis do not support hypothesis (b), that is, the results do not detect that transfer pricing in Saudi Arabia’s oil and gas sector is used to shift profits to Saudi Arabia’s lower tax jurisdiction. However, the results of this paper should not be interpreted as meaning that profit shifting behaviour in the oil and gas sector of Saudi Arabia does not take place, just that it was not detected by the adapted Bartelsman and Beetsma (2003) model that relied entirely on the examination of publicly available data. Given that the Bartlesman and Beetsma (2003) model has been shown to be rigorous and robust in application to other sectors and in other countries, the implication arises whether the adaptation of the model is insufficient to be able to detect the behaviour being tested, or that the type of available public data is in itself inadequate in its content and form to be able to detect from it the behaviour being tested for. Sections Three and Four of this study set out the adaptation of the model in a manner that retained the conceptual rigour and robustness necessary to generate reliable results for the sector being examined. To this extent the adapted model can be used as a basis for other studies in the same and related sectors in other countries. As a consequence this study opens up a line of research to further test the adapted Bartelsman and Beetsma (2003) model for other national tax jurisdictions and thereby provide results that will enable comparisons and further refinement of the model, if necessary. This study can be used as a basis for the oil and gas sector in other countries.
References Bartelsman, E, & Beetsma, R 2003, ‘Why pay more? Corporate tax avoidance through
transfer pricing in OECD countries’,Journal of Public Economics, vol. 87, no. 9-10, pp.2225-2252.
Bernard, J & Genest-Laplante, E 1995, ‘Transfer pricing by the Canadian oil industry: a company analysis’,Applied Economics Letters, vol.3, no. 5, pp.333-340.
Biswas, R 2001,International tax competition: Globalisation and fiscal sovereignty, Commonwealth Secretariat, London.
Borkowski, SC 1992, ‘Choosing a transfer pricing method: A study of the domestic and international decision-making process’,Journal of International Accounting, Auditing and Taxation, pp.33-49.
Borkowski, SC 1997, ‘The transfer pricing concerns of developed and developing countries’,The International Journal of Accounting, vol. 32, no. 3, pp.321-336.
Cravens, KS 1997, ‘Examining the role of transfer pricing as a strategy for multinational firms’,International Business Review, vol. 6, no. 2, pp. 127-145.
Curtis, S 2008, ‘Transfer pricing for corporate treasury in the multinational enterprise’,Journal of Applied Corporate Finance, vol. 20, no. 2, pp.97-112.
Devereaux, M, Lockwood, B& Reoano, M 2008, ‘Do countries compete over corporate tax rates?’Journal of Public Economics, vol. 92, no. 5-6, pp.1210-1235.
Eden, L & Kudrle, RT 2005, ‘Tax havens: Renegade states in the international tax regime?’Law and Policy, vol. 27, no. 1, pp.100-127.
Alhassan
122
Grubert, H, Goodspeed, T & Sivenson, D 1993‘Explaining the low taxable income of foreign controlled companies in the United States’, in A Giovanni, Hubbarb, G & Slemrod, J (eds), Studies in International Taxation, National Bureau of Economic Research Project Report, University of Chicago.
Grubert, H & Mutti, J 1991, ‘Taxes, tariffs and transfer pricing in multinational corporate decision making’,The Review of Economics and Statistics, vol. 73, no. 2, pp.285-293.
Grubert, H & Slemrod, J 1998, ‘The effects of taxes on investment and income shifting to Puerto Rico’,The Review of Economics and Statistics Quarterly,vol. 80, no. 3, pp.365-373.
Harris, DG, Morck, R, Slemrod, J &Yeung, B 1991, ‘Income shifting in U.S. multinational corporations’,NBER Working paper, no.3924.
Hines, J & Rice, E 1994, ‘Fiscal paradise: foreign tax havens and American business’,Quarterly Journal of Economics, vol. 109, no. 1, pp.149-182.
Hoi Ki Ho, D 2008, ‘Multinational transfer pricing: Evidence in the United Kingdom’,International Tax Journal,vol. 34, no. 4, pp.43-48.
Hoonsawat, R 2007, Transfer pricing: Does the size and remoteness of countries matter? Department of Economics, Maxwell School of Citizenship and Public Affairs,Syracuse University,Syracuse,New York.
Johnson, W & Kirsh, R 1991, ‘International transfer pricing decision making in the United States’ multinationals’,International Journal of Management, vol. 89, no. 2, pp.817-828.
Lall, S 1973, ‘Transfer pricing by multinationals manufacturing firms’,Oxford Bulletin of Economics and Statistics, no. 35,pp.173-195.
Mehafdi, M 2000, ‘The ethics of international transfer pricing’,Journal of Business Ethics, vol. 28, no. 4, pp. 365-382.
Nielsen, SB, Raimondos-Møller, P & Schjelderup, G 2001, Formula apportionment and transfer pricing under oligopolistic competition, Norwegian School of Economics and Business Administration, Department of Economics, University of Bergen, Bergen.
Oyelere, PB & Emmanuel, CR 1998, ‘International transfer pricing and income shifting: Evidence from the UK’,European Accounting Review, vol. 7, no. 4, pp. 623-635.
Silva, EA 1999, ‘Transfer pricing under gross profit methods adjustment for functions performed’, Global Transfer Pricing, Aug-Sept, pp. 33-39.