Page 1
TRANSLATING CRUDE OIL FOULING TESTING RIG DATA TO THE FIELD:
A ROAD MAP FOR FUTURE RESEARCH
A. D. Smith1, E. M. Ishiyama1, J. S. Harris1, and M. R. Lane1
1 P.O. Box 1390, Navasota, TX 77868 USA [email protected]
ABSTRACT
To obtain fundamental and applied knowledge of crude
oil fouling, numerous researchers have conducted
experiments in various fouling test rigs to study fouling in a
controlled scientific manner. An ideal goal for applied
research is to use data obtained from test rigs to accurately
predict fouling in operating heat exchangers and associated
networks. Despite significant efforts to design fouling
equipment that better mimics the preheat train, direct
translation of test rig data to the field is yet to be achieved.
Successful translation of fouling rig data to a field heat
exchanger requires accounting both the impact of operating
conditions and the context of the results obtained from the
test rig. Although researchers have investigated many of the
operating conditions and the nature of fouling data obtained
from test rigs, which affect translation of fouling data, this
manuscript revisits these fundamentals to identify avenues
of research which are unanswered.
This paper organizes and discusses the key factors that
must be understood and modeled to be able to translate test
rig data to the field. The gaps in knowledge outline a
roadmap for future research.
INTRODUCTION
The complexity of crude oil fouling has resulted in
many types of fouling test rigs in different research groups
(Kolaczkowski, 1977; Eaton and Lux, 1984; Asomaning,
1990; Shetty et al., 2016; Tajudin et al., 2015; Smith, 2013;
Crittenden et al., 2015; Joshi, 2013). Currently, results of
crude oil fouling experiments provide insights on
fundamental behaviors and on the impact of different
surfaces and crude types (e.g., Hazelton et al., 2015). They
aid in the identification of dominant fouling mechanisms
and help in evaluation of the efficacy of mitigation
strategies (e.g., the use of antifoulants or coatings). They
also provide useful comparative results (e.g., Crude B has
an initial fouling rate twice that of Crude A), as well as
evaluation of fouling of crude blends including crude
incompatibility.
Although these applications are valuable, direct
quantitative translation of the fouling rig data to the plant is
not widely practiced. Translating fouling rig data to the field
and quantitatively using fluid chemistry to predict crude oil
fouling are two long-standing goals of crude oil fouling
research. Refiners especially want to know how a crude (or
blend) will foul and assess the fouling costs associated with
operation of the preheat train, as well as costs associated
with cleaning and modifications. These costs would then
inform the crude price and purchasing decisions.
This paper looks at the differences between fouling rigs
and preheat train exchangers and lays out the key factors
that are required to be addressed to successfully translate
test rig data to the field. From this, the fouling community
can assess the gap in achieving this goal and the research
required.
What we want to map
Translating rig data to the field requires models that
account for the impact that operating conditions and the test
rig have on fouling. As illustrated in Fig. 1,
1. Models need to fit fouling test rig data.
2. The translation process must update the models for
their application to the crude preheat train (PHT)
context.
Fig. 1 Illustration of how test rig results would be used to
predict refinery fouling.
Oil
Test
conditions
Test rig for a specific
surface material
Fouling resistance data
Fitted parameters
Translation
Fouling
model(s)
Updated model and
fitted parameters
PHT model Refinery
data
Heat
exchanger
details
PHT Rf predictions
1
2
Heat Exchanger Fouling and Cleaning – 2017
ISBN: 978-0-9984188-0-3; Published online www.heatexchanger-fouling.com 14
Page 2
How we can map rig data to field operations
Translation of fouling rig data to the field will rely on
the development of fouling models that can account for both
the fundamental impact of the operating conditions and for
test rig specific behaviors. The model and parameters fit to
fouling rig data would then be appropriately adjusted to
predict field scenarios.
For example, consider an experiment with the fouling
fluid recirculating through the fouling rig, assuming that
precursor depletion is a factor that must be accounted for
via a time-dependent expression (a term representing
concentration decreasing with time). To apply the model to
the context of the field (a quasi-constant precursor
concentration), the starting concentration would be used as
a constant and the time-dependent term eliminated.
Why we want to translate rig data to the field
Fouling test results will have applied value when
demonstrated to reliably predict field experience. Thus,
what is learned under scientifically controlled conditions
can be translated in terms of what actually occurs in the
preheat train.
If research can create models that use fluid chemistry
and transport processes to predict fouling in the fouling rig,
we are also capable of using chemistry to predict fouling in
the field; thus achieving and linking the two key goals of
crude oil fouling research.
Accurately translating fouling rig data to the field
demonstrates that the dominating factors affecting fouling
have been well understood. To improve on the existing
fouling research we intend to identify further obstacles that
requires attention to have a better translation of the rig
fouling data with that observed from the field. A summary
of challenges are summarized at the end of the manuscript
(Table 5).
Fouling test rigs
The fouling test rigs of interest in this discussion are
offline and are typically a batch-wise operation. Online slip-
stream style test rigs are outside the scope of this
discussion.
HTRI’s fouling rigs are designed to mimic as closely as
possible the PHT operating conditions such as flow,
temperatures, pressure, geometry, metallurgy, etc. (Bennett
et al., 2009). For the purposes of scientific research, these
rigs must have effective control of operating conditions,
allow repeatable results, and support high confidence in
measurement accuracy. However, not all industrial
considerations can be accounted in scientific testing,
resulting in differences, such as the fluid volume used, test
duration, and inspection/collection of the deposit; the
impact of these differences needs to be accounted when
translating the rig result to industrial operations.
Key differences between a fouling test rig and a refinery
PHT exchanger Mode of operation. Due to their duration of operation,
test rigs cannot typically operate in a continuous once-
through fashion and have flowrates and tube diameters
comparable to field PHTs. Virtually all fouling test rigs
perform a batch-wise operation with recirculated test fluid,
leading to concerns about precursor consumption and other
reactions that may occur from maintaining the test fluid at
elevated temperatures for sustained durations. In addition,
because the PHT is once-through flow and not all oil is the
same, the oil stream in a refinery is constantly changing in
contrast to a batch test.
Purpose of equipment—science vs. production. Crude
refinery operations are subject to real-world demands and
circumstances, resulting in regularly changing operating
conditions. Test rigs, however, are built for scientific
research, which leads to exclusion/inclusion of factors that
impact interpretation of test rig results. Test rigs operate
under well-controlled operating conditions; however, the
unpredictable nature of the refinery could contribute to
fouling problems (e.g., desalter problems). Replicating this
in a scientific manner is challenging. Fouling tests typically
start with a clean surface, whereas a field exchanger (except
when new) starts with some fouling layer even after
cleaning (Joshi, 2013; Ishiyama et al., 2009). This condition
difference impacts the initial fouling rate.
Heating method. For test rigs that use electrically
heated test sections and operate with a constant flux/duty,
the wall temperature increases and the surface temperature
remains approximately constant as fouling occurs. In
contrast, fouling in a heat exchanger decreases duty/flux,
the wall temperature remains approximately constant, and
the surface temperature decreases. Designs such as pilot-
scale double-pipe test rigs better mimic actual plant
behavior.
Fouling measurement. Some test rigs use the variation
in the fouling surface wall temperature as a measure of
fouling. In contrast, field fouling measurements are
obtained from the reconciliation of bulk temperatures,
pressures, and flows with thermal and hydraulic models
(Ishiyama et al., 2013b). Thus, the fouling measurement is
deduced based on available field data and the models used.
Depending on the available shell-side data and the modeling
techniques, fouling on the shell side may or may not be
lumped together with the tube-side fouling.
Comparison of rig and field data
HTRI has tested crude oils for its membership and
under proprietary contract. HTRI’s Crude Oil Fouling Task
Force (COFTF) has directed the HTRI Fouling Program to
primarily focus research efforts on the hot section of the
crude PHT. The following generalized discussion is based
by our experience testing in this operating space.
Quantitative comparison. Analysis and interpretation
of refinery data can be very challenging due to the variable
feedstock and operating conditions in a PHT. Although
noisy data are observed, defined measurable trends can be
obtained.
The fouling resistances observed in fouling rigs
typically range from 10-6 – 10-4 m2 K/W. Occasionally,
resistances as high as 10-3 m2 K/W can be observed,
Heat Exchanger Fouling and Cleaning – 2017
ISBN: 978-0-9984188-0-3; Published online www.heatexchanger-fouling.com 15
Page 3
although these are often at very low flow rates and/or
temperatures in excess of typical PHT conditions (Smith,
2013; Joshi, 2013; Srinivasan and Watkinson, 2015).
Generally, maximum resistances observed for field
exchangers are nominally 1 – 2 orders of magnitude greater
lying in a range of 10-4 – 10-2 m2 K/W (Joshi, 2013;
Ishiyama et al., 2013).
Although fouling rates are the primary metric, the
difference in absolute resistance affects the context of the
fouling scenario that the rate is measured (fouling on metal
vs. fouling on an aged deposit) and the dominating
resistance, which is discussed below.
Based on HTRI’s and COFTF members’ experience,
refinery heat exchangers tend to have higher fouling rates
than fouling rigs operating at similar test conditions. The
best direct assessment of this is shown in Table 1 that
compares the average field conditions and overall rate vs.
HTRI fouling tests for the same velocity and shear stress.
The constant velocity scenario had a fouling rate an order of
magnitude less than the field. The constant shear stress
scenario resulted in negative fouling.
Table 1. Comparison of field and test rig data for HTRI
Crude 20.
Field
exchanger
Test rig
(matching
field
velocity)
Test rig
(matching
field shear
stress)
Length of evaluation,
days 100 5.5 5.5
Metallurgy 317L SS 317L SS 317L SS
Tube diameter, mm 21.18 11.78 11.78
Tb, C 276.7 ± 6 275.9 ± 0.6 275.9± 0.6
Tw,0, C 282 ± 6 283 ± 5 283 ± 5
V, m/s 2.65 ± 0.3 2.65 ± 0.01 1.98 ± 0.01
τ, Pa 5 – 10 12.43 ±
0.01 7.49 ± 0.01
dRf /dt, m2 K/W day ~2.1x10⁻⁵ ~1.6x10⁻⁶ negative
Qualitative comparison. Qualitatively, fouling rigs are
generally trusted to provide reliable trends, insights, and
lessons learned to inform decision-making. It is for this
reason their use perpetuates within the industry. For
example, to compare two crudes, a fouling rig could
evaluate each crude at a common set of conditions and
determine which of the two oils fouled more. In 2013,
Smith presented data from the HTRI fouling rig ranking
eight different oils. The results compared very well with
industry experience.
Regarding fouling behavior, testing in fouling rigs can
result in trends in fouling resistance vs. time that are less
commonly observed in field data:
negative fouling resistances and rates at the beginning of
a test
induction periods dominating the duration of a fouling
test (in field data, induction periods are insignificant
compared to the operating period)
asymptotic fouling trends (Asomaning, 1990, Hout,
1983; Smith, 2013; Fig. 5)
Such differences in fouling behavior/context discourages
direct comparison of fouling rig data to field data
(Crittenden et al., 2015).
The following sections highlight key factors that need
to be quantitatively accounted for to successfully translate
fouling rig data to the field.
ACCOUNTING FOR OPERATING CONDITION
DIFFERENCES
Flow
For crude oil and other hydrocarbon systems, the
general trend of fouling with flow has been discussed in
literature (Crittenden et al., 1987; Epstein, 1994; Crittenden
et al., 2007; Petkovic and Watkinson, 2014).
Fouling data reported by Crittenden (1987) and
Crittenden et al. (2007) show for that, for both a styrene and
a crude oil system (Maya crude oil), fouling increases with
flow up to a maximum (transport limited flow region), and
then fouling decreases as flow rate increases. However, the
physical relationship of flow rate and fouling rate is less
clear. At very low flows, there is little turbulence, and the
fouling rate is diffusion limited. This is elaborated in
Epstein’s chemical reaction fouling model (Epstein, 1994).
As transport limitations become negligible at higher flow
rates, several theories could be discussed on the cause of the
reduction in fouling with increased flow. Epstein proposed
that it was the average residence time a parcel of fluid spent
at the wall (chemical reaction perspective), however, the
data used to fit this model had little to no data at much
higher flow rates that would be necessary to support this
hypothesis.
The authors have considered that fouling may be better
modeled as catalysis reaction, given that fouling is a surface
dependent phenomenon; thus, boundary layer thickness is
the governing flow property, as previously visited by
Paterson and Fryer (1988) for modeling milk fouling. To
test this hypothesis, the term representing the residence-
time-at-the-wall in Epstein’s model was substituted for
boundary layer thickness, and the revised model was fitted
to Crittenden’s (1987) data. Fig. 2 shows the comparison of
these two model versions to predict Crittenden’s data; both
appear to fit equally well. Interestingly, the two versions
have very different projections of fouling rate at much
higher flow rates. If data were obtained at much high
flowrates, it could help assess which model version is most
accurate and provide a strong suggestion as to the physics of
how flow impacts fouling for such system. Crude oil fouling
can consist of a combination of fouling mechanisms (e.g.
combination of autoxidation, polymerization and thermal
decomposition). It is not yet understood if the influence of
flow is universal or different for different fouling
mechanisms. Quantification of individual mechanisms and
the assessment of the impact of flow on each mechanism
would be a long-term goal.
Ebert and Panchal (1996) and others have created a
series of so called threshold fouling models (Wilson, 2014)
in which fouling rate is the sum of deposition, typically
governed by Reynolds number (turbulence), and removal or
suppression, typically governed by shear stress or velocity.
Heat Exchanger Fouling and Cleaning – 2017
ISBN: 978-0-9984188-0-3; Published online www.heatexchanger-fouling.com 16
Page 4
The variety of flow expressions in the literature fouling
models provide the impact of flow on fouling but not
necessarily the fundamental insight.
How the impact of flow is modeled directly impacts
how rig data are quantitatively translated to the field. Many
fouling rigs have a different geometry than a field heat
exchanger. Further, not all PHT exchangers have the same
size tubes. The physics of how flow impacts fouling is
necessary to accurately adjust the fouling rate obtained in a
fouling unit to a scenario with a different (typically larger)
flow path diameter.
e
Fig. 2 Two versions of the Epstein (1994) model fit to
styrene in kerosene data (Crittenden 1987). Top – Epstein’s
original model (fouling regulated by residence time at the
surface). Bottom – fouling regulated by boundary layer
thickness. The prediction line for Ts = 170 °C is bold to aid
comparison.
Although the directional impact on fouling for the
various proposed regulating flow parameters (velocity,
shear stress, boundary layer thickness, retention time at the
wall (boundary layer thickness divided by shear velocity),
and Reynolds number) trend together, a change in diameter
impacts each differently. Fig. 3 shows how four different
flow parameters trend with velocity for two different
diameters. It can be seen that the relative difference between
the two tube diameters is different for each flow parameter.
Thus, the amplitude of how a fouling prediction scales
depends on the parameter that the fouling model uses.
Future research needs to focus on understanding the physics
of how flow impacts fouling rate for a variety of fouling
mechanisms.
Fig. 3 Variation of four flow parameters with velocity for a
21.2-mm tube ID (PHT exchanger) and an 11.8-mm tube ID
(HTRI fouling rig). Percent difference is relative to the
11.8-mm tube ID. Fluid properties are that of HTRI Crude
19 at Tb = 260 °C and Ts = 300 °C.
Temperatures
For fouling, two temperatures are in play: the bulk
temperature of the fluid flowing through the system and the
deposition temperature (the temperature regulating the
attachment of material to the heat transfer surface).
Ts = 75 °CTs = 100 °C
Ts = 230 °C
Ts = 210 °C
Ts = 190 °C
Ts = 170 °C
Ts = 150 °C
Ts = 120 °C
0.0E+00
2.0E-03
4.0E-03
6.0E-03
8.0E-03
1.0E-02
1.2E-02
1.4E-02
1.6E-02
1.8E-02
0.0 0.5 1.0 1.5 2.0 2.5 3.0
dR
f/d
t,m
2K
/W d
V, m/s
Ts = 75 °C
Ts = 100 °C
Ts = 210 °C
Ts = 190 °C
Ts = 170 °C
Ts = 150 °C
Ts = 120 °C
0.0E+00
2.0E-03
4.0E-03
6.0E-03
8.0E-03
1.0E-02
1.2E-02
1.4E-02
1.6E-02
1.8E-02
0.0 0.5 1.0 1.5 2.0 2.5 3.0
dR
f/d
t,m
2K
/W d
V, m/s
-0.18
-0.12
-0.06
0
0
4
8
12
0.00 1.00 2.00 3.00
% d
iffe
ren
ce
τ, P
a
0
0.02
0.04
0.06
0.08
0.1
0.12
0
20
40
60
80
100
120
0.00 1.00 2.00 3.00
% d
iffe
ren
ce
Bo
un
da
ry l
ay
er
thic
kn
ess,
µm
0
0.05
0.1
0.15
0.2
0
2
4
6
8
0.00 1.00 2.00 3.00
% d
iffe
ren
ce
Res
iden
ce t
ime
at
the
wa
ll, m
S
0.00
0.25
0.50
0.75
1.00
0
20000
40000
60000
80000
100000
120000
140000
160000
0.00 1.00 2.00 3.00
% d
iffe
ren
ce
Re
Velocity, m/sTube ID = 21.2 mmTube ID =11.8 mm
Heat Exchanger Fouling and Cleaning – 2017
ISBN: 978-0-9984188-0-3; Published online www.heatexchanger-fouling.com 17
Page 5
Bulk temperature. Beyond its impact on physical
properties, the explicit impact of bulk temperature on
fouling is largely ignored in current crude oil fouling
models (Wilson, 2014). Some models use film temperature,
which is a combination of bulk and surface temperature
(Watkinson, 2007). Given the complexity of crude oil
fouling, this assumption is, at face value, reasonable given
that the higher deposition temperature is considered a
dominating factor. Although ignoring bulk temperature is
convenient for model development, doing so overlooks the
impact of bulk phase reactions and solubility, significant
phenomena that are strongly affected by temperature and
that can significantly affect the fouling behavior.
Some researchers have shown that increasing bulk
temperature decreased fouling (Eaton and Lux, 1984;
Asomaning, 1997; Kovo, 2006; Panchal et al., 1997) while
others have shown the opposite (Srinivasan and Watkinson,
2015; Saleh et al., 2005, Oufer, 1997; Wang and Watkinson,
2015). These contradictory trends suggest competing
mechanisms and/or a variance in the dominant mechanism
from crude to crude. What can be concluded from these data
is that bulk temperature does have a significant impact on
fouling that should not be ignored.
With respect to temperature, fouling rig experiments
either maintain the bulk temperature constant and vary the
wall temperature (or vice versa) or maintain a constant wall-
bulk temperature difference. In a heat exchanger, the bulk
and wall/surface temperature (and therefore the wall-bulk
temperature difference) vary along the length of the
exchanger. Thus, experimental data never exactly matches
the field scenario. If models are developed from test rig data
obtained at a constant bulk temperature or a constant wall-
bulk temperature difference, they may introduce large errors
when the same models are used to predict fouling at a
different bulk temperature if the impact of bulk temperature
is not explicitly accounted for.
As further discussed by Shetty et al. (2016), bulk
temperature clearly has an impact. Future work could
include gathering more data to support/improve such bulk
temperature relationships and use of such model approaches
when modeling industrial heat exchanger performances.
Deposition temperature. Many researchers have defined
the general trend with deposition temperature and
demonstrated it to be modeled well by an Arrhenius type
expression. If fouling rigs are operated with a constant duty,
then when fouling progresses, the wall temperature (surface
of the metal) increases and the surface or skin temperature
(surface of the deposit that is touching the fluid) is
maintained approximately constant. Film temperature is a
temperature in between the wall and bulk temperature and is
commonly assessed by interpolation (Equ. (1)). Ebert and
Panchal (1996) proposed an α of 0.55. Depending on the
fouling mechanism, the dominant temperature could vary
between film and surface. This needs to be explored in the
context of fouling experienced in the crude PHT.
( )f w b bT T T T (1)
In contrast, the duty of a heat exchanger decreases as
fouling occurs; the operation is closer to having a constant
wall temperature (compared to having a constant heat duty)
and the surface temperature decreases. The temperature
that drives deposition has been a matter of debate (skin vs.
film temperature) (Wilson, 2014). The trend of wall, skin,
or film temperature with increased fouling are important
considerations as each has different implications on how a
model interprets a rig and PHT scenario (Table 2). The
trend with wall temperature does not correspond to most
fouling rig rate trends. For this reason, most models do not
use wall temperature, or, if they do, it is the initial wall
temperature, which is approximately equal to the surface
temperature for a test operating with a constant duty
(Wilson, 2014). Although the trends shown in Table 2 for
surface and film temperature are the same, film temperature
implies that fouling rate always increases with increasing
bulk temperature, which is not always the case. Surface
temperature has logical trends, is independent of bulk
temperature, and is the temperature of the surface exposed
to the fluid. For these reasons, it is the most often used in
fouling models (Wilson, 2014).
Table 2. Nominal fouling rate trends with respect to
deposition temperature only as fouling resistance increases
for a fouling rig and a PHT exchanger, given the same
initial deposition temperature
Same initial
temperature
Rig fouling rate
trend (constant
heat flux)
PHT fouling rate
trend (~constant
wall temp.)
Wall Increases ~ Constant
Surface ~ Constant Decreases
Film ~ Constant Decreases
Pressure
Of all the operating conditions, pressure is the most
dismissed and perhaps the least understood in testing. The
impact of pressure on fouling in a test rig is complicated by
not only what the pressure is, but how the pressurization is
achieved, and whether the system has a headspace.
Preheat train heat exchangers operate at 140 – 500 psig,
which is typically sufficient to prevent boiling. However
boiling can occur in the PHT (Ishiyama and Pugh, 2013).
In general, fouling tests are pressurized to maintain single-
phase conditions. However, the accuracy of bubble point
curves from the physical property generator software is
unknown. Thus, if the system is not sufficiently over
pressurized, boiling can occur, further convoluting fouling
test results (Harris et al., 2017). As a conservative practice,
HTRI and many others had used nitrogen to pressurize the
fluid (Watkinson et al., 2000; Saleh et al., 2005; Yang et al.,
2009). Since 2014-2015, HTRI has continued to challenge
and improve its pressurization practices.
The actual pressure of the single-phase system may not
affect fouling nearly as much as the method used to obtain
the pressure in the experiment. For systems pressurized with
nitrogen (Watkinson et al., 2000; Saleh et al., 2005; Yang et
al., 2009), the fouling units are typically allowed to have
some gas headspace. This headspace provides room for the
Heat Exchanger Fouling and Cleaning – 2017
ISBN: 978-0-9984188-0-3; Published online www.heatexchanger-fouling.com 18
Page 6
fluid to expand when heated, but it also allows lighter gas
components of the oil to accumulate as the fluid is heated.
The pressure affects the solubility of those light components
in the gas and can affect the solubility of fouling
components in the fluid. Additionally, nitrogen dissolved in
the gas may boil out of the solution at the surface (Hout,
1983; Fetissoff et al. 1982). Nitrogen may also impact the
solubility of heavy oil components such as asphaltenes
(Asomaning, 1997). Sometimes units are allowed to build
pressure naturally, either through vapor pressure in the head
space or through expansion of the fluid. When the
temperature is stable, nitrogen may be added to achieve the
final target pressure. The fluid expansion approach was
used by Harris et al. (2017) because it eliminated the use of
nitrogen. Additionally, the test section power was used to
heat up the bulk fluid. However, it has recently been
realized that this method results in the wall temperature
crossing the bubble point curve during start-up which leads
to fouling before the establishment of the references point (t
= 0) as shown in Fig 4. Thus, the conclusion by Harris et al.
(2017) may be more a reflection of the pressurization
practice than it is of the pressure; however, new data have
not been obtained to confirm this hypothesis.
Fig. 4 Wall (Tw) and bulk (Tb) temperature vs pressure
profiles for a fouling test during which the wall temperature
crossed the bubble point during start-up.
Going forward, it is possible that pressure may impact
fouling, for example by having impact on asphaltene
solubility. To date, data from the literature have not been
obtained that investigate the impact of pressure that do not
also have caveats about the pressurization practice used. For
the integrity of fouling rig data and conclusions, let alone
the ability to translate that data to the field, pressurization
practices need to be adopted that do not involve nitrogen,
obtain pressures similar to the field, and avoid boiling (or
close proximity to the bubble point), both during start-up
and throughout the test.
ACCOUNTING FOR IMPACT OF DEPOSITION
Fouling deposition manifests differently in a PHT and a
test rig. Fouling rigs often produce data with trends that are
not as commonly observed in field data, which include
asymptotic fouling, negative fouling, and induction periods.
These trends can result from one or more of the issues
discussed below.
Precursor Concentration, Consumption, and Generation
The identity of fouling precursors is often vague and
may vary among different hydrocarbon streams. Precursors
may be immediately present in the oil or created via
reaction at elevated test temperatures (Panchal and
Watkinson, 1993; Wilson, 2014). The concentration of
precursors may both increase and decrease over the duration
of a batch fouling test. In contrast, a refinery heat exchanger
receives a continuous once-through stream of fluid with a
precursor concentration that is more closely approximated
as constant.
Precursor consumption during a fouling test is an often
debated concern (Wilson, 2014). It has been argued that
precursor depletion is responsible for asymptotic fouling
trends, making initial fouling rate a key measurement for
fouling rig data. The rationale is straightforward; batch
fouling units contain a finite amount of test fluid, and as the
test progresses and material is removed as a result of
fouling, the fluid’s precursor concentration is depleted,
affecting the fouling rate. Counterarguments point to
concentrations of presumed fouling precursors (often
asphaltenes) and contend that significant depletion is
unreasonable. For example, 4L of crude (860 kg/m3)
containing 0.5 w/w% asphaltenes would hold 17.2 g of
asphaltenes. For a fouling unit with a heated area of
~40 cm2, a deposit for Rf = 10-4 m2 K/W would have a mass
of 0.1–0.2 g (~1% of the mass of the asphaltenes in the
crude).
HTRI recently conducted a series of four successive
tests where the oil from the previous test was reused for the
next test. To evaluate concerns of precursor depletion, the
fourth test had the same test conditions as the first (V = 1.1
m/s, Tw = 361 °C, Tb = 260 °C, P = 2000 kPa). As shown in
Fig. 5, Run 4 showed much less fouling than Run 1. The
reduction in fouling was suspected to be due to precursor
depletion. Deposit analysis indicated that the Run 1 deposit
contained much more iron and sulfur than that of Run 4
(Table 3). Oil analysis prior to Run 1 and after Run 4 (Table
4) also indicated that iron was depleted from the oil. In this
example, iron was not the only fouling precursor but clearly
played a significant role. This example clearly illustrates
that fouling precursors can be depleted from batch testing
and that precursors can exist in trace (ppm) concentrations.
Accounting for precursor depletion in batch fouling tests is
critical to translating data to the field; otherwise, measured
rates may be underestimated.
Conversely, fouling precursors can be generated during
a fouling test, for example, bulk phase precipitation of
asphaltenes driven by bulk temperature (Wilson, 2014;
Hout, 1983; Watkinson and Wilson, 1997). In a refinery,
this reaction may be slower than the residence time in the
heat exchanger and, thus, its impact is not experienced. If it
does occur in the heat exchanger, it likely attains some
pseudo steady-state, at which point the precursor
concentration behaves as though it is constant. In a batch
fouling system, the fluid is maintained at temperature for a
0
50
100
150
200
250
300
350
400
450
500
0 20 40 60
Tem
per
atu
re,
°C
Pressure, barg
Bubble Point Tw Tb
Tw crossed
bubble point
during heat up
Pressurization via fluid expansion;
pressure swings due to fluid bleed off
Tw Tb
time
Heat Exchanger Fouling and Cleaning – 2017
ISBN: 978-0-9984188-0-3; Published online www.heatexchanger-fouling.com 19
Page 7
much longer duration than the residence time of crude in the
preheat train. As a result, intermediate reactions may
proceed to a greater extent of conversion. It is even possible
for the precursor concentration to decrease (immediate use
of initial precursors), increase (generation of new
precursors), and then decrease (consumption of new
precursors when production has peaked). If methods do not
properly account for the generation of precursors, field
predictions could be overstated.
Fig. 5 Fouling resistance plots for Runs 1 (top) and 4
(bottom) of a four-test series using the same batch of crude.
Runs 1 and 4 had the same test conditions.
Table 3 Deposit analysis of Runs 1 and 4.
Element Run 1 (w/w %) Run 4 (w/w %)
C 45.0 75.1
O 6.2 5.5
Si 0.4 0.1
S 18.4 3.5
Ca 1.0 –
Cr 1.8 4.0
Fe 25.6 9.8
Ni 1.0 –
Table 4 Oil analysis prior to Run 1 and after Run 4.
Element Prior to Run 1
(ppm) After Run 4
(ppm)
Fe 747.5 114
Ni 36.2 38.9
V 119 134
Future research needs to focus on identification of
fouling precursors and methods to model transient
concentrations during batch tests.
Influence of the Deposit
Dynamic variation in surface roughness, thickness, and
thermo-physical properties of the foulant deposits can have
a significant influence on quantifying the thermal and
hydraulic impact of fouling. Laboratory experiments are
typically conducted on clean surfaces, and PHT fouling
occurs on fouled surfaces (with the exception of new
equipment); the extent to which the deposit influences the
fouling rate will be different.
Variation in surface roughness can result in heat
transfer enhancements and have been observed
experimentally (e.g., Albert et al., 2011; Crittenden and
Alderman, 1988). Changes in deposit thickness and
variation in surface roughness have been further accounted
in data reduction methods used for interpreting laboratory
data (Albert et al., 2011). Usually, obtaining information on
surface roughness variation in industrial exchangers is
impractical. Not all industrial exchangers have pressure
drop measurements. In cases where pressure drop
measurements for industrial exchangers are available, it is
possible to obtain information relating to the deposit
thickness and deposit thermal conductivity (Ishiyama et al.,
2017), which assists in interpretation of exchanger thermo-
hydraulics. Fouling rig tests often result in low fouling
resistances (circa 10-5 m2 K/W) with small fouling layer
thicknesses (< 25 µm) so that pressure drop changes may
not be detectable. Thus, obtaining useful deposit property
data is more challenging and relies on additional equipment
such as confocal laser scanning microscopes to measure the
deposit thickness.
Both industrial and laboratory fouling deposits can be
subject to deposit aging (the changes in thermo-physical
properties of the foulant deposit with time). Aging affects
fouling measurement, prediction, and comparison of test rig
data to PHT data. Aging is likely to occur in industrial
exchangers when the foulant deposit is exposed to a heated
surface for a prolonged period of time (Ishiyama et al, 2010;
Ishiyama, 2010). However, the aging effects could be
masked with deposition of fresh foulants. Future research
should consider development and validation of aging
models through laboratory experiments where a fouling run
is allowed to continue for a prolonged period even after the
deposition process has ended (i.e., after depletion of the
precursors).
Changing Heat Transfer Coefficient
Compared to data collected from a plant, fouling
measurements in a test rig are collected for a shorter period
of time, resulting in smaller values in fouling resistances, Rf,
and a potential for higher errors based on how Rf is
calculated.
Consider Rf measured as the difference between the
overall heat transfer coefficient at a given time step (U) vs.
at a reference time step (U0) that is presumed to have no
fouling at the same operating condition:
0
1 1fR
U U (2)
For a fouling test rig that measures and monitors the metal
surface temperature, the clean overall heat transfer
coefficient is equal to the convective heat transfer
coefficient, h0:
-2.E-05
0.E+00
2.E-05
4.E-05
6.E-05
8.E-05
0 1 2 3 4 5 6 7 8 9 10 11 12
Rf, m
2K
/W
Run time, days
Run 1
-2.E-05
0.E+00
2.E-05
4.E-05
6.E-05
8.E-05
0 1 2 3 4 5 6 7 8 9 10 11 12
Rf, m
2 K
/W
Run time, days
Run 4
Heat Exchanger Fouling and Cleaning – 2017
ISBN: 978-0-9984188-0-3; Published online www.heatexchanger-fouling.com 20
Page 8
0 0
1 1
U h (3)
Likewise, when fouling occurs, the overall heat transfer
coefficient is the combined resistance of the deposit (Rd)
and the convective heat transfer coefficient:
1 1dR
U h (4)
When operating conditions are held constant throughout the
test, if it is assumed that the current and initial heat transfer
coefficients are identical, then Rf is equal to Rd .
0
1 1f dR R
h h
(4)
Although this logic seems reasonable, the convective
heat transfer coefficient is unlikely to be constant. Material
building up on the surface impacts the roughness and the
surface temperature of the deposit, both of which have at
least a small (< 5%) impact on the convective heat transfer
coefficient. While even a 1% impact on the heat transfer
coefficient does not seem sufficient for concern, it can have
profound impact on Rf. Fig. 6 shows the percent difference
between Rd and Rf as a result of a 1% change in the heat
transfer coefficient as a function of Rf for a low and a high
heat transfer coefficient. From the figure, for a fouling
resistance of 10-5 m2 K/W (typical rig fouling resistance), a
1% change in h creates a relative difference of 30 – 100%
that directly impacts assessment of fouling rates; for a
fouling resistance of 10-3 m2 K/W, a 1% variation in h
results in a relative difference of 1% or less (negligible).
Modeling of variations in h0 have been discussed by
Albert et al. (2011) and would need to be considered, where
possible.
When applying or regressing a fouling model it is often
assumed the heat transfer coefficient is constant as fouling
occurs; thus, h is not a modeled variable. Small changes in h
can have such a profound impact on Rf, so fitting Rd models
to Rf data results in an inherently error prone model because
the impact of changing h is not independently accounted
for. Without the ability to segregate the contribution of h
and Rd, trends such as asymptotic fouling, negative fouling,
and induction periods are difficult to interpret and model.
To resolve this concern, future research should develop
methods to segregate and individually model the impact of
Rd and h by collecting and using both thermal and hydraulic
data to reconcile fouling rig measurements. For example,
the Gnielinski and Churchill correlations could be used to
segregate Rd and h (Bennett and Huang, 2009). Although
surface roughness has long been acknowledged to impact
heat transfer and pressure drop, additional research is
needed to identify which surface roughness parameters
(Keyence, 2015) best correlate with heat transfer, pressure
drop, and fouling. To achieve this, surface roughness
measurement needs to be incorporated in fouling research
using advanced tools such as laser confocal microscopes
that can provide the surface topography data and quantify
more than 50 different surface roughness parameters. For
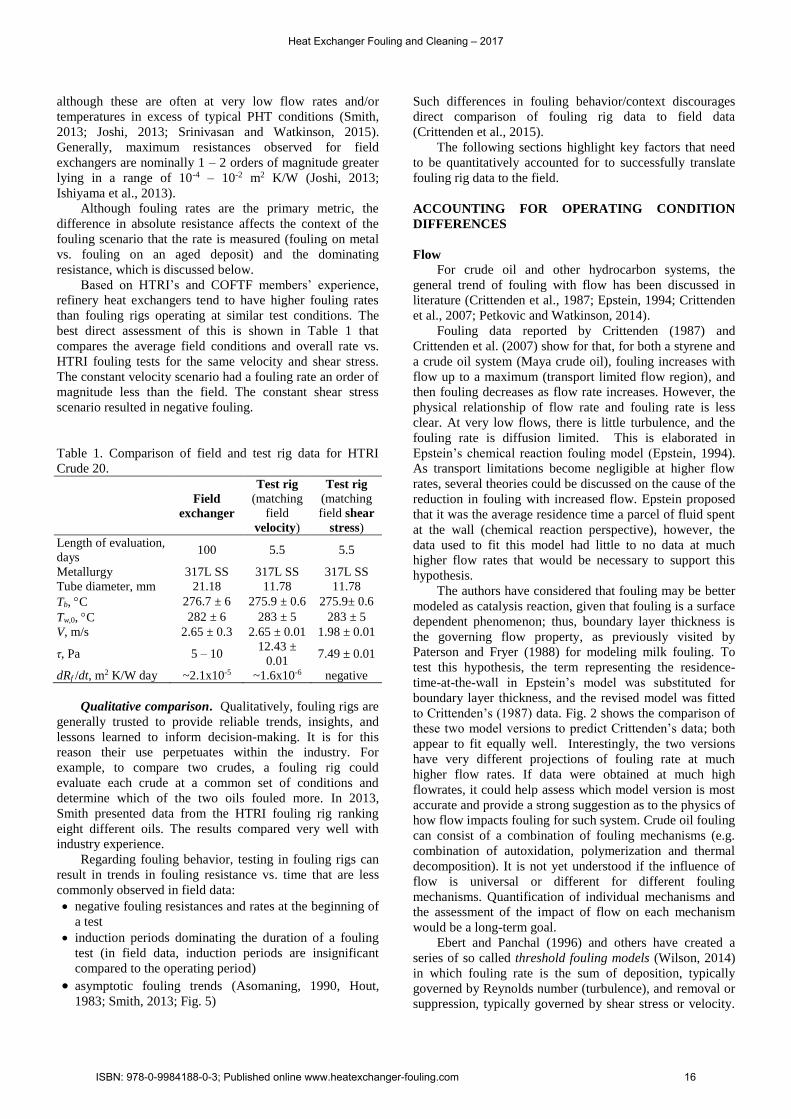
example, Fig. 7 shows 3D images for a clean and negatively
fouled surface from which qualitative roughness differences
are obvious, and quantitative differences may be measured
using software.
Fig. 6 Relative difference between Rd and Rf as function of
Rf for a high and low tube-side heat transfer coefficient.
Surface Transition
Except for new heat exchanger bundles, fouling in a
refinery heat exchanger begins with some deposit left on the
surface, even after cleaning (Joshi, 2013; Ishiyama et al.,
2009). Thus, fouling in an exchanger is deposition on an
existing deposit. In contrast, the test section surface of a test
rig is often rigorously cleaned or possibly replaced prior to
each test. Thus, fouling in a test rig must undergo a
transition of fouling to bare metal to fouling on deposit. The
properties of the surface (composition, texture, etc.) affect
the rate of attachment. Unless the bare metal surface and the
deposit have an equal (or similar) impact on deposition rate,
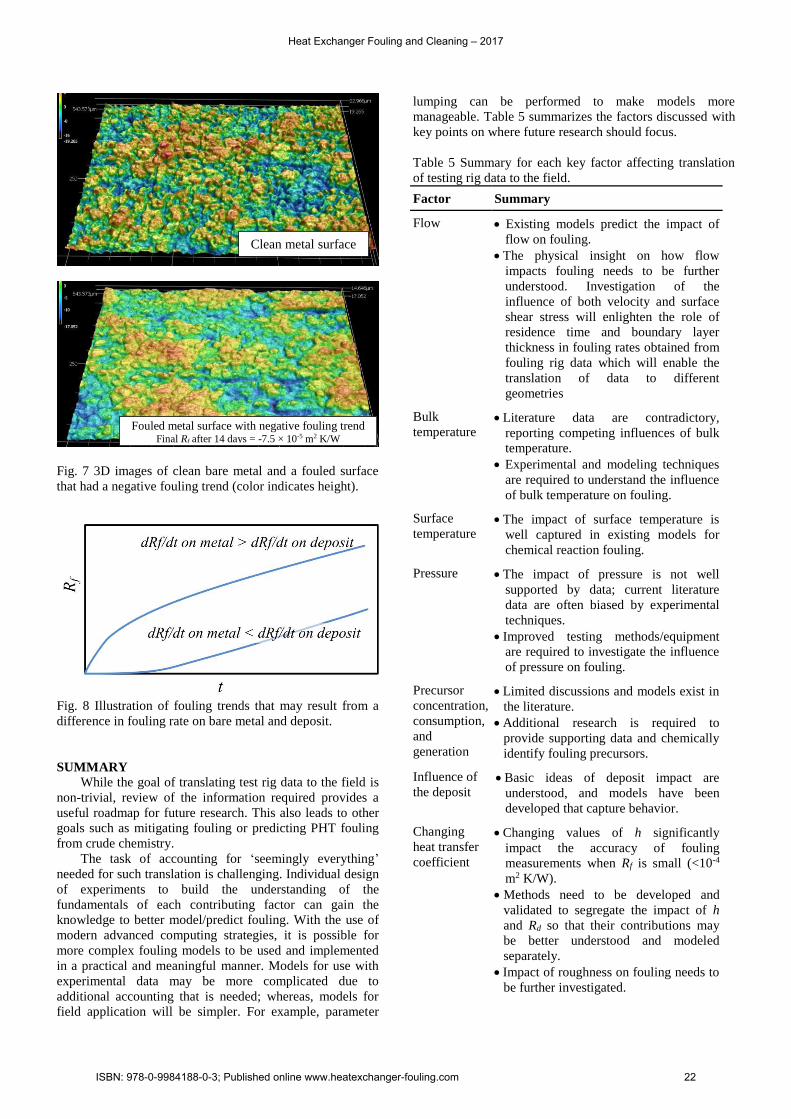
the transition impacts initial fouling trends. As illustrated in
Fig. 8, a high initial fouling rate can be observed if the rate
on the metal is greater than that on the deposit. Conversely,
if the rate on metal is much slower than that on deposit, an
induction period or initially accelerating rate may be
observed.
Induction periods in fouling experiments have been
investigated and modeled, with good agreement to test rig
data (Young et al., 2009) Because the induction period for a
field exchanger is much shorter than its run duration, what
is of most use for predicting field exchanger fouling is the
rate of fouling on existing deposit. Thus, accounting for the
difference in the rate of fouling on bare metal vs. deposit is
essential to accurately predicting field fouling behavior.
0.01%
0.10%
1.00%
10.00%
100.00%
1.E-06 1.E-05 1.E-04 1.E-03 1.E-02 1.E-01
Rel
ati
ve
imp
act
of
1%
ch
an
ge
in h
;
(Rd–
Rf)
/Rf
Rf, m2 K/W
h = 1000 W/m2 K h = 5000 W/m2 K
Testing
rigs
PHT
h h0
Heat Exchanger Fouling and Cleaning – 2017
ISBN: 978-0-9984188-0-3; Published online www.heatexchanger-fouling.com 21
Page 9
Fig. 7 3D images of clean bare metal and a fouled surface
that had a negative fouling trend (color indicates height).
Fig. 8 Illustration of fouling trends that may result from a
difference in fouling rate on bare metal and deposit.
SUMMARY
While the goal of translating test rig data to the field is
non-trivial, review of the information required provides a
useful roadmap for future research. This also leads to other
goals such as mitigating fouling or predicting PHT fouling
from crude chemistry.
The task of accounting for ‘seemingly everything’
needed for such translation is challenging. Individual design
of experiments to build the understanding of the
fundamentals of each contributing factor can gain the
knowledge to better model/predict fouling. With the use of
modern advanced computing strategies, it is possible for
more complex fouling models to be used and implemented
in a practical and meaningful manner. Models for use with
experimental data may be more complicated due to
additional accounting that is needed; whereas, models for
field application will be simpler. For example, parameter
lumping can be performed to make models more
manageable. Table 5 summarizes the factors discussed with
key points on where future research should focus.
Table 5 Summary for each key factor affecting translation
of testing rig data to the field.
Factor Summary
Flow Existing models predict the impact of
flow on fouling.
The physical insight on how flow
impacts fouling needs to be further
understood. Investigation of the
influence of both velocity and surface
shear stress will enlighten the role of
residence time and boundary layer
thickness in fouling rates obtained from
fouling rig data which will enable the
translation of data to different
geometries
Bulk
temperature Literature data are contradictory,
reporting competing influences of bulk
temperature.
Experimental and modeling techniques
are required to understand the influence
of bulk temperature on fouling.
Surface
temperature The impact of surface temperature is
well captured in existing models for
chemical reaction fouling.
Pressure The impact of pressure is not well
supported by data; current literature
data are often biased by experimental
techniques.
Improved testing methods/equipment
are required to investigate the influence
of pressure on fouling.
Precursor
concentration,
consumption,
and
generation
Limited discussions and models exist in
the literature.
Additional research is required to
provide supporting data and chemically
identify fouling precursors.
Influence of
the deposit Basic ideas of deposit impact are
understood, and models have been
developed that capture behavior.
Changing
heat transfer
coefficient
Changing values of h significantly
impact the accuracy of fouling
measurements when Rf is small (<10-4
m2 K/W).
Methods need to be developed and
validated to segregate the impact of h
and Rd so that their contributions may
be better understood and modeled
separately.
Impact of roughness on fouling needs to
be further investigated.
Fouled metal surface with negative fouling trend Final Rf after 14 days = -7.5 × 10⁻⁵ m2 K/W
Clean metal surface
Heat Exchanger Fouling and Cleaning – 2017
ISBN: 978-0-9984188-0-3; Published online www.heatexchanger-fouling.com 22
Page 10
Factor Summary
Surface
transition Initial surface transition models are
available in literature. Additional data
are required to support and further
develop surface transition models.
CONCLUSIONS
1. Interpretation of fouling rig experiment data were
discussed to highlight the differences between data obtained
from a heat exchanger in a crude refinery preheat train and
data obtained from fouling rig experiments.
2. Flow rate (velocity and shear), bulk temperature,
surface temperature, pressure, precursor concentration,
presence of deposit, and calculation method of heat transfer
coefficients are factors that need to be addressed when
translating fouling rig data to operating exchangers. Future
research should focus on these topics (Table 5).
3. Intrinsic differences such as the length of operation
and condition of the heat exchanger surface (usually starts
clean for a fouling experiment, but not necessarily for an
operating exchanger) are usually not accounted for in
fouling rig experiments. Tackling such obstacles are
currently pursued at HTRI’s research facility in Navasota,
TX USA.
NOMENCLATURE
h convective heat transfer coefficient, W/m2 K
h0 clean convective heat transfer coefficient, W/m2 K
P pressure, kPa
Rd thermal resistance of the deposit, m2 K/W
Rf measured fouling resistance, m2 K/W
Re Reynolds number, dimensionless
t time, day
Tb bulk temperature, °C
Ts surface temperature, °C
Tw wall temperature, °C
Tw,0 initial wall temperature, °C
U overall heat transfer coefficient, W/m2 K
U0 clean overall heat transfer coefficient, W/m2 K
V velocity, m/s
τ shear stress, Pa
REFERENCES
Albert, F., Augustin, W., and Scholl, S., 2011,
Roughness and constriction effects on heat transfer in
crystallization fouling, Chem. Eng. Sci., Vol. 66, pp. 499-
509.
Asomaning, S., 1990, The role of olefins in fouling of
heat exchangers, Master’s thesis, University of British
Columbia, Vancouver, Canada.
Asomaning, S., 1997, Heat exchanger fouling by
petroleum asphaltenes, PhD diss., University of British
Colombia, Vancouver, Canada.
Bennett, C. A., Appleyard, S., Gough, M., Hohmann,
R. P., Joshi, H. M., King, D. C., Lam, T. Y., Rudy, T. M.,
and Stomierowski, S. E., 2009, Industry-recommended
procedures for experimental crude oil preheat fouling
research, Heat Trans. Eng., Vol. 27, pp. 28-35.
Bennett, C. A., and Huang, L., 2009, Intube fouling:
effects of roughness and deposit thermal conductivity, HTRI
Report F-19, College Station, TX.
Crittenden, B. D., Hout, S. A., and Alderman, N. J.,
1987, Model experiments of chemical reaction engineering,
Chem. Eng. Res. Des., Vol 65, pp. 165-170.
Crittenden, B. D., and Alderman, N. J., 1988, Negative
fouling resistances: The effect of surface roughness, Chem.
Eng. Sci., Vol. 43, pp. 829-838.
Crittenden, B. D., Kolaczkowski, S. T., Takemoto, T.
and Phillips, D. Z., 2007, Crude oil fouling in a pilot-scale
parallel tube apparatus, Heat Exchanger Fouling and
Cleaning VII, eds. H. Muller-Steinhagen, P. Watkinson and
M. R. Malayeri, ECI, Brooklyn, NY.
Crittenden, B. D., Hewitt, G. F., Millan-Agorio, M.,
Tay, F. H., and Venditti, S., 2015, Experimental generation
of fouling deposits, in Crude Oil Fouling, eds. F. Coletti
and G. F. Hewitt, Waltman, MA, pp. 51-94.
Eaton, P. E. and Lux, R., 1984, Laboratory fouling test
apparatus for hydrocarbon feedstocks, Fouling in Heat
Exchange Equipment, ASME HTD-Vol. 35, eds. J. W.
Suitor and A. M. Pritchard, ASME, New York, pp. 33-42.
Ebert, W., and Panchal, C. B., 1996, Analysis of Exxon
crude-oil-slip stream coking data, Proc. of Fouling
Mitigation of Industrial Heat-Exchange Equipment, ed. C.
B. Panchal, San Luis Obispo, CA, pp. 451-460.
Epstein, N., 1994, A model of the initial chemical
reaction fouling rate for flow within a heated tube, and its
verification, Proc. 10th Intern. Heat Trans. Conf., eds. G. F.
Hewitt, Brighton, UK.,Vol. 4.
Fetissoff, P. E., Watkinson, A. P., and Epstein, N.,
1982, Comparison of two heat transfer fouling probes, Proc.
7th Intl. Heat Transfer Conf., eds. U. Grigull, E. Hahne, K.
Stephan, and J. Straub, Hemisphere, Washington, DC, p.
391.
Harris J., Lane M., and Smith A., 2017, Investigating
the impact of boiling conditions on the rouling of a crude
oil, Heat Tran. Eng., Vol. 38, pp. 703-711.
Hazelton, M., Stephenson, T., Lepore, J., Subramani,
V., and Mitlin, D., 2015, Sulfide promoted chronic fouling
in a refinery: A broad phenomenon spanning a range of heat
transfer surfaces and oil types, Fuel, Vol. 160, pp. 479-489.
Hout, S. A., 1983, Chemical reaction fouling. PhD
diss., University of Bath, Bath, UK.
Ishiyama, E.M., Wilson, D.I., and Paterson, W.R.,
2009, The effect of fouling on heat transfer, pressure drop,
and throughput in refinery preheat trains: optimization of
cleaning schedules, Heat Trans. Eng., Vol. 30, pp. 805-814.
Ishiyama, E.M., Coletti F., Macchietto S., Paterson W.
R. and Wilson D.I. 2010. Impact of Deposit Ageing on
Thermal Fouling: Lumped Parameter Model. AIChE
Journal 56 (2):531–45.
Ishiyama, E. M., 2010, Erratum for “Impact of deposit
ageing on thermal fouling: Lumped parameter model” by
Ishiyama et al., (DOI: 10.1002/ aic.11978, pp. 531-545.
February 2010). AIChE Symp. Ser., Vol. 56, p. 1671.
Ishiyama, E. M., and Pugh, S. J., 2013, Considering in-
tube crude oil boiling in assessing performance of preheat
trains subject to fouling, Proc. of Intl. Conf. on Heat
Exchanger Fouling and Cleaning, eds. M. R. Malayeri, H.
Heat Exchanger Fouling and Cleaning – 2017
ISBN: 978-0-9984188-0-3; Published online www.heatexchanger-fouling.com 23
Page 11
Muller-Steinhagen, and A. P. Watkinson, Budapest,
Hungary.
Ishiyama, E. M., Pugh, S. J., Kennedy, J., Wilson, D. I.,
Ogden-Quin, A., and Birch, G., 2013, An industrial case
study of retrofitting heat exchangers and revamping preheat
trains subject to fouling, Proc. of Intl. Conf. on Heat
Exchanger Fouling and Cleaning, eds. M. R. Malayeri, H.
Muller-Steinhagen, and A. P. Watkinson, Budapest,
Hungary.
Ishiyama, E. M., Pugh, S., Paterson, B., Polley, G. T.,
Kennedy, J., and Wilson, D. I., 2013, Management of crude
preheat trains subject to fouling, Heat Trans. Eng., Vol. 34,
pp. 692-701.
Ishiyama, E. M., Falkeman, E. S., Wilson, D. I., and
Pugh, S. J., 2017, Quantifying implications of deposit
ageing from crude refinery preheat train data, Heat
Exchanger Fouling and Cleaning, Aranjuez, Spain.
Joshi, H. M., 2013, Crude oil fouling field data and a
model for pilot-plant scale data, Proc. of Intl. Conf. on Heat
Exchanger Fouling and Cleaning, eds. M. R. Malayeri, H.
Muller-Steinhagen, and A. P. Watkinson. Budapest,
Hungary.
Keyence Corporation of America, 2015, Introduction to
surface roughness measurement, Elmwood Park, NJ.
Kolaczkowski, S. T., 1977, Two-phase heat transfer
and fouling in hydrocarbon vaporizers, PhD diss.,
University of Bath, Bath, UK.
Kovo, A., 2006, Mathematical modelling and
simulation of fouling of Nigerian crude oil equipment
installations, Leonardo J. Sci., Issue 9, pp. 111-124.
Oufer, L., 1990, Fouling characteristics of organic
fluids, PhD diss., Oregon State University, Corvallis, OR.
Panchal, C. B., and Watkinson, A. P., 1993, Chemical
reaction fouling model for single-phase heat transfer, 29th
ASME/AIChE National Heat Transfer Conf., Atlanta, GA.
Panchal, C. B., Kuru, W. C., Ebert, W. A., Liao, C. F.
and Palen, J., 1997, Threshold conditions for crude oil
fouling, Proc. Intl. Conf. on Understanding Heat Exchanger
Fouling and its Mitigation, Castelvacchio Pas, Italy, p. 273.
Paterson, W. and Fryer, P., 1988, A reaction
engineering approach to the analysis of fouling, Chem. Eng.
Sci., Vol. 43, pp. 1714-1717.
Petkovic, B. and Watkinson, A.P., 2014, Fouling of a
Heated Rod in a Stirred Tank System, Heat Transfer Eng.,
Vol. 35, pp 302-310.
Saleh, Z., Sheikholeslami, R., and Watkinson, P., 2005,
Fouling characteristics of a light Australian crude oil, Heat
Trans. Eng., Vol. 26, pp,15-22.
Shetty, N., Deshannavar, U. B., Marappagounder, R.,
and Pendyala, R., 2016, Improved threshold fouling models
for crude oils, Energy, Vol. 111, pp. 453-467.
Smith, A. D., 2013, Analysis of fouling rate and
propensity for eight crude oil samples in annular test
section, Proc. of Intl. Conf. on Heat Exchanger Fouling and
Cleaning, eds. M. R. Malayeri, H. Muller-Steinhagen, and
A. P. Watkinson, Budapest, Hungary.
Srinivasan, M., and Watkinson, A. P., 2015, Fouling of
some Canadian crude oils, Heat Trans. Eng., Vol. 26, pp. 7-
14.
Tajudin, Z., Martinez-Minuesa, J. A., Diaz-Bejarano,
E., Valkov, I., Orzlowski, P., Coletti, F., Macchietto, S., and
Hewitt, G. F., 2015, Experiment analysis and baseline
hydraulic characterisation of HiPOR, a high pressure crude
oil fouling rig, Chem. Eng. Trans., Vol. 43, pp 1405-1410.
Wang, W., and Watkinson, P., 2015, Deposition from a
sour heavy oil under incipient coking conditions: Effect of
surface materials and temperature, Heat Trans. Eng., Vol.
36, pp. 623-631.
Watkinson, A. P., and Wilson, D. I., 1997, Chemical
reaction fouling: A review, Experimental and Thermal Sci.,
Vol. 14, pp.361-374.
Watkinson, A. P., Navaneetha-Sundaram B., and
Posarac D., 2000, Fouling of a sweet crude oil under inert
and oxygenated conditions, Energy Fuels, Vol. 14, pp. 64-
69.
Watkinson, A. P., 2007, Deposition from crude oil in
heat exchangers, Heat Trans. Eng., Vol. 28, pp. 177-184.
Wilson, D. I., 2014, A review of predictive models for
crude oil fouling, HTRI Report F-23, College Station, TX.
Yang, M., Young, A. and Crittenden, B. D., 2009, Use
of CFD to correlate crude oil fouling against surface
temperature and surface shear stress in a stirred fouling
apparatus, Proc. of Eurotherm Conference on Fouling and
Cleaning in Heat Exchangers, Schladming, Austria, pp.
272–280.
Young, A., Yang, M., Niyetkaliyev, A. and Crittenden,
B., 2009, Modelling the Fouling Induction Period.
Schladming, Austria, p. 69-75.
Heat Exchanger Fouling and Cleaning – 2017
ISBN: 978-0-9984188-0-3; Published online www.heatexchanger-fouling.com 24