Transmission of Sovereign Risk in the Euro Crisis * Filippo Brutti † University of Zurich Study Center Gerzensee Philip Saur´ e ‡ Swiss National Bank January 2013 Abstract We assess the role of financial linkages in the transmission of sovereign risk in the Euro Crisis. Building on the narrative approach by Romer and Romer (1989), we use financial news to identify structural shocks in a vector autoregressive model of daily sovereign CDS premia for eleven European countries. To estimate how these shocks transmit across borders, we use data on cross-country bank exposures to sovereign debt. Our results indicate that cross-border financial exposures constitute important transmission channels. A 10-percent decrease in the exposure to Greek debt reduces, on average, the transmission rate of sovereign risk by 9.4 percent. Decomposing these effects, we find that exposures to sovereign constitute significant transmission channels, while we find no robust support for transmission through bank-to-bank lending. Keywords: Cross-country Transmission, Sovereign Risk, Financial Linkages, Euro Crisis, Narrative Approach JEL Classification: F36, F42, F21, C30 * We would like to thank Nathan Foley-Fisher, Matthias Gubler, Sylvia Kaufmann, Christian Kascha, Carlos Lenz, Dirk Niepelt and Fabrizio Zilibotti. We are also grateful to seminar participants at the Study Center Gerzensee, Swiss National Bank, University of Konstanz, University of Lausanne and University of Zurich for comments and suggestions. Filippo Brutti gratefully acknowledges financial support from the European Research Council (ERC Advanced Grant IPCDP-229883). The views expressed in this paper are the authors’ views and do not necessarily represent those of the Swiss National Bank. † Email: fi[email protected]‡ Email: [email protected]. 1
Transcript
Transmission of Sovereign Risk in the Euro Crisis∗
Filippo Brutti†
University of ZurichStudy Center Gerzensee
Philip Saure‡
Swiss National Bank
January 2013
Abstract
We assess the role of financial linkages in the transmission of sovereign risk in theEuro Crisis. Building on the narrative approach by Romer and Romer (1989), we usefinancial news to identify structural shocks in a vector autoregressive model of dailysovereign CDS premia for eleven European countries. To estimate how these shockstransmit across borders, we use data on cross-country bank exposures to sovereigndebt. Our results indicate that cross-border financial exposures constitute importanttransmission channels. A 10-percent decrease in the exposure to Greek debt reduces,on average, the transmission rate of sovereign risk by 9.4 percent. Decomposingthese effects, we find that exposures to sovereign constitute significant transmissionchannels, while we find no robust support for transmission through bank-to-banklending.
Keywords: Cross-country Transmission, Sovereign Risk, Financial Linkages, EuroCrisis, Narrative Approach
JEL Classification: F36, F42, F21, C30
∗We would like to thank Nathan Foley-Fisher, Matthias Gubler, Sylvia Kaufmann, Christian Kascha,Carlos Lenz, Dirk Niepelt and Fabrizio Zilibotti. We are also grateful to seminar participants at the StudyCenter Gerzensee, Swiss National Bank, University of Konstanz, University of Lausanne and University ofZurich for comments and suggestions. Filippo Brutti gratefully acknowledges financial support from theEuropean Research Council (ERC Advanced Grant IPCDP-229883). The views expressed in this paperare the authors’ views and do not necessarily represent those of the Swiss National Bank.†Email: [email protected]‡Email: [email protected].
1
1 Introduction
In late 2009, with the global economy inching out of the Great Recession, the sovereign
debt crisis hit Europe with a remarkable pace and vigor. Fears of sovereign insolvency
initially developed in one peripheral country, Greece, but quickly spread to other European
countries, forcing policymakers to take bold actions in order to stop the contagion.
Financial turmoil can spread across countries through different channels. We recognize
that the public debate about contagion in the Euro crisis has repeatedly stressed the im-
portance of financial linkages across the involved countries and, in particular, of financial
institutions operating across national borders.1 For example, a looming Greek sovereign
default may adversely affect banks in other countries according to their exposure to Greek
sovereign debt. Through implicit guarantees, a troubled national banking system consti-
tutes a liability of the respective sovereign, thereby increasing sovereign credit risk. By the
same token, cross-border interbank lending can matter: as the Greek sovereign debt crisis
stresses the Greek banking system, counterparty risk rises for foreign creditors, affecting
the financial health of the latter’s countries. However, the role played by cross-border ex-
posures of financial institutions for the transmission of shocks is still heavily debated (see
Van Wincoop (2011), among others).
The aim of this paper is to provide empirical evidence to assess the contribution of
cross-border exposures by financial institutions to the transmission of sovereign risk in
Euro Crisis. We distinguish, in particular, between transmission through exposure to public
debt and through cross-border bank linkages. To this end, we identify financial shocks that
originate in Greece and we analyze how the sovereign default risk of European countries,
measured by sovereign Credit Default Swap (CDS) premia, responds to these shocks. We
1Christine Lagarde, Managing Director of the International Monetary Fund, states that “[f]inancialexposures across the continent are transmitting weakness and spreading fear from market to market,country to country, periphery to core.” See also Financial Times: ”Greek contagion fears spread to otherEU banks”, June 15, 2011. For a careful discussion of the role of financial institution for the internationalpropagation of risk see Bolton and Jeanne (2011) and Guerrieri et al. (2012).
2
then use data on bilateral cross-border bank positions from the Bank of International
Settlements (BIS) to relate the responses of other countries to their aggregate exposure to
Greek public debt and debt of Greek banks, while controlling for other factors.
Our results indicate that a one-percent shock to Greek CDS causes a 0.36 percent in-
crease in the CDS of the average European country, which suggests economically important
transmission rates. Moreover, financial linkages contribute significantly to these spillovers.
In particular, a 10-percent decrease in cross-border financial exposures, corresponding to a
reduction of 0.075 percent of GDP for the average country, would decrease the spillover ef-
fects of sovereign risk by 3.4 percent. For the average country, this corresponds to about 9.4
percent of the overall transmission rate. Decomposing these effects, we find that bilateral
exposures to sovereign debt constitute economically and statistically significant transmis-
sion channels. Specifically, a 10-percent decrease in the exposure to foreign sovereign debt,
corresponding to a reduction of 0.05 percent of GDP, would decrease spillover effects by 1.8
percent. Again the average country, this corresponds to 5 percent of the overall transmission
rate. On the contrary, we find no robust support for transmission through bank-to-bank
lending.
Methodologically, we consider a vector autoregressive (VAR) model for country CDS
premia, which includes global financial factors as exogenous variables. We adopt the nar-
rative approach of Romer and Romer (1989) using financial news to identify exogenous
shocks in one country, with a specific focus on information innovations stemming from
Greece (“Greek shocks”). Within this framework, we then estimate whether the response
to Greek shocks varies over time with the exposure to Greek debt, controlling for country
and time fixed effects and within-country variation in trade linkages.2
2We acknowledge that the narrative approach exhibits some commonalities with a classic event-studymethodology, which has been previously applied to study the international transmission of financial crises(e.g., Forbes (2004)). This methodology usually considers a market model to explain the behavior of finan-cial assets during normal times and then compute within a specific event-window a measure of abnormalreturns, defined as the deviation of asset returns from the model predictions. In our study, we are forced
3
The narrative approach has the major advantage that identification is achieved without
imposing a specific pattern for cross-country spillovers on the VAR model. This virtue is
particularly important when analyzing cross-country transmission because standard iden-
tification assumptions, e.g., short-run, long-run or sign restrictions, are difficult to defend
in this context (see Rigobon (2002)). Some concerns need to be addressed, however. Im-
portantly, our estimates of cross-country spillovers might suffer of an endogeneity bias if
simultaneous shocks in other countries or to global factors occurred at the time of Greek
shocks. We have several reasons to think that this is not the case. First, with daily data
the problem of simultaneity is sensibly reduced. Second, we take special care in reviewing
financial news to exclude from our analysis those Greek events that occurred simultaneously
with relevant financial news in other countries.3 Third, by controlling for global financial
factors in the estimation, common shocks that affect sovereign risk through general market
conditions are accounted for.
The classic use of the narrative approach has also been disputed in the past. Romer and
Romer’s (1989) original identification strategy through episodes of monetary contraction
has been criticized. Concerned about reverse causality, Leeper (1997) argues that the
events considered may constitute an endogenous policy response to previous movements in
economic conditions (see Romer and Romer (1997) for a reply).4 Additionally, the effects
of the policy events selected using a narrative approach are said to be indistinguishable
from those of omitted economic fundamentals (Hoover and Perez (1995)). We argue that
these standard lines of critique do not apply to our setup. First, the high frequency of our
to use a VAR model to account for the strong autocorrelation of CDS premia during the Euro Crisis.Additionally, event studies are typically based on a single event-window of extended length rather than ona collection of daily events. Our definition of an event is thus more conservative since a clear identificationof the exact origin of the event is much easier to motivate for short-lived single-day events.
3A detailed description of the data and the selection procedure follows in Section 2.4Leeper (1997) notes that the events that Romer and Romer (1989) use to identify the response to
monetary shocks (contractions of the FED) are predictable by past macroeconomic variables and thatunpredictable changes do not generate responses that look like typical effects of monetary policy. Romerand Romer (1997) argue that the results in Leeper (1997) are due to overfitting.
4
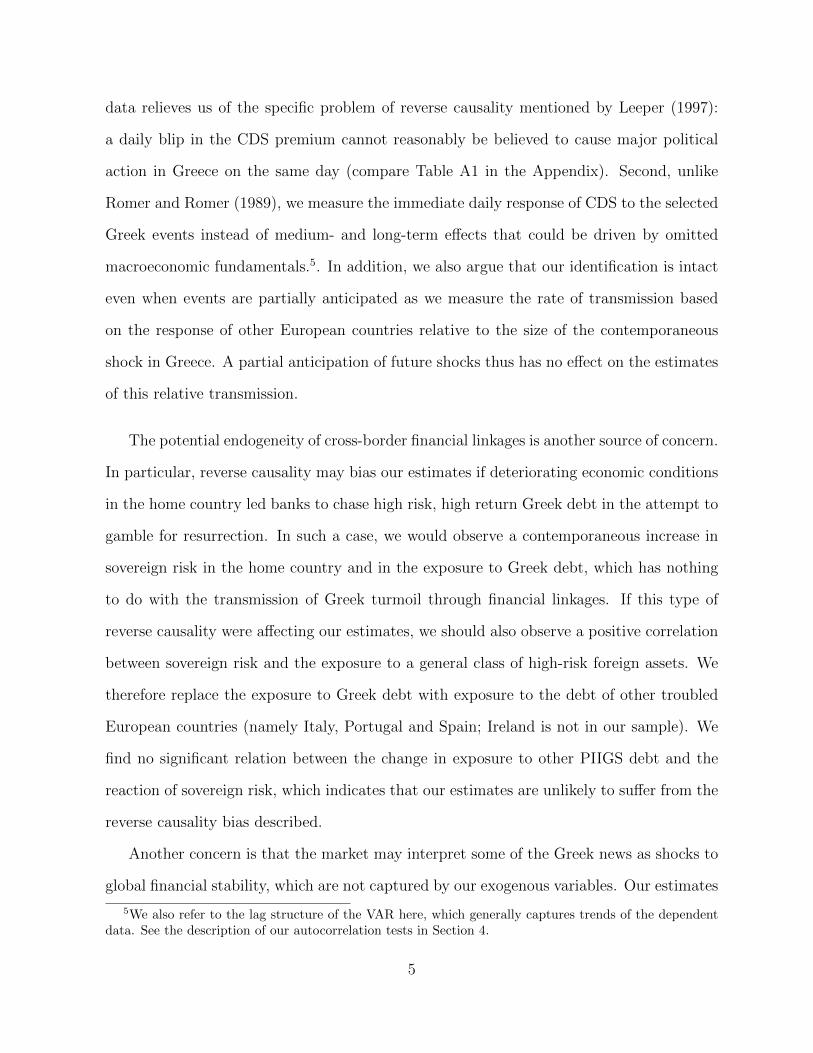
data relieves us of the specific problem of reverse causality mentioned by Leeper (1997):
a daily blip in the CDS premium cannot reasonably be believed to cause major political
action in Greece on the same day (compare Table A1 in the Appendix). Second, unlike
Romer and Romer (1989), we measure the immediate daily response of CDS to the selected
Greek events instead of medium- and long-term effects that could be driven by omitted
macroeconomic fundamentals.5. In addition, we also argue that our identification is intact
even when events are partially anticipated as we measure the rate of transmission based
on the response of other European countries relative to the size of the contemporaneous
shock in Greece. A partial anticipation of future shocks thus has no effect on the estimates
of this relative transmission.
The potential endogeneity of cross-border financial linkages is another source of concern.
In particular, reverse causality may bias our estimates if deteriorating economic conditions
in the home country led banks to chase high risk, high return Greek debt in the attempt to
gamble for resurrection. In such a case, we would observe a contemporaneous increase in
sovereign risk in the home country and in the exposure to Greek debt, which has nothing
to do with the transmission of Greek turmoil through financial linkages. If this type of
reverse causality were affecting our estimates, we should also observe a positive correlation
between sovereign risk and the exposure to a general class of high-risk foreign assets. We
therefore replace the exposure to Greek debt with exposure to the debt of other troubled
European countries (namely Italy, Portugal and Spain; Ireland is not in our sample). We
find no significant relation between the change in exposure to other PIIGS debt and the
reaction of sovereign risk, which indicates that our estimates are unlikely to suffer from the
reverse causality bias described.
Another concern is that the market may interpret some of the Greek news as shocks to
global financial stability, which are not captured by our exogenous variables. Our estimates
5We also refer to the lag structure of the VAR here, which generally captures trends of the dependentdata. See the description of our autocorrelation tests in Section 4.
5
might then suffer an omitted variable bias if changes in the exposure to Greek debt correlate
with changes in their general exposure to global risk. We address this concern by controlling,
in addition, for changes in countries’ aggregate exposure to foreign debt. The estimates
of this extended model show that the previous results on the effect of exposure to Greece
remain intact, while no significant relation between the responses to Greek shocks and
the exposure to general foreign risk of countries is detected. We thus conclude that our
estimates are not affected by the presence of omitted variables.
1.1 Literature Review
The mechanism of cross-country transmission is at the core of a large empirical and the-
oretical literature. Calvo and Reinhart (1996) distinguish between three different sources
of spillovers: first, responses to common shocks; second, fundamental-based contagion,
which operates via direct trade or financial linkages; third, pure contagion, which operates
through the portfolio rebalancing of global investors and herding behavior.6 In testing
whether cross-country spillovers are determined by direct linkages across countries, our pa-
per is closer in spirit to Forbes (2004) and Forbes and Chinn (2004).7 Contrary to the latter
study, however, our results indicate that bank linkages are relatively more important than
trade linkages to explain the propagation of risk.8 We explain this difference in results as a
consequence of the large degree of financial integration existing among European countries.
Longstaff et al. (2011) focus on the role of global factors, such as the US stock market
return or the VIX index for market volatility, as a driver of co-movements in sovereign
CDS markets. They find that these factors explain a sizeable fraction of the total variation
6A necessarily incomplete list of papers includes Baig and Goldfajn (1999), Schinasi and Smith (2000),Kyle and Xiong (2001), Forbes and Rigobon (2002), Corsetti et al. (2005), Broner et al. (2006).
7See also Kaminsky and Reinhart (2000), Hernandez and Valdes (2001), Van Rijckeghem and Weder(2001, 2003).
8Analyzing stock market returns, Forbes and Chinn find that bank channels are significant only in someof their specifications.
6
and, in light of this evidence, conclude that global investors play a dominant role in these
markets. Borri and Verdelhan (2011) study the linkages across sovereign debt markets
that arise when countries borrow from a common risk averse lender.9 We see our results as
complementary to these studies insofar as we control for global factors in our estimations.10
The unfolding Euro crisis is currently stimulating rich academic output, which can be
covered here only partially. A large part of this literature has focused on the role of finan-
cial linkages in the spread of the crisis. Bolton and Jeanne (2011) develop a comprehensive
theoretical analysis of transmission of sovereign risk through an integrated banking system.
The authors note that, although “diversification generates risk diversification benefits ex
ante, it also generates contagion ex post.” Using sovereign and bank CDS premia between
2007 and 2010 and a series of bank bailouts, Acharya et al. (2011) provide evidence that a
weak banking sector increases the default risk of the sovereign, showing in particular “that
the announcement of financial sector bailouts was associated with an immediate, unprece-
dented widening of sovereign CDS spreads and narrowing of bank CDS spreads.”11 In line
with these findings, Dieckmann and Plank (2010) find “a private-to-public risk transfer
through which market participants incorporate their expectations about financial indus-
try bailouts and the potential burden of government intervention.” Focusing on the role of
financial news, Bhanot et al. (2011) report results that “point to the role of news announce-
ments and the banking channel as important transmission channels in the crisis period.”
Finally, Arezki et al. (2011) find that “sovereign rating downgrades have statistically and
economically significant spillover effects both across countries and financial markets.” The
authors discuss several channels of spillover of sovereign risk across countries, pointing es-
pecially to “the holding of foreign sovereign debt by domestic banks...” and to the claims
9See also Lizarazo (2010) and Arellano and Bai (2012).10Furthermore, in a VAR model, the response of risk premia to global factors can differ across countries,
as suggested by Borri and Verdelhan (2011).11Balteanu and Erce (2011) study the feedback effects between bank crises and sovereign defaults in
emerging economies.
7
of banks “on banks in other countries” (see also Blundell-Wignall and Slovik (2010) and
Sy (2010)).
Our contribution to this empirical literature is twofold. First, building on the docu-
mented roles of bank-to-bank and bank-to-sovereign linkages as transmission channels of
sovereign risk, we take the broader perspective of the country level and analyze cross-
country spillovers and the role the national exposure rates in the transmission of sovereign
risk. Second, we evaluate the transmission mechanism through the careful identification
of financial shocks that originated in Greece and through the time variation in national
exposure rates.
The remainder of this paper is structured as follows. Section 2 describes our data in
detail, and Section 3 lays out the empirical framework. Section 4 presents and discusses
our main findings, and Section 5 concludes.
2 Data
Our analysis requires us to combine three main types of data: (i) a measure of sovereign
default risk; (ii) a classification of shocks that identifies, in particular, those of Greek origin;
(ii) a measure of bilateral financial linkages. The key sources for the first and third types
of data are Datastream and the BIS, respectively. We compile the second one ourselves.
Sovereign default risk. Our measure of a country’s default risk is a five-year sovereign
Credit Default Swap (CDS) premium, collected by CMAN and provided by Bloomberg. A
CDS is essentially an insurance contract between two counterparties, typically traded over
the counter. It transfers credit risk from one party, the buyer of protection, who pays “a
regular fixed premium to the seller of protection in return for compensation contingent
on the occurrence of a specified credit event” (Barclays Capital 2010). Although CDS
premia do not capture default risk perfectly, recent literature has documented that they
8
are considered to be reliable and among the best measures of default risk available (Pan
and Singleton (2008), Stulz (2010) and Fontana and Scheicher (2010)). Our analysis thus
relies on CDS premia on five-year on-the-run government bonds as a measure of sovereign
risk.12
Figure 1: Sovereign CDS Premia0
50
01
00
0
01jan2008 01jan2009 01jan2010 01jan2011
Portugal Italy Greece
Spain
A: The 'PIIGS' Countries
01
00
20
03
00
01jan2008 01jan2009 01jan2010 01jan2011
Austria Belgium Germany France
UK Netherlands Sweden
B: The 'Northern' European Countries
Five-year sovereign CDS premia of selected European countries at daily frequencyfrom January 2008 to March 2011. Units of the vertical axis are basis points (a levelof 100 bp implies that it costs 0.01 Euro per year to protect one Euro of outstandingdebt over the five-year period). Source: Bloomberg.
Figure 1 plots daily five-year sovereign CDS premia separately for “PIGS” countries
12This type of CDS contracts are the most commonly traded and have commonly been monitored, quotedand commented on the course of the recent sovereign debt crisis (Packer and Suthiphongchai 2003).
9
(Portugal, Italy, Greece and Spain) and eight other “Northern” European countries for
the period from January 2008 to March 2011.13 These graphs are familiar to the reader
of financial news: the curves not only track financial troubles at the height of the Great
Recession, but also illustrate the buildup of the Euro crisis; in particular, the market’s
assessment of a potential Greek sovereign default following the budgetary announcements
by Greek authorities in fall 2009.
The figure exhibits strong co-movements of CDS premia across countries, which appear
also from the pairwise correlations of log-changes reported in Table 1. These pairwise
correlations range between 0.6011 (Sweden and Greece) and 0.8952 (Italy and Spain), with
an average of 0.7290. In addition to the obvious effects of common factors (see Fontana
and Scheicher (2010)), part of that correlation is likely to be generated by spillover effects
from one troubled country – e.g., Greece – to other countries in the sample.
Greek Shocks. The second type of required information is a list of those days when
financially relevant information innovation came (almost) exclusively from Greece. For our
identification strategy, indeed, it is essential that we make sure that Greece is the only
origin of a relevant news shock. Pioneering the “narrative approach”, Romer and Romer
(1989) stress that severe problems can arise when isolating the shocks due to the judg-
mental and retrospective nature of the selection process. To prevent an unconscious bias
in this selection process, we rely entirely on external sources for a selection of ‘financially
relevant information shocks” during the Euro Crisis and keep the required selection process
of Greek events as mechanical as possible. Specifically, we first construct a timeline of the
Euro crisis by combining three external sources: the Financial Times (Interactive Timeline:
Greek Debt Crisis), the Wall Street Journal (Europe’s Debt Crisis - Timeline), and Reuters
13Ireland, the additional “I” in the usual PIIGS acronym, is excluded from our sample for the followingreason. In the last quarter of 2010 we observe a sharp decline in the exposure of Irish banks to Greekdebt. This drop is likely to be caused by the creation in late 2010 of a nationalized “bad bank” absorbingtroubled assets owned by Irish banks, without actually changing the exposure to Greece. We are concernedthat the inclusion of Ireland might bias our results.
10
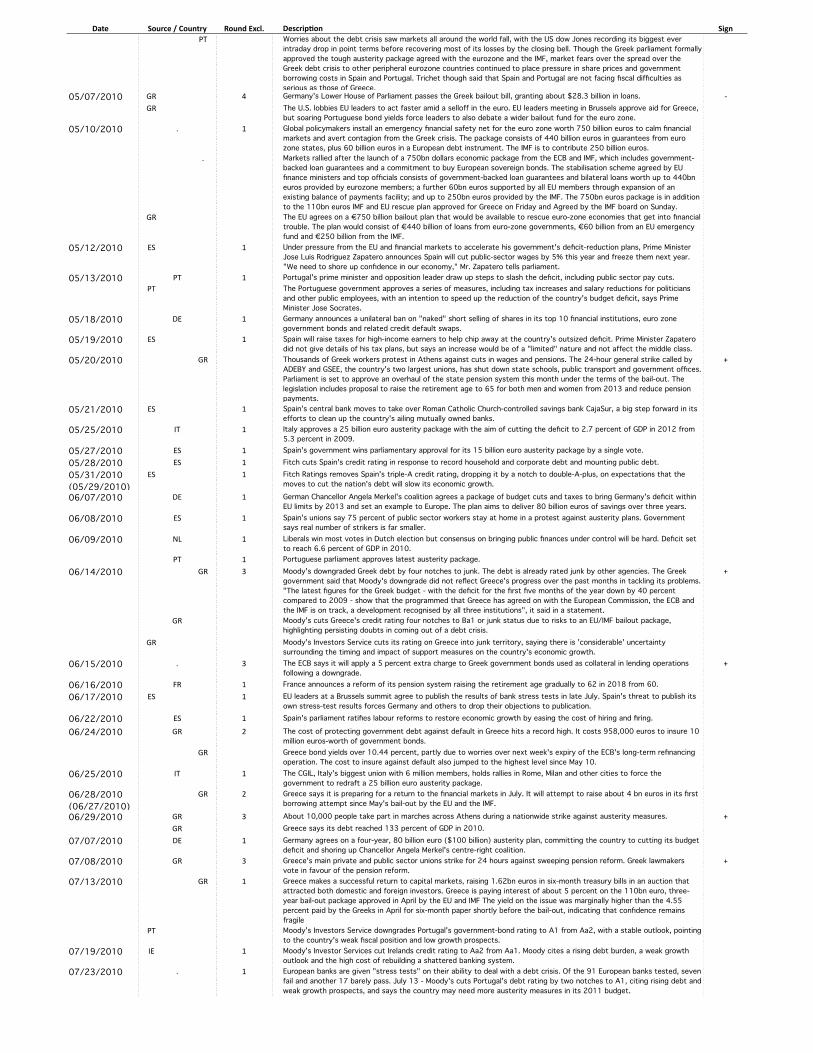
(Europe’s Debt Crisis Timelines).14 The thus compiled joint timeline covers a period start-
ing October 9, 2009, and ending November 28, 2010. The list of these events is reported
in Table A1 in the Appendix. The first column of Table A1, labeled Date, reports the day
of the event or, in case the event falls on a weekend or a bank holiday, the first business
day after the event. In the latter case, the original date is reported in brackets. The list
includes 92 working days where news of any kind is reported in at least one of the three
timelines. The column in Table A2 labeled Source / Country provides information on the
original timeline as well as the country in which the news shock originated.15 Excluding
the days that contain news from other countries than Greece leaves us with 50 of these 92
days. The days excluded in this first step are marked with 1 in the third column of Table
A1 labeled Exclusion Round. In a second round, we exclude those of remaining days, in
which the news essentially consists of reported market sentiment, the evolution of bond
spreads and unspecific political statements. We are aware of the fact that this selection
is judgmental to some extent but argue that there is little room for ambiguity, as can be
verified by taking a close look at the third column of Table A2, where these days are marked
with a 2. After excluding these days from the list, we are left with 38 days of Greek events.
We label this list of events the raw set of Greek shocks. It reflects our broadest definition of
Greek shocks and will serve for robustness checks for our results. However, to prevent our
results to be driven by simultaneous shocks in other countries, we perform an additional
round of elimination. Specifically, for each of the remaining 38 days in the raw set of Greek
shocks, we search for potential overlapping shocks originating in other countries. This step
of exclusion is based on Lexis-Nexis, a comprehensive news database.16 For each of the 38
14See http://www.ft.com/intl/cms/s/0/003cbb92-4e2d-11df-b48d-00144feab49a.html#axzz1eQwHrlj,http://online.wsj.com/article/SB10001424052748704448304575195863350731920.html andhttp://www.reuters.com/article/2010/08/25/eurozone-crisis-events-idUSLDE67O0YD2010082515We re-date the very first shock, which appears to be misreported in the timeline of Reuters to October
9 2009. We don’t find other inconsistencies between the three original timelines and the news in theLexis-Nexis database.
16See www.lexisnexis.com.
11
days, we classify the events occurring in other countries into nine categories.17 The first
four comprise, respectively, information on monetary policy (MONP), policy action and
regulation (POLA), social unrest (SOCU) and a rating agency’s change of grading of a
country other than Greece (RATE). We view these events as too important for financial
markets and therefore exclude those days from our list of Greek events, where at least one
of these events is reported. The remaining five categories comprise general economic news
(ECON) the description of market developments and sentiment (MKT), event outside of
Europe (FORE) political statements regarding non-committal intentions (POLI), and news
on private companies (COMP). Days are not excluded from our list of Greek events based
on these events. In the third column of Table A2 the days excluded in this last round of
exclusion are marked with 3.
The final list of Greek events comprises 24 information shocks identified as Greek shocks
and is reported in Table A1 along with a short description of the corresponding event. These
24 pure Greek events are finally classified as generating positive or negative information
shocks, depending on whether we expect the Greek CDS premium to either increase or
decrease on that day. This last step is actually the only one relying on our judgement only.
We refer to Table A1 to check that there is little room for ambiguity at this stage.
To perform an additional robstness check, we also exclude those dates, at which, ac-
cording to the description in the Lexis-Nexis database, the general economic news (ECON)
were unexpected or surprising to market participants. This final round excludes 7 addi-
tional days (marked with a 4 in Table A1, third column) and leaves us with a set of 17
days, which we label the restricted set of Greek events.
Financial linkages. We now need a measure of bilateral financial linkages with Greece
which we can then relate to the response of each country to Greek shocks. In particular, we
focus on bilateral cross-border bank exposures using data from the Consolidated Banking
17We document this list of events in a supplementary appendix, which is available from the authors uponrequest. (This appendix is included in the submission.)
12
Statistics of the BIS. This dataset covers banks’ claims to non-residents, broken down by
nationality of borrower and creditor and four types of debt: (i) Public Debt; (ii) Private
Bank Debt; (iii) Private Non-Bank Debt; and (iv) Other Debt (see BIS (2006)). Report-
ing entities are bank head offices, including the exposures of their foreign affiliates (i.e.,
subsidiaries and branches); reported data cover financial claims on the balance sheet, con-
solidated on a worldwide basis within each banking group (i.e., inter-office positions are
netted out).18 The final dataset provides a matrix of cross-country bilateral (gross) bank
exposures, evaluated at market prices.19
The BIS reports the data in US dollars after converting the positions originally reported
in other currencies using end-of-quarter exchange rates. As most of the countries in our
sample belong to the Euro Area, we convert the data back into Euros using the end-of-
quarter exchange rate provided by the International Financial Statistics (IFS) of the IMF.
This conversion allows us to remove potential valuation effects that are common to all
countries, which might introduce an exogenous variation in our measure of financial linkages
and thus affect our estimates. Finally, we normalize banks’ exposure by the average GDP
between 2009 and 2010 to control for different country sizes. The data on GDP come from
the World Economic Outlook of the IMF.
Figure 2, top panel, illustrates gross cross-border exposure of BIS-reporting banks,
aggregated across the eleven European countries in our sample, by type of debt. It shows
that, during the height of the financial crisis, the total foreign positions were rewound,
in particular those of bank debt. With the onset of the year 2010, the downward trend
has continued, but moderately so. The picture is different when focusing on Greek foreign
18BIS (2006) specifies that balance-sheet relevant instruments include ”certificates of deposit (CDs),promissory notes and other negotiable paper issued by non-residents, banks’ holdings of international notesand coins, foreign trade-related credits, claims under sale and repurchase agreements with non-residents,deposits and balances placed with banks, loans and advances to banks and non-banks, holdings of securitiesand participations including equity holdings in unconsolidated banks or non-bank subsidiaries.”
19In addition, BIS (2006) reports a number of valuation practices recommended to reporting entities toensure the cross-country comparability of data. In addition to the use of market prices to evaluate claims,these practices specify how to report arrears, provisions and the write-off of claims.
13
Figure 2: Foreign Debt Exposure by Type
01000
2000
3000
4000
Bill
ion E
uro
s
2006q1 2007q1 2008q1 2009q1 2010q1 2011q1
A. Aggregate Cross-Border Debt
020
40
60
80
100
Bill
ion E
uro
s
2006q1 2007q1 2008q1 2009q1 2010q1 2011q1
Private Debt Bank Debt
Public Debt Other Debt
B. Greek Debt
Exposure of BIS reporting banks to European debt (top panel) and Greek debt (bot-tom panel) by type of debt: Public, Bank and Non-Bank Private, and Other. Quar-terly data are reported on an immediate borrower basis (for a comparison betweenimmediate and ultimate borrower bases, see the Appendix). The set of 11 countriesincludes: Austria, Belgium, France, Germany, Greece, Italy, Netherlands, Portugal,Spain, Sweden and UK. Source: BIS, Consolidated Banking Statistics.
debt to the remaining ten countries (bottom panel). Here, the largest decrease in debt
exposure occurred during the year 2010, with positions in sovereign debt dropping the
most in absolute terms.20
20In principle, the decrease in the exposure to Greek bonds may result from valuation effects. Thus,to ensure international comparability, the BIS recommends ”that banks’ international claims be valued atmarket prices” but acknowledges that, where ”market values are not appropriate, contractual or nominalvalues should be used.” Moreover, differences across countries arise because ”loans in the banking books,which in principle should be assigned nominal value, should be valued in accordance to the reportingcountries’ accounting standards.” (BIS 2006)
14
It is important to notice that neither the levels nor the trends in the exposure to Greek
debt are uniform across all countries. Table 2a shows that within the set of ten European
countries, average exposures vary between roughly 0.08 and 1.22 percent of GDP. Table 2b
reports summary statistics of the evolution of exposure to Greek debt staring in the fourth
quarter 2009, for which levels are normalized to 100.21 Panel A reports numbers for total
debt by quarter. The last column thus shows that, on average, the exposure to Greek debt
was 67.5% of the initial level. The country for which exposure changed the least reduced
its exposure by 0.2% (100-99.8), and the largest reduction amounted to 77.2%. Panel B
summarizes exposures for Greek public debt. Up to 2010Q4, the average country reduced
its exposure to 73.0% of the initial level. The maximum reduction was 82.3%, and one
country actually increased its exposure by 13.1%. Finally, panel C reports the numbers
based on Greek bank debt. Between 2009Q4 and 2010Q4, the average country reduced Its
exposure to 32.0% of the initial level. The maximum reduction reached 97.7%, and at least
one country increased its exposure by 4.2%. Our aim is to exploit the time variation of
each country to extract information about how sovereign risk is transmitted via exposure
to the different classes of Greek debt.
The data on financial linkages are reported on the immediate borrower basis and do not
include credit derivatives and guarantees, which could shift risk exposure across countries.
Thus, the accuracy of effective exposure is a potential source of concern. Unfortunately, the
availability of data on the ultimate risk basis is very limited. Not only would the use of the
ultimate borrower basis limit our sample, but Greece would drop out of it. A comparison
between the data on the immediate and ultimate basis shows that the two measures covary
very closely.
A first inspection of the data reveals two important aspects of CDS premia on the days
classified as Greek events. First, on these days, we observe large movements in the Greek
21The beginning of the Greek sovereign debt crisis can be dated to 2009Q4.
15
CDS premium relative to the rest of the sample. Table 3a reports summary statistics of
daily log-changes in the Greek CDS premium, partitioning the sample into days of positive
Greek shocks, days of negative Greek shocks and all remaining days, respectively. While
the average change in Greek CDS is 0.19% in the absence of Greek events, the table shows
an average increase of more than 7% on the days of “positive” Greek news, and a decline
of more than 4% on the days on “negative” Greek news. We also observe that the largest
increase in Greek CDS (27%) occurred on a day of positive Greek shocks. Similarly, the
second largest drop in the Greek CDS premium (-15.7%) is associated with a Greek event
with negative sign.22
Looking at the relation between exposure to Greek debt and the response of other
countries to Greek shocks, we find that a level of exposure above the country median is
on average associated with larger CDS responses. Table 3b reports summary statistics of
the log-changes in the CDS premia of the 10 European countries in our sample by rate
of exposure to Greek debt (above or below the country median) and by type of Greek
shock (positive or negative). As shown in Panel A, the average increase in the CDS of
other countries on the days of positive Greek shocks is equal to 3.99% when the exposure
to total Greek debt is above the median of each respective country, while it is equal to
2.64% when the exposure is below the median. Similarly, on the days of negative Greek
shocks the CDS of other countries decline on average by 1.66% when exposure is above the
country median and by 0.87% when exposure is below the country median. Panels B and
C show similar patterns in the cases of exposure to public debt and to private bank debt,
respectively. Overall, these numbers suggest that, controlling for country fixed effects, the
absolute response to Greek shocks tend to increase with the exposure to Greek debt. In the
next section, we describe the empirical framework that we adopt to test this hypothesis.
22Notice that the largest drop in the Greek CDS premium (-47.10%) coincides with the joint EU-IMFannouncement of a 110bn Euro bailout package for Greece. However, we had to exclude this announcementfrom the list of pure Greek events as the EU Council agreed on the same day to establish the first Europeanstabilization mechanism with the aim of safeguarding financial stability in all member states.
16
3 Empirical Framework
In this section, we discuss our approach to identifying sovereign risk spillovers across coun-
tries. We start by considering a n-dimensional vector autoregressive model
yt = Φy(L)yt−1 + Φxxt + ut,
where yt is a vector of CDS premia for each country, Φy(L) =∑J
j=1 Φy,jLj−1 is a polynomial
of n× n matrices in the lag operator, xt is a m-dimensional vector of exogenous variables
that includes the constant, and ut is a vector of innovations. In a more compact form, this
model can be written as
yt = Φzt + ut, (1)
where zt = [y′t−1, . . . , y′t−J , x
′t]′ is a p × 1 vector of both lagged endogenous and exogenous
variables with p = nJ +m and Φ = [Φy,1, . . . ,Φy,J ,Φx] is a n× p matrix of coefficients.
The innovations ut are jointly correlated reflecting cross-country spillovers. Following
standard practice, we assume
ut = Bεt, (2)
where εt is an i.i.d. vector of country-specific shocks with zero mean. The matrix B thus
reflects the rate of transmission of these shocks across countries. Without loss of generality,
we normalize the diagonal elements of B, which reflect the within-country transmission of
shocks, to one.
3.1 Identifying Spillovers using a Narrative Approach
We use a “narrative approach” similar to Romer and Romer (1989) to identify cross-country
spillovers, measured by the non-diagonal elements of the transmission matrix B. As part
of our specific approach, we first decompose each country-specific shock into a signed mean
17
shift, which shall reflects “exceptional” and to some extent observable events, and a residual
noise, which shall reflect “normal” shocks. Specifically, we assume for each country i that
εi,t = di,tξi + νi,t
where di,t ∈ −1, 0, 1 is a signed indicator for exceptional events in country i; ξi denotes
the size of exceptional events; νi,t reflects normal events; and di,t and νi,t are i.i.d. across
time and countries.23 Applying the same decomposition to each country, we can write
εt = Dtξ + νt
where Dt is a diagonal matrix with entries di,t.
The narrative account of Greek events described in the previous section allows us to
identify a specific set of dates with pure Greek shocks (i.e., days of exceptional events in
Greece but in no other country) and to determine the sign of the corresponding shock.
Using this information, we can define a signed indicator function 1gr,t for Greek events and
rearrange the vector of country-specific shocks as
εt = 1gr,tξgr + εt (3)
where ξgr = [0 ... ξgr ... 0]′ is a column vector of exceptional shocks in Greek events and
thus is zero except for the Greek component. Meanwhile, εt = (1 − |1gr,t|)Dngrt ξ + νt is a
residual shock that incorporates the possibility of exceptional non-Greek shocks in other
periods plus the normal noise νt.
23Despite being quite restrictive, the assumption that the effect of exceptional events is constant overtime does not affect our results but conveniently reduces notation.
18
Combining (3) and (2) yields
yt = Φzt + β · 1gr,t + ut, (4)
where ut is a modified residual defined as
ut ≡ 1gr,tugrt + (1− |1gr,t|)ungrt
ugrt ≡ Bνt (5)
ungrt ≡ B(Dngrt ξ + νt).
In model (4), the vector β measures the average response of sovereign risk in each
country to a shock in Greece, and is the coefficient of interest. To obtain efficient estimates
for this coefficient, however, we cannot use a standard Ordinary Least Squares (OLS)
estimator as the assumption of conditional homoskedasticity of the error term is clearly
violated. By construction, indeed, ut depends only on the normal shock νt in the days of
Greek events, while it depends on the sum of νt and, potentially, the non-Greek exceptional
shocks Dngrt ξ in all other days. Our strategy thus forces us to derive a Generalized Least
Squares (GLS) estimator that allows for the presence of two alternating regimes in the
variance-covariance matrix of the residuals. We refer to the Appendix for a technical
description of the GLS estimator used to estimate model (4).
One last step is required to test whether the transmission of Greek shocks is statistically
significant. By construction, indeed, the coefficient β is a reduced-form parameter that
depends on both the rate of cross-country transmission of Greek shocks and the average
19
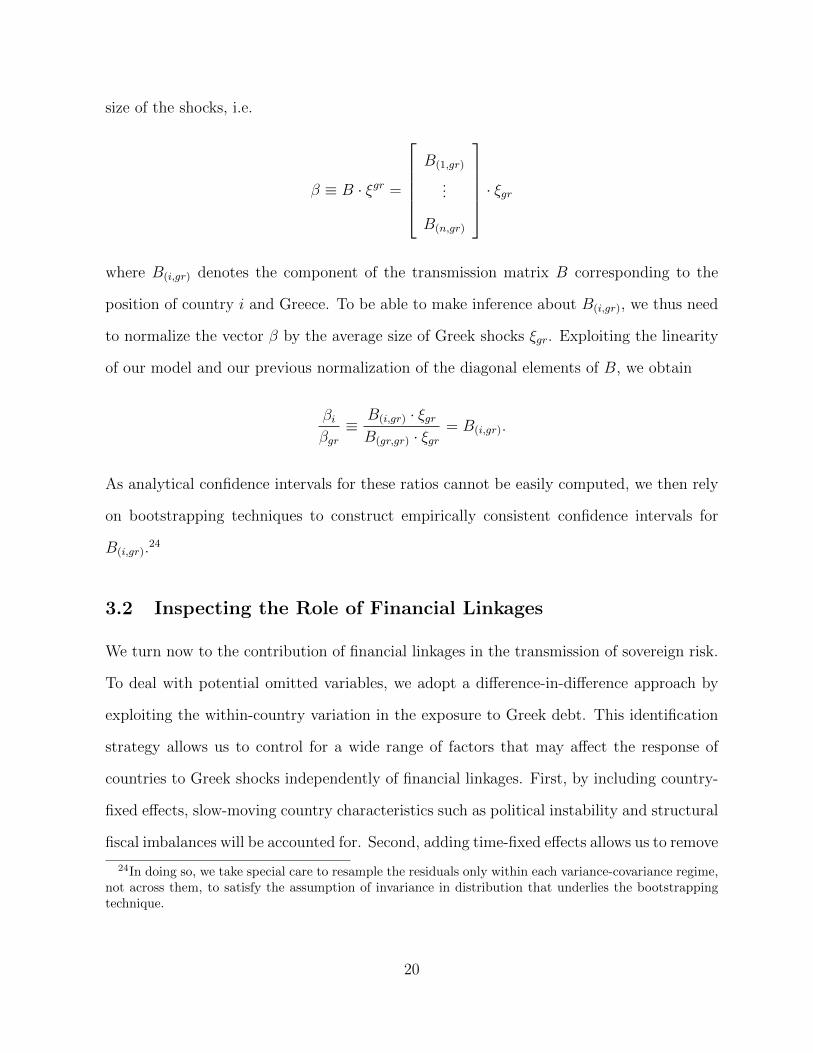
size of the shocks, i.e.
β ≡ B · ξgr =
B(1,gr)
...
B(n,gr)
· ξgr
where B(i,gr) denotes the component of the transmission matrix B corresponding to the
position of country i and Greece. To be able to make inference about B(i,gr), we thus need
to normalize the vector β by the average size of Greek shocks ξgr. Exploiting the linearity
of our model and our previous normalization of the diagonal elements of B, we obtain
βiβgr≡
B(i,gr) · ξgrB(gr,gr) · ξgr
= B(i,gr).
As analytical confidence intervals for these ratios cannot be easily computed, we then rely
on bootstrapping techniques to construct empirically consistent confidence intervals for
B(i,gr).24
3.2 Inspecting the Role of Financial Linkages
We turn now to the contribution of financial linkages in the transmission of sovereign risk.
To deal with potential omitted variables, we adopt a difference-in-difference approach by
exploiting the within-country variation in the exposure to Greek debt. This identification
strategy allows us to control for a wide range of factors that may affect the response of
countries to Greek shocks independently of financial linkages. First, by including country-
fixed effects, slow-moving country characteristics such as political instability and structural
fiscal imbalances will be accounted for. Second, adding time-fixed effects allows us to remove
24In doing so, we take special care to resample the residuals only within each variance-covariance regime,not across them, to satisfy the assumption of invariance in distribution that underlies the bootstrappingtechnique.
20
all time-varying factors that have a common effect on all countries. Finally, we include a
measure of bilateral trade of each country with Greece to remove potential endogenous
responses of financial linkages through changes in trade linkages.
Specifically, we allow the spillover matrix B in (2) to vary over time, reflecting quarterly
changes in financial exposures and trade linkages. Using Bq to denote the transmission
matrix in quarter q, we assume
Bq = B0 + Tq + d1 · FINq + d2 · TRADEq, (6)
where B0 is a matrix of fixed effects for each country pair, Tq is a matrix of time-fixed
effects common to all country pairs, and FINq and TRADEq are the matrices of financial
and trade linkages for each country pair. The coefficients d1 and d2 measure the effects of
an increase in financial and trade linkages on cross-country spillovers, respectively. Both
coefficients are scalar, as we assume that financial and trade linkages have the same effect
independently of the country pair.25
Substituting for (6) into (2) and using our previous decomposition of country-specific
Thus, the response to Greek shocks now depends on a vector of fixed effects for each
country, β0 = B0ξgr, a vector of common time effects, τq, and the vectors of financial
and trade linkages of each country with Greece, FINgr,q and TRADEgr,q. The coefficients
δ1 ≡ d1 · ξgr and δ2 ≡ d2 · ξgr are scalar and measure the contribution of financial and trade
linkages to the transmission of the average Greek shock, respectively.
25In (6) we maintain our previous normalization of the diagonal entries of B, by setting the diagonalentries of B0 equal to one and those of Tq, FINq and TRADEq to zero.
21
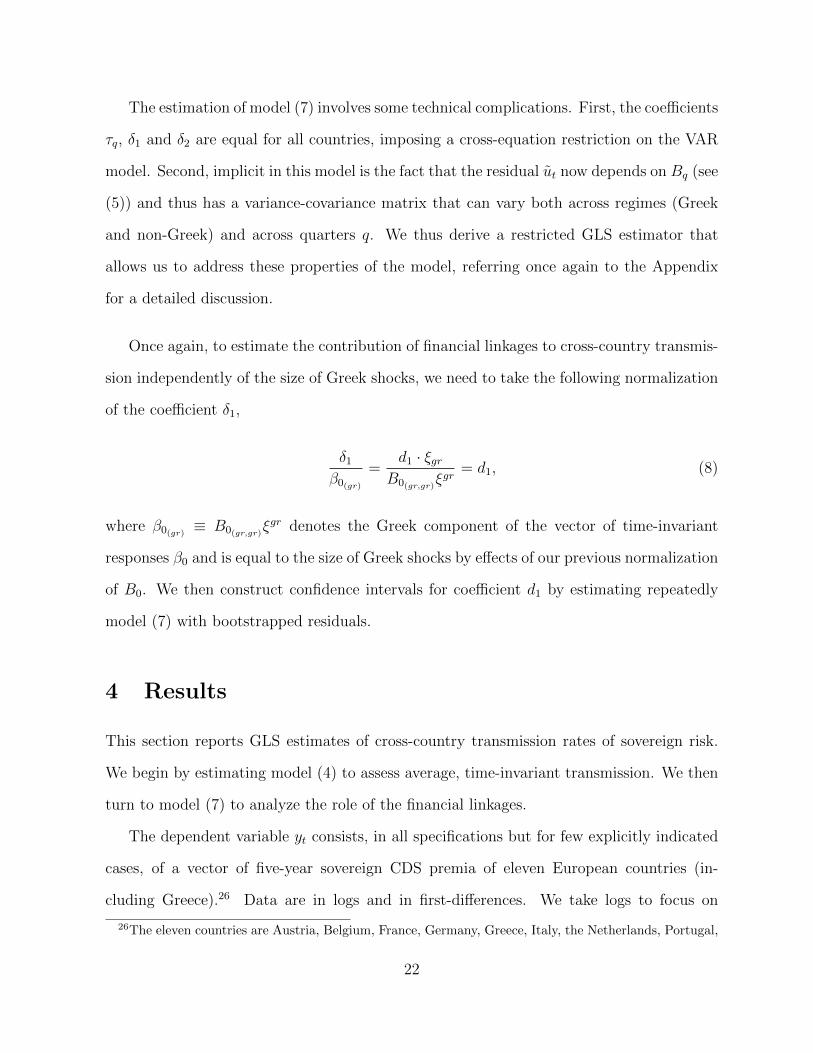
The estimation of model (7) involves some technical complications. First, the coefficients
τq, δ1 and δ2 are equal for all countries, imposing a cross-equation restriction on the VAR
model. Second, implicit in this model is the fact that the residual ut now depends on Bq (see
(5)) and thus has a variance-covariance matrix that can vary both across regimes (Greek
and non-Greek) and across quarters q. We thus derive a restricted GLS estimator that
allows us to address these properties of the model, referring once again to the Appendix
for a detailed discussion.
Once again, to estimate the contribution of financial linkages to cross-country transmis-
sion independently of the size of Greek shocks, we need to take the following normalization
of the coefficient δ1,
δ1β0(gr)
=d1 · ξgr
B0(gr,gr)ξgr
= d1, (8)
where β0(gr) ≡ B0(gr,gr)ξgr denotes the Greek component of the vector of time-invariant
responses β0 and is equal to the size of Greek shocks by effects of our previous normalization
of B0. We then construct confidence intervals for coefficient d1 by estimating repeatedly
model (7) with bootstrapped residuals.
4 Results
This section reports GLS estimates of cross-country transmission rates of sovereign risk.
We begin by estimating model (4) to assess average, time-invariant transmission. We then
turn to model (7) to analyze the role of the financial linkages.
The dependent variable yt consists, in all specifications but for few explicitly indicated
cases, of a vector of five-year sovereign CDS premia of eleven European countries (in-
cluding Greece).26 Data are in logs and in first-differences. We take logs to focus on
26The eleven countries are Austria, Belgium, France, Germany, Greece, Italy, the Netherlands, Portugal,
22
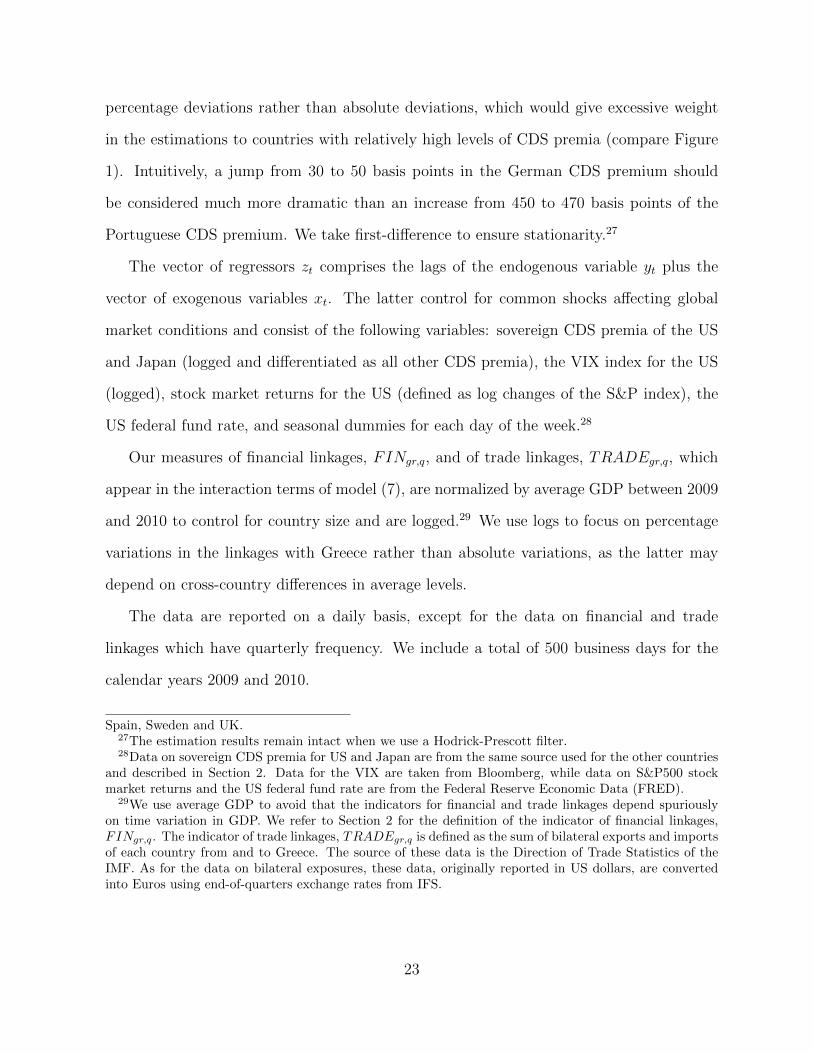
percentage deviations rather than absolute deviations, which would give excessive weight
in the estimations to countries with relatively high levels of CDS premia (compare Figure
1). Intuitively, a jump from 30 to 50 basis points in the German CDS premium should
be considered much more dramatic than an increase from 450 to 470 basis points of the
Portuguese CDS premium. We take first-difference to ensure stationarity.27
The vector of regressors zt comprises the lags of the endogenous variable yt plus the
vector of exogenous variables xt. The latter control for common shocks affecting global
market conditions and consist of the following variables: sovereign CDS premia of the US
and Japan (logged and differentiated as all other CDS premia), the VIX index for the US
(logged), stock market returns for the US (defined as log changes of the S&P index), the
US federal fund rate, and seasonal dummies for each day of the week.28
Our measures of financial linkages, FINgr,q, and of trade linkages, TRADEgr,q, which
appear in the interaction terms of model (7), are normalized by average GDP between 2009
and 2010 to control for country size and are logged.29 We use logs to focus on percentage
variations in the linkages with Greece rather than absolute variations, as the latter may
depend on cross-country differences in average levels.
The data are reported on a daily basis, except for the data on financial and trade
linkages which have quarterly frequency. We include a total of 500 business days for the
calendar years 2009 and 2010.
Spain, Sweden and UK.27The estimation results remain intact when we use a Hodrick-Prescott filter.28Data on sovereign CDS premia for US and Japan are from the same source used for the other countries
and described in Section 2. Data for the VIX are taken from Bloomberg, while data on S&P500 stockmarket returns and the US federal fund rate are from the Federal Reserve Economic Data (FRED).
29We use average GDP to avoid that the indicators for financial and trade linkages depend spuriouslyon time variation in GDP. We refer to Section 2 for the definition of the indicator of financial linkages,FINgr,q. The indicator of trade linkages, TRADEgr,q is defined as the sum of bilateral exports and importsof each country from and to Greece. The source of these data is the Direction of Trade Statistics of theIMF. As for the data on bilateral exposures, these data, originally reported in US dollars, are convertedinto Euros using end-of-quarters exchange rates from IFS.
In our baseline specification, we estimate model (4). The coefficient β is constant over the
entire period and thus captures the time-average of the responses to the identified Greek
shocks by the other European countries.
Our tests of autocorrelation of the residuals prompt us to include eight lags of the
dependent variable and no lag of the exogenous variables. Moreover, we disregard het-
eroskedasticity within the set of days where Greek events occur.
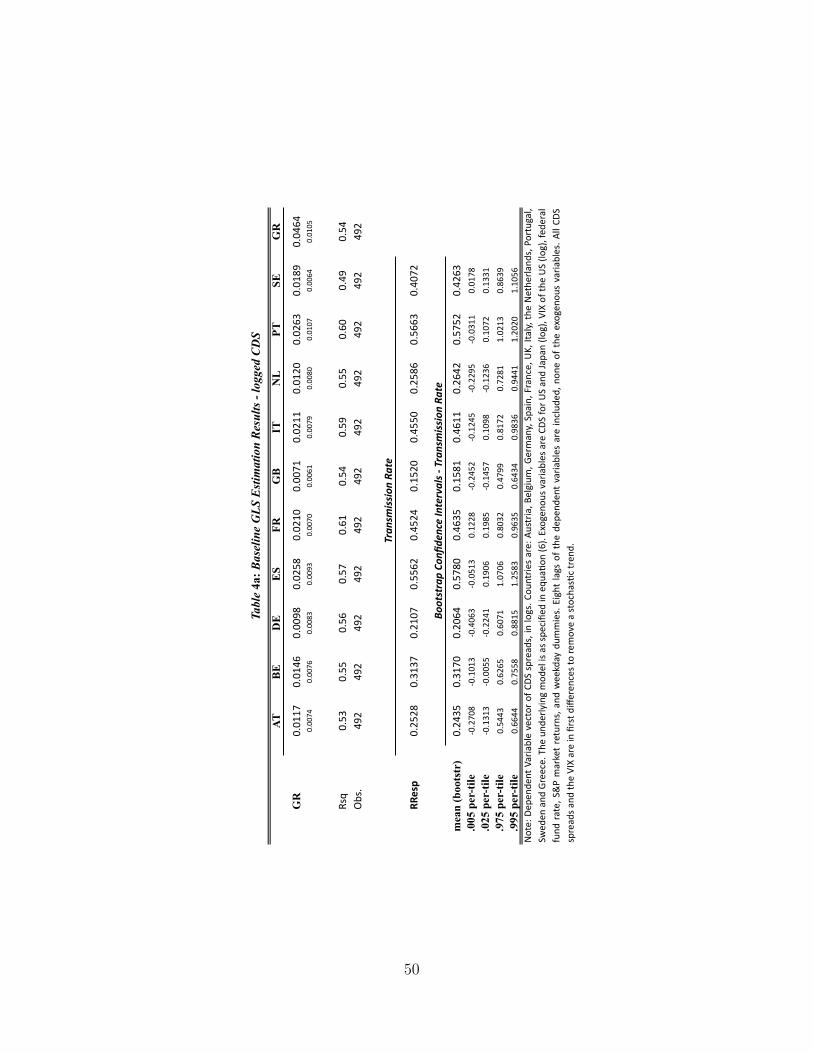
Table 4a reports the results for the baseline specification. The columns correspond to
the elements of the vector yt, i.e., to the eleven countries. In the upper panel, we report the
corresponding coefficients of the indicator for Greek events (GR), along with the standard
errors. All of the estimates of the eleven coefficients are positive, and the implied t-ratios
indicate that the coefficients are statistically significant on the five-percent level for more
than half of the countries.30 The point estimate for Greece itself is 0.0464, which indicates
that the events identified in Table A1 generated, on average, a jump in the Greek sovereign
CDS premium of over 4.6 percent. At a time-average of 679 basis points in 2010, this
average change in the CDS premium is roughly equivalent to a jump of more than 31 basis
points (679 ∗ .0464 = 31.53).
The coefficients corresponding to countries other than Greece itself vary from 0.0071
(UK) to 0.0263 (Portugal). Measured relative to the magnitude of the Greek coefficient
(lower panel), these estimates imply a rate of transmission that ranges from 15.20% to
56.63%, with a level of statistical significance that strongly matches that of the absolute
responses. On average, the rate of transmission is equal to 36.25%, suggesting economically
significant cross-country spillovers.
Table 4b repeats the estimates without prior logging the CDS premia to assess transmis-
30Namely, Spain, France, Italy, Portugal, Sweden and Greece. Increasing the confidence level to tenpercent, the response to Greek shocks is significant also for Belgium.
24
sion rates by levels rather than percentage deviations. Again, all estimates are positive and
with level of statistical significance comparable to those obtained before. The coefficient
for Greece indicates an average jump of 24.217 basis points in response to Greek events,
which is somewhat lower than, but in the same realm as, the benchmark computed using
the elasticities. The response of European sovereign CDS premia relative to the response
of the Greek CDS premium ranges between 1.11% and 34.30%.
Figure 3 plots the impulse response functions, including the five-percent confidence
bounds, for all eleven countries. The figure shows that a Greek shock generates a positive
contemporaneous response in the CDS premium of all countries, whose significance is com-
parable to the levels reported in Table 4a. In general, the induced change in CDS becomes
insignificant after one day. More importantly, the figure shows no negative response as the
lag increases, which indicates that the effects of Greek shocks are not transitory and the
sovereign CDS premia do not revert to their initial levels over time.31
Overall, the results from the baseline regression indicate substantial rates of transmis-
sion of sovereign risk across Europe. In the next step, we analyze the role of financial
linkages in that transmission.
4.2 Financial Linkages
We turn now to the estimation specified in (7). The coefficient δ1 on the interaction term
FINgr,q · 1gr,t captures the effect of financial linkages on the transmission of sovereign risk,
and is therefore the coefficient of interest. We use three different measures of financial
linkages: exposure (i) to Total Greek Debt (i.e. public plus private); (ii) to Greek Public
Debt; and (iii) to Debt of Greek Banks. Whenever there is no risk of confusion, we will
refer to these measures as exposure to Greece.
Column I in Table 5 shows the estimates corresponding to the specification where expo-
31The confidence bounds are derived from a bootstrap distribution based on 1000 replications.
25
Figure 3: Impulse Response Functions
0 2 4 6 8 10−0.02
00.020.04
at
0 2 4 6 8 10−0.02
00.020.04
be
0 2 4 6 8 10−0.02
00.020.04
de
0 2 4 6 8 10−0.02
00.020.04
es
0 2 4 6 8 10−0.02
00.020.04
fr
0 2 4 6 8 10−0.02
00.020.04
gb
0 2 4 6 8 10−0.02
00.020.04
it
0 2 4 6 8 10−0.02
00.020.04
nl
0 2 4 6 8 10−0.02
00.020.04
pt
0 2 4 6 8 10−0.02
00.020.04
se
0 2 4 6 8 10
0
0.05
0.1gr
Impulse response functions of CDS (log-changes) of eleven countries to a Greek shock of averagesize for the 10 business days after impact (blue line). The red lines indicate the 5% confidencebounds based on a bootstrap exercise with 1000 replications.
sure is measured in total Greek debt over GDP (Total). We choose to report only a small
set of the estimated coefficients for exigences of space: the first row reports the Greek
component of the vector of time-invariant coefficients on the Greek dummy (GR). This
coefficient, denoted by β0(gr) in (8), captures the average size of Greek shocks and is esti-
mated to be 0.0474, which is close to the point estimate in the baseline regression (Table
4a).32
32We do not report the fixed effects of the responses of other countries but nevertheless check that theimplied average rate of transmission is consistent with the baseline results.
26
The second and the third coefficient reported in Column I of Table 5 correspond to
the interaction terms GR ∗ Total and GR ∗ Trade, which relate the responses to Greek
shocks to the financial and trade linkages with Greece, respectively. The coefficient for the
first interaction term, which corresponds to δ1 in model (7), is 0.0163 and is significant at
the five-percent level, as indicated by the implied t-ratio. The coefficient on the second
interaction term is −0.0115 and is not statistically significant. We take these results as an
indication that financial linkages have been relatively more important than trade linkages
for the transmission of the Euro crisis and we further scrutinize their role.
We are interested in the rate of transmission, i.e. in the response relative to the size of
the original Greek shock. To this aim, the coefficient of GR ∗Total needs to be normalized
by the average size of the Greek shock, β0(gr) . The resulting ratio corresponds to the ratio
d1 in (6), which measures the elasticity, with respect to an increase in financial exposure,
of other countries’ responses to a one-percent increase of Greek sovereign risk. We will
therefore say that our coefficient of interest measures the impact of financial linkages on
the transmission rate of a normalized Greek shock.
The point estimate reported in Column I is equal to 0.3443 and is statistically significant
at the one-percent level as shown by the bootstrap confidence intervals reported in the lower
panel of the table.33 Figure 4 illustrates the bootstrap distributions for this coefficient for
the different measures of financial exposures to Greece. In all cases, the point estimates of
the coefficient lie, reassuringly, at the center of the respective bootstrap distribution.
The effect of financial linkages on transmission is not only statistically significant but
also economically relevant. Since CDS as well as financial exposure are logged, the point
estimate of 0.3443 suggests that a one percent increase in a country’s financial exposure
to Greece increases the transmission rate of a normalized Greek shock by 0.34 percent.
33As discussed in Section 3, we cannot derive a theoretical distribution for the estimator of d1 andresume to bootstrapping to assess statistical significance. The reported confidence bounds are based on1000 bootstrap replications and indicates that the estimates of d1 are strictly positive with a one-percentconfidence level.
27
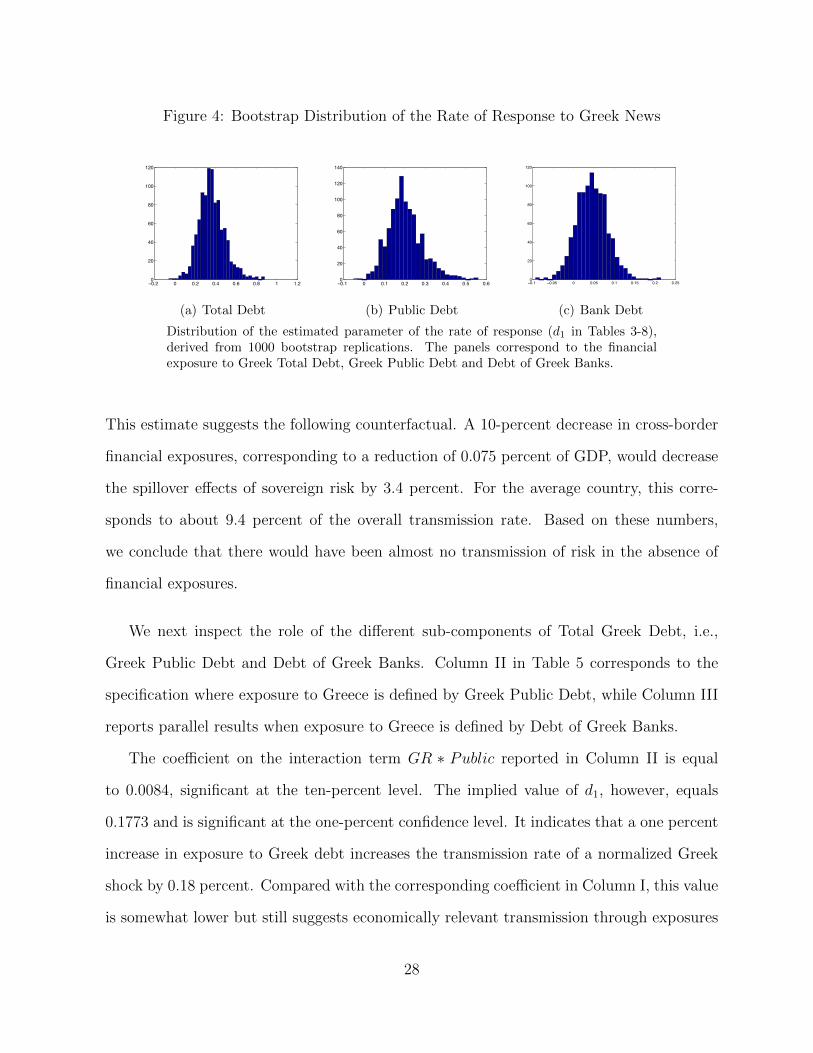
Figure 4: Bootstrap Distribution of the Rate of Response to Greek News
−0.2 0 0.2 0.4 0.6 0.8 1 1.20
20
40
60
80
100
120
(a) Total Debt
−0.1 0 0.1 0.2 0.3 0.4 0.5 0.60
20
40
60
80
100
120
140
(b) Public Debt
−0.1 −0.05 0 0.05 0.1 0.15 0.2 0.250
20
40
60
80
100
120
(c) Bank Debt
Distribution of the estimated parameter of the rate of response (d1 in Tables 3-8),derived from 1000 bootstrap replications. The panels correspond to the financialexposure to Greek Total Debt, Greek Public Debt and Debt of Greek Banks.
This estimate suggests the following counterfactual. A 10-percent decrease in cross-border
financial exposures, corresponding to a reduction of 0.075 percent of GDP, would decrease
the spillover effects of sovereign risk by 3.4 percent. For the average country, this corre-
sponds to about 9.4 percent of the overall transmission rate. Based on these numbers,
we conclude that there would have been almost no transmission of risk in the absence of
financial exposures.
We next inspect the role of the different sub-components of Total Greek Debt, i.e.,
Greek Public Debt and Debt of Greek Banks. Column II in Table 5 corresponds to the
specification where exposure to Greece is defined by Greek Public Debt, while Column III
reports parallel results when exposure to Greece is defined by Debt of Greek Banks.
The coefficient on the interaction term GR ∗ Public reported in Column II is equal
to 0.0084, significant at the ten-percent level. The implied value of d1, however, equals
0.1773 and is significant at the one-percent confidence level. It indicates that a one percent
increase in exposure to Greek debt increases the transmission rate of a normalized Greek
shock by 0.18 percent. Compared with the corresponding coefficient in Column I, this value
is somewhat lower but still suggests economically relevant transmission through exposures
28
to public debt.
The coefficient on the interaction term GR ∗ Bank reported in Column III is equal to
0.0020 and is not statistically significant. The implied value of d1 is 0.0412, much lower than
in the previous two cases. In addition, the reported bootstrap confidence interval shows
that this coefficient is not statistically different from zero at a five-percent confidence level.
These results suggest that the role of exposure to debt of foreign banks is less important for
the transmission of sovereign risk: the elasticity of the spillover effects to bank debt exposure
is less than one fourth of the corresponding elasticity with respect to direct exposure to
Greek sovereign debt.
Finally, notice that the estimated coefficients on the Greek dummy and on the interac-
tion term GR ∗ Trade do not vary much across specifications.
Overall, the baseline estimates suggest that the rates of exposure to total Greek debt,
and in particular to Greek public debt, played important roles in the transmission of
sovereign risk across the Euro Area. Bank-to-bank lending, by contrast, did not seem
to play a major role for the transmission. We now conduct a number of robustness exer-
cises using alternative specifications and different variables than those used in our baseline
estimations.
4.3 Robustness
In the first robustness check, we repeat our estimations measuring CDS in basis points and
the exposure to Greek debt as percentage points of GDP (i.e., we do not log these variables).
While this linear specification, may consitute a more direct way of testing transmission,
the estimates may also be affected by the respective levels of CDS and exposure to Greece.
Specifically, countries with relatively large CDS premia and with relatively large exposures
to Greek debt will have higher weight in the estimation. Table 6 shows that the coefficients
on the interaction between the different measures of financial exposures and the Greek
29
dummy remain positive, although the coefficients involving the exposure to total Greek
debt and the exposure to Greek public debt are not statistically significant. When we nor-
malize the interaction coefficients by the size of Greek shocks, however, we find insignificant
estimates only in the specification with total Greek debt. We observe that the estimate of
the coefficient of interest, d1, in the specification involving the Debt of Greek Banks is now
larger than the estimate in the specification using Greek Public Debt. The estimates of the
coefficient d1 are 0.0625 and 0.2894, respectively. One must bear in mind, however, that
the exposure to bank debt (0.09% of GDP on average) is much lower than the exposure
to sovereign debt (0.48%) so that the total effect of the latter is bigger. Overall, the point
estimates reported in Table 6 suggest following interpretation of our results. According to
Column II, a reduction of exposure to Greek Public Debt of one percent of GDP implies
that the transmission rate of a normalized Greek shock decreases by roughly 0.06 percent.
Comparing these results with an average normalized response of 0.08912 basis point (com-
pare Table 4b), this value suggest that financial linkages were important for the observed
transmission of sovereign risk.
Next, we take an alternative measure of financial linkages that not only considers the
direct exposure to Greek debt but also the entire network of bilateral exposures across
the countries in our sample. In particular, if French banks are strongly exposed to Greek
sovereign debt but Spanish banks are not, the Spanish banks might nevertheless suffer
from an increase in Greek sovereign risk due to their indirect exposure through the French
banking system. To capture these indirect effects, we invert the matrix of bilateral financial
linkages and estimate the corresponding Greek column of the matrix of financial linkages.
The exposure now captures the overall – i.e., the direct and the indirect – transmission
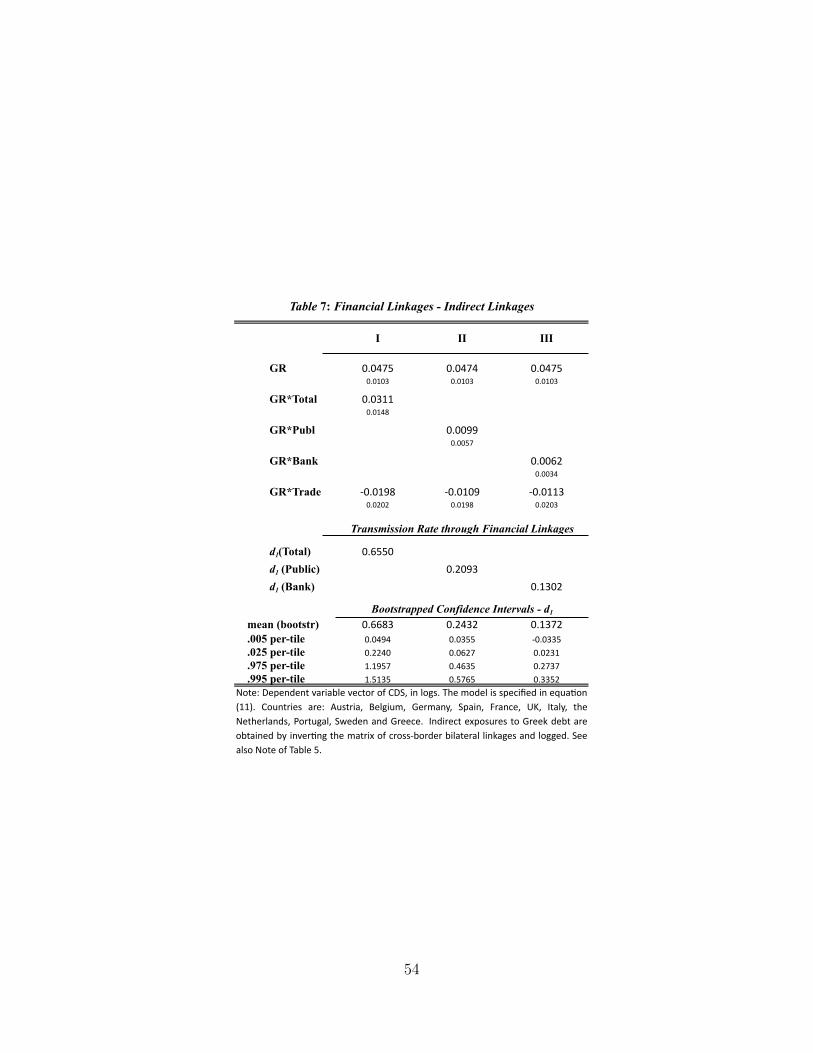
of Greek shocks to the respective European countries. Table 7 shows that the estimates
for d1 have a level of statistical significance of at least five percent in all specifications.
Interestingly, the point estimates are larger than those reported in Table 5, especially in
30
the specification with total Greek debt and with Debt of Greek Banks. These numbers
demonstrate the importance of accounting for the entire network of cross-border financial
linkages when studying the propagation of sovereign risk, particularly in the context of the
highly integrated European countries.
Further, we address potential concerns related to the possibility that financial institu-
tions in distress may raise their exposures to high risk, high return assets (including Greece)
to gamble for resurrection. In this case, vulnerable economies with strong responses to all
foreign (including Greek) shocks may actually increase their exposure to Greek debt so
that reverse causality could bias our estimates. To test for such effects, we re-estimate our
baseline model by replacing the exposure to Greek debt with the exposure to the debt of
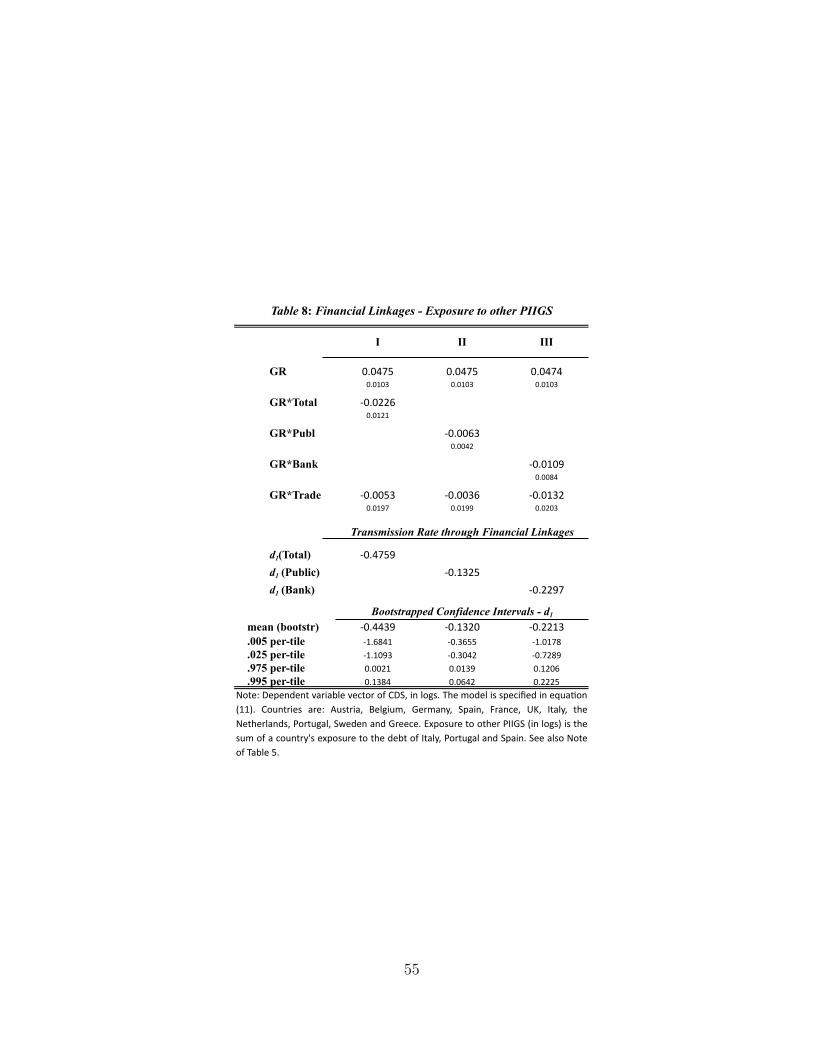
the PIIGS. The results reported in Table 8 show that there is no clear association between
the change in responses to Greek shocks and the exposures to the debt of the PIIGS. In par-
ticular, the coefficient on the interaction with the different measures of financial exposures
are all negative and statistically insignificant. The same result applies when normalizing
the interaction coefficients by the size of average Greek shocks, as indicated by the fact that
the bootstrap confidence intervals for d1 are centered around zero. We confidently dismiss
the possibility of gambling for resurrection and the associated reverse causality bias in the
results showed in Table 5.
An additional concern is that the days of Greek news might be interpreted by the
market as days of deteriorating global economic conditions.34 In this case, our estimate
would be biased if changes in exposure to Greek debt correlate within countries’ changes in
the exposure to aggregate foreign debt, defined as the sum of claims on each foreign country.
Specifically, the coefficient on the interaction term with financial exposures would reflect
the response of sovereign risk to changes in the general exposure to risk rather than changes
34More specifically, these event could be perceived as changes in global conditions not captured in ourexogenous variables.
31
in the exposure to Greece. To address this concern, we add as a control the interaction
between the Greek dummy and three measures of aggregate exposure to foreign debt (i.e.,
total, public and bank debt), each referring to the corresponding measure considered in the
exposure to Greek debt. At the cost of generating some confusion, we denote in Table 9
this additional interaction term as GR ∗ FOREIGN , irrespectively of the specific class of
asset it refers. The results in Table 9 show that both the coefficient on the interaction term
with exposure to Greek debt and the implied value of d1 barely change in magnitude or in
significance relative to our baseline results in Table 5. The coefficient on the interaction
with aggregate foreign exposure, instead, enters with a negative sign and is not significant
in any of the three specification. Overall, these results shows that the aggregate exposure
to foreign debt has no effect on the transmission rate of Greek shocks.
Finally, we conduct a number of additional checks to verify whether our results are
robust to different definitions of Greek shocks. In the first check, we take a narrower set
of events which was labeled the restricted set of Greek events in section 2. As described
in that section, this set is obtained after taking an additional round of elimination, where
we adopt a more conservative definition of relevant financial news in other countries. The
results are shown in Table 10. Relative to our baseline results, the coefficient on the Greek
dummy (GR) rises to approximately 0.053 in all specifications and remains significant at
the one-percent level. Column I and II show that the coefficients on the interaction terms
GR∗Total and GR∗Publ increase in magnitude and are significant at the one-percent and
at the five-percent confidence level, respectively. The coefficient on GR ∗ Bank reported
in Column III remains insignificant. A similar pattern is maintained for the normalized
coefficient d1, which is strongly significant in the first two specifications while it is not so in
the third one. In addition, the values of this coefficient in the first two columns is roughly
equivalent to the ones reported in Table 5. We can therefore conclude that our results do
not change significantly when we base the selection of Greek shocks on a narrow definition.
32
Similarly, the general pattern of our results does not change when we expand the defi-
nition of Greek events to include all dates that survive the first two rounds of elimination
(see Table A2). In particular, this raw set of Greek events includes also those events that
overlap with information shocks stemming from outside Greece. Using this noisy measure
of Greek shocks should thus result in an attenuation bias of both the coefficients on the
Greek dummy and on the two interaction terms. Consistently with our expectations, the
results reported in Table 11 show that almost all estimated coefficient have lower absolute
magnitude but there is no meaningful change in the respective sign. The estimated size
of Greek shocks reported in the first row of the table is approximately equal to 0.03 in
all specifications, remaining statistically significant at the one-percent level. As for the
interaction with the measures of financial linkages, we observe a much lower coefficient in
the specification with the exposure to total Greek debt (0.0106) and only a small variation
in the coefficient corresponding to the exposure to Greek public debt (0.0086). These val-
ues results in an estimate for the normalized coefficient d1 that equals 0.3567 in the first
specification and 0.2911 in the second one, with a level of significance of five-percent in
the worst case. The value of d1 instead close to zero and statistically insignificant in the
specification with the exposure to Debt of Greek Banks. Overall, these results indicate
that our estimates of the effect of financial linkages on the transmission of sovereign risk
are very robust to the specific set of Greek events considered.
5 Conclusion
This paper has shown that financial linkages matter for the transmission of sovereign risk
in the Euro crisis. Our preferred estimates show that a 10-percent decrease in cross-
border financial exposures, corresponding to a reduction of 0.075 percent of GDP, would
decrease the spillover effects of sovereign risk by 3.4 percent. For the average country,
this corresponds to about 9.4 percent of the overall transmission rate. Similarly, a 10-
33
percent decrease in the exposure to foreign sovereign debt, corresponding to a reduction
of 0.05 percent of GDP, would decrease spillover effects by 1.8 percent. Again the average
country, this corresponds to 5 percent of the overall transmission rate. These estimates are
statistically significant and economically relevant. On the contrary, bank-to-bank lending
does not appear to matter for the transmission of sovereign risk.
Methodologically, we follow the narrative approach of Romer and Romer (1989), iden-
tifying financially relevant news shocks that can be attributed to Greece’s problems ser-
vicing its sovereign debt. These shocks are used to assess the response of sovereign risk of
other European countries. We further relate the latter responses to cross-border financial
linkages, controlling for alternative transmission channels using country-fixed effects and
within-country variation in trade linkages.
34
A The Estimator
We derive the estimator used in main body of the paper. To do so, we will proceed in
several steps. First, we state a technical result on matrix inversion, which we use later.
Second, we derive a multi-variate generalized least squares (GLS) estimator under the type
of heteroskedasticity described in the main text. Third, we describe our bootstrapping
techniques.
A.1 Matrix Algebra
Claim 1 Let Σk be a collection of n × n matrices with full rank, for k = 1, ..., K. Let
further Ik denote m × m matrices of the following form: all off-diagonal elements equal
to zero, all diagonal elements are either zero or one and the Ik sum to the unit matrix:∑k Ik = 1m. Then, (
K∑k=1
Σk ⊗ Ik
)−1=
K∑k=1
Σ−1k ⊗ Ik (9)
holds, where ⊗ symbolizes the Kronecker matrix multiplication.
Proof. Multiplication of∑
k Σk ⊗ Ik and the right hand side in (9) and exploiting the
basic properties of the Kronecker multiplication yields
(∑k
Σk ⊗ Ik
)∑k
Σ−1k ⊗ Ik =∑k
(Σk ⊗ Ik)(Σ−1k ⊗ Ik
)+∑k 6=j
(Σk ⊗ Ik)(Σ−1j ⊗ Ij
)=
∑k
ΣkΣ−1k ⊗ IkIk +∑k 6=j
ΣkΣ−1j ⊗ IkIj
=∑k
1n ⊗ Ik +∑k 6=j
ΣkΣ−1j ⊗ 0m
= 1n ⊗∑k
Ik = 1nm
35
A.2 GLS Estimator – Time-Invariant Transmission
Defining zt = [z′t,1gr,t]′ and Φ = [Φ, β], we can reformulate model (4) in the main text as
yt = Φzt + ut, (10)
where the residuals ut satisfy
Et(ut) = 0, Et(utu′t) =
Σgr if t ∈ T gr
Σngr if t 6∈ T gr
, Et(utu′s) = 0 for s 6= t (11)
with T gr being the set of greek events and Σgr and Σngr being full-ranked and thus invert-
ible. Here and in the following, Et denotes the expected value given the information set
available at period t.
Further assumptions are required to guarantee the asymptotic normality of the GLS
estimator. Following Lutkepohl (2007, p. 397), we assume throughout that the matrix Φ of
autoregressive coefficients satisfies a stability condition, and that the vector of exogenous
variables xt, which appears among the elements of zt, is generated by a stationary, stable
VAR process which is independent of the process ut.
For a model dimension n and sample size T , model (10) can be written compactly as
y = (In ⊗ Z ′)φ + u, (12)
where y is the nT × 1 vector obtained by stacking the vectors y(k) of time series for each
kth component of yt, u is similarly defined by stacking the vectors u(k) of time series of
each component of ut, In is a n-dimensional identity matrix and Z = [z1, . . . , zT ] is the
(p+ 1)× T matrix formed by the time series of vector zt. Here, p+ 1 denotes the number
of regressors in each equation of model (10), which include p = nJ + m variables plus the
36
Greek dummy. φ = [Φ′(1), Φ′(2), . . . , Φ
′(n)]′ is the n(p+ 1)× 1 vector obtained from stacking
the rows Φ(k) of matrix Φ.
Consistently with the assumptions in (11), the variance-covariance of the vector of
residuals ut satisfies
Σu = Σgr ⊗ IgrT + Σngr ⊗ IngrT .
Here IgrT is a T -dimensional diagonal matrix whose diagonal entries corresponds to the
entries of the vector [1gr,1, . . . ,1gr,T ] and IngrT = IT − IgrT . The GLS estimator of φ thus
minimizes u′(Σu)−1u and equals
φ = [(In ⊗ Z)Σ−1u (In ⊗ Z ′)]−1(In ⊗ Z)Σ−1u y. (13)
Under the assumption in (11) and the regularity conditions discussed above, we can
show
Claim 2 The GLS estimator of β converges in distribution according to
√T(φ− φ
)d−→ N(0,Q−1VQ−1),
where Q ≡ plim(T−1(In ⊗ Z)Σ−1u (In ⊗ Z ′)
)is well-defined, symmetric and non-singular
and V ≡ (In ⊗ Z)Σ−1u (In ⊗ Z ′).
Proof. Rearranging (13) we obtain
√T(φ− φ
)=
[(In ⊗ Z)Σ−1u (In ⊗ Z ′)
T
]−1(In ⊗ Z)Σ−1u u√
T. (14)
37
Expanding the term within squared brackets yields
(In ⊗ Z)Σ−1u (In ⊗ Z ′)T
=1
T
ZΩ11Z′ ZΩ12Z
′ . . . ZΩ1nZ′
ZΩ21Z′ ZΩ22Z
′ . . . ZΩ2nZ′
......
. . ....
ZΩn1Z′ ZΩn2Z
′ . . . ZΩnnZ′
where Ωij denotes the T × T block of Σ−1u with (i, j) position. Applying Claim 1, we write
Ωij = ωij,gr · IgrT + ωij,ngr · IngrT ,
where ωij,gr denotes the component of Σ−1gr with (i, j) position. ωij,ngr is defined analogously.
Substituting for Ωij we obtain
1
TZΩijZ
′ = ωij,grλ∑t∈T gr
ztz′t
Tgr+ ωij,ngr(1− λ)
∑t6∈T gr
ztz′t
Tngr,
where Tgr and Tngr are used to denote the number of Greek and non-Greek events respec-
tively and λ = Tgr
Tis the sample probability of t ∈ T gr. Assuming that λ converges to a
finite number as T → ∞, the assumptions in (11) and the regularity conditions imposed
above ensure that each ZΩijZ′ has a well-defined probability limit. We can thus write
(In ⊗ Z)Σ−1u (In ⊗ Z ′)T
p−→ Q, (15)
where Q is a symmetric matrix (since Σ−1u is symmetric) and is non-singular.
38
Expanding the second term in (14) we get
(In ⊗ Z)Σ−1u u√T
=1√T
∑nj=1 ZΩ1,ju(j)∑nj=1 ZΩ2,ju(j)
...∑nj=1 ZΩn,ju(j)
,
where
1√T
n∑j=1
ZΩi,ju(j) =n∑
j=1
(ωij,gr
√λ∑t∈T gr
ztuj,t√Tgr
+ ω1j,ngr
√1− λ
∑t6∈T gr
ztuj,t√Tngr
).
The terms ztuj,t are martingale difference sequences with well-defined variance-covariance
matrices in both Greek and non-Greek regimes. We can therefore apply a version of the
Central Limit Theorem (see Hamilton (1994, p. 193)) to show that each 1√T
∑nj=1 ZΩi,ju(j)
has a well-defined asymptotic normal distribution. Thus, we can write
(In ⊗ Z)Σ−1u u√T
d−→ N(0,V), (16)
where V ≡ (In ⊗ Z)Σ−1u (In ⊗ Z ′). Combining (15) and (16), we obtain
√T(φ− φ
)d−→ N(0,Q−1VQ−1),
Feasible estimation of model (12) using GLS estimator (13) requires a two-step proce-
dures. First, use OLS residuals to obtain estimates for the VCV matrices Σgr and Σngr.
Then, use these matrices to obtain the feasible GLS estimator.
39
A.3 GLS Estimator – Time-Varying Transmission and Restric-
tions
We restrict our discussion of GLS estimator for the case of time-varying transmission and
restrictions on the parameters of the model to a simple version of model (7) in the main
text. Specifically, we consider just one time-varying interaction term and no linear trend
in the response to Greek shocks, as in
yt = Φzt +(β0 + δ1 · FINgr,q
)· 1gr,t + ut. (17)
where δ1 is a scalar. Generalization to the case of several interaction term and linear trend
is straightforward.
Defining zt = [z′t,1gr,t, F IN′gr,q · 1gr,t]
′, we can rewrite model (17) as
yt = Φzt + ut Φ′(k) = Rk · ck, (18)
where the matrix of coefficients Φ = [Φ, β0,∆1] allows for different coefficients on the
interaction term in each equation of the model. The equation on the right specifies a set
of linear restrictions on each row Φ(k) of the matrix of coefficients Φ. Letting
Rk =
Ip×p 0p×1 0p×1
01×p 1 0
0n×p 0n×1 ek
and ck = [Φ(k), δ0,k, δ1]′
where ek is the kth unit vector of length n, the components of vector ∆1 are constrained to
be equal to each other.
40
The residual process satisfies the following set of assumptions
Et(ut) = 0, Et(utu′t) =
Σgr,q if t ∈ Tq ∩ T gr
Σngr,q if t ∈ Tq\T gr
, Et(utu′s) = 0 for s 6= t, (19)
where Tq is the set of dates in quarter q and T gr is defined as before. This formulation
allows the variance-covariance matrix of residuals to depend on the quarter q within the
two regimes.
Rewriting model (18) using the notation introduced in the previous case, we obtain
y = (In ⊗ Z′)φ + u φ = R · γ. (20)
Here φ = [Φ′(1), Φ′(2), . . . , Φ
′(n)]′ is the n(p + 1) + n × 1 vector of constrained coefficients
obtained from stacking the rows Φ(k) of matrix Φ, while γ is the n(p+ 1) + 1× 1 vector of
unconstrained coefficients and is defined as γ = [Φ′(1),Φ′(2), . . . ,Φ
′(n), δ
′0, δ1]
′.
The two coefficients are linearly related through the matrix R, which is defined by
R =
W 0 . . . E1
0. . . 0
...
... 0 W En
,
where W and Ek, for k = 1, . . . , n satisfy
W =
Ip×p
01×p
0n×p
and Ek =
0p×n 0p×1
e′k 0
0n×n ek
.
The assumptions (19) on the distribution of the residuals imply that the vector of
41
residuals u has a variance-covariance matrix that is now equal to
Σu =∑q
Σq,gr ⊗ (IgrT Iq) + Σq,ngr ⊗ (IngrT Iq) ,
where IgrT and IngrT are defined as above and Iq is a T × T matrix defined as
Iq =
0T1×T1 . . . . . . . . . . . . . . . . . .
. . . . . . 0Tq−1×Tq−1 0Tq−1×Tq . . . . . . . . .
. . . . . . 0Tq−1×Tq ITq×Tq 0Tq×Tq+1 . . . . . .
. . . . . . . . . . . . . . . . . . . . .
. . . . . . . . . . . . . . . . . . 0TQ×TQ
, (21)
where 0Tq×Tq and ITq×Tq denote a zero matrix and an identity matrix with dimension Tq×Tq,
respectively.
We now derive an estimator for this model under this set of assumptions. Substituting
the constraint into the main equation, the GLS estimator of γ minimizes the expression
u′(Σu)−1u =(y − (In ⊗ Z ′)Rγ
)′Σ−1u
(y − (In ⊗ Z ′)Rγ
).
The estimator of γ is thus
γ =[R′(In ⊗ Z)Σ−1u (In ⊗ Z′)R
]−1R′(In ⊗ Z′)Σ−1u y. (22)
Under the assumptions in (19) and the same regularity conditions as before, we can
show
Claim 3 The GLS estimator γ converges in distribution according to
√T (γ − γ)
d−→ N(0,Q−1VQ−1).
42
where Q ≡ plim(T−1(R′(In ⊗ Z)Σ−1u (In ⊗ Z ′)R)
)is well-defined, symmetric and non-
singular and V ≡ R′(In ⊗ Z ′)Σ−1u (In ⊗ Z)R.
Proof. Rearranging (22) we obtain
√T (γ − γ) =
[R′(In ⊗ Z)Σ−1u (In ⊗ Z ′)R
T
]−1R′(In ⊗ Z ′)Σ−1u u√
T. (23)
The expansion of the term within squared bracket yields
R′(In ⊗ Z)Σ−1u (In ⊗ Z ′)RT
= (24)
=1
T
W ′Z 0 . . . 0
0 W ′Z . . . 0
......
. . ....
0 0 . . . W ′Z
E ′1Z E ′2Z . . . E ′nZ
Ω11 Ω12 . . . Ω1n
Ω21 Ω22 . . . Ω2n
......
. . ....
Ωn1 Ωn2 . . . Ωnn
Z ′W 0 . . . . . . Z ′E1
0 Z ′W . . . . . . Z ′E2
......
. . . . . ....
0 0 . . . Z ′W Z ′En
=1
T
W ′ZΩ11Z′W W ′ZΩ12Z
′W . . . . . .∑
j W′ZΩ1jZ
′Ej
W ′ZΩ21Z′W W ′ZΩ22Z
′W . . . . . .∑
j W′ZΩ2jZ
′Ej
......
. . . . . . . . .
...... . . . W ′ZΩnnZ
′W∑
j W′ZΩnjZ
′Ej∑iE′iZΩi1Z
′W∑
iE′iZΩi2Z
′W . . .∑
iE′iZΩinZ
′W∑
j
(∑iE′iZΩijZ
′Ej
)
where Ωij is used again to indicate the T × T block of matrix Σu with (i, j) position.
We can further rearrange this equation. To do so, we need first to realize that the
matrix Ωij is now formed by different submatrices which account for the varying covariance
43
of residuals across quarters:
Ωij =
Ωij,1 0 . . . 0
0 Ωij,2 . . . 0
......
. . ....
0 0 . . . Ωij,Q
.
Let Igr,q define the non-zero diagonal submatrix with Tq×Tq dimension of the matrix IgrT ·Iq.
Matrix Ingr,q is defined analogously. Applying Claim 1, we write
Ωij,q = ωij,gr,q · Igr,q + ωij,ngr,q · Ingr,q,
where ωij,gr,q and ωij,ngr,q denote the components with (i, j) position of Σ−1gr,q and Σ−1ngr,q,
respectively.
Using the definitions of Ωij, W and each Ei, we can now show that the blocks of the
expanded matrix in (24) contains the uncentered second moments of the regressors in zt
and thus must have a well-defined probability limit. Consider a partition of the previously
defined matrix Z into a number of submatrices Zq which are formed by the time series of
zt within each quarter q. Thus, Z = [Z1, . . . , ZQ]. We can show first that
1
TW ′ZΩijZ
′W =1
TZΩijZ
′ =
Q∑q=1
1
TZqΩij,qZq
′
and, by the above decomposition of Ωij,q, each element in the sum can be expressed as
1
TZqΩij,qZ
′q = n
ωij,gr,qλq∑t∈Tq
ztz′t
Tgr,q+ ωij,ngr,q(1− λq)
∑t∈Tq\Tq
ztz′t
Tngr,q
,
where λq, Tgr,q and Tngr,q are defined as before but now depend on a specific quarter q
and n = P (t in quarter q) denotes the sample probability of a date t being in quarter q.
44
Assuming that the limits for λq and n as T →∞ exist and are finite, our set of assumptions
ensures that 1TZqΩij,qZ
′q converges in probability. We can thus write
1
TW ′ZΩijZ
′Wp−→ Qij,
where Q is a symmetric matrix (since Σ−1u is symmetric) and is assumed to be non-singular.
Using a similar rearrangement, we can also show that
1
TE ′iZΩijZ
′W =
Q∑q=1
1
TE ′iZqΩij,qZq
′
where for each q it holds
E ′iZqΩij,qZq′ = n
ωij,gr,qλq∑t∈Tq
ei,tz′t
Tgr,q+ ωij,ngr,q(1− λq)
∑t∈Tq\Tq
ei,tz′t
Tngr,q
.
Here ei,t ≡ E ′izt = [(ei · 1gr,t)′, (e′i · (lgr,q · 1gr,t))
′]′ is a (n+ 1)× 1 vector which includes the
indicator 1gr,t in the ith position and the interaction between the Greek indicator and the
ith component of vector lgr,q in the (n+ 1)th position. As this term has a well-defined limit
under our regularity assumptions, we can conclude that the matrix 1TE ′iZΩijZ
′W converges
in probability and thus
1
T
∑i
E ′iZΩijZ′W
p−→ Eij,
where Eij is well-defined. Finally, we can show analougsly that
∑j
(∑i
E ′iZΩijZ′Ej
)p−→ H,
where H is well-defined. Combining these three results, we obtain
R′(In ⊗ Z)Σ−1u (In ⊗ Z ′)RT
p−→ Q, (25)
45
where Q is well-defined, symmetric and non-singular.
Given the assumption that the residual ut is conditional independent of the regressors
in zt, we can now apply the Central Limit Theorem, as we did in the previous case, and
we can show that the second term in (23) has a well-defined asymptotic distribution:
R′(In ⊗ Z ′)Σ−1u u√T
d−→ N(0,V), (26)
where V ≡ R′(In ⊗ Z ′)Σ−1u (In ⊗ Z)R. Combining (25) and (26) we obtain
√T (γ − γ)
d−→ N(0,Q−1VQ−1).
As for the previous case, feasible estimation of model (20) with GLS estimator (22) re-
quires a two-step procedures, where we first estimate the the quarter-specific VCV matrices
Σngr,q and Σgr,q using OLS residuals. In this case, however, we face the difficulty that the
quarterly sets of dates with Greek events, Tq, contain, on average, few elements. Thus, the
standard estimate of the quarter-specific variance-covariance matrix
Σgr,q =1
|Tq ∩ T gr|∑
t∈Tq∩T gr
utu′t
delivers matrices that do not have full rank and cannot be inverted for the calculation of
the GLS estimations. We address this problem by simply taking the time-average variance-
Table 2a: Summary Statistics - Exposure to Greek Debt, Time-Averagein % of GDP, Average 2009/10
Source: BIS Consolidated Banking Sta?s?cs. Countries are: Austria, Belgium, France, Germany, Italy, theNetherlands, Portugal, Spain, Sweden and the UK.
Source: BIS Consolidated Banking StaAsAcs. Countries are: Austria, Belgium, France, Germany, Ireland, Italy,the Netherlands, Portugal, Spain, Sweden and the UK.
Table 3b: Summary Statistics - CDS spreads in 10 European countries during Greek eventsLog-changes by business day, by type and level of exposure to Greek debt.
A. Total Debt
Days of posiEve Greek shocks Days of negaEve Greek shocks
B. Public Debt
Days of posiEve Greek shocks Days of negaEve Greek shocks
C. Bank Debt
Days of posiEve Greek shocks Days of negaEve Greek shocks
Source: Datastream, BIS Consolidated Banking Statistics. Countries are: Austria, Belgium, France, Germany, Italy, the Netherlands, Portugal, Spain, Sweden and the UK.
Note: Dependent variable vector of CDS, in logs. Countries are: Austria, Belgium,Germany, Spain, France, UK, Italy, the Netherlands, Portugal, Sweden and Greece.The underlying model is as specified in equaSon (11). Exogenous variables are CDSfor US and Japan (log), VIX of the US (log), federal fund rate, S&P market returnsand weekday dummies. The Greek dummy is interacted with exposure to Greekdebt, bilateral trade with Greece and Sme dummies. Data on exposure and tradeare logged. Eight lags of the dependent variables are included, none of theexogenous variables. All CDS spreads and the VIX are in first differences to removea stochasSc trend.
Note: Dependent variable vector of CDS, in levels (bp). The model is specified inequaJon (11). Countries are: Austria, Belgium, Germany, Spain, France, UK, Italy,the Netherlands, Portugal, Sweden and Greece. Exogenous variables are CDS for USand Japan (in levels), VIX of the US (in levels), federal fund rate, S&P market returnsand weekday dummies. The Greek dummy is interacted with exposure to Greekdebt, bilateral trade with Greece and Jme dummies. Data on exposure and tradeare in percent of GDP. See also note of Table 5.
Note: Dependent variable vector of CDS, in logs. The model is specified in equaIon(11). Countries are: Austria, Belgium, Germany, Spain, France, UK, Italy, theNetherlands, Portugal, Sweden and Greece. Indirect exposures to Greek debt areobtained by inverIng the matrix of cross‐border bilateral linkages and logged. Seealso Note of Table 5.
Table 8: Financial Linkages - Exposure to other PIIGS
Bootstrapped Confidence Intervals - d1
Note: Dependent variable vector of CDS, in logs. The model is specified in equaIon(11). Countries are: Austria, Belgium, Germany, Spain, France, UK, Italy, theNetherlands, Portugal, Sweden and Greece. Exposure to other PIIGS (in logs) is thesum of a country's exposure to the debt of Italy, Portugal and Spain. See also Noteof Table 5.
Note: Dependent variable vector of CDS, in logs. The model is specified in equaIon (11).Countries are: Austria, Belgium, Germany, Spain, France, Italy, the Netherlands, Portugaland Greece. Aggregate exposure to foreign debt is defined as the sum of the claims oneach foreign country. See also Note of Table 5.
Table 10: Financial Linkages – Restricted Set of Greek Shocks
Bootstrapped Confidence Intervals - d1
Note: Dependent variable vector of CDS, in logs. The model is specified in equaIon(11). Countries are: Austria, Belgium, Germany, Spain, France, UK, Italy, theNetherlands, Portugal, Sweden and Greece. The set of Greek shocks includes 17daily events. See also Note of Table 5.
Transmission Rate through Financial Linkages
57
Date Round Excl. Descrip4on Sign
(mm.dd.yyyy) WSJ Reu FT
1=other countries; 2=descr. Debt; 3= lexis‐nexis; 4=unexp. econ data
10/09/2009* GR Papandreou's new socialist government says Greece's 2009 budget deficit will be 12.7 percent of GDP, more than twice the previously published figure.
+
12/08/2009 GR 4 Fitch Ratings cuts Greek debt to BBB+, the first time in 10 years it has been rated below investment grade. + GR Greece's credit rating is downgraded to the lowest level in the eurozone as fears mount over its deteriorating public
finances. Fitch cut ratings on Greek debt to BBB plus with a negative outlook. First time in 10 years that Greece receives a rating below A grade. Heavy selling of Greek stocks and bonds.
12/09/2009 IE 1 In Ireland, a budget delivers savings of over 4 billion euros. Public service pension age rises to 66 from 65.12/14/2009 GR 3 Papandreou outlines policies to cut budget deficit and to crack down on corruption and public spending. Papandreou also
announces a 10 percent cut on civil servants' allowances, a ban on bonuses for executives at public sector corporations and a 90 percent tax on bonuses for senior bankers.
‐
12/15/2009 GR 3 Greek debt markets tumble again as analysts express skepticism over government's plan to cut public deficit. Trade unions announce a 24-hours strike against reforms.
+
12/16/2009 GR 3 Standard & Poor's cuts Greece's rating by one notch, to BBB-plus from A-minus, saying its austerity programme is unlikely to produce a sustainable reduction in public debt.
+
12/22/2009 GR 4 Moody's cuts Greek debt to A2 from A1 over soaring deficits, the third rating agency to downgrade Greece. +
01/11/2010 GR 3 IMF announces it will send a technical mission to Athens. The mission will advise the government on pension reforms, tax policy, tax collection and budgetary control, but will have no role in developing or vetting on the government's fiscal consolidation plan.
‐
01/13/2010 GR GR is condemned by the European Commission for falsifying data on its public finances. The Commission said figures from Greece were so unreliable that its budget deficit and public debt might be even higher than the government had claimed last October. At that time, the Government estimated that its 2009 deficit would be 12.5 percent of GDP, above April estimates (3.7 percent). It revised 2008 deficit to 7.5 percent from 5 percent.
+
01/14/2010 GR 3 Greece unveils a stability programme, saying it will aim to cut its deficit to 2.8 percent of GDP by 2012. ‐GR Greece announced an ambitious three-year plan to curb its runaway budget deficit. The plan calls for the budget deficit to
be cut from 12.7 percent to 2.8 percent of GDP by the end of 2012. 01/15/2010 GR 2 Investors flocked to buy the first issue of Greek government bonds of the year. Yield spreads with German bonds
narrowed down.01/29/2010 ES 1 Spain announces a plan to save 50 billion euros, including government spending cuts totaling 4 percent of GDP. Public
sector pay is to be cut 4 percent.02/11/2010 GR Leaders of countries in the eurozone promised "determined and co-ordinated action if needed to safeguard stability" if
Greece slashed its budget deficit. ‐
02/25/2010 GR 3 Moody's warned of a downgrade on Greek government bonds. +
03/03/2010 GR The Greek government announces a new austerity plan that will yield €4.8 billion in savings. The government decides to move ahead with steep cuts in civil-service salaries and entitlements, and to to raise Greece's sales tax by two percentage points.
‐
03/04/2010 GR 2 ECB President Jean-Claude Trichet rejects calls for more IMF involvement in Greece.GR Greece raises some cash with a new bond issue. The five-year bond was three times oversubscribed, with $20.5 billion in
offers received, a Finance Ministry statement said. The ministry says, the high level of offers shows that despite the extremely difficult circumstances, investor confidence in the Greek economy remains strong.
GR Greece sold 5bn euros in 10-year bonds and received orders for three times that amount. However, the interest rate the country has been forced to pay to attract investors is one of the highest Greece has paid for a 10-year bonds since 2001.
03/05/2010 GR A package of public sector pay cuts and tax increases is passed in Greece to save an extra 4.8 billion euros. State-funded pensions are frozen.
‐
GR German Chancellor Angela Merkel meets with Greek Prime Minister George Papandreou. Ms. Merkel avoids giving debt-plagued Greece a commitment of financial assistance.
03/08/2010 (03/07/2010)
GR 1 Greek Prime Minister George Papandreou meets with French President Nicolas Sarkozy. Mr. Sarkozy says a number of EU countries are preparing a support package for Greece, even though he doesn't believe the Greek government will need financial help.
03/08/2010 PT 1 Portugal's government announces new budget cuts, including a ramped-up privatization plan, caps on public-sector wages and tax increases on high incomes.
03/09/2010 GR 2 Mr. Papandreou meets with President Barack Obama and discusses a European proposal to crack down on financial-market speculation. Papandreou says Mr. Obama's response was "very positive," but that Greece has not asked the U.S. for financial help.
03/11/2010 GR An estimated 50,000 people take to the streets to protest the government's austerity plans. Flights were grounded and trains suspended amid a nationwide general strike.
+
03/16/2010 GR Greece avoids a downgrade rating by Standard & Poor's Ratings Services. S&P said the Greek government's plans to reduce its deficit supports the nation's current triple-B-plus long-term credit rating.
‐
03/18/2010 GR 4 Mr. Papandreou asks EU leaders to agree to a package of standby loans. Mr. Papandreou says he will keep Greece's aid option open, but would prefer help from the European Union to a bailout by the IMF.
+
03/22/2010 ES 1 Spanish Finance Minister Elena Salgado reaches a broad agreement on cost-savings measures with the finance chiefs of Spain's powerful regional governments. The government plans to narrow the budget deficit to 3% of gross domestic product in 2013, in line with EU requirements.
03/24/2010 PT 1 Fitch Ratings lowers Portugal's sovereign credit rating by one notch to double-A-minus and warns of further cuts unless the government changes its fiscal course.
03/25/2010 GR 3 Euro zone leaders and the IMF agree to create a joint financial safety net to help Greece. ‐GR Mr. Trichet says the ECB will continue to accept bonds with ratings as low as triple-B-minus as collateral next year,
although it won't lend as much against lower-rated paper as against the ultra-safe triple-A-rated bonds like Germany'sGR Leaders of the 16-nation euro zone back a deal under which they and the International Monetary
04/06/2010 GR 2 Greek government bond yields jump to 7.1% and the cost of insuring Greek government debt rockets, as market concerns accumulate over domestic capital flight and the country's ability to fund its budget deficit without aid from the IMF.
+
04/09/2010 GR 3 Fitch cuts it rating for Greece by two notches to the lowest investment-grade rating, to triple-B-minus from triple-B-plus, and says the outlook remains negative.
+
04/12/2010 (04/11/2010)
GR Euro zone finance ministers approve a 30 billion euro aid mechanism for Greece. ‐
GR Finance ministers from the 16-nation euro zone agree that Greece can borrow up to €30 billion ($40 billion) by taking three-year loans from fellow members of the currency bloc this year at an interest rate of close to 5%.
04/12/2010 GR Eurozone members commit to provide up to 30bn euros in loans to Greece over the next year. The funds would be supplemented by money from the IMF that could yield an additional 15bn euros. The rates charged to Athens would be about 5 percent for a three-year fixed loan.
‐
Table A1: Financially Relevant Information Shocks - All Countries
Source / Country
Date Round Excl. Descrip4on SignSource / Country04/13/2010 GR 2 Greece sold 1.56bn euros in 6-month and 1-year debt, more than the 1.2bn expected.04/20/2010 GR Greek unemployment jumps to a six-year peak of 11.3 percent in January. Interest rates on 10-year Greek bonds jump
36.2bp, taking the spread over German bonds to 473bp.+
04/22/2010 GR Eurostat says Greece's 2009 budget deficit was 13.6 percent of GDP, not the 12.7 percent it had reported. The next day Papandreou asks for activation of EU/IMF aid.
+
GR Eurostat said Greece's budget deficit reached 13.6 percent of GDP last year, up from previous Eurostat estimates of 12.9 percent. The news came as thousands of Greek civil servants staged a 24-hour strike and a march through central Athens on Thursday in protest against planned reforms of the state-funded pension system due to reach parliament next month.
GR The European Union's official statistics agency says the Greek budget deficit in 2009 was wider than the government had estimated, and adds that it has reservations about the accuracy of Greek budget data that may lead to further upward revisions. Eurostat said the Greek government's budget deficit was 13.6% of gross domestic product last year. The Greek government had estimated the deficit was 12.7% of GDP in 2009.
GR Moody's cut its rating on Greece by one notch to A3, its second downgrade this year. Greece's 10-year bonds reached highs of 8.8 percent and its two-year bonds reached 10.1 percent -the highest since 1998.
GR Moody's lowers Greece's government bond rating to A3 from A2 and says further downgrades are possible.04/23/2010 GR 4 Mr. Papandreou says "the time has come" for Greece to request aid from the euro zone and IMF, following months of
turmoil. He describes the bailout package as "a necessity. It is an extreme necessity, it is a national necessity." ‐
GR Greece will ask its eurozone partners to activate a 30bn euros rescue package following a week of intense pressure on financial markets. Yield on Greek long-term government bonds pulled back somewhat but remained close to the elevated levels hit during the previous sessions. The 10-year note was yielding 8.65 percent, down 27 bp. But the two-year yield rose 40bp to 10.23 percent.
04/26/2010 GR 2 Greek bond yields jumped to unprecedented levels as market fears over the rescue package rose. Wolfgang Schäuble, Germany's finance minister, issued an urgent appeal to his country's lawmakers in Berlin to back a eurozone loan to Greece as an essential move to defend the stability of the euro. There were also signs that the Greek crisis was spreading to other peripheral eurozone economies, particularly Portugal, which saw its 10-year bond yields jump 20bp to 5.13 percent - a fresh record high since it joined the euro.
04/27/2010 GR 1 Standard & Poor's downgraded Greek's credit rating to junk status as the country's debt crisis heightened dramatically. Greece's deteriorating public finances and economic outlook was behind the decision to reduce the country's long-term ratings by three notches to BB plus. Greece's leading commercial banks also saw their credit ratings lowered to junk, prompting a sell-off in Athens of stocks and bonds for a second day in a row.
GR Standard & Poor's downgrades Greek government debt to junk status. The next day it downgrades Spain's debt because of poor growth prospects.
PT Portugal's long-term credit ratings were reduced by two notches to A minus, reflecting the country's weakening public finances.
PT S&P cuts Portugal's rating by two notches to A-minus, saying Portuguese finances were structurally weak and the economy uncompetitive.
GR Standard & Poor's cuts its ratings on Greece into junk territory, saying the government's policy options are narrowing because of weak economic growth prospects.
PT Standard & Poor's cuts its rating on Portugal by two notches, to A-, amid mounting concerns about the country's ability to deal with its debts. S&P said the move reflects "the amplified risks Portugal faces."
04/28/2010 ES 1 Standard and Poor's downgrades Spain's longterm credit-rating to double-A with a negative outlook.GR The fallout from the downgrading of Greek debt led to a volatile day on the markets. At one point the 10-year yield
reached 12.5 percent, before later falling 57bp at 9.97 before rising again. The Greek regulator banned short selling in shares on the Athens bourse until June 28 after investors ditched Greek assets a day earlier. And German parliamentarians claimed Greece will need between 100-120bl euros over the next three years. The current proposed IMF/eurozone rescue package is worth 45bn euros.
ES In sign the crisis is spreading across the eurozone, Standard and Poor's downgraded Spain's credit rating to AA.04/29/2010 GR 1 The European Commission said an emergency multi-annual loan programme for Greece from its eurozone partners and the
IMF would be concluded in the next few days. Greece's 15 eurozone partners have promised to lend Athens 30bn euros in the first year of a rescue package, to be topped up with at least 15bn euros from the IMF. And Germany's opposition Social Democrats gave the green light for an emergency parliamentary process to approve a multi-billion euro loan for Greece, clearing the way for swift approval.
IT Italy successfully launched two bond offerings, easing fears that of contagion spreading throughout the eurozone.GR Greece agrees with the International Monetary Fund and the European Union to take additional austerity measures
expected to yield "around €23 billion" ($30 billion) as a precondition for financial assistance, a Greek official familiar with the talks on aid said.
04/30/2010 GR Reports indicate that Greece has agreed the outline of a 24bn euros austerity package, including a three-year wage freeze for public sectors workers, in return for a multibillion euro loan from the eurozone and the IMF. Negotiations with officials from the IMF, the European Commission and the ECB are due to be completed at the weekend and the measures will be presented for approval by the Greek parliament next week. Approval to the rescue plan is expected at a summit of European heads of government, due to be held in Brussels on May 10.
‐
05/03/2010 (05/02/2010)
GR Prime Minister George Papandreou says Greece has reached a deal with the EU and IMF opening the door to a bailout in return for extra savings of 30 billion euros over three years. Athens will get loans worth 110 billion euros in installments conditional on reforms over three years in the first rescue of a member of the 16-nation euro zone.
‐
GR Eurozone finance ministers on Sunday approve a 110bn package of emergency loans aimed at averting a sovereign default by Greece and preventing a confidence crisis spreading to countries such as Spain and Portugal. Eurozone countries are to contribute 80bn of the total. The European finance ministers meeting followed Greece's agreement to enhanced austerity conditions in return for the loans. Under these, the country is expected to reduce its budget deficit from 13.6 percent of GDP to below 3 percent by 2014, and to stabilise the public debt at about 140 percent of GDP, even though it is expected to peak at almost 150 percent of national income.
GR Greece reaches a historic deal with other euro-zone countries and the IMF for a huge bailout, a first for one of the 16 countries using the euro. The deal is expected to total more than 100 billion euros ($133.14 billion) over three years, though only the EU has set out its figure -- 30 billion euros, for the first year.
05/03/2010 GR The ECB suspends the minimum credit rating required for Greek government-backed assets used in its liquidity-providing operations, removing the risk of Greek government bonds being excluded if ratings agencies turn against the rescue programme. The euro fell 0.9 percent against the US dollar, although bond markets across Europe were stable with yields on two-year Greek debt dropping below 10 percent for the first time in more than a week. Speculators are increasingly betting that the eurozone crisis could escalated as short positions against the euro rose to a fresh record.
‐
05/04/2010 GR Greek civil servants stage a two-day strike to protest the new austerity measures. +
05/05/2010 PT 1 The euro tumbles to a 14-month low against the dollar, as news that Moody's Investors Service placed Portugal under review for a downgrade accentuated euro-zone sovereign debt fears.
GR Three people die in violent street protests in Athens during a general strike against austerity by Greek labor unions.GR Violent protests erupt in Athens against the cuts required as part of the austerity package. Three people were killed after
they were trapped in a bank branch set ablaze by a petrol bomb. In spite of the protests, Papandreou reiterated his commitment to implementing an austerity package agreed with the European Union and the IMF.
05/06/2010 ES 1 Worries about the debt crisis saw markets all around the world fall, with the US dow Jones recording its biggest ever intraday drop in point terms before recovering most of its losses by the closing bell. Though the Greek parliament formally approved the tough austerity package agreed with the eurozone and the IMF, market fears over the spread over the Greek debt crisis to other peripheral eurozone countries continued to place pressure in share prices and government borrowing costs in Spain and Portugal. Trichet though said that Spain and Portugal are not facing fiscal difficulties as serious as those of Greece.
Date Round Excl. Descrip4on SignSource / CountryPT Worries about the debt crisis saw markets all around the world fall, with the US dow Jones recording its biggest ever
intraday drop in point terms before recovering most of its losses by the closing bell. Though the Greek parliament formally approved the tough austerity package agreed with the eurozone and the IMF, market fears over the spread over the Greek debt crisis to other peripheral eurozone countries continued to place pressure in share prices and government borrowing costs in Spain and Portugal. Trichet though said that Spain and Portugal are not facing fiscal difficulties as serious as those of Greece.
05/07/2010 GR 4 Germany's Lower House of Parliament passes the Greek bailout bill, granting about $28.3 billion in loans. ‐GR The U.S. lobbies EU leaders to act faster amid a selloff in the euro. EU leaders meeting in Brussels approve aid for Greece,
but soaring Portuguese bond yields force leaders to also debate a wider bailout fund for the euro zone.05/10/2010 . 1 Global policymakers install an emergency financial safety net for the euro zone worth 750 billion euros to calm financial
markets and avert contagion from the Greek crisis. The package consists of 440 billion euros in guarantees from euro zone states, plus 60 billion euros in a European debt instrument. The IMF is to contribute 250 billion euros.
. Markets rallied after the launch of a 750bn dollars economic package from the ECB and IMF, which includes government-backed loan guarantees and a commitment to buy European sovereign bonds. The stabilisation scheme agreed by EU finance ministers and top officials consists of government-backed loan guarantees and bilateral loans worth up to 440bn euros provided by eurozone members; a further 60bn euros supported by all EU members through expansion of an existing balance of payments facility; and up to 250bn euros provided by the IMF. The 750bn euros package is in addition to the 110bn euros IMF and EU rescue plan approved for Greece on Friday and Agreed by the IMF board on Sunday.
GR The EU agrees on a €750 billion bailout plan that would be available to rescue euro-zone economies that get into financial trouble. The plan would consist of €440 billion of loans from euro-zone governments, €60 billion from an EU emergency fund and €250 billion from the IMF.
05/12/2010 ES 1 Under pressure from the EU and financial markets to accelerate his government's deficit-reduction plans, Prime Minister Jose Luis Rodriguez Zapatero announces Spain will cut public-sector wages by 5% this year and freeze them next year. "We need to shore up confidence in our economy," Mr. Zapatero tells parliament.
05/13/2010 PT 1 Portugal's prime minister and opposition leader draw up steps to slash the deficit, including public sector pay cuts.PT The Portuguese government approves a series of measures, including tax increases and salary reductions for politicians
and other public employees, with an intention to speed up the reduction of the country's budget deficit, says Prime Minister Jose Socrates.
05/18/2010 DE 1 Germany announces a unilateral ban on "naked" short selling of shares in its top 10 financial institutions, euro zone government bonds and related credit default swaps.
05/19/2010 ES 1 Spain will raise taxes for high-income earners to help chip away at the country's outsized deficit. Prime Minister Zapatero did not give details of his tax plans, but says an increase would be of a "limited" nature and not affect the middle class.
05/20/2010 GR Thousands of Greek workers protest in Athens against cuts in wages and pensions. The 24-hour general strike called by ADEBY and GSEE, the country's two largest unions, has shut down state schools, public transport and government offices. Parliament is set to approve an overhaul of the state pension system this month under the terms of the bail-out. The legislation includes proposal to raise the retirement age to 65 for both men and women from 2013 and reduce pension payments.
+
05/21/2010 ES 1 Spain's central bank moves to take over Roman Catholic Church-controlled savings bank CajaSur, a big step forward in its efforts to clean up the country's ailing mutually owned banks.
05/25/2010 IT 1 Italy approves a 25 billion euro austerity package with the aim of cutting the deficit to 2.7 percent of GDP in 2012 from 5.3 percent in 2009.
05/27/2010 ES 1 Spain's government wins parliamentary approval for its 15 billion euro austerity package by a single vote.05/28/2010 ES 1 Fitch cuts Spain's credit rating in response to record household and corporate debt and mounting public debt.05/31/2010 (05/29/2010)
ES 1 Fitch Ratings removes Spain's triple-A credit rating, dropping it by a notch to double-A-plus, on expectations that the moves to cut the nation's debt will slow its economic growth.
06/07/2010 DE 1 German Chancellor Angela Merkel's coalition agrees a package of budget cuts and taxes to bring Germany's deficit within EU limits by 2013 and set an example to Europe. The plan aims to deliver 80 billion euros of savings over three years.
06/08/2010 ES 1 Spain's unions say 75 percent of public sector workers stay at home in a protest against austerity plans. Government says real number of strikers is far smaller.
06/09/2010 NL 1 Liberals win most votes in Dutch election but consensus on bringing public finances under control will be hard. Deficit set to reach 6.6 percent of GDP in 2010.
PT 1 Portuguese parliament approves latest austerity package.06/14/2010 GR 3 Moody's downgraded Greek debt by four notches to junk. The debt is already rated junk by other agencies. The Greek
government said that Moody's downgrade did not reflect Greece's progress over the past months in tackling its problems. "The latest figures for the Greek budget - with the deficit for the first five months of the year down by 40 percent compared to 2009 - show that the programmed that Greece has agreed on with the European Commission, the ECB and the IMF is on track, a development recognised by all three institutions", it said in a statement.
+
GR Moody's cuts Greece's credit rating four notches to Ba1 or junk status due to risks to an EU/IMF bailout package, highlighting persisting doubts in coming out of a debt crisis.
GR Moody's Investors Service cuts its rating on Greece into junk territory, saying there is 'considerable' uncertainty surrounding the timing and impact of support measures on the country's economic growth.
06/15/2010 . 3 The ECB says it will apply a 5 percent extra charge to Greek government bonds used as collateral in lending operations following a downgrade.
+
06/16/2010 FR 1 France announces a reform of its pension system raising the retirement age gradually to 62 in 2018 from 60.06/17/2010 ES 1 EU leaders at a Brussels summit agree to publish the results of bank stress tests in late July. Spain's threat to publish its
own stress-test results forces Germany and others to drop their objections to publication.06/22/2010 ES 1 Spain's parliament ratifies labour reforms to restore economic growth by easing the cost of hiring and firing.
06/24/2010 GR 2 The cost of protecting government debt against default in Greece hits a record high. It costs 958,000 euros to insure 10 million euros-worth of government bonds.
GR Greece bond yields over 10.44 percent, partly due to worries over next week's expiry of the ECB's long-term refinancing operation. The cost to insure against default also jumped to the highest level since May 10.
06/25/2010 IT 1 The CGIL, Italy's biggest union with 6 million members, holds rallies in Rome, Milan and other cities to force the government to redraft a 25 billion euro austerity package.
06/28/2010 (06/27/2010)
GR 2 Greece says it is preparing for a return to the financial markets in July. It will attempt to raise about 4 bn euros in its first borrowing attempt since May's bail-out by the EU and the IMF.
06/29/2010 GR 3 About 10,000 people take part in marches across Athens during a nationwide strike against austerity measures. + GR Greece says its debt reached 133 percent of GDP in 2010.
07/07/2010 DE 1 Germany agrees on a four-year, 80 billion euro ($100 billion) austerity plan, committing the country to cutting its budget deficit and shoring up Chancellor Angela Merkel's centre-right coalition.
07/08/2010 GR 3 Greece's main private and public sector unions strike for 24 hours against sweeping pension reform. Greek lawmakers vote in favour of the pension reform.
+
07/13/2010 GR 1 Greece makes a successful return to capital markets, raising 1.62bn euros in six-month treasury bills in an auction that attracted both domestic and foreign investors. Greece is paying interest of about 5 percent on the 110bn euro, three-year bail-out package approved in April by the EU and IMF The yield on the issue was marginally higher than the 4.55 percent paid by the Greeks in April for six-month paper shortly before the bail-out, indicating that confidence remains fragile
PT Moody's Investors Service downgrades Portugal's government-bond rating to A1 from Aa2, with a stable outlook, pointing to the country's weak fiscal position and low growth prospects.
07/19/2010 IE 1 Moody's Investor Services cut Irelands credit rating to Aa2 from Aa1. Moody cites a rising debt burden, a weak growth outlook and the high cost of rebuilding a shattered banking system.
07/23/2010 . 1 European banks are given "stress tests" on their ability to deal with a debt crisis. Of the 91 European banks tested, seven fail and another 17 barely pass. July 13 - Moody's cuts Portugal's debt rating by two notches to A1, citing rising debt and weak growth prospects, and says the country may need more austerity measures in its 2011 budget.
Date Round Excl. Descrip4on SignSource / Country. Europe took a further step towards restoring confidence in its banking system on Friday as it published the results of
stress tests into the region's leading financial institutions, showing that only seven of 91 banks failed to meet its capital requirements.
ES Europe releases bank stress test results. The stress tests, intended to restore trust in Europe's banking system, showed seven of the 91 banks -- five from Spain, one from Germany and one from Greece -- would need to raise new capital to fortify their finances and weather potential tough conditions.
07/27/2010 GR 2 Greece is determined to show it can outperform tough fiscal targets set by the EU and IMF, said Papaconstantinou, finance minister. In an interview with the FT, MR. Papaconstantinous said in the first half of this year the budget deficit had been slashed by 45 percent after deep cuts in public consumption and capital investment.
07/28/2010 GR Greece orders striking truck drivers to go back to work, the third day of their nationwide stoppage, as fuel shortages start to hurt the country.
+
07/29/2010 IT 1 Italy's 25 billion euro ($32.5 billion) package of austerity measures is approved in the lower house, clearing its final parliamentary hurdle.
. The European Commission's economic sentiment index rises to a 28-month high in July, buoyed by figures from Germany.08/05/2010 GR 3 Experts from the EU, IMF and the ECB say Greece is delivering fiscal and structural reforms on time but must crack down
harder on tax evasion. The monitoring team made clear that Greece would qualify for a second loan tranche of 9bn from a 110 bn rescue package on the basis of progress made. But the experts said Greece would need a sustained period of strong policy implementation before it could resume borrowing on the international capital markets, perhaps in 2011.
‐
. EU, IMF and ECB officials applaud Greek efforts to exit its debt crisis, endorsing a fresh 9 billion euro payment from the EU/IMF bailout scheme, but urges reforms in energy, banking and the public sector.
08/11/2010 SK 1 Slovakia, the euro zone's poorest member rules out providing 816 million euros towards a 110 billion euro Greek bailout fund. Slovakia will contribute to the wider safety net.
08/12/2010 GR 4 New statistics suggest Greek sank deeper into recession in the second quarter, with Elstat, the statistic service, estimating the economy had shrunk 3.5. percent in the three months to the end of June from the same period last year. There was also sharp rise in the year-on-year jobless rate from 8.5. percent to 12.5 percent in May a record increase reflecting worsening conditions in the real economy, according to analysts.
+
08/19/2010 GR 4 The European Commission clears the second tranche of the bail-out facility, meaning Greece is in line to receive a further 9bn euros in eurozone loans. Olli Rehn, Commissioner for Economics and monetary affairs, praised the measures taken by Mr. Papandreous government in recent months but warned of possible problems ahead, with immediate challenges in safeguarding liquidity and stability in the banking sector.
‐
08/24/2010 IE 1 Standard & Poor's cuts Ireland's long-term rating by one notch to 'AA-', and assigns the country a negative outlook, in a move criticised by the country's debt management agency. Moody's cut its rating to Aa2 in July.
IE Standard & Poor's Ratings Services trims its rating on Ireland by one notch, saying the project fiscal to the Irish government of supporting the financial sector has increased significantly above prior estimates. The rating was lowered to double-A-minus, three notches under triple-A.
09/01/2010 . 1 An IMF report suggests that markets are overestimating the risk of default, arguing that debt default by an advanced economy such as Greece is unnecessary, undesirable and unlikely.
09/07/2010 GR 3 The National Bank of Greece, the country's largest lender, announces it will go ahead with a larger-than-expected €2.8 billion capital raising. The move is designed to boost capital adequacy given the current recessionary environment.
+
09/08/2010 GR Greek second-quarter gross domestic product is revised down to show a 1.8% fall from the first three months of the year compared with the initial estimate of a 1.5% decline.
+
09/15/2010 GR 2 Greece's finance minister strongly rejects the idea that Athens will be forced to restructure its debts, saying that a default would break the eurozone. On a two-day visit to London, Paris and Frankfurt to convince investors that Athens has turned a corner in its year-long economic crisis, Papaconstantinou told the FT that a Greek default would spark selling in other so-called peripheral bond markets of Portugal and Ireland.
09/30/2010 ES 1 Rating agency Moody's Investors Service Inc. downgrades Spain's credit rating by one notch to Aa1, citing the country's weak growth prospects and the challenge this presents for fiscal consolidation.
10/04/2010 GR Greece unveils an ambitious draft budget aiming to slash its budget deficit to 7 percent of GDP next year, deeper than the 7.6 percent goal agreed with the Ecm, the ECB and the IMF and aimed at securing a return to the bond market at some point next year. The 2011 draft budget sees the general government budget deficit drop to 16.28 bn in 2011 from a forecast 18.5 bn this year on higher tax revenues and spending cuts with real GDP projected to contract by 2.6 percent. Additionally, Greek 10-year bond yields fell 15 basis points to 9.975 percent following comments on Sunday by Wen Jiabao, China premier, on Bejing interest in buying Greek bonds.
‐
10/06/2010 IE 1 Fitch Ratings cuts the Irish government's credit rating and says it may do so again if the economy fails to recover and political support for budget cuts weakens. Fitch cut the government's rating to single-A-plus from double-A-minus and said the outlook is negative.
10/12/2010 GR 2 Growing confidence in Greece is underlined by the success of a short-term debt auction where the cost of borrowing fell by more than a quarter of a point for six-month money compared with the previous sale last month. The Greek 10-year bond prices have jumped 10 percent, with yields falling 13 percent, since June 30. It has comfortably outperformed the rest of the eurozone in price, yield and total returns. It is the first time the Greek bond markets have recorder positive total returns and seen prices rise over a three-month period since the eurozone debt crisis started last Sep.
10/26/2010 IE 1 Ireland's government says that budget cuts of €15 billion are needed over the next four years, double the amount previously expected, in order to cut the country's budget deficit to 3% of gross domestic product by 2014 as previously agreed with the E.U.
11/05/2010 GR 2 A three-month success period ends with a surge in bond yields, renewing concern about political stability in Athens ahead of Sunday local government elections. Yields on 10-year bonds have spiked to 11.34 percent, approaching the historic highs of last May.
11/12/2010 PT 1 A clarification by finance ministers from Germany, France, Italy, Spain and the U.K. at the G-20 Summit says that bonds issued before mid-2013 would be unaffected by changes to the EU's bailout program.
11/22/2010 (11/21/2010)
IE 1 The Irish government says it has applied for tens of billions of euros in aid from the European Union and the International Monetary Fund. The EU and the IMF indicate the money will be forthcoming, pending negotiations on the steps to restructure Ireland's debts and cut its budget deficit.
11/22/2010 IE 1 Prime Minister Brian Cowen pledges to call an election next year if a crucial budget package is approved. Mr. Cowen's concession on early elections was triggered by moves earlier that undercut the stability of the shaky coalition led by his Fianna Fail party.
11/24/2010 IE 1 Ireland's government outlines €15 billion ($20.55 billion) in spending cuts and tax hikes over four years that are intended to reduce the budget deficit to 9.1% of gross domestic product in 2011.
11/29/2010 (11/28/2010)
IE 1 Europe seals a €67.5 billion bailout of Ireland and for the first time crafts a blueprint for rescues from 2013 on that could have private-sector creditors bearing some of the cost.
* This news appears in the original Pmeline with date 11/05/2009. We modify the date based on informaPon from the Lexis‐Nexis database.
References
Acharya, Viral V., Itamar Drechsler and Philipp Schnabl 2011: ”A Pyrrhic Victory? Bank
bailouts and Sovereign Default Risk” NBER WP 17136
Arellano, Cristina and Yan Bai 2012: “Linkages Across Sovereign Debt Markets”, Work-
ing Paper
Arezki, Rabah, Bertrand Candelon and Amadou Sy 2011: ”Sovereign Rating News and
Financial Markets Spillovers: Evidence from the European Debt Crisis” CESIFO WP 3411
Baig, Taimur and Ilan Goldfajn 1999: “Financial Market Contagion in the Asian Crisis,”
IMF Staff Papers 46, 167-195.
Bank for International Settlement 2006: ”Guidelines to the international consolidated
banking statistics,” www.bis.org
Bank for International Settlement 2011: ”OTC derivatives market activity in the second
half of 2010,” www.bis.org
Baldwin, Richard and Daniel Gros 2010: ”The euro in crisis – What to do?” in ”Com-
pleting the Eurozone Rescue: What More Needs to be Done?” eds: Richard Baldwin,
Daniel Gros and Luc Laeven
Balteanu, Irina and Aitor Erce 2011: “Bank Crises and Sovereign Defaults: Exploring
the Links,” Working Paper, Bank of Spain.
Barkleys Capital: ”Standard Corporate CDS Handbook. Ongoing Evolution in the
CDS Market,” February 2010
Blundell-Wignall, A. and P. Slovik 2010: “The EU Stress Test and Sovereign Debt
Exposures”, OECD Working Papers on Finance, Insurance and Private Pensions, No. 4,