83
B O N N E V I L L E P O W E R A D M I N I S T R A T I O N 1 2010 Integrated Program Review Transmission Strategy & Expense IPR Workshop May 18, 2010 All day 9-12 and 1-4

B O N N E V I L L E P O W E R A D M I N I S T R A T I O N
12010 Integrated Program Review
Transmission Strategy & Expense IPRWorkshop
May 18, 2010All day 9-12 and 1-4

2010 Integrated Program Review 2
B O N N E V I L L E P O W E R A D M I N I S T R A T I O N
Table of ContentsTopic Slide # Presenter
9:00 Schedule and Overview 2-15 Robin Furrer• May 10th follow-up items- driver impact on expense program (p 4-13), wind program costs (p 61-63)• Expense Forecast
9:30 Benchmarking 16-25 Robin Furrer• FERC Form 1• Transmission Benchmarking Community Survey• Staffing Benchmarking
10:15 System Operations Expense Program 26-30 Randi Thomas
Scheduling, Marketing, and Expense Non-BBL Acquisition and Ancillary Services Programs 31-41 Cathy Ehli
Business Support Expense Program 42-46 John QuinataMaintenance Expense Program 47-55 Robin Furrer
Engineering Expense Program 56-60 Larry Bekkedahl
Wind Program Costs 61-63 Randi Thomas, Cathy Ehli
12:00 Lunch
1:00 FY 12 and 13 Cost Reduction Scenarios 64-79 By Program Area
3:45 Next Steps- May 10th follow-up items- Rate Case vs Actuals 2007- 2009 (to be posted), Staffing Workshop- June Robin Furrer

2010 Integrated Program Review 3
B O N N E V I L L E P O W E R A D M I N I S T R A T I O N
Transmission Overview for FY 2012-2013
Why are operating costs exceeding inflation?Taking care of existing infrastructureIncreasing complexity in mandatory complianceIntegrating renewables on the grid resulting in operational complexities
What trends are offsetting operating costs?Lower than expected debt service Higher than projected revenues Relatively stable reserves Efficiencies from business automation and process improvementsFavorable short-term commodity pricing New strategic sourcing agreements
Although Transmission operating costs are increasing at a faster rate thaninflation, revenues are also accelerating due to the success of 2008 and2009 NOS. With revenues increasing, rate pressures are minimized.

2010 Integrated Program Review 4
B O N N E V I L L E P O W E R A D M I N I S T R A T I O N
Key Program Drivers
Drivers from last 2010-2011 IPR:
Taking care of aging infrastructure and building newIncreasing complexity in mandatory complianceAutomation - regulatory and business requirementsOperational complexities Introduced by high levels of renewables on the GridTechnology innovation investmentsEconomic uncertainties
New drivers for 2012-2013 IPR:Increasing emphasis on cyber and physical security Accomplishing increasing Program Levels in the most effective wayClimate change- equipment maintenance, upgrade, and replacement and SF6
Drivers shown on pages 5-9 are identified from an incremental expense impact (FY11 rate case to FY11 IPR Program Levels) with high ($5-10M), medium ($3-5M), and low ($1-3M) designations. Levels do not reflect capital.

2010 Integrated Program Review 5
B O N N E V I L L E P O W E R A D M I N I S T R A T I O N
Driver #1 - Taking care of existing infrastructure and building newHigh

2010 Integrated Program Review 6
B O N N E V I L L E P O W E R A D M I N I S T R A T I O N
Driver #2 - Increasing complexity in mandatory compliance
Over 110 mandatory reliability standards • Evolving to cover a wider range of contingencies than power systems were originally
planned to meet. • Some standards, in particular those that are considered top priorities by NERC and
FERC, are increasing in scope and complexity.• Subject Matter Experts are more involved in the development process of standards to
ensure results driven standards are written with the emphasis placed on improving reliability
Environmental stewardship: Clean Water Act (CWA) , Toxic Substances Control Act (TSCA)
• EPA increasing enforcement on compliance with the Clean Water Act • Executive Order 13541: Reduce and minimize the quantity of toxic and hazardous
chemicals and materials acquired, used, and disposed by FY 2015 • EPA leadership indicating desire to sunset the PCB use authorization and phase out
equipment that uses or contains PCBs
FERC Order 890 Implementation and Tariff Compliance• Ongoing open season obligations to pursue further expansion of infrastructure need
High

2010 Integrated Program Review 7
B O N N E V I L L E P O W E R A D M I N I S T R A T I O N
Driver #3 - Automation - Regulatory and Business Requirements
There are many information technology systems underway, primarily in operationsand the marketing & scheduling organizations.
OASIS functionality - Implement FERC requirements and Efficiency improvementsScheduling functionality - E-Tag to support reliability, new products and customer interfacesNERC reliability standards - Mandated changes in ATC (available transfer capability) methodology.Commercial Business System Reinforcement - Support industry standard OASIS and scheduling functionality Wind integration - System and Process ChangesRODS Replacement - Retirement of legacy platformTransmission Process Improvement (TPIP) - multiple systems ranging from Transmission Asset System (TAS) to Microsoft Project Integration (MSPI) to Work Plan Scheduling System (WPSS).
Low

2010 Integrated Program Review 8
B O N N E V I L L E P O W E R A D M I N I S T R A T I O N
Driver #4 - Operational Complexities of Integrating Renewables
Northwest renewable portfolio standards (RPS) are driving a steep ramp-up in new wind resources
A portion of the renewable generation is being developed for export to other areas of the West and California
Continuing growth is creating operational challenges
Higher penetration of wind resources exacerbates reliability issues, particularly during • Fall and Winter Season High spring run-off (when BPA must spill according to the BiOp),• Low load conditions when BPA is at minimum generation, • Mandatory fish flows, and• During times when certain BiOp requirements are in effect
Medium

2010 Integrated Program Review 9
B O N N E V I L L E P O W E R A D M I N I S T R A T I O N
Driver #5 - Technology Innovation Investments
Technological innovation is instrumental to thesuccess of many industry-wide initiatives:
Integrating efficient renewable generation, Integrating intermittent generation, Enhancing the reliability and efficiency of system operations, Deploying demand response programs, Enabling energy storage devices and Developing distributed generation sources.
“Smart grid” technologies planned include:Western Interconnection Synchrophasor Project (WISP)Northwest Smart Grid Demonstration Project
Low

2010 Integrated Program Review 10
B O N N E V I L L E P O W E R A D M I N I S T R A T I O N
Driver #6 - Economic UncertaintiesLoad dynamics
Deploying demand response programs
Future market price uncertainty
Commodity cost uncertainty (steel, copper, etc.)
Changing labor market (rate of retirement, applicant pool)
Low

2010 Integrated Program Review 11
B O N N E V I L L E P O W E R A D M I N I S T R A T I O N
Driver #7 - Increasing emphasis on cyber and physical security
As standards are evolving and compliance with them becomes more difficult, BPA-T hasstepped up efforts to secure the reliability of its portion of the nation's bulk electric system.
Federal legislation could mandate even tighter compliance requirements for both physically and electronically protecting the grid and grid operations equipment. New technologies requiring secure implementations will be necessary to operate the grid in a smarter, more "green" manner. New standards or interpretations could greatly impact workload
Specific focus areas include:Smart Grid - implementing it in a secure mannerImplementing cyber and physical security requirements at BPA substations (indoor)Implementing physical security requirements at BPA substations (outdoor)Preparing for and implementing changes in the NERC compliance standards: CIP versions 2 and 3Preparing for and implementing the major change in determining how subsystems to the Bulk Electric System are determined, NERC CIP version 4
Low

2010 Integrated Program Review 12
B O N N E V I L L E P O W E R A D M I N I S T R A T I O N
Driver #8 – Accomplishing The Additional Work EffectivelyGiven BPA-T’s internal workforce constraint of $200M (direct $), BPA has developed a contract strategy that will ensure the completion of the sustain and expansion capital programs. The Contract Management Office (CMO) and other contracting strategies provide an increase in capacity to meet the capital program needs. Specific CMO objectives include achieving the increased capital program contracting without increasing employee levels as well as meeting project/program objectives within budget, scope, and schedule.
Capital Resource Strategy
0100200300400500600700800
FY 2011 FY 2012 FY 2013 FY 2014 FY 2015 FY 2016 FY 2017
$M
In-house (BPA + supplemental labor)
CMO (OE + EPC + C/I)
Other contracts
Owner’s Engineer (OE), Engineer, Procure, Construct (EPC), and Contract Administration and Inspection (C/I)
High

2010 Integrated Program Review 13
B O N N E V I L L E P O W E R A D M I N I S T R A T I O N
Driver #9 - Climate change- equipment maintenance, upgrade, replacement, and SF6
The Executive Orders direct BPA to reduce its fossil fuel usage, increase its alternativefuel usage, and report (ultimately decrease) on Green House Gas emissions. Theseactions also support BPA's agency wide strategy map directive of Environmental Stewardship.
Specific initiatives include:Fleet
• Increasing use of alternative fuels, B20, E85 • Purchasing hybrid and electric vehicles • Increasing vehicles with Tier III and Tier IV emissions • Implementing idle reduction technologies to reduce emissions
Field Services• Leaky Equipment Repair: Continue targeting equipment for repair by pairing SF6 tracking
data and the SF6 FLIR camera to locate equipment leaks.• Known emissions (other than leaky equipment): Issue a crew alert outlining proper SF-6
evacuation procedures to avoid venting SF6 to atmosphere during internal inspection.• Unaccounted-for emissions: With the mass-balance method depending heavily on accurate
weighing of the bottles and tight inventory accounting, do the following:– Require monthly SF6 inventory reporting so that inventory discrepancies can be dealt
with in a timely manner.– Utilize accurate, industrial-type scales by all crews. – Use equipment nameplate to estimate the amount of SF6 pulled from equipment and
returned to the warehouse during retirement or during a gas swapCalculate the amount of SF6 put into leaky equipment using the differential-pressure method.
Low

2010 Integrated Program Review 14
B O N N E V I L L E P O W E R A D M I N I S T R A T I O N
Transmission Expense Programs ($M)
211239 261
302 292 316 336 345
0
100
200
300
400
FY07Actual
FY08Actual
FY09Actual
FY10SOY
FY11RateCase
FY11IPR
FY12IPR
FY13IPR
Includes System Ops, Scheduling, Marketing, Business Support, System Maintenance, Non-BBL Ancillary Svcs, and System Engineering Programs

2010 Integrated Program Review 15
B O N N E V I L L E P O W E R A D M I N I S T R A T I O N

2010 Integrated Program Review 16
B O N N E V I L L E P O W E R A D M I N I S T R A T I O N
Transmission Program Benchmarking
In an effort to validate IPR program trends and ensure ourcosts are in line with utility best practices, we have thefollowing benchmarking efforts underway:
FERC Form 1 Total Transmission Costs Data
Transmission Benchmarking Community Survey- 1st Quartile Consulting
Staffing Benchmarking- Navigant
These processes will assess performance, identify best practices, develop and reinforce change efforts, and track long-term progress. Benefits may be seen in improved operational performance, customer satisfaction, and financial performance

2010 Integrated Program Review 17
B O N N E V I L L E P O W E R A D M I N I S T R A T I O N
Approximate annual average increase per year using FY01 as a base year: BPA 7%, Utility 1- 40%, Utility 2- 10%, Utility 3- 16%, Utility 4- 14%, Utility 5- 2%, Utility 6- 8%, Utility 7- 5%, Utility 8- 7%, Utility 9- 3%, Utility 10- 9%. Data from FERC Form 1 Line 91
Transmission Operation Expenses (accumulative % Increase)
-50%
0%
50%
100%
150%
200%
250%
300%
350%
400%
FY-02 FY-03 FY-04 FY-05 FY-06 FY-07 FY-08
Perc
ent (
%)
BPA Utility 1 Utility 2Utility 3 Utility 4 Utility 5Utility 6 Utility 7 Utility 8Utility 9 Utility 10 Combined Utilities Average (w/out BPA)
FERC FORM 1 DATA- GENERAL UTILITY TREND (1 of 2)

2010 Integrated Program Review 18
B O N N E V I L L E P O W E R A D M I N I S T R A T I O N
Approximate Annual Average Increase per year, using FY01 as a base year
BPA- 8% Utility 1- 11% Utility 2- 3% Utility 3- 4% Utility 4- 7% Utility 5- 11 % Utility 6- 12% Utility 7- 9% Utility 8- 11% Utility 9- 9% Utility 10- 16%
Transmission Maintenance Expenses (accumulative % increase)
-100%
-50%
0%
50%
100%
150%
200%
FY-02 FY-03 FY-04 FY-05 FY-06 FY-07 FY-08
Perc
ent %
BPA Utility 1 Utility 2Utility 3 Utility 4 Utility 5Utility 6 Utility 7 Utility 8Utility 9 Utility 10 Combined Utilities Average (w/out BPA)
Ferc Form 1 Line 99
FERC FORM 1 DATA- GENERAL UTILITY TREND (2 of 2)

2010 Integrated Program Review 19
B O N N E V I L L E P O W E R A D M I N I S T R A T I O N
The annual survey will cover all major aspects of Transmission organizations including:
Costs Reliability and customer responseSafety Operations and maintenanceReplacement and new business capital Vegetation managementStaffing & outsourcing
With more than 400 multi-part questions and utility collaboration, data is more detailed and standardized than FERC Form 1 data and is also normalized to BPA system parameters.
Additionally there are three detailed practice areas for this year; these include:• Improving new business performance• Capital investment value management• NERC requirements
2009/2010 participating utilities include: Austin Energy, BG&E, BC Hydro, CenterPoint Energy, CPS Energy, Entergy (multiple operating companies), E.ON U.S. (LG&E and Kentucky Utilities), Exelon (PECO & ComEd) , Hydro One, Hydro-Quebec, Kansas City Power & Light, National Grid (multiple operating companies), Northwestern Energy, Omaha Public Power, Oncor Electric Delivery, PacifiCorp, PEPCO, PG&E, PSE&G, Seattle City Light, Tennessee Valley Authority, We Energies, Westar.
Transmission Benchmarking Community Survey (1 of 2)
2010 Integrated Program Review 20
B O N N E V I L L E P O W E R A D M I N I S T R A T I O N
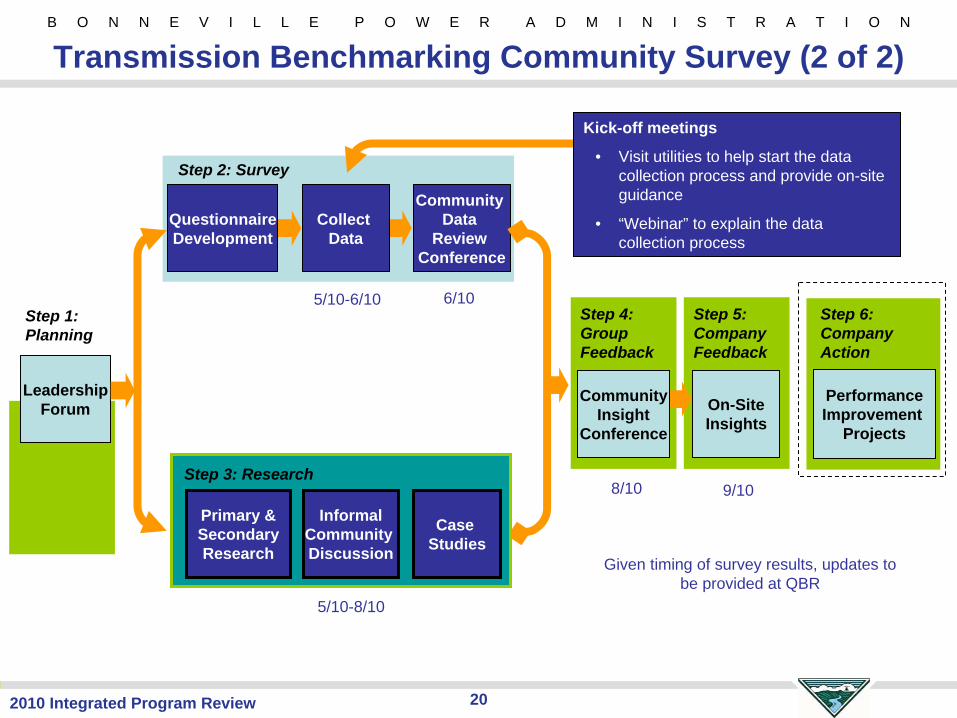
Transmission Benchmarking Community Survey (2 of 2)
Leadership Forum On-Site
Insights
PerformanceImprovement
Projects
Step 1: Planning
Step 5:Company Feedback
Step 4: Group Feedback
Step 6:Company Action
Community Data
Review Conference
Step 2: Survey
Community Insight
Conference
QuestionnaireDevelopment
Collect Data
Kick-off meetings
• Visit utilities to help start the data collection process and provide on-site guidance
• “Webinar” to explain the data collection process
Case Studies
InformalCommunity Discussion
Step 3: Research
Primary & SecondaryResearch
6/105/10-6/10
8/10
5/10-8/10
9/10
Given timing of survey results, updates to be provided at QBR

2010 Integrated Program Review 21
B O N N E V I L L E P O W E R A D M I N I S T R A T I O N
Transmission Staffing Benchmarking
Primary objective was to benchmark staffing in BPA’s Transmission Services and Supply Chainorganizations against staffing at other utilities
Secondary objectives include:Compare actual and benchmark staffing to identify gapsReview unique conditions and work practices at BPA to identify factors that might helpexplain variances between the actual and benchmark staffingCompare use of supplemental staff and contractors at BPA compared to their use at other good performing utilities
Scope of work:Staffing benchmarks included BPA employees, supplemental labor and contracted services Organization analyzed by typical utility work functionsStaffing benchmarks were developed in 41 transmission work functions and 9 Supply Chain work functions

2010 Integrated Program Review 22
B O N N E V I L L E P O W E R A D M I N I S T R A T I O N
Normalizing Data to BPA System Characteristics
Variables (2009 Values And 3-Year Average Changes) Used To Normalize Staffing
Miles of Overhead Transmission Line
Miles of Underground Transmission Cable
Number of Substations
Operating Revenue
Population Served
Power Purchased, Received & Delivered
Substation kVA
Territory Size
Transformer Capacity
Transmission Plant Construction Expenditures
Transmission Plant Capital Budget

2010 Integrated Program Review 23
B O N N E V I L L E P O W E R A D M I N I S T R A T I O N
Transmission Industry Work Functions (1 of 2)
Operations & Maintenance Engineering & Construction ServicesCommunications Services Asset Management AviationFacilities Communications
EngineeringForecasting
Metering & Test Project Management LaboratoryRelay Engineering & Test Service Design Maps, Records & SurveysSecurity Standards Power ContractsStation Maintenance Station Construction Rights & PermitsStation Operations Station Design & Drafting Transmission Sales
SupportTraining Station Engineering Transmission Sales
SystemsTransmission Line Maintenance
Transmission Engineering Transmission Sales
Vegetation & ROW Clearing Transmission Line Construction
Vehicle MaintenanceWork Scheduling

2010 Integrated Program Review 24
B O N N E V I L L E P O W E R A D M I N I S T R A T I O N
Transmission Industry Work Functions (2 of 2)
Planning & System Ops Administration Supply Chain
Grid Planning Administration Clerical
Non-Utility Generator Planning
Business Support Contracts
System Operations Support Clerical EnvironmentalSystem Operations Management Support FacilitiesTransmission Planning Management Management
Materials Management
Purchasing
Transportation
Warehouse

2010 Integrated Program Review 25
B O N N E V I L L E P O W E R A D M I N I S T R A T I O N
STAFFING ANALYSIS
MEDIAN &LOWEST QUARTILE
NAVIGANTDATABASE FUNCTIONAL
BENCHMARKS
SYSTEM
CHARACTERISTICS
COMPANY STAFFINGCONTRACTORS
41 FUNCTIONS
(INDEPENDENT OF
ORGANIZATION STRUCTURE)
MANAGEMENT
INPUT
MEDIAN &LOWEST QUARTILE
BPA ORGANIZATIONBENCHMARKS

B O N N E V I L L E P O W E R A D M I N I S T R A T I O N
262010 Integrated Program Review
Transmission System Operations

2010 Integrated Program Review 27
B O N N E V I L L E P O W E R A D M I N I S T R A T I O N
Transmission System Operations
Transmission System Operations
2009 Actuals 2010 SOY
2011 TR-10 Rate Case 2011 IPR 2012 IPR 2013 IPR
CONTROL CENTER SUPPORT 11,400,420 12,019,884 13,541,472 13,746,000 14,137,179 14,554,493 INFORMATION TECHNOLOGY 4,572,020 7,932,582 6,761,202 6,638,546 6,773,896 6,936,123 POWER SYSTEM DISPATCHING 11,138,057 11,434,178 11,863,794 12,000,000 12,399,838 12,816,798 SUBSTATION OPERATIONS 19,167,809 19,905,262 19,205,532 20,526,054 21,171,176 21,849,019 TECHNICAL OPERATIONS 5,241,705 10,975,048 6,096,454 8,211,600 8,435,963 8,675,531
Total 51,520,012 62,266,954 57,468,455 61,122,200 62,918,052 64,831,964
Program DescriptionSystem Operations contains expenses for power system dispatching, technical operations, substation operations, control center support and Transmission IT costs, including Agency Services costs for IT that are allocated to Transmission Services.
Strategic Objectives- S2 - FCRPS Operations & Expansion, S8 - Climate Change, S6- Renewable Energy
Key Products and OutputsMany of the programs are heavily involved in providing technical expertise in support of NERC mandatory reliability standard and federal cyber security standards.
Power System Dispatching- Provides dispatching, control, and monitoring of the electric operation of the Federal transmission system, including load, frequency and voltage control of Federal generating plants to ensure a safe and reliable system.
• Monitors power system conditions and takes proactive actions to ensure a safe and reliable system. • Manages generation load balance• Responsible for voltage control and control of power system stability tools (e.g. Remedial Action Schemes (RAS))• Manages outages in real-time coordinating switching activity with field crews to support construction, maintenance and repair of facilities • Coordinates BPA operations with interconnected utilities• Determines priorities and provides direction for emergency restoration activities• Provides long and short term outage coordination including responsibility for the NWPP 45 day outage planning process• Provides training to ensure NERC Operator certification requirements are met

2010 Integrated Program Review 28
B O N N E V I L L E P O W E R A D M I N I S T R A T I O N
Transmission System OperationsKey Products and Outputs (continued)
Technical operations• Operational engineering support for real-time operations – completing operational studies in support of dispatch, development
and maintenance of standards, guides and procedures supporting real-time operations (e.g. Dispatching Standing Orders, etc.), coordination and power system analysis support for outage scenarios, engineering oversight for AGC, RAS, under frequency and under voltage load shedding, variable energy resources, e.g. wind, maintaining engineering line ratings to support operational studies.
• Management of power system operational data to support internal analysis, regulatory reporting and external requests• Transmission Emergency Management - planning, maintaining and exercising Transmission Service’s emergency response
capabilities • Transmission Reliability Program – programmatic responsibility for NERC Reliability standards including strategic direction and
policy development; manages and coordinates responses to NERC/WECC standards development process requests, etc.; responsible for external coordination and supports agency reliability objectives.
Control Center Support – Planning, engineering, design, construction and operation and maintenance support for automation used by Power System Dispatchers to operate and control the transmission grid, e.g. energy management systems such as SCADA, AGC, etc. Also includes support for:
• Infrastructure – engine generators/HVAC, access control, network, hardware (e.g. servers, workstations, data acquisition devices), operating and application software.
• Provides for 24X7 monitoring of Control Center automation as well as system wide communications network
Substation Operations• Field Operations – Station inspections, switch orders, switching, first response, emergency response, and outage planning.• Develops policies, procedures and standards for Substations Operations, responsible for maintenance of BPA’s Switching and
Clearance procedures, management of access to energized facilities and maintenance of the Operations Technical Manual. Provides leadership and support for the Substations Operations Apprentice Craft Committee.
Information Technology –costs dedicated 100% in support of Transmission IT projects and Agency Services IT costs allocated to Transmission via G&A allocations.

2010 Integrated Program Review 29
B O N N E V I L L E P O W E R A D M I N I S T R A T I O N
System Operations Program ($M)
44 49 5162 57 61 63 65
0
50
FY07Actual
FY08Actual
FY09Actual
FY10SOY
FY11RateCase
FY11IPR
FY12IPR
FY13IPR

2010 Integrated Program Review 30
B O N N E V I L L E P O W E R A D M I N I S T R A T I O N
FY 2012-13 Program Spending DriversFY 2011 IPR Changes as compared to FY2011 Rate Case
• Substation Operations +$1.3M
−
Negotiated hourly wage increase, $700K
−
Decrease in lapse of field operation positions, $600K
• Technical Operations +$2.1M
−
Operational support for wind
−
Operational management of new flowgates as a result of new ATC methodology
−
Completing core workload - RAS, outage analysis, study workload, support of commercial activity - business practices, etc.
−
Support of WECC disturbance analysis and line rating workload reflects actuals, $544K
−
Shift of personnel from Security Enhancement program, $378K
−
Risk of delaying Dynamic Transfer Capability (DTC) studies
FY 2012-13 IPR Changes:• FY 2011 IPR changes carry forward into 2012 and 2013 with only an adjustment for inflation.
Transmission System Operations

B O N N E V I L L E P O W E R A D M I N I S T R A T I O N
312010 Integrated Program Review
Transmission Scheduling

2010 Integrated Program Review 32
B O N N E V I L L E P O W E R A D M I N I S T R A T I O N
Transmission Scheduling
Program DescriptionThe scheduling program contains expenses for reservations, pre-scheduling, real-time scheduling, scheduling after-the fact, and technical support.
Strategic Objectives- S1 - Policy & Regional Actions, S4 - Transmission Access & Rates, P1 – Performance, I1 - Systems & Processes
Key Products and OutputsScheduling After-The-Fact - Verify net scheduled and net actual interchange, and investigate and resolve discrepancies. Pre-Scheduling - Sales/scheduling of transmission for next day(s) operations per the WECC Pre-schedule timeline.Real-Time Scheduling - Sales/scheduling of transmission services for next hour delivery; curtail schedules in-hour as system conditions require Reservations - Analysis to determine whether specific transmission requests can be granted subject to requirements of the Tariff and FERC orders, runs the market competitions, assists customers with questions about their transmission requests and operation of OASIS. Scheduling Technical Support - Technical analysis, manages work requests, develop documentation to support the Real-Time and Pre-schedule functions.
Transmission Scheduling2009
Actuals 2010 SOY2011 TR-10 Rate Case 2011 IPR 2012 IPR 2013 IPR
SCHED-AFTER-THE-FACT 310,352 48,351 447,393 447,393 456,016 465,067 SCHED-MANAGE SPRVISION & ADMIN 237,381 - 734,000 - - - SCHED-PRE-SCHEDULING 261,283 105,060 470,382 470,382 479,570 489,195 SCHED-REAL-TIME SCHEDULING 3,491,829 5,218,964 5,027,654 5,027,654 5,117,608 5,213,070 SCHED-RESERVATIONS 789,943 1,267,593 1,073,546 1,073,546 1,094,288 1,116,052 SCHED-TECHNICAL SUPPORT 1,564,134 2,501,186 2,368,651 5,599,502 5,674,361 5,758,541
Total 6,654,922 9,141,153 10,121,626 12,618,478 12,821,843 13,041,925

2010 Integrated Program Review 33
B O N N E V I L L E P O W E R A D M I N I S T R A T I O N
Transmission Scheduling
Scheduling Program ($M)
7 8 79 10
13 13 13
0
10
20
FY07Actual
FY08Actual
FY09Actual
FY10SOY
FY11RateCase
FY11IPR
FY12IPR
FY13IPR

2010 Integrated Program Review 34
B O N N E V I L L E P O W E R A D M I N I S T R A T I O N
FY 2012-13 Program Spending DriversFY 2011 IPR Changes as compared to FY2011 Rate Case:
• Scheduling Technical Support +$3.2M
−
$1M for commercial business support for wind - reps on wind policy and business practices committees. Support for automation of wind operations.
−
$2.1M commercial wind IT operations, shift from the marketing program
FY 2012-13 IPR Changes:• FY2011 IPR changes carry forward into 2012 and 2013 with only an adjustment for inflation.
Transmission Scheduling

B O N N E V I L L E P O W E R A D M I N I S T R A T I O N
352010 Integrated Program Review
Transmission Marketing

2010 Integrated Program Review 36
B O N N E V I L L E P O W E R A D M I N I S T R A T I O N
Transmission Marketing
Program DescriptionThe marketing program contains expenses related to business strategy & assessment, marketing IT support, billing, finance, contract management, and internal operations.
Strategic Objectives- S1 - Policy & Regional Actions, S4 - Transmission Access & Rates, I1 - Systems & Processes, P1 - Performance
Key Products and OutputsMarketing Business Strategy & Assessment - Transmission business policy, assessments, rate case support, and commercial infrastructure. Marketing Contract Management - Analysis and support to Transmission sales to establish, update, or renew transmission contracts. Marketing Transmission Finance - Budgeting, accounting, and finance support to Transmission Marketing. Transmission Sales- Primarily responsible for customer relationships. Establish, update, or renew transmission contracts, and explain changes in business practices or procedures.
Transmission Marketing2009
Actuals 2010 SOY2011 TR-10 Rate Case 2011 IPR 2012 IPR 2013 IPR
MARKETING IT SUPPORT 22,171 - 2,112,150 - - - MKTG BUSINESS STRAT & ASSESS 5,345,690 6,639,814 7,006,597 6,863,173 7,105,219 7,230,923 MKTG CONTRACT MANAGEMENT 3,556,413 4,963,603 4,905,281 4,394,453 4,510,232 4,603,949 MKTG TRANSMISSION BILLING 2,698,102 2,591,673 2,308,852 2,548,263 2,622,902 2,678,722 MKTG TRANSMISSION FINANCE 398,238 289,450 301,699 299,386 306,392 313,561 MKTG TRANSMISSION SALES 2,297,537 3,054,900 3,261,010 3,261,010 3,318,770 3,380,162
Total 14,318,150 17,539,441 19,895,588 17,366,285 17,863,515 18,207,317

2010 Integrated Program Review 37
B O N N E V I L L E P O W E R A D M I N I S T R A T I O N
Transmission Marketing
Marketing Program ($M)
14 13 1418 20
17 18 18
0
10
20
30
FY07Actual
FY08Actual
FY09Actual
FY10SOY
FY11RateCase
FY11IPR
FY12IPR
FY13IPR

2010 Integrated Program Review 38
B O N N E V I L L E P O W E R A D M I N I S T R A T I O N
Transmission Marketing
Drivers of Change: Implementation of Network Integration Service (NITS) OASIS Increased requirements of additional NERC ATC Standards Increased concerns regarding reliability to the Federal System based on additional
wind Assess and implement Intertie Open Seasons
FY 2012-13 Program Spending DriversFY 2011 IPR Changes as compared to FY 2011 Rate Case:
• Marketing Program, (-$3.4M)
– Business Strategy & Assessment, Marketing IT Support, and Management and Supervision shifted to Technical Support within Scheduling Program
FY 2012-13 IPR Changes:
FY 2011 IPR changes carry forward into 2012 and 2013 with only an adjustment for inflation.

B O N N E V I L L E P O W E R A D M I N I S T R A T I O N
392010 Integrated Program Review
Transmission Non-BBL Acquisition and Ancillary Services
2010 Integrated Program Review 40
B O N N E V I L L E P O W E R A D M I N I S T R A T I O N
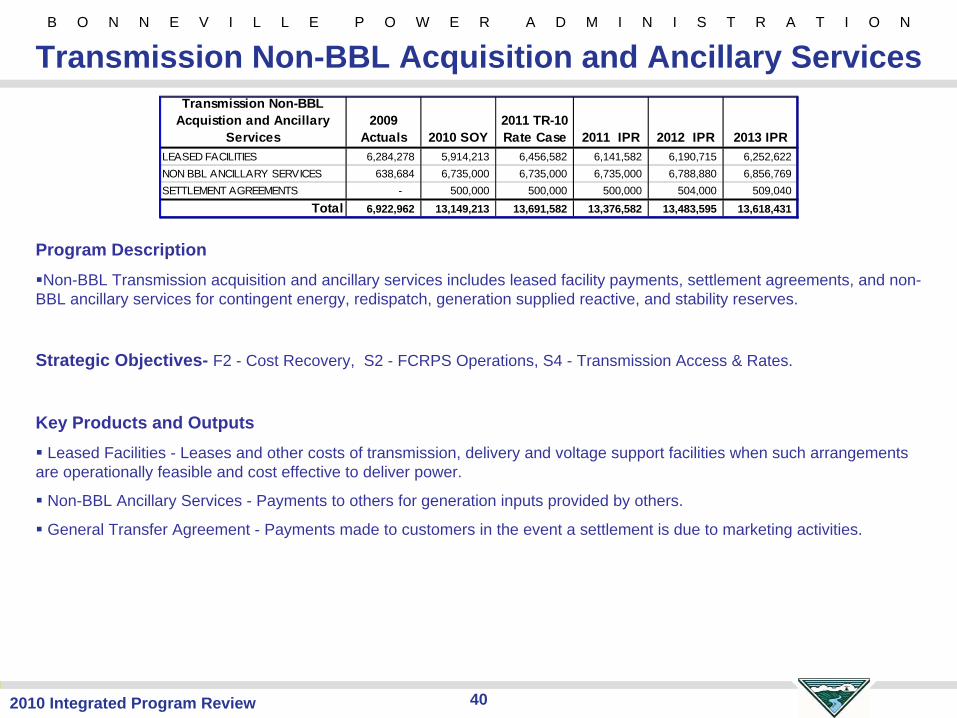
Transmission Non-BBL Acquisition and Ancillary Services
Program DescriptionNon-BBL Transmission acquisition and ancillary services includes leased facility payments, settlement agreements, and non-
BBL ancillary services for contingent energy, redispatch, generation supplied reactive, and stability reserves.
Strategic Objectives- F2 - Cost Recovery, S2 - FCRPS Operations, S4 - Transmission Access & Rates.
Key Products and OutputsLeased Facilities - Leases and other costs of transmission, delivery and voltage support facilities when such arrangements
are operationally feasible and cost effective to deliver power.
Non-BBL Ancillary Services - Payments to others for generation inputs provided by others.
General Transfer Agreement - Payments made to customers in the event a settlement is due to marketing activities.
Transmission Non-BBL Acquistion and Ancillary
Services2009
Actuals 2010 SOY2011 TR-10 Rate Case 2011 IPR 2012 IPR 2013 IPR
LEASED FACILITIES 6,284,278 5,914,213 6,456,582 6,141,582 6,190,715 6,252,622 NON BBL ANCILLARY SERVICES 638,684 6,735,000 6,735,000 6,735,000 6,788,880 6,856,769 SETTLEMENT AGREEMENTS - 500,000 500,000 500,000 504,000 509,040
Total 6,922,962 13,149,213 13,691,582 13,376,582 13,483,595 13,618,431
2010 Integrated Program Review 41
B O N N E V I L L E P O W E R A D M I N I S T R A T I O N
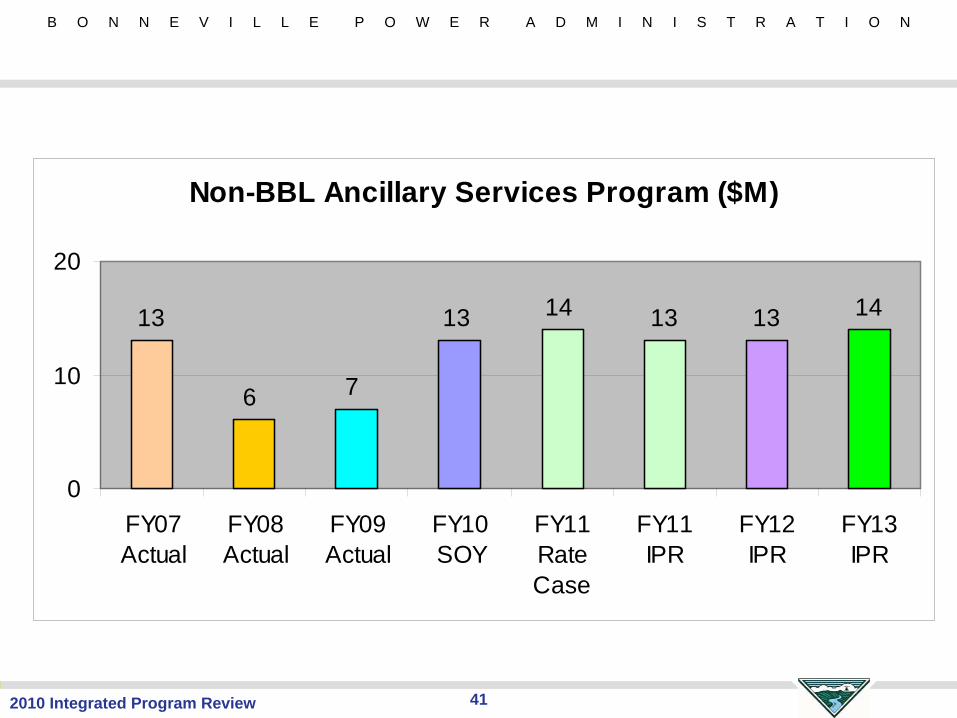
Non-BBL Ancillary Services Program ($M)
13
6 7
13 14 13 13 14
0
10
20
FY07Actual
FY08Actual
FY09Actual
FY10SOY
FY11RateCase
FY11IPR
FY12IPR
FY13IPR

B O N N E V I L L E P O W E R A D M I N I S T R A T I O N
422010 Integrated Program Review
Transmission Business Support

2010 Integrated Program Review 43
B O N N E V I L L E P O W E R A D M I N I S T R A T I O N
Transmission Business Support
Program DescriptionBusiness Support includes expenses for logistics services, aircraft services, legal services, internal general & administrative services, and executive and administrative services.
Strategic Objectives- I4 - Asset Management, I7 - Risk Informed Decision Making and Transparency, S1 - Policy and Regional Action, I1 - Systems and Processes
Key Products and OutputsExecutive and Administrative Services
• Transmission Services Management including VP’s and managers’ labor, outplacement training, employee reimbursements for flu shots, etc. Includes student tuition assistance and travel
Aircraft Services • Provides aviation support to insure the reliability of the power system. Consists of two fixed wing aircraft, flight crew, mechanics
and dispatchers. Transports employees to support the power system.General Administrative
• Represents the support of the Transmission Services, including training, awards, efficiency projects, balance scorecard/business strategy and asset management not specific to another program.
Legal Support - Expense• Represents direct legal support for transmission issues, including contracting, right-of-way, etc.
Transmission Business Support2009
Actuals 2010 SOY2011 TR-10 Rate Case 2011 IPR 2012 IPR 2013 IPR
AIRCRAFT SERVICES 921,283 2,102,084 1,203,471 2,318,036 2,378,897 2,444,578 EXECUTIVE & ADMIN SERVICES 9,310,545 11,691,392 7,871,014 12,904,998 18,241,611 18,601,352 GENERAL ADMINISTRATIVE 6,452,872 9,113,721 14,864,799 10,581,397 13,052,128 13,337,294 LEGAL SUPPORT - EXPENSE 2,401,088 3,116,774 3,026,654 3,364,189 3,186,933 3,429,120 LOGISTICS SERVICES 3,756,348 9,882,993 6,840,930 5,739,031 5,907,829 6,061,368 SECURITY ENHANCEMENTS EXPENSE 3,185,952 522,000 1,429,256 956,000 977,532 1,001,313
Total 26,028,088 36,428,965 35,236,123 35,863,651 43,744,930 44,875,025

2010 Integrated Program Review 44
B O N N E V I L L E P O W E R A D M I N I S T R A T I O N
Transmission Business Support
Key Products and Outputs (continued)Logistics Services
• Materials Handling and Transportation Services, including traffic management, transportation, material handling, shipping, parts pickup, small freight and mail
• Materials Management, including materials and supply purchasing strategy coordination, materials and supply purchasing, stock and direct inventory management, spare parts inventory management, system/order processing, receiving inspection, capital construction material coordination;
• Construction/Services and Field Purchasing, including construction and services purchasing strategy coordination, professional/non-professional services contracting and construction contracting;
• Asset Utilization, including program property management, TEAP coordination, and equipment loan pools;
• Process Management, including continual process improvement of the overall logistics services processes, evaluation and coordination of cross-agency processes in inventory management, purchasing and asset utilization
Security Enhancements
• Costs associated with regular maintenance, minor additions, and inspection of physical security measures such as fences, gates, monitors, and special locks.

2010 Integrated Program Review 45
B O N N E V I L L E P O W E R A D M I N I S T R A T I O N
Transmission Business Support
Business Support Program ($M)
28 27 26
36 35 3644 45
0
50
FY07Actual
FY08Actual
FY09Actual
FY10SOY
FY11RateCase
FY11IPR
FY12IPR
FY13IPR

2010 Integrated Program Review 46
B O N N E V I L L E P O W E R A D M I N I S T R A T I O N
FY 2012-13 Program Spending DriversFY 2011 IPR Changes as compared to FY2011 Rate Case:
• Within Business Support there are some internal program restructuring changes to more appropriately reflect the direction of effort. $4.3M of funds were shifted from General & Administrative to Executive & Administrative Services, yielding no net increase in the overall Business Support program.
• Aircraft Services, +$1.1M−
FAA mandated aircraft maintenance, hangar and aircraft refurbishment, and employee transportation for emergencies.
• Logistic Services, -$1.8M −
100% of Logistic Services is charged into the expense budget and then the capital portion is transferred out. Typically this is 75% capital and 25% expense. In FY2011 allocation of Logistic Services to capital has increased; therefore the credit in base case was too low and the $1.8M reflects this change.
• Security Enhancements, (-$473K)−
$378K shifted to Regulatory Costs in the Engineering program for emergency management staff.
−
$439K Increase for enhanced field response to equipment
FY 2012-13 IPR Changes:• FY2011 IPR changes carry forward into 2012 and 2013 with only an adjustment for inflation.
Transmission Business Support

B O N N E V I L L E P O W E R A D M I N I S T R A T I O N
472010 Integrated Program Review
Transmission Maintenance

2010 Integrated Program Review 48
B O N N E V I L L E P O W E R A D M I N I S T R A T I O N
Transmission Maintenance
Program DescriptionSystem maintenance contains costs related to technical training, heavy mobile equipment maintenance, and maintenance costs for system management, joint cost, power system control, system protection control, transmission line, substation, and non-electric facilities. Also includes costs related to Environmental Analysis and Pollution, Prevention and Abatement activities.
Strategic Objectives- I4 - Asset Management, S9 - Stakeholder Satisfaction, S2 - FCRPS Operations & Expansion, S8 - Climate Change
Key Products and OutputsEnvironmental Analysis
• Provide National Environmental Policy Act (NEPA) and National Historic Preservation Act (NHPA) regulatory compliance through analysis and documentation of impacts related to transmission construction, operation and maintenance activities
Transmission Maintenance2009
Actuals 2010 SOY2011 TR-10 Rate Case 2011 IPR 2012 IPR 2013 IPR
ENVIRONMENTAL ANALYSIS 66,825 77,970 80,310 80,310 80,952 81,762 HEAVY MOBILE EQUIPMENT MAINT 58,282 (53,380) (0) (0) 0 0 JOINT COST MAINTENANCE 141,635 156,749 200,499 200,499 206,741 213,312 NON-ELECTRIC MAINTENANCE 11,280,142 21,672,499 28,055,096 29,291,716 29,752,254 30,272,207 POLLUTION PREVENTN & ABATEMENT 2,906,599 3,635,719 3,915,484 4,063,961 4,174,698 4,261,470 POWER SYSTEM CONTROL MAINT 10,270,560 11,257,940 10,658,781 13,100,000 13,510,531 13,942,646 ROW MAINTENANCE 34,417,269 30,016,610 18,508,417 24,100,000 24,672,429 25,299,601 SUBSTATION MAINTENANCE 25,522,118 23,364,327 22,784,161 27,400,000 29,815,256 30,678,013 SYSTEM MAINTENANCE MANAGEMENT 7,753,452 5,968,413 6,150,516 6,165,131 6,351,940 6,549,743 SYSTEM PROTECTION CONTRL MAINT 11,418,812 13,059,262 11,317,486 12,500,000 12,898,096 13,316,452 TECHNICAL TRAINING 2,465,761 2,571,397 2,723,220 2,823,200 2,915,964 3,013,210 TRANSMISSION LINE MAINTENANCE 21,982,859 23,474,832 26,179,389 25,296,162 26,046,274 26,839,823
Total 128,284,312 135,202,337 130,573,359 145,020,979 150,425,136 154,468,240

2010 Integrated Program Review 49
B O N N E V I L L E P O W E R A D M I N I S T R A T I O N
Transmission MaintenanceKey Products and Outputs (continued)
Heavy Mobile Equipment Maintenance (HMEM) • HMEM program covers costs associated with repair and maintenance on all BPA E-plated equipment, Microwave
engine generators, substation engine generators, outfitting of BPA/GSA vehicles and maintenance of miscellaneous tools
Joint Cost Maintenance • Operations and maintenance of facilities jointly owned by BPA and an outside entity.
Non-Electric Maintenance • Inspection and maintenance of the substation grounds and yards. It includes janitorial services; road, parking, curbs,
and gutter upkeep; care of grounds, snow removal and cutting grass; water and sewer upkeep; security, fire protection, and alarm system upkeep; heating, cooling, and associated equipment inspections and maintenance; and crane and elevator inspections and upkeep.
Pollution, Prevention & Abatement • Develop, coordinate, and manage environmental compliance actions and programs associated with the operation,
maintenance, and construction of BPA’s transmission system
Power System Control• Costs for diagnostic and repair of communications
ROW Maintenance• Planning, implementation, and monitoring (project management) of all vegetation-related activities associated w/
ROW's and access road activities. Contracted vegetation management and access road construction crews to accomplish identified maintenance work; danger tree management, management analysis--reporting systems and technology.
Substation Maintenance• Service and repair of BPA-owned system power equipment, including transformers, breakers, and other high voltage
equipment within BPA substations and energized facilities.

2010 Integrated Program Review 50
B O N N E V I L L E P O W E R A D M I N I S T R A T I O N
Transmission MaintenanceKey Products and Outputs (continued)
System Maintenance Management • Upkeep of capital plant, property, and equipment to insure its intended function in support of the ongoing operations.
Includes repairs and minor replacements of plant from point of generation to the entrance to the distribution system.
System Protection Control Maintenance• Testing, checking, maintaining, and adjusting meters, gauges, and other instruments, relays, controls, and other
equipment in the plant
Technical Training • Coordinating and providing training for apprentices (electrician, lineman, operator), craftsman, lineman, electrician,
operator and engineer training and T Professional training for annual employees
Transmission Line Maintenance • Maintenance and repair of nearly 15,000 circuit miles of overhead transmission lines and transmission line structures
and fixtures such as steel towers, wood poles, cross arms, insulators, overhead conductors and devices, as well as roads and trails.

2010 Integrated Program Review 51
B O N N E V I L L E P O W E R A D M I N I S T R A T I O N
Transmission Maintenance
System Maintenance Program ($M)
91115 128 135 131 145 150 154
0
50
100
150
200
FY07Actual
FY08Actual
FY09Actual
FY10SOY
FY11RateCase
FY11IPR
FY12IPR
FY13IPR

2010 Integrated Program Review 52
B O N N E V I L L E P O W E R A D M I N I S T R A T I O N
ROW Budget History and Forecast
$‐
$5.0
$10.0
$15.0
$20.0
$25.0
$30.0
$35.0
$ in M
illions
Actuals $7.5 $12.5 $14.8 $28.3 $34.4
IPR $30.0 $24.1 $24.7 $25.3 $25.9 $26.6 $27.2 $27.9
FY05 FY06 FY07 FY08 FY09 FY10 FY11 FY12 FY13 FY14 FY15 FY16 FY17

2010 Integrated Program Review 53
B O N N E V I L L E P O W E R A D M I N I S T R A T I O N
Substation RCM Trending
$0
$2,000,000
$4,000,000
$6,000,000
$8,000,000
$10,000,000
$12,000,000
$14,000,000
ActualsAmt
ActualsAmt
ActualsAmt
ActualsAmt
ActualsAmt
ActualsAmt
ActualsAmt
Projected IPR IPR IPR
2003 2004 2005 2006 2007 2008 2009 2010 2011 2012 2013
Preventative Maintenance Corrective Maintenance Other Maintenance Engineering

2010 Integrated Program Review 54
B O N N E V I L L E P O W E R A D M I N I S T R A T I O N
FY 2012-13 Program Spending DriversFY 2011 IPR Changes as compared to FY2011 Rate Case:
• Substation maintenance, $4.7M−
Environmental stewardship related to aging/leaking equipment including transformer testing, dry outs, sorbent maintenance and overhauls; prioritized jointly with BPA EF&W, $1.4M
−
Laboratory business case, $300k
−
Engineering expertise associated with failing transformers and components such as load tap changers, $2M
−
Increased maintenance associated with aging equipment and additional infrastructure requiring maintenance, $1M
−
Seismic hardening, $500k
−
Program includes $500k efficiency gain for the new Cascade system that better informs priority, risk and equipment health decision making
• PSC Maintenance, $2.4M−
Increasing failures associated with failing asset health and new technology interfaces (digital/analog), $500k
−
Analog to digital circuit moves, $500K
−
NERC CIP projections in the field and control center, $700K
−
Redlines and drawing updates and as-builts, $400K
−
Control center expertise, $300K
• SPC Maintenance, $1.2M−
Engineering expertise associated with new technology additions while old technology remains, $300K
−
Increasing failures associated with aging equipment, $700K
−
PMU/synchrophasor engineering work, standards, test gear, $200K
Transmission Maintenance

2010 Integrated Program Review 55
B O N N E V I L L E P O W E R A D M I N I S T R A T I O N
FY 2012-13 Program Spending Drivers (continued)FY 2011 IPR Changes as compared to FY2011 Rate Case:
• ROW Maintenance, $5.6M−
Increased vegetation preventive maintenance (cycle) using asset health approach, $2.8M−
Increased use of LiDAR as a key diagnostic, $0.7M−
Realty associated with orchard impacts, crops damage and off ROW vegetation management, $2.1M−
Program includes $750k efficiency gain anticipated from Strategic Sourcing of contract vegetation removal• Transmission Line Maintenance, (-$600k)
−
Program includes $500k efficiency gain for the new Cascade system that better informs priority, risk and equipment health decision making
−
Rescheduled sign replacement program based on system and safety priority
FY 2012-13 IPR Changes:FY 2011 IPR changes carry forward into 2012 and 2013 with an adjustment for inflation.
• $1M/year Seismic Hardening
Transmission Maintenance

B O N N E V I L L E P O W E R A D M I N I S T R A T I O N
562010 Integrated Program Review
Transmission Engineering

2010 Integrated Program Review 57
B O N N E V I L L E P O W E R A D M I N I S T R A T I O N
Transmission Engineering
Program DescriptionSystem engineering consists of costs in support of the research and development program, transmission system planning and analysis, region association fees, including the allocated costs for industry restructuring, and costs associated with cancelledcapital projects and inventory adjustments.
Strategic Objectives- I4 - Asset Management, I5 - Technology Innovation, S2 - FCRPS Operations & Expansion, S8 - Climate Change
Key Products and OutputsCapital to Expense Transfer
• Conduct annual analysis of Bonneville’s outstanding capital work orders to assess whether they should be expensed. Includes cancelled projects.
• As obsolete inventory is identified and disposed of, it is expensed. Environmental Policy Planning
• Ensures statutory/regulatory environmental compliance requirements are accomplished through appropriate biological, physical, and cultural investigations and social and economic analyses of BPA decisions, or actions that it carries out or funds.
Transmission Engineering2009
Actuals 2010 SOY2011 TR-10 Rate Case 2011 IPR 2012 IPR 2013 IPR
CAPITAL TO EXPENSE TRANSFER 6,100,706 3,695,107 4,000,000 4,000,000 4,032,000 4,072,320 ENVIRONMENTAL POLICY/PLANNING 1,332,748 1,777,565 1,853,415 1,783,483 1,823,179 1,854,449 REGULATORY COSTS 5,148,765 7,863,535 5,082,837 6,758,487 7,700,268 7,867,689 RESEARCH & DEVELOPMENT 6,994,116 6,663,225 5,700,544 6,579,691 8,688,116 9,114,490 TSD PLANNING & ANALYSIS 8,028,628 8,483,236 8,811,024 11,907,712 12,278,522 12,669,656
Total 27,604,963 28,482,668 25,447,820 31,029,373 34,522,085 35,578,604

2010 Integrated Program Review 58
B O N N E V I L L E P O W E R A D M I N I S T R A T I O N
Transmission EngineeringKey Products and Outputs (continued)
Research & Development
• Conduct research focused on technologies related to business challenges BPA faces including reliability, energy efficiency, and integration of renewable energy resources.
• Oversight of BPAs R&D program. Technologies of interest are identified in BPA's Technology Roadmaps. A portfolio of research is selected every year through BPA's Portfolio Decision Framework
TSD Planning and Analysis
• Provide technical support activities, such as transmission system planning and studies to optimize portions of the system. Provide support for non-wires solutions studies and pilot projects.
Regulatory & Regional Association Fees
• Western Electricity Coordinating Council (WECC) dues and loop flow payments, DOE licensing costs for radio frequencies and NERC CIP compliance program costs. Also includes costs related to industry restructuring.

2010 Integrated Program Review 59
B O N N E V I L L E P O W E R A D M I N I S T R A T I O N
Transmission Engineering
System Engineering Program ($M)
1521
28 2825
3135 36
0
10
20
30
40
FY07Actual
FY08Actual
FY09Actual
FY10SOY
FY11RateCase
FY11IPR
FY12IPR
FY13IPR

2010 Integrated Program Review 60
B O N N E V I L L E P O W E R A D M I N I S T R A T I O N
FY 2012-13 Program Spending DriversFY 2011 IPR Changes as compared to FY2011 Rate Case:
• TSD Planning & Analysis, +$3.1M−
Expense indirect in support of the larger capital program, $1.1M
−
Colstrip Montana study, $700K
−
Wind integration- integration studies, network open season, WIT, $900K
−
Asset management, $200K
−
Non-wires, $100K
−
Grid modeling software, $100K
• Regulatory & Association Fees, +$1.7M−
Support for NERC CIP compliance requirements, $1.3M
−
Radio frequency support relicensing, $550K
FY 2012-2013 IPR Changes:• $2.1M/year Technology Innovation - reflects the R&D requested increases• $1M/year Regulatory - E-Discovery and OATT Risk Mitigation
Transmission Engineering

B O N N E V I L L E P O W E R A D M I N I S T R A T I O N
612010 Integrated Program Review
Wind Costs- Multiple Programs

2010 Integrated Program Review 62
B O N N E V I L L E P O W E R A D M I N I S T R A T I O N
Wind Integration: FY 2010 Forecast WIT/WIND Budget vs. Actuals
Notes:1.Beginning FY11, budgets for Marketing and sales WIT and WIND activities would be carried under the Marketing Program instead of Technical Operations Program.2. FY10 budgets and actuals in the Technical Operations Program includes costs for WIND and WIT from the Marketing and Sales organization.3. End of Year Forecast is an approximation based on actuals to date.
Budget(Forecasted start
of FY10)
Actuals (Through 5/12/10)
EOY Forecast3
(Approx. by 9/30/10)
Capital Program (Direct cost Gen Interconnection work)
$63,809,900 $11,676,662 $35,658,214
Expense Program
Technical Operations (WIT)1/2/ $4,950,000 $1,443,300 $3,000,000
Control Center Support (WIT) Included in TO Budget for WIT
Included in TO Budget for WIT
Included in TO Budget for WIT
Marketing, Business Strategy and Assessment (WIND)
Included in TO Budget for WIT
Included in TO Budget for WIT
Included in TO Budget for WIT
Internal Reimbursables— Renewables Mitigation (Transmission billed to Power)
$1,050,000 $1,050,000 $1,050,000

2010 Integrated Program Review 63
B O N N E V I L L E P O W E R A D M I N I S T R A T I O N
Wind Integration: FY 2011-2014 Forecast
2011 Estimate 2012 Estimate 2013 Estimate 2014 Estimate
Capital Program(Direct Cost Gen Interconnection)
$57,784,700 $35,266,700 $36,450,300 $24,328,500
Expense Program
Technical Operations (WIT) 1 $300,000 $300,000 $300,000 $300,000
Control Center Support (WIT) $300,000 $300,000 $300,000 $300,000
Marketing, Business Strategy and Assessment (WIND) 2
$238,000 $244,000 $250,000 $256,353
Internal Reimbursables 3 $2,220,000 $2,275,500 $2,332,387 $2,390,697
Notes:
1. Beginning FY11, budgets for Marketing and Sales WIT and WIND activities would be carried under the Marketing Program instead of Technical Operations Program.
2. FY10 budgets and actuals in the Technical Operations Program includes costs for WIND and WIT from the Marketing and Sales organization.
3. In FY12 and FY13, Transmission’s share of Corporate and Legal WIT expenses will be $210,000 each year.

B O N N E V I L L E P O W E R A D M I N I S T R A T I O N
642010 Integrated Program Review
IPR – Transmission 5% Cost Reduction Scenario

2010 Integrated Program Review 65
B O N N E V I L L E P O W E R A D M I N I S T R A T I O N
Summary Cost Reduction
FY12 Cut FY 13 Cut FY 12 IPR FY 13 IPRFY 12 Cut as % of Budget
FY 13 Cut as % of Budget
Business Support $2,551,128 $2,628,091 $43,744,930 $44,875,025 5.8% 5.9%Marketing $1,426,913 $1,456,697 $17,863,515 $18,207,317 8.0% 8.0%Non-BBL $111,536 $112,111 $13,483,595 $13,618,431 0.8% 0.8%System Engineering $1,900,183 $1,994,023 $34,522,084 $35,578,604 5.5% 5.6%System Maintenance $7,469,591 $7,730,113 $150,425,136 $154,468,240 5.0% 5.0%System Operations $2,342,036 $2,295,110 $62,918,052 $64,831,964 3.7% 3.5%Scheduling 54,000$ 54,000$ $12,821,843 $13,041,925 0.4% 0.4%
$15,855,387 $16,270,145 $335,779,155 $344,621,506 5% 5%
TRANSMISSION 5% REDUCTIONS BY PROGRAM

2010 Integrated Program Review 66
B O N N E V I L L E P O W E R A D M I N I S T R A T I O N
System Operations – Reduction Scenario (1 of 3)
Transmission System Operations 2012 IPR
2012 IPR Reduction Scenario Delta 2013 IPR
2013 IPR Reduction Scenario Delta
CONTROL CENTER SUPPORT 14,137,179 13,022,179 1,115,000 14,554,493 13,413,848 1,140,645 INFORMATION TECHNOLOGY 6,773,896 6,289,460 484,436 6,936,123 6,541,338 394,785 POWER SYSTEM DISPATCHING 12,399,838 12,032,838 367,000 12,816,798 12,441,357 375,441 SUBSTATION OPERATIONS 21,171,176 21,071,176 100,000 21,849,019 21,746,719 102,300 TECHNICAL OPERATIONS 8,435,963 8,160,363 275,600 8,675,531 8,393,592 281,939
Total 62,918,052 60,576,016 2,342,036 64,831,964 62,536,854 2,295,110
Program Line Item
Description of Reduction Average reduction
Impact of Reduction Risk: MediumHigh
Control Center Support
Decrease contractor staffing for technology support
Reduce O&M Support for DC RAS at Munro Control Center. Project has been delayed one year so O&M staffing can also be delayed.
Delay full staffing of Control System Monitor administration
$850K per year
$140K in FY 2012
$126k per year
Could not deliver on both core workload and new initiatives, e.g. renewable generation, Smart Grid, Columbia Grid/Joint Initiatives, synchrophasers, key O&M support for control center automation. Eliminate maintenance support for the Transmission Path Summary application on RODS.
Continued delay in completing infrastructure O&M and Preventive Maintenance tasks. The risk is lack of maintenance will eventually lead to failure.
Risk of not being prepared to support new equipment once installed
Doesn’t fully implement CSM workload structuring effort, risks to not meeting full system monitoring requirements
High
Medium
Medium

2010 Integrated Program Review 67
B O N N E V I L L E P O W E R A D M I N I S T R A T I O N
Program Line Item
Description of Reduction
$ Amount of Reduction
Impact of Reduction Risk: MediumHigh
Information Technology
Reduce IT costs by reducing/deferring project planning, enhancements and O&M support costs.
Cancel or delay some expense projects in FY12 & FY13 &/or some capital project deliveries in FY10 and FY11 to achieve O&M savings in FY12 and FY13. Projects to be delayed could include parts of Transmission Commercial Systems Reinforcement (TCSR) and OATI enhancements; as well as expansion or support efforts for Transmission Scheduling (TSAS) and Commercial Business Support Application (CBSA) systems as well as non-TCSR IT Change Order Costs.
These costs constitute a significant portion of the IT development & support costs required to keep Transmission’s commercial systems current with industry changes, operating efficiently and adapting to the demands of the Transmission Commercial Market growth and evolution.
$484K per year This reduction represents about 15-20% of the commercial system costs and presents the following risks.
Risk of meeting industry timelines for conducting NT business on OASIS
Risk of not achieving compliance initiatives in the time frame targeted.
Risk of impacting tariff reciprocity and compliance efforts.
Risk of not meeting the regions objectives for Wind Integration and other regional Transmission market initiatives , such as Intertie Open Seasons and Redispatch.
Risk of system performance and design not keeping up with market trends, demands and internal business information needs.
Risk of not being able to offer new market products - which could impact future revenue possibilities.
High
System Operations – Reduction Scenario (2 of 3)

2010 Integrated Program Review 68
B O N N E V I L L E P O W E R A D M I N I S T R A T I O N
System Operations – Reduction Scenario (3 of 3)
Program Line Item
Description of Reduction $ Amount of Reduction
Impact of Reduction Risk: Medium High
Power System Dispatching
Delay full staffing of new Wind/Visualization desk by 1 year
Reduce Dispatcher Training Facility staff
$200K per year
$192K per year
Unable to effectively manage the growing amount of renewables on the grid
Shifts additional training work to existing BPA staff and contractors. If work cannot be absorbed there is a risk of not meeting NERC required operator training requirements.
High
High
Technical Operations
Reduce contract support for operational system studies
$275K per year Timeliness and analytical rigor of some operational studies will be reduced. For example, this may result in a more conservative margin for the Dynamic Transfer Capability (DTC) value since engineering judgment may need to be more heavily relied upon.
High
Substation Operations
Reduce contractor support for Operations Technical Manual maintenance
$101K per year The Operations Technical Manual is used by field operations staff as a source of technical reference information. Not keeping it up to date impacts the quality of field operations and possibly impairing safe and reliable operations.
Medium

2010 Integrated Program Review 69
B O N N E V I L L E P O W E R A D M I N I S T R A T I O N
Marketing– Reduction Scenario (1 of 2)
Marketing & Scheduling Programs were evaluated as one program and the reductions were taken solely from the Marketing Program.
Transmission Marketing 2012 IPR
2012 IPR Reduction Scenario Delta 2013 IPR
2013 IPR Reduction Scenario Delta
MARKETING IT SUPPORT - - - - - - MKTG BUSINESS STRAT & ASSESS 7,105,219 5,939,719 1,165,500 7,230,923 6,041,273 1,189,650 MKTG CONTRACT MANAGEMENT 4,510,232 4,380,721 129,511 4,603,949 4,471,315 132,634 MKTG TRANSMISSION BILLING 2,622,902 2,491,000 131,902 2,678,722 2,544,309 134,413 MKTG TRANSMISSION FINANCE 306,392 306,392 - 313,561 313,561 - MKTG TRANSMISSION SALES 3,318,770 3,318,770 - 3,380,162 3,380,162 -
Total 17,863,515 16,436,602 1,426,913 18,207,317 16,750,620 1,456,697
Program Line Item
Description of Reduction
$ Amount Impact of Reduction Risk: Medium High
Mktg Transmission Billing
50% Reduction in Customer Support Services’ participation in Customer Account Teams
$132K per year Limit research and analysis into billing issues, disputes and problems to individual customer billing issues that have a material (1% audit standard revenue impact on the customer.
High
Business Strategy and Assessments
Reduce support of wind initiatives, NERC ATC Standards, Intertie Open Seasons, Redispatch, Network Integration Transmission Services (NITS) OASIS and commercial systems improvements
$1.17M per year
Risk of not meeting industry timelines for conducting NT business on OASIS
Risk of not achieving compliance initiatives in the time frame targeted.
Risk of impacting tariff reciprocity and compliance efforts.Risk of not meeting the region’s objectives for wind integration and
other regional Transmission market initiatives, such as Intertie Open Seasons and Redispatch.
Risk of system performance and design not keeping up with market trends, demands and internal business information needs.
Risk of not being able to offer new market products - which could impact future revenue possibilities.
High

2010 Integrated Program Review 70
B O N N E V I L L E P O W E R A D M I N I S T R A T I O N
Marketing– Reduction Scenario (2 of 2)
Program Line Item
Description of Reduction
$ Amount Impact of Reduction Risk: Medium High
Mktg Contract Management
Reduce contract support $130K per year Lengthen the time to validate and make contract data available to downstream systems and customer contract data management.
Medium

2010 Integrated Program Review 71
B O N N E V I L L E P O W E R A D M I N I S T R A T I O N
Business Support – Reduction Scenario (1 of 3)
Program Line Item
Description of Reduction $ Amount Impact of Reduction Risk: Medium High
Aircraft Services Reduce airplane flight hours to support transportation needs of the agency.
$195K per year Reduced availability to provide contract support for transportation when TC does not have aircraft assets to meet customer needs. Employees will need to take commercial carrier which may be at higher cost and longer travel time.
Medium
Executive & Admin Services and General Admin.
Reduced funding to appropriately staff customer support functions. Sample reductions include not implementing sub-hourly billing products and services during FY 2012-13, limiting the number of meter ‘communication’ conversions (for example, from cellular to Transmission Control Protocol/Internet Protocol) to the current 30 per year, and reducing research and analysis into billing issues, disputes and problems to individual customer billing issues that have a material (1% audit standard) revenue impact on the customer.
$960K per year Increased risk exposure from A-123 internal control findings associated with system and process deficiencies and lack of remediation.Reduced response timeliness to customer information requests into metering, billing, contracts, and load forecasts issues that affect customers
Reduced bill, meter and load forecast data QC checksReduced validation of compliance with internal contract policies and standards, and contract authenticationReduced analytical support associated with policy decision impacts on customer support systems and processesReduced support and responsiveness to AE Customer Account Teams
High
Transmission Business Support 2012 IPR
2012 IPR Reduction Scenario Delta 2013 IPR
2013 IPR Reduction Scenario Delta
AIRCRAFT SERVICES 2,378,897 2,249,274 129,623 2,444,578 2,303,950 140,628 EXECUTIVE & ADMIN SERVICES 18,241,611 17,281,611 960,000 18,601,352 17,615,493 985,859 GENERAL ADMINISTRATIVE 13,052,128 12,852,128 200,000 13,337,294 13,137,294 200,000 LEGAL SUPPORT - EXPENSE 3,186,933 3,028,352 158,581 3,429,120 3,258,447 170,673 LOGISTICS SERVICES 5,907,829 4,904,905 1,002,924 6,061,368 5,032,737 1,028,631 SECURITY ENHANCEMENTS EXPENSE 977,532 877,532 100,000 1,001,313 899,013 102,300
Total 43,744,930 41,193,802 2,551,128 44,875,025 42,246,934 2,628,091

2010 Integrated Program Review 72
B O N N E V I L L E P O W E R A D M I N I S T R A T I O N
Program Line Item
Description of Reduction $ Amount
Impact of Reduction Risk: Medium High
Executive & Admin Services and General Admin.
Reduce Corporate risk office support
Reduce OWCP Forecast
continued Increases risk of failing to identify and appropriately mitigate key enterprise risks. General slowing of the BPA’s Business Continuity program, reducing its ability to effectively respond to a significant disruptive event.
Uncertainty of medical costs and compensation obligations. OWCP budget set at 2.2% greater than current year’s forecasted actuals.
High
Medium
General Administrative
Reduce support for compliance program
Reduce Transmission student tuition reimbursement
$140K per year
$60K per year
Decrease in supplemental labor impacts compliance-related work; increases risk in meeting timelines; affects key agency transmission reliability target.
Impacts prior commitment with existing students to fund tuition; may create inability to attract high caliber talent for succession planning
High
Medium
Legal Support Expense
No Legal hearing officer services provided in FY12 and forego FY13 second hearing officer and arbitration services. Services would have provided support for the number and complexity of new pricing issues facing Transmission as a consequence of wind integration, the stepped-up capital program, and FERC’s recent NOI on renewables integration
$158K per year
Increases risk of identifying early-on potential customer contract implementation issues, avoiding implementation mistakes, and rectifying contract issues, post-execution. Although 2012 is an-off rate case year, it is prudent to budget for a hearing officer. If the hearing officer is cut it will leave Transmission in the position of having to self-fund these services. Cutting one of the hearing officers runs a high risk of procedural errors and customer dissatisfaction.
High
Business Support – Reduction Scenario (2 of 3)

2010 Integrated Program Review 73
B O N N E V I L L E P O W E R A D M I N I S T R A T I O N
Program Line Item
Description of Reduction $ Amount
Impact of Reduction Risk: Medium High
Logistic Services
Reduce level of support for Logistic Services through reducing the amount of transportation services available to Transmission for delivery of materials, e.g. transformer oil delivery
Reduce or eliminate Cycle counts for inventory,
Reduce crew / vehicle / equipment movement,
Eliminate custom spooling of wire
Eliminate sorts in asset utilization and return only factory sealed boxes
Reduce the number of Contracting Officer Assistants supporting the Contracting Officers for Capital and O&M procurement
$1M per year
Overall reductions result in a high risk of negative impact on capital program execution. Reduced special delivery runs could impact project schedules.
A reduction in staff (5%) will result in FERC mandated cycle counts being reduced or suspended.
Shifts workload to Transmission Force Account and Maintenance.
Only full spools will be sent to the field for construction projects, resulting in extra costs to the project and additional waste.
Disposing partial cases that contain useable material, will increase costs to projects (that would otherwise receive credit for the return)
Project start dates will be put at risk since Supply Chain Services may not be able to meet contract timelines and HCA and DOE IG mandated document storage policies.
High
Medium
High
Medium
Medium
High
Security Enhancements
Limit security system alarms response to normal business hours. Do not allow use over-time for response after hours, weekends, overnight, etc.
$101K per year
Impact would be exposure to security breaches beyond core business hours.
High
Business Support – Reduction Scenario (3 of 3)

2010 Integrated Program Review 74
B O N N E V I L L E P O W E R A D M I N I S T R A T I O N
System Maintenance – Reduction Scenario (1 of 3)
Transmission Maintenance 2012 IPR
2012 IPR Reduction Scenario Delta 2013 IPR
2013 IPR Reduction Scenario Delta
ENVIRONMENTAL ANALYSIS 80,952 76,905 4,047 81,762 77,674 4,088 HEAVY MOBILE EQUIPMENT MAINT 0 0 - 0 0 - JOINT COST MAINTENANCE 206,741 206,741 - 213,312 213,312 - NON-ELECTRIC MAINTENANCE 29,752,254 26,558,816 3,193,438 30,272,207 26,916,045 3,356,162 POLLUTION PREVENTN & ABATEMENT 4,174,698 3,972,593 202,106 4,261,470 4,054,618 206,853 POWER SYSTEM CONTROL MAINT 13,510,531 13,110,531 400,000 13,942,646 13,533,446 409,200 ROW MAINTENANCE 24,672,429 24,172,429 500,000 25,299,601 24,788,101 511,500 SUBSTATION MAINTENANCE 29,815,256 27,965,256 1,850,000 30,678,013 28,786,063 1,891,950 SYSTEM MAINTENANCE MANAGEMENT 6,351,940 6,031,940 320,000 6,549,743 6,222,383 327,360 SYSTEM PROTECTION CONTRL MAINT 12,898,096 12,798,096 100,000 13,316,452 13,214,152 102,300 TECHNICAL TRAINING 2,915,964 2,815,964 100,000 3,013,210 2,910,910 102,300 TRANSMISSION LINE MAINTENANCE 26,046,274 25,246,274 800,000 26,839,823 26,021,423 818,400
Total 150,425,136 142,955,545 7,469,591 154,468,240 146,738,127 7,730,113
Program Line Item
Description of Reduction
$ Amount Impact of Reduction Risk: Medium High
Non-Electric Maintenance
Delay lowest priority projects from backlog of deferred non-electric facilities maintenance.
$3.1M per year Deferral of work will incur higher costs in outyears, Emergency repairs may increase with higher costs and newly identified non-electric projects may not be addressed.
Medium
Pollution Prevention and Abatement
Reduce service contracts needed for cleanup and disposal of contaminated items.
$200K per year Reduction would put at risk the ability to be in compliance with environmental requirements.
High
Power System Control Maintenance
Delay the backlog reduction of community system documentation.
$400K per year Inaccurate communication system documentation will reduce crew efficiency and decrease system reliability and worker safety.
High

2010 Integrated Program Review 75
B O N N E V I L L E P O W E R A D M I N I S T R A T I O N
Program Line Item
Description of Reduction
$ Amount Impact of Reduction Risk: MediumHigh
ROW Maintenance Reduce all expense realty activities not directly associated with clearing vegetation hazards on ROW.
$500K per year The elimination of off ROW vegetation management will increase outages to off ROW vegetation impacting reliability.
High
Substation Maintenance
Reduce corroded equipment painting program.
Reduce quality control program.
Reduce load tap changer factory support; delay repair of two leaking transformers; defer maintenance on U bushings.
Reduce seismic hardening.
Abolish implementation of the lab business case recommendations.
$100K per year
$100K per year
$1.05M per year
$250K per year
$350K per year
Will increase costs in outyears. Shortens asset life. Requires more emergency response due to catastrophic failure. Corroded towers increase safety risk.
Increases programmatic risk and potential for compliance issues.
Increased risk of violent equipment failures, environmental noncompliance, and reduction of system reliability
Delay restoration following a seismic event. Would increase the scope of outages from a seismic event.
Deteriorates the labs resulting in an eventual closure, stranding investments, outsourcing of work at higher costs (up to 300% more). Diminishes BPA’s recognized expertise in the industry and ability to provide expert services.
Medium
High
High
Medium
High
System Maintenance – Reduction Scenario (2 of 3)

2010 Integrated Program Review 76
B O N N E V I L L E P O W E R A D M I N I S T R A T I O N
System Maintenance – Reduction Scenario (3 of 3)
Program Line Item
Description of Reduction
$ Amount Impact of Reduction Risk: MediumHigh
System Maintenance Management
Delay centralized work planning and evaluation initiative and new processes.
$320K per year Decreased crew efficiency, system availability, and potential for under-delivery on maintenance programs and unavailability of staff for capital work
High
System Protection Control Maintenance
Reduce bench and field testing of new technology for relays and controls
$100K per year Increases risk for system reliability because we will be installing equipment that has not been sufficiently tested.
High
Technical Training Reduce technical expertise for apprenticeship and craftsmen programs.
$100K per year Results in less thorough training program and less skilled workforce. Potential for increased human and operating errors, negatively impacting reliability and safety.
High
Transmission Line Maintenance
Reduce the helicopter air patrol program.
Reduce safety initiative for re- signing towers.
$300K per year
$500K per year
Reduces in detailed line inspections results in unknown condition assessments and a potential for emergency failures.
Increase operational errors and safety risk. Shifts costs to the next rate period.
High
High

2010 Integrated Program Review 77
B O N N E V I L L E P O W E R A D M I N I S T R A T I O N
Engineering – Reduction Scenario
Transmission Engineering 2012 IPR
2012 IPR Reduction Scenario Delta 2013 IPR
2013 IPR Reduction Scenario Delta
CAPITAL TO EXPENSE TRANSFER 4,032,000 4,000,000 32,000 4,072,320 4,000,000 72,320 ENVIRONMENTAL POLICY/PLANNING 1,823,179 1,739,763 83,416 1,854,449 1,769,650 84,798 REGULATORY COSTS 7,700,268 7,249,907 450,361 7,867,689 7,407,208 460,481 RESEARCH & DEVELOPMENT 8,688,116 8,253,710 434,406 9,114,490 8,658,766 455,724 TSD PLANNING & ANALYSIS 12,278,522 11,378,522 900,000 12,669,656 11,748,956 920,700
Total 34,522,085 32,621,902 1,900,183 35,578,604 33,584,581 1,994,023
Program Line Item
Description of Reduction
$ Amount Impact of Reduction Risk: MediumHigh
Environmental Policy & Planning
Reduce support for NEPA and NHPA coverage for projects
$84K per year Would place BPA in jeopardy of not being in compliance with Federal law and risk lawsuits or directives of non-compliance that could shut down or delay projects.
High
Regulatory Costs Reduce grid operations information system security management (ISSM) office support.
$450K per year Increased risk of meeting cyber security mandatory requirements, e.g. Smart Grid, CIP Version 3&4, and Critical Cyber Assets in field locations.
High
Research & Development
Reduce funding of R&D Technology Innovation projects. Negate the Technology Innovation Program budget ramp-up to reach one half of one percent.
$444K per year Jeopardizes achievement of incremental improvements in real time grid operation capability, which is expected to add 100-500MW during nonpeak hours for many paths without building new transmission lines. Estimated savings are project to be $250k to $1M per year.
Puts at risk advancement in seismic standards, equipment stabilization and hardening, thereby reducing BPA’s seismic preparedness capabilities in face of the expected 9 magnitude subduction earthquake overdue in the Pacific Northwest.
High

2010 Integrated Program Review 78
B O N N E V I L L E P O W E R A D M I N I S T R A T I O N
Engineering – Reduction Scenario
Program Line Item
Description of Reduction
$ Amount Impact of Reduction Risk: MediumHigh
TSD Planning & Analysis
Reduction in internal construction services in support of the capital program.
After completion of the Montana Colstrip study in FY11, fund no additional study work in the area of planning and/or asset management.
$304K per year
$607K per year
Will not meet the commitment to develop and complete BPA capital projects (including meeting NERC reliability criteria), customer requested projects, and interconnection of renewable generation.
Reduced support for capital program and inability to complete planning studies for wind integration requests.
High
High

B O N N E V I L L E P O W E R A D M I N I S T R A T I O N
792010 Integrated Program Review
Next Steps

2010 Integrated Program Review 80
B O N N E V I L L E P O W E R A D M I N I S T R A T I O N
Detailed Workshop Schedule
Date Time- May 3, 2010 3:00-4:00 PM
Pre-IPR meeting held at the Quarterly Business Review
1 Executive Welcome and Overview May 10, 2010 9:00-1:00 PMExecutive Welcome, Introductions, Process OverviewPower, Transmission, Corporate overview
2 Federal Hydro Asset Strategy & Capital Discussion May 13, 2010 9:00-12:00 PMFCRPS Hydro Asset StrategyFederal Hydro Capital Program for FY 2012-17
3 Transmission Asset Strategies & Capital Discussion May 17, 2010 9:00-4:00 PMTransmission Asset Strategies Transmission Capital Programs for FY 2012-17
4 Transmission Expense May 18, 2010 9:00-12:00 PMTransmission Expense Programs for FY 2012-13
5 Transmission Overflow 1:00-4:00 PMDiscuss Remaining Topics, Follow Ups, Etc.
6 May 19, 2010 9:00-12:00 PM
Power Internal Operating Cost for FY 2012-13Power Acquisition and Ancillary Services for FY 2012-13Residential Exchange Program for FY 2012-13
7 1:00-4:00 PMCGS Expense and Capital Program for FY 2012-17
Asset Management Overview
Power Internal Operating Costs, Acquisition/Ancillary Services & Residential Exchange
Columbia Generating Station (CGS)
2010 Integrated Program Review (IPR) Workshop Schedule*All workshops are subject to change as necessary*
Workshop Topic

2010 Integrated Program Review 81
B O N N E V I L L E P O W E R A D M I N I S T R A T I O N
Detailed Workshop Schedule
Date Time8 FCRPS Hydro Operation & Maintenance Program and Cultural Resources May 20, 2010 9:00-12:00 PM
FCRPS Hydro O&M Program for FY 2012-13Cultural Resources Program
9 1:00-4:00 PM
F&W Expense & Capital Program for FY 2012-17LSRC Program for FY 2012-13NWPPC Expense Program for FY 2012-13Columbia River Fish Mitigation (CRFM) FY 2012-17
10 May 24, 2010 9:00-12:00 PMDiscuss Remaining Topics, Follow Ups, Etc.
Energy Efficiency & Renewable Resources11 Energy Efficiency Expense & Capital Program for FY 2012-17 1:00-4:00 PM
Renewable Resources for FY 2012-13
12 Facilities Asset Strategy May 25, 2010 9:00-10:30 AMFacilities Asset Strategy
13 10:30-12:00 PMIT Asset Strategy
14 1:00-4:00 PMAgency Services Expense & Capital Programs for FY 2012-2017
15 General Manager Meeting June 8, 2010 9:00-12:00 PM
16 General Manager Meeting July 13, 2010 9:00-12:00 PM
Information Technology (IT) Asset Strategy
Agency Services
Fish & Wildlife, Lower Snake River Comp (LSRC) and Northwest Power Planning Council (NWPPC)
2010 Integrated Program Review (IPR) Workshop Schedule*All workshops are subject to change as necessary*
Workshop Topic
Power Overflow

2010 Integrated Program Review 82
B O N N E V I L L E P O W E R A D M I N I S T R A T I O N
Ways to ParticipateAll forums are open to the public and will be noticed on the Integrated Program Review (IPR) external website at: http://www.bpa.gov/corporate/Finance/IBR/IPR/.
Representatives from the Corps of Engineers, Bureau of Reclamation and Energy Northwest will be participating in the IPR process including presentations.
All technical and managerial workshops will be held at BPA Headquarters.
If participating by phone please dial into the bridge at 503-230-5566, then any time during or after the message and the double beep, enter 3981#. Presentation material will be posted on the IPR external website prior to the workshop taking place.
The IPR process will include a public comment period for proposed program spending levels. The comment period opens May 10, 2010 and will close on July 29, 2010.
Comments can be submitted at any of the scheduled workshops or submitted in writing to:
• Bonneville Power Administration, P.O. Box 14428, Portland, OR 97293-4428,
• Email to [email protected],
• Faxed to (503) 230-3285

2010 Integrated Program Review 83
B O N N E V I L L E P O W E R A D M I N I S T R A T I O N
BPA’s Financial Disclosure Information
All FY 2010-2017 information has been made publicly available by BPA on May 14, 2010 and does not contain Agency-approved Financial Information.
All FY 2005-2009 information has been made publicly available by BPA and contains Agency-approved Financial Information.
All FY 2011 Rate Case data has been developed for publication in rates proceeding documents and is being provided by BPA.


![· Gift]Awards/MemoriaIs Expense Legal Services Food/Beverage Expense Polling Expense Printing Expense Salaries/Wages/Contract Labor Solicitation/Fundraising Expense](https://static.documents.pub/doc/80x56/5c5ef74209d3f2515c8cf3a9/-giftawardsmemoriais-expense-legal-services-foodbeverage-expense-polling-expense.jpg)


